Appraisal Report€¦ · Mr. Eric Peterson Airport Business Manager, Roads and Airport Dept. County...
103
Appraisal Report San Martin Airport FBO 13030 Murphy Avenue San Martin, Santa Clara County, California 95046 Report Date: March 21, 2018 FOR: County of Santa Clara Mr. Eric Peterson Airport Business Manager, Roads and Airport Dept. 2500 Cunningham Avenue San Jose, CA 95148 Valbridge Property Advisors 55 South Market Street, Suite 1210 San Jose, CA 95113 408.279.1520 phone Valbridge File Number: 408.279.3428 fax CA02-18-0019-003 valbridge.com
Transcript of Appraisal Report€¦ · Mr. Eric Peterson Airport Business Manager, Roads and Airport Dept. County...

Appraisal Report
San Martin Airport FBO 13030 Murphy Avenue
San Martin, Santa Clara County, California 95046
Report Date: March 21, 2018
FOR:
County of Santa Clara Mr. Eric Peterson
Airport Business Manager, Roads and Airport Dept. 2500 Cunningham Avenue
San Jose, CA 95148
Valbridge Property Advisors
55 South Market Street, Suite 1210 San Jose, CA 95113 408.279.1520 phone Valbridge File Number: 408.279.3428 fax CA02-18-0019-003 valbridge.com

© 2018 VALBRIDGE PROPERTY ADVISORS
55 South Market Street, Suite 1210
San Jose, CA 95113
408.279.1520 phone
408.279.3428 fax
valbridge.com
March 21, 2018
Yvonne J. Broszus, MAI
408.279.1520, ext. 7135
Mr. Eric Peterson
Airport Business Manager, Roads and Airport Dept.
County of Santa Clara
2500 Cunningham Avenue
San Jose, CA 95148
RE: Appraisal Report
San Martin Airport FBO
13030 Murphy Avenue
San Martin, Santa Clara County, California 95046
Dear Mr. Peterson:
In accordance with your request, we have performed an appraisal of the above referenced property.
This appraisal report sets forth the pertinent data gathered, the techniques employed, and the
reasoning leading to our value opinions. This letter of transmittal is not valid if separated from the
appraisal report.
The subject property, as referenced above, is located on at the northwest quadrant of San Martin
Airport and is further identified as a portion of Assessor’s Parcel Number (APN) 825-10-075. The
subject measures 10.27-acres, or 447,482 square-feet. The subject consists of the existing Magnum
Aviation FBO leasehold area, including both the land and the improvements. The existing
improvements include a total building area of about 109,376 square feet, plus various site
improvements.
This appraisal estimates the annual market rent for the entire FBO leasehold area identified above. As
requested, we have also estimated the annual market rent for a portion of the leasehold area
consisting of the main FBO office/hangar building, with the adjacent land area. The FBO
office/hangar building contains 16,500 square feet. We have estimated the site area associated with
the building at 2.51 acres, or 109,336 square feet. An aerial of the property, as we have valued it for
this appraisal, is provided later in this report. For purposes of this report, we have also assumed that
a lease of the FBO office/maintenance property would include the right to sell fuel.
We developed our analyses, opinions, and conclusions and prepared this report in conformity with
the Uniform Standards of Professional Appraisal Practice (USPAP) of the Appraisal Foundation; the
Code of Professional Ethics and Standards of Professional Appraisal Practice of the Appraisal
Institute; and the requirements of our client as we understand them.

Mr. Eric Peterson
County of Santa Clara
Page 2
© 2018 VALBRIDGE PROPERTY ADVISORS
The client in this assignment is the County of Santa Clara and the intended user of this report is our
client and no others. The intended use is for preparation of a long-term business plan and no other
use. The value opinions reported herein are subject to the definitions, assumptions and limiting
conditions, and certification contained in this report.
The acceptance of this appraisal assignment and the completion of the appraisal report submitted
herewith are subject to the General Assumptions and Limiting Conditions contained in the report.
The findings and conclusions are further contingent upon the following extraordinary assumptions
and/or hypothetical conditions which might have affected the assignment results:
Extraordinary Assumptions: The storage hangars located on the subject property were available for inspection only from
the exterior. Only limited information on the interior, therefore, was available. For purposes
of this report, we assume that the interiors include minimal improvements other than some
electrical power, and that the measurements of individual hangars are reasonably accurate. If
this information is later found to be incorrect, a revision in this appraisal could be necessary.
As requested, we have estimated the annual market rent for the entire FBO leasehold area, as
well as a portion of the leasehold area. The entire FBO leasehold area is defined within the
existing lease document and forms the basis for our first value opinion. Our second value
opinion for only a portion of the FBO leasehold area includes the FBO office/hangar building
plus associated or adjacent land area. We have estimated the associated land area at 109,336
square feet. If a lease for this portion of the property includes a significantly different
associated land area, then the rent estimated in this appraisal would require revision.
Hypothetical Conditions: None
Based on the analysis contained in the following report, our value conclusions are summarized as
follows:
Respectfully submitted,
Valbridge Property Advisors
Yvonne J. Broszus, MAI
Director
California Certified License #AG019587
Component
Entire FBO
Leasehold Area
FBO Office/ Hangar
Portion w/Adjacent Land
Value Type Market Rent Market Rent
Effective Date of Value February 9, 2018 February 9, 2018
Annual Market Rent $600,000 $220,000
Per Square Foot of Building Area/Month $0.46 $1.11 psf
Per Square Foot of Land Area/Year $1.34 $2.01 psf
Value Conclusions

SAN MARTIN AIRPORT FBO
TABLE OF CONTENTS
© 2018 VALBRIDGE PROPERTY ADVISORS Page i
Table of Contents
Cover Page
Letter of Transmittal
Table of Contents ....................................................................................................................................................................... i
Summary of Salient Facts ....................................................................................................................................................... ii
Aerial and Front Views ............................................................................................................................................................ iv
Location Map .............................................................................................................................................................................. v
Introduction ................................................................................................................................................................................. 1
Scope of Work ............................................................................................................................................................................ 4
Regional and Market Area Analysis .................................................................................................................................... 5
City and Neighborhood Analysis ..................................................................................................................................... 10
Site Description – Entire Leasehold Area ...................................................................................................................... 17
Site Description – FBO Office/Hangar Area ................................................................................................................. 21
Improvements Description ................................................................................................................................................. 22
Building A: FBO Office/Maintenance Hangar .............................................................................................................. 24
Row B: Executive Box Hangars .......................................................................................................................................... 26
Row C: Box Hangars .............................................................................................................................................................. 27
Row D: Box Hangars .............................................................................................................................................................. 28
Row E: Portable Hangars ..................................................................................................................................................... 29
Rows F & G: Box Hangars.................................................................................................................................................... 30
Row H: T-Hangars .................................................................................................................................................................. 31
Row I: Box Hangars ................................................................................................................................................................ 32
Row J: Executive Hangars .................................................................................................................................................... 33
Row K: T-Hangars ................................................................................................................................................................... 34
Summary of Improvements ................................................................................................................................................ 35
Assessment and Tax Data ................................................................................................................................................... 36
Market Analysis ....................................................................................................................................................................... 37
Highest and Best Use ............................................................................................................................................................ 42
Appraisal Methodology ....................................................................................................................................................... 44
Market Rent of Entire Leasehold Area ........................................................................................................................... 45
Cost Approach for Entire Leasehold Area ..................................................................................................................... 46
Market Rent for Entire Land Area .................................................................................................................................... 50
Market Rent of a Portion of Leasehold Area ............................................................................................................... 68
Cost Approach for a Portion of Leasehold Area ........................................................................................................ 69

SAN MARTIN AIRPORT FBO
TABLE OF CONTENTS
© 2018 VALBRIDGE PROPERTY ADVISORS Page ii
Summary of Value Conclusions ........................................................................................................................................ 75
General Assumptions and Limiting Conditions .......................................................................................................... 76
Certification – Yvonne J. Broszus, MAI ........................................................................................................................... 82
Addenda .................................................................................................................................................................................... 83
Subject Photographs ..................................................................................................................................................... 84
Glossary .............................................................................................................................................................................. 85
Qualifications ................................................................................................................................................................... 91
Valbridge Property Advisors Information / Office Locations ........................................................................ 93

SAN MARTIN AIRPORT FBO
SUMMARY OF SALIENT FACTS
© 2018 VALBRIDGE PROPERTY ADVISORS Page ii
Summary of Salient Facts
Property Identification
Property Name San Martin Airport FBO
Property Address 13030 Murphy Avenue
San Martin, Santa Clara County, California 95046
Latitude & Longitude 37.083322, -121.599906
Tax Parcel Number portion of 825-10-075
Property Owner County of Santa Clara
Site
Zoning
Agricultural, 20 acre minimum lot size, Scenic Roads
Combining District (A-20AC-sr)
FEMA Flood Map No. 06085C 0628H
Flood Zone D
Primary Land Area 10.273 acres
Proposed Improvements
Property Use Airport, Airplane Hangar
Occupancy Type Aviation-related
Gross Building Area (GBA) 109,376 sf
Year Built 1960's - 2006
Condition Average
Construction Class S - Steel Frame
Construction Quality Average
Valuation Opinions
Highest & Best Use - As Vacant Development of an FBO
Highest & Best Use - As Improved Existing FBO use
Reasonable Exposure Time 12 Months
Reasonable Marketing Time 12 Months
Component
Entire FBO
Leasehold Area
FBO Office/ Hangar
Portion w/Adjacent Land
Value Type Market Rent Market Rent
Effective Date of Value February 9, 2018 February 9, 2018
Annual Market Rent $600,000 $220,000
Per Square Foot of Building Area/Month $0.46 $1.11 psf
Per Square Foot of Land Area/Year $1.34 $2.01 psf
Value Conclusions

SAN MARTIN AIRPORT FBO
SUMMARY OF SALIENT FACTS
© 2018 VALBRIDGE PROPERTY ADVISORS Page iii
Our findings and conclusions are further contingent upon the following extraordinary assumptions
and/or hypothetical conditions which might have affected the assignment results:
Extraordinary Assumptions: The storage hangars located on the subject property were available for inspection only from
the exterior. Only limited information on the interior, therefore, was available. For purposes
of this report, we assume that the interiors include minimal improvements other than some
electrical power, and that the measurements of individual hangars are reasonably accurate. If
this information is later found to be incorrect, a revision in this appraisal could be necessary.
As requested, we have estimated the annual market rent for the entire FBO leasehold area, as
well as a portion of the leasehold area. The entire FBO leasehold area is defined within the
existing lease document and forms the basis for our first value opinion. Our second value
opinion for only a portion of the FBO leasehold area includes the FBO office/hangar building
plus associated or adjacent land area. We have estimated the associated land area at 109,336
square feet. If a lease for this portion of the property includes a significantly different
associated land area, then the rent estimated in this appraisal would require revision.
Hypothetical Conditions: None

SAN MARTIN AIRPORT FBO
AERIAL AND FRONT VIEWS
© 2018 VALBRIDGE PROPERTY ADVISORS Page iv
Aerial and Front Views
AERIAL VIEW
FRONT VIEW

SAN MARTIN AIRPORT FBO
LOCATION MAP
© 2018 VALBRIDGE PROPERTY ADVISORS Page v
Location Map
SAN MARTIN AIRPORT FBO
INTRODUCTION
© 2018 VALBRIDGE PROPERTY ADVISORS Page 1
Introduction
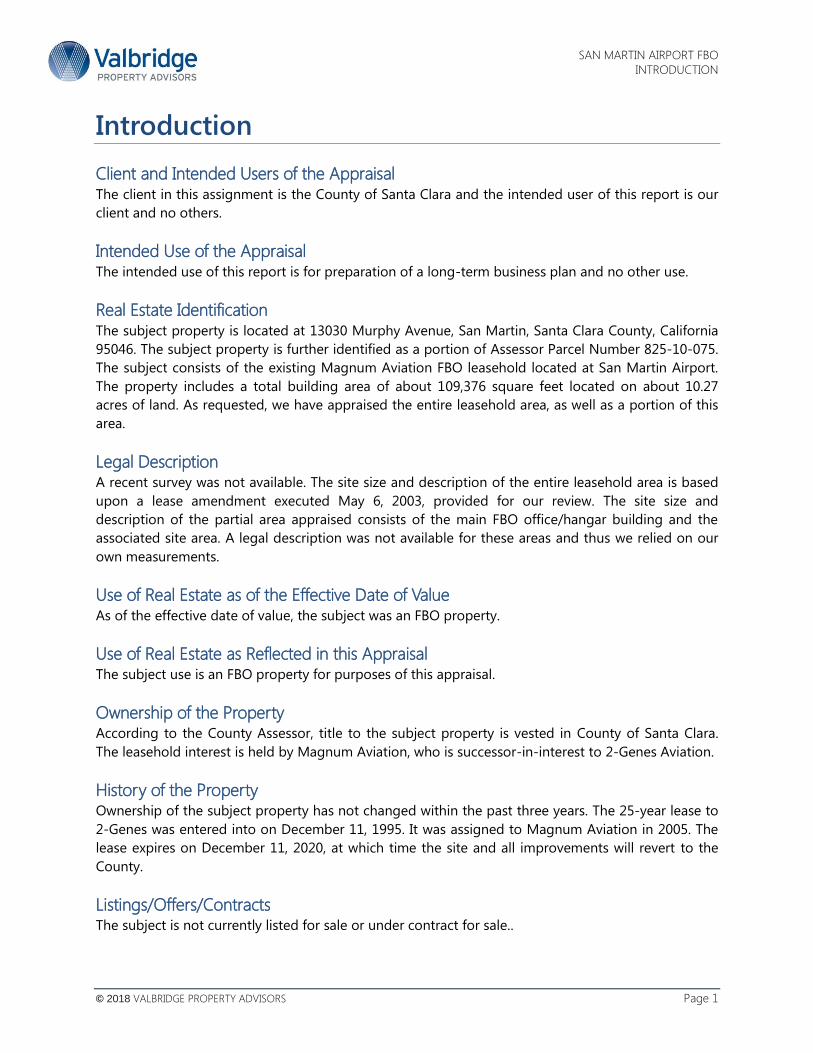
Client and Intended Users of the Appraisal The client in this assignment is the County of Santa Clara and the intended user of this report is our
client and no others.
Intended Use of the Appraisal The intended use of this report is for preparation of a long-term business plan and no other use.
Real Estate Identification The subject property is located at 13030 Murphy Avenue, San Martin, Santa Clara County, California
95046. The subject property is further identified as a portion of Assessor Parcel Number 825-10-075.
The subject consists of the existing Magnum Aviation FBO leasehold located at San Martin Airport.
The property includes a total building area of about 109,376 square feet located on about 10.27
acres of land. As requested, we have appraised the entire leasehold area, as well as a portion of this
area.
Legal Description A recent survey was not available. The site size and description of the entire leasehold area is based
upon a lease amendment executed May 6, 2003, provided for our review. The site size and
description of the partial area appraised consists of the main FBO office/hangar building and the
associated site area. A legal description was not available for these areas and thus we relied on our
own measurements.
Use of Real Estate as of the Effective Date of Value As of the effective date of value, the subject was an FBO property.
Use of Real Estate as Reflected in this Appraisal The subject use is an FBO property for purposes of this appraisal.
Ownership of the Property According to the County Assessor, title to the subject property is vested in County of Santa Clara.
The leasehold interest is held by Magnum Aviation, who is successor-in-interest to 2-Genes Aviation.
History of the Property Ownership of the subject property has not changed within the past three years. The 25-year lease to
2-Genes was entered into on December 11, 1995. It was assigned to Magnum Aviation in 2005. The
lease expires on December 11, 2020, at which time the site and all improvements will revert to the
County.
Listings/Offers/Contracts The subject is not currently listed for sale or under contract for sale..

SAN MARTIN AIRPORT FBO
INTRODUCTION
© 2018 VALBRIDGE PROPERTY ADVISORS Page 2
Type and Definition of Value The purpose of this appraisal is to estimate the market rent for the subject property. “Market rent,”
as used in this appraisal, is defined as “The most probable rent that a property should bring in a
competitive and open market reflecting the conditions and restrictions of a specified lease
agreement, including the rental adjustment and revaluation, permitted uses, use restrictions, expense
obligations, term, concessions, renewal and purchase options, and tenant improvements (TIs).” 1
Valuation Scenarios, Property Rights Appraised, and Effective Dates of Value Per the scope of our assignment we developed opinions of value for the subject property under the
following scenarios of value:
We completed an appraisal inspection of the subject property on February 9, 2018.
Date of Report The date of this report is March 21, 2018, which is the same as the date of the letter of transmittal.
List of Items Requested but Not Provided Title report
Assumptions and Conditions of the Appraisal The acceptance of this appraisal assignment and the completion of the appraisal report submitted
herewith are subject to the General Assumptions and Limiting Conditions contained in the report.
The findings and conclusions are further contingent upon the following extraordinary assumptions
and/or hypothetical conditions which might have affected the assignment results:
Extraordinary Assumptions
The storage hangars located on the subject property were available for inspection only from
the exterior. Only limited information on the interior, therefore, was available. For purposes
of this report, we assume that the interiors include minimal improvements other than some
electrical power, and that the measurements of individual hangars are reasonably accurate. If
this information is later found to be incorrect, a revision in this appraisal could be necessary.
As requested, we have estimated the annual market rent for the entire FBO leasehold area, as
well as a portion of the leasehold area. The entire FBO leasehold area is defined within the
existing lease document and forms the basis for our first value opinion. Our second value
opinion for only a portion of the FBO leasehold area includes the FBO office/hangar building
plus associated or adjacent land area. We have estimated the associated land area at 109,336
square feet. If a lease for this portion of the property includes a significantly different
associated land area, then the rent estimated in this appraisal would require revision.
1 The Dictionary of Real Estate Appraisal, Sixth Edition, (Appraisal Institute, 2015), 140
Valuation Scenario Effective Date of Value
Market Rent for Entire FBO Leasehold Area February 9, 2018
Market Rent for FBO Office/Hangar Portion w/Adjacent Land February 9, 2018

SAN MARTIN AIRPORT FBO
INTRODUCTION
© 2018 VALBRIDGE PROPERTY ADVISORS Page 3
Hypothetical Conditions
None

SAN MARTIN AIRPORT FBO
SCOPE OF WORK
© 2018 VALBRIDGE PROPERTY ADVISORS Page 4
Scope of Work
The elements addressed in the Scope of Work are (1) the extent to which the subject property is
identified, (2) the extent to which the subject property is inspected, (3) the type and extent of data
researched, (4) the type and extent of analysis applied, (5) the type of appraisal report prepared, and
(6) the inclusion or exclusion of items of non-realty in the development of the value opinion. These
items are discussed as below.
Extent to Which the Property Was Identified The three components of the property identification are summarized as follows:
Legal Characteristics - The subject was legally identified via a plat map in a lease amendment
provided by our client.
Economic Characteristics - Economic characteristics of the subject property were identified
via leases, market participant surveys, our company database, third party sources, and
information provided by our client, as well as a comparison to properties with similar
locational and physical characteristics.
Physical Characteristics - The subject was physically identified via an appraisal inspection by
Yvonne Broszus, MAI that consisted of interior and exterior observations of the main FBO
building, and exterior observations only of the storage hangars.
Extent to Which the Property Was Inspected We inspected the subject on February 9, 2018. The improvements were measured during the course
of the inspection.
Type and Extent of Data Researched We researched and analyzed: (1) market area data, (2) property-specific market data, (3) zoning and
land-use data, and (4) current data on comparable listings and transactions. We also interviewed
people familiar with the subject market/property type.
Appraisal Conformity and Report Type We developed our analyses, opinions, and conclusions and prepared this report in conformity with
the Uniform Standards of Professional Appraisal Practice (USPAP) of the Appraisal Foundation; the
Code of Professional Ethics and Standards of Professional Appraisal Practice of the Appraisal
Institute; and the requirements of our client as we understand them. This is an Appraisal Report as
defined by the Uniform Standards of Professional Appraisal Practice under Standards Rule 2-2a.
Personal Property/FF&E All items of non-realty are excluded from this analysis. The opinion of market value developed herein
is reflective of real estate only.

SAN MARTIN AIRPORT FBO
REGIONAL AND MARKET AREA ANALYSIS
© 2018 VALBRIDGE PROPERTY ADVISORS Page 5
Regional and Market Area Analysis
REGIONAL MAP
Overview The subject property is located in the San Francisco Bay Region, an area which is comprised of the
nine counties bordering the San Francisco Bay. According to the State of California Department of
Finance, the area had a combined population of approximately 7.71 million as of January 1, 2017.
The Department of Finance characterizes the San Francisco Bay Area by a moderate climate,
diversified economy and one of the highest standards of living in the United States.
Population Santa Clara County is the most populous of the nine counties comprising the San Francisco Bay
Region, with an estimated 1,938,180 residents as of January 1, 2017 according to the State of
California Department of Finance. San Jose is the largest city in the county and the third largest in
California, surpassing San Francisco.
According to the Site to Do Business projections, presented below, the county’s population is
expected to increase 1.2% between 2017 and 2022, while San Martin will increase approximately
1.0% over the same period.

SAN MARTIN AIRPORT FBO
REGIONAL AND MARKET AREA ANALYSIS
© 2018 VALBRIDGE PROPERTY ADVISORS Page 6
Transportation Excellent transportation routes and linkages to all major cities within the region and throughout the
state are primary reasons for the advancement of business activity in the Bay Area, including Santa
Clara County.
Air service in the area is provided by Norman
Y. Mineta San Jose International Airport,
which accommodated almost 12.5 million
passengers in 2017. San Francisco and
Oakland airports are also within an hour’s
drive from most portions of the county.
Although air travel is down over the past two
years, In 2010, San Jose International Airport
completed the first phase of a two-phase
expansion with the goal of increasing service
to 17.3 million travelers a year, at a cost of
$1.3 billion. Planning for the second phase,
nine additional gates and a new concourse
extension at the south end of Terminal B,
began early in 2018.
The area has a well-developed freeway system although traffic congestion is unquestionably one of the
negative aspects. The county’s transportation network also includes a number of expressways, which
provide streamlined access to most interior locations. Lawrence Expressway, San Tomas Expressway and
Foothill Expressway run north-south, while Central Expressway and Montague Expressway run roughly
east-west.
Employment High-technology employment and a skilled workforce translate into relatively high-income levels,
and Santa Clara County is one of the most affluent metropolitan regions in the nation. Silicon Valley’s
economy is stable, although its narrow range of driving industries has kept recent growth very slow.
Significant employment sectors within Santa Clara County include manufacturing; professional,
scientific, and technical services; health care; retail; and educational services. Some of the largest
employers are associated with the computer industry such as Adobe, Apple, AMD, and Hewlett-
Packard; hospitals such as the VA Medical Center, Kaiser Permanente, and the San Jose Medical
Population
Annual %
Change Estimated Projected
Annual %
Change
Area 2000 2010 2000 - 10 2017 2022 2017 - 22
United States of America 281,421,906 308,745,538 1.0% 327,514,334 341,323,594 0.8%
California 33,871,648 37,253,956 1.0% 39,611,295 41,298,900 0.9%
Santa Clara County 1,682,585 1,781,642 0.6% 1,958,087 2,075,690 1.2%
San Martin 6,504 7,027 0.8% 7,499 7,863 1.0%
Source: Site-to-Do-Business (STDB Online)

SAN MARTIN AIRPORT FBO
REGIONAL AND MARKET AREA ANALYSIS
© 2018 VALBRIDGE PROPERTY ADVISORS Page 7
Center; space and aerotech including NASA and Lockheed Martin; and educational facilities such as
San Jose State University and Stanford University School of Medicine.
Unemployment The unemployment rate in Santa Clara County is currently less than the rates of the state and nation.
The County unemployment rate was 2.6% as of December 2017. The State of California was at 4.3%
while the Nation was at 4.1% for the same time period. Unemployment rates locally and nationwide
have been on a decreasing trend over the last several years, as shown in the table below (note that
information on San Martin, which is an unincorporated area within the County, was not available).
The information below was obtained from the “UCLA
Anderson Forecast for the Nation: December 2017
Report,” presented by the UCLA Anderson School of
Management.
The forecast for 2018 is sunny, while 2019 will be
cloudy according to the Anderson School of
Management. The national GDP is growing at a
strong rate and is expected to continue to do so into
through the second quarter of 2018, but then as the
unemployment rate drops below 4% and
employment growth slows due to a shortage of
Employment by Industry - Santa Clara County
2017 Percent of
Industry Estimate Employment
Agriculture/Mining 6,643 0.70%
Construction 51,243 5.40%
Manufacturing 167,015 17.60%
Wholesale trade 19,928 2.10%
Retail trade 85,406 9.00%
Transportation/Utilities 27,520 2.90%
Information 34,162 3.60%
Finance/Insurance/Real Estate Services 44,601 4.70%
Services 491,556 51.80%
Public Administration 20,877 2.20%
Total 948,950 100.0%
Source: Site-to-Do-Business (STDB Online)
Unemployment Rates
Area YE 2010 YE 2011 YE 2012 YE 2013 YE 2014 YE 2015 YE 2016 YE 2017
United States of America 9.3% 8.5% 7.9% 6.7% 5.6% 5.0% 4.7% 4.1%
California 11.0% 9.6% 8.0% 6.6% 5.6% 5.1% 4.2% 4.2%
Santa Clara County 8.4% 7.0% 5.5% 4.3% 3.7% 3.3% 2.6% 2.6%
Morgan Hill 9.3% 7.7% 6.1% 4.8% 4.1% 3.7% 2.9% 2.9%
Gilroy 10.9% 9.1% 7.2% 5.6% 4.9% 4.4% 3.4% 3.4%
Source: Bureau of Labor Statistics - Year End - National & State Seasonally Adjusted

SAN MARTIN AIRPORT FBO
REGIONAL AND MARKET AREA ANALYSIS
© 2018 VALBRIDGE PROPERTY ADVISORS Page 8
labor, growth will drop back to the 2% growth rate seen previously. By the end of 2019, the cloudy
prediction is for a growth rate of 1.5% or possibly lower.
Monetary Policy In the Post-Yellen Era
The Janet Yellen era is coming to an end with Jerome Powell’s appointment, however his views on
monetary policy are very similar to hers on monetary policy and not many changes are expected on
that front. That said, on regulatory policy, Powell is anticipated to be more open than Yellen when it
comes to reconsidering the 2009-2012 financial crisis regulations. Therefore, it is anticipated that the
gradual interest rate normalization policy that has been underway for a year will continue well into
2019 with a 25 basis point increase from the current 1.375% rate in December and three more
increases in 2018. By the end of 2019, the federal funds rate will likely approximate 3%.
Powell’s Fed will also continue the policy of gradually shrinking the Fed’s balance sheet, which began
in October – quantitative easing that expanded the balance sheet from $800 billion to over four
trillion dollars over several years, now with a target of tightening back to $2.5-$3.0 trillion.
Inflation
It appears that the second quarter slowdown in inflation was transitory and inflation will continue in
excess of 2% at a steady pace for the foreseeable future. The primary source for the rising inflation
rate will be a significant rebound in wage growth, which after creeping along around 2%, is forecast
to accelerate to approximately 4% by late 2018 on a year-over-year basis.
Real consumption spending is maintaining its strength experienced in 2016 by increasing 2.7% and
2.8% in 2017 and 2018, respectively. However, as auto sales slow in 2019 consumption growth will
slip back to 2.2%. However, it is forecast by the Anderson report that as long as stock and house
prices remain elevated, the consumer, or at least the high-end consumer, will remain in good shape.
In the case of the lower end consumer they are encouraged by Walmart reporting a strong 2.7%
increase in year-over-year same store sales in their latest quarter.
Global Economy
In response to a recovering global economy, real exports are recovering from the near zero growth
of 2015 and 2016. Real exports are estimated to increase by 3.2% this year and 4.5% and 4.1% in
2018 and 2019, respectively.
The real risk to our export forecast and for that matter the entire forecast is political. In less than a
year, President Trump has blown up the Trans Pacific Partnership (TPP) trade treaty and the global
climate accord. The North American Free Trade Treaty (NAFTA) could be next. Leaving NAFTA is not
so simple because it would undo countless supply chains among the three countries (U.S., Canada
and Mexico) involved, and the gross trade volumes among the three NAFTA partners amounts to
over one trillion dollars per year. Especially hard hit would be the U.S. automobile industry where
parts cross borders several times in the manufacturing of a single automobile. In the view of the
Anderson Report, should the U.S. leave NAFTA, the growth outlook would deteriorate and the
chance of a recession in late 2018 or 2019 would significantly increase.
The California Forecast
In the September 2017 quarterly UCLA Anderson forecast essay UCLA Anderson Forecast Director
and Senior Economist Jerry Nickelsburg states that the forecast for California’s unemployment is for
continued growth, but that is likely due to the federal administration’s difficulty getting legislation

SAN MARTIN AIRPORT FBO
REGIONAL AND MARKET AREA ANALYSIS
© 2018 VALBRIDGE PROPERTY ADVISORS Page 9
through Congress and a result of more job seekers brought into the market, rather than more jobs
being available. The tightening of immigration rules is expected to have a significant effect in
California, however due to protections already in place, not as big an effect as they might have
otherwise had. California is expected to grow at a rate slightly faster than the US as a whole, and be
at a 4.5% unemployment rate by the end of 2019.
Median Household Income In Santa Clara County, San Jose, the county seat, ranks first out of the entire nation in terms of
median household income for major metropolitan areas. San Francisco, about 50 miles to the north
of San Jose, also ranked as one of the wealthiest cities in the nation: it holds the number two spot
with a median household income of about 9% less than San Jose.
Total median household income for the region is presented in the following table. Overall, the
subject compares favorably to the state and the country.
Conclusions Historically, the Santa Clara County region has been considered a desirable place to both live and
work. Physical features and a strong local economy attract both businesses and residents. It is a
worldwide leader in technology and a regional employment center, with an increasingly diversified
economy. While traffic congestion will continue to be a problem, residents remain among the most
affluent in the country.
The election of Donald Trump signaled a change in economic policy. In the short run that will likely
bring with it more real growth and inflation along with higher interest rates. However, because the
economy is operating at or close to full employment, the growth spurt is expected to be short-lived.
There is uncertainty in the long-term economic forecast. Nevertheless, in the short-term, 2018 is
expected to be another prosperous year as we continue to say goodbye to the effects of the financial
crisis.
Median Household Income
Estimated Projected Annual % Change
Area 2017 2022 2017 - 22
United States of America $56,124 $62,316 2.2%
California $65,223 $74,370 2.8%
Santa Clara County $99,069 $108,576 1.9%
San Martin $105,627 $114,215 1.6%
Source: Site-to-Do-Business (STDB Online)

SAN MARTIN AIRPORT FBO
CITY AND NEIGHBORHOOD ANALYSIS
© 2018 VALBRIDGE PROPERTY ADVISORS Page 10
City and Neighborhood Analysis
NEIGHBORHOOD MAP
San Martin is an unincorporated area located in the jurisdiction of Santa Clara County. It lies between
Morgan Hill to the north, and Gilroy to the south. San Francisco is approximately 80 miles north of
San Martin and Monterey is about 55 miles to the southwest. San Martin, along with neighboring
Morgan Hill and Gilroy, is located in an area typically known as the “South Valley” area.
The City of Morgan Hill was incorporated in 1906, and is situated in southern Santa Clara County
along Highway 101. Gilroy is located about 10 miles south of Morgan Hill, in the farthest southern
portion of Santa Clara County. The economies of the South Valley Area have traditionally been based
on agriculture, but industrial and residential expansions have been making inroads into agricultural
land for the past six years. With the rapid growth of Silicon Valley in the northern portion of the
county, the character of South County has changed. Demand for the less expensive and available
commercial land and housing in the cities of Morgan Hill, Gilroy, and the unincorporated areas, such
as San Martin where the subject is located, substantially increased during the past three years. These
communities have become a popular alternative to the more expensive areas of Silicon Valley to the
north.
The unincorporated area of San Martin is serviced by two major arterials: Highway 101, also known
as the “South Valley Freeway,” and the Monterey Highway, also known as Monterey Road, which was

SAN MARTIN AIRPORT FBO
CITY AND NEIGHBORHOOD ANALYSIS
© 2018 VALBRIDGE PROPERTY ADVISORS Page 11
formerly old Highway 101. The South Valley Freeway was constructed around the cities of Morgan
Hill and Gilroy, thereby reducing old Highway 101 to a “business” highway. There are two major
arterials leading from Highway 101 to Monterey Road in the unincorporated area of San Martin. San
Martin Avenue is the first exit south of Morgan Hill. Masten Avenue is the following exit to the south.
The San Martin area has slowly become the “estate home Mecca” of the South County due to the
more relaxed building requirements of the county. Morgan Hill and Gilroy both have growth control
measures in place that limit growth in all areas, including residential, due to sewer issues. Residential
use in San Martin is supported by septic system, not sewer. Also, water to San Martin properties is
provided by individual wells, rather than a city water system.
Most properties in San Martin are designated for either rural residential or agricultural uses. Small
portions of the area, however, have a commercial/industrial overlay that permit a limited amount of
commercial or industrial development.
Neighborhood Location and Boundaries The subject neighborhood is located in San Martin. The area is semi-rural in nature. The
neighborhood is bounded by East Middle Avenue to the north, 101 Freeway to the east, Buena Vista
Avenue to the south, and Monterey Highway to the west.
Demographics The table on the following page depicts the area demographics in San Martin within a one-, three-,
and five-mile radius from the subject.

SAN MARTIN AIRPORT FBO
CITY AND NEIGHBORHOOD ANALYSIS
© 2018 VALBRIDGE PROPERTY ADVISORS Page 12
Transportation Routes Within the immediate area of the subject, transportation access helps define the character of its
development. Major travel and commuter routes within the area of the subject include East San
Martin Avenue and 101 Freeway, Monterey Highway. Access to the area is considered good.
Neighborhood Demographics
Radius 1 mile 3 miles 5 miles
Population Summary
2000 Population 2,113 14,910 61,776
2010 Population 2,255 15,679 68,592
2017 Population 2,400 16,918 77,362
2022 Population Estimate 2,511 17,870 83,393
Annual % Change (2017 - 2022) 0.9% 1.1% 1.5%
Housing Unit Summary
2000 Housing Units 577 4,822 19,452
% Owner Occupied 65.2% 74.2% 69.6%
% Renter Occupied 30.2% 22.4% 28.1%
2010 Housing Units 642 5,292 22,017
% Owner Occupied 58.3% 68.1% 65.6%
% Renter Occupied 35.2% 25.7% 30.1%
2017 Housing Units 667 5,580 24,199
% Owner Occupied 57.4% 67.4% 65.3%
% Renter Occupied 37.0% 27.3% 31.7%
2022 Housing Units 698 5,888 26,064
% Owner Occupied 57.0% 67.1% 64.9%
% Renter Occupied 37.1% 27.4% 31.7%
Annual % Change (2017 - 2022) 0.9% 1.1% 1.5%
Income Summary
2017 Median Household Income $100,258 $103,600 $98,992
2022 Median Household Income Estimate $109,182 $112,676 $109,439
Annual % Change 1.7% 1.7% 2.0%
2017 Per Capita Income $38,260 $44,136 $40,259
2022 Per Capita Income Estimate $43,102 $49,523 $45,471
Annual % Change 2.4% 2.3% 2.5%
Source: Site-to-Do-Business (STDB Online)

SAN MARTIN AIRPORT FBO
CITY AND NEIGHBORHOOD ANALYSIS
© 2018 VALBRIDGE PROPERTY ADVISORS Page 13
Neighborhood Land Use The subject neighborhood is located in an area with primarily residential and agricultural land uses.
An approximate breakdown of the development in the area is as follows:
LAND USES
Agricultural: 40%
Residential: 30%
Retail: 5%
Industrial 5%
Public: 10%
Vacant: 10%
The San Martin Airport, of which the subject is a part, represents the single largest developed
property in the immediate area. Additional information on the airport is provided below.
San Martin Airport San Martin Airport is a non-towered airport in a rural area. The airport currently has one runway
measuring about 3,100 feet in length. This runway length will only support small aircraft, not
corporate jets. There are plans to extend the runway to 5,000 feet in length in the future; however,
those plans are on hold until such time as the general aviation market volume in the area has
reached a level that would justify the cost of the expansion. As of today, this is not expected for at
least another five years, and could be much longer.
Total operations for 2017 were 31,958, which represents a decline of about 3.6 percent from the
previous year. Reportedly overall operations at San Martin Airport have been relatively flat, and are
not expected to increase dramatically in the near future. There are 64 based aircraft at the airport.
The airport is improved with about 150 hangars and 90 tie-downs. About 100 of the hangars are
controlled directly by the Airport (County), while the other 50 are located on land leased to the FBO,
Magnum Aviation. Magnum Aviation is the only FBO at the airport and provides fueling and
maintenance services. There are minimal services provided directly by the airport, which results in
minimal transient, recreational traffic generated at the airport. Other users at the airport include
Gavilan College, who recently constructed a new building at the airport.
The airport is also improved with a couple of buildings used for animal services. One is the animal
shelter, which is operated by the county. The other is an animal clinic located on the corner of
Church and Murphy Avenues. This clinic is operated by a non-profit. The airport collects no rent from
this use, as the tenant provides county services that do not exist elsewhere.
Summary
In summary, the subject is located on the San Martin Airport in San Martin, an unincorporated area
of Santa Clara County. San Martin is a rural area, comprised mostly with agricultural and low-
intensity residential uses. These uses dominate the specific location of the subject site, as well. The
county is cautious in allowing an intensification of uses in the unincorporated area. The subject area

SAN MARTIN AIRPORT FBO
CITY AND NEIGHBORHOOD ANALYSIS
© 2018 VALBRIDGE PROPERTY ADVISORS Page 14
is not expected to be annexed into either Gilroy or Morgan Hill for the foreseeable future. Overall,
therefore, the subject neighborhood is in a stable stage of its life cycle.

SAN MARTIN AIRPORT FBO
CITY AND NEIGHBORHOOD ANALYSIS
© 2018 VALBRIDGE PROPERTY ADVISORS Page 15
SAN MARTIN AIRPORT
Property Identification
Airport Code E16
Property Type General Aviation Airport
Property Name San Martin Airport
Address 13025 Murphy Ave
City, State Zip San Martin, CA 95046
County Santa Clara County
Property Description
Based Aircraft 64 Current Occupancy 50% (airport owned)
Annual Operations 31,958 Terminal? No
Towered? No Restaurant? No
Lease Data
Hangar Type Size (s.f.) Rent/Month Rent/s.f./Mo.
T-Hangars 679-1,826 $440.50-1,185 $0.65
Box Hangars 2,029-2,973 $1,432.50-2,262.50 $0.71-0.76

SAN MARTIN AIRPORT FBO
CITY AND NEIGHBORHOOD ANALYSIS
© 2018 VALBRIDGE PROPERTY ADVISORS Page 16
FBO Lease Information
Magnum Aviation is an FBO providing fuel and maintenance services. The leasehold area includes a
main office/hangar building, plus 52 storage hangars. It is our understanding that the storage
hangars were sold to individual users, who now each have a sub-leasehold interest at the airport. The
Master FBO lease expires in December 2020, at which time all sub-leases will also expire.
The original ground rent in 1995 was $0.133 per square foot per year. The lease included annual CPI
increases. If all increases were applied, the 2018 rent would be $0.242 per square foot per year.
Airport Remarks
San Martin airport is located one mile east of San Martin, California. It has one asphalt runway measuring
3095 x 75 feet. It is a small airport with no tower and no terminal. The relatively low number of based aircraft
and level of operations also reflect the limited demand for this airport. It is located in a rural area, distant
from the major employment and population centers of Santa Clara County. The Wings of History Air Museum
is located next to the airport.
The current occupancy in the airport-owned hangars at San Martin Airport is 50%. Most of the hangars are T-
hangars; about 9% of the hangar space represents box hangars. The hangars are relatively new, at about 10
years old. They are in good condition.

SAN MARTIN AIRPORT FBO
SITE DESCRIPTION – ENTIRE LEASEHOLD AREA
© 2018 VALBRIDGE PROPERTY ADVISORS Page 17
Site Description – Entire Leasehold Area
San Martin Airport is located in the unincorporated area of Santa Clara County between Morgan Hill
and Gilroy known as San Martin. The characteristics of the site are summarized as follows:
Site Characteristics Location: At the northwest quadrant of San Martin Airport
Gross Land Area: 10.27 Acres or 447,482 SF
Shape: Irregular
Topography: Level
Drainage: Appears adequate
Grade: At street grade
Utilities: All to site
Flood Zone Data Flood Map Panel/Number: 06085C 0628H
Flood Map Date: 05-18-2009
Flood Zone: D
"D" is areas where flood hazards are undetermined, but possible.
Flood insurance requirements will be determined when specific
flood risk is identified.
Site Area in Flood: 0%

SAN MARTIN AIRPORT FBO
SITE DESCRIPTION – ENTIRE LEASEHOLD AREA
© 2018 VALBRIDGE PROPERTY ADVISORS Page 18
Other Site Conditions Soil Type: Those that appear suitable for development.
Environmental Issues: No environmental issues were noted at the time of inspection or
disclosed by the client that would impact value.
Earthquake Zone: While all of California is prone to earthquakes, the subject is not
in an Alquist-Priolo fault zone.
Adjacent Land Uses North: Vacant land
South: San Martin Airport county-owned hangars
East: San Martin Airport runways
West: Santa Clara County Hazardous Waste Recycling/Disposal Lot and
Llagas Creek
Zoning Designation Zoning Jurisdiction: County of Santa Clara
Zoning Classification: A-20AC-sr, Agricultural, 20 acre minimum lot size, Scenic Roads
Combining District
General Plan Designation: Transportation
Permitted Uses: Agricultural, airport facilities
Analysis/Comments on Site The subject property represents a portion of the San Martin Airport. The most notable aspects of the
airport as it relates to the subject improvements are the permitted uses. The only legally permissible
uses for the subject improvements are those that are airport related. This can include ancillary uses
such as office and retail, provided those mostly service the airport.
Overall, the site characteristics are supportive of the airport uses on the property.

SAN MARTIN AIRPORT FBO
SITE DESCRIPTION – ENTIRE LEASEHOLD AREA
© 2018 VALBRIDGE PROPERTY ADVISORS Page 19
TAX/PLAT MAP

SAN MARTIN AIRPORT FBO
SITE DESCRIPTION – ENTIRE LEASEHOLD AREA
© 2018 VALBRIDGE PROPERTY ADVISORS Page 20
FLOOD ZONE

SAN MARTIN AIRPORT FBO
SITE DESCRIPTION – FBO OFFICE/HANGAR AREA
© 2018 VALBRIDGE PROPERTY ADVISORS Page 21
Site Description – FBO Office/Hangar Area
As requested, we have also estimated the market rent for a portion of the FBO leasehold area
consisting of the main FBO office/hangar building and associated land area. A site plan was not
provided as to what land area would be included with the FBO office/hangar building. For purposes
of this appraisal, therefore, we have estimated that the land area would include an apron area in
front of the hangar, the parking lot located north of the hangar, and the site area extending to the
fuel farm area. An aerial of the associated site area is outlined in the aerial presented below.
Using Google Earth, the land area depicted above was estimated at about 2.51 acres, or 109,335
square feet. If a lease for this portion of the property includes a significantly different associated land
area, then the rent estimated in this appraisal would require revision.
SAN MARTIN AIRPORT FBO
IMPROVEMENTS DESCRIPTION
© 2018 VALBRIDGE PROPERTY ADVISORS Page 22
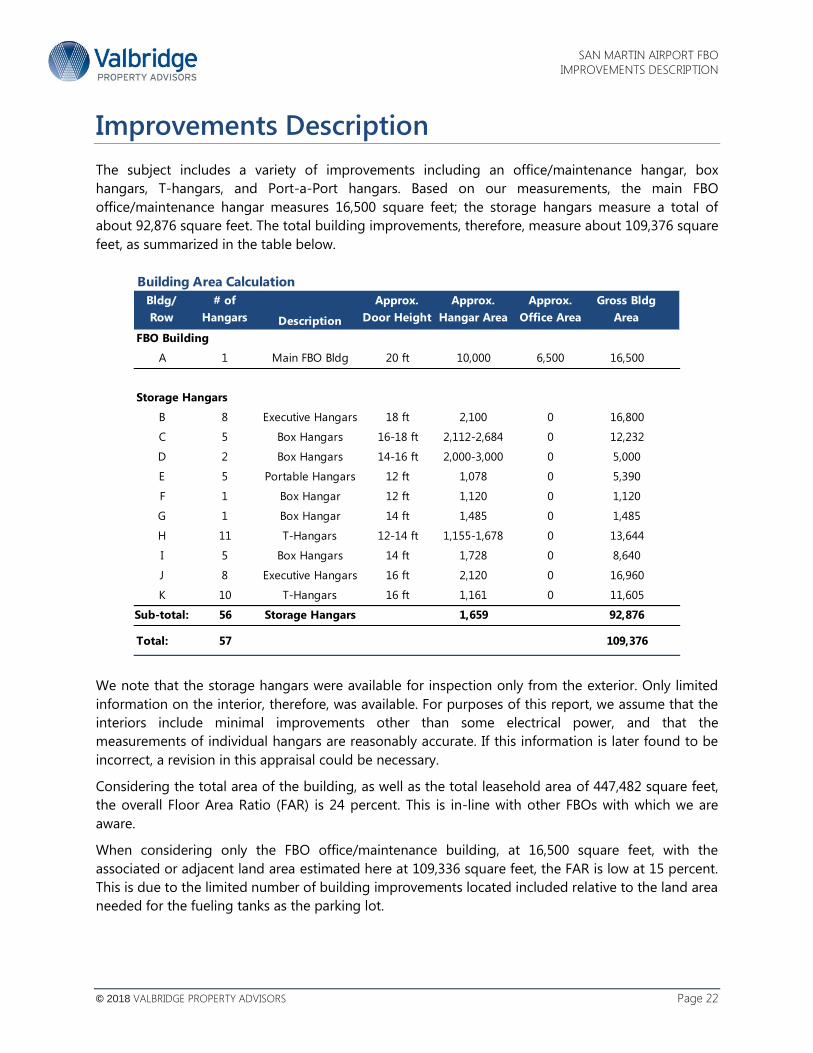
Improvements Description
The subject includes a variety of improvements including an office/maintenance hangar, box
hangars, T-hangars, and Port-a-Port hangars. Based on our measurements, the main FBO
office/maintenance hangar measures 16,500 square feet; the storage hangars measure a total of
about 92,876 square feet. The total building improvements, therefore, measure about 109,376 square
feet, as summarized in the table below.
We note that the storage hangars were available for inspection only from the exterior. Only limited
information on the interior, therefore, was available. For purposes of this report, we assume that the
interiors include minimal improvements other than some electrical power, and that the
measurements of individual hangars are reasonably accurate. If this information is later found to be
incorrect, a revision in this appraisal could be necessary.
Considering the total area of the building, as well as the total leasehold area of 447,482 square feet,
the overall Floor Area Ratio (FAR) is 24 percent. This is in-line with other FBOs with which we are
aware.
When considering only the FBO office/maintenance building, at 16,500 square feet, with the
associated or adjacent land area estimated here at 109,336 square feet, the FAR is low at 15 percent.
This is due to the limited number of building improvements located included relative to the land area
needed for the fueling tanks as the parking lot.
Building Area Calculation
Bldg/
Row
# of
Hangars Description
Approx.
Door Height
Approx.
Hangar Area
Approx.
Office Area
Gross Bldg
Area
FBO Building
A 1 Main FBO Bldg 20 ft 10,000 6,500 16,500
Storage Hangars
B 8 Executive Hangars 18 ft 2,100 0 16,800
C 5 Box Hangars 16-18 ft 2,112-2,684 0 12,232
D 2 Box Hangars 14-16 ft 2,000-3,000 0 5,000
E 5 Portable Hangars 12 ft 1,078 0 5,390
F 1 Box Hangar 12 ft 1,120 0 1,120
G 1 Box Hangar 14 ft 1,485 0 1,485
H 11 T-Hangars 12-14 ft 1,155-1,678 0 13,644
I 5 Box Hangars 14 ft 1,728 0 8,640
J 8 Executive Hangars 16 ft 2,120 0 16,960
K 10 T-Hangars 16 ft 1,161 0 11,605
Sub-total: 56 Storage Hangars 1,659 92,876
Total: 57 109,376
SAN MARTIN AIRPORT FBO
IMPROVEMENTS DESCRIPTION
© 2018 VALBRIDGE PROPERTY ADVISORS Page 23
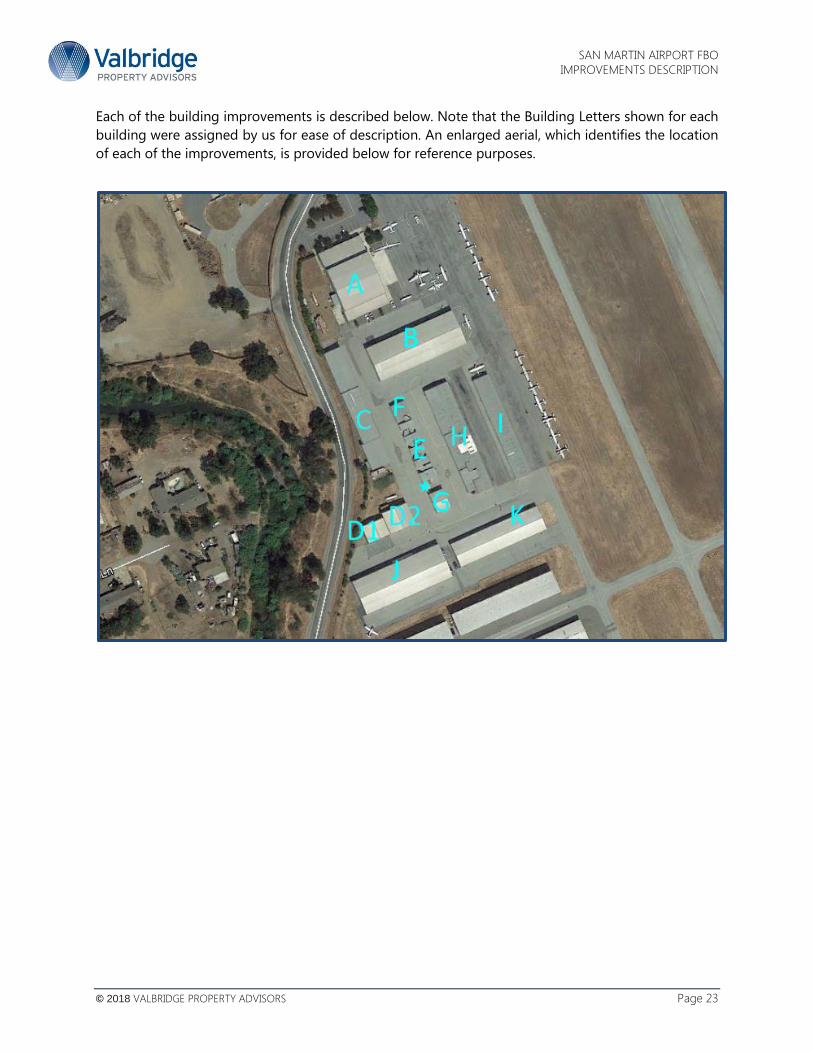
Each of the building improvements is described below. Note that the Building Letters shown for each
building were assigned by us for ease of description. An enlarged aerial, which identifies the location
of each of the improvements, is provided below for reference purposes.

SAN MARTIN AIRPORT FBO
BUILDING A: FBO OFFICE/MAINTENANCE HANGAR
© 2018 VALBRIDGE PROPERTY ADVISORS Page 24
Building A: FBO Office/Maintenance Hangar
Building A consists of the main FBO office and maintenance hangar occupied by Magnum Aviation,
the FBO tenant. The total building measures 16,500 square feet, of which 6,500 represents average
quality office space.
Improvement Characteristics Building Type: FBO Office/Maintenance Hangar
Total Building Area: 16,500 square feet
Interior Build-Out: Open hangar with an office building addition.
Construction Class: Metal, Steel frame.
Construction Quality: Average
Condition: Average
Clear Height: 20 feet
Analysis/Comments on Building The main FBO office/hangar building is a steel-frame building with metal siding. The hangar has a
concrete pad floor, and a 77-foot wide sliding door. The clear height at the door is 20 feet. It is used
primarily for maintenance purposes and appears to have adequate electrical power and plumbing for
that purpose. On both sides of the hangar are annex areas, one of which is improved with the FBO
office, and the other is improved with the hangar office and shop space. The office area is improved
with a ceramic tile floor, painted walls and a suspended ceiling tiles with recessed florescent lights.
We estimate that the building was constructed in the mid-2000s. It is 100% occupied by the FBO.

SAN MARTIN AIRPORT FBO
BUILDING A: FBO OFFICE/MAINTENANCE HANGAR
© 2018 VALBRIDGE PROPERTY ADVISORS Page 25
MAINTENANCE HANGAR INTERIOR
FBO OFFICE

SAN MARTIN AIRPORT FBO
ROW B: EXECUTIVE BOX HANGARS
© 2018 VALBRIDGE PROPERTY ADVISORS Page 26
Row B: Executive Box Hangars
The row of units identified as B on the diagram above contain 8 box hangars of 2,100 square feet
each, for a total area of 16,800 square feet. These hangars are somewhat newer than most of the
other FBO storage hangars located on the property. A general description of the row is provided
below, followed by the individual unit sizes.
Improvement Characteristics Building Type: Box Hangar
Total Building Area: 16,800 square feet
Interior Build-Out: Unknown
Construction Class: S, Steel frame with steel siding
Construction Quality: Average
Condition: Average
Clear Height: 18’
Analysis/Comments on Row B Row B contains individual box hangars that appear typical as compared to those available in the
market. We estimate the date of construction for these hangars in the mid-1990s. They appear in
average condition for their age.

SAN MARTIN AIRPORT FBO
ROW C: BOX HANGARS
© 2018 VALBRIDGE PROPERTY ADVISORS Page 27
Row C: Box Hangars
The row of units identified as C on the diagram above contains a total of 5 box hangars containing a
total of 12,232 square feet. A general description of the row is provided below, followed by the
individual unit sizes.
Improvement Characteristics Building Type: Box Hangar
Total Building Area: 12,232 square feet
Interior Build-Out: Unknown
Construction Class: S, Steel frame with steel siding
Construction Quality: Average
Condition: Average
Clear Height: 16-18’
Analysis/Comments on Row C There are five individual units within the hangar ranging from 2,112 to 2,684 square feet in size. Two
are 48 feet wide, two are 61 feet wide, and one is 60 feet wide. All are 44 feet deep. The two 48-foot
hangars have a 16-foot door height and the other three have 18-foot door heights. We estimate that
these hangars were constructed in the 1960s. None of the units were open for interior inspection.

SAN MARTIN AIRPORT FBO
ROW D: BOX HANGARS
© 2018 VALBRIDGE PROPERTY ADVISORS Page 28
Row D: Box Hangars
The buildings identified as D1 and D2 on the diagram are both box hangars. One measures 2,000
square feet and the other measures 3,000 square feet, for a total of 5,000 square feet. A general
description of the hangar buildings is provided below, followed by the individual unit sizes.
Improvement Characteristics Building Type: Box Hangar
Total Building Area: 5,000 square feet
Interior Build-Out: Unknown
Construction Class: S, Steel frame with steel siding
Construction Quality: Average
Condition: Average
Clear Height: 14-16’
Analysis/Comments on Buildings The hangars are located on a concrete foundation. The door openings range between 50- and 60-
feet. We estimate the buildings were constructed in in the 1960s. Neither unit was open for interior
inspection but the units appear to be in average condition for their age.

SAN MARTIN AIRPORT FBO
ROW E: PORTABLE HANGARS
© 2018 VALBRIDGE PROPERTY ADVISORS Page 29
Row E: Portable Hangars
Row E contains 5 portable hangars known as Port-a-Ports. This row is capped by box hangars
identified as F and G, which are described next. There is also a storage shed on this row (location
indicated by the star on the diagram), which is considered personal property and has not been
evaluated for the purposes of this appraisal. While the Port-a-Ports could also be considered
personal property, for purposes of this analysis, we have included them given that we expect the
units would remain on the property upon expiration of the current FBO lease. The ownership of the
storage shed is not known and assumed to belong to the tenant.
Improvement Characteristics Building Type: Portable hangars
Total Building Area: 5,390 square feet
Interior Build-Out: Unknown
Construction Class: S, Steel-frame with steel siding
Construction Quality: Average
Condition: Average
Clear Height: 12 feet
Analysis/Comments on Row E Based on the measurements we took, the hangars appear to be Executive I (Light Twin) model
hangars. There are a total of five of these units. According to Port-a-Port’s website, these units each
measure approximately 1078 square feet.
Port-a-Port hangars require no specific foundation and can be placed directly on asphalt or concrete.
They all appear to be in average condition; we estimate their construction in the 1960s.

SAN MARTIN AIRPORT FBO
ROW F&G: BOX HANGARS
© 2018 VALBRIDGE PROPERTY ADVISORS Page 30
Rows F & G: Box Hangars
Building F and G are located on either side of the portable hangars and consist of two box hangars.
The buildings measure 1,120 and 1,485 square feet, respectively.
Improvement Characteristics – Box Hangars Building Type: Box Hangar
Total Building Area: 2,605 square feet
Interior Build-Out: Unknown
Construction Class: S, Steel frame with steel siding
Construction Quality: Average
Condition: Average
Clear Height: 12-14’
Analysis/Comments on Buildings Both box hangars are typical as compared to those available in the market. The hangars are located
on a concrete foundation. Neither unit was open for interior inspection. We estimate the buildings
were constructed in the 1960s.

SAN MARTIN AIRPORT FBO
ROW H – T- HANGARS
© 2018 VALBRIDGE PROPERTY ADVISORS Page 31
Row H: T-Hangars
The row identified as H on the diagram consists of 11 T-Hangars as can be seen from the aerial. A
general description of the hangar buildings is provided below, followed by the individual and total
unit sizes for each building.
Improvement Characteristics Building Type: T-Hangars
Total Building Area: 13,644 square feet
Interior Build-Out: Unknown
Construction Class: S, Steel-frame with steel siding
Construction Quality: Average
Condition: Average
Clear Height: 12-14 feet
Analysis/Comments on Row H Eight of the T-Hangars measure 42 feet across the door and are approximately 37 feet deep. Each of
these units is estimated be approximately 1,155 square feet in area. The other 3 hangars represent
end units and range in size from 1,355 and 1,678 square feet. The door heights of the hangars range
between 12-14 feet.
The hangars are typical as compared to those available in the market. None of the units were open
for us to do an interior inspection. We estimate their date of construction to be in the 1960s.

SAN MARTIN AIRPORT FBO
ROW I: BOX HANGARS
© 2018 VALBRIDGE PROPERTY ADVISORS Page 32
Row I: Box Hangars
The row identified as I on the diagram above contains 5 box hangars for a total area of 8,640 square
feet. A general description of the hangar building is provided below, followed by the individual unit
sizes.
Improvement Characteristics Building Type: Box Hangar
Total Building Area: 8,640 square feet
Interior Build-Out: Unknown
Construction Class: S, Steel frame with steel siding
Construction Quality: Average
Condition: Average
Clear Height: 14’
Analysis/Comments on Row I Each unit has a 48-foot-wide sliding door and the building is a single-unit wide, with the doors
facing away from the runways. With a total of five units, each unit measures 1,728 square feet. The
box hangers appear typical as compared to those available in the market. The hangars are located on
a concrete foundation. None of the units were open for an interior inspection. They appear to have
been constructed in the 1960s.
SAN MARTIN AIRPORT FBO
ROW J: EXECUTIVE HANGARS
© 2018 VALBRIDGE PROPERTY ADVISORS Page 33
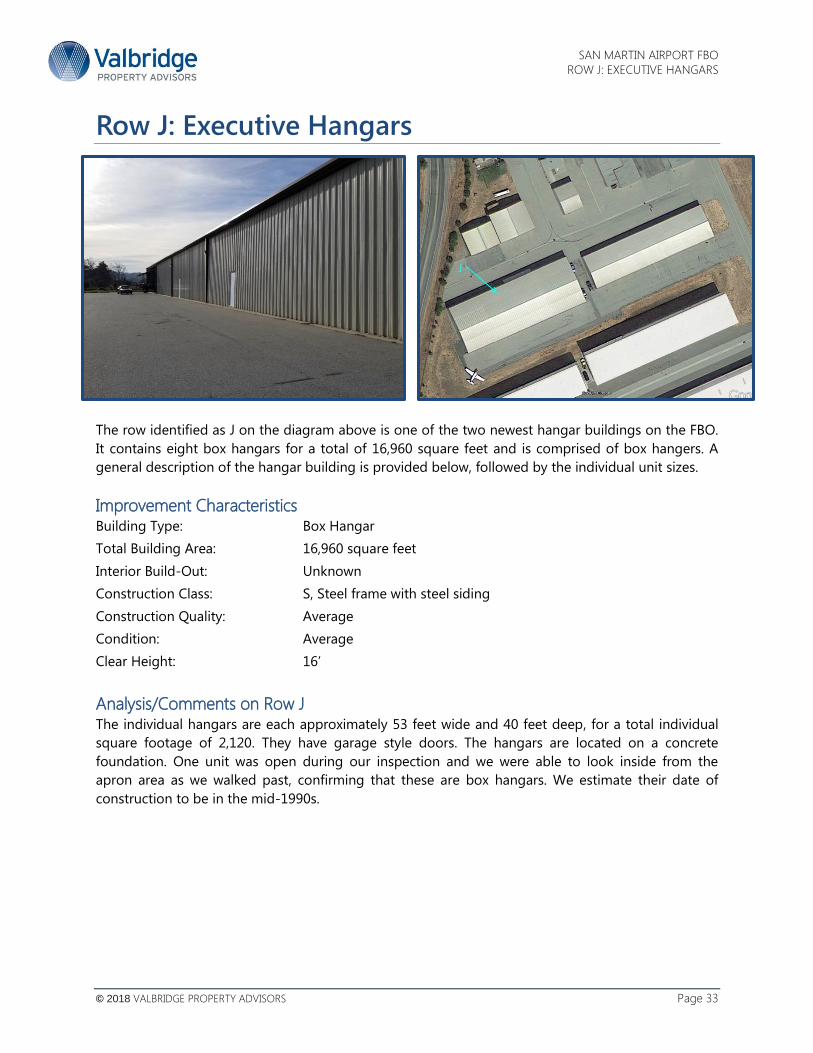
Row J: Executive Hangars
The row identified as J on the diagram above is one of the two newest hangar buildings on the FBO.
It contains eight box hangars for a total of 16,960 square feet and is comprised of box hangers. A
general description of the hangar building is provided below, followed by the individual unit sizes.
Improvement Characteristics Building Type: Box Hangar
Total Building Area: 16,960 square feet
Interior Build-Out: Unknown
Construction Class: S, Steel frame with steel siding
Construction Quality: Average
Condition: Average
Clear Height: 16’
Analysis/Comments on Row J The individual hangars are each approximately 53 feet wide and 40 feet deep, for a total individual
square footage of 2,120. They have garage style doors. The hangars are located on a concrete
foundation. One unit was open during our inspection and we were able to look inside from the
apron area as we walked past, confirming that these are box hangars. We estimate their date of
construction to be in the mid-1990s.

SAN MARTIN AIRPORT FBO
ROW K: T HANGARS
© 2018 VALBRIDGE PROPERTY ADVISORS Page 34
Row K: T-Hangars
The row identified as K on the diagram above contains 11,605 square feet and holds, we estimate
based on the locks, 10 T-hangars. A general description of the hangar buildings is provided below,
followed by the individual unit sizes.
Improvement Characteristics Building Type: Box Hangar
Total Building Area: 11,605 square feet
Interior Build-Out: Unknown
Construction Class: S, Steel frame with steel siding
Construction Quality: Average
Condition: Average
Clear Height: 16’
Analysis/Comments on Row K This row has hangars with sliding doors. This sort of set up does not allow all units to have their
doors open at the same time, as the doors of one hangar will slide across blocking the opening of
the adjacent hangar. By counting the number of locks, it appears that there are 10 or 12 units in this
building. 10 units would mean 42-foot doors, which seems to be typical for T-hangars. With the 10-
unit estimate, each unit would have a unit size around 1,160 square feet, which is in line with the
other T-Hangers on the FBO. The hangars are located on a concrete foundation. One unit was
partially open as we walked by, but we were unable to do more than glance at the visible portion of
the unit and confirm that these are T-hangars. We estimate the date of construction for this building
in the 1990’s.
SAN MARTIN AIRPORT FBO
SUMMARY OF IMPROVEMENTS
© 2018 VALBRIDGE PROPERTY ADVISORS Page 35
Summary of Improvements
The subject improvements consist of an FBO with one main office and maintenance hangar, about 56
storage hangars, 35 tie-downs, a fuel island, and associated apron area. The FBO office measures
about 6,500 square feet, and the maintenance hangar measures about 10,000. The office is improved
with tile flooring, painted gypsum board walls, and a suspended tile ceiling with recessed fluorescent
light. It includes a main lobby area and a couple of private office areas. It is functional for the
intended use and well maintained. The maintenance hangar has a door clear height of about 20 feet
and can accommodate several aircraft at one time. The hangar area includes an annex for a
maintenance office and shop.
The approximate 56 storage hangars include a mix of executive hangars, box hangars, T-hangars and
portable hangars. None of the hangars were inspected on the interior so only limited information is
available on how the interiors are improved. For purposes of this report, we assume that the interiors
include minimal improvements other than some electrical power. This is typical of storage hangars.
We also assume that our measurements of the individual hangars are reasonably accurate. Based on
our measurements, the hangars range in size from 1,078 to 2,684 square feet in size. The total area of
the storage hangars is 92,876 square feet, resulting in an average size for the 56 hangars of 1,659
square feet. The hangars consist of steel siding over a steel frame, typical of box and T-hangars.
Overall, the improvements appear to be in average condition for their age.
Site improvements include a fueling island and about 35 tie-down spaces for aircraft. An asphalt
paved parking lot for about 38 vehicles is located north of the FBO building. The site improvements
are in average to good condition. Based on our research, the FBO building was constructed in the
mid-2000s; three of the storage hangars were constructed in the mid 1990s, and the remainder of
the buildings were constructed in the 1960s.
In summary, the subject is improved with an FBO that consists of an office, maintenance hangar,
about 56 storage hangars and related site improvements. It is our understanding that the users of
the storage hangars own leasehold interests in these hangars; they are not leased out on short-term
leases. In our search for information on the storage hangars, we found no recent listings of sales of
the leasehold interests. Overall, the improvements are functional for their intended use and appear
to meet the demands of the market.

SAN MARTIN AIRPORT FBO
ASSESSMENT AND TAX DATA
© 2018 VALBRIDGE PROPERTY ADVISORS Page 36
Assessment and Tax Data
Assessment Methodology The State of California has provided for a unified system to assess real estate for property taxes.
Assessment Districts are established on a county basis to assess real estate within the county. The
appraised property falls under the taxing jurisdiction of Santa Clara County. Any property taxes due
on the subject, however, would be for possessory interests caused by the creation of leasehold
interests. The fee interest of the property is not assessable. For this reason, there is no reported
assessed value for the property.
For purposes of this market rent analysis, the rent for each individual unit is based on the tenant
paying the possessory interest tax for its interest in the property. This is typical in the subject’s
market.

SAN MARTIN AIRPORT FBO
MARKET ANALYSIS
© 2018 VALBRIDGE PROPERTY ADVISORS Page 37
Market Analysis
Aviation Market Overview The aviation market is a limited, specialized market. It is segmented into two main categories:
commercial and general aviation (GA). Commercial flights represent regularly scheduled flights made
by major commercial air carriers. General aviation flights consist of mostly private flights that are not
necessarily regularly scheduled. It includes all operations, except commercial air carrier traffic and
military operations.
The general aviation market is further segmented into 1) Fixed Based Operators (FBOs) and 2) private
or corporate owner-users. An FBO is a privately-owned entity that provides aviation support services
to other businesses at an airport. These services typically include fueling services, but may also
include aircraft storage, maintenance services, a flight school, etc. Most airports have only one or two
FBOs operating at the airport, as the level of business typically does not warrant additional
competition.
The table on the following page shows the total aviation and general aviation operations in the
United States from 2000 through 2015.

SAN MARTIN AIRPORT FBO
MARKET ANALYSIS
© 2018 VALBRIDGE PROPERTY ADVISORS Page 38
NATIONAL AIRPORT OPERATIONS IN TOWERED AIRPORTS
Itinerant Local
Calendar Air Air General Total Total GA % Change
Year Carrier Taxi Aviation Military Total Civil Military Total Operations Operations GA
2000 15,130,733 10,819,571 22,269,071 1,422,028 49,641,403 16,621,631 1,419,080 18,040,711 67,682,114 38,890,702 -
2001 14,177,655 10,836,776 21,274,300 1,507,820 47,796,551 16,220,728 1,447,706 17,668,434 65,464,985 37,495,028 -3.59
2002 13,309,745 11,160,855 21,386,443 1,554,228 47,411,271 16,063,361 1,520,585 17,583,946 64,995,217 37,449,804 -0.12
2003 12,667,389 11,601,690 20,152,454 1,532,263 45,953,796 15,152,056 1,492,834 16,644,890 62,598,686 35,304,510 -5.73
2004 13,140,372 12,395,387 19,726,898 1,471,943 46,734,600 14,849,783 1,457,885 16,307,668 63,042,268 34,576,681 -2.06
2005 13,467,204 12,437,123 19,151,192 1,389,814 46,445,333 14,774,016 1,445,191 16,219,207 62,664,540 33,925,208 -1.88
2006 13,356,029 11,848,397 18,811,006 1,360,726 45,376,158 14,479,620 1,419,181 15,898,801 61,274,959 33,290,626 -1.87
2007 13,687,788 11,581,071 18,335,008 1,296,229 44,900,096 14,560,618 1,377,542 15,938,160 60,838,256 32,895,626 -1.19
2008 13,544,809 10,604,907 17,013,618 1,275,590 42,438,924 13,589,686 1,228,865 14,818,551 57,257,475 30,603,304 -6.97
2009 12,732,804 9,412,534 15,283,655 1,308,053 38,737,046 12,229,985 1,272,041 13,502,026 52,239,072 27,513,640 -10.10
2010 12,722,700 9,436,641 14,846,037 1,319,936 38,325,314 11,629,445 1,323,870 12,953,315 51,278,629 26,475,482 -3.77
2011 12,861,792 9,177,953 14,475,524 1,306,753 37,822,022 11,481,565 1,294,867 12,776,432 50,598,454 25,957,089 -1.96
2012 12,818,415 8,903,614 14,398,052 1,320,069 37,440,150 11,556,479 1,267,679 12,824,158 50,264,308 25,954,531 -0.01
2013 12,845,544 8,796,539 14,125,183 1,245,620 37,012,886 11,730,379 1,272,093 13,002,472 50,015,358 25,855,562 -0.38
2014 13,170,730 8,309,287 13,942,764 1,287,421 36,710,202 11,679,412 1,235,488 12,914,900 49,625,102 25,622,176 -0.90
2015 13,943,870 7,768,282 13,856,043 1,296,433 36,864,628 11,679,293 1,181,549 12,860,842 49,725,470 25,535,336 -0.34
2016 14,544,132 7,513,991 13,929,858 1,341,127 37,329,108 11,629,359 1,170,742 12,800,101 50,129,209 25,559,217 0.09
2017 13,920,487 6,581,925 12,929,643 1,230,147 34,662,202 11,033,271 1,128,194 12,161,465 46,823,667 23,962,914 -6.25

SAN MARTIN AIRPORT FBO
MARKET ANALYSIS
© 2018 VALBRIDGE PROPERTY ADVISORS Page 39
The data on the previous page shows that General Aviation operations are significantly lower than
they were 10 years ago. However, over the past seven years the declines have been modest, albeit
almost entirely declines, with a significant dip again in 2017. Since 2010, there has been an overall
9.49% decline in general aviation operations nationally despite a small uptick in 2016. However,
overall air carrier numbers have been rebounding over the last few years in defiance of the overall
general trend. This is likely due to a rebound in our economy and the increase in spending on travel.
A report prepared by Kamala I. Shetty and R. John Hansman, titled ”Current and Historical Trends in
General Aviation in the United States,” published by MIT International Center for Air Transportation
(ICAT), in August 2012, indicated that there are different drivers at play in the general aviation market
as compared to the commercial market. These factors include economics, the volatility of fuel prices,
increased use of internet in business (hence, decreasing business travel), tax incentives for aircraft
ownership, the costs of owning and operating personal aircraft, the total private pilot and GA aircraft
populations, along with many others. These factors are likely to remain a dominant force in the
industry in the future, as the report referenced previously indicates that 75% of airports with GA
operations are expected to experience no growth from 2006 levels through 2025.
In the San Francisco Bay Area, General Aviation operations at reliever airports like the subject have
mostly followed the trends of the nation, which are consistent with the predictions of the MIT report.
As seen from the table and chart below, GA operations for six of the surveyed airports have been
relatively flat to slightly declining over the past five years.
Source: County of Santa Clara, Roads and Airport Department &
US Department of Transportation: FAA Operations & Performance Data
Operations at Bay Area Reliever Airports
Year RHV E16 Palo Alto Livermore Hayward Concord Total for Region % Change
2013 156,522 33,914 175,622 155,752 95,664 83,603 701,077 -
2014 138,006 32,522 174,270 144,256 108,305 98,683 696,042 -0.72%
2015 145,003 33,538 170,392 116,067 117,557 103,127 685,684 -1.51%
2016 150,645 33,166 152,353 115,916 107,242 114,893 674,215 -1.70%
2017 163,327 31,958 147,928 128,827 100,257 120,044 692,341 2.62%

SAN MARTIN AIRPORT FBO
MARKET ANALYSIS
© 2018 VALBRIDGE PROPERTY ADVISORS Page 40
This is the case at San Martin, where total operations have not only experienced no growth but have
dropped during and since the Great Recession, with only a couple of positive years as shown below:
OPERATIONS AT SAN MARTIN AIRPORT
Most operations at the reliever airports in the Bay Area are generated by smaller, single-engine
aircraft. This type of aircraft does not require the longer runway length as do larger jets. The length
of an airport’s runway, therefore, can limit the type of aircraft that can land and use the airport. The
surrounding community, and proximity to residential areas, can also impact the type of aircraft that
can land at the airport.
Land rates at airports depend on land use. There is no quoted rate at San Martin. Based on our
survey presented later, land rents for FBO or aviation uses typically range between $0.22 and $0.36
per square foot per year. Typical lease terms are 35 or more years. A long lease term is necessary to
enable the tenant to invest in the property and then to recapture and depreciation that investment
over a normal holding period. Lease terms of 40-50 years are more common as a result.
In summary, the general aviation market is a limited, specialized market that is influenced by the
general economy as well as the aviation industry. Overall flight activity for the general aviation
market has trended downward somewhat over the past five years. The forecast for the industry is for
Year Operations % Change
2007 49,998 -
2008 46,867 -6.26
2009 39,433 -15.86
2010 33,750 -14.41
2011 36,394 7.83
2012 33,468 -8.04
2013 33,914 1.33
2014 32,522 -4.10
2015 33,538 3.12
2016 33,166 -1.11
2017 31,958 -3.64

SAN MARTIN AIRPORT FBO
MARKET ANALYSIS
© 2018 VALBRIDGE PROPERTY ADVISORS Page 41
relatively stable, or flat, activity for the next 5 to 10 years. We expect the subject to perform in-line
with the general market.

SAN MARTIN AIRPORT FBO
HIGHEST AND BEST USE
© 2018 VALBRIDGE PROPERTY ADVISORS Page 42
Highest and Best Use
The Highest and Best Use of a property is the use that is legally permissible, physically possible, and
financially feasible which results in the highest value. An opinion of the highest and best use results
from consideration of the criteria noted above under the market conditions or likely conditions as of
the effective date of value. Determination of highest and best use results from the judgment and
analytical skills of the appraiser. It represents an opinion, not a fact. In appraisal practice, the concept
of highest and best use represents the premise upon which value is based.
Analysis of Highest and Best Use As If Vacant The primary determinants of the highest and best use of the property as if vacant are the issues of
(1) Legal permissibility, (2) Physical possibility, (3) Financial feasibility, and (4) Maximum productivity.
Legally Permissible
The subject site is zoned A-20AC-sr, Agricultural, 20 acre minimum lot size, Scenic Roads Combining
District which controls the general nature of permissible uses. The location of the subject property
“inside” the fenced area of the airport results in a use restriction to airport-related uses. The subject
is well-suited for these types of uses. There are no known easements, encroachments, covenants or
other restrictions that would unduly limit or impede development.
Physically Possible
The physical attributes allow for a number of potential uses. Elements such as size, shape, availability
of utilities, known hazards (flood, environmental, etc.), and other potential influences are described in
the Site Description and have been considered. There are no items of a physical nature that would
materially limit appropriate and likely development.
Financially Feasible
The probable use of the site for airport-related development is compatible with other uses in the
market area. A review of published yield, rental and occupancy rates suggest that there is a balanced
supply and demand is sufficient to support construction costs and ensure timely absorption of
additional inventory in this market. Therefore, near-term speculative development of the subject site
is financially feasible.
The level of operations and the number of based aircraft at the airport best support no more than
one FBO that sells fuel.
Maximally Productive
Among the financially feasible uses, the use that results in the highest value (the maximally
productive use) is the highest and best use. Considering these factors, the maximally productive use
as though vacant is for development of an FBO use.
Conclusion of Highest and Best Use As If Vacant
The conclusion of the highest and best use as if vacant is for development of an FBO use.

SAN MARTIN AIRPORT FBO
HIGHEST AND BEST USE
© 2018 VALBRIDGE PROPERTY ADVISORS Page 43
Analysis of Highest and Best Use as Improved In determining the highest and best use of the property as improved, the focus is on three
possibilities for the property: (1) continuation of the existing use, (2) modification of the existing use,
or (3) demolition and redevelopment of the land.
Retaining the improvements as they exist meets the tests for physical possibility, legal permissibility
and financial feasibility. The improvements are in average condition and any alternative use of the
existing improvements is unlikely to be economically feasible. The market value of the property as
improved exceeds the combination of vacant site value plus cost of demolition of the improvements.
Therefore demolition and redevelopment of the site is not maximally productive.
Conclusion of Highest and Best Use As Improved
The highest and best use of the subject property, as improved, is the existing FBO use.
Most Probable Lessee As of the date of value, the most probable lessee(s) or tenant(s) of the subject property are a single
Fixed Base Operators (FBOs), with sub-tenancies for the individual storage hangars. The most likely
users would be members of the local community, as well as visitors to the area, arriving by plane.

SAN MARTIN AIRPORT FBO
APPRAISAL METHODOLOGY
© 2016 VALBRIDGE PROPERTY ADVISORS Page 44
Appraisal Methodology
Approaches to Value There are two traditional approaches typically available to develop indications of rent: direct
comparison, and a return on cost/value.
Direct Comparison Approach
In the direct comparison approach, the appraiser analyzes leases and listings of similar properties,
adjusting for differences between the subject property and the comparable properties. This method
can be useful for valuing properties when there is an active leasing market for the property type
being appraised.
Return on Value
The return on value approach is based on the principle that rent is related to value. In this approach,
the value of the improvement is estimated and then an appropriate rate of return is applied. The
value is commonly estimated utilizing the Cost Approach. This approach is often used when there is
no active leasing market for the property type being appraised.
Subject Valuation The subject includes a variety of airport improvements that are commonly found in other
neighboring airports. These include the hangar and office space. Individual hangars are commonly
leased and rates for individual hangars are readily available. However, leases for entire FBO leases are
uncommon, as there are few airports in the region, with each airport typically operating within only 1
or 2 FBOs. Those leases tend to be long-term, which further results in very limited data available for
applying a direct comparison approach.
For this reason, we applied a valuation approach that represents a return on value/cost. The
improvements are first valued using a cost approach, and then an appropriate rate of return is
applied to the resulting value to arrive at the market rent for the improvements. This rent is then
added to the market rent of the underlying land, which is estimated by applying a direct comparison
approach. This method is applied to the entire FBO leasehold area, as well as the portion of the site
that includes the FBO office/maintenance hangar and associated land.

SAN MARTIN AIRPORT FBO
MARKET RENT OF ENTIRE LEASEHOLD AREA
© 2016 VALBRIDGE PROPERTY ADVISORS Page 45
Market Rent of Entire Leasehold Area
Methodology We have first estimated the market rent for the entire leasehold area, which consists of 447,482
square feet of land area and about 109,376 square feet of improvements. As indicated previously, we
have applied the Return on Value methodology, in which a market rate of return is applied to the
value of the improvements, which is then added to the market rent of the underlying land.
The first step in this process, then, is to apply the cost approach to the existing improvements. This
includes both building and site improvements.

SAN MARTIN AIRPORT FBO
COST APPROACH FOR ENTIRE LEASEHOLD AREA
© 2016 VALBRIDGE PROPERTY ADVISORS Page 46
Cost Approach for Entire Leasehold Area
Methodology The cost approach develops an indication of market value by estimating replacement or
reproduction cost of the improvements, deducting all appropriate forms of depreciation and adding
land value. This approach is based on the premise that an investor or buyer of real estate would pay
no more for a specific property than the cost to replace or reproduce the improvements less any
accrued depreciation plus payment of entrepreneurial incentive and land value.
Direct Costs To estimate direct costs of the building, we used replacement cost. Marshall Valuation Service is a
national cost contracting service with years of evaluation experience and continued analysis of the
cost of new construction. The calculator method was used to determine the replacement cost of the
improvements.
Direct Building Cost
Marshall Valuation Service cost figures indicated total direct building construction costs of
$5,270,174 or $48.18 per square foot of gross building area. A calculation of total direct building
costs for the subject property follows.
Direct Cost - All Buildings on Entire Leasehold Area
Building Identification/Name
Maintenance
Hangar
Executive Box
Hangars Box Hangars T-Hangars
Portable
Hangars All
Gross Building Area 16,500 sf 45,365 sf 28,477 sf 13,644 sf 5,390 sf 109,376
Story Height (average in feet) 18' 16-18' 14-16' 12-14'
Number of Floors 1 1 1 1 1
Year Built 2006 1996 1960's 1960's 1960's
Effective Age 10 years 22 years 35 years 35 years 45 years 23 years
Marshall Valuation Service
Date Feb-18 Feb-18 Feb-18 Feb-18 Feb-18
Section 14 14 14 14 14
Page 29 29 29 30 30
Type Maintenance Hangar Storage Hangar Storage Hangar T-Hangar T-Hangar
Class S S S S S
Quality Average-Good Average Low Cost Low Cost Low Cost
Base Cost/SF of GBA $60.63 $36.75 $24.80 $26.25 $26.25 $35.41
Base Cost Adjustments
Sprinklers $2.48 $0.00 $0.00 $0.00 $0.00 $0.37
Base Cost Subtotal $63.11 $36.75 $24.80 $26.25 $26.25 $35.79
Multipliers
Current 1.020(x) 1.020(x) 1.020(x) 1.020(x) 1.020(x)
Local 1.320(x) 1.320(x) 1.320(x) 1.320(x) 1.320(x)
Perimeter 1.000(x) 1.000(x) 1.000(x) 1.000(x) 1.000(x)
Story Height 1.000(x) 1.000(x) 1.000(x) 1.000(x) 1.000(x)
Number of Floors 1.000(x) 1.000(x) 1.000(x) 1.000(x) 1.000(x)
Net Multiplier 1.346(x) 1.346(x) 1.346(x) 1.346(x) 1.346(x) 1.346(x)
Adj. Direct Building Cost/SF of GBA $84.97 $49.48 $33.39 $35.34 $35.34 $48.18
Adj. Total Direct Building Cost $1,402,005 $2,244,660 $950,847 $482,179 $190,483 $5,270,174

SAN MARTIN AIRPORT FBO
COST APPROACH FOR ENTIRE LEASEHOLD AREA
© 2016 VALBRIDGE PROPERTY ADVISORS Page 47
Direct Site Improvement Cost
Direct site improvement costs were estimated at $2,684,892, as presented in the following table:
Indirect Costs Comparable properties indicated indirect costs of 1 to 5 percent of direct costs, most of which is
included in the Marshall Valuation Service figures above. We estimated an additional expense of
5.00% of direct costs for items not included, or $397,753. The calculation is presented in the
following table:
Total Direct and Indirect Cost
Marshall Valuation Service
The Marshall Valuation Service cost figures indicated a total direct and indirect cost of $8,352,819, as
presented in the following table:
Entrepreneurial Incentive For this analysis, entrepreneurial incentive was estimated at 10.0% percent of construction cost, or
$835,282, which is appropriate for special purpose oriented development. The calculation is
presented in the following table:
Direct Cost - Site Improvements for Entire Leasehold Area
Item Size/Quantity Unit Cost Total Cost
Site Improvements 447,482 x $6.00 $2,684,892
Total Site Improvement Costs $2,684,892
=
Indirect Cost
Item
Building + Site
Direct Costs Rate Total Cost
Professional Fees Excluded from MVS $7,955,066 x 5.00% $397,753
Total Indirect Costs $397,753
=
Marshall Valuation Service Direct and Indirect Cost
Component Cost Estimate
Direct Building Cost $5,270,174
Direct Site Improvement Cost $2,684,892
Indirect Cost $397,753
Total Direct and Indirect Cost $8,352,819
Entrepreneurial Incentive Calculation
Replacement Cost New Only Entrepreneurial Incentive
$8,352,819 x 10.0% = $835,282

SAN MARTIN AIRPORT FBO
COST APPROACH FOR ENTIRE LEASEHOLD AREA
© 2016 VALBRIDGE PROPERTY ADVISORS Page 48
Replacement Cost New Adding entrepreneurial incentive to the reconciled total direct and indirect cost resulted in a
replacement cost new of $9,188,101
Depreciation The next step is to estimate depreciation applicable to the subject improvements. The various forms
of depreciation are discussed as follows:
Physical Deterioration
Physical deterioration is a reduction in utility resulting from an impairment of physical condition and
is delineated into curable and incurable components.
Curable Physical
Based on our property visit and discussions with the property owners, the subject property does not
exhibit deferred maintenance.
Incurable Physical
Total incurable physical depreciation was estimated at 46.0%, or -$4,226,526. The calculation is
presented in the following table:
Functional Obsolescence
The subject property is representative of market standards and the ideal improvement. Therefore, no
functional obsolescence was considered.
External Obsolescence
No external obsolescence is noted.
Total Depreciation
Adding all forms of depreciation indicated total accrued depreciation of $4,226,526.
Market Value of Improvements Deducting all forms of depreciation from the value of the improvements as if new results in a
contributory value of the improvements of $4,961,575, as shown below.
Replacement Cost New $9,188,101
Effective Age 23 years
Economic Life 50 years
Indicated Deterioration Ratio 46.0%
Indicated Deterioration $4,226,526
Incurable Deterioration - Age/Life Method

SAN MARTIN AIRPORT FBO
COST APPROACH FOR ENTIRE LEASEHOLD AREA
© 2016 VALBRIDGE PROPERTY ADVISORS Page 49
Market Rate of Return on Improvements Next, a market rate of return is applied to the improvements.
Rates of return for land for all properties typically range between 7 to 10 percent, with the most
desirable properties earning a higher rate of return than less desirable properties. Most airport
properties lease at land rates ranging between 8.0 and 8.5 percent. Improvements lease at rates of
return that are higher than land rates. This is mostly because they depreciate over time and thus
carry more risk.
Airport improvements typically have long lives and depreciate more slowly than other commercial
properties. For this reason, we have applied a 200 basis point increase over a land base rate of 8.0
percent. In conclusion, a rate of return of 10.0 percent is applied to the improvements. This results in
a contributory rent for the improvements of $496,157 per year, as shown below.
Next, the contributory market rent of the land is estimated and then added to the above rent for the
improvements.
Cost Approach Schedule for All Improvements on Entire Leasehold Area
Replacement Cost New
Direct and Indirect Cost New $8,352,819
Entrepreneurial Incentive $835,282
Replacement Cost New $9,188,101
Accrued Depreciation
Physical Deterioration
Curable (deferred maintenance) $0
Incurable (short-lived) $0
Incurable (long-lived) -$4,226,526
Total Physical Deterioration -$4,226,526
Obsolescence
External $0
Functional $0
Total Obsolescence $0
Total Accrued Depreciation -$4,226,526
Depreciated Cost of Improvements $4,961,575
Market Rent for Improvements on Entire Leasehold Area
Depreciated Cost of Improvements $4,961,575
Multiplied by Rate of Return for Improvements 10%
Market Rent for Contributory Value of Improvements $496,157

SAN MARTIN AIRPORT FBO
MARKET RENT FOR ENTIRE LAND AREA
© 2016 VALBRIDGE PROPERTY ADVISORS Page 50
Market Rent for Entire Land Area
Next, the market rent for the entire land area is estimated. To develop an opinion of market rent for
the land, we have utilized a Direct Comparison Approach. The direct comparison approach develops
an indication of market rent by analyzing consummated leases, listings, or pending leases of
properties similar to the subject, focusing on the difference between the subject and the
comparables using all appropriate elements of comparison. This approach is based on principles of
supply and demand, balance, externalities, and substitution.
The first step in the Direct Comparison Approach is to research and analysis comparable rental
properties. In our search for comparable, we have focused on properties with a similar highest and
best use as the subject. These represent properties designated for FBO or aviation-related uses on
airports.
There are few leases of FBO properties in the subject’s area given that there are few airports in any
regions, and leases to FBO or aviation-related uses are typically long-term and thus do not transact
often. Yet, a direct comparison to leases of these types of uses represents the best and most reliable
method available in estimating market rent for the subject.
In our search for comparable properties, we searched for FBO sites that were located on airports that
are similar to San Martin in terms of runway length, number of based aircraft, and amenities available
to pilots.
The most comparable leases are summarized in the table on the following page, followed by a map
displaying the location of each comparable in relation to the subject. Summary sheets detailing each
comparable are then included, followed by a map. Analysis of the comparables is provided after the
individual summary sheets.

SAN MARTIN AIRPORT FBO
MARKET RENT FOR ENTIRE LAND AREA
© 2016 VALBRIDGE PROPERTY ADVISORS Page 51
Airport Ground Rent Comparable Summary
Comp. Lease Property Annual # Based Rental
No. Signed Name Location Operations Aircraft Rate / SF
1 December-15 San Martin Airport San Martin, California 31,958 64 $0.22
2 January-14 Hayward Executive Airport Hayward, California 116,800 452 $0.32
3 November-14 Fresno Yosemite Int'l Airport Fresno, California 99,645 179 $0.30
4 December-13 Livermore Airport Livermore, California 117,530 462 $0.36
5 October-15 Jacqueline Cochrane Airport Thermal, California 76,285 48 $0.35
6 Available Gillespie Field Airport El Cajon, California 226,665 562 $0.32
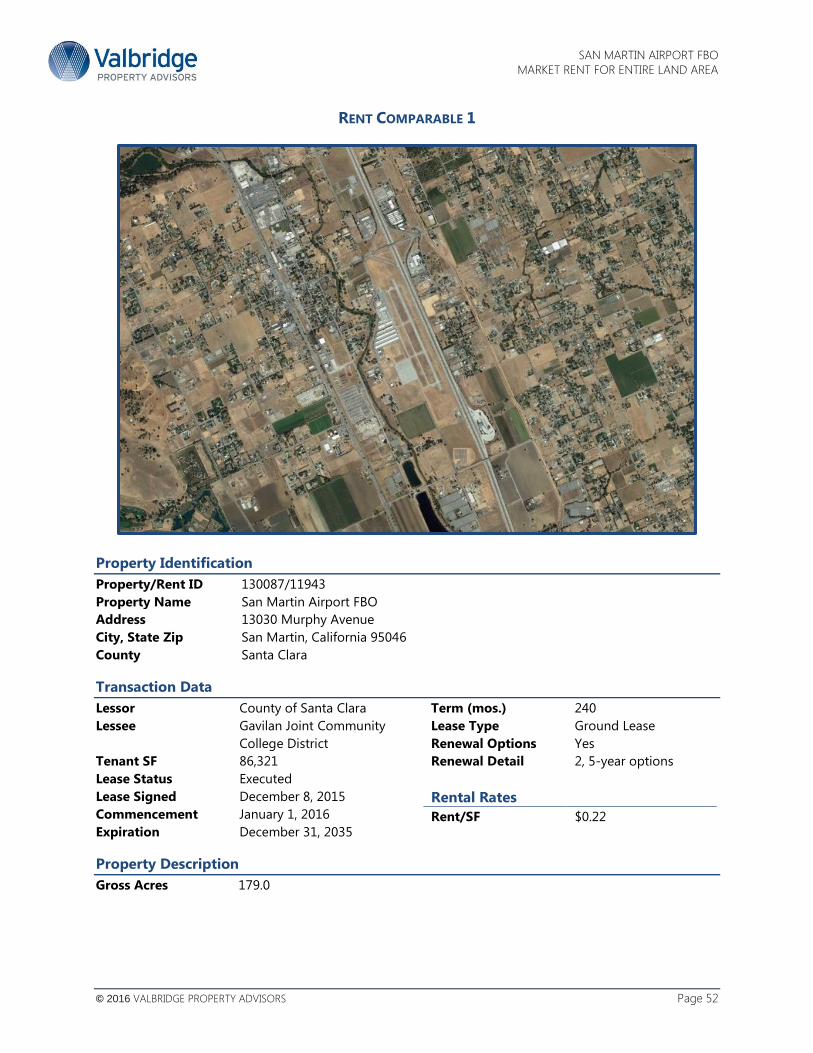
SAN MARTIN AIRPORT FBO
MARKET RENT FOR ENTIRE LAND AREA
© 2016 VALBRIDGE PROPERTY ADVISORS Page 52
RENT COMPARABLE 1
Property Identification
Property/Rent ID 130087/11943
Property Name San Martin Airport FBO
Address 13030 Murphy Avenue
City, State Zip San Martin, California 95046
County Santa Clara
Transaction Data
Lessor County of Santa Clara
Lessee Gavilan Joint Community
College District
Tenant SF 86,321
Lease Status Executed
Lease Signed December 8, 2015
Commencement January 1, 2016
Expiration December 31, 2035
Term (mos.) 240
Lease Type Ground Lease
Renewal Options Yes
Renewal Detail 2, 5-year options
xxx xxx
Rental Rates xxx
Rent/SF $0.22
Property Description
Gross Acres 179.0

SAN MARTIN AIRPORT FBO
MARKET RENT FOR ENTIRE LAND AREA
© 2018 VALBRIDGE PROPERTY ADVISORS Page 53
Remarks X
San Martin Airport is a small reliever airport of 179 acres located in the south portion of Santa Clara
County. There is one runway, with a length of about 3,100 feet. There is no tower and operations in 2017
were 32,485. There are 67 based aircraft at the airport. One FBO serves the airport; the FBO provides fuel
and maintenance services, as well as pilot training. The FBO is improved with about 53 hangars, all of
which are occupied by users within individual sub-leaseholds. Those leasehold interests expire in 2020, at
which time the FBO property and the sub-leasehold improvements will revert to the County. The County
also owns about 100 hangars, which it leases out to individual users.
This a ground lease for a portion of land "inside-the-fence" of San Martin Airport. The tenant plans to
construct an aviation maintenance technician school on the site. The lease also includes the use of one,
existing, county-owned hangar on the airport. The rate listed above does not include the hangar space.
The lease has an initial term of 20 years, with two, 5-year options. There are annual CPI increases.

SAN MARTIN AIRPORT FBO
MARKET RENT FOR ENTIRE LAND AREA
© 2018 VALBRIDGE PROPERTY ADVISORS Page 54
RENT COMPARABLE 2
Property Identification
Property/Rent ID 113789/4544
Property Name Hayward Executive Airport
Address 20301 Skywest Drive
City, State Zip Hayward, California 94541
County Alameda
Transaction Data
Lessor Hayward Executive Airport
Lessee Meridian Companies
Tenant SF 314,939
Lease Status Executed
Commencement January 1, 2014
Expiration December 31, 2063
Term (mos.) 600
Lease Type Ground Lease
xxx xxx
Rental Rates xxx
Rent/SF $0.32
Property Description
Gross Acres 543.00

SAN MARTIN AIRPORT FBO
MARKET RENT FOR ENTIRE LAND AREA
© 2018 VALBRIDGE PROPERTY ADVISORS Page 55
Remarks X
Hayward Executive Airport is located about two miles west of downtown Hayward. It has two asphalt
runways. One is 5,694 by 150 feet, the second is 3,107 by 75 feet. The airport was a former military
airport and is now designated as a reliever airport, meaning that it is designated to provide relief or
additional capacity to the primary airports in the area (such as San Francisco International, San Jose
International, and Oakland International) and to accommodate general aviation aircraft in the area.
This lease, which represents Phase I, is 7.23 acres (314,939 sf) in size and includes the construction of a
122,500 sf aircraft parking apron, one 18,000-sf aircraft storage hangar, and an attached 3,000-sf
passenger terminal with reception area, pilot lounge, weather briefing room, and administrative offices.
This phase will also include the construction of an above-ground fuel storage facility with a capacity of
30,000 gallons, a 40-vehicle parking lot, and a two-lane entrance road that connects to West Winton
Avenue. The tenant indicates an estimate of $5.6 million to build out the improvements for Phase I.

SAN MARTIN AIRPORT FBO
MARKET RENT FOR ENTIRE LAND AREA
© 2018 VALBRIDGE PROPERTY ADVISORS Page 56
RENT COMPARABLE 3
Property Identification
Property/Rent ID 113791/4547
Property Name Fresno Yosemite International Airport
Address 5175 E Clinton Way
City, State Zip Fresno, California 93727
County Fresno
Transaction Data
Lessor Fresno Yosemite
International Airport
Lessee ROAM
Tenant SF 64,402
Lease Status Executed
Commencement November 1, 2014
Expiration October 31, 2034
Term (mos.) 240
Lease Type Ground Lease
xxx xxx
Rental Rates xxx
Rent/SF $0.30
Property Description
Gross Acres 1,728

SAN MARTIN AIRPORT FBO
MARKET RENT FOR ENTIRE LAND AREA
© 2018 VALBRIDGE PROPERTY ADVISORS Page 57
Remarks X
Fresno Yosemite International Airport is a joint civil-military airport located in the heart of Fresno. It is
1,728 acres in size and has two runways and a helipad. The runways are 9,539 and 8,008 feet long.
Fresno airport has multiple commercial airlines using the airport including Alaska Airlines, American
Airlines, Delta, and United – however total operations for the airport for 2017 were still under 100,000.
This ground lease starts on the Effective date and ends 20 years after the Date of Beneficial Occupancy
(date a certificate of occupancy is issued for the new improvements or 12 months from the effective
date, whichever is earlier).

SAN MARTIN AIRPORT FBO
MARKET RENT FOR ENTIRE LAND AREA
© 2018 VALBRIDGE PROPERTY ADVISORS Page 58
RENT COMPARABLE 4
Property Identification
Property/Rent ID 113792/4548
Property Name Livermore Airport
Address 36 Terminal Circle
City, State Zip Livermore, California 94551
County Alameda
Transaction Data
Lessor Livermore Airport
Lessee Five Rivers Aviation, LLC
Tenant SF 485,258
Lease Status Executed
Commencement December 1, 2013
Expiration November 30, 2048
Term (mos.) 420
Lease Type Ground Lease
Renewal Options Yes
Renewal Detail 2, 5-year periods
xxx xxx
Rental Rates xxx
Rent/SF $0.36
Property Description
Gross Acres 650.00

SAN MARTIN AIRPORT FBO
MARKET RENT FOR ENTIRE LAND AREA
© 2018 VALBRIDGE PROPERTY ADVISORS Page 59
Remarks X
Livermore Municipal Airport is located about three miles northwest of downtown Livermore, California. It
has two asphalt runways which are parallel to each other. The first is 5,253 by 100 ft, the second is 2,699
by 75 ft. The airport is designated as a reliever airport, meaning that it is designated to provide relief or
additional capacity to the primary airports in the area (such as San Francisco International, San Jose
International, and Oakland International) and to accommodate general aviation aircraft in the area. The
airport has about 400 hangars onsite and is 100% occupied. There is a waiting list. It is a busy airport
with a high number of based aircraft, likely due to the relatively low rental rates for the region. The
immediate area is rural, but in the path of development.
This lease is a 35-year lease renewal with two additional 5-year options under the same conditions as the
original lease.

SAN MARTIN AIRPORT FBO
MARKET RENT FOR ENTIRE LAND AREA
© 2018 VALBRIDGE PROPERTY ADVISORS Page 60
RENT COMPARABLE 5
Property Identification
Property/Rent ID 130303/11757
Property Name Jacqueline Cochrane Airport
Address 56-850 Higgins Drive
City, State Zip Thermal, California 92274
County Riverside
Transaction Data
Lessor County of Riverside
Lessee Desert Jet Center
Tenant SF 191,664
Lease Status Executed
Lease Signed October 6, 2015
Commencement November 1, 2015
Expiration October 31, 2050
Term (mos.) 420
Lease Type Ground Lease
Renewal Options Yes
Renewal Detail 1 5-year option
xxx xxx
Rental Rates xxx
Rent/SF $0.35
Property Description
Gross Acres 1,850.00

SAN MARTIN AIRPORT FBO
MARKET RENT FOR ENTIRE LAND AREA
© 2018 VALBRIDGE PROPERTY ADVISORS Page 61
Remarks X
Jacqueline Cochran Regional Airport is located in Thermal, California in the Coachella Valley, about 20
miles southeast of Palm Springs. It has two asphalt runways, one of which is 8,500 feet long and the
other is 4,995 feet long. While the airport only has 44 based aircraft and had only about 76,000
operations last year, there are 4 fuel providers.
This is the lease of vacant land on which to build an FBO - approximate 7,000-sf office building and
22,500-sf hangar with approximately 2,700 sf of maintenance stop for servicing aircraft, and a fuel
station, with an additional 10,000 of hangar space to be built within the first five years of the lease.
Monthly rent of $5,596.80 plus fuel flowage fee of 10 cents per gallon (12 cents minus 2 cents per gallon
for on-time payment of rent/fee). Rent has CPI adjustment annually, and adjusts to market July 1, 2020
and every 5 years afterwards.

SAN MARTIN AIRPORT FBO
MARKET RENT FOR ENTIRE LAND AREA
© 2018 VALBRIDGE PROPERTY ADVISORS Page 62
RENT COMPARABLE 6
Property Identification
Property/Rent ID 130359/11785
Property Name Gillespie Field Airport
Address N Marshall Ave
City, State Zip El Cajon, California 92020
County San Diego
Transaction Data
Lessor County of San Diego
Lessee Velocity CEA SD LLC
Tenant SF 311,018
Lease Status Executed
Commencement March 1, 2018
Expiration February 29, 2048
Term (mos.) 360
Lease Type Ground Lease
xxx xxx
Rental Rates xxx
Rent/SF $0.32
Property Description
Gross Acres 758.00

SAN MARTIN AIRPORT FBO
MARKET RENT FOR ENTIRE LAND AREA
© 2018 VALBRIDGE PROPERTY ADVISORS Page 63
Remarks X
Gillespie Field is located in El Cajon, 10 miles northeast of downtown San Diego. It is 758 acres in size
and has three asphalt runways measuring 5,342 feet, 4,145 feet and 2,738 feet long. The airport is the
home of the San Diego Air and Space Museum Gillespie Field Annex, which displays many vintage and
modern airplanes as well as a replica of the Spirit of St. Louis.
This lease represents the purchase and renegotiation of a ground lease on the airport. Velocity is
purchasing the FBO/ground lease from the previous leaseholder, and plans to do substantial capital
improvements. Therefore they are looking to extend the previous lease to a new full 30-year term. The
base monthly rent starts at $8211 per month until December 1, 2018 when it adjusts to $8,568, which is
the same as the existing lease. Thereafter base monthly rent will adjust on the same schedule and terms
contained in the existing lease. As part of the new lease, lessee is required to meet a minimum capital
investment requirement of $907,375 (which reportedly is well within their plans for upgrading the
property).

SAN MARTIN AIRPORT FBO
MARKET RENT OF A PORTION OF LEASEHOLD AREA
© 2018 VALBRIDGE PROPERTY ADVISORS Page 64
Market Rent Analysis When necessary, adjustments were made for differences in the various elements of comparison,
including lease structure, market conditions, location, size and other relevant factors. If the element
in comparison is considered superior to that of the subject, we applied a negative adjustment.
Conversely, a positive adjustment is applied if inferior. A summary of the elements of comparison
follows.
Transaction Adjustments Transaction adjustments include: expense structure, concessions, tenant improvement allowances
and conditions of lease. These items, which are applied prior to the market conditions and property
adjustments, are discussed as follows:
Expense Structure
The market rent estimate is based on a triple net lease structure. As the rent comparables exhibited
rental rates negotiated on the same basis, no expense structure adjustments were warranted.
Rental Concessions
No rent comparables were reporting rental concessions upon the date of value. Therefore, no
adjustments due to rental concessions were required.
Conditions of Lease
No atypical conditions of lease were noted and the for-lease listing rates were reported as
representative of consummated market transactions.
Market Conditions Adjustment Market conditions change over time because of inflation, deflation, fluctuations in supply and
demand, or other factors. Changing market conditions may create a need for adjustment to
comparable rent transactions consummated during periods of dissimilar market conditions.
The rent comparables range in signing dates from 2013 to a current listing. General market
conditions have improved significantly since that time, and land for most types of uses has increased
as well. However, the aviation market remained relatively flat. Recognizing the general increase in
market and economic conditions, as well as the fact that the subject airport has outperformed the
market over the past 5 years, we have applied a 3 percent annual increase to each of the
comparables to reflect current market conditions.
Property Adjustments Property Adjustments are usually expressed quantitatively as percentages or dollar amounts that
reflect differences in rental rates attributable to the various characteristics of the property. In some
instances, however, qualitative adjustments are used. Property adjustments are based on locational
and physical characteristics and are made after the application of transaction and market conditions
adjustments.
Our reasoning for the adjustments made was based on our market research, best judgement, and
experience in the appraisal of similar properties.

SAN MARTIN AIRPORT FBO
MARKET RENT OF A PORTION OF LEASEHOLD AREA
© 2018 VALBRIDGE PROPERTY ADVISORS Page 65
Location
Location adjustments may be required when the locational characteristics of a comparable are
different from those of the subject. These characteristics can include general neighborhood
characteristics, freeway accessibility, street exposure, corner versus interior lot location, neighboring
properties, view amenities, and other factors.
The location adjustment considers only the general, regional location of the subject airport. Factors
such as the specific activity of the airport and the airport physical characteristics are considered later.
Most of the surveyed airports required upward adjustment relative to the subject’s regional location.
Our adjustments considered factors such as the population and median household incomes of the
areas, as well as general economic activity. The adjustments for this factor ranged between 5% and
10%, recognizing the desirable regional location of the subject within Santa Clara County. Rent
Comparable 1 required no locational adjustment, as that comparable is located at San Martin Airport.
Leased Area
The size adjustment addresses variance in the rentable area of the comparables and that of the
subject, as larger lease space typically commands a lower rental rate per unit than does a smaller
space. This inverse relationship is due, in part, to the principle of “economies of scale.”
The subject consists of about 10.27 acres and is best suited for one FBO that provides fuel and other
services. Considering this configuration, we made downward adjustments for Comparables 1 and 3,
which ranged from about 1.5 to 2.0 acres in size. The other comparables were more similar in size to
the subject and thus required no size adjustment.
Rent Escalations
Most FBO and aviation leases have either annual CPI increases, or cumulative CPI increases every five
years. Many long-term leases also include re-valuation clauses every 20 to 25 years. This represents
the lease terms that we would also expect for the subject, and the terms upon which the market rent
estimate is based. No adjustment is necessary, therefore, for this factor.
Lease Term
Most leases require an investment by the tenant in the airport, such as building construction and site
improvements. These improvements typically have useful lives of over 40 years. A tenant must have
sufficient number of years in which he can amortize and depreciate his investment in the property. If
a sufficient lease term is not provided, the value of the underlying land is negatively impacted.
Most of the leases surveyed included lease terms of over 40 years. Comparables 1 and 3, however,
had shorter terms and thus required an upward adjustment for this factor.
Airport Operations and Number of Based Aircraft
The level of activity at an airport will impact the businesses that operate there, and thus impact the
rent for the facility. In evaluating the level of airport activity, we considered both the level of
operations as well as the number of based aircraft. All of the comparables, except Comparable 1,
were superior to the subject in this regard and required downward adjustments.

SAN MARTIN AIRPORT FBO
MARKET RENT OF A PORTION OF LEASEHOLD AREA
© 2018 VALBRIDGE PROPERTY ADVISORS Page 66
Longest Runway Length
The length of the longest airport runway impacts the type of aircraft that can use the facility, and
thus the type of businesses that can operate at the facility. San Martin a runway length of 3,100 feet,
which cannot accommodate most modern jets. All the other airports surveyed had longer runways
and thus could attract a wider variety of aircraft and businesses. For this reason, each of these
comparables was adjusted downward to reflect the subject’s runway limitations, except Comparable
1, which is located at San Martin.
Summary of Adjustments Presented on the following page is a summary of the adjustments made to the rent comparables. As
noted earlier, these quantitative adjustments were based on our market research, best judgment, and
experience in the appraisal of similar properties.
Rent Comparable Adjustment Grid - FBO Land
Rental 1 Rental 2 Rental 3 Rental 4 Rental 5 Rental 6
Comparable ID 11943 4544 4547 4548 11757 11785
Date of Value & Survey/Lease Date February-18 December-15 June-15 June-15 June-15 October-15 February-18
Airport Name San Martin San Martin Hayward Fresno Livermore J Cochrane Gillespie
Annual Rental Rate $0.22 $0.32 $0.30 $0.36 $0.35 $0.32
Transactional Adjustments
Expense Structure Triple Net Ground Lease Ground Lease Ground Lease Ground Lease Ground Lease Ground Lease
Expenses (psf) $0.00 $0.00 $0.00 $0.00 $0.00 $0.00
Rent Concessions
Adjustment $0.00
Effective Rental Rate $0.22 $0.32 $0.30 $0.36 $0.35 $0.32
FALSE FALSE FALSE FALSE FALSE FALSEConditions of Lease
Adjustment $0.00 $0.00 $0.00 $0.00 $0.00 $0.00
Adjusted Rental Rate $0.22 $0.32 $0.30 $0.36 $0.35 $0.32
FALSE FALSE FALSE FALSE FALSE FALSEMarket Conditions Adjustments
Elapsed Time from Date of Value 2.18 years 2.63 years 2.63 years 2.63 years 2.35 years 0.00 years
Market Trend Through February-18 6.5% 7.9% 7.9% 7.9% 7.0% -
Analyzed Rental Rate $0.23 $0.35 $0.32 $0.39 $0.38 $0.32
0.0% 0.0% 0.0% 0.0% 0.0% 0.0%Property Adjustments
Regional Location San Martin San Martin,
California
Hayward,
California
Fresno,
California
Livermore,
California
Thermal,
California
El Cajon,
California
Adjustment - - 10.0% 10.0% 5.0% 10.0%
0.0% 0.0% 0.0% 0.0% 0.0% 0.0%Leased Area 447,482 86,321 sf 314,939 sf 64,402 sf 485,258 sf 191,664 sf 311,018 sf
Adjustment -10.0% - -10.0% - - -
0.0% 0.0% 0.0% 0.0% 0.0% 0.0%Rent Escalations Typical Annual CPI Typical Typical Typical CPI Typical
Adjustment - - - - - -
0.0% 0.0% 0.0% 0.0% 0.0% 0.0%Lease Term 40 years 30 years 50.0 years 20.0 years 45 years 40 years Market
Adjustment 10.0% - 20.0% - - -
0.0% 0.0% 0.0% 0.0% 0.0% 0.0%Airport Ops/Based Aircraft 31,958 Similar Superior Superior Superior Superior Superior
Adjustment 64 - -20.0% -10.0% -20.0% -5.0% -40.0%
0.0% 0.0% 0.0% 0.0% 0.0% 0.0%Longest Runway Length 3,100 3,100 5,694 9,539 5,253 8,500 5,342
Adjustment - -25.0% -30.0% -25.0% -30.0% -25.0%
Net Physical Adjustment 0.0% -45.0% -20.0% -35.0% -30.0% -55.0%
Adjusted Annual Rental Rate $0.23 $0.19 $0.26 $0.25 $0.26 $0.14

SAN MARTIN AIRPORT FBO
MARKET RENT OF A PORTION OF LEASEHOLD AREA
© 2018 VALBRIDGE PROPERTY ADVISORS Page 67
Land Rent Conclusion From the market data available, we used six rent comparables, which were adjusted based on
pertinent elements of comparison. The following table summarizes the unadjusted and adjusted
rental rates:
The comparables indicated a potential range of market rent ranging from $0.14to $0.26 per square
foot per year. Comparable 1, located at San Martin Airport, is the most similar to the subject. This
comparable indicated a rate of $0.23 per square foot. Considering this comparable, as well as the
others analyzed, the market rent for the underlying land is estimated at $0.24 per square foot per
year, or $107,396.
Market Rent Conclusion The market rent for the underlying land is then added to the market rent of the improvements. This
results in a total annual market rent indication of $600,000, as summarized below.
The above market rent conclusion of $600,000 equates to a monthly rent of $50,000. On a per unit
basis, the market rent equates to $0.46 per square foot per month on the building area. This is
toward the low end of the rents currently charged for the county’s storage hangars at San Martin.
This is reasonable, however, since the area leased is much larger than any single hangar, and thus
carries significantly more risk of management.
The conclusion also results in a rent of $1.34 per square foot per year on the land area. This is much
higher than the market rent for just the land, at $0.24 per square foot per year, which is reasonable
considering the considerable improvements located on the site.
Rent Comparable Statistics
Metric Unadjusted Adjusted
Minimum Rental Rate $0.22 $0.14
Maximum Rental Rate $0.36 $0.26
Median Rental Rate $0.32 $0.24
Mean Rental Rate $0.31 $0.22
Market Rent for Land and Improvements on Entire Leasehold Area
Market Rent for Contributory Value of Improvements $496,157
Market Rent for Contributory Value of Land 107,396
Indicated Annual Market Rent for Entire Subject Property $603,553
Rounded to: $600,000
Indicated Market Rent Conclusion
Indicated Market Rent per Month $50,000
Indicated Market Rent per Square Foot of Building Area/Month $0.46
Indicated Market Rent per Square Foot of Land Area/Year $1.34

SAN MARTIN AIRPORT FBO
MARKET RENT OF A PORTION OF LEASEHOLD AREA
© 2018 VALBRIDGE PROPERTY ADVISORS Page 68
Market Rent of a Portion of Leasehold Area
Next, we have estimated the market rent for a portion of the leasehold area. This area includes the
main FBO office/maintenance hangar and the associated land area. As noted earlier, the FBO
office/maintenance hangar measures 16,500 square feet and is located on about 2.51 acres, or
109,336 square feet of land.
The same methodology is applied to this portion of the property as the entire leasehold area. The
Cost Approach, therefore, is presented next.

SAN MARTIN AIRPORT FBO
COST APPROACH FOR A PORTION OF LEASEHOLD AREA
© 2018 VALBRIDGE PROPERTY ADVISORS Page 69
Cost Approach for a Portion of Leasehold Area
Direct Costs To estimate direct costs of the building, we used replacement cost. Marshall Valuation Service is a
national cost contracting service with years of evaluation experience and continued analysis of the
cost of new construction. The calculator method was used to determine the replacement cost of the
improvements.
Direct Building Cost
Marshall Valuation Service cost figures indicated total direct building construction costs of
$1,402,005 or $84.97 per square foot of gross building area. A calculation of total direct building
costs for the subject property follows.
Direct Site Improvement Cost
Direct site improvement costs were estimated at $656,014, as presented in the following table:
Direct Cost - FBO Office/Maintenance Hangar
Building Identification/Name
Maintenance Hangar
Gross Building Area 16,500 sf
Story Height (average in feet) 18'
Number of Floors 1
Year Built 2006
Effective Age 10 years
Marshall Valuation Service
Date Feb-18
Section 14
Page 29
Type Maintenance Hangar
Class S
Quality Average-Good
Base Cost/SF of GBA $60.63
Base Cost Adjustments
Sprinklers $2.48
Base Cost Subtotal $63.11
Multipliers
Current 1.020(x)
Local 1.320(x)
Perimeter 1.000(x)
Story Height 1.000(x)
Number of Floors 1.000(x)
Net Multiplier 1.346(x)
Adj. Direct Building Cost/SF of GBA $84.97
Adj. Total Direct Building Cost $1,402,005
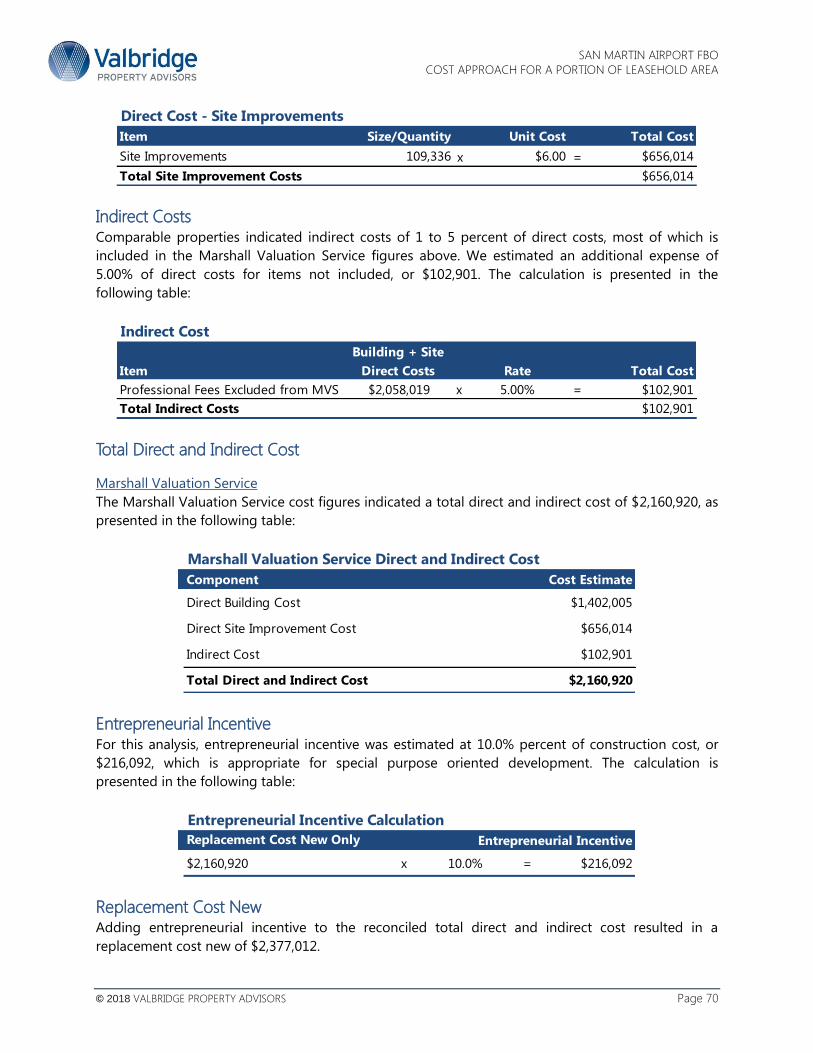
SAN MARTIN AIRPORT FBO
COST APPROACH FOR A PORTION OF LEASEHOLD AREA
© 2018 VALBRIDGE PROPERTY ADVISORS Page 70
Indirect Costs Comparable properties indicated indirect costs of 1 to 5 percent of direct costs, most of which is
included in the Marshall Valuation Service figures above. We estimated an additional expense of
5.00% of direct costs for items not included, or $102,901. The calculation is presented in the
following table:
Total Direct and Indirect Cost
Marshall Valuation Service
The Marshall Valuation Service cost figures indicated a total direct and indirect cost of $2,160,920, as
presented in the following table:
Entrepreneurial Incentive For this analysis, entrepreneurial incentive was estimated at 10.0% percent of construction cost, or
$216,092, which is appropriate for special purpose oriented development. The calculation is
presented in the following table:
Replacement Cost New Adding entrepreneurial incentive to the reconciled total direct and indirect cost resulted in a
replacement cost new of $2,377,012.
Direct Cost - Site Improvements
Item Size/Quantity Unit Cost Total Cost
Site Improvements 109,336 x $6.00 $656,014
Total Site Improvement Costs $656,014
=
Indirect Cost
Item
Building + Site
Direct Costs Rate Total Cost
Professional Fees Excluded from MVS $2,058,019 x 5.00% $102,901
Total Indirect Costs $102,901
=
Marshall Valuation Service Direct and Indirect Cost
Component Cost Estimate
Direct Building Cost $1,402,005
Direct Site Improvement Cost $656,014
Indirect Cost $102,901
Total Direct and Indirect Cost $2,160,920
Entrepreneurial Incentive Calculation
Replacement Cost New Only Entrepreneurial Incentive
$2,160,920 x 10.0% = $216,092

SAN MARTIN AIRPORT FBO
COST APPROACH FOR A PORTION OF LEASEHOLD AREA
© 2018 VALBRIDGE PROPERTY ADVISORS Page 71
Depreciation The next step is to estimate depreciation applicable to the subject improvements. The various forms
of depreciation are discussed as follows:
Physical Deterioration
Physical deterioration is a reduction in utility resulting from an impairment of physical condition and
is delineated into curable and incurable components.
Curable Physical
Based on our property visit and discussions with the property owners, the subject property does not
exhibit deferred maintenance.
Incurable Physical
Total incurable physical depreciation was estimated at 20.0%, or $475,402. The calculation is
presented in the following table:
Functional Obsolescence
The subject property is representative of market standards and the ideal improvement. Therefore, no
functional obsolescence was considered.
External Obsolescence
No external obsolescence is noted.
Total Depreciation
Adding all forms of depreciation indicated total accrued depreciation of $475,402.
Market Value of Improvements Deducting all forms of depreciation from the value of the improvements as if new results in a
contributory value of the improvements of $1,901,610, as shown on the following page.
Replacement Cost New $2,377,012
Effective Age 10 years
Economic Life 50 years
Indicated Deterioration Ratio 20.0%
Indicated Deterioration $475,402
Incurable Deterioration - Age/Life Method

SAN MARTIN AIRPORT FBO
COST APPROACH FOR A PORTION OF LEASEHOLD AREA
© 2018 VALBRIDGE PROPERTY ADVISORS Page 72
Market Rate of Return on Improvements Next, a market rate of return is applied to the improvements. The same rate that was applied to the
entire leasehold area is considered appropriate for this analysis as well. Applying a 10.0 percent rate
of return to the improvements, then, results in a contributory rent for the improvements of $190,161
per year, as shown below.
Next, the contributory market rent of the land is added to the above rent for the improvements.
Market Rate of Return on Improvements The land rent was estimated earlier at $0.24 per square foot per year based on a direct comparison
of other airport land comparables. Applying this unit value to the subject’s land area of 109,336
square feet results in a land rent of $26,241 per year.
Adding the market rent for the improvements to the market rent for the underlying land results in a
total annual market rent estimate of $220,000 for the subject, as summarized below.
Cost Approach Schedule
Replacement Cost New
Direct and Indirect Cost New $2,160,920
Entrepreneurial Incentive $216,092
Replacement Cost New $2,377,012
Accrued Depreciation
Physical Deterioration
Curable (deferred maintenance) $0
Incurable (short-lived) $0
Incurable (long-lived) -$475,402
Total Physical Deterioration -$475,402
Obsolescence
External $0
Functional $0
Total Obsolescence $0
Total Accrued Depreciation -$475,402
Depreciated Cost of Improvements $1,901,610
Market Rent for Improvements Only
Depreciated Cost of Improvements $1,901,610
Multiplied by Rate of Return for Improvements 10%
Market Rent for Contributory Value of Improvements $190,161

SAN MARTIN AIRPORT FBO
COST APPROACH FOR A PORTION OF LEASEHOLD AREA
© 2018 VALBRIDGE PROPERTY ADVISORS Page 73
The above market rent conclusion of $220,000 equates to a monthly rent of $18,333. On a per unit
basis, the market rent equates to $1.11 per square foot per month on the building area. This is higher
than the rents currently charged for the county’s storage hangars at San Martin. This is reasonable
since the building represents an office/maintenance hangar, which includes a much higher level of
improvements than storage hangars. It also is reasonable considering that the site includes the right
to sell fuel.
The conclusion also results in a rent of $2.01 per square foot per year on the land area. This is much
higher than the market rent for just the land, at $0.24 per square foot per year, which is reasonable
considering the considerable improvements located on the site.
Cross-Check of Rental Conclusion We have cross-checked the value conclusion above by reviewing some rental information available
that was obtained through our research on FBO leases. Note that the location of the first two
comparables is confidential and cannot be disclosed. It represents an airport within the San Francisco
Bay Area, and this is regionally somewhat similar to the subject.
As seen from the table, the rents indicated by the three comparables listed above range from $0.94
to $1.50 per square foot. Rent Comparables 1a and 1b represent leases on an airport within the San
Francisco Bay Area. The date that the rent was set for both of these leases is unknown. Comparable
1a represents a maintenance hangar (with minimal to no office build-out), plus the right to sell fuel.
Overall, the airport location and operational competitiveness of this airport is superior to the subject.
However, the subject improvements are superior, and the date of the actual lease is likely dated.
Comparable 1b is located at the same airport as Comparable 1a and represents the current rent for a
tenant that occupies both office space and a maintenance hangar at the airport. The quality and
condition of these improvements is relatively similar to the subject. The location and operational
Market Rent for Land and Improvements
Market Rent for Contributory Value of Improvements $190,161
Market Rent for Contributory Value of Land 26,241
Indicated Annual Market Rent for Portion of Subject Property $216,402
Rounded to: $220,000
Indicated Market Rent Conclusion
Indicated Market Rent per Month $18,333
Indicated Market Rent per Square Foot of Building Area/Month $1.11
Indicated Market Rent per Square Foot of Land Area/Year $2.01
FBO Rent Comparables
Comp Airport Date
Bldg
Area
Monthly
Rent Rent/s.f. Comments
1a Bay Area Airport Current 10,640 $10,000 $0.94 Fuel & maintenance provider.
1b Bay Area Airport Current 15,141 $20,000 $1.32 Maintenance and office space.
2 John Wayne Airport Jan-17 83,265 $125,000 $1.50 FBO at commercial airport.

SAN MARTIN AIRPORT FBO
COST APPROACH FOR A PORTION OF LEASEHOLD AREA
© 2018 VALBRIDGE PROPERTY ADVISORS Page 74
performance of the airport, however, is superior, suggesting that the subject would lease at a lower
rate.
Comparable 2 is not directly comparable to the subject, as this represents an FBO at a commercial
airport. However, we have included this comparable for informational purposes given that it
represents a recent lease of an FBO. Considering the subject’s operation, a much lower rent than
$1.50 per square foot is indicated.
In conclusion, the three comparables for FBO and/or aviation businesses were considered as a cross-
check to our value conclusion. The rent for these comparables ranges between $0.94 and $1.50 per
square foot. While of the comparables could be compared directly to the subject, they support the
value conclusion of $1.11 per square foot per month for the subject.

SAN MARTIN AIRPORT FBO
SUMMARY OF VALUE CONCLUSIONS
© 2018 VALBRIDGE PROPERTY ADVISORS Page 75
Summary of Value Conclusions
This appraisal estimates the annual market rent for the entire Magnum Aviation leasehold area, as
well as a portion of the leasehold area. The entire area consists of 109,376 square feet of
improvements located on 447,482 square feet of land. The portion appraised within this appraisal
consists of a 16,500 square foot office/maintenance hangar located on 109,336 square feet of land.
Based on our research and analysis, the market rent conclusions for each property is estimated
below.
The market rent was based on return on value, which is a common approach used for special
purpose properties for which there is limited market data. This approach provides a reasonable
conclusion for the property which is in-line with actual rents currently charged for other property at
the airport.
Component
Entire FBO
Leasehold Area
FBO Office/ Hangar
Portion w/Adjacent Land
Value Type Market Rent Market Rent
Effective Date of Value February 9, 2018 February 9, 2018
Annual Market Rent $600,000 $220,000
Per Square Foot of Building Area/Month $0.46 $1.11 psf
Per Square Foot of Land Area/Year $1.34 $2.01 psf
Value Conclusions
SAN MARTIN AIRPORT FBO
GENERAL ASSUMPTIONS & LIMITING CONDITIONS
© 2018 VALBRIDGE PROPERTY ADVISORS Page 76
General Assumptions and Limiting Conditions
This appraisal is subject to the following limiting conditions:
1. The legal description – if furnished to us – is assumed to be correct.
2. No responsibility is assumed for legal matters, questions of survey or title, soil or subsoil
conditions, engineering, availability or capacity of utilities, or other similar technical matters.
The appraisal does not constitute a survey of the property appraised. All existing liens and
encumbrances have been disregarded and the property is appraised as though free and
clear, under responsible ownership and competent management unless otherwise noted.
3. Unless otherwise noted, the appraisal will value the property as though free of
contamination. Valbridge Property Advisors | Hulberg and Associates will conduct no
hazardous materials or contamination inspection of any kind. It is recommended that the
client hire an expert if the presence of hazardous materials or contamination poses any
concern.
4. The stamps and/or consideration placed on deeds used to indicate sales are in correct
relationship to the actual dollar amount of the transaction.
5. Unless otherwise noted, it is assumed there are no encroachments, zoning violations or
restrictions existing in the subject property.
6. The appraiser is not required to give testimony or attendance in court by reason of this
appraisal, unless previous arrangements have been made.
7. Unless expressly specified in the engagement letter, the fee for this appraisal does not
include the attendance or giving of testimony by Appraiser at any court, regulatory, or other
proceedings, or any conferences or other work in preparation for such proceeding. If any
partner or employee of Valbridge Property Advisors | Hulberg and Associates is asked or
required to appear and/or testify at any deposition, trial, or other proceeding about the
preparation, conclusions or any other aspect of this assignment, client shall compensate
Appraiser for the time spent by the partner or employee in appearing and/or testifying and
in preparing to testify according to the Appraiser’s then current hourly rate plus
reimbursement of expenses.
8. The values for land and/or improvements, as contained in this report, are constituent parts of
the total value reported and neither is (or are) to be used in making a summation appraisal
of a combination of values created by another appraiser. Either is invalidated if so used.
SAN MARTIN AIRPORT FBO
GENERAL ASSUMPTIONS & LIMITING CONDITIONS
© 2018 VALBRIDGE PROPERTY ADVISORS Page 77
9. The dates of value to which the opinions expressed in this report apply are set forth in this
report. We assume no responsibility for economic or physical factors occurring at some point
at a later date, which may affect the opinions stated herein. The forecasts, projections, or
operating estimates contained herein are based on current market conditions and
anticipated short-term supply and demand factors and are subject to change with future
conditions.
10. The sketches, maps, plats and exhibits in this report are included to assist the reader in
visualizing the property. The appraiser has made no survey of the property and assumed no
responsibility in connection with such matters.
11. The information, estimates and opinions, which were obtained from sources outside of this
office, are considered reliable. However, no liability for them can be assumed by the
appraiser.
12. Possession of this report, or a copy thereof, does not carry with it the right of publication.
Neither all, nor any part of the content of the report, or copy thereof (including conclusions
as to property value, the identity of the appraisers, professional designations, reference to
any professional appraisal organization or the firm with which the appraisers are connected),
shall be disseminated to the public through advertising, public relations, news, sales, or other
media without prior written consent and approval.
13. No claim is intended to be expressed for matters of expertise that would require specialized
investigation or knowledge beyond that ordinarily employed by real estate appraisers. We
claim no expertise in areas such as, but not limited to, legal, survey, structural, environmental,
pest control, mechanical, etc.
14. This appraisal was prepared for the sole and exclusive use of the client for the function
outlined herein. Any party who is not the client or intended user identified in the appraisal or
engagement letter is not entitled to rely upon the contents of the appraisal without express
written consent of Valbridge Property Advisors | Hulberg and Associates and Client. The
Client shall not include partners, affiliates, or relatives of the party addressed herein. The
appraiser assumes no obligation, liability or accountability to any third party.
15. Distribution of this report is at the sole discretion of the client, but third-parties not listed as
an intended user on the face of the appraisal or the engagement letter may not rely upon the
contents of the appraisal. In no event shall client give a third-party a partial copy of the
appraisal report. We will make no distribution of the report without the specific direction of
the client.
16. This appraisal shall be used only for the function outlined herein, unless expressly authorized
by Valbridge Property Advisors | Hulberg and Associates.

SAN MARTIN AIRPORT FBO
GENERAL ASSUMPTIONS & LIMITING CONDITIONS
© 2018 VALBRIDGE PROPERTY ADVISORS Page 78
17. This appraisal shall be considered in its entirety. No part thereof shall be used separately or
out of context.
18. Unless otherwise noted in the body of this report, this appraisal assumes that the subject
property does not fall within the areas where mandatory flood insurance is effective. Unless
otherwise noted, we have not completed nor have we contracted to have completed an
investigation to identify and/or quantify the presence of non-tidal wetland conditions on the
subject property. Because the appraiser is not a surveyor, he or she makes no guarantees,
express or implied, regarding this determination.
19. The flood maps are not site specific. We are not qualified to confirm the location of the
subject property in relation to flood hazard areas based on the FEMA Flood Insurance Rate
Maps or other surveying techniques. It is recommended that the client obtain a confirmation
of the subject property’s flood zone classification from a licensed surveyor.
20. It is assumed that there are no hidden or unapparent conditions of the property, subsoil, or
structures which would render it more or less valuable. No responsibility is assumed for such
conditions or for engineering which may be required to discover them.
21. Our inspection included an observation of the land and improvements thereon only. It was
not possible to observe conditions beneath the soil or hidden structural components within
the improvements. We inspected the buildings involved, and reported damage (if any) by
termites, dry rot, wet rot, or other infestations as a matter of information, and no guarantee
of the amount or degree of damage (if any) is implied. Condition of heating, cooling,
ventilation, electrical and plumbing equipment is considered to be commensurate with the
condition of the balance of the improvements unless otherwise stated. Should the client have
concerns in these areas, it is the client’s responsibility to order the appropriate inspections.
The appraiser does not have the skill or expertise to make such inspections and assumes no
responsibility for these items.
22. This appraisal does not guarantee compliance with building code and life safety code
requirements of the local jurisdiction. It is assumed that all required licenses, consents,
certificates of occupancy or other legislative or administrative authority from any local, state
or national governmental or private entity or organization have been or can be obtained or
renewed for any use on which the value conclusion contained in this report is based unless
specifically stated to the contrary.
23. When possible, we have relied upon building measurements provided by the client, owner, or
associated agents of these parties. In the absence of a detailed rent roll, reliable public
records, or “as-built” plans provided to us, we have relied upon our own measurements of
the subject improvements. We follow typical appraisal industry methods; however, we
recognize that some factors may limit our ability to obtain accurate measurements including,
but not limited to, property access on the day of inspection, basements, fenced/gated areas,
grade elevations, greenery/shrubbery, uneven surfaces, multiple story structures, obtuse or
acute wall angles, immobile obstructions, etc. Professional building area measurements of

SAN MARTIN AIRPORT FBO
GENERAL ASSUMPTIONS & LIMITING CONDITIONS
© 2018 VALBRIDGE PROPERTY ADVISORS Page 79
the quality, level of detail, or accuracy of professional measurement services are beyond the
scope of this appraisal assignment.
24. We have attempted to reconcile sources of data discovered or provided during the appraisal
process, including assessment department data. Ultimately, the measurements that are
deemed by us to be the most accurate and/or reliable are used within this report. While the
measurements and any accompanying sketches are considered to be reasonably accurate
and reliable, we cannot guarantee their accuracy. Should the client desire a greater level of
measuring detail, they are urged to retain the measurement services of a qualified
professional (space planner, architect or building engineer). We reserve the right to use an
alternative source of building size and amend the analysis, narrative and concluded values (at
additional cost) should this alternative measurement source reflect or reveal substantial
differences with the measurements used within the report.
25. In the absence of being provided with a detailed land survey, we have used assessment
department data to ascertain the physical dimensions and acreage of the property. Should a
survey prove this information to be inaccurate, we reserve the right to amend this appraisal
(at additional cost) if substantial differences are discovered.
26. If only preliminary plans and specifications were available for use in the preparation of this
appraisal, then this appraisal is subject to a review of the final plans and specifications when
available (at additional cost) and we reserve the right to amend this appraisal if substantial
differences are discovered.
27. Unless otherwise stated in this report, the value conclusion is predicated on the assumption
that the property is free of contamination, environmental impairment or hazardous materials.
Unless otherwise stated, the existence of hazardous material was not observed by the
appraiser and the appraiser has no knowledge of the existence of such materials on or in the
property. The appraiser, however, is not qualified to detect such substances. The presence of
substances such as asbestos, urea-formaldehyde foam insulation, or other potentially
hazardous materials may affect the value of the property. No responsibility is assumed for
any such conditions, or for any expertise or engineering knowledge required for discovery.
The client is urged to retain an expert in this field, if desired.
28. The Americans with Disabilities Act (“ADA”) became effective January 26, 1992. We have not
made a specific compliance survey of the property to determine if it is in conformity with the
various requirements of the ADA. It is possible that a compliance survey of the property,
together with an analysis of the requirements of the ADA, could reveal that the property is
not in compliance with one or more of the requirements of the Act. If so, this could have a
negative effect on the value of the property. Since we have no direct evidence relating to this
issue, we did not consider possible noncompliance with the requirements of ADA in
developing an opinion of value.
29. This appraisal applies to the land and building improvements only. The value of trade
fixtures, furnishings, and other equipment, or subsurface rights (minerals, gas, and oil) were
not considered in this appraisal unless specifically stated to the contrary.

SAN MARTIN AIRPORT FBO
GENERAL ASSUMPTIONS & LIMITING CONDITIONS
© 2018 VALBRIDGE PROPERTY ADVISORS Page 80
30. No changes in any federal, state or local laws, regulations or codes (including, without
limitation, the Internal Revenue Code) are anticipated, unless specifically stated to the
contrary.
31. Any income and expense estimates contained in the appraisal report are used only for the
purpose of estimating value and do not constitute prediction of future operating results.
Furthermore, it is inevitable that some assumptions will not materialize and that
unanticipated events may occur that will likely affect actual performance.
32. Any estimate of insurable value, if included within the scope of work and presented herein, is
based upon figures developed consistent with industry practices. However, actual local and
regional construction costs may vary significantly from our estimate and individual insurance
policies and underwriters have varied specifications, exclusions, and non-insurable items. As
such, we strongly recommend that the Client obtain estimates from professionals
experienced in establishing insurance coverage. This analysis should not be relied upon to
determine insurance coverage and we make no warranties regarding the accuracy of this
estimate.
33. The data gathered in the course of this assignment (except data furnished by the Client) shall
remain the property of the Appraiser. The appraiser will not violate the confidential nature of
the appraiser-client relationship by improperly disclosing any confidential information
furnished to the appraiser. Notwithstanding the foregoing, the Appraiser is authorized by the
client to disclose all or any portion of the appraisal and related appraisal data to appropriate
representatives of the Appraisal Institute if such disclosure is required to enable the appraiser
to comply with the Bylaws and Regulations of such Institute now or hereafter in effect.
34. You and Valbridge Property Advisors | Hulberg and Associates both agree that any dispute
over matters in excess of $5,000 will be submitted for resolution by arbitration. This includes
fee disputes and any claim of malpractice. The arbitrator shall be mutually selected. If
Valbridge Property Advisors | Hulberg and Associates and the client cannot agree on the
arbitrator, the presiding head of the Local County Mediation & Arbitration panel shall select
the arbitrator. Such arbitration shall be binding and final. In agreeing to arbitration, we both
acknowledge that, by agreeing to binding arbitration, each of us is giving up the right to
have the dispute decided in a court of law before a judge or jury. In the event that the client,
or any other party, makes a claim against Hulberg and Associates or any of its employees in
connections with or in any way relating to this assignment, the maximum damages
recoverable by such claimant shall be the amount actually received by Valbridge Property
Advisors | Hulberg and Associates for this assignment, and under no circumstances shall any
claim for consequential damages be made.
35. Valbridge Property Advisors | Hulberg and Associates shall have no obligation, liability, or
accountability to any third party. Any party who is not the “client” or intended user identified
on the face of the appraisal or in the engagement letter is not entitled to rely upon the
contents of the appraisal without the express written consent of Valbridge Property Advisors
| Hulberg and Associates. “Client” shall not include partners, affiliates, or relatives of the party
named in the engagement letter. Client shall hold Valbridge Property Advisors | Hulberg and
Associates and its employees harmless in the event of any lawsuit brought by any third party,

SAN MARTIN AIRPORT FBO
GENERAL ASSUMPTIONS & LIMITING CONDITIONS
© 2018 VALBRIDGE PROPERTY ADVISORS Page 81
lender, partner, or part-owner in any form of ownership or any other party as a result of this
assignment. The client also agrees that in case of lawsuit arising from or in any way involving
these appraisal services, client will hold Valbridge Property Advisors | Hulberg and Associates
harmless from and against any liability, loss, cost, or expense incurred or suffered by
Valbridge Property Advisors | Hulberg and Associates in such action, regardless of its
outcome.
36. The Valbridge Property Advisors office responsible for the preparation of this report is
independently owned and operated by Hulberg and Associates. Neither Valbridge Property
Advisors, Inc., nor any of its affiliates has been engaged to provide this report. Valbridge
Property Advisors, Inc. does not provide valuation services, and has taken no part in the
preparation of this report.
37. If any claim is filed against any of Valbridge Property Advisors, Inc., a Florida Corporation, its
affiliates, officers or employees, or the firm providing this report, in connection with, or in any
way arising out of, or relating to, this report, or the engagement of the firm providing this
report, then (1) under no circumstances shall such claimant be entitled to consequential,
special or other damages, except only for direct compensatory damages, and (2) the
maximum amount of such compensatory damages recoverable by such claimant shall be the
amount actually received by the firm engaged to provide this report.
38. This report and any associated work files may be subject to evaluation by Valbridge Property
Advisors, Inc., or its affiliates, for quality control purposes.
39. Acceptance and/or use of this appraisal report constitutes acceptance of the foregoing
general assumptions and limiting conditions.

SAN MARTIN AIRPORT FBO
CERTIFICATION
© 2018 VALBRIDGE PROPERTY ADVISORS Page 82
Certification – Yvonne J. Broszus, MAI
I certify that, to the best of my knowledge and belief:
1. The statements of fact contained in this report are true and correct.
2. The reported analyses, opinions, and conclusions are limited only by the reported assumptions
and limiting conditions and are my personal, impartial, and unbiased professional analyses,
opinions, and conclusions.
3. I have no present or prospective interest in the property that is the subject of this report and no
personal interest with respect to the parties involved.
4. The undersigned has not performed services, as an appraiser or in any other capacity, regarding
the property that is the subject of this report within the three-year period immediately preceding
acceptance of this assignment.
5. I have no bias with respect to the property that is the subject of this report or to the parties
involved with this assignment.
6. My engagement in this assignment was not contingent upon developing or reporting
predetermined results.
7. My compensation for completing this assignment is not contingent upon the development or
reporting of a predetermined value or direction in value that favors the cause of the client, the
amount of value opinion, the attainment of a stipulated result, or the occurrence of a subsequent
event directly related to the intended use of this appraisal.
8. My analyses, opinions and conclusions were developed, and this report has been prepared, in
conformity with the Uniform Standards of Professional Appraisal Practice.
9. Yvonne J. Broszus, MAI has personally inspected the subject property.
10. No one provided significant real property appraisal assistance to the person signing this
certification, unless otherwise noted.
11. The reported analyses, opinions and conclusions were developed, and this report has been
prepared, in conformity with the requirements of the Code of Professional Ethics and Standards of
Professional Appraisal Practice of the Appraisal Institute.
12. The use of this report is subject to the requirements of the Appraisal Institute relating to review
by its duly authorized representatives.
13. As of the date of this report, the undersigned has completed the continuing education program
for Designated Members of the Appraisal Institute.
Yvonne J. Broszus, MAI
Director
California Certified License #AG019587

SAN MARTIN AIRPORT FBO
ADDENDA
© 2018 VALBRIDGE PROPERTY ADVISORS Page 83
Addenda
Subject Photos
Glossary
Qualifications
Yvonne J. Broszus, MAI - Director
Information on Valbridge Property Advisors
Office Locations
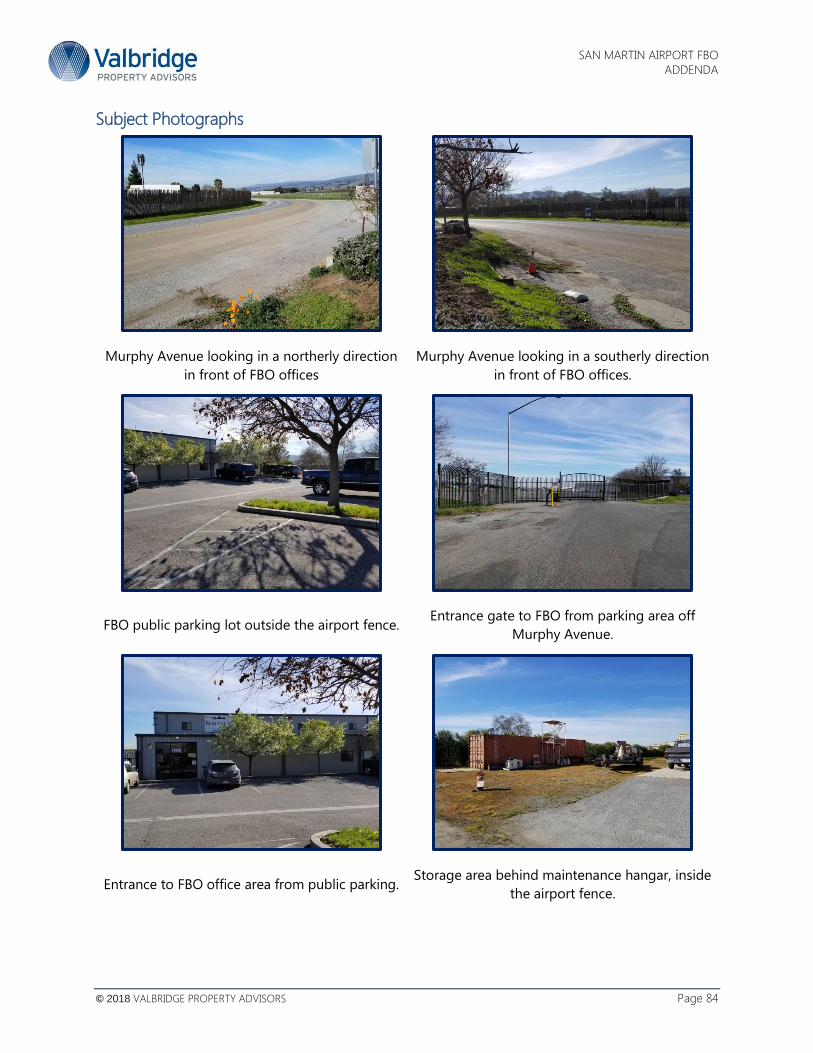
SAN MARTIN AIRPORT FBO
ADDENDA
© 2018 VALBRIDGE PROPERTY ADVISORS Page 84
Subject Photographs
Murphy Avenue looking in a northerly direction
in front of FBO offices
Murphy Avenue looking in a southerly direction
in front of FBO offices.
FBO public parking lot outside the airport fence. Entrance gate to FBO from parking area off
Murphy Avenue.
Entrance to FBO office area from public parking. Storage area behind maintenance hangar, inside
the airport fence.

SAN MARTIN AIRPORT FBO
ADDENDA
© 2018 VALBRIDGE PROPERTY ADVISORS Page 85
Glossary Definitions are taken from The Dictionary of Real Estate Appraisal, 6
th Edition (Dictionary), the Uniform Standards of
Professional Appraisal Practice (USPAP), and Building Owners and Managers Association International (BOMA).
Absolute Net Lease
A lease in which the tenant pays all expenses including
structural maintenance, building reserves, and
management; often a long-term lease to a credit tenant.
(Dictionary)
Amortization The process of retiring a debt or recovering a capital
investment, typically through scheduled, systematic
repayment of the principal; a program of periodic
contributions to a sinking fund or debt retirement fund.
(Dictionary)
As Is Market Value The estimate of the market value of real property in its
current physical condition, use, and zoning as of the
appraisal date. (Dictionary)
Base Rent The minimum rent stipulated in a lease. (Dictionary)
Base Year The year on which escalation clauses in a lease are
based. (Dictionary)
Building Common Area In office buildings, the areas of the building that provide
services to building tenants but which are not included
in the office area or store area of any specific tenant.
These areas may include, but shall not be limited to,
main and auxiliary lobbies, atrium spaces at the level of
the finished floor, concierge areas or security desks,
conference rooms, lounges or vending areas, food
service facilities, health or fitness centers, daycare
facilities, locker or shower facilities, mail rooms, fire
control rooms, fully enclosed courtyards outside the
exterior walls, and building core and service areas such
as fully enclosed mechanical or equipment rooms.
Specifically excluded from building common area are
floor common areas, parking space, portions of loading
docks outside the building line, and major vertical
penetrations. (BOMA)
Building Rentable Area The sum of all floor rentable areas. Floor rentable area is
the result of subtracting from the gross measured area
of a floor the major vertical penetrations on that same
floor. It is generally fixed for the life of the building and
is rarely affected by changes in corridor size or
configuration. (BOMA)
Certificate of Occupancy (COO) A formal written acknowledgment by an appropriate
unit of local government that a new construction or
renovation project is at the stage where it meets
applicable health and safety codes and is ready for
commercial or residential occupancy. (Dictionary)
Common Area Maintenance (CAM)
The expense of operating and maintaining common
areas; may or may not include management charges and
usually does not include capital expenditures on tenant
improvements or other improvements to the property.
(Dictionary)
The amount of money charged to tenants for their
shares of maintaining a [shopping] center’s common
area. The charge that a tenant pays for shared services
and facilities such as electricity, security, and
maintenance of parking lots. Items charged to common
area maintenance may include cleaning services, parking
lot sweeping and maintenance, snow removal, security
and upkeep. (ICSC – International Council of Shopping
Centers, 4th
Ed.)
Condominium A multiunit structure, or a unit within such a structure,
with a condominium form of ownership. (Dictionary)
Conservation Easement An interest in real estate restricting future land use to
preservation, conservation, wildlife habitat, or some
combination of those uses. A conservation easement
may permit farming, timber harvesting, or other uses of
a rural nature as well as some types of conservation-
oriented development to continue, subject to the
easement. (Dictionary)
Contributory Value
A type of value that reflects the amount a property or
component of a property contributes to the value of
another asset or to the property as a whole.
The change in the value of a property as a whole,
whether positive or negative, resulting from the addition
or deletion of a property component. Also called
deprival value in some countries. (Dictionary)

SAN MARTIN AIRPORT FBO
ADDENDA
© 2018 VALBRIDGE PROPERTY ADVISORS Page 86
Debt Coverage Ratio (DCR)
The ratio of net operating income to annual debt service
(DCR = NOI/Im), which measures the relative ability of a
property to meet its debt service out of net operating
income; also called debt service coverage ratio (DSCR). A
larger DCR typically indicates a greater ability for a
property to withstand a reduction of income, providing
an improved safety margin for a lender. (Dictionary)
Deed Restriction
A provision written into a deed that limits the use of
land. Deed restrictions usually remain in effect when title
passes to subsequent owners. (Dictionary)
Depreciation
1) In appraisal, a loss in property value from any cause;
the difference between the cost of an improvement
on the effective date of the appraisal and the
market value of the improvement on the same date.
2) In accounting, an allocation of the original cost of
an asset, amortizing the cost over the asset’s life;
calculated using a variety of standard techniques.
(Dictionary)
Disposition Value
The most probable price that a specified interest in
property should bring under the following conditions:
Consummation of a sale within a specified time,
which is shorter than the typical exposure time for
such a property in that market.
The property is subjected to market conditions
prevailing as of the date of valuation;
Both the buyer and seller are acting prudently and
knowledgeably;
The seller is under compulsion to sell;
The buyer is typically motivated;
Both parties are acting in what they consider to be
their best interests;
An adequate marketing effort will be made during
the exposure time;
Payment will be made in cash in U.S. dollars (or the
local currency) or in terms of financial arrangements
comparable thereto; and
The price represents the normal consideration for
the property sold, unaffected by special or creative
financing or sales concessions granted by anyone
associated with the sale. (Dictionary)
Easement The right to use another’s land for a stated purpose.
(Dictionary)
EIFS Exterior Insulation Finishing System. This is a type of
exterior wall cladding system. Sometimes referred to as
dry-vit.
Effective Date
1) The date on which the appraisal or review opinion
applies. (SVP)
2) In a lease document, the date upon which the lease
goes into effect. (Dictionary)
Effective Gross Income (EGI) The anticipated income from all operations of the real
estate after an allowance is made for vacancy and
collection losses and an addition is made for any other
income. (Dictionary)
Effective Rent Total base rent, or minimum rent stipulated in a lease,
over the specified lease term minus rent concessions;
the rent that is effectively paid by a tenant net of
financial concessions provided by a landlord. (TIs).
(Dictionary)
EPDM Ethylene Propylene Diene Monomer Rubber. A type of
synthetic rubber typically used for roof coverings.
(Dictionary)
Escalation Clause
A clause in an agreement that provides for the
adjustment of a price or rent based on some event or
index. e.g., a provision to increase rent if operating
expenses increase; also called escalator clause, expense
recovery clause or stop clause. (Dictionary)
Estoppel Certificate
A signed statement by a party (such as a tenant or a
mortgagee) certifying, for another’s benefit, that certain
facts are correct, such as that a lease exists, that there
are no defaults, and that rent is paid to a certain date.
(Black’s) In real estate, a buyer of rental property
typically requests estoppel certificates from existing
tenants. Sometimes referred to as an estoppel letter.
(Dictionary)
Excess Land Land that is not needed to serve or support the existing
use. The highest and best use of the excess land may or
may not be the same as the highest and best use of the
improved parcel. Excess land has the potential to be
sold separately and is valued separately. (Dictionary)
Excess Rent The amount by which contract rent exceeds market rent
at the time of the appraisal; created by a lease favorable
to the landlord (lessor) and may reflect unusual
management, unknowledgeable or unusually motivated
parties, a lease execution in an earlier, stronger rental
market, or an agreement of the parties. (Dictionary)

SAN MARTIN AIRPORT FBO
ADDENDA
© 2018 VALBRIDGE PROPERTY ADVISORS Page 87
Expense Stop
A clause in a lease that limits the landlord’s expense
obligation, which results in the lessee paying operating
expenses above a stated level or amount. (Dictionary)
Exposure Time
1) The time a property remains on the market.
2) The estimated length of time that the property
interest being appraised would have been offered
on the market prior to the hypothetical
consummation of a sale at market value on the
effective date of the appraisal; Comment: Exposure
time is a retrospective opinion based on an analysis
of past events assuming a competitive and open
market. (Dictionary)
Extraordinary Assumption
An assumption, directly related to a specific assignment,
as of the effective date of the assignment results, which,
if found to be false, could alter the appraiser’s opinions
or conclusions. Comment: Extraordinary assumptions
presume as fact otherwise uncertain information about
physical, legal, or economic characteristics of the subject
property; or about conditions external to the property
such as market conditions or trends; or about the
integrity of data used in an analysis. (USPAP, 2016-2017
ed.)
Fee Simple Estate
Absolute ownership unencumbered by any other
interest or estate, subject only to the limitations
imposed by the governmental powers of taxation,
eminent domain, police power, and escheat. (Dictionary)
Floor Common Area In an office building, the areas on a floor such as
washrooms, janitorial closets, electrical rooms,
telephone rooms, mechanical rooms, elevator lobbies,
and public corridors which are available primarily for the
use of tenants on that floor. (BOMA)
Full Service (Gross) Lease
A lease in which the landlord receives stipulated rent
and is obligated to pay all of the property’s operating
and fixed expenses; also called a full service lease.
(Dictionary)
Furniture, Fixtures, and Equipment (FF&E) Business trade fixtures and personal property, exclusive
of inventory. (Dictionary)
Going-Concern Value
An outdated label for the market value of all the
tangible and intangible assets of an established and
operating business with an indefinite life, as if sold in
aggregate; more accurately termed the market value of
the going concern or market value of the total assets of
the business. (Dictionary)
Gross Building Area (GBA) 1) Total floor area of a building, excluding unenclosed
areas, measured from the exterior of the walls of
the above-grade area. This includes mezzanines and
basements if and when typically included in the
market area of the type of property involved.
2) Gross leasable area plus all common areas.
3) For residential space, the total area of all floor levels
measured from the exterior of the walls and
including the superstructure and substructure
basement; typically does not include garage space.
(Dictionary)
Gross Measured Area The total area of a building enclosed by the dominant
portion (the portion of the inside finished surface of the
permanent outer building wall which is 50 percent or
more of the vertical floor-to-ceiling dimension, at the
given point being measured as one moves horizontally
along the wall), excluding parking areas and loading
docks (or portions of same) outside the building line. It
is generally not used for leasing purposes and is
calculated on a floor by floor basis. (BOMA)
Gross Up Method
A method of calculating variable operating expenses in
income-producing properties when less than 100%
occupancy is assumed. Expenses reimbursed based on
the amount of occupied space, rather than on the total
building area, are described as “grossed up.” (Dictionary)
Gross Retail Sellout The sum of the separate and distinct market value
opinions for each of the units in a condominium,
subdivision development, or portfolio of properties, as
of the date of valuation. The aggregate of retail values
does not represent the value of all the units as though
sold together in a single transaction; it is simply the total
of the individual market value conclusions. Also called
the aggregate of the retail values, aggregate retail selling
price or sum of the retail values.. (Dictionary)
Ground Lease
A lease that grants the right to use and occupy land.
Improvements made by the ground lessee typically
revert to the ground lessor at the end of the lease term.
(Dictionary)
Ground Rent The rent paid for the right to use and occupy land
according to the terms of a ground lease; the portion of
the total rent allocated to the underlying land.
(Dictionary)

SAN MARTIN AIRPORT FBO
ADDENDA
© 2018 VALBRIDGE PROPERTY ADVISORS Page 88
HVAC Heating, ventilation, air conditioning (HVAC) system. A
unit that regulates the temperature and distribution of
heat and fresh air throughout a building. (Dictionary)
Highest and Best Use
1) The reasonably probable use of property that
results in the highest value. The four criteria that the
highest and best use must meet are legal
permissibility, physical possibility, financial
feasibility, and maximum productivity.
2) The use of an asset that maximizes its potential and
that is possible, legally permissible, and financially
feasible. The highest and best use may be for
continuation of an asset’s existing use of for some
alternative use. This is determined by the use that a
market participant would have in mind for the asset
when formulating the price that it would be willing
to bid. (IVS)
3) [The] highest and most profitable use for which the
property is adaptable and needed or likely to be
needed in the reasonably near future. (Uniform
Appraisal Standards for Federal Land Acquisitions)
(Dictionary)
Hypothetical Condition
1) A condition that is presumed to be true when it is
known to be false. (SVP – Standards of Valuation
Practice, effective January 1, 2015)
2) A condition, directly related to a specific
assignment, which is contrary to what is known by
the appraiser to exist on the effective date of the
assignment results, but is used for the purpose of
analysis. Comment: Hypothetical conditions are
contrary to known facts about physical, legal, or
economic characteristics of the subject property; or
about conditions external to the property, such as
market conditions or trends; or about the integrity
of data used in an analysis. (USPAP, 2016-2017 ed.)
(Dictionary)
Industrial Gross Lease
A type of modified gross lease of an industrial property
in which the landlord and tenant share expenses. The
landlord receives stipulated rent and is obligated to pay
certain operating expenses, often structural
maintenance, insurance and real property taxes, as
specified in the lease. There are significant regional and
local differences in the use of this term. (Dictionary)
Insurable Value
A type of value for insurance purposes. (Typically this
includes replacement cost less basement excavation,
foundation, underground piping and architect’s fees).
(Dictionary)
Investment Value
The value of a property to a particular investor or class
of investors based on the investor’s specific
requirements. Investment value may be different from
market value because it depends on a set of investment
criteria that are not necessarily typical of the market.
(Dictionary)
Just Compensation
In condemnation, the amount of loss for which a
property owner is compensated when his or her
property is taken. Just compensation should put the
owner in as good a position pecuniarily as he or she
would have been if the property had not been taken.
(Dictionary)
Leased Fee Interest The ownership interest held by the lessor, which
includes the right to receive the contract rent specified
in the lease plus the reversionary right when the lease
expires. (Dictionary)
Leasehold Interest The right held by the lessee to use and occupy real
estate for a stated term and under the conditions
specified in the lease. (Dictionary)
Lessee (Tenant) One who has the right to occupancy and use of the
property of another for a period of time according to a
lease agreement. (Dictionary)
Lessor (Landlord) One who conveys the rights of occupancy and use to
others under a lease agreement. (Dictionary)
Liquidation Value
The most probable price that a specified interest in
property should bring under the following conditions:
Consummation of a sale within a short time period.
The property is subjected to market conditions
prevailing as of the date of valuation.
Both the buyer and seller are acting prudently and
knowledgeably.
The seller is under extreme compulsion to sell.
The buyer is typically motivated.
Both parties are acting in what they consider to be
their best interests.
A normal marketing effort is not possible due to the
brief exposure time.
Payment will be made in cash in U.S. dollars (or the
local currency) or in terms of financial arrangements
comparable thereto.
The price represents the normal consideration for
the property sold, unaffected by special or creative

SAN MARTIN AIRPORT FBO
ADDENDA
© 2018 VALBRIDGE PROPERTY ADVISORS Page 89
financing or sales concessions granted by anyone
associated with the sale. (Dictionary)
Loan to Value Ratio (LTV) The ratio between a mortgage loan and the value of the
property pledged as security, usually expressed as a
percentage. (Dictionary)
Major Vertical Penetrations Stairs, elevator shafts, flues, pipe shafts, vertical ducts,
and the like, and their enclosing walls. Atria, lightwells
and similar penetrations above the finished floor are
included in this definition. Not included, however, are
vertical penetrations built for the private use of a tenant
occupying office areas on more than one floor.
Structural columns, openings for vertical electric cable or
telephone distribution, and openings for plumbing lines
are not considered to be major vertical penetrations.
(BOMA)
Market Rent The most probable rent that a property should bring in a
competitive and open market reflecting the conditions
and restrictions of a specified lease agreement,
including the rental adjustment and revaluation,
permitted uses, use restrictions, expense obligations;
term, concessions, renewal and purchase options and
tenant improvements (TIs). (Dictionary)
Market Value
The most probable price that a property should bring in
a competitive and open market under all conditions
requisite to a fair sale, the buyer and seller each acting
prudently and knowledgeably, and assuming the price is
not affected by undue stimulus. Implicit in this definition
is the consummation of a sale as of a specified date and
the passing of title from seller to buyer under conditions
whereby:
Buyer and seller are typically motivated;
Both parties are well informed or well advised, and
acting in what they consider their own best
interests;
A reasonable time is allowed for exposure in the
open market;
Payment is made in terms of cash in United States
dollars or in terms of financial arrangements
comparable thereto; and
The price represents the normal consideration for
the property sold unaffected by special or creative
financing or sales concessions granted by anyone
associated with the sale.
(Dictionary)
Marketing Time
An opinion of the amount of time it might take to sell a
real or personal property interest at the concluded
market value level during the period immediately after
the effective date of an appraisal. Marketing time differs
from exposure time, which is always presumed to
precede the effective date of an appraisal. (Advisory
Opinion 7 of the Appraisal Standards Board of the
Appraisal Foundation and Statement on Appraisal
Standards No. 6, “Reasonable Exposure Time in Real
Property and Personal Property Market Value Opinions”
address the determination of reasonable exposure and
marketing time.) (Dictionary)
Master Lease
A lease in which the fee owner leases a part or the entire
property to a single entity (the master lease) in return
for a stipulated rent. The master lessee then leases the
property to multiple tenants. (Dictionary)
Modified Gross Lease
A lease in which the landlord receives stipulated rent
and is obligated to pay some, but not all, of the
property’s operating and fixed expenses. Since
assignment of expenses varies among modified gross
leases, expense responsibility must always be specified.
In some markets, a modified gross lease may be called a
double net lease, net net lease, partial net lease, or semi-
gross lease. (Dictionary)
Operating Expense Ratio The ratio of total operating expenses to effective gross
income (TOE/EGI); the complement of the net income
ratio, i.e., OER = 1 – NIR (Dictionary)
Option
A legal contract, typically purchased for a stated
consideration, that permits but does not require the
holder of the option (known as the optionee) to buy, sell,
or lease real estate for a stipulated period of time in
accordance with specified terms; a unilateral right to
exercise a privilege. (Dictionary)
Partial Interest Divided or undivided rights in real estate that represent
less than the whole, i.e., a fractional interest such as a
tenancy in common, easement, or life interest.
(Dictionary)
Pass Through
A tenant’s portion of operating expenses that may be
composed of common area maintenance (CAM), real
property taxes, property insurance, and any other
expenses determined in the lease agreement to be paid
by the tenant. (Dictionary)
Potential Gross Income (PGI) The total income attributable to property at full
occupancy before vacancy and operating expenses are
deducted. (Dictionary)

SAN MARTIN AIRPORT FBO
ADDENDA
© 2018 VALBRIDGE PROPERTY ADVISORS Page 90
Prospective Future Value Upon Completion A prospective market value may be appropriate for the
valuation of a property interest related to a credit
decision for a proposed development or renovation
project. According to USPAP, an appraisal with a
prospective market value reflects an effective date that
is subsequent to the date of the appraisal report. … The
prospective market value –as completed- reflects the
property’s market value as of the time that development
is expected to be complete. (Dictionary)
Prospective Future Value Upon Stabilization A prospective market value may be appropriate for the
valuation of a property interest related to a credit
decision for a proposed development or renovation
project. According to USPAP, an appraisal with a
prospective market value reflects an effective date that
is subsequent to the date of the appraisal report …The
prospective market value – as stabilized – reflects the
property’s market value as of the time the property is
projected to achieve stabilized occupancy. For an
income-producing property, stabilized occupancy is the
occupancy level that a property is expected to achieve
after the property is exposed to the market for lease
over a reasonable period of time and at comparable
terms and conditions to other similar properties.
(Dictionary)
Replacement Cost The estimated cost to construct, at current prices as of a
specific date, a substitute for a building or other
improvements, using modern materials and current
standards, design, and layout. (Dictionary)
Reproduction Cost The estimated cost to construct, at current prices as of
the effective date of the appraisal, an exact duplicate or
replica of the building being appraised, using the same
materials, construction standards, design, layout, and
quality of workmanship and embodying all of the
deficiencies, superadequacies, and obsolescence of the
subject building. (Dictionary)
Retrospective Value Opinion A value opinion effective as of a specified historical date.
The term retrospective does not define a type of value.
Instead, it identifies a value opinion as being effective at
some specific prior date. Value as of a historical date is
frequently sought in connection with property tax
appeals, damage models, lease renegotiation, deficiency
judgments, estate tax, and condemnation. Inclusion of
the type of value with this term is appropriate, e.g.,
“retrospective market value opinion.” (Dictionary)
Sandwich Leasehold Estate
The interest held by the sandwich leaseholder when the
property is subleased to another party; a type of
leasehold estate. (Dictionary)
Sublease
An agreement in which the lessee in a prior lease
conveys the right of use and occupancy of a property to
another, the sublessee, for a specific period of time,
which may or may not be coterminous with the
underlying lease term. (Dictionary)
Subordination
A contractual arrangement in which a party with a claim
to certain assets agrees to make his or her claim junior,
or subordinate, to the claims of another party.
(Dictionary)
Surplus Land
Land that is not currently needed to support the existing
use but cannot be separated from the property and sold
off for another use. Surplus land does not have an
independent highest and best use and may or may not
contribute value to the improved parcel. (Dictionary)
Triple Net (Net Net Net) Lease
An alternative term for a type of net lease. In some
markets, a net net net lease is defined as a lease in
which the tenant assumes all expenses (fixed and
variable) of operating a property except that the
landlord is responsible for structural maintenance,
building reserves, and management; also called NNN
lease, net net net lease, or fully net lease. (Dictionary)
(The market definition of a triple net lease varies; in
some cases tenants pay for items such as roof repairs,
parking lot repairs, and other similar items.)
Usable Area The measured area of an office area, store area, or
building common area on a floor. The total of all the
usable areas for a floor shall equal floor usable area of
that same floor. (BOMA)
Value-in-Use
The value of a property assuming a specific use, which
may or may not be the property’s highest and best use
on the effective date of the appraisal. Value in use may
or may not be equal to market value but is different
conceptually. (Dictionary)

SAN MARTIN AIRPORT FBO
ADDENDA
© 2018 VALBRIDGE PROPERTY ADVISORS Page 91
Qualifications

SAN MARTIN AIRPORT FBO
ADDENDA
© 2018 VALBRIDGE PROPERTY ADVISORS Page 92
Qualifications of Yvonne J. Broszus, MAI
Director Valbridge Property Advisors | Northern California
Independent Valuations for a Variable World
State Certifications
Certified General
State of California
Membership/Affiliations
Member: Appraisal Institute MAI Designation
Chairman: AI Fall Conference Committee (2006)
AI Spring Litigation Conference (2017)
Committee Member: AI Spring Litigation Conference (2014-current)
AI Silicon Valley Subchapter (2006-07)
AI Fall Conference (2004, 2005)
Award: AI Claudia B. Carleton Leadership Award
Appraisal Institute & Related Courses
Continuing education courses taken through the Appraisal Institute
and other real estate organizations.
Experience
Director
Valbridge Property Advisors | Northern California (2013-Present)
Vice President
Hulberg & Associates, Inc. (1988-2013)
(joined to create Valbridge in 2013)
Appraisal/valuation and consulting assignments include: retail
buildings (community, specialty, neighborhood and strip), office
buildings (professional and medical/dental), vacant and agricultural
land, warehouses, manufacturing, light industrial, research and
development, apartments, single-family, condominiums, subdivisions,
mobile home parks, auto dealerships, service stations, worship
facilities, truck stops, food processing and cold storage facilities, fixed
base operators at airports, and other special purpose properties.
Ms. Broszus has provided valuation services in a wide variety of
complex civil litigation cases involving real estate. These matters have
included condemnation issues, contract disputes, bankruptcy/creditors
matters, and environmental lawsuits, among other issues. She also
specializes in property tax appeals, having helped clients recover
millions of dollars in property tax refunds.
Qualified as an expert witness, Ms. Broszus has testified in state and
federal courts, major arbitrations, and at Assessment Appeal Board
hearings. She is a highly experienced forensic appraiser.
Education
Bachelor of Science,
Marketing
Santa Clara University
Contact Details
408-279-1520 ext. 7135 (p)
408-279-3428 (f)
Valbridge Property Advisors |
Northern California
55 South Market, Suite 1210
San Jose, CA 95113
www.valbridge.com

SAN MARTIN AIRPORT FBO
ADDENDA
© 2018 VALBRIDGE PROPERTY ADVISORS Page 93
Valbridge Property Advisors Information / Office Locations

SAN MARTIN AIRPORT FBO
ADDENDA
© 2018 VALBRIDGE PROPERTY ADVISORS Page 94