REAL ESTATE APPRAISAL OF AIRPORT PARCELS LOCATED AT … · 2020-02-13 · real estate appraisal ....
114
REAL ESTATE APPRAISAL OF AIRPORT PARCELS LOCATED AT CHARLOTTE COUNTY AIRPORT PUNTA GORDA, CHARLOTTE COUNTY, FLORIDA for JAMES W. PARISH, P.E. CEO PUNTA GORDA AIRPORT CHARLOTTE COUNTY AIRPORT AUTHORITY 28000 A-1 AIRPORT ROAD PUNTA GORDA, FL 33982 by C. MICHAEL POLK & ASSOCIATES, INC. P.O. BOX 510215 PUNTA GORDA, FLORIDA 33951
Transcript of REAL ESTATE APPRAISAL OF AIRPORT PARCELS LOCATED AT … · 2020-02-13 · real estate appraisal ....

REAL ESTATE APPRAISAL OF
AIRPORT PARCELS LOCATED AT
CHARLOTTE COUNTY AIRPORT PUNTA GORDA, CHARLOTTE COUNTY, FLORIDA
for
JAMES W. PARISH, P.E. CEO PUNTA GORDA AIRPORT
CHARLOTTE COUNTY AIRPORT AUTHORITY 28000 A-1 AIRPORT ROAD PUNTA GORDA, FL 33982
by
C. MICHAEL POLK & ASSOCIATES, INC. P.O. BOX 510215
PUNTA GORDA, FLORIDA 33951


TABLE OF CONTENTS Summary of Appraisal .........................................................................................................1 Purpose of the Appraisal ......................................................................................................4 Legal Description .................................................................................................................4 Scope of Work .....................................................................................................................4 Owner of Record ..................................................................................................................6 Sales History ........................................................................................................................6 Zoning ..................................................................................................................................6 Marketing Time ...................................................................................................................7 Reasonable Time Exposure..................................................................................................7 Subject Pictures ....................................................................................................................8 Charlotte County Analysis .................................................................................................14 Description of the Market Area .........................................................................................27 Neighborhood Map ............................................................................................................42 Description of the Site .......................................................................................................43 Site Plan .............................................................................................................................44 Aerial View ........................................................................................................................45 Highest and Best Use .........................................................................................................46 Valuation of 1-5 Acre Parcels with and without Airport Access.......................................47 Method of Appraisal ..........................................................................................................48 Sales Comparison Approach to Value ...............................................................................49 Land Sale #1 ......................................................................................................................50 Land Sale #2 ......................................................................................................................52

TABLE OF CONTENTS (Cont'd)
Land Sale #3 ......................................................................................................................54 Land Sale #4 ......................................................................................................................56 Land Sale #5 ......................................................................................................................58 Land Sale #6 ......................................................................................................................60 Land Sale #7 ......................................................................................................................62 Land Sale #8 ......................................................................................................................64 Land Sale #9 ......................................................................................................................66 Land Sales Map..................................................................................................................68 Land Sales Adjustment Grid ..............................................................................................70 Land Sales Analysis ...........................................................................................................71 Valuation of 6-10 Acre Parcels with and without Airport Access.....................................74 Method of Appraisal ..........................................................................................................75 Sales Comparison Approach to Value ...............................................................................76 Land Sale #1 ......................................................................................................................77 Land Sale #2 ......................................................................................................................79 Land Sale #3 ......................................................................................................................81 Land Sale #4 ......................................................................................................................83 Land Sale #5 ......................................................................................................................85 Land Sale #6 ......................................................................................................................87 Land Sale #7 ......................................................................................................................89 Land Sales Map..................................................................................................................91 Land Sales Adjustment Grid ..............................................................................................92

TABLE OF CONTENTS (Cont'd) Land Sales Analysis ...........................................................................................................93 Certificate of Value ............................................................................................................97 Assumptions and Limiting Conditions ..............................................................................99 Qualifications of Appraiser ..............................................................................................101
Engagement Letter ...........................................................................................................105 Addendum

1
SUMMARY OF APPRAISAL Location: Various Airport Parcels ranging from 1 to 10 acres.
Located at the Charlotte County Airport, Punta Gorda, FL 33982.
Type of Property: The subject properties consist of vacant industrial
ECAP zoned parcels located in Punta Gorda, Charlotte County, Florida.
Site: Various parcels 1 to 10 acres Zoning: ECAP, Enterprise Charlotte Airport Park, Charlotte
County. Flood Zone Information: The subject lies in Flood Zone X, A and AE which
are areas with base flood elevations determined. Flood Map 12015C0261F, dated May 5, 2003.
Highest and Best Use: As If Vacant: Industrial Date of Investigation: January 15 – February 9, 2019 Date of Valuation: February 9, 2019 Interest Appraised: Fee Simple

2
SUMMARY OF APPRAISAL (Cont’d) VALUE INDICATIONS: The following table displays the values on a per S.F. basis of the land owned by the Charlotte County Airport Authority with and without access to the runway.
Location Size Estimate Value per S.F.
Airport Access 1.00 Acre $2.50 Non- Access 1.00 Acre $1.90
Airport Access 2.00 Acre $2.50 Non- Access 2.00 Acre $1.90
Airport Access 3.00 Acre $2.50 Non- Access 3.00 Acre $1.90
Airport Access 4.00 Acre $2.25 Non- Access 4.00 Acre $1.70
Airport Access 5.00 Acre $2.25 Non- Access 5.00 Acre $1.70
Airport Access 6.00 Acre $2.25 Non- Access 6.00 Acre $1.70
Airport Access 7.00 Acre $2.25 Non- Access 7.00 Acre $1.70
Airport Access 8.00 Acre $2.00 Non- Access 8.00 Acre $1.50
Airport Access 9.00 Acre $2.00 Non- Access 9.00 Acre $1.50
Airport Access 10.00 Acre $2.00 Non- Access 10.00 Acre $1.50

3
DEFINITION OF IMPORTANT TERMS
Market Value The most probable price which a property should bring in a competitive and open market under all conditions requisite to a fair sale, the buyer and seller, each acting prudently, knowledgeably and assuming the price is not affected by undue stimulus. Implicit in this definition is the consummation of a sale as of a specified date and the passing of title from seller to buyer under conditions whereby: a. buyer and seller are typically motivated; b. both parties are well informed or well advised, and each acting in what they consider
their own best interest; c. a reasonable time is allowed for exposure in the open market; d. payment is made in terms of cash in U.S. dollars or in terms of financial arrangements
comparable thereto; and e. the price represents the normal consideration for the property sold unaffected by special
or creative financing or sales concessions granted by anyone associated with the sale.1 Fee Simple Absolute ownership unencumbered by any other interest or estate, subject only to the limitations imposed by the governmental powers of taxation, eminent domain, police power, and escheat.2 Extraordinary Assumption – An assumption, directly related to a specific assignment, as of the effective date of the assignment results, which, if found to be false, could alter the appraiser’s opinions or conclusions. Hypothetical Condition
1. A condition that is presumed to be true when it is known to be false. (SVP) 2. A condition, directly related to a specific assignment, which is contrary to what is known
by the appraiser to exist on the effective date of the assignment results, buts is used for the purpose of analysis.
1 Federal National Mortgage Association (F.N.M.A.) and OCC CFR 34.42-f 2 Appraisal Institute, The Dictionary of Real Estate Appraisal, (Sixth Edition, 2015)

4
INTRODUCTION Identification of Subject Various Airport Parcels ranging from 1 to 10 acres. Located at the Charlotte County Airport, Punta Gorda, FL 33982 Legal Description The appraisal is not of a specific parcel or parcels, but a general valuation of a typical site at the Charlotte County Airport Authority with and without access to the runway. Purpose and Date of Appraisal The purpose of this appraisal was to estimate the Market Value of the subject properties as of the date of inspection February 9, 2019. It is our understanding that this report will be used to determine the market value of the respective sites of the Charlotte County Airport Authority and the values will ultimately be utilized to determine the land lease rates of the aforementioned parcels. Function of Appraisal/Intended Users/Use Restrictions This report is solely for the officers of the Charlotte County Airport Authority. It is our understanding that this report will be used to determine the market value of the respective sites of the Charlotte County Airport Authority and the estimated values will ultimately be utilized to determine the land lease rates of the aforementioned parcels. Any other person relying on this report is instructed to obtain a release from the aforementioned client and C. Michael Polk & Associates, Inc. before relying on this report. Scope of Work The scope of the appraisal involved inspection of the subject neighborhood, the subject property and comparable market data. We developed a highest and best use estimate by analyzing the physical, legal, and economic factors impacting the subject property. Particular attention was given to the trend of industrial development in the Charlotte County and Southwest Florida market area. Ultimately, we developed value indications for the subject property and reconciled them to a final value conclusion. The appraiser researched and verified data utilizing interviews with market participants, such as buyers, sellers, real estate brokers, appraisers, etc. The appraisers utilized the following data sources in preparation of the appraisal: LoopNet, CoStar, Charlotte County MLS, Suite Life, as well as Investor Surveys by PwC, Integra and the University of Florida. The following is a brief description of the scope of the work performed in developing the subject appraisal. In this appraisal assignment, we visually inspected the subject site and surrounding land areas in order to gather information about the physical and locational characteristics of the subject site that is relevant to the valuation problem. We researched data on comparable land sales and confirmed all comparables sales and listing information and analyzed the information gathered in applying the sales comparison approach. We did not apply the cost or income approaches because they were not considered applicable to arrive at credible results. The subject property of this appraisal is various vacant parcels of land located at the Charlotte County Airport; therefore we applied only the sales comparison approach

5
INTRODUCTION (Cont’d) to value. This approach is considered necessary for credible results given the intended use, property characteristics and type of value sought. This Appraisal Report:
(i) states the identity of the client, unless the client has specially stated otherwise; states the identity of any intended users by name or type;
(i) states the intended use of the appraisal;
(ii) summarizes information sufficient to identify the real estate involved in the appraisal, including the physical and economic property characteristics relevant to the assignment;
(iii) states the real property interest appraised;
(iv) states the type and definition of value and cite the source of the definition;
(v) states the effective date of the appraisal and the date of the report;
(vi) summarizes the scope of the work used to develop the appraisals;
(vii) summarizes the information analyzed, the appraisal methods and techniques
employed, and the reasoning that supports the analyses, opinions, and conclusions; exclusion of the sales comparison approach, cost approach or income approach, must be explained;
(viii) states the use of the real estate existing, as of the date of value and the use of the real
estate reflected in the appraisal; and when an opinion of highest and best use was developed by the appraiser, summarizes the support and rationale for that opinion;
(ix) states clearly and conspicuously:
a. state all extraordinary assumptions and hypothetical conditions ;and
b. state that their use might have an effected the assignments results; and includes a
(xi) signed certification in accordance with Standards Rule 2-3.
Property Rights Appraised The fee simple interest in the subject property has been appraised. Only real estate was included, no personal property was included in the valuation.

6
INTRODUCTION (Cont’d) Ownership of Record Charlotte County Airport Authority 28000 A-1 Airport Road Punta Gorda, FL 33982 History of Subject There have been no arms-length/bona fide transactions involving the parcels over the last five years. The appraiser is not aware of any other agreement of sale, options or listings that are current as of the effective date of this appraisal. The property history was provided by a review of the county tax and deed records. We did not perform a title search, and therefore, do not warrant the history as presented herein. Consequently, anyone contemplating an interest in the property should rely solely upon a title search or legal opinion. Zoning and Land Use The zoning was confirmed as Enterprise Charlotte Airport Park, and has a Future Land Use designation of Airport Commerce Park. The intent of the Enterprise Charlotte Airport Park is to create a mixed use zoning district which enhances and promotes economic development within its boundaries as well as within the county, and which provides for quality and consistency in design and development while still maintaining flexibility in design and development standards. The permitted use categories include commercial/retail, industrial, distribution, office/governmental/institutional, aviation and related industries and agriculture. The overlay district consists of a lengthy and comprehensive document governing the uses, setback and buffering requirements and architectural standards. The document is too lengthy to include as part of this report, however; a complete copy of the Enterprise Charlotte Airport Park Overlay District and the description of the Future Land Use designation of Airport Commerce Park can be found on the web at the following address; www.charlottecountyfl.com/CDEV/PlanningZoning/AirportOverlay/. Any reader of this report is recommended to review the document before purchasing or lending on property located within this district. The overlay district does have specific buffering and architectural requirements, however; the developer of the park has indicated that they have been exempted from some of the requirements as the result of the settlement of a lawsuit. The park will have buffers around the park itself, but not on the individual sites, and the architectural requirements will be only for the elevations facing Challenger Boulevard. Thus, after reviewing the development standards of Enterprise Charlotte Airport Park zoning and conferring with a representative of the zoning department the analyst ascertained that subject parcel is a buildable site.

7
INTRODUCTION (Cont’d) Marketing Time Estimate Based on conversations with local real estate brokers, and investors of similar type properties, marketing periods for vacant commercial property, similar to the subject of this report, are typically six to twelve months. The land sales comparables utilized were all on the market for at least six months prior to their sale. Given the fairly recent sales of the comparable land sales in the subject’s market area, and the discussions with real estate brokers and investors of similar properties, the analysts are projecting a marketing period of approximately six to twelve months for the subject property. Reasonable Exposure Time Per the Appraisal Standards Board statement on Appraisal Standard Number 6, exposure time may be defined as the estimated length of time of the property interest being appraised would have been offered on the market prior to the hypothetical consummation of a sale at market value on the effective date of the appraisal; a retrospective estimate based on an analysis of past events assuming a competitive open market. Thus, reasonable exposure time is not synonymous with a marketing time estimate as it is assumed to have occurred prior to the date of valuation. Inherent in the market value estimate is not that it will sell within the estimated marketing time, but that it would have sold assuming prudent marketing within some reasonable exposure time prior to the date of valuation. In this instance, we have concluded that the reasonable exposure time occurring prior to the date of valuation that would have resulted in a consummation of a sale at the market value estimate would have been approximately 1 year.

8
CHENEY WAY

9
VIEWS OF VARIOUS AIRPORT PARCELS

10
MORE VIEWS OF VARIOUS AIRPORT PARCELS

11
MORE VIEWS OF VARIOUS AIRPORT PARCELS

12
MORE VIEWS OF VARIOUS AIRPORT PARCELS

13
MORE VIEWS OF VARIOUS AIRPORT PARCELS

14
CHARLOTTE COUNTY ANALYSIS
Introduction: In this portion of the appraisal report, the appraiser will provide the reader with an economic overview of Charlotte County and the Southwest Florida region. Information which shall be presented herein has been obtained primarily from the April, 2018 Annual Economic Yearbook edition published by FLORIDA TREND MAGAZINE. In an effort to reduce the printed text pertaining to this topic matter, the appraiser will focus on the more significant economic issues and trends identified in the afore-referenced source as well as specifics for the highlighted county. Other references are footnoted on the specific page. The following economic overview and analysis is presented. Population Totals: The most significant economic statistics relating to a metropolitan statistical area is population totals. Population totals relate to urban densities and the critical mass of an economic area. Furthermore, population growth starts a chain reaction, which results in housing starts and job growth. New jobs, which are most frequently triggered by population growth include construction, real estate, business and personal services, and retail wholesale trade. The following table is presented as a summary of the population totals relating to each of the sixteen counties within the southwest region along with the regional totals:
Population Totals
COUNTY 2018 Growth from 2013-2017
Charlotte 180,830 9.7% Citrus 147,995 6.5% Collier 380,472 12.1% Desoto 36,456 5.1% Glades 14,128 7.9% Hardee 28,198 3.1% Hendry 40,612 7.6% Hernando 188,108 8.1% Highlands 105,125 7.5% Hillsboro 1,420,000 9.6% Lee 738,964 11.8% Manatee 384,140 12.2% Pasco 524,664 10.3% Pinellas 965,245 3.8% Polk 672,133 7.9% Sarasota 419,158 7.4%
Florida 21,162,207 9.79%
Charlotte County, has a reported population of 180,830 for the start of 2018 which represents an increase of 9.7% vs 2013. Charlotte County is the tenth most populated county of the Southwest Region's sixteen counties. According to Florida Trends 2018 Economic yearbook the population for the State of Florida is 21,162,207 at the start of 2018 which indicates an increase of 2.0% compared to the state’s population of 20,731,650 in 2017. Projected increase 2018-2022 is 5.99% for the State of Florida.

15
CHARLOTTE COUNTY AREA ANALYSIS (Cont’d) Florida’s population has grown by nearly 430,000 people since last year. That’s a gain of more than 1,178 people each day. The growth isn’t occurring evenly though. The smallest five counties which are Liberty, Lafayette, Franklin, Glades and Hamilton counties have 58,295 residents, down 68 people from last year. Yet, the largest five counties which are Miami-Dade, Broward, Palm Beach, Hillsborough and Orange Counties have 9,037,748 residents, a gain of almost 177,295 people over the same 12 months. According to an article in the USA Today Dated May 25, 2017 by Mary Bowerman, “The Census Bureau shows the fasted-growing cities in the U.S. Cities in the South are growing at a faster rate than any other region in the United States, Amel Toukabri, a demographer in the Census Bureau’s population division said in a statement. “Since the 2010 Census, the population in large southern cities grew by an average of 9.4%,” Toukabri said. According to the U.S. Census, while small towns declined by .5% in the Northeast and by .3% in the Midwest, small towns grew by .2% in the South and .8% in the West. Bonita Springs was listed as #8 and Fort Myers as #15. By 2030 Florida’s population is forecast to grow by over 26 million residents. Historically Florida has grown 300,000 residents per year on average for the last 59 years. This has huge implications for water, roads, schools, universities, jobs, health care and just about everything else. Population By-Age Group: One of the more important demographic characteristics relating to population totals relates to the various age groups. The following table is presented as a summary of the regional population by-age group for the year 2018:
Population By-Age Group
State
0-14
15-19
20-39
40-64
65+
Florida
15.92%
5.48%
24.59%
31.93%
22.09%
As indicated above, the 40-64 age group accounts for the largest component to the state of Florida’s population. This age group was followed by the 20-39 age brackets accounting for 24.59% of the 2018 total population. The median age for the state of Florida is 42.2 years. In regards to Charlotte County, the median age is 59.6 years. Over the next two decades, Florida’s older population (age 60 and older) will account for most of Florida’s growth, representing 55.1% of the gains. The population increases, which have been observed in the Southwest Florida region, are typically a result of the migration of well-to-do retirees from the Northeast and Midwest states, who settle primarily in Naples and Sarasota. The less well-to-do retirees are attracted to the more affordable, moderate real estate prices in Charlotte and Lee Counties.

16
CHARLOTTE COUNTY AREA ANALYSIS (Cont’d) Per-Capita Personal Income: Per-capita personal income is an important economic indicator for our market area because it demonstrates economic purchasing power of a particular market. The following table is presented as a summary of the economic data relating to per-capita personal income for Charlotte County and the Southwest Florida region per The Florida Trend Economic Yearbook dated April 2018:
Per Capita Personal Income
COUNTY
Per Capita Income 2017
Charlotte
$41,239
Citrus
$38,511
Collier
$85,421
Desoto
$24,921
Glades
$22,246
Hardee
$26,472
Hendry
$29,535
Hernando
$36,335
Highlands
$34,734
Hillsboro
$47,086
Lee
$48,592
Manatee
$46,929
Pasco
$39,481
Pinellas
$52,512
Polk
$36,850
Sarasota
$61,463
Florida
$48,515
Charlotte County reported the seventh highest per capita income of $41,239 as of April 2018 for the Southwest region. Glades County being the lowest with $22,246 per capita income. Collier

17
CHARLOTTE COUNTY AREA ANALYSIS (Cont’d) County was No.1 for highest per capita income for the state of Florida and the Southwest region at $85,421 per capita income. Employment: The number of jobs is an important economic indicator identifying the significant activities occurring within a particular metropolitan area. The following table is presented as a summary of the demographic data relating to jobs for each of the six major market areas within the Southwest Florida region:
JOBS MSA
DEC. 2017
DEC. 2016
% CHANGE
Bradenton/ Sarasota/ North Port
352,621 339.326 +3.9%
Fort Myers/ Cape Coral
319,205 317,081 +0.7%
Naples/ Marco Island
165,554 161,464 +2.5%
Punta Gorda
69,207 59,963 +15.4%
Lakeland/ Winter Haven
281,011 272,302 +3.2%
Tampa/St.Pete Clearwater
1,455,306 1,419,976 +2.5%
Source: Agency for Workforce Innovation Charlotte County accounted for the sixth largest component of the 2017 regional employment with 69,207 jobs. Tampa/St. Pete/Clearwater Counties accounted for the largest component of the 2017 regional employment with 1,455,306 jobs. According to the Southwest Florida Regional Economic Indicators April 2018 Volume XII Number 4, the unemployment rate for Charlotte County dipped to 4.2 percent in February 2018, down from January’s 4.4 percent. The unemployment rate for the five-county region dipped to 3.8 percent in February 2018 from 4.1 percent in the prior month, and from 4.9 percent in February 2017. This decrease from the prior February was driven by an employment increase of 16,615 workers (3 percent) and an unemployment decrease of 6,039 (21 percent).

18
CHARLOTTE COUNTY AREA ANALYSIS (Cont’d) Lee County’s seasonally-adjusted unemployment rate dropped to 3.6 percent in February 2018, a decrease of 0.3 points from January 2018. Collier County’s unemployment rate declined to 3.8 percent in February 2018, down from 4.1 percent in January 2018. Hendry County’s February 2018 unemployment rate improved to 6.2 percent, down from 6.6 percent in January 2018. The February 2018 unemployment rate for Glades County remained unchanged from the previous month at 4.8 percent. Florida’s seasonally-adjusted unemployment rate was 3.9 percent in February 2018, unchanged from January 2018, and down 0.6 percentage points from February 2017. The seasonally adjusted national unemployment rate for February 2018 was unchanged from the previous month at 4.1 percent, a decline from the 4.7 percent rate recorded in February 2017. There were 398,000 jobless Floridian’s out of a labor force of 10,176,000. The U.S. unemployment rate was 4.1 percent in February. Florida’s seasonally adjusted total nonagricultural employment was 8,699,400 in February 2018, an increase of 26,700 jobs (+0.3 percent) over the month. The state gained 167,800 jobs over the year, an increase of 2.0 percent. Nationally, the number of jobs rose 1.6 percent over the year. Prior to September 2017, Florida’s over the year job growth rate had exceeded or equaled the nation’s rate since May 2012. Other industries gaining jobs over the year included construction (+31,700 jobs, +6.3 percent); leisure and hospitality (+25,600 jobs, +2.1 percent); education and health services (+18,500 jobs, +1.5 percent); financial activities (+15,300 jobs, +2.7 percent); trade, transportation, and utilities (+14,900 jobs, +0.9 percent); manufacturing (+7,800 jobs, +2.2 percent); government (+6,200 jobs, +0.6 percent); and other services (+2,500 jobs, +0.7 percent). The onlyindustry losing jobs was information (‐1,500 jobs, ‐1.1 percent). Airport passenger activity is the sum of arrivals and departures for Southwest Florida International (RSW), Sarasota Bradenton International (SRQ), and Punta Gorda (PGD) airports. Peak seasonal activity occurs in February, March, and April, with significantly lower activity in the summer months. Total passenger activity for these three airports grew to 1,192,969 in January 2018, an increase of 8 percent over both January 2017 and the prior month of December 2017. RSW passenger activity rose to 965,981 in January 2018, up 8 percent from January 2017 and 11 percent over December 2017. Punta Gorda reported 122,901 passengers in January 2018, a 17 percent increase over January 2017, albeit 4 percent below December 2017. Sarasota Bradenton recorded 104,087 passengers in January 2018, a fractional increase over December 2017, but 3 percent below January 2017.

19
CHARLOTTE COUNTY AREA ANALYSIS (Cont’d) The nation’s first solar-powered town of Babcock Ranch will be home to about 50,000 people according to the developer, Syd Kitson of Palm Beach Gardens- based Kitson & Partners. Babcock Ranch is located along State Road 31 bordering Lee and Charlotte Counties. The first residents moved in at the end of 2017, but the overall completion for the town is 20 years. Developers plan to create 20,000 homes and 6 million square feet of commercial space that will all be powered by the sun. Already operating in this solar powered city is a general store, restaurant, school, hiking trails and lakes for fishing. Just recently added are self-powered solar vehicles for transportation around the community. The new Sunseeker development by Allegiant is promoting an ambitious plan that includes launching a new brand, Sunseeker Resorts, named for a travel magazine and a website it already produces. Key features of the resort include: A condo-hotel complex, with as many as nine towers; 720 condo homes with owners having the option of renting them out. Purchase prices range from $650,000 to more than $1.1 million; 75 standard hotel units, possibly more later; Approximately 10 restaurants and shops; A 1,000-foot-long swimming pool; and A private marina with owners’ slips and rental watercraft. In Charlotte County the 450-acre site of Murdock Village has been purchased by PEG (Private Equity Group) and the developer is making plans to move forward to develop the property into a master planned community. According to Donald Schrotenboer, PEG president and CEO the company is in the midst of transportation-impact and wetlands studies and will begin to assess the property’s marketing potential. There are plans for 2,400 residential units, plus 200,000 square feet of commercial and retail space, and a 150-room hotel. The anticipated pricing in the development will be as follows: apartments $850-$1,200 per month, multi-family four-plex condo’s $145,000 - $166,000, and villa’s $163, $172,000, single family homes on 52 foot wide lots $184,000-$220,000 and single family homes on 65 foot wide lots $228,000-$273,000, per the Charlotte Sun article by Gary Roberts and posted in the Charlotte County Economic Development’s Business section.

20
CHARLOTTE COUNTY AREA ANALYSIS (Cont’d) Homes: The table below lists the single-family existing home sales by Realtors.
HOMES MSA
JANUARY 2018
SALES
1-YEAR CHANGE
JANUARY 2018 PRICE
1-YEAR CHANGE
Fort Myers Cape Coral
895
+9.3%
$244,500
-0.2%
Punta Gorda
278
-2.5%
$210,000
+7.7%
Bradenton/ Sarasota
918
+10.9%
$289,495
+7.6%
Naples
296
-5.7%
$438,500
+1.4%
LAKELAND/ WINTER HAVEN
610
-4.4%
$192,993
+17.0%
TAMPA/ST.PETE/ CLEARWATER
2,782
-6.1%
$217,000
+11.3%
SEBRING
114
+5.6
$135,000
+8.9
HOMOSASSA SPRINGS
190
-5.0%
$154,950
+10.7%
According to Florida Gulf Coast University (Southwest Florida Regional Economic Indicators) dated April 2018, the three coastal counties reported 663 single-family building permits issued in February 2018, an increase of 10 percent over February 2017. Lee County issued 391 permits in February 2018, an increase of 66 (20 percent) over February 2017. In Collier County, 169 permits were issued in February 2018, a decrease of 33 (16 percent) from February 2017. Charlotte County issued 103 permits in February 2018, an increase of 27 (36 percent) over February 2017. Charlotte and Lee County 13-month trend lines continue to be positive, while Collier’s remained negative. Hendry County year-to-date total increased to 28 permits, up significantly from the four permits issued through February 2017.

21
CHARLOTTE COUNTY AREA ANALYSIS (Cont’d) Total Realtor® sales of single-family homes in the three counties rose to 1,565 in February 2018, an increase of 8 percent over both February 2017 and January 2018. Lee County single-family home sales increased to 912 units in February 2018, up 11 percent from February 2017 and 2 percent above the January 2018 figure. The February 2018 median home price in Lee County was $250,223, up $5,223 over the same month in 2017. Charlotte County recorded 355 single-family homes sold in February 2018, an increase of 26 units over February 2017 and 77 units more than January 2018. Charlotte’s median price reached $215,000 in February 2018, an increase of $30,000 over the year before. Collier County single-family home sales totaled 298 units in February 2018, favorably comparing to 294 in February 2017 and to 280 units in January 2018. Collier’s median price increased to $472,000 in February 2018, an increase of $42,000 over January 2018 and $70,000 above the February 2017 figure. According to RealtyTrac the home sales for the State of Florida for January 2018 were down 34% compared with the previous month, and down 10% compared with a year ago. The median sales price of a non-distressed home was $192,000. The median sales price of a foreclosure home was $159,000, or 17% lower than non-distressed home sales. There are currently 24,215 properties in FL that are in some stage of foreclosure (default, auction or bank owned) while the number of homes listed for sale on RealtyTrac is 93,387. The Federal Housing & Finance Agency reported on March 22, 2018 Washington, DC – U.S. house prices rose in January, up 0.8 percent from the previous month, according to the Federal Housing Finance Agency (FHFA) seasonally adjusted monthly House Price Index (HPI). The previously reported 0.3 percent increase in December was revised upward to 0.4 percent. The FHFA monthly HPI is calculated using home sales price information from mortgages sold to, or guaranteed by, Fannie Mae and Freddie Mac. From January 2017 to January 2018, house prices were up 7.3 percent. For the nine census divisions, seasonally adjusted monthly price changes from December 2017 to January 2018 ranged from -0.7 percent in the West South Central division to +1.2 percent in the New England and Pacific divisions. The 12-month changes were all positive, ranging from +5.1 percent in the West South Central division to +10.0 percent in the Mountain division. Nationally, interest rates on conventional purchase-money mortgages increased from January 2018 to February 2018, according to several indices of new mortgage contracts. The National Average Contract Mortgage Rate for the Purchase of Previously Occupied Homes by Combined Lenders Index was 4.28 percent for loans closed in late February, up 16 basis points from 4.12 percent in January.

22
CHARLOTTE COUNTY AREA ANALYSIS (Cont’d) The average interest rate on all mortgage loans was 4.24 percent, up 14 basis points from 4.10 in January 2018. The average interest rate on conventional, 30-year, fixed-rate mortgages of $453,100 or less was 4.36 percent, up 17 basis points from 4.19 in January 2018. The effective interest rate on all mortgage loans was 4.34 percent in February 2018, up 18 basis points from 4.16 in January. The effective interest rate accounts for the addition of initial fees and charges over the life of the mortgage. The average loan amount for all loans was $311,900 in February, up $13,500 from $298,400 in January 2018. Tourism Today, Governor Rick Scott announced that Florida set another tourism record in 2017 by welcoming the highest number of visitors in any year in the state’s history with 116.5 million visitors, according to VISIT FLORIDA. This represents a 3.6 percent increase over the 112.4 million visitors in 2016. Governor Scott said, “Today, I am proud to announce that Florida has continued our record-breaking success by welcoming more than 116 million visitors in 2017. Because of VISIT FLORIDA’s aggressive marketing efforts to make sure families across the world knew that Florida was open to visitors following Hurricane Irma, we are able to celebrate another record-breaking year for tourism. This is especially great news for the 1.4 million jobs that rely on our growing tourism industry. We will continue to market our state as the number one global destination for tourism.” VISIT FLORIDA estimates that a record 116.5 million visitors traveled to Florida in 2017, an increase of 3.6 percent over last year. This number breaks down to 102.3 million domestic visitors, 10.7 million overseas visitors and 3.5 million Canadian visitors coming to the Sunshine State. Total enplanements at Florida’s 18 major airports in 2017 increased 4.1 percent over the same period the previous year, with 87.2 million passengers. The number of hotel rooms sold in Florida during 2017 grew by 4.6 percent compared to quarter four 2016. During the same period, Florida’s average daily room rate (ADR) increased by 2.6 percent and occupancy by 3.2 percent. Ken Lawson, President and CEO of VISIT FLORIDA, said, “Florida welcomed a record 116.5 million visitors in 2017, which is great news for our state. Because of the cutting-edge marketing programs at VISIT FLORIDA, particularly following Hurricane Irma, we were able to increase total visitation by 3.6 percent over last year, resulting in billions of dollars in revenue for the state. We are continuing to aggressively market the Sunshine State to the rest of the country and the rest of the world.” Maryann Ferenc, Board Chair of VISIT FLORIDA, said, “I would like to offer gratitude to the Governor and the Legislature for funding VISIT FLORIDA, the VISIT FLORIDA team for their successful efforts, the tourism industry for creating a Florida that people want to visit and

23
CHARLOTTE COUNTY AREA ANALYSIS (Cont’d) residents for creating the real welcome. Alignment at the local, state and national level have created prosperity in Florida!” Carol Dover, President and CEO of Florida Restaurant and Lodging Association (FRLA), said, “Given all the Sunshine State has to offer as a vacation destination, it comes as no surprise that each year, Florida continues to attract visitors in record numbers, however this welcomed outcome is incredible considering the tough year our state has faced in the wake of Hurricane Irma and validates the state’s sound investment in tourism marketing. FRLA salutes the diligent efforts of VISIT FLORIDA, as well as our hospitality industry partners, who work in concert to ensure Florida remains competitive as a leading global destination. Visitors are not only enjoying our hotels and restaurants, they’re simultaneously boosting state and local revenues, and supporting 1.4 million industry jobs across the state.” Florida set another record despite losing 1.8 million visitors due to Hurricane Irma, according to a recent report commissioned by VISIT FLORIDA. The impact report of Hurricane Irma shows that it cost the state 1.8 million visitors. An estimated 34.9 million out-of-state visitors came to Florida in the final four months of 2017. In the “no hurricane” model, Florida would have hosted 36.7 million visitors during that same time period. Additionally, Irma resulted in a loss of $1.5 billion in visitor spending, with $1.1 billion attributable to domestic visitors and $400 million for international visitors. Visitation was hit hardest in September, with visitation falling 13.5 percent relative to anticipated growth. However, losses were drastically reduced by October, and even more so in the following months. VISIT FLORIDA’s Post-Irma Marketing Campaign helped curb the effects of Irma on visitation, with an estimated 358 million impressions in the month following Irma. VISIT FLORIDA estimates that a record 28.5 million visitors traveled to Florida in the fourth quarter of 2017, an increase of 5.5 percent over the same period last year. This Q4 number breaks down to 25.0 million domestic visitors, 2.8 million overseas visitors and 705,000 Canadian visitors coming to the Sunshine State. Total enplanements at Florida’s 18 major airports in Q4 2017 increased 6.7 percent over the same period the previous year, with 21.7 million passengers. The number of hotel rooms sold in Florida during quarter four of 2017 grew by 8.1 percent compared to quarter four 2016. During the same period, Florida’s average daily room rate (ADR) increased by 5.4 percent and occupancy by 7.0 percent. Trends and Conclusions: According to Florida GulfCoast University’s report dated April 2018 for Southwest Florida Regional Economic Indicators, the Southwest Florida economy continues to display signs of robust growth as the first quarter of 2018 comes to a close. Positive signs include an 8-percent increase in airport passenger activity from January 2017 to January 2018, a 10-percent increase in single-family building permits from February 2017 to February 2018, and an 18-percent increase in tourist tax revenues for January 2018 compared to January 2017.

24
CHARLOTTE COUNTY AREA ANALYSIS (Cont’d) Southwest Florida’s seasonally adjusted unemployment rate declined to 3.8 percent in February 2018, down 0.3 points from the January 2018 figure. The region’s unemployment rate was lower than both the state of Florida (3.9 percent) and the nation (4.1 percent) during the same month. Other highlights in the report include: Single-family home sales for the three coastal counties were up by 8 percent from February 2017 to February 2018, while median home prices showed increases compared to both January 2018 and to February 2017. Taxable sales for the five-county region totaled $2.3 billion in December 2017, up 9 percent from the December 2016 figure. For the full-calendar year, Southwest Florida recorded a 3-percent improvement in taxable sales. Consumer sentiment in December fell both nationally and among Floridians, dropping 1.4 points in Florida from a revised November figure of 97.3 to 95.9, according to the latest University of Florida consumer survey. Among the five components that make up the index, one increased and four decreased. Opinions as to whether now is a good time to buy a big-ticket household item rose 3.5 points, from 101.1 to 104.6. Perceptions of one’s personal financial situation now compared with a year ago dropped 1.3 points from 90 to 88.7. “This drop was not found among men, those aged 60 and older, or those with an income under $50,000. It’s worth noting that the biggest drop regarding current personal finances was among respondents with an income of $50,000 or greater said Hector H. Sandoval, director of the Economic Analysis Program at UF’s Bureau of Economic and Business Research. The three components representing expectations of future economic conditions all declined this month. Expectations of personal finances a year from now declined 2.9 points from 105.4 to 102.5. Anticipated U.S. economic conditions over the upcoming year decreased 2.5 points, from 96.9 to 94.4. Expectations of U.S. economic conditions over the next five years showed the biggest drop this month, down 3.6 points from 93 to 89.4. “Most of the pessimism this month comes from unfavorable expectations about the state of the U.S. economy over the next five years. Remarkably, these negative perceptions are shared across all demographics in Florida and are strongest among those with an income level over $50,000. Additionally, the pessimism may reflect concerns over daily financial debates by the U.S. government this month,” Sandoval said. Florida began 2017 with a three-month, record-breaking increase in consumer sentiment. March 2017 reported the highest consumer sentiment level since March 2002, contributing to an average of 96.1 in the first half of the year. Consumer sentiment readings generally fell every

25
CHARLOTTE COUNTY AREA ANALYSIS (Cont’d) month after August though the average consumer sentiment for the second half of 2017 was 96.3 points, two-tenths of a point higher than the first half. “Notably, the average consumer sentiment in 2017 is 4.6 points higher than last year’s average, and it’s the highest average since 2000. Overall, Floridians are far more optimistic in 2017,” Sandoval said. Economic indicators in Florida have remained favorable throughout 2017. The labor market experienced solid job gains and a decreasing unemployment rate. The latest figure available shows the monthly unemployment rate in Florida dropped two-tenths of a percentage point to 3.6 percent in October. The Federal Reserve’s recent decision to raise interest rates by a quarter of a percentage point reflects their confidence that nationwide economic activity will continue expanding at a moderate rate and that the labor market will remain strong. “As the year ends with an overall high level of consumer sentiment and a positive economic outlook among Floridians, there are good financial prospects for 2018. We expect consumer sentiment in January to remain around the average 2017 levels,” Sandoval said. According to the U.S. Department of Commerce Bureau of Economic Analysis, The GDP increased 2.3 percent in 2017 (that is, from the 2016 annual level to the 2017 annual level), compared with an increase of 1.5 percent in 2016. The increase in real GDP in 2017 primarily reflected positive contributions from PCE, nonresidential fixed investment, and exports. These contributions were partly offset by a decline in private inventory investment. Imports, which are a subtraction in the calculation of GDP, increased. The acceleration in real GDP from 2016 to 2017 reflected upturns in nonresidential fixed investment and in exports and a smaller decrease in private inventory investment. These movements were partly offset by decelerations in residential fixed investment and in state and local government spending. Imports, which are a subtraction in the calculation of GDP, accelerated. Current-dollar GDP increased 4.1 percent, or $766.1 billion, in 2017 to a level of $19,390.6 billion, compared with an increase of 2.8 percent, or $503.8 billion, in 2016. The price index for gross domestic purchases increased 1.8 percent in 2017, compared with an increase of 1.0 percent in 2016 (table 4). The PCE price index increased 1.7 percent, compared with an increase of 1.2 percent. Excluding food and energy prices, the PCE price index increased 1.5 percent, compared with an increase of 1.8 percent. During 2017 (measured from the fourth quarter of 2016 to the fourth quarter of 2017), real GDP

26
CHARLOTTE COUNTY AREA ANALYSIS (Cont’d) increased 2.6 percent, compared with an increase of 1.8 percent during 2016. The price index for gross domestic purchases increased 1.9 percent during 2017, compared with an increase of 1.4 percent during 2016. Corporate Profits Profits from current production (corporate profits with inventory valuation adjustment and capital consumption adjustment) decreased $1.1 billion in the fourth quarter, in contrast to an increase of $90.2 billion in the third quarter. Profits of domestic financial corporations decreased $14.6 billion in the fourth quarter, in contrast to an increase of $47.8 billion in the third. Profits of domestic nonfinancial corporations increased $19.4 billion, compared with an increase of $10.4 billion. Rest-of-the-world profits decreased $5.9 billion, in contrast to an increase of $32.0 billion. In the fourth quarter, receipts increased $14.9 billion, and payments increased $20.8 billion. In 2017, profits from current production increased $91.2 billion, in contrast to a decrease of $44.0 billion in 2016. Profits of domestic financial corporations increased $15.7 billion, in contrast to a decrease of $2.0 billion. Profits of domestic nonfinancial corporations increased $37.4 billion, in contrast to a decrease of $51.7 billion. The rest-of-the-world component of profits increased $38.0 billion, compared with an increase of $9.8 billion. The 2017 Tax Cuts and Jobs Act includes several provisions that impact the business income and personal income statistics in the national income and product accounts (NIPAs). The provisions do not impact corporate profits for current production or GDI but do impact net cash flow in the fourth quarter of 2017.
27
DESCRIPTION OF THE MARKET AREA
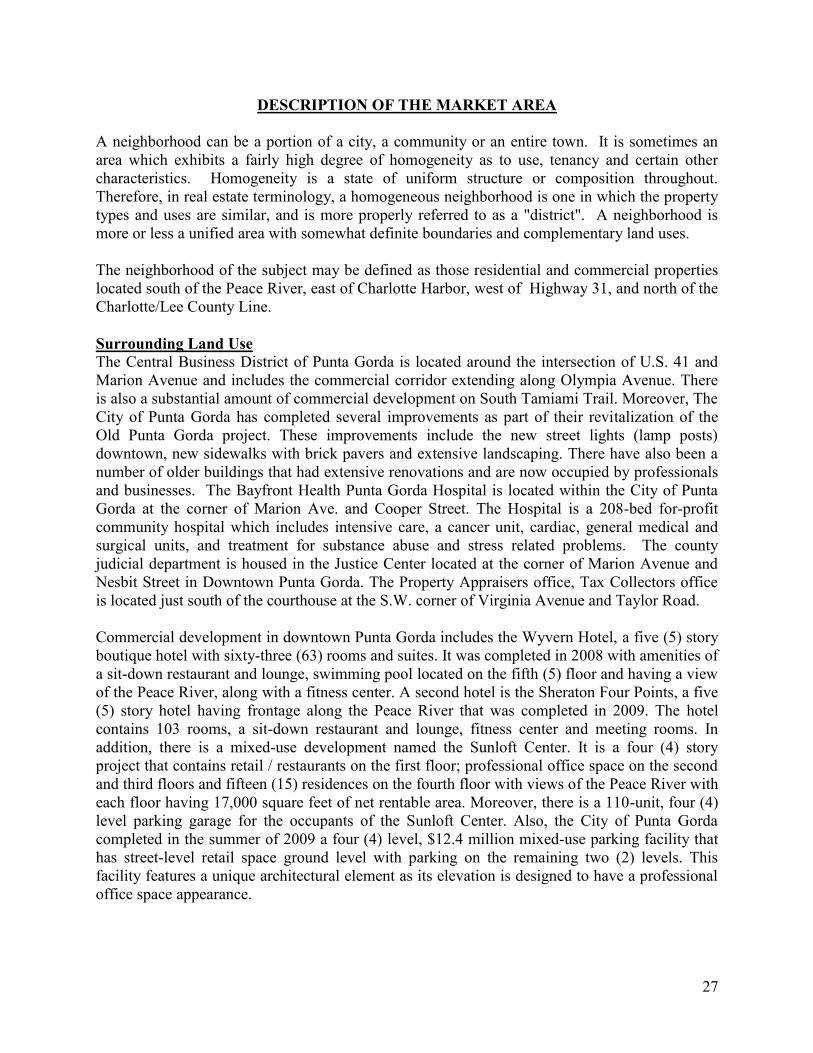
A neighborhood can be a portion of a city, a community or an entire town. It is sometimes an area which exhibits a fairly high degree of homogeneity as to use, tenancy and certain other characteristics. Homogeneity is a state of uniform structure or composition throughout. Therefore, in real estate terminology, a homogeneous neighborhood is one in which the property types and uses are similar, and is more properly referred to as a "district". A neighborhood is more or less a unified area with somewhat definite boundaries and complementary land uses. The neighborhood of the subject may be defined as those residential and commercial properties located south of the Peace River, east of Charlotte Harbor, west of Highway 31, and north of the Charlotte/Lee County Line. Surrounding Land Use The Central Business District of Punta Gorda is located around the intersection of U.S. 41 and Marion Avenue and includes the commercial corridor extending along Olympia Avenue. There is also a substantial amount of commercial development on South Tamiami Trail. Moreover, The City of Punta Gorda has completed several improvements as part of their revitalization of the Old Punta Gorda project. These improvements include the new street lights (lamp posts) downtown, new sidewalks with brick pavers and extensive landscaping. There have also been a number of older buildings that had extensive renovations and are now occupied by professionals and businesses. The Bayfront Health Punta Gorda Hospital is located within the City of Punta Gorda at the corner of Marion Ave. and Cooper Street. The Hospital is a 208-bed for-profit community hospital which includes intensive care, a cancer unit, cardiac, general medical and surgical units, and treatment for substance abuse and stress related problems. The county judicial department is housed in the Justice Center located at the corner of Marion Avenue and Nesbit Street in Downtown Punta Gorda. The Property Appraisers office, Tax Collectors office is located just south of the courthouse at the S.W. corner of Virginia Avenue and Taylor Road. Commercial development in downtown Punta Gorda includes the Wyvern Hotel, a five (5) story boutique hotel with sixty-three (63) rooms and suites. It was completed in 2008 with amenities of a sit-down restaurant and lounge, swimming pool located on the fifth (5) floor and having a view of the Peace River, along with a fitness center. A second hotel is the Sheraton Four Points, a five (5) story hotel having frontage along the Peace River that was completed in 2009. The hotel contains 103 rooms, a sit-down restaurant and lounge, fitness center and meeting rooms. In addition, there is a mixed-use development named the Sunloft Center. It is a four (4) story project that contains retail / restaurants on the first floor; professional office space on the second and third floors and fifteen (15) residences on the fourth floor with views of the Peace River with each floor having 17,000 square feet of net rentable area. Moreover, there is a 110-unit, four (4) level parking garage for the occupants of the Sunloft Center. Also, the City of Punta Gorda completed in the summer of 2009 a four (4) level, $12.4 million mixed-use parking facility that has street-level retail space ground level with parking on the remaining two (2) levels. This facility features a unique architectural element as its elevation is designed to have a professional office space appearance.
28
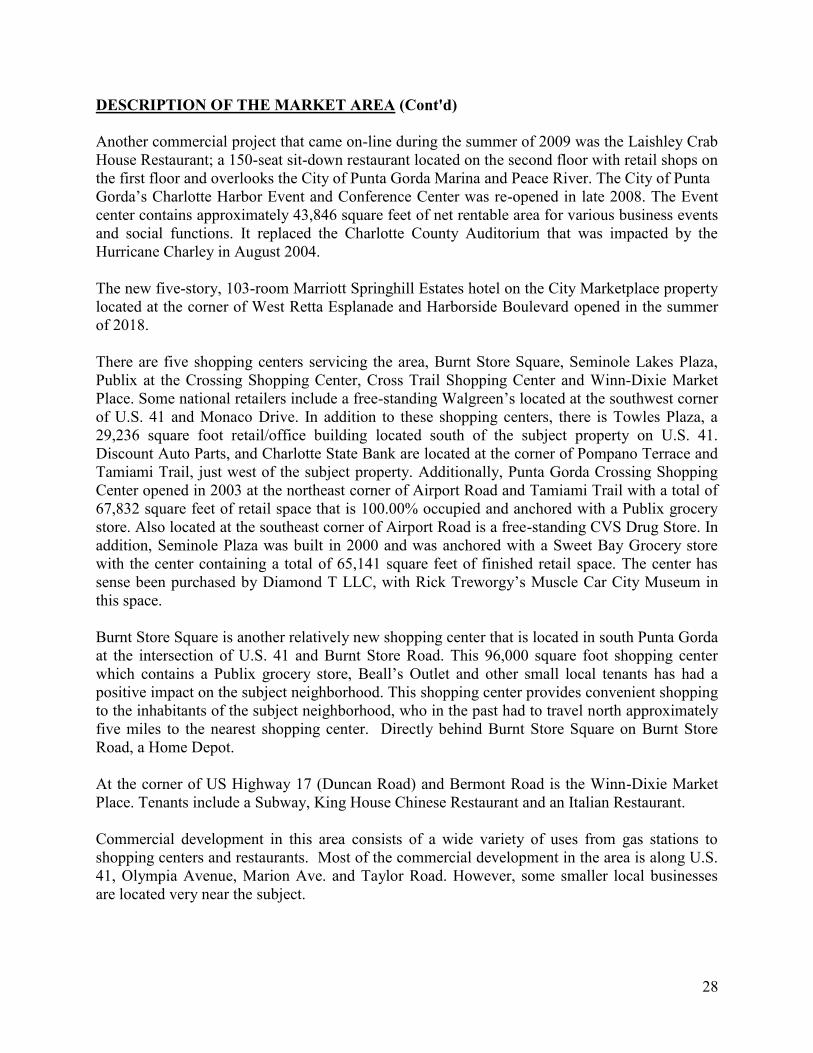
DESCRIPTION OF THE MARKET AREA (Cont'd) Another commercial project that came on-line during the summer of 2009 was the Laishley Crab House Restaurant; a 150-seat sit-down restaurant located on the second floor with retail shops on the first floor and overlooks the City of Punta Gorda Marina and Peace River. The City of Punta Gorda’s Charlotte Harbor Event and Conference Center was re-opened in late 2008. The Event center contains approximately 43,846 square feet of net rentable area for various business events and social functions. It replaced the Charlotte County Auditorium that was impacted by the Hurricane Charley in August 2004. The new five-story, 103-room Marriott Springhill Estates hotel on the City Marketplace property located at the corner of West Retta Esplanade and Harborside Boulevard opened in the summer of 2018. There are five shopping centers servicing the area, Burnt Store Square, Seminole Lakes Plaza, Publix at the Crossing Shopping Center, Cross Trail Shopping Center and Winn-Dixie Market Place. Some national retailers include a free-standing Walgreen’s located at the southwest corner of U.S. 41 and Monaco Drive. In addition to these shopping centers, there is Towles Plaza, a 29,236 square foot retail/office building located south of the subject property on U.S. 41. Discount Auto Parts, and Charlotte State Bank are located at the corner of Pompano Terrace and Tamiami Trail, just west of the subject property. Additionally, Punta Gorda Crossing Shopping Center opened in 2003 at the northeast corner of Airport Road and Tamiami Trail with a total of 67,832 square feet of retail space that is 100.00% occupied and anchored with a Publix grocery store. Also located at the southeast corner of Airport Road is a free-standing CVS Drug Store. In addition, Seminole Plaza was built in 2000 and was anchored with a Sweet Bay Grocery store with the center containing a total of 65,141 square feet of finished retail space. The center has sense been purchased by Diamond T LLC, with Rick Treworgy’s Muscle Car City Museum in this space. Burnt Store Square is another relatively new shopping center that is located in south Punta Gorda at the intersection of U.S. 41 and Burnt Store Road. This 96,000 square foot shopping center which contains a Publix grocery store, Beall’s Outlet and other small local tenants has had a positive impact on the subject neighborhood. This shopping center provides convenient shopping to the inhabitants of the subject neighborhood, who in the past had to travel north approximately five miles to the nearest shopping center. Directly behind Burnt Store Square on Burnt Store Road, a Home Depot. At the corner of US Highway 17 (Duncan Road) and Bermont Road is the Winn-Dixie Market Place. Tenants include a Subway, King House Chinese Restaurant and an Italian Restaurant. Commercial development in this area consists of a wide variety of uses from gas stations to shopping centers and restaurants. Most of the commercial development in the area is along U.S. 41, Olympia Avenue, Marion Ave. and Taylor Road. However, some smaller local businesses are located very near the subject.

29
DESCRIPTION OF THE MARKET AREA (Cont'd) Residential The subject property is located west of Interstate 75 and north of Jones Loop Road. Moreover, east of the subject property is an area known as the Charlotte Ranchettes. This is typified by single family homes located on 1.25 acres up to 5.00-acre home sites. These homes are predominantly ranch style one story homes that were constructed in the early seventies to now. Punta Gorda Isles subdivision is located west of U.S. 41. This area is typified by single-family homes located on saltwater canals with direct access to Charlotte Harbor. The older homes are predominately ranch style one story homes. The newer homes are two stories. There are also a number of mid-rise condominium projects in this area. The development of Punta Gorda Isles was started in the late 1950's and today is approximately 90% developed. This area is considered one of the most desirable places to live in Charlotte County as the area is protected by deed restrictions and most of the homes are of superior quality construction and are well maintained. South of the subject is the residential neighborhood of Charlotte Park, a subdivision that contains quarter acre lots with water but no sewer available. Also, located south of the subject is the Tropical Gulf Acres residential development, which began building homes in the late 1950’s to early 1960’s. Typical homes are concrete block with painted stucco exterior with floor plans ranging from two to three bedrooms with two bathrooms and total living area of 1,000 to 1,700 square feet. Other residential developments include the following:
250+ unit project by KB Homes located along Alligator Creek at Taylor Road. This project includes single family homes from 1,300 square feet to 2,500 square feet and is still under development at this time.
342+ unit project by D. R. Horton, located on the north side of Airport Road. This project includes single family homes from 1,672 square feet to 2,319 square feet. Still under construction.
104+ unit project by KB Homes located on Tuscany Isles Dr. Planned community amenities include a private, gated entrance, pool and clubhouse. This project includes single family homes from 1,300 square feet to 1,523 square feet. Still under development.
Industrial There are industrial type properties in a limited number of areas of Punta Gorda that are not subdivided industrial parks. There are industrial areas along roads such as Florida Street, Taylor

30
DESCRIPTION OF THE MARKET AREA (Cont'd) Road, and Carmalita Street. Many of these industrial areas are typified by older, steel framed warehouse buildings that are owner occupied, and are utilized in automotive service repair and construction related businesses. The majority of industrial areas in Punta Gorda are located in proximity to US 41, US Highway 17, and Interstate 75, which are the major transportation arterioles in the county. There are four main industrial parks in Punta Gorda and are described as follows. The 1775 Industrial Park is located on the north side of US Highway 17 approximately 1.5 miles east of I-75. This industrial park is characterized by predominantly owner-occupied office/warehouse buildings. The majority of these buildings are newer buildings. The King Industrial Park offers larger industrial lots ranging in size from 1.0 acre to 3.0 acres. There has been minimal development in this park in the past; however, growth has increased since the beginning of 1998 with new buildings under construction. Charlotte Commercial Center is located on Taylor Road just north of its intersection with Jones Loop Road. The Charlotte Commercial Park benefits from its proximity to Interstate 75 and Tamiami Trail via a good road network. Taylor Business Center is a phased commercial condominium project that is projected to be completed in seven (7) years with a total build-out of ninety-six (96) units. Furthermore, each of the one-story eight (8) buildings will contain twelve (12) units having 1,200 square feet of net rentable area with 400 square feet or 33.33% allocated as office space and 800 square feet (66.66%) as warehouse space. Currently, Phase I has been completed within Buildings “B” and “F”.
Old Town Commercial Condominium Development is located at 3849 / 3853 / 3857 Acline Road, Punta Gorda, Charlotte County, it is comprised of twenty-one (21) individual condominium units. The Airport Industrial Park is located at the Charlotte County Airport. The Airport Industrial Park offers existing warehouse buildings and hanger type buildings that are owned by the Charlotte County Airport. It is possible to build a new building in the Airport Industrial Park, however, the entire Airport Industrial Park is on land owned by the Charlotte County Airport Authority, and the building would have to be built on leased land. Charlotte County has instituted the Charlotte Airport Park, and a Future Land Use designation of Airport Commerce Park on a large portion of land surrounding the Charlotte County Airport. The intent of the Enterprise Charlotte Airport Park is to create a mixed-use zoning district which enhances and promotes economic development within its boundaries as well as within the County, and which provides for quality and consistency in design and development while still

31
DESCRIPTION OF THE MARKET AREA (Cont'd) maintaining flexibility in design and development standards. The permitted use categories include commercial/retail, industrial, distribution, office/governmental/institutional, aviation and related industries and agriculture. New / Future Commercial One important development impacting this market area is the recent development 2015 Cheney Brothers distribution center that contains 345,000-square-foot dry warehouse. Cheney Brother’s has recently announced that it now plans to add an additional 100,000 square feet and will employee over 300 employees. A new Holiday Inn Express on Mac Drive in Punta Gorda, opened May of 2018.
Aldi, a German based grocery chain on Jones Loop Road opened in the fall of 2018. Starbuck’s is building a free standing building as an outparcel to the Cross Trails Shopping Center. An 8,474 square foot office building has broken ground on Cross Street. A new Chase Bank is under construction on the northwest corner of Tamiami Trail and Carmelita Street. Charlotte County Airport The Charlotte County Airport originally opened in 1944 as a United States Army Air Force airfield. Currently, it is used mostly in general aviation for single-engine planes to small jet engines. In 2006, the airport had 74,743 aircraft operations or an average of 204 per day with 97.00% being general aviation and 3.00% as taxi. Moreover, it is improved with three paved asphalt runways measuring 6,695, 5,688 and 5,044 lineal feet, respectively. It has recently expanded its passenger terminal and tripled the size of Bailey Terminal — from 16,000 to about 50,000 square feet. This doubled the air gates from two to four, enhanced security areas, and make room for more ticket counters and a larger passenger waiting area. The expansion cost about $11 million, 70 percent of which will be paid for by the Federal Aviation Administration. The Florida Department of Transportation and the port authority split the remaining 30 percent. The airport has been successful in maintaining the operation of a regional airline. Allegiant has daily flights into Punta Gorda from destinations outside Florida. Utility Availability Both the City of Punta Gorda and Charlotte County Utilities provide public utilities of water and sewer in various submarkets of Punta Gorda. Furthermore, electricity is supplied by Florida Power and Light Company and telephone service is provided by Century Link. Police and fire protection are provided by the Charlotte County with the City of Punta Gorda also providing services.

32
DESCRIPTION OF THE MARKET AREA (Cont’d) Access and Circulation U.S. 41 is one of the primary arteries in the subject's neighborhood. U.S. 41 is a major north-south highway system, which runs from Tampa to Miami. This four lane bilateral thoroughfare links the subject neighborhood south to Lee County and the City of Fort Myers and to the north to Port Charlotte. East-West arterials include Marion Avenue, which provides west-bound traffic from Interstate 75 and Olympia Avenue, which links the downtown market area of Punta Gorda east to Interstate 75. Interstate 75 is a limited expressway that links Southwest Florida to other major roadways and metropolitan areas within the state of Florida is located just east of the subject and is accessible at N. Jones Loop Road (Exit 161) and Duncan Road or U.S. Highway 17 (Exit 164). Overall, the primary market area is considered to benefit from adequate access. The Florida Department of Transportation (FDOT) indicated the following Average Annual Daily Traffic (AADT) counts for 2017 on the following page. Location AADT Piper Rd, from CR 768/Jones Loop Rd, to Fairway Dr S 1,100 Airport Rd, from Taylor Rd. Piper Rd 4,000 Demographics We have obtained a 1, 3 and 5 mile ring study prepared by ESRI for the subject location. Selected demographic characteristics for the subject neighborhood are summarized on the following page in the chart.

33
DESCRIPTION OF THE MARKET AREA (Cont’d)
AREA DEMOGRAPHICS
1 Mile
3 Miles
5 Miles
Population
2023 Projection
753
15,897
38,919
2018
662
14,019
34,817
Annual Rate % Change 2018-2023
2.61%
2.55%
2.25%
Households
2023 Projection
43
7,178
18,429
2018
37
6,280
16,455
Annual Rate % Change 2018-2023
3.05%
2.71%
2.29%
Income
2018 Average HH Income
$69,125
$62,255
$73,323
2018 Median HH Income
$52,046
$42,594
$48,397
Age
2018 Median Age (Yrs)
50.7
58.4
62.9
As the demographic data indicates, growth between 2018 and 2023 is expected range from 2.25% to 2.61% per year range in a one, three and five mile radius. At a rate slightly greater than the population growth, households are expected to grow in the 2.29% to 3.05% per year range. Income figures are relatively moderate with average household income in the $62,255 to $73,323 per year range. The median age of the neighborhood is from 50.7 years to 62.9 years indicating an area catering to the retired, working professionals as well as families. Overall, the demographic data indicates a strong economic base able to support most types of development. It should be noted that the demographic data is tied directly to the 2010 census figures and is grossly understated with respect to population growth and income figures.
RETAIL MARKET OVERVIEW According to the Second Quarter 2018 CoStar Retail Report, in Southwest Florida, the retail market did not experience much change in market conditions in the second quarter 2018. The vacancy rate went from 4.6% in the previous quarter to 4.7% at the end of the second quarter 2018. Net absorption was positive 6,713 square feet, and vacant sublease space increased by 48,099 square feet. Quoted rental rates increased from the first quarter 2018 levels, ending at

34
DESCRIPTION OF THE MARKET AREA (Cont’d) $17.27 per square foot per year for the second quarter 2018. A total of 7 retail buildings with 64,725 square feet of retail space was delivered to the market in the quarter, with 500,960 square feet still under construction at the end of the quarter. The total retail inventory in the Southwest Florida market area is 80,679,933 square feet in 6,069 buildings and 901 centers at the end of the second quarter 2018. Approximately 57.7% of the region’s total retail/shopping center inventory is located in Lee County with a vacancy rate of 5.4%. Vacant existing spaces, and speculative new construction, are both typically concentrated in General freestanding retail buildings, unanchored strip shopping centers, anchored neighborhood shopping centers and community shopping centers. Based on analysis of building permit data for the region’s various political jurisdictions, the CoStar Group Inc., estimates there is 6,119 square feet in Charlotte County currently under construction in 1 building at the end of the second quarter 2018. Southwest Florida’s retail vacancy rate increased in the second quarter 2018, ending the quarter at 4.7% compared to 4.6% in the first quarter 2018 and 4.3% in the fourth quarter 2017. Average quoted asking rental rates in the Southwest Florida retail market are up over previous quarter levels, and up from their levels four quarters ago. Quoted rents ended the second quarter 2018 at $17.27 per square foot per year. That compares to $17.02 per square foot in the first quarter 2018, and $16.15 per square foot at the end of the third quarter 2017. This represents a 1.5% increase in rental rates in the current quarter, and a 6.49% increase from four quarters ago. The total retail net absorption was basically flat in Southwest Florida’s second quarter 2018, with positive 6,713 square feet absorbed in the quarter. In the first quarter 2018, net absorption was negative (131,378) square feet, while in the fourth quarter 2017, absorption came in at positive 359,024 square feet. The following table displays the end of the Second Quarter 2018 Charlotte County Total Retail Market Statistics published by the CoStar Group Inc.
Submarket # Bldgs Rentable Area
Vacant Sq. Ft.
Vacancy Rate
Charlotte County 891 10,221,838 381,215 3.7% * Source: CoStar Group Inc.
The total retail market vacancy rate in Charlotte County was 3.7% at the end of the second quarter 2018. This is compared to the first quarter 2018 which had a rate of 4.1% and 3.9% in the fourth quarter 2017. Charlotte County’s total retail market rental rates ended the second quarter 2018 at $13.74 per square foot per year. This is up compared to the first quarter 2018 which had a rental rate of $13.06 per square foot, $13.35 per square foot in the fourth quarter 2017, and $12.79 per square foot at the end of the third quarter 2017. Charlotte County’s total retail net absorption was positive 36,650 square feet at the end of the second quarter 2018, negative (23,193) square feet at the end of the first quarter 2018 and positive 58,262 square feet at the end of the fourth quarter 2017.

35
DESCRIPTION OF THE MARKET AREA (Cont’d) The total retail market inventory in Charlotte County at the end of the second quarter 2018 was 10,221,838 square feet in 891 buildings with 381,215 square feet vacant. Charlotte County has a total of 6,119 square feet in 1 building under construction that is 100% pre-leased at the end of the second quarter 2018. Charlotte County has not delivered any new projects in the retail market as of the end of the second quarter 2018. The notable lease signings that occurred in Charlotte County for the second quarter 2018 include the following table. We have listed lease signings with named tenants.
Tenant
Square Footage
Location
Qtr
N/A 10,997 19400 Cochran Blvd 2nd N/A 7,500 18700 Veterans Blvd 1st N/A 6,400 18700 Veterans Blvd 1st N/A 6,400 3315 Tamiami Trail 1st
* Source: CoStar Group Inc.
During the second quarter 2018, 7 buildings totaling 64,725 square feet were completed in the Southwest Florida retail market. Over the past four quarters a total of 447,424 square feet of retail space has been built in Southwest Florida. In addition to the current quarter, 11 buildings with 148,309 square feet were completed in the first quarter 2018, 10 buildings totaling 112,692 square feet in the fourth quarter 2017 and 121,698 square feet in 9 buildings completed in the third quarter 2017. There were 500,960 square feet under construction at the end of the second quarter 2018. Some of the notable deliveries for 2018 include; a 25,000 square foot facility delivered in the first quarter 2018 in Lee County at 19901 Ben Hill Griffin Parkway and is now 45% occupied and a 20,704 square foot facility in Collier County that is 85% occupied located at 7717 Collier Blvd.
The Shopping Center market in Southwest Florida currently consists of 872 buildings with 35,282,337 square feet of retail space in 1,460 buildings. The Shopping Center market is comprised of all Community Center, Neighborhood Center and Strip Centers. After absorbing negative (104,999) square feet and delivering 7,100 square feet in the second quarter 2018, The Shopping Center sector saw the vacancy rate go from 7.3% at the end of the first quarter 2018 to 7.6% in the second quarter 2018. Approximately 13.25% of the region’s shopping center inventory is located in Charlotte County. Rental rates ended the second quarter 2018 at $15.06 per square foot, up from the $15.05 per square foot at the end of the first quarter 2018. Rental rates have trended up over the past year, going from $14.49 per square foot a year ago to their current levels. Net absorption in the Shopping Center Sector has totaled 258,128 square feet over the past four quarters. In addition to the negative (104,999) square feet absorbed this quarter, negative (22,509) square feet was absorbed in the first quarter 2018, positive 219,770 was absorbed in the fourth quarter 2017, and positive 165,866 square feet was absorbed in the third quarter 2017.

36
DESCRIPTION OF THE MARKET AREA (Cont’d) At the end of the second quarter 2018 Charlotte County reported a current inventory of 137 Shopping Centers containing 4,675,731 square feet of which 293,759 square feet is vacant space with a 6.3% vacancy rate. Charlotte County reported YTD net absorption of positive 30,234 square feet, quoted rental rates of $13.60 per square foot per year, no YTD deliveries and 6,119 square feet under construction at the end of the second quarter 2018. The Power Center market in Southwest Florida currently consists of 3,246,519 square feet in 10 centers comprised of 65 buildings at the end of the second quarter 2018. The average vacancy rate at the end of the second quarter 2018 was 3.4%. With positive 28,806 square feet of net absorption and no new deliveries, the vacancy rate went from 4.3% at the end of the first quarter 2018. In the first quarter 2018, Power Centers absorbed negative (22,181) square feet, and delivered no new space. The vacancy rate went from 3.6% to 4.3% over the course of the quarter. Rental rates started the quarter at $21.09 per square foot and ended the quarter at $19.61 per square foot. At the end of the second quarter 2017, the vacancy rate was 5.5%. Over the past four quarters the Power Centers have absorbed a cumulative 70,070 square feet of space and delivered no new space. Charlotte County currently has an inventory of 0 Power Centers. The General Retail market in Southwest Florida currently consists of 32,885,647 square feet in 4,400 buildings. This market area includes all freestanding retail buildings, except those contained within a center. The General Retail sector reported a vacancy rate of 2.1% at the end of the second quarter 2018 with a total of 682,244 square feet vacant. Current rental rates of $21.70 per square foot per year at the end of the second quarter 2018. There was 364,701 square feet under construction with 57,625 square feet having been completed in the second quarter 2018. YTD net absorption of positive 95,792 square feet. Approximately 14.2% of the region’s General Retail Market inventory is located in Charlotte County. In Charlotte County the General Retail sector currently has an inventory of 689 General Retail buildings containing 4,674,367 square feet of which 82,400 square feet is vacant space with a vacancy rate of 1.8%, YTD net absorption of negative (16,777) square feet, quoted rental rates of $15.21 per square feet, no YTD deliveries and nothing under construction as of the end of the second quarter 2018. There are currently 8 Specialty Centers in the Southwest Florida market, making up 1,147,526 square feet of retail space and is comprised of Outlet Centers, Airport Retail and Theme/Festival Centers. Specialty Centers in the Southwest Florida market have experienced negative (70,367) square feet of net absorption in 2018.

37
DESCRIPTION OF THE MARKET AREA (Cont’d) The vacancy rate currently stands at 16.9%, and rental rates average $20.98 per square foot per year. YTD deliveries of 7,500 square feet located and nothing under construction ate end of the second quarter 2018. Charlotte County currently has an inventory of 0 Specialty Centers. The Mall market in Southwest Florida currently consists of 11 centers with 8,117,904 square feet of retail space and is comprised of Lifestyle Centers, Regional Malls and Super Regional Malls. The Mall sector reported net absorption of positive 7,513 square feet in the second quarter 2018. This net absorption number combined with no new space that was built in the quarter, caused the vacancy rate to go from 1.1% a quarter ago to 1.0% at the end of the second quarter 2018. Rental rates went from $34.15 per square foot during that time. Approximately 10.7% of the region’s Mall market inventory is located in Charlotte County. Charlotte County currently has an inventory of 1 center in the Mall market containing 871,740 square feet of which 5,056 square feet is vacant space with a 0.6% vacancy rate, quoted rental rates of $0 per square feet, YTD net absorption of 0 square feet, no new deliveries and nothing under construction in the second quarter 2018.
OFFICE MARKET OVERVIEW As indicated in The Second Quarter 2018 CoStar Report, the Southwest Office market currently has an inventory of 33,621,933 square feet in 3,273 buildings. The Class A sector consisted of 4,253,759 square feet in 79 projects. There were 1,734 Class B buildings totaling 20,777,689 square feet and the Class C sector consisted of 8,590,485 square feet in 1,460 buildings. Within the Office market there were 91owner-occupied buildings accounting 1,477,777 square feet of office space. The office vacancy rate was up over the previous quarter ending the second quarter 2018 at 7.4%, with net absorption totaling negative (178,487) square feet. Vacant sublease space increased in the second quarter at 53,571 square feet. Rental rates increased 0.3% at the end of the second quarter 2018 to $15.03 per square foot, compared to the first quarter 2018 when they were $14.99 per square foot. Net absorption for the overall Southwest Florida office market was negative (178,487) square feet in the second quarter 2018 compared to negative (149,639) square feet in the first quarter 2018, positive 46,145 in the fourth quarter 2017, and positive 192,589 square feet in the third quarter 2017.During the second quarter 2018 one building totaling 10,000 square feet was complete in the Southwest Florida Office market area. This compares to three buildings totaling 28,504 square feet that were completed in the first quarter 2018, three buildings totaling 111,382 square feet completed in the fourth quarter 2017 and 6,044 square feet completed in the third quarter 2017. There were 73,738 square feet of office space under construction at the end of the second quarter 2018.

38
DESCRIPTION OF THE MARKET AREA (Cont’d) Some of the notable 2018 deliveries include: 7964 Summerlin Lakes Dr, a 14,190 square foot facility that delivered in the first quarter 2018 and is now 100% occupied, and 1390 Tamiami Trail N, a 10,000 square foot building that delivered in the second quarter 2018 and is now 100% occupied. The largest projects underway at the end of the second quarter 2018 were 3419 Lee Blvd, a 40,000 square foot building with 100% of its space pre-leased and in Charlotte County a 10,000 square foot building located at 2881 Placida Road with no space pre-leased. The following table displays the Total Office Market Report for Charlotte County published by the CoStar Group Inc for the second quarter 2018.
Submarket # Bldgs Rentable Area Vacant
Sq. Ft. Vacancy
Rate Charlotte County 565 3,943,495 229,748 5.8%
* Source: CoStar Group Inc. Charlotte County's Total Office Market currently has an inventory of 565 buildings with 3,943,495 square feet of which 229,748 square feet is vacant, a vacancy rate of 5.8%, net absorption of negative (32,015) square feet. In Charlotte County the rental rate went down $.43 per square foot ending the second quarter 2018 at $13.16 per square foot. This is compared to the first quarter 2018 when rental rates were $13.59 per square foot and $13.50 per square foot in the fourth quarter 2017. The Southwest Florida Class A office sector consists of 79 projects with 4,253,759 square feet of which 597,294 square feet is vacant space at the end of the second quarter 2018. The recorded net absorption was negative (70,748) square feet in the second quarter 2018, compared to negative (55,660) square feet in the first quarter 2018, positive 29,083 square feet in the fourth quarter 2017 and positive 47,640 square feet in the third quarter 2017. Class-A projects reported a vacancy rate of 14.0% at the end of the second quarter 2018, 13.7% at the end of the first quarter 2018 and 12.4% at the end of the fourth quarter 2017. Average quoted rental rates at the end of the second quarter 2018 for the Class-A sector were $17.01 per square foot compared to $17.67 for the first quarter 2018. The following table displays Charlotte County’s Class A, B and C Market Statistics published by the CoStar Group Inc. for the second quarter 2018.
Charlotte Market # Bldgs Rentable Area Vacant
Sq. Ft. Vacancy
Rate Class A 3 166,638 33,200 19.9% Class B 152 1,442,299 120,904 8.4% Class C 410 2,334,558 75,644 3.2% Total 565 3,943,495 229,748 5.8%
* Source: CoStar Group Inc.

39
DESCRIPTION OF THE MARKET AREA (Cont’d) The Charlotte County Class A office sector consists of 3 building with 166,638 square feet of which 33,200 square feet is vacant space with a vacancy rate of 19.9%, YTD net absorption of negative (857) square feet, quoted rental rates of $15.39 per Square foot, no YTD deliveries and no new construction reported for this market at the end of the second quarter 2018. The Southwest Florida Class B office sector consisted of 1,734 projects with 20,777,689 square feet of which 1,039634 square feet was vacant space at the end of the second quarter 2018. The Class-B market reported net absorption of negative (171,561) square feet for the current quarter and negative (72,154) square feet in the first quarter 2018. Class-B projects reported a vacancy rate of 7.5% at the end of the second quarter 2018, 6.6% at the end of the first quarter 2018 and 6.2% at the end of the fourth quarter 2017. Class-B rental rates stood at $14.96 per square foot for the second quarter 2018 compared to the first quarter when they were $14.73 per square foot. The Charlotte County Class B office sector consists of 152 buildings with 1,442,299 square feet of which 120,904 square feet is vacant space with a vacancy rate of 8.4%, YTD net absorption of negative (34,307) square feet, with a quoted rental rate of $12.54 per square foot, no YTD deliveries and 10,000 square feet under construction at the end of the second quarter 2018. The Southwest Florida Class C office sector consists of 1,460 projects with 8,590,485 square feet of which 334,721 square feet is vacant space at the end of the second quarter 2018. The Class-C market reported net absorption of positive 8,162 square feet for the current quarter and negative (21,825) square feet for the first quarter 2018. Class-C projects reported a vacancy rate of 3.9% for the second quarter 2018, compared to 4.0% for the first quarter 2018 and 3.7% for the fourth quarter 2017. The average quoted rental rates for Class-C projects were down $.10 per square foot at the end of the second quarter 2018 at $12.25 per square foot, compared to the first quarter 2018 when they stood at $12.35 per square foot. The Charlotte County Class C office sector consists of 410 buildings with 2,334,558 square feet of which 75,644 square feet is vacant space with a vacancy rate of 3.2%, a quoted rental rate of $13.06 per square foot, YTD net absorption of positive 26,604 square feet, no YTD deliveries, and no new construction reported in this market for the second quarter 2018. The notable lease signing that occurred in Charlotte County for 2018 are included the following table.
Tenant
Square Footage
Location
Qtr
Berson Realty Group 5,000 223 Taylor Road 2nd * Source: CoStar Group Inc.
INDUSTRIAL/FLEX OVERVIEW According to The Second Quarter 2018 CoStar Industrial Report, the Southwest Florida Industrial Market reported a total Industrial inventory of 49,585,527 square feet in 3,698 buildings. Within the Industrial market there were 187 owner-occupied buildings accounting for 3,685,614 square feet of Industrial space. The vacancy rate increased to 2.6% at the end of the

40
DESCRIPTION OF THE MARKET AREA (Cont’d) second quarter 2018 compared to the first quarter 2018 when it was 2.1% and 1.8% at the end of the fourth quarter 2017. Quoted Rental rates for industrial space was $8.48 per square foot per year at the end of the second quarter 2018. This represents a 1.7% decrease in quoted rental rates from the end of the first quarter 2018, when rents were reported at $8.63 per square foot. The net absorption for the overall Southwest Florida Industrial market was negative (218,098) square feet in the second quarter 2018. That compares to negative (42,944) square feet in the first quarter 2018, positive 83,989 square feet in the fourth quarter 2017 and positive 2,025 square feet in the third quarter 2017. There were twelve properties under construction at the end of the second quarter 2018 with a total of 722,032 square feet in the Southwest Florida Industrial market. One building totaling 26,000 square feet was delivered to the market in the second quarter 2018. This compares to seven buildings totaling 106,671 square feet that were completed in the first quarter 2018, four buildings totaling 137,300 square feet completed in the fourth quarter 2017 and 8,400 square feet in one building completed in the third quarter 2017. The Charlotte County Industrial Market makes up 9.1% of the regions Flex/Warehouse space. In Charlotte County there is currently a total of 455 buildings with 4,496,887 square feet of Industrial space in the Warehouse and Flex sectors with 66,138 square feet of vacant space and a 1.5% vacancy rate. The vacancy rate has gone up since the first quarter 2018 when it was 1.1%. This is compared to the fourth quarter 2017 when the vacancy rate was also 1.1%, and 0.7% in the third quarter 2017. The overall net absorption in Charlotte County at the end of the second quarter 2018 was negative (114,748) square feet compared to the first quarter 2018 with net absorption of positive 140 square feet, negative (19,210) square feet for the fourth quarter 2017, and negative (4,520) square feet in the third quarter 2017. The overall quoted rental rate in Charlotte County showed a decrease ending the second quarter 2018 at $9.67 per square foot. This is compared to the first quarter 2018 when rates were $9.95 per square foot, a difference of $.28 per square foot. The following table displays the total Second Quarter 2018 Charlotte County Flex and Warehouse Market Statistics published by the CoStar Group Inc.
Submarket # Bldgs Rentable Area Vacant Sq. Ft.
Vacancy Rate
Flex Market 38 385,222 11,800 3.1% Warehouse Market 417 4,111,665 54,338 1.3% Total 455 4,496,887 66,138 1.5%
* Source: CoStar Group Inc. The Southwest Florida Industrial Flex Market reported a total of 6,619,428 square feet in 3,291 projects. The Flex market recorded net absorption of negative (53,647) square feet in the second quarter 2018 compared to positive 59,654 square feet in the first quarter 2018, positive 88,628 square feet in the fourth quarter 2017 and positive 24,886 in the third quarter 2017.

41
DESCRIPTION OF THE MARKET AREA (Cont’d) Flex projects reported a vacancy rate of 5.0% at the end of the second quarter 2018 compared to 3.8% at the end of the first quarter 2018, 3.6% at the end of the fourth quarter 2017, and 4.6% at the end of the third quarter 2017. The quoted rental rates within the Flex market were down in the second quarter 2018 reported at $10.61 per square foot as compared to $11.29 per square foot at the end of the first quarter 2018, a difference of $.68 per square foot per year. In the Charlotte County Flex market, the current inventory consists of 38 buildings with a total of 385,222 square feet of which 11,800 square feet is vacant space with a 3.1% vacancy rate, YTD net absorption of negative (7,500) square feet and a quoted rental rate of $12.54 per square foot per year. No new deliveries and nothing under construction at the end of the second quarter 2018. The Southwest Florida Industrial Warehouse Market reported a total of 42,966,099 square feet in 3,291 buildings. The Warehouse building market recorded net absorption of negative (164,451) square feet in the second quarter 2018 compared to negative (102,598) square feet in the first quarter 2018, negative (4,639) square feet in the fourth quarter 2017 and a negative (22,861) square feet in the third quarter 2017. The Warehouse market reported a vacancy rate of 2.2% at the end of the second quarter 2018, 1.8% in the first quarter 2018, 1.5% at the end of the fourth quarter 2017 and 1.2% at the end of the third quarter 2017. The average quoted rental rate for the Warehouse market stood at $8.01 per square foot an increase over the first quarter 2018 when they were $7.99 per square foot per year. In Charlotte County the Warehouse market currently has an inventory of 417 buildings with 4,111,665 square feet of which 54,338 square feet is vacant space with a vacancy rate of 1.3%, YTD net absorption of negative (7,108) square feet with a quoted rental rate of $9.24 per square foot. No new deliveries and 47,020 square feet under construction for the second quarter 2018. The notable lease signing that occurred in Charlotte County for 2018 is shown in the following table.
Tenant Square Footage Location Qtr
N/A 9,000 2850 Worth Ave. 2nd * Source: CoStar Group Inc.
The Charlotte County Warehouse market currently has 3 projects under construction with a total of 47,020 square feet that are all 100% pre-leased with no quoted rental rates at the end of the second quarter 2018. The largest projects underway in the Southwest Florida Industrial Market are located in Lee County and include: 10400 Meridian Center Parkway with 200,961 square feet, 0% pre-leased with a quoted rental rate of $8.07 per square foot per year and 15411 Meridian Center Parkway with 161,766 square feet that is 0% pre-leased with a quoted rental rate of $8.07 per square foot per year. Both projects are estimated to be completed by the fourth quarter 2018.

Copyright © and (P) 1988–2009 Microsoft Corporation and/or its suppliers. All rights reserved. http://www.microsoft.com/streets/Certain mapping and direction data © 2009 NAVTEQ. All rights reserved. The Data for areas of Canada includes information taken with permission from Canadian authorities, including: © Her Majesty the Queen in Right of Canada, © Queen's Printer for Ontario. NAVTEQ and NAVTEQ ON BOARD are trademarks of NAVTEQ. © 2009 Tele Atlas North America, Inc. All rights reserved. Tele Atlas and Tele Atlas North America are trademarks of Tele Atlas, Inc. © 2009 by Applied Geographic Systems. All rights reserved.
Neighborhood Location Map
0 mi 0.2 0.4 0.6

43
DESCRIPTION OF THE SITE
Various Airport Parcels ranging from 1 to 10 acres. Located at the Charlotte County Airport, Punta Gorda, FL 33982 Area The subject sites typically range in size from 1-10 acres with some parcels located actually adjacent to the airport with access to the runway and some of the parcels located within the Airport Authority Park located in proximity to the airport. Access The subject sites are accessed via several roadways in proximity to the Charlotte County Airport including Piper Road, Cheney Way, Sky Lane Way, Golf Course Boulevard, Mooney Avenue and Henry Street, thus access to the site is considered good. No adverse easements or encroachments were noted at the time of inspection. However, no formal survey was provided to the appraiser. Easements No adverse easements or encroachments were noted at the time of inspection. However, no formal surveys were provided to the appraisers. Utilities & Services Water: City of Punta Gorda Sewer: None (Septic) Electricity: Florida Power & Light Telephone: CenturyLink Police & Fire: Charlotte County SUMMARY The subject site is well located in the Punta Gorda area of Charlotte County and has good overall access, as well as direct ingress/egress. The sites have requisite size and shape characteristics suitable for a variety of development alternatives, as the surrounding development indicates the ground is suitable for development.
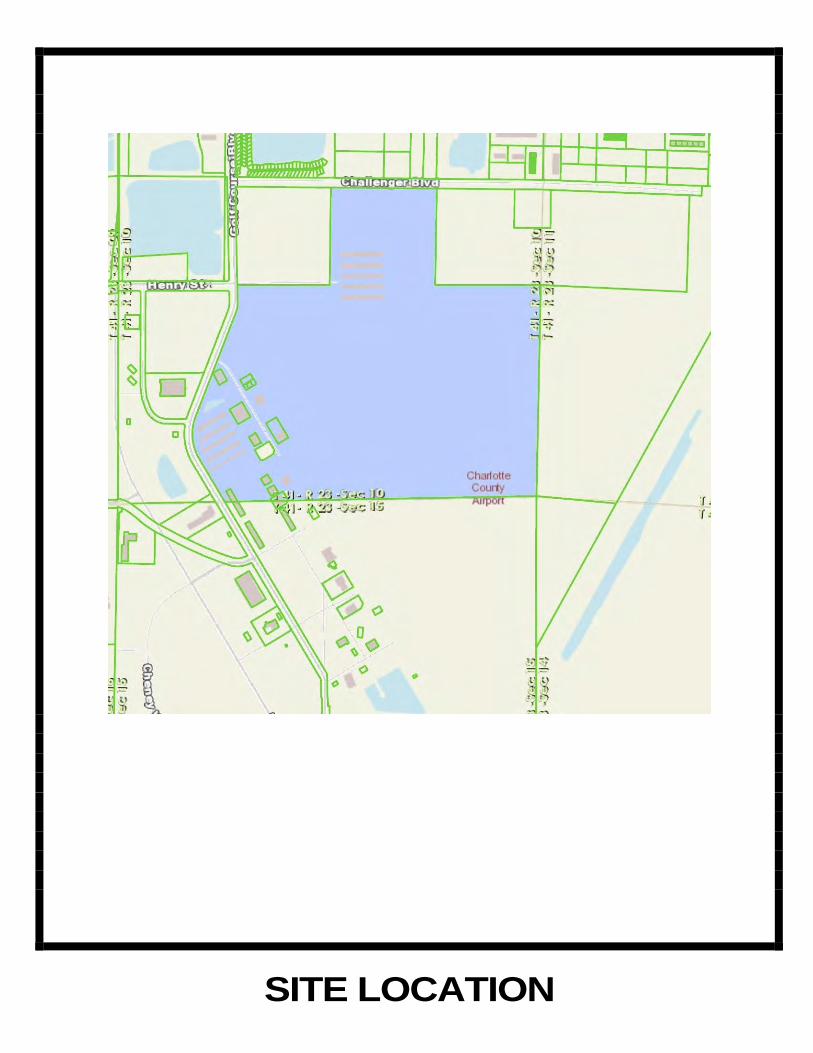
SITE LOCATION

45
AERIAL VIEW

46
HIGHEST AND BEST USE Highest and Best Use is defined as the reasonably probable and legal use of vacant land or an improved property which is physically possible, appropriately supported, financially feasible and that results in the highest value. As the foregoing definition implies, the highest and best use of a site, as if vacant, may differ from the highest and best use as improved. Estimation of highest and best use is influenced by the judgment of an appraiser and his analytical skill. The ultimate determination of highest and best use is shaped by the competitive forces within the market where the property is located. Thus, the analysis and interpretation of highest and best use is an economic study of market forces focused on the subject property. In estimating the highest and best use of the subject, consideration was given to the physical characteristics of the property, including the size and shape of the site, location, access to transportation arteries and availability of utilities. We have also considered the impact of legal considerations such as zoning, possible zoning changes, etc. Finally, economic considerations such as market conditions and the position of supply and demand are considered. Analysis of all three aspects are considered in estimating the subject's highest and best use. Highest and Best Use - As If Vacant Physical As outlined in the Site Data section of this report, the subject site appears to be physically adapted to support a wide variety of industrial improvements. Legal The subject site is zoned ECAP, Enterprise Charlotte Airport Park, by Charlotte County. Permitted uses as well as restrictions in density were outlined in the Introduction section. Your attention is directed to the Introduction section for a more complete discussion of zoning and land use. Overall, a wide variety of industrial development alternatives are legally permissible uses. Economic The subject sites are along various roadways that make up the Charlotte County Airport Authority. This is a moderately-traveled area that has had some light industrial development. Moreover, according to the 4th Quarter 2017 CoStar Industrial Survey the vacancy level for Industrial Space was 1.2%. Thus, it would appear there is sufficient demand for new industrial development. The feasible land uses would include some type of light industrial or commercial use taking advantage of the location, and the surrounding supporting development. Conclusion - As If Vacant Based upon the foregoing physical, legal and economic considerations, we have concluded that the highest and best use of the subject site, as if vacant, is for development of a good quality light industrial project one market conditions improve.

47
VALUATION OF 1-5 ACRE PARCELS WITH AND WITHOUT AIRPORT ACCESS

48
METHOD OF APPRAISAL Real estate is usually appraised using at least three separate estimates of “approaches” to value. With these approaches, the appraiser attempts to look at the property from all points of view. The Cost Approach to Value looks at the property from the standpoint of what it would cost to build new in the market today. This approach usually starts with an estimate of what it would cost to either reproduce or replace the subject improvements in the market today. Any accrued depreciation is then subtracted from the reproduction or replacement cost estimate. Finally, the value of the land is added to the depreciated reproduction or replacement cost of the improvements. The Cost Approach is based on the principle of substitution which states, when applied to the Cost Approach, that a reasonable person would not be justified in paying more for a piece of improved property than he could build it for today. The Income Approach to Value looks at the property through the eyes of a typical investor who is probably buying it for its income-producing capabilities. In this approach the typical income and expense patterns are analyzed, and the net income is capitalized into an indication of value using a rate of investment return typical in the market for an investment with the attributes of the subject. The Market, or Sales Comparison Approach, to Value compares the total subject property with recent sales of similar properties. This method utilizes the choices available to buyers in the market at the time of the appraisal and also reflects the principle of substitution. The three separate indications of value are correlated into a final conclusion of value based on the relative strengths and weaknesses of each approach as it applies to the subject property, as determined by the appraiser’s judgment and experience. We did not apply the cost or income approaches because they were not considered applicable to arrive at credible results. The subject properties of the appraisal are comprised of tracts of land located in proximity to the Charlotte County Airport Authority; therefore we applied only the sales comparison approach to value. This approach is considered necessary for credible results given the intended use, property characteristics and type of value sought.

49
SALES COMPARISON APPROACH TO VALUE The Sales Comparison approach to value is a method of estimating market value whereby a subject property is compared with similar properties in close proximity to the subject that have sold recently. One premise for this approach is that the market will determine a price for a property being appraised in the same manner that it determines the prices for comparable, competitive properties. This is a systematic method of carrying out comparative shopping and the comparison is applied to the unique characteristics of real estate that cause prices to vary. The following comparables are listed independently on separate sales sheets and later adjusted for any dissimilarities to the subject in the Analysis section of this report. The principle of substitution maintains that the value of a property that is replaceable in the market tends to be set by the cost of acquiring an equally desirable substitute property. The Sales Comparison Approach, which is based on this principle, is often the most reliable approach to the value of real estate. However, when substitute properties are not available in the market, the reliability of the sales comparison approach may be less than that of other approaches to value. Basic economic factors such as supply, demand, and equilibrium play a major role in the determining of value as of a particular date. For example, with reference to the demand for real estate, the number of potential users of a particular property type, their financial capacity, their tastes and preferences are al considered pertinent to value. Shifts in any of these elements can cause prices to vary, and thus would necessitate adjustments for dissimilarities. When applying the sales comparison approach, the appraiser generally adheres to the following procedure.
1. The competitive market for the subject is researched to obtain information about transactions, listings, and other offerings of property similar to the subject.
2. The information gathered is then verified to determine the accuracy and reliability of
the data obtained.
3. A unit or units of comparison (i.e. price per acre or square foot, front foot or unit, etc.) is selected. Price indications are then adjusted and applied to the respective number of units of comparison associated with the subject.
4. The multiple value indications that result from the adjusted units of comparison are
then reconciled into a single value estimate. The sales comparables used in our valuation of the subject are contained on the following pages.

50
Land Sale No. 1
Property Identification Record ID 2926 Property Type Industrial, Vacant Industrial Property Name Vacant Industrial Land Address 7581-7591 Sawyer Circle, Port Charlotte, Charlotte County, Florida
33981 Location Lot 5 & 6, block 5359 of Third Replat of Port Charlotte Subdivision,
Section 95 Tax ID 412108406011 & 412108406012 MSA Suburban Market Type Vacant Industrial Sale Data Grantor Ballapuram G. & Meera Adhinarayanan TR Grantee Jarrell Iacoma et al Closing Date November 22, 2017 Deed Book/Page 4257/665 Recorded Plat Pk 16, Pgs 54A-54E Property Rights Fee Simple Conditions of Sale Cash to seller. Sale History No prior sales noted over three year sales search. Verification Jarrell Iacoma Contract Price $120,000 Cash Equivalent $120,000

51
Land Sale No. 1 (Cont.)
Land Data Zoning IG, Industrial General Topography Level at road grade. Utilities Water, Electric, Sewer, Telephone Shape Mostly Rectangular Land Size Information Gross Land Size 1.422 Acres or 61,930 SF Front Footage 205 ft Sawyer Cir; Indicators Sale Price/Gross Acre $84,405 Sale Price/Gross SF $1.94 Remarks The site contains 61,930 square feet or 1.422 acres of land. The site has not been cleared and has utilities. Located on the south side of Sawyer Circle, west of Gasparilla Road in Port Charlotte. Zoned IG by Charlotte County.

52
Land Sale No. 2
+
Property Identification Record ID 2997 Property Type Industrial, Vacant Industrial Acreage Property Name Airport Commerce Center Address 000 Woodlawn Drive, Punta Gorda, Charlotte County, Florida Location Lots 3 and 4, Block C, Woodland Acres Tax ID 412314400026 Sale Data Grantor Polk Family II, LLC Grantee Poseidon Venture Group, LLC Sale Date April 24, 2018 Deed Book/Page 4307/2174 Recorded Plat PB 1, PG 59 Property Rights Fee Simple Marketing Time 1,460 DOM Financing Cash to Seller Sale History No prior sales noted over three year search. Verification Chuck Thomas//Broker/Maxim Commercial Real Estate ; 941-621-
2202 Sale Price $337,000 Cash Equivalent $337,000

53
Land Sale No. 2 (Cont.)
Land Data Zoning ECAP, Enterprise Charlotte Airport Park Topography Level at Road Grade Shape Rectangular Land Size Information Gross Land Size 4.64 Acres or 202,118 SF Front Footage 660 ft Woodlawn; 330 ft Duffie; + Indicators Sale Price/Gross Acre $72,629 Sale Price/Gross SF $1.67 Remarks The comparable site contains 217,800 square feet or 4.64 acres of land. The site has been cleared. Located in the Airport Commerce Park on the northwest corner of Woodlawn and Duffie Dr in Punta Gorda. Zoned ECAP by Charlotte County.

54
Land Sale No. 3.
Property Identification Record ID 2799 Property Type Industrial, Industrial Property Name Vacant Industrial Land Address 7001 Commerce Pkwy or 28290 Challenger Blvd, Punta Gorda,
Charlotte County, Florida 33982 Location Charlotte County Park of Commerce Lot 47 Tax ID 412311102001 MSA Urban Market Type Vacant Industrial Sale Data Grantor BIGM Properties, LLC Grantee 28290 Challenger Boulevard, LLC Sale Date March 10, 2017 Deed Book/Page 4182/1496 Recorded Plat PB 19, PG 10 Property Rights Fee Simple Marketing Time 1,888 DOM Financing Cash to Seller Sale History No prior qualified sales within a three year search. Verification Ronald Struthers, Coldwell Banker/Broker; 941-487-2100 Sale Price $107,000 Cash Equivalent $107,000

55
Land Sale No. 3 (Cont.)
Land Data Zoning ECAP, Charlotte County, Enterprise Charlotte Airport Park Topography Level at Road Grade Utilities Electric and Telephone Shape Rectangular Landscaping Cleared Land Size Information Gross Land Size 2.026 Acres or 88,253 SF Indicators Sale Price/Gross Acre $52,813 Sale Price/Gross SF $1.21 Remarks The comparable site is Vacant Industrial Land with a total of 2.026 acres or 88,253 SF. The site has been cleared and has utilities. It is located on the east side of Commerce Pkwy in Punta Gorda, just north of Challenger Blvd. Zoned ECAP by Charlotte County.
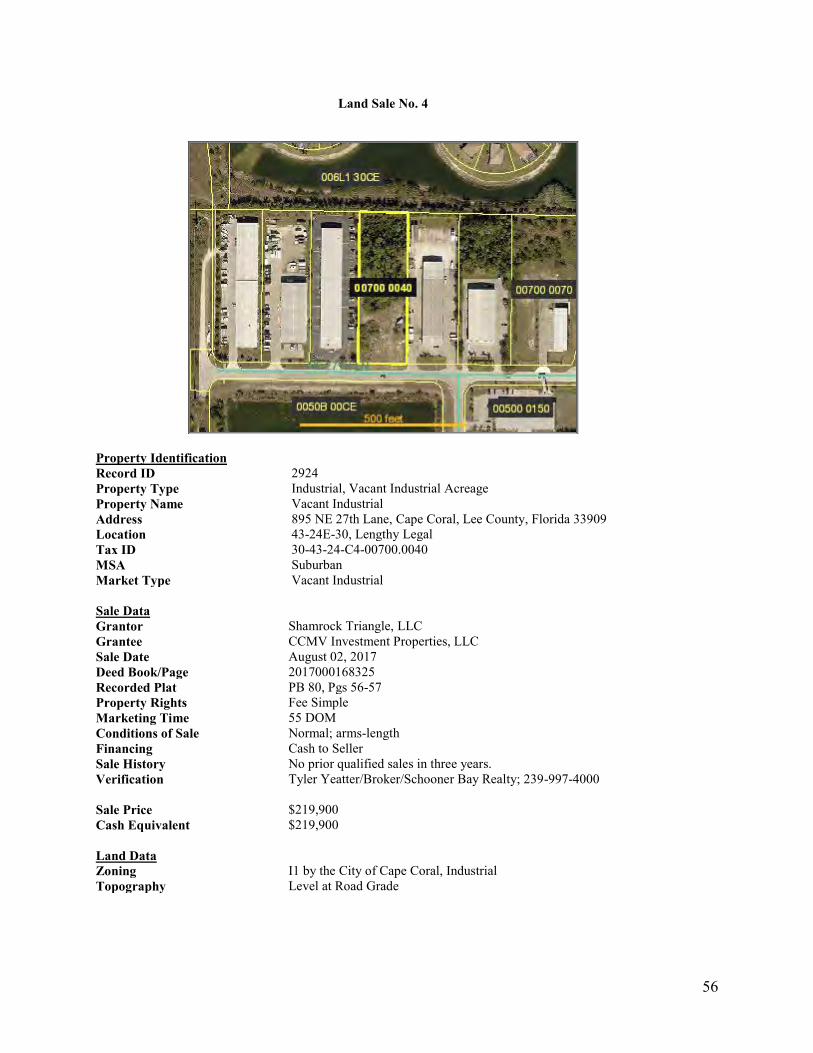
56
Land Sale No. 4
Property Identification Record ID 2924 Property Type Industrial, Vacant Industrial Acreage Property Name Vacant Industrial Address 895 NE 27th Lane, Cape Coral, Lee County, Florida 33909 Location 43-24E-30, Lengthy Legal Tax ID 30-43-24-C4-00700.0040 MSA Suburban Market Type Vacant Industrial Sale Data Grantor Shamrock Triangle, LLC Grantee CCMV Investment Properties, LLC Sale Date August 02, 2017 Deed Book/Page 2017000168325 Recorded Plat PB 80, Pgs 56-57 Property Rights Fee Simple Marketing Time 55 DOM Conditions of Sale Normal; arms-length Financing Cash to Seller Sale History No prior qualified sales in three years. Verification Tyler Yeatter/Broker/Schooner Bay Realty; 239-997-4000 Sale Price $219,900 Cash Equivalent $219,900 Land Data Zoning I1 by the City of Cape Coral, Industrial Topography Level at Road Grade

57
Land Sale No. 4 (Cont.)
Utilities Utilities Available Shape Rectangular Landscaping Native Land Size Information Gross Land Size 1.552 Acres or 67,587 SF Front Footage 147 ft NE 27th Lane; Indicators Sale Price/Gross Acre $141,726 Sale Price/Gross SF $3.25 Remarks The comparable site is a vacant Industrial parcel comprised of 1.552 acres or 67,587 SF. The property has frontage along NE 27th Lane. The comparable has been partially cleared. Located on the north side of NE 27th Lane in Cape Coral. Zoned I1 by the City of Cape Coral.

58
Land Sale No. 5
Property Identification Record ID 3035 Property Type Industrial/Commercial, Vacant Commercial Land Property Name Vacant Industrial Land Address 23432 Janice Avenue, Port Charlotte, Charlotte County, Florida 33980 Location 25-40-22 / Whidden Industrial Park/Lengthy Legal Tax ID 402225203001 MSA Suburban Market Type Industrial Sale Data Grantor DWPCFLA, LLC Grantee Omar Almeida Hernandez Sale Date March 21, 2018 Deed Book/Page BK 4297 PG 257 Recorded Plat BK 15 PG 23 Property Rights Fee Simple Marketing Time 1,053 DOM Financing Cash to Seller Sale History No prior sales. in a three year search Verification Ronald Struthers/Coldwell Banker Commercial NRT; 941-769-3316 Sale Price $230,000 Cash Equivalent $230,000

59
Land Sale No. 5 (Cont.) Land Data Zoning IG > Industrial/General, Industrial Topography Level at road grade. Utilities All public utilities are available. Shape Rectangular Land Size Information Gross Land Size 2.440 Acres or 106,286 SF Indicators Sale Price/Gross Acre $94,263 Sale Price/Gross SF $2.16 Remarks This comparable is an industrial vacant parcel with 106,286 square feet or 2.440 acres. Located in Whidden Industrial Park off Harborview Road between Tamiami Trail and I-75. Serviced by Charlotte Harbor Utilities for water. This parcel sold on 3/21/2018 for $230,000 or $94,263/acre of land. Zoned IG, Charlotte County.

60
Land Sale No. 6
Property Identification Record ID 3036 Property Type Industrial, Vacant Industrial Property Name Vacant Industrial Land Address 500 Paul Morris Drive, Englewood, Sarasota County, Florida 34223 Location 29-40S-20E, LOT 85/ Morris Industrial Park MSA Urban Market Type Vacant Industrial Sale Data Grantor Builders Lots, LLC Grantee Engelwood Alliance, LLC Sale Date May 07, 2018 Deed Book/Page 2018061447 Recorded Plat BK 28 PG 18 Property Rights Fee Simple Financing Cash to Seller Sale History No prior sales noted over a three year search period. Verification Bruce Thompson/Concordia Realty, LLC; 850-573-2063 Sale Price $135,000 Cash Equivalent $135,000 Land Data Zoning PID Planned Industrial Development by Sarasota County Topography Level at road grade Utilities Electric, Telephone, Water

61
Land Sale No. 6 (Cont.)
Shape Rectangular Land Size Information Gross Land Size 1.732 Acres or 75,466 SF Indicators Sale Price/Gross Acre $77,924 Sale Price/Gross SF $1.79 Remarks The site contains 75,466 square feet or 1.732 acres of land. The parcel is located in Morris Industrial Park and sold on 5/7/2018 for $135,000 or $77,924/acre. Zoned PID, Sarasota County.

62
Land Sale No. 7
Property Identification Record ID 3038 Property Type Industrial, Vacant Industrial Property Name Vacant Industrial+ Address 8429 Northup Drive/ Corner of Northup & Woodlawn, Punta Gorda,
Charlotte County, Florida 33982 Location WOODLAND ACRES BLK G LTS 2 & 4/ Lengthy Legal Tax ID 412314400029 MSA Suburban Market Type Industrial Flex Space Sale Data Grantor Penthouse Florida, LLC/C Barbara Laishley Grantee Amigo Pallets, Inc. Sale Date September 21, 2018 Recorded Plat 14-41-23 Deed Book/Page 4369/635 Property Rights Fee Simple Financing Regular Arm's -Length Transaction Sale History No sales transpired within 3-year search. Verification Bruce Laishley; 941-875-4783 Contract Price $347,700 Cash Equivalent $347,700 Land Data Zoning ECAP, Enterprise Charlotte Airport Park by Charlotte County Topography Level at Road Grade Utilities All utilities available. Shape Rectangular

63
Land Sale No. 7 (Cont.)
Land Size Information Gross Land Size 3.75 Acres or 163,350 SF Indicators Sale Price/Gross Acre $92,720 Sale Price/Gross SF $2.13 Remarks The sale property is located at the northwest corner of Northup Drive and Woodlawn Drive in the Airport Commerce Center, an industrial park in Punta Gorda. The Airport Commerce Center is located east of Piper Road and north of Jones Loop Road, adjacent to the Charlotte County Airport. It contains a gross area of 163,350 SF or 3.75 acres. Zoned ECAP by Charlotte County.

64
Land Sale No. 8
Property Identification Record ID 3091 Property Type Commercial, Vacant Commercial Property Name Vacant Industrial Land Address 3921 Taylor Road, Punta Gorda, Charlotte County, Florida 33950 Location 21-41-23 Lengthy Legal Tax ID 412321101007 MSA Suburban Market Type Vacant commercial Sale Data Grantor Glenn E. Shows Grantee Taylor Coach Caves LLC Sale Date August 31, 2018 Deed Book/Page 4354/1017 Property Rights Fee Simple Conditions of Sale Normal; arms-length transaction. Financing Cash to Seller Sale History No prior qualified sales in last three years Verification Robert Boehm/Broker/RE/MAX Harbor Realty; 941-639-8500 Sale Price $150,000 Cash Equivalent $150,000

65
Land Sale No. 8 (Cont.)
Land Data Zoning IG, Charlotte County, Industrial General Topography Level at street grade Shape Irregular Landscaping Partially Cleared with Native Vegetation Land Size Information Gross Land Size 5.200 Acres or 226,512 SF Uplands Land Size 2.146 Acres or 93,495 SF , 41.28% Unusable Land Size 3.054 Acres or 133,017 SF , 58.72% Front Footage 339 ft Taylor Road; Indicators Sale Price/Gross Acre $28,846 Sale Price/Gross SF $0.66 Sale Price/Uplands Acre $69,886 Sale Price/Uplands SF $1.60 Remarks The comparable property is a vacant commercial parcel comprised of 5.20 acres 226,512 SF. The site is partially cleared. 3.054 acres (58.72%) is submerged land area. The sale was for $150,000 or $1.60 per square foot for the upland area. Located on the south side of Taylor Road, just south of Scenic View Drive in Punta Gorda. Zoned IG by Charlotte County.
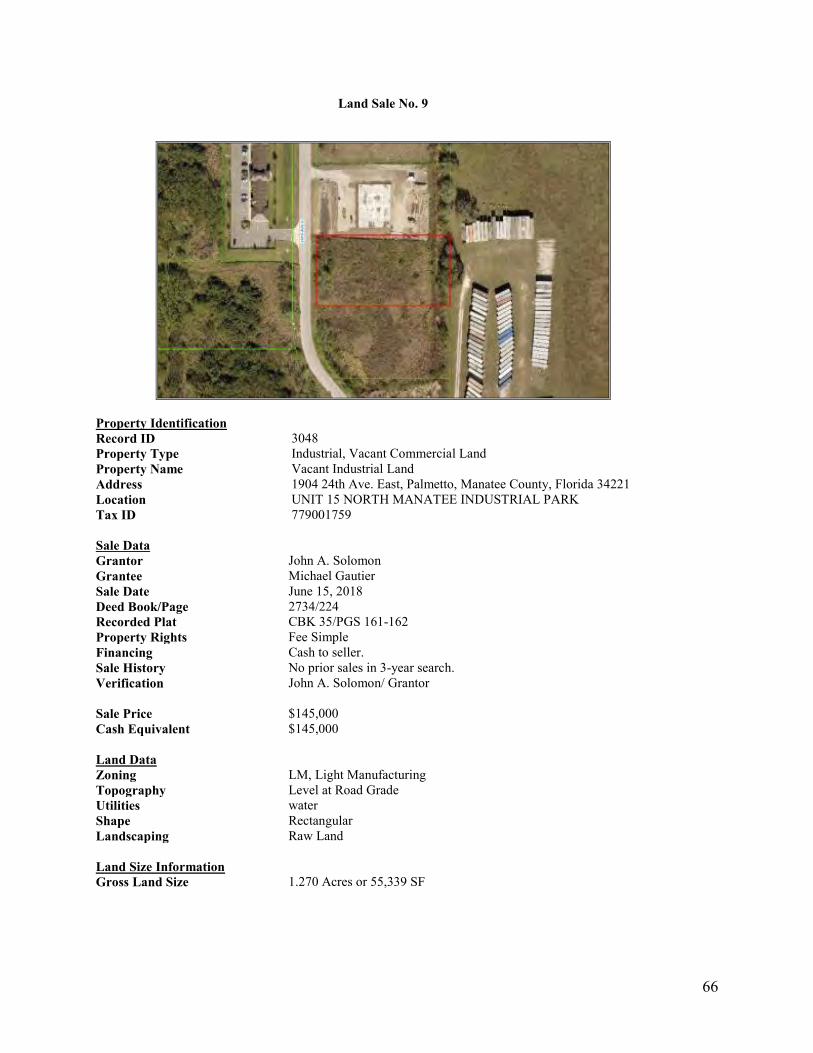
66
Land Sale No. 9
Property Identification Record ID 3048 Property Type Industrial, Vacant Commercial Land Property Name Vacant Industrial Land Address 1904 24th Ave. East, Palmetto, Manatee County, Florida 34221 Location UNIT 15 NORTH MANATEE INDUSTRIAL PARK Tax ID 779001759 Sale Data Grantor John A. Solomon Grantee Michael Gautier Sale Date June 15, 2018 Deed Book/Page 2734/224 Recorded Plat CBK 35/PGS 161-162 Property Rights Fee Simple Financing Cash to seller. Sale History No prior sales in 3-year search. Verification John A. Solomon/ Grantor Sale Price $145,000 Cash Equivalent $145,000 Land Data Zoning LM, Light Manufacturing Topography Level at Road Grade Utilities water Shape Rectangular Landscaping Raw Land Land Size Information Gross Land Size 1.270 Acres or 55,339 SF

67
Land Sale No. 9 (Cont.) Indicators Sale Price/Gross Acre $114,137 Sale Price/Gross SF $2.62 Remarks This comparable vacant parcel contains 1.27 acres or 55,339 SF of raw land. The parcel is located within the North Manatee Industrial Park. Zoned LM (light manufacturing), Manatee County.

Copyright © and (P) 1988–2009 Microsoft Corporation and/or its suppliers. All rights reserved. http://www.microsoft.com/streets/Certain mapping and direction data © 2009 NAVTEQ. All rights reserved. The Data for areas of Canada includes information taken with permission from Canadian authorities, including: © Her Majesty the Queen in Right of Canada, © Queen's Printer for Ontario. NAVTEQ and NAVTEQ ON BOARD are trademarks of NAVTEQ. © 2009 Tele Atlas North America, Inc. All rights reserved. Tele Atlas and Tele Atlas North America are trademarks of Tele Atlas, Inc. © 2009 by Applied Geographic Systems. All rights reserved.
Land Sales Location Map, 1-5 Acres
0 mi 2 4 6 8 10

Copyright © and (P) 1988–2009 Microsoft Corporation and/or its suppliers. All rights reserved. http://www.microsoft.com/streets/Certain mapping and direction data © 2009 NAVTEQ. All rights reserved. The Data for areas of Canada includes information taken with permission from Canadian authorities, including: © Her Majesty the Queen in Right of Canada, © Queen's Printer for Ontario. NAVTEQ and NAVTEQ ON BOARD are trademarks of NAVTEQ. © 2009 Tele Atlas North America, Inc. All rights reserved. Tele Atlas and Tele Atlas North America are trademarks of Tele Atlas, Inc. © 2009 by Applied Geographic Systems. All rights reserved.
Land Sales Location Map II, 1-5 Acres
0 mi 5 10 15 20

70
LAND COMPARABLES ANALYSIS SUMMARY
Subject Comp 1 Comp 2 Comp 3 Comp 4 Comp 5 Comp 6 Comp 7 Comp 8 Comp 9
Date 11/17 4/18 3/17 8/17 3/18 5/18 9/18 8/18 6/18
Price $120,000 $337,000 $107,000 $219,900 $230,000 $135,000 $347,700 $150,000 $145,000
Price/S.F. $1.94 $1.67 $1.21 $3.25 $2.16 $1.79 $2.13 $1.60 $2.62
Square Feet 43,560 - 217,800 61,930 202,118 88,253 67,587 106,286 75,466 163,350 93,495 55,339
Acres 1-5 1.422 4.64 2.026 1.552 2.44 1.732 3.75 2.146 1.27
Adjustments:
Financing Cash\Equiv. Cash Cash Cash Cash Cash Cash Cash Cash Cash
Cond. of Sale Normal Normal Normal Normal Normal Normal Normal Normal Normal Normal
Time Current Current Current Current Current Current Current Current Current Current
Time/Cond./Fin. Adjusted: 0.00% 0.00% 0.00% 0.00% 0.00% 0.00% 0.00% 0.00% 0.00%
Price/S.F. $1.94 $1.67 $1.21 $3.25 $2.16 $1.79 $2.13 $1.60 $2.62
Location Good Similar Similar Similar Similar Similar Similar Similar Similar Similar
0.00% 0.00% 0.00% 0.00% 0.00% 0.00% 0.00% 0.00% 0.00%
Physical (No. Gross S.F.) 43,560 - 217,800
Similar Similar Similar Similar Similar Similar Similar Similar Similar
0.00% 0.00% 0.00% 0.00% 0.00% 0.00% 0.00% 0.00% 0.00%
Zoning ECAP Similar Similar Similar Similar Similar Similar Similar Similar Similar
0.00% 0.00% 0.00% 0.00% 0.00% 0.00% 0.00% 0.00% 0.00%
Access Good Similar Similar Similar Similar Similar Similar Similar Similar Similar
0.00% 0.00% 0.00% 0.00% 0.00% 0.00% 0.00% 0.00% 0.00%
Utilities None Similar Similar Similar Similar Similar Similar Similar Similar Similar
0.00% 0.00% 0.00% 0.00% 0.00% 0.00% 0.00% 0.00% 0.00%
Net Adjustments 0.00% 0.00% 0.00% 0.00% 0.00% 0.00% 0.00% 0.00% 0.00%
Adjusted Price/S.F. $1.94 $1.67 $1.21 $3.25 $2.16 $1.79 $2.13 $1.60 $2.62
The foregoing represents the most recent industrial land sale activity that has taken place over the past twenty two (22) months. The unadjusted prices are in the $1.21 to $3.25/S.F. range, while an explanation of the adjustments to these sales in comparison to the subject is as follows.

71
Land Sales Analysis (Cont’d) Date of Sale (Time) The comparable sales used in the analysis have taken place over the past twenty two (22) months with a range of sale dates as old as March 2017 and as recent as September 2018. In order to derive or extract the appropriate time adjustment, the analyst would need to use re-sales of comparable vacant sites, subtracting the prior sale from the most recent, to measure the amount of appreciation or depreciation. This amount is then divided by the first sale price and then by the number of months between sales to derive the average monthly rate of change. During verification and researching of the comparable sales, no recent prior sales were found from which a reliable rate of change within the market for the period in question could be extracted. However, in lieu of making an unsupported time adjustment across the board, the more recent sales were given most emphasis. Location Adjustments: Adjustments were made for market factors such as proximity to shopping facilities and other commercial developments, traffic volumes, ease of access, existence of complementary land uses, and demographic characteristics surrounding the market area. The subject sites typically range in size from 1-5 acres with some parcels located actually adjacent to the airport with access to the runway and some of the parcels located within the Airport Authority Park located in proximity to the airport. Physical Adjustments (Size): The subject sites valued in this section of the report range from 1 acre to 5 acres. The comparables ranged from 55,339 S.F. to 202,118 S.F. Adjustments pertaining to parcel size are generally based on the real estate axiom stating that the unit price is inversely related to total size. Accordingly, as size of the parcel increases, its unit (price per square foot) price decreases. As smaller sites require a smaller capital investment, there tends to be potential investors for smaller sites. The higher demand should tend to drive per unit prices up. Similarly, as commodities produced in our economy in general tend to sell for less on a unit basis as the number of units increase, it would be reasonable to expect smaller sites to sell for more per square foot than larger sites. When analyzing and pairing the sales, a distinct correlation could be made between sales price per square foot and size. No adjustments were made to comparables per se; however, the values of the subject sites will be adjusted based on their size with the smaller sites valued at a higher price per S.F. than the larger sites. Zoning: The subject is zoned ECAP, Enterprise Charlotte Airport Park, by Charlotte County. All of the comparables were sufficiently similar in regards to zoning classifications and did not warrant any adjustments.

72
Land Sales Analysis (Cont’d) Access: The subject sites are accessed via several roadways in proximity to the Charlotte County Airport including Piper Road, Skylane Way, Golf Course Boulevard, Mooney Avenue, Henry Street, thus access to the site is considered good. The comparables were considered to possess similar access. Utilities: There is water to the subject site. No adjustments were considered warranted. Conclusion: Additionally, the appraiser is aware of the following listings in the subject’s neighborhood.
Address Land Acres
List Price Price Per SF
Zoning Comments
Woodlawn Dr, Punta Gorda
4.70 $920,000 $4.49 ECAP 4.7 acre parcel or 204,732 SF of vacant industrial land. Corner site within Airport Commerce Center. There are 320.58 lineal feet of road frontage on its south side. Water, sewer and off-site storm-water retention in place. Listed @ $920,000 or $4.49/SF. Zoned ECAP.
28521 Pablo Rd, Punta Gorda
2.03 $179,900 $2.03 ECAP 2.03 acres or 88,427 SF of vacant industrial land. The site has been cleared and utilities are in place. Located in Airport Commerce Park. Listed @ $179,900 or $2.03/SF. Zoned ECAP.
25595 Marion Ave., Punta Gorda
2.70 $399,000 $3.39 CG, IG 2.70 acre parcel or 117,612 SF of vacant industrial land w/ rail access. Two parcels, one is .25 +/- acres, the other is 2.7 +/- acres. Listed @ $399,000 or $3.39/SF. Zoned CG, IG.
Northrup Dr., Punta Gorda
2.18 $189,900 $2.00 ECAP 2.18 acres or 94,961 SF of vacant industrial land. Located in Airport Commerce Park. Listed @ $189,900 or $2.00/SF. Zoned ECAP.
27445 Challenger Blvd, Punta Gorda
5.00 $650,000 $2.98 ECAP 5.00 acres or 217,800 SF of vacant industrial land. Site has 330’ of frontage along Challenger Blvd. Listed @ $650,000 or $2.98/SF. Zoned ECAP.
5441 Constitutional Ave., Punta Gorda
1.46 $275,000 $4.32 IG 1.46 acres or 63,598 SF of vacant industrial land. Located in the 1775 Industrial Park located along Duncan Rd. (Hwy 17). Listed @ $275,000 or $4.32/SF. Zoned IG.
8284 Duffie Dr., Punta Gorda
4.57 $850,000 $4.27 ECAP 4.57 acres or 199,062 SF of vacant industrial land. Located in Airport Commerce Park. Listed @ $850,000 or $4.27/SF. Zoned ECAP.

73
Land Sales Analysis (Cont’d) The listings range from $2.00 per square foot to $4.49 per square foot for commercial and industrial sites located in proximity to the subject property. Several of the listings are located in the industrial parks located just north and south of the Airport (Airport Commerce Center and Charlotte County Park of Commerce) and have been on the market for over a year. All of the land sales used in the foregoing analysis was taken from the Charlotte and the Southwest Florida Market areas. They all occurred within the last twenty two (22) months and for the most part are competitive comparable land sales of commercial and industrial sites. After adjusting the comparables for their dissimilarities, the adjusted sales prices ranged from $1.21 to $3.25 per square foot. The predominant range of the sales was from $1.60 to $2.62 per S.F. After an intensive analysis of the comparable sales and reviewing the current listings, the final values were estimated as follows:
Location Size Estimate Value per S.F.
Airport Access 1.00 Acre $2.50 Non- Access 1.00 Acre $1.90
Airport Access 2.00 Acre $2.50 Non- Access 2.00 Acre $1.90
Airport Access 3.00 Acre $2.50 Non- Access 3.00 Acre $1.90
Airport Access 4.00 Acre $2.25 Non- Access 4.00 Acre $1.70
Airport Access 5.00 Acre $2.25 Non- Access 5.00 Acre $1.70

74
VALUATION OF 6-10 ACRE PARCELS WITH AND WITHOUT AIRPORT ACCESS

75
METHOD OF APPRAISAL Real estate is usually appraised using at least three separate estimates of “approaches” to value. With these approaches, the appraiser attempts to look at the property from all points of view. The Cost Approach to Value looks at the property from the standpoint of what it would cost to build new in the market today. This approach usually starts with an estimate of what it would cost to either reproduce or replace the subject improvements in the market today. Any accrued depreciation is then subtracted from the reproduction or replacement cost estimate. Finally, the value of the land is added to the depreciated reproduction or replacement cost of the improvements. The Cost Approach is based on the principle of substitution which states, when applied to the Cost Approach, that a reasonable person would not be justified in paying more for a piece of improved property than he could build it for today. The Income Approach to Value looks at the property through the eyes of a typical investor who is probably buying it for its income-producing capabilities. In this approach the typical income and expense patterns are analyzed, and the net income is capitalized into an indication of value using a rate of investment return typical in the market for an investment with the attributes of the subject. The Market, or Sales Comparison Approach, to Value compares the total subject property with recent sales of similar properties. This method utilizes the choices available to buyers in the market at the time of the appraisal and also reflects the principle of substitution. The three separate indications of value are correlated into a final conclusion of value based on the relative strengths and weaknesses of each approach as it applies to the subject property, as determined by the appraiser’s judgment and experience. We did not apply the cost or income approaches because they were not considered applicable to arrive at credible results. The subject properties of the appraisal are comprised of tracts of land located in proximity to the Charlotte County Airport Authority; therefore we applied only the sales comparison approach to value. This approach is considered necessary for credible results given the intended use, property characteristics and type of value sought.

76
SALES COMPARISON APPROACH TO VALUE The Sales Comparison approach to value is a method of estimating market value whereby a subject property is compared with similar properties in close proximity to the subject that have sold recently. One premise for this approach is that the market will determine a price for a property being appraised in the same manner that it determines the prices for comparable, competitive properties. This is a systematic method of carrying out comparative shopping and the comparison is applied to the unique characteristics of real estate that cause prices to vary. The following comparables are listed independently on separate sales sheets and later adjusted for any dissimilarities to the subject in the Analysis section of this report. The principle of substitution maintains that the value of a property that is replaceable in the market tends to be set by the cost of acquiring an equally desirable substitute property. The Sales Comparison Approach, which is based on this principle, is often the most reliable approach to the value of real estate. However, when substitute properties are not available in the market, the reliability of the sales comparison approach may be less than that of other approaches to value. Basic economic factors such as supply, demand, and equilibrium play a major role in the determining of value as of a particular date. For example, with reference to the demand for real estate, the number of potential users of a particular property type, their financial capacity, their tastes and preferences are al considered pertinent to value. Shifts in any of these elements can cause prices to vary, and thus would necessitate adjustments for dissimilarities. When applying the sales comparison approach, the appraiser generally adheres to the following procedure.
1. The competitive market for the subject is researched to obtain information about transactions, listings, and other offerings of property similar to the subject.
2. The information gathered is then verified to determine the accuracy and reliability of
the data obtained. 3. A unit or units of comparison (i.e. price per acre or square foot, front foot or unit, etc.)
is selected. Price indications are then adjusted and applied to the respective number of units of comparison associated with the subject.
4. The multiple value indications that result from the adjusted units of comparison are
then reconciled into a single value estimate.
The sales comparables used in our valuation of the subject are contained on the following pages.

77
Land Sale No. 1
Property Identification Record ID 3088 Property Type Vacant land, Vacant Industrial Property Name Vacant Industrial Address 5331-5351 Woodfield Rd, Placida, Charlotte County, Florida 33946 Location LBG 002 0000 018A-0018, ZZZ204121 P7 Short Legal Tax ID 412120302003,412120302002,41210302004 MSA Suburban Market Type Vacant Industrial Sale Data Grantor Rotonda-Lakes II Limited Partnership Grantee Marcoaldi Management LLC Sale Date December 03, 2018 Deed Book/Page 4386/481 Recorded Plat PB 3, PG 17 Property Rights Fee Simple Marketing Time 4,339 DOM Financing Cash to seller Sale History No prior sales within 3 year search. Verification Sage Andress/Broker/Sunmark Realty, Inc; 813-416-4254 Sale Price $830,000 Cash Equivalent $830,000

78
Land Sale No. 1 (Cont.)
Land Data Zoning IL Charlotte County, Industrial Light Topography Level Utilities Septic/Electric/Water/Telephone Shape Rectangular Land Size Information Gross Land Size 8.770 Acres or 382,021 SF Front Footage 604 ft Woodfield Rd; 660 ft Gasparilla Rd; Indicators Sale Price/Gross Acre $94,641 Sale Price/Gross SF $2.17 Remarks The comparable contains three parcels for a total of 8.770 acres or 382,021 SF. The site had been partially cleared. The sale was for three parcels for $830,000 or $2.17 per square foot. Located on the southwest corner of Woodfield Rd and Gasparilla Rd in Placida. Zoned IL by Charlotte County.

79
Land Sale No. 2
Property Identification Record ID 3110 Property Type Industrial, Vacant Industrial Property Name Vacant Industrial Land Address 1851 Whitfield Ave., Sarasota, Manatee County, Florida 34243 Location 35S -18E -19/ Lengthy Legal Tax ID 1868700004 MSA Suburban Market Type Vacant Industrial Sale Data Grantor Florida Power & Light Company Grantee Sidewalk Properties 2, LLC Sale Date November 01, 2018 Deed Book/Page 2755/4874 Recorded Plat BK 16/PG 46 Property Rights Fee Simple Conditions of Sale Cash to seller. Sale History No prior qualified sales over three year search Verification Fred Kolb/Colliers International Southwest Florida; 239-985-8081 Sale Price $1,100,000 Cash Equivalent $1,100,000 Land Data Zoning HM by Manatee County, Heavy Manufacturing Topography Level at road grade. Utilities All Utilities Available Shape Rectangular Landscaping Cleared Land Size Information Gross Land Size 7.510 Acres or 327,136 SF

80
Land Sale No. 2 (Cont.)
Indicators Sale Price/Gross Acre $146,471 Sale Price/Gross SF $3.36 Remarks The comparable site is industrial land which consists of 7.51 acres or 327,136 SF. There is a 200,000 SF asphalt- paved lot on the site. This property sold on Nov. 1, 2018 for $1,100,000 or $3.36/SF. Zoned HM by Manatee County.

81
Land Sale No. 3
Property Identification Record ID 3047 Property Type Industrial/Commercial, Vacant Commercial Land Property Name Vacant Industrial Land Address 6925 28th Street Ct E, Sarasota, Manatee County, Florida 34243 Location SOUTHWEST COUNTY/ Sect. 29, Twnshp 35S, Rge 18E Tax ID 1971600000 MSA Suburban Sale Data Grantor Peter Kreissle Grantee Group Genie Corp. Sale Date December 21, 2017 Deed Book/Page 2707/1-2 Recorded Plat BK 115/PG 745 Property Rights Fee Simple Marketing Time 770 DOM Financing Cash to seller. Sale History No prior sales in 3-year search. Verification Peter Kreissle/Grantor; 941-720-0232 Sale Price $900,000 Cash Equivalent $900,000 Land Data Zoning LM-Manatee County, Light Manufacturing Topography Level at Road Grade Utilities Electric, Phone, Water, Sewer Shape Rectangular Landscaping Raw Land Land Size Information Gross Land Size 9.100 Acres or 396,396 SF Front Footage 600 ft E 28th Street;

82
Land Sale No. 3 (Cont.)
Indicators Sale Price/Gross Acre $98,901 Sale Price/Gross SF $2.27 Remarks This comparable vacant parcel contains 9.10 acres or 396,396 SF of raw land. All utilities are available to the property. Located on the southwest corner of 28th St Ct E and Whitfield Ave in Sarasota. This property sold on Dec. 21, 2017 for $900,000 or $2.27/SF of land. Zoned LM (light manufacturing), Manatee County.

83
Land Sale No. 4
Property Identification Record ID 2778 Property Type Industrial, Vacant Industrial Property Name Vacant Industrial Land Address Pondella Rd & Westwood Dr, Cape Coral, Lee County, Florida 33909 Location 08-44S-24E, Lengthy Legal Tax ID 08-44-24-00-00005.0050 & 0010 MSA Urban Market Type Vacant Industrial Sale Data Grantor GDP Financial Recovery, LLC Grantee Honc Docks and Lifts, INC Sale Date January 25, 2017 Deed Book/Page 2017000025889 Property Rights Fee Simple Marketing Time 666 DOM Financing Cash to Seller Sale History No prior qualified sales within a three year search. Verification Charles Mayhugh, Mayhugh Realty/Broker; 239-278-4945 Sale Price $530,000 Cash Equivalent $530,000 Land Data Zoning IPD, Lee County, Industrial

84
Land Sale No. 4 (Cont.)
Topography Level at Road Grade Utilities Electric, sewer,water,telephone Shape Rectangular Landscaping Cleared Land Size Information Gross Land Size 6.180 Acres or 269,200 SF Indicators Sale Price/Gross Acre $85,761 Sale Price/Gross SF $1.97 Remarks The comparable site is Vacant Industrial Land with a total of 6.180 acres or 269,200 SF. The site has not been cleared but has utilities. It is located on the southwest corner of Pondella Rd and Westwood Dr in Cape Coral, just east of E. Industrial Cir. Zoned IPD by Lee County.

85
Land Sale No. 5
Property Identification Record ID 2978 Property Type Industrial/Commercial, Vacant Industrial Property Name Vacant Industrial Address 3539 Acline Rd, Punta Gorda, Charlotte County, Florida 33950 Location 28-41-23, Lengthy Legal Tax ID 412328251003-1006 MSA Suburban Market Type Vacant Industrial Sale Data Grantor Pam Duncan Et al Grantee TNT Southern Holdings LLC. Closing Date June 28, 2018 Deed Book/Page 4333/708 & 717 Property Rights Fee Simple Conditions of Sale Normal; arms-length transaction. Financing Cash to Seller Sale History No prior qualified sales in last three years Verification Lyn Bevis/Broker/RE/MAX Harbor Realty Inc.; 941-639-8500 Contract Price $450,000 Cash Equivalent $450,000 Land Data Zoning IG, Charlotte County, Industrial General Topography Level at street grade Utilities Water & Electric Shape Irregular

86
Land Sale No. 5 (Cont.)
Landscaping Native Land Size Information Gross Land Size 11.760 Acres or 512,265 SF Uplands Land Size 10.260 Acres or 446,926 SF, 87.25% Wetlands Land Size 1.500 Acres or 65,340 SF, 12.76% Front Footage 1,147 ft Acline Road; Indicators Sale Price/Gross Acre $38,265 Sale Price/Gross SF $0.88 Sale Price/Uplands Acre $43,860 Sale Price/Uplands SF $1.01 Remarks The comparable property is a Vacant Industrial parcel comprised of 11.760 acres or 512,265 SF. There is a total of 1.50 acres of wetlands. The comparable has not been cleared but utilities are available. The property has frontage on the south side of Acline Road, just east of Tamiami Trail in Punta Gorda. Zoned IG by Charlotte County.

87
* Land Sale No. 6
Property Identification Record ID 2780 Property Type Industrial, Vacant Industrial Property Name Vacant Industrial Land Address 2990 Van Buren Street, Fort Myers, Lee County, Florida 33912 Location Southside Gardens Blk 1 Tax ID 29-44-25-P1-00101.0070 MSA Urban Market Type Vacant Industrial Sale Data Grantor FL Star Investments, LLC Grantee DDE, LLC Sale Date February 13, 2017 Deed Book/Page 2017000037598 Recorded Plat PB 3, PG 18 Property Rights Fee Simple Marketing Time 595 DOM Financing Cash to Seller Sale History No prior qualified sales within a three year search. Verification Gary Hains, Gulf Breeze Real Estate/Broker; 239-213-1620 Sale Price $325,000 Cash Equivalent $325,000 Land Data Zoning IL, City of Fort Myers, Industrial Topography Level at Road Grade

88
Land Sale No. 6 (Cont.)
Utilities Electric, sewer,water,telephone Shape Rectangular Landscaping Partially Cleared Land Size Information Gross Land Size 5.00 Acres or 217,800 SF Front Footage 152 ft Van Buren; Indicators Sale Price/Gross Acre $65,000 Sale Price/Gross SF $1.49 Remarks The comparable site is Vacant Industrial Land with a total of 5.00 acres or 217,800 SF. The site has been partially cleared and is equipped with utilities. It is located on the west side of Van Buren St in Fort Myers, just east of Veronica S. Shoemaker Blvd. Zoned IL by the City of Fort Myers.

89
Land Sale No. 7
+
Property Identification Record ID 2997 Property Type Industrial, Vacant Industrial Acreage Property Name Airport Commerce Center Address 000 Woodlawn Drive, Punta Gorda, Charlotte County, Florida Location Lots 3 and 4, Block C, Woodland Acres Tax ID 412314400026 Sale Data Grantor Polk Family II, LLC Grantee Poseidon Venture Group, LLC Sale Date April 24, 2018 Deed Book/Page 4307/2174 Recorded Plat PB 1, PG 59 Property Rights Fee Simple Marketing Time 1,460 DOM Financing Cash to Seller Sale History No prior sales noted over three year search. Verification Chuck Thomas//Broker/Maxim Commercial Real Estate ; 941-621-
2202 Sale Price $337,000 Cash Equivalent $337,000

90
Land Sale No. 7 (Cont.)
Land Data Zoning ECAP, Enterprise Charlotte Airport Park Topography Level at Road Grade Shape Rectangular Land Size Information Gross Land Size 4.64 Acres or 202,118 SF Front Footage 660 ft Woodlawn; 330 ft Duffie; + Indicators Sale Price/Gross Acre $72,629 Sale Price/Gross SF $1.67 Remarks The comparable site contains 217,800 square feet or 4.64 acres of land. The site has been cleared. Located in the Airport Commerce Park on the northwest corner of Woodlawn and Duffie Dr in Punta Gorda. Zoned ECAP by Charlotte County.

Copyright © and (P) 1988–2009 Microsoft Corporation and/or its suppliers. All rights reserved. http://www.microsoft.com/streets/Certain mapping and direction data © 2009 NAVTEQ. All rights reserved. The Data for areas of Canada includes information taken with permission from Canadian authorities, including: © Her Majesty the Queen in Right of Canada, © Queen's Printer for Ontario. NAVTEQ and NAVTEQ ON BOARD are trademarks of NAVTEQ. © 2009 Tele Atlas North America, Inc. All rights reserved. Tele Atlas and Tele Atlas North America are trademarks of Tele Atlas, Inc. © 2009 by Applied Geographic Systems. All rights reserved.
6-10 Acres Land Sales Location Map
0 mi 10 20 30

92
LAND COMPARABLES ANALYSIS SUMMARY
Subject Comp 1 Comp 2 Comp 3 Comp 4 Comp 5 Comp 6 Comp 7
Date 12/18 11/18 12/17 1/17 6/18 2/17 4/18
Price $830,000 $1,100,000 $900,000 $530,000 $450,000 $325,000 $337,000
Price/S.F. $2.17 $3.36 $2.27 $1.97 $1.01 $1.49 $1.67
Square Feet 261,360-435,600 382,021 327,136 396,396 269,200 446,926 217,800 202,118
Acres 6-10 8.77 7.51 9.10 6.18 10.26 5.00 4.64
Adjustments:
Financing Cash\Equiv. Cash Cash Cash Cash Cash Cash Cash
Cond. of Sale Normal Normal Normal Normal Normal Normal Normal Normal
Time Current Current Current Current Current Current Current Current
Time/Cond./Fin. Adjusted: 0.00% 0.00% 0.00% 0.00% 0.00% 0.00% 0.00%
Price/S.F. $2.17 $3.36 $2.27 $1.97 $1.01 $1.49 $1.67
Location Good Similar Similar Similar Similar Similar Similar Similar
0.00% 0.00% 0.00% 0.00% 0.00% 0.00% 0.00%
Physical (S.F.) 261,360-435,600 Similar Similar Similar Similar Similar Similar Similar
0.00% 0.00% 0.00% 0.00% 0.00% 0.00% 0.00%
Zoning ECAP Similar Similar Similar Similar Similar Similar Similar
0.00% 0.00% 0.00% 0.00% 0.00% 0.00% 0.00%
Access Good Similar Similar Similar Similar Similar Similar Similar
0.00% 0.00% 0.00% 0.00% 0.00% 0.00% 0.00%
Utilities Water & Sewer Similar Similar Similar Similar Similar Similar Similar
0.00% 0.00% 0.00% 0.00% 0.00% 0.00% 0.00%
Topography Similar Similar Similar Similar Inferior Similar Similar
0.00% 0.00% 0.00% 0.00% 10.00% 0.00% 0.00%
Net Adjustments 0.00% 0.00% 0.00% 0.00% 10.00% 0.00% 0.00%
Conclusion: Price/S.F. $2.17 $3.36 $2.27 $1.97 $1.11 $1.49 $1.67
The foregoing represents the most recent industrial land sale activity that has taken place over the past twenty four (24) months. The unadjusted prices are in the $1.01 to $3.36/S.F. range, while an explanation of the adjustments to these sales in comparison to the subject is as follows.

93
Land Sales Analysis (Cont’d) Date of Sale (Time) The comparable sales used in the analysis have taken place over the past twenty four (24) months with a range of sale dates as old as January 2017 and as recent as December 2018. In order to derive or extract the appropriate time adjustment, the analyst would need to use re-sales of comparable vacant sites, subtracting the prior sale from the most recent, to measure the amount of appreciation or depreciation. This amount is then divided by the first sale price and then by the number of months between sales to derive the average monthly rate of change. During verification and researching of the comparable sales, no recent prior sales were found from which a reliable rate of change within the market for the period in question could be extracted. However, in lieu of making an unsupported time adjustment across the board, the more recent sales were given most emphasis. Location Adjustments: Adjustments were made for market factors such as proximity to shopping facilities and other commercial developments, traffic volumes, ease of access, existence of complementary land uses, and demographic characteristics surrounding the market area. The subject sites typically range in size from 6-10 acres with some parcels located actually adjacent to the airport with access to the runway and some of the parcels located within the Airport Authority Park located in proximity to the airport. Physical Adjustments (Size): The subject sites valued in this section of the report range from 6 acres to 10 acres. The comparables ranged from 202,118 S.F. to 446,926 S.F. Adjustments pertaining to parcel size are generally based on the real estate axiom stating that the unit price is inversely related to total size. Accordingly, as size of the parcel increases, its unit (price per square foot) price decreases. As smaller sites require a smaller capital investment, there tends to be potential investors for smaller sites. The higher demand should tend to drive per unit prices up. Similarly, as commodities produced in our economy in general tend to sell for less on a unit basis as the number of units increase, it would be reasonable to expect smaller sites to sell for more per square foot than larger sites. When analyzing and pairing the sales, a distinct correlation could be made between sales price per square foot and size. No adjustments were made to comparables per se; however, the values of the subject sites will be adjusted based on their size with the smaller sites valued at a higher price per S.F. than the larger sites. Zoning: The subject is zoned ECAP, Enterprise Charlotte Airport Park, by Charlotte County. All of the comparables were sufficiently similar in regards to zoning classifications and did not warrant any adjustments.

94
Land Sales Analysis (Cont’d) Access: The subject sites are accessed via several roadways in proximity to the Charlotte County Airport including Piper Road, Sky Lane Way, Golf Course Boulevard, Mooney Avenue, Henry Street, property is accessed via Janice Avenue, thus access to the site is considered good. The comparables were considered to possess similar access. Topography: Sale #5 was densely wooded and was adjusted upward accordingly. Utilities: There is water to the subject site. No adjustments were considered warranted.

95
Land Sales Analysis (Cont’d) Conclusion: Additionally, the appraiser is aware of the following listings in the subject’s neighborhood.
Address Land Acres
List Price Price Per SF
Zoning Comments
9450 Piper Rd., Punta Gorda
26.90 $6,444,702 $5.50 ECAP 26.90 acre parcel or 1,171,764 SF of vacant industrial land. Located in the Airport Park District. Utilities available. Listed @ $6,444,702 or $239,580/acre. Zoned ECAP.
8283 Duffie Dr., Punta Gorda
8.46 $2,027,000 $5.50 ECAP 8.46 acres or 368,518 SF of vacant industrial land. The site is located at northeast quadrant of I-75 and Jones Loop Rd. Located in Airport Commerce Park. Listed @ $2,027,000 or $5.50/SF. Zoned ECAP.
Punta Gorda Airport, Punta Gorda
10.24 $1,450,000 $3.25 ECAP 10.24 acres or 440,054 SF of vacant industrial land. Off-site drainage and all utilities available to the site. Listed @ $1,450,000 or $3.25/SF.
9151 Gasparilla Rd., Punta Gorda
7.77 $900,000 $2.66 II 7.77 acres or 338,461 SF of vacant industrial land. Located on Hwy 771 in West Charlotte County. Contains 690+ ft. along Hwy 771. Utilities in place. Listed @ $900,000 or $2.66/SF. Zoned II.
3589 Acline Rd., Punta Gorda
8.00 $1,100,000 $3.16 IG 8.00 acres or 348,480 SF of vacant industrial land. Listed @ $1,100,000 or $3.16/SF. Zoned IG.
10250, 10290 Pheasant Blvd & 6255 Taylor Rd., Punta Gorda
5.69 $875,000 $3.53 IG 5.69 acres or 247,856 SF of vacant industrial land. This listing includes 3 lots with. Located in the King Center Industrial Park. Listed @ $875,000 or $3.53/SF. Zoned IG.

96
Land Sales Analysis (Cont’d) The above listings range from $2.66 per square foot to $5.50 per square foot for commercial and industrial site located in proximity to the subject property. Several of the listings are located in the industrial parks located just north and south of the Airport (Airport Commerce Center and Charlotte County Park of Commerce) and have been on the market for over a year. All of the land sales used in the foregoing analysis were taken from the Charlotte, Sarasota and Lee County Market areas. They all occurred within the last twenty four (24) months and for the most part are competitive comparable land sales of commercial and industrial sites. After adjusting the comparables for their dissimilarities, the adjusted sales prices ranged from $1.11 to $3.36 per square foot. The predominant range of the sales was from $1.49 to $2.27 per S.F. After an intensive analysis of the comparable sales and reviewing the current listings, the final values were estimated as follows:
Location Size Estimate Value per S.F.
Airport Access 6.00 Acre $2.25 Non- Access 6.00 Acre $1.70
Airport Access 7.00 Acre $2.25 Non- Access 7.00 Acre $1.70
Airport Access 8.00 Acre $2.00 Non- Access 8.00 Acre $1.50
Airport Access 9.00 Acre $2.00 Non- Access 9.00 Acre $1.50
Airport Access 10.00 Acre $2.00 Non- Access 10.00 Acre $1.50

97
C E R T I F I C A T I O N I certify that, to the best of my knowledge and belief: The statements of fact contained in this report are true and correct. The reported analysis, opinions, and conclusions are limited only by the reported assumptions and limiting conditions, and are my personal, impartial and unbiased professional analyses, opinions, and conclusions. I have no present or prospective interest in the property that is the subject of this report, and I have no personal interest with respect to the parties involved. I have no bias with respect to the property that is the subject of this report, or to the parties involved with this assignment. My engagement in this assignment was not contingent upon developing or reporting predetermined results. My compensation for completing this assignment is not contingent upon the development or reporting of a predetermined value or direction in value that favors the cause of the client, the amount of the value opinion, the attainment of a stipulated result, or the occurrence of a subsequent event directly related to the intended use of the appraisal. The use of this report is subject to the requirements of the State of Florida, and the Appraisal Institute, relating to review by the Real Estate Appraisal Subcommittees of the Florida Real Estate Commission and the Appraisal Institute. Charles Michael Polk, III has made a personal inspection of the property that is the subject of this report. The reported analysis, opinions, and conclusions were developed, and this report has been prepared, in conformity with the requirement of the State of Florida for state certified appraisers, the requirements of the Code of Professional Ethics and Standards of Professional Practice of the Appraisal Institute and the Uniform Standards of Professional Appraisal Practice. No one provided significant professional assistance to the person signing this report. As of the date of this report, I, Charles Michael Polk, III have completed the requirements of the Voluntary Continuing Education Program of the Appraisal Institute. I have performed services, as an appraiser, regarding the property that is the subject of this report within the three-year period immediately preceding acceptance of this assignment. In my opinion, the Market Value of the Fee Simple Interest in the subject property as of the effective date of appraisal, February 9, 2019 was:


99
ASSUMPTIONS AND LIMITING CONDITIONS The value conclusion and certification within this report are made expressly subject to the following Assumptions and Limiting conditions, as well as any further reservations or conditions stated within the text of the report. 1. No responsibility is assumed for the legal description or for matters including legal or title considerations. Title to the property is assumed to be good and marketable. 2. All existing liens and encumbrances (except the existing leases if any) have been disregarded, and the property is appraised as though free and clear. 3. Responsible ownership and competent property management are assumed. 4. The information furnished by others is believed to be reliable. However, no warranty is given for its accuracy. 5. All engineering is assumed to be correct. The plot plans and illustrative material in this report are included only to assist the reader in visualizing the property. 6. It is assumed that there are no hidden or unapparent conditions of the property, subsoil, or structures that render it more or less valuable. No responsibility is assumed for such conditions or for arranging for engineering studies that may be required to discover them. 7. It is assumed that there is full compliance with all applicable federal, state, and local environmental regulations and laws unless non-compliance is stated, defined, and considered in the appraisal report. 8. It is assumed that all applicable zoning and use regulations and restrictions have been complied with except where nonconformity has been stated, defined, and considered in the appraisal report. 9. It is assumed that all required licenses, certificates of occupancy, consents, or other legislative or administrative authority from any local, state, or national government or private entity or organization, have been, or can be obtained or renewed for any use on which the value estimate contained in this report is based. 10. It is assumed that the utilization of the land and improvements is within the boundaries of property lines or the property described and that there is no encroachment or trespass unless noted in this report. 11. Subsurface rights were not considered in making this appraisal. 12. The distribution, if any, of the total valuation of this report between land and improvements applies only under the stated program of utilization. The separate allocations for land and buildings must not be used in conjunction with any other appraisal and are invalid if so used.

100
ASSUMPTIONS AND LIMITING CONDITIONS (Cont’d) 13. Possession of this report, or a copy thereof, does not carry with it the right of publication. It may not be used for any purpose by any person other than the party to whom it is addressed, without the written consent of the appraiser, and in any event only with proper written qualification and only in its entirety. 14. The appraiser herein by reason of this appraisal is not required to give further consultation, testimony, or be in attendance in court with reference to the property in question unless arrangements have been previously made. 15. Neither all nor any part of the contents of this report (especially any conclusions as to value, the identity of the appraiser, or any reference to the MAI and the SRA designation) shall be disseminated to the public through advertising, public relations, news, sales, or other media without the prior written consent and approval of the appraiser. 16. The existence of potentially hazardous material used in the construction or maintenance of the building, and/or the existence of toxic waste which may or may not be present on or under the site, was not observed during our inspection. However, we are not qualified to detect such substances. These substances, if they exist, could have a negative effect on the estimated value of the property. The user of this report is urged to retain an expert in this field if desired. 17. The Americans with Disabilities Act (ADA) became effective January 26, 1992. I have not made a specific compliance survey and analysis of this property to determine whether or not it is in conformity with the various detailed requirements of the ADA. It is possible that a compliance survey of the property together with a detailed analysis of the requirements of the ADA could reveal that the property is not in compliance with one or more of the requirements of the act. If so, this fact could have a negative effect upon the value of the property. Since I have no direct evidence relating to this issue, I did not consider possible noncompliance with the requirements of ADA in estimating the value of the property. 18. No environmental report was provided. The appraisal is subject to a satisfactory environmental report. 19. The information furnished by others is believed to be reliable. However, no warranty is given for its accuracy. 20. The market value estimate stated in this appraisal report was based on current and projected market conditions indicated by comparable data, price per S.F., and other market indicators that are described in further detail throughout the appraisal report. The appraisers cannot be held responsible for unforeseeable events that alter market conditions prior or subsequent to the effective date of the appraisal. Extraordinary Assumption The appraisal is not of a specific parcel or parcels, but a general valuation of a typical site at the Charlotte County Airport Authority with and without access to the runway.

101
QUALIFICATIONS OF THE APPRAISER
CHARLES M. POLK, III, J.D., MAI, SRA, CCIM
GENERAL EDUCATION: Bachelor of Science in Real Estate, College of Business, Florida State University, Tallahassee, Florida. Juris Doctor, Stetson University College of Law, St. Petersburg, Florida. PROFESSIONAL EDUCATION: The following real estate courses were successfully completed at Florida State University: Real Estate Principles Real Estate Appraisal Advanced Real Estate Analysis Real Estate Finance Legal Environment of Real Estate Real Estate Feasibility Analysis The following real estate related courses were successfully completed at Stetson University College of Law: Property I Property II Real Property Finance Land Use Planning Florida Real Property Litigation Environmental Law Seminar Civil Government Clinic with the Florida Department of Transportation-District7 Successfully completed or has credit for the following courses sponsored by the Appraisal Institute: Course 1A-1 - Real Estate Appraisal Principles Course 1A-2 - Basic Valuation Procedures Course 1B-A - Capitalization Theory and Techniques, Part A Course 1B-B - Capitalization Theory and Techniques, Part B Course 2-1 - Case Studies in Real Estate Valuation Course 2-2 - Valuation Analysis and Report Writing Course 2-3 - Standards of Professional Practice Course 4 - Real Estate Valuation in Litigation Course 8-2 - Residential Valuation Course 410 - Standards of Professional Practice, Part A Course 410 - Standards of Professional Practice, Part B

102
QUALIFICATIONS OF THE APPRAISER
CHARLES M. POLK, III, J.D., MAI, SRA, CCIM
PROFESSIONAL EDUCATION (cont’d): Successfully completed or has credit for the following courses sponsored by the Society of Real Estate Appraisers: Course 101 - Introduction to Real Property Valuation Course 102 - Applied Residential Property Valuation Course 201 - Principles of Income Property Valuation Course 202 - Applied Income Property Valuation Credit for attendance at the following Seminars: Applied Sales Comparison Approach Seminar A.I.R.E.A. Single-Family Residential Demonstration Report Writing A.I.R.E.A. Accrued Depreciation Seminar A.I.R.E.A. Employment Relocation Seminar E.R.C. Valuation & Evaluation of Proposed Projects S.R.E.A. Feasibility - Non-residential Properties A.I.R.E.A. Discounted Cash Flow Analysis A.I.R.E.A. Appraisal Regulations of the Federal Banking Agencies Appraisal Institute Appraising Troubled Properties Appraisal Institute Appraisal Review Income Properties Appraisal Institute Discounted Cash Flow Analysis Appraisal Institute Persuasive Style in Narrative Appraisal Reports Appraisal Institute Eminent Domain and Land Valuation Litigation ALI-ABA Regulatory Takings CLE Eminent Domain CLE Florida Condemnation Valuation & Appraiser Liability Appraisal Institute LICENSES: Real Estate Broker, State of Florida. Certified General Appraiser, State of Florida. Appraiser No. 0000439 ASSOCIATION MEMBERSHIPS: Member Appraisal Institute (MAI) - Appraisal Institute Senior Residential Appraiser (SRA) - Appraisal Institute Senior Real Property Appraiser (SRPA) - Appraisal Institute Certified Commercial Investment Member (CCIM) – CCIM Institute
103
QUALIFICATIONS OF THE APPRAISER
CHARLES M. POLK, III, J.D., MAI, SRA, CCIM
PROFESSIONAL ACTIVITIES: 2014 Special Magistrate for the 2014 Manatee County Value Adjustment Board 2013 Special Magistrate for the 2013 Manatee County Value Adjustment Board 2012 Special Magistrate for the 2012 Manatee County Value Adjustment Board 2011 Special Magistrate for the 2011 Manatee County Value Adjustment Board 2010 Special Magistrate for the 2010 Sarasota County Value Adjustment Board 2010 Special Magistrate for the 2010 Manatee County Value Adjustment Board 2009 Special Magistrate for the 2009 Sarasota County Value Adjustment Board 2009 Special Magistrate for the 2009 Manatee County Value Adjustment Board 2008 Special Magistrate for the 2008 Sarasota County Value Adjustment Board 2008 Special Magistrate for the 2008 Manatee County Value Adjustment Board 2007 Special Magistrate for the 2007 Sarasota County Value Adjustment Board 2007 Special Magistrate for the 2007 Manatee County Value Adjustment Board 2006 Special Magistrate for the 2006 Sarasota County Value Adjustment Board 2006 Special Magistrate for the 2006 Manatee County Value Adjustment Board 2005 Special Magistrate for the 2005 Sarasota County Value Adjustment Board 2004 Special Magistrate for the 2004 Sarasota County Value Adjustment Board 2003 Special Master for the 2003 Sarasota County Value Adjustment Board 2002 Special Master for the 2002 Sarasota County Value Adjustment Board 1994-98 Admissions Committee Member, West Coast Florida Chapter of the Appraisal Institute 1993-94 Director, West Coast Florida Chapter of the Appraisal Institute 1992-94 Assistant Regional Member Review and Counseling, Appraisal
Institute 1991-92 Treasurer, Southwest Florida Chapter, Appraisal Institute 1990-91 Professional Practice Committee Chairman, Southwest Florida
Chapter 186, Society of Real Estate Appraisers 1990 Young Advisory Council - Society of Real Estate Appraisers, Sarasota, FL 1988 Young Advisory Council - Society of Real Estate Appraisers, New Orleans, LA 1986 Public Relations Committee Member, Florida Chapter 100, Society of Real Estate Appraisers 1984-85 Member of Real Estate Society, Florida State University REAL ESTATE AND APPRAISAL EXPERIENCE: President, C. Michael Polk & Associates, Inc., Charlotte County, Florida, July 1994 to Present. Partner, Persons, Polk & Company, Charlotte County, Florida. March 1991 to July 1994. Partner, Charlotte Appraisal Company, Charlotte County, Florida. June 1990 to July 1994.

104
QUALIFICATIONS OF THE APPRAISER
CHARLES M. POLK, III, J.D., MAI, SRA, CCIM
REAL ESTATE AND APPRAISAL EXPERIENCE (cont’d): Vice-President, Branch Manager, Appraisal First Appraisal Company, Sarasota, Florida. October, 1988 to June, 1990. Assistant Manager, Sr. Commercial Appraiser, Appraisal First Appraisal Company, Sarasota, Florida. July, 1987 to October, 1988. Commercial Appraiser, Appraisal First Appraisal Company, Fort Myers, Florida. February, 1987 to July, 1987. Commercial Appraiser, AmeriFirst Appraisal Company, Fort Myers, Florida, 1986 Commercial Appraiser, AmeriFirst Appraisal Company, Maitland, Florida, 1986 Residential Appraiser, AmeriFirst Appraisal Company, Fort Myers, Florida, 1985 CLIENTS SERVED: Attorney's, Banks, Savings & Loans, Florida Department of Transportation, Florida Department of Natural Resources, Florida Department of Labor and Employment Security, United States Marshall's Office, Federal Home Loan Bank Board, Federal Deposit Insurance Corporation, Federal Savings & Loan Insurance Corporation, Charlotte County, Charlotte County School Board, City of Punta Gorda, various national corporations, estates and individuals. TYPE OF PROPERTIES: Single-Family Homes, Condominiums, Two to Four Family Dwellings, Office Buildings, Industrial Warehouses, Shopping Centers, Apartment Complexes, Subdivision Developments, Planned Unit Developments, Office Condominiums, Adult Congregate Living Facilities, Mobile Home Parks, R.V. Parks, Restaurants, Hotels and Motels, Nursing Homes, Marinas, Mini-Warehouses, and Undeveloped Land. GEOGRAPHICAL AREAS SERVED: Primarily Charlotte, Lee, Collier, Sarasota and Manatee Counties. Have appraised properties in: Desoto, Glades, Hendry, Leon, Hillsborough, Pinellas, Orange, Seminole and Osceola Counties. COURT TESTIMONY/EXPERT WITNESS: Have been qualified as an expert witness in the Circuit Courts of Charlotte County, Lee County, and Sarasota County, Florida. Testimony given in trials, order of taking hearings, bankruptcy hearings, divorce cases, etc.

jparish
Image
jparish
Text Box
jparish
Text Box
1-15-2019


ADDENDUM