Applying LEAN Six Sigma Strategies to Manage Missing ... · Applying LEAN Six Sigma Strategies to...
48
1 Applying LEAN Six Sigma Strategies to Manage Missing Medications in a Tertiary Acute Care Hospital Maria Marchese, RPh, PharmD Pharmacy Resident 2015-2016 Preceptor: Nancy Burge, RPh, BPharm BCPS Kingston General Hospital Department of Pharmacy Services In partial fulfillment of the Hospital Pharmacy Residency Program
Transcript of Applying LEAN Six Sigma Strategies to Manage Missing ... · Applying LEAN Six Sigma Strategies to...
1
Applying LEAN Six Sigma Strategies to Manage Missing Medications in a Tertiary Acute Care Hospital
Maria Marchese, RPh, PharmD Pharmacy Resident
2015-2016 Preceptor: Nancy Burge, RPh, BPharm BCPS
Kingston General Hospital Department of Pharmacy Services
In partial fulfillment of the Hospital Pharmacy Residency Program

2
PHARMACY SERVICES
Applying LEAN Six Sigma Strategies to Manage Missing Medications in a Tertiary Acute Care
Hospital 2015-2016 Residency Project
Maria Marchese, RPh PharmD and Nancy Burge, RPh BPharm BCPS
8/26/2016
3
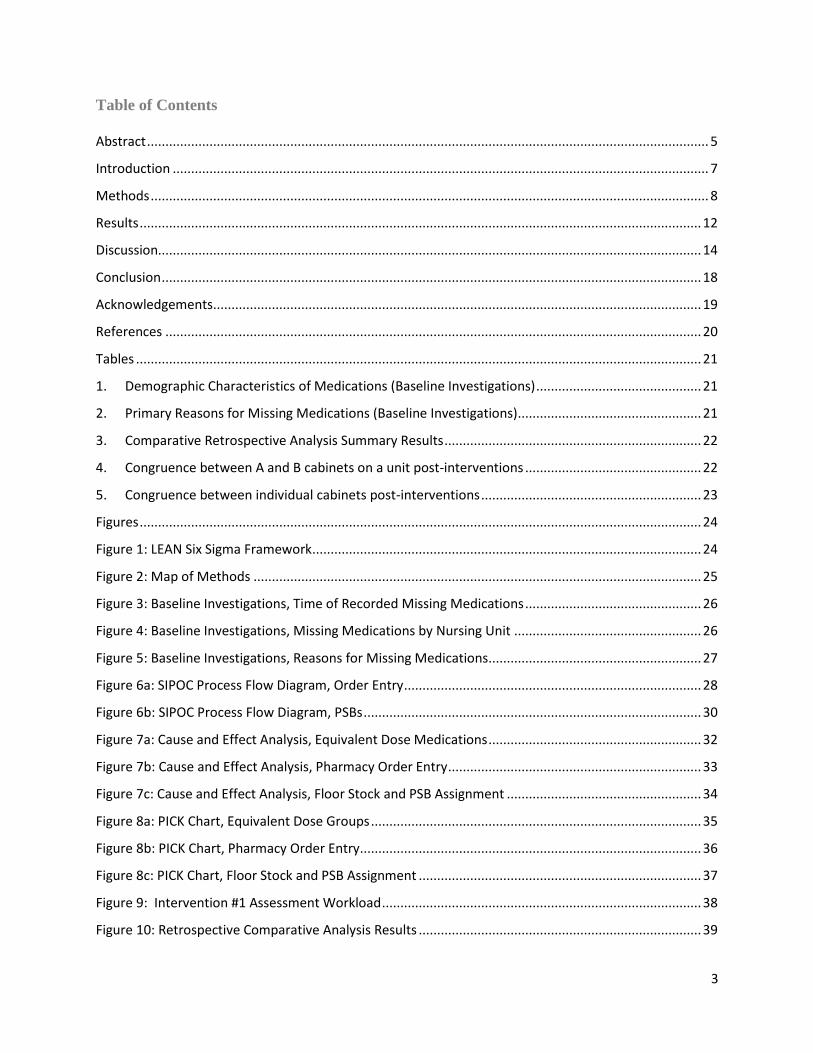
Table of Contents
Abstract ......................................................................................................................................................... 5
Introduction .................................................................................................................................................. 7
Methods ........................................................................................................................................................ 8
Results ......................................................................................................................................................... 12
Discussion.................................................................................................................................................... 14
Conclusion ................................................................................................................................................... 18
Acknowledgements ..................................................................................................................................... 19
References .................................................................................................................................................. 20
Tables .......................................................................................................................................................... 21
1. Demographic Characteristics of Medications (Baseline Investigations) ............................................. 21
2. Primary Reasons for Missing Medications (Baseline Investigations) .................................................. 21
3. Comparative Retrospective Analysis Summary Results ...................................................................... 22
4. Congruence between A and B cabinets on a unit post-interventions ................................................ 22
5. Congruence between individual cabinets post-interventions ............................................................ 23
Figures ......................................................................................................................................................... 24
Figure 1: LEAN Six Sigma Framework .......................................................................................................... 24
Figure 2: Map of Methods .......................................................................................................................... 25
Figure 3: Baseline Investigations, Time of Recorded Missing Medications ................................................ 26
Figure 4: Baseline Investigations, Missing Medications by Nursing Unit ................................................... 26
Figure 5: Baseline Investigations, Reasons for Missing Medications .......................................................... 27
Figure 6a: SIPOC Process Flow Diagram, Order Entry ................................................................................. 28
Figure 6b: SIPOC Process Flow Diagram, PSBs ............................................................................................ 30
Figure 7a: Cause and Effect Analysis, Equivalent Dose Medications .......................................................... 32
Figure 7b: Cause and Effect Analysis, Pharmacy Order Entry ..................................................................... 33
Figure 7c: Cause and Effect Analysis, Floor Stock and PSB Assignment ..................................................... 34
Figure 8a: PICK Chart, Equivalent Dose Groups .......................................................................................... 35
Figure 8b: PICK Chart, Pharmacy Order Entry ............................................................................................. 36
Figure 8c: PICK Chart, Floor Stock and PSB Assignment ............................................................................. 37
Figure 9: Intervention #1 Assessment Workload ....................................................................................... 38
Figure 10: Retrospective Comparative Analysis Results ............................................................................. 39

4
Appendices .................................................................................................................................................. 40
A. Description of Automated Dispensing Cabinets at KGH ..................................................................... 40
B. Definition of Terms ............................................................................................................................. 40
C. Description of Interventions ............................................................................................................... 42
D. Project Scope Revision Log ................................................................................................................. 44
E. Missing Medication Documentation Form ......................................................................................... 46
F. Primary Analysis – Sample Data Entry Sheet ...................................................................................... 47
G. Survey of Nursing Staff Data Sheet ..................................................................................................... 48
5
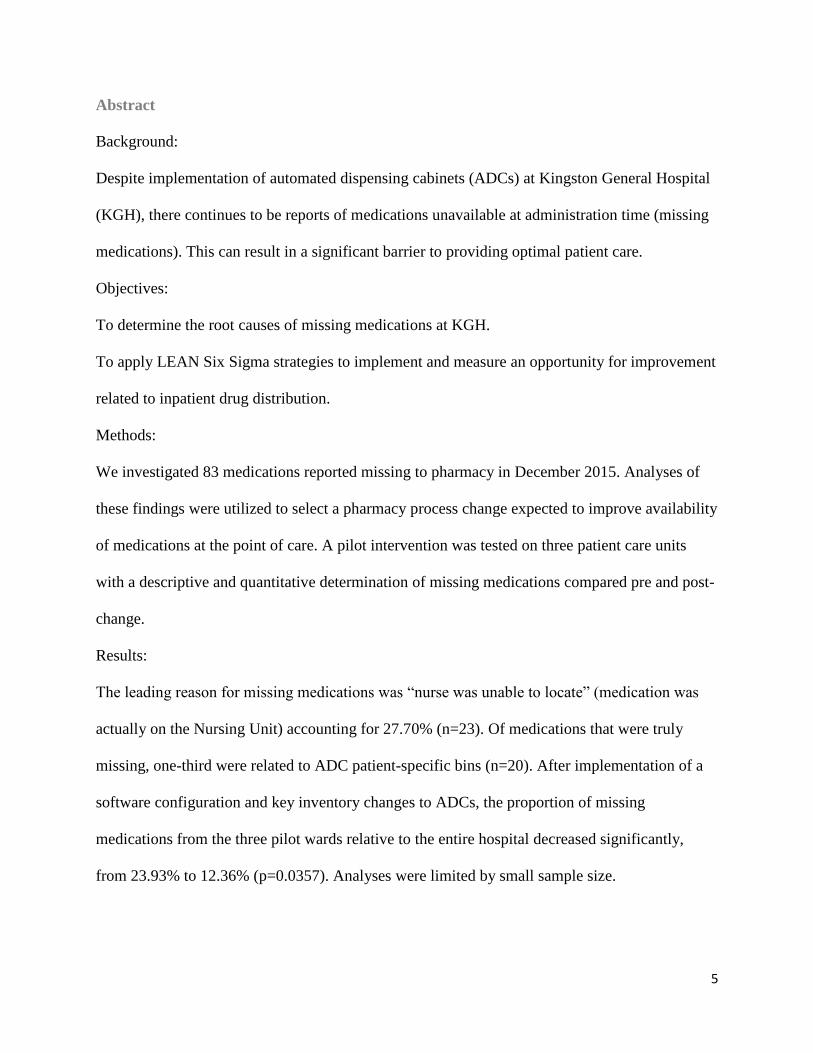
Abstract
Background:
Despite implementation of automated dispensing cabinets (ADCs) at Kingston General Hospital
(KGH), there continues to be reports of medications unavailable at administration time (missing
medications). This can result in a significant barrier to providing optimal patient care.
Objectives:
To determine the root causes of missing medications at KGH.
To apply LEAN Six Sigma strategies to implement and measure an opportunity for improvement
related to inpatient drug distribution.
Methods:
We investigated 83 medications reported missing to pharmacy in December 2015. Analyses of
these findings were utilized to select a pharmacy process change expected to improve availability
of medications at the point of care. A pilot intervention was tested on three patient care units
with a descriptive and quantitative determination of missing medications compared pre and post-
change.
Results:
The leading reason for missing medications was “nurse was unable to locate” (medication was
actually on the Nursing Unit) accounting for 27.70% (n=23). Of medications that were truly
missing, one-third were related to ADC patient-specific bins (n=20). After implementation of a
software configuration and key inventory changes to ADCs, the proportion of missing
medications from the three pilot wards relative to the entire hospital decreased significantly,
from 23.93% to 12.36% (p=0.0357). Analyses were limited by small sample size.
6
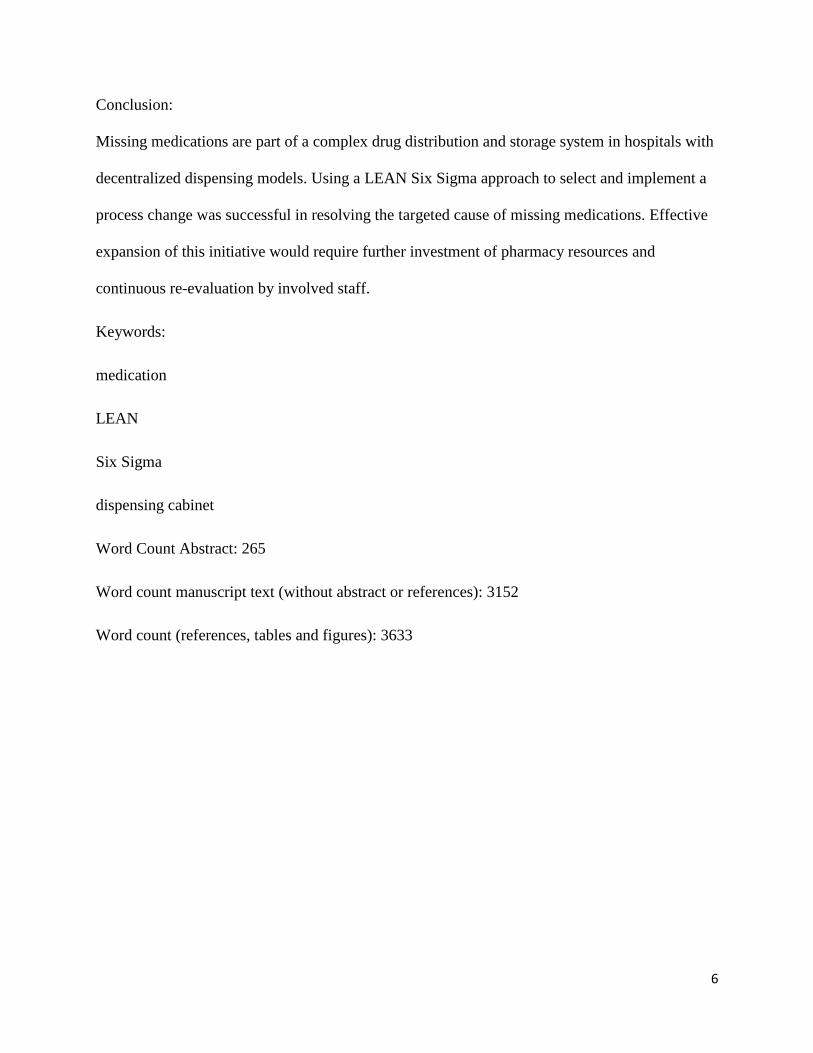
Conclusion:
Missing medications are part of a complex drug distribution and storage system in hospitals with
decentralized dispensing models. Using a LEAN Six Sigma approach to select and implement a
process change was successful in resolving the targeted cause of missing medications. Effective
expansion of this initiative would require further investment of pharmacy resources and
continuous re-evaluation by involved staff.
Keywords:
medication
LEAN
Six Sigma
dispensing cabinet
Word Count Abstract: 265
Word count manuscript text (without abstract or references): 3152
Word count (references, tables and figures): 3633
7
Introduction
A missing medication occurs when a drug supplied from pharmacy is unavailable for the
nurse to administer to the patient at the time it is scheduled or required. Missing medications
create a significant barrier to operational efficiency for both pharmacy and nursing staff, in
addition to jeopardizing patient safety and quality of care.
The use of automated dispensing cabinets (ADCs) in patient care areas to support a
decentralized dispensing model has been shown to increase patient safety and improve timely
access to medications. [1] Specifically, ADCs have been shown to decrease missing medications
in hospital distribution systems. [2] Undoubtedly, the infrastructure of the hospital’s network of
medication distribution programs, equipment and staff must be aligned to operate synchronously
to achieve these intended results.
Kingston General Hospital (KGH), a 440 bed tertiary acute care teaching hospital,
recently converted from a centralized unit dose dispensing model to the use of ADCs on all
nursing units. With this change, staff have encountered multiple challenges and have had to
adapt processes to minimize disruptions to the distribution chain and preserve the timely,
accurate supply of medications. However, at KGH, nursing and pharmacy departments continue
to cite missing medications as a concern.
There is a paucity of data reporting strategies to optimally manage hospital distribution
systems to minimize missing medications. LEAN and Six Sigma are two complementary
systematic process improvement tools originating from the manufacturing industry (Figure 1).
[3] [4] LEAN Six Sigma strategies have been widely demonstrated to be successfully
transferrable to health care settings, including the medication use system. [3] [5] [6] [7] These

8
tools provide a framework with which to solve complex process problems in a multifactorial
environment. [8] In addition to LEAN projects having been reported to be successful to address
missing medications, [7] KGH has previously applied LEAN principles to numerous other
initiatives in the hospital. These projects have achieved cost savings and standardized workflow
in support of improved patient care. [9]
This project used LEAN Six Sigma methodology to assess the distribution processes at
our hospital. Its primary objectives were to establish the root causes of missing medications and
determine whether applying LEAN Six Sigma continuous improvement tools would
subsequently decrease the number of missing medications at KGH.
Methods
Refer to Figure 2 for a flow diagram outlining of the methods of the study. A description of the
format of automated dispensing cabinets at KGH and a complete set of definitions of key terms
are respectively found in Appendices A and B.
Baseline Investigations
A prospective analysis of missing medications reported to pharmacy was conducted at
Kingston General Hospital the week of December 14 -18, 2015 over variable 8-hour blocks
within pharmacy operating hours (0730h to 2200h). Results of this analysis were then used to
devise the subsequent interventions, data collection, and measurements of the study.
Missing medications were tracked in real-time using the Missing Medication
Documentation Form (Appendix E). The following data were collected from telephone
discussion and/or direct encounter with pharmacy and nursing staff: date, time, technician
accepting request, nursing unit, medication name, strength and dosage form, if the medication
was for a new order (entered < 24 hours previous), unit or multi-dose format, formulary status,

9
cost per dose, and whether the medication was missing on >1 consecutive occasion (“repeat”
missing). The primary reason for the medication being missing was assigned one of eight pre-
defined categories by the primary investigator. A sample data entry sheet can be found in
Appendix F.
Medications were included in the study only if they were dispensed for inpatients and the
order had been received and entered into the pharmacy information system. Controlled
substances and medications prepared by the pharmacy’s centralized intravenous admixture
system (CIVAS) were excluded since the distribution processes regulating these medications
differ substantially and would require separate assessment of interventions. Requests for refills
of depleted multi-dose medications were not considered to be missing medications.
The principal investigator, supported by stakeholder representatives, conducted a series
of meetings to identify and confront the primary distribution-related causes for missing
medications. Preliminary work involved examining the steps of Six Sigma and principles of
LEAN methodology applied to healthcare in conjunction with critical observation of pharmacy
and nurse personnel performing duties. Two SIPOC (Suppliers, Inputs, Process, Outputs,
Customers) Diagrams (Figures 6a and 6b) were constructed to identify all the essential elements
of the processes in question prior to conducting a root cause analysis. The analysis (also known
as Cause and Effects, Fishbone, or Ishikawa diagram) was completed for the top three root
causes under the primary identified cause (Figures 7a-c). Possible process improvements were
brainstormed and plotted on PICK (Possible, Implement, Challenge, Kill) charts to identify
solutions that would generate the highest impact with minimal required effort and/or resources
(Figures 8a-c).
Interventions
10
Two key interventions were applied to a subset of nursing units (Connell 9 (C9), Connell
10 (C10), and Kidd 7 (K7); also referred to as the “experimental group”) over February – March
2016 as a pilot Plan-Do-Study-Act (PDSA) cycle. The first intervention applied a setting in the
ADC software program that automatically assigns items defined within equivalent dose groups
into the patient-specific bin. The second intervention involved standardizing both cabinets on the
nursing unit and expanding the ADC stock to include a greater number of dosage strengths for
commonly used medications. Specific details of the interventions and their rationale can be
found in Appendix C.
Comparative Retrospective Analysis
After the interventions were complete, a retrospective quantitative analysis was
conducted comparing the proportion of missing medications pre-intervention (December 2015),
and post-intervention (March 2016). These missing medications were subject to the same
definition and inclusion criteria as in the baseline prospective investigations.
For the comparative retrospective analysis, the data was collected from the pharmacy
information system, extracted as the “Timeline Report” and included the following: date, time,
patient name, medication name, strength, dosage form, dose and dosing schedule, nursing unit
location, and quantity charged.
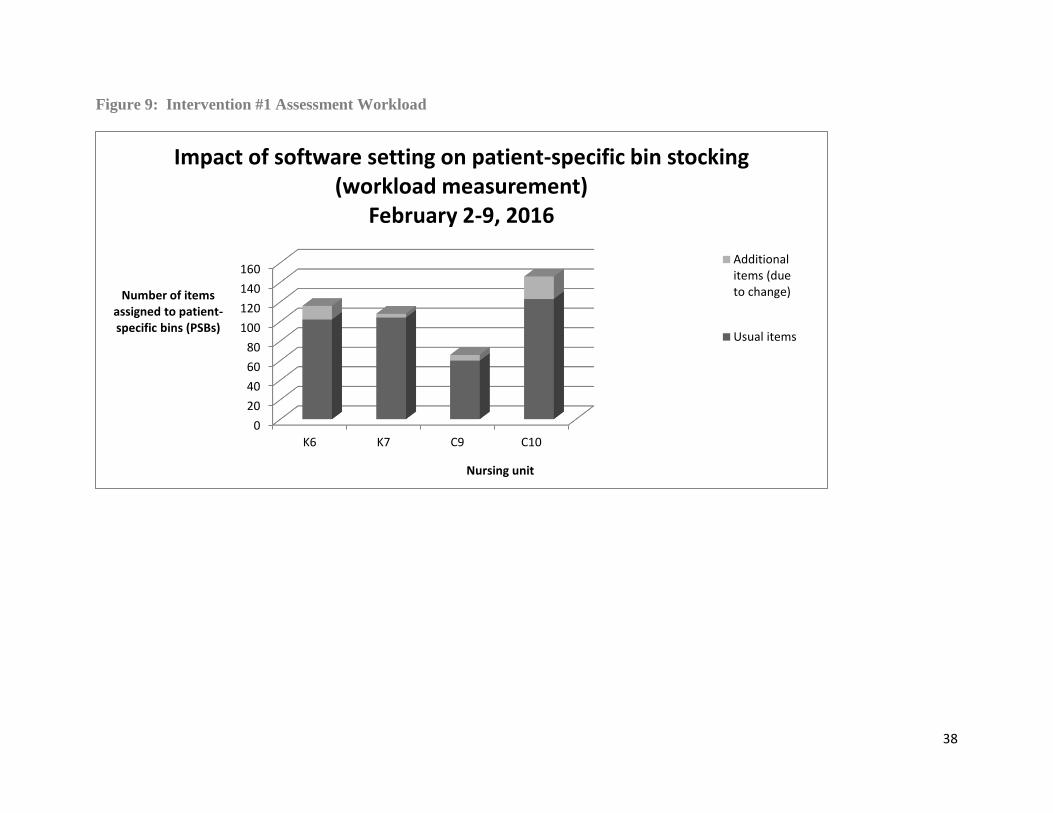
Reassessment
As a continuous quality improvement project, data was collected to assess the
effectiveness of each intervention according to Plan-Do-Study-Act methodology. To assess the
effect of the first intervention, the pharmacy manager recorded the number of patient-specific
items that were assigned pre and post-change and computed the additional workload created for
technicians filling patient-specific bins, in addition to tracking missing medication calls
regarding these items (Figure 9).

11
To assess the effect and sustainability of the second intervention, the cabinets on
experimental nursing units were appraised by assessing congruence of the floor stock assigned to
each cabinet three months after instituting the changes.
Representing “customers” of the pharmacy’s operations, twelve nurses (eight who work
routinely in the experimental group units and four from “control” units) were informally
surveyed post-interventions to gage perceptions on missing medications, specifically with
respect to automated dispensing cabinets and patient-specific bins. Open and closed-ended
questions were used to guide the brief survey to capture themes and to assist in planning for
continuous improvement of this project. The data sheet can be found in Appendix G.
Statistical Analysis
Descriptive statistics including frequencies and percentages were used to analyze data
from the baseline investigations. The categorical data were analyzed by cross-tabulations to test
for associations with the collected variables, using the Pearson Chi-Square or Fisher’s Exact test
as appropriate. The retrospective comparative analysis utilized the Pearson Chi-Square test to
compare the number of missing medications (relative to the affected nursing units vs. entire
hospital) pre and post-intervention. The a priori p-value for statistical significance was 0.05, and
the study aimed to achieve a 50% relative decrease in the measure. Statistical analyses were
performed by the hospital statistician using IBM SPSS version 23 for Windows (Armonk, New
York, 2015). Descriptive statistics and qualitative summaries were used to report data from the
reassessment phases of the continuous improvement cycles.
Approval for the study was granted by Queens University Health Sciences and Affiliated
Teaching Hospitals Research Ethics Board (HSREB) in conjunction with the Residency
Advisory Committee (RAC) for the Kingston General Hospital Pharmacy Residency Program.

12
Any protocol changes, including the plan for interventions and comparative retrospective
analysis, were within the confines of the ethics submission and approved and documented in the
Project Scope Revision Log (Appendix D). There are no conflicts of interest among any of the
study investigators to describe.
Results
Baseline Investigations
A total of 83 missing medications identified by a convenience sample were investigated
during the baseline data collection period (Table 1). Of these, 25 (30.5%) were not actually
missing and located on the inpatient unit. For truly missing medications, 20 were “not in the
patient-specific bin”, 14 were due to patient transfer, and 7 were due to errors in pharmacy order
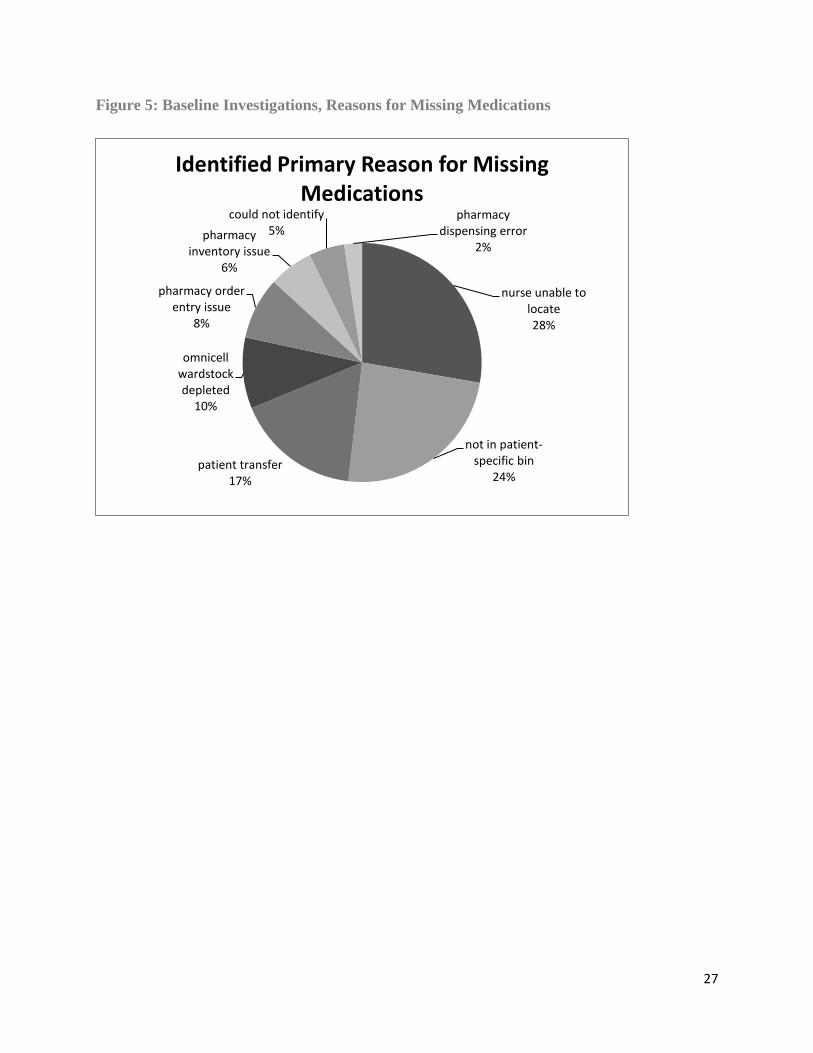
entry (Table 2, Figure 5). The nursing units most commonly implicated for missing medications
included intensive care unit (ICU) and general medicine units (Figure 4); with 17 % of all
documented requests originating from Kidd-2 ICU (K2ICU), 11% from Davies-4 ICU, 12%
from C10, and 10% from C9 medicine floors. The time block with the highest collection of
missing medications was from 0730h to 1029h in the morning (Figure 3). Multivariate analyses
failed to reveal any meaningful significant differences among the time blocks, with the exception
of repeat missing medications (those missing on two or more consecutive occasions, at least 4
hours after pharmacy had re-dispensed the medication), which were more commonly
encountered later on in the day. Seventy percent of repeat missing medications occurred after
1630h. However, these incidental findings must be interpreted with caution given small numbers
and since the convenience sample of missing medications was not evenly distributed across time
blocks. Repeat missing medications were also more likely to be truly missing (two-sided p =
0.028) which was consistent with observed staff concerns of some medications being persistently
reported missing. Although it was not statistically significant, there was a greater proportion of

13
multi-dose items, such as inhalers, eye drops, nose sprays, and topical preparations that were
“false missing” (41.2%) compared with unit-dose items (27.7%).
Comparative Retrospective Analysis
There were a total of 117 missing medications meeting inclusion criteria for the five-day
pre-intervention data collection period (Table 3). Of these, 28 medications were missing from
C9, C10, and K7 nursing units (“experimental group”). At the post-intervention data collection
period, there were a total of 89 missing medications, indicating a lower absolute number overall
(Figure 10). Post-intervention, only 11 missing medications were from the experimental group
nursing units. Therefore, the proportion of missing medications originating from the
experimental group significantly decreased from 23.9% to 12.36% after the interventions,
representing a relative 48.3% decrease (p=0.0357).
Of the twelve nurses surveyed, ten (83.3 %) had overall positive feedback about
automated dispensing cabinets and did not perceive missing medications to be problematic for
their workflow. Five nurses (41.7 %) noticed that missing medications were diminished
compared to six months ago, and nine (75.0 %) felt comfortable using the “select equivalent
meds” feature from the automated dispensing cabinets in order to retrieve the most suitable dose
for the patient. Noted themes were consistent with nurses perceiving fewer requests to pharmacy
for missing medications, and that if missing medications did occur, they tended to be with
patient-specific items. Of note, nurses had concern that pharmacy is simply not fast enough for
processing new orders that require initial doses sent to the floor, signalling the value of
automated dispensing cabinets for timely medication administration.

14
Data indicated excellent congruence of floor stock three months after optimization, with
88% similarity between A and B cabinets (Table 4) and 95% similarity for individual cabinets
(Table 5).
Discussion
This study identified that missing medications most commonly occur due to poor storage
practices, knowledge gaps among nursing staff, patient transfers, limitations of pharmacy
information systems, and pharmacy errors at our hospital. The fact that a substantial percentage
of missing medications were not truly missing suggests potential deficiencies in the storage and
procurement of medications (especially multi-dose items) on nursing units. The leading drug-
distribution causes were related to order entry practices and poorly optimized configuration of
patient-specific bins in the ADCs, which was consistent with reports from pharmacy technician
staff in the initial planning stages of the project. The baseline investigations enabled not only
observation, but immersion into the interconnected processes between nursing and pharmacy
departments affecting missing medications. We were able to collect several characteristics of
missing medications from the entire hospital to narrow our focus. Of all patient care areas,
K2ICU produced the greatest proportion of missing medications; which may be due to the
unique set up of six individual dispensing cabinets throughout the unit, which increases the
complexity of supplying medications. The high proportion of missing medications from C9 and
C10 medicine floors is likely attributed to larger patient loads in addition to extensive medication
profiles in this patient population. Owing to the adequate sample size of the baseline analysis and
thorough follow-up of each missing medication in real-time, we can be confident that the results
reflect the distribution of true causes of missing medications at KGH. Despite this, causes of
missing medications are difficult to classify, since the primary cause for the missing medication

15
may depend on other factors or reasons. Interpretation of the cause under a single label is thus
subject to bias. In future studies, devising a systematic and validated scheme for classification of
missing medications is recommended. We recognize some limitations to the baseline
investigational analysis; we did not track missing medications on weekends, and the convenience
sample resulted in non-uniform tracking throughout the day.
The retrospective comparative analysis demonstrated a significantly lower proportion of
missing medications originating from the three experimental group nursing units, suggesting that
the improvements were effective in reducing the intended measure of missing medications.
Considering the low baseline numbers for missing medications at KGH, our positive findings
may be valid.
However, the measure for missing medications (Timeline Report) used in this
retrospective analysis has several limitations. First, the report does not capture missing
medications from automated dispensing cabinet depletion, which may commonly occur after
weekends, due to insufficient pharmacy inventory, or if there is a surge in the demand for a
particular medication. Technological limitations of the report’s data capacity limited its inclusion
to missing medications for orders created 60 days prior to the run date. This excludes some older
orders which may have been reported as missing medications. However, older orders are less
likely to become missing medications, and since our measure was computed as a proportion, this
is not expected to significantly impact the results.
The major limitation of the retrospective analysis and PDSA cycle was the small sample
size. Substantial manual manipulation of the report was necessary in order to obtain data, and for
this reason, we were limited to a 5-day comparison period for missing medications. It is not
known whether expanding our measurement would change the results. Developing a more

16
accurate quantitative measure of missing medications is desirable and suggested for future
studies.
By nature of the pre-test post-test design and the considerable time elapsed between
measurements, the significant finding in the retrospective analysis is also subject to bias. The
data are vulnerable to becoming skewed from exogenous events, such as minor changes in
procedures or staff. In the case of this study, minor technology glitches with the pharmacy
information system were addressed along the way, potentially decreasing missing medications in
patient-specific bins. Therefore, although we were able to demonstrate a significantly lower
proportion of medications on the experimental group floors, we cannot exclude the possibility of
a Type I Error. Finally, our results do not apply to missing medications from intravenous
admixtures or controlled substances, which must be evaluated separately, but still contribute to
the operational barriers experienced by pharmacy and nursing departments.
Reassessment of the interventions revealed that the floor stock changes remained stable
after the implementation of floor stock optimization at three months (5% deviation on average
for each cabinet). Most of the discrepancies were noted to be reflective of controlled substances,
which follow specific pharmacy policies for addition to ADCs, and as a result of a hospital-wide
changeover of electrolyte supply.
The ADC charge pharmacy technician estimated the floor stock optimization required 15
hours of dedicated time to complete per inpatient unit. For average technician wages at Kingston
General Hospital, this would translate into a human resource cost of approximately $400 per
nursing unit. This does not include the potential cost of necessary equipment (e.g. additional
ADC drawers) as it is applicable, or the cost attributed to maintaining inventory of ADCs once
optimized. Given the weighted issue of inconsistent floor stock among ADCs identified in the

17
root cause analysis, this suggests that our interventions are sustainable and within reasonable
required resources to maintain.
Recommendations for Future Research
Owing to time constraints, not all elements of the Six Sigma steps were completed;
specifically, the value stream map for the ideal state of the improved pharmacy process system
was not constructed. This would have served as a valuable reference tool for staff to maintain
standardization and efficiency, and would be recommended for further development in the
quality improvement initiative for missing medications at KGH.
Given the results of the pilot study and positive feedback from pharmacy and nursing
staff, the project team agreed to accept and continue the changes implemented on the three
experimental floors in the study. We recommend that other nursing units be considered for the
same interventions, particularly those with dual cabinets and with a high volume of missing
medications. It should become the duty of a dedicated staff member trained in the system of
automated dispensing cabinets and pharmacy information systems who monitors and implements
these changes.
Finally, subsequent opportunity analysis of other leading causes of missing medications
using LEAN Six Sigma approaches is strongly encouraged for future projects. Each root cause of
missing medication would require a unique assessment. Nurse education, training, and
reorientation strategies are imperative to ensure successful flow of medication to the patient. In
this case, a prospectus outlining the retrieval of a medication from the automated dispensing
cabinet using the “Select Equivalent Med” function shall be distributed as the pharmacy-led
contribution. Similarly, pharmacy technician training on order entry and standardization of this
process is likely to reduce missing medications by reducing errors and supporting seamless
18
integration of information systems. A mandatory information session will be held to standardize
practices for pharmacy order entry that minimize missing medications.
Conclusion
Missing medications are part of a complex drug distribution system at Kingston General
Hospital. A consistent and readily available supply of medication is dependent on the interface of
technology, inventory control, pharmacy and nursing staff, and defined procedures. By
identifying the leading root causes of missing medications at our hospital, LEAN and Six Sigma
theorems provided a systematic approach to evaluate and introduce effective opportunities for
improvement. Adequate investment of resources and continued re-evaluation of practices are
necessary to sustain these successes and ensure they remain relevant. Ultimately, this strategy
has the potential to decrease missing medications and improve satisfaction of nursing staff and
patients.

19
Acknowledgements
Wilma Hopman, Statistician, for providing data analysis
Tammy Irish, ADC Charge Technician, for assistance with the interventions
Ron Koob, for assistance with Pharmacy Informatics
Veronique Briggs and Alan Smith, Pharmacy Co-Directors, for their ongoing support and
assistance with implementation of interventions
All KGH Pharmacy Technicians, for assistance with collection of data

20
References
[1] Chapuis CM, Roustit G, Bal C, Schwebel P, Pansu S, David-Tchouda S,et al.
"Automated drug dispensing system reduces medication errors in an intensive care
setting" Critical Care Medicine 2010. 38(12): 2275-2281.
[2] Yandon R, Guharoy R , Rupert M and Lavassaur M. "Missing medications: a reality or
myth –Resolution of a serious problem via use of automated dispensing units. [Abstract]"
ASHP Midyear Clinical Meeting 2002. 37:498.
[3] Al-Araidah O, Momani A, Khasawneh M and Momani M. "Lead-Time Reduction
Utilizing Lean Tools Applied to Healthcare: The Inpatient Pharmacy at a Local Hospital"
Journal for Healthcare Quality 2010. 32(1): 59-66.
[4] Bevan H, Westwood N, Crowe R and O'Connor M. "Lean Six Sigma: some basic
concepts" [Online]. NHS Institute for Innovation and Improvement". Available:
http://www.northamptongeneral.nhs.uk/downloads/ourservices/serviceimprovement/tools
forimprovement/leansixsigma.pdf. [Accessed 25 November 2015]
[5] American Society of Health-System Pharmacists. "Quality Issue Brief, Applying LEAN
to the Medication Use Process –Issues for Pharmacy" [Online]. Available:
http://www.ashp.org/menu/PracticePolicy/ResourceCenters/QII/Learn-About-QI.aspx.
[Accessed 24 November 2015].
[6] Newell TL, Steinmetz-Malato LL and Van Dyke DL. "Applying Toyota Production
System Techniques for Medication Delivery: Improving Hospital Safety and Efficiency".
Journal for Healthcare Quality 2011. 33(2):37-46.
[7] Sobek DK and Jimmerson C. "Applying the Toyota production system to a hospital
pharmacy," in Industrial Engineering Research Conference, Portland, Oregon, 2003.
Available from: http://www.montana.edu/dsobek/a3/ioc-
grant/documents/IERC_2003.pdf [Accessed 19 August 2016]
[8] George ML, Roawlands D, Price M and Maxey JK. The Lean Six Sigma Pocket
Toolbook. New York, NY: McGraw-Hill, 2005.
[9] Graban M and Lefteroff L. "Lean and Process Excellence at Kingston General Hospital"
[Online] Lean Manufacturing, Society for Manufacturing Engineers, 2008. Available
from: http://cdn.markgraban.com/wp-content/uploads/2012/03/SME-YB-2008-
KINGSTON.pdf [Accessed 19 August 2016].

21
Tables
1. Demographic Characteristics of Medications (Baseline Investigations)
Characteristic Frequency (n=83) Percentage (%)
Not truly missing 25 30.5
New Order 24 28.9
Multi-dose item 18 21.7
Repeat missing 10 12
Non-formulary item 7 8.4
Location (Nursing Unit)
Kidd-2 ICU 14 16.9
Connell 10 10 12
Davies-4 ICU 9 10.8
Connell 9 8 9.6
K6 6 7.2
K9 6 7.2
K3 5 6.0
C3 + C3(short stay) 5 6.0
K7 4 4.8
2. Primary Reasons for Missing Medications (Baseline Investigations)
Identified Primary Reason Frequency Percentage
nurse unable to locate 23 27.70%
not in patient-specific bin 20 24.10%
patient transfer 14 16.90%
ADC wardstock depleted 8 9.60%
pharmacy order entry issue 7 8.40%
pharmacy inventory issue 5 6.00%
could not identify 4 4.80%
pharmacy dispensing error 2 2.40%
TOTAL 83 100

22
3. Comparative Retrospective Analysis Summary Results
Number of Missing Medications (%)
Pre-Interventions
December 2015
Post- Interventions
March 2016
Total
Experimental
Group
(C9, C10, K7)
28 (23.93) 11 (12.36) 39
Control group
(All other floors) 89 (76.07) 78 (87.64) 167
Total 117 89 206
χ2 = 4.410; p =0.0357
4. Congruence between A and B cabinets on a unit post-interventions
% Similarity of Floor Stock
A vs B cabinets
March 2016
(At completion of Interventions)
June 2016
(3 months after completion)
K7 89.0 90.4
C9 88.8 84.3
C10 88.7 87.7

23
5. Congruence between individual cabinets post-interventions
% Similarity of Floor Stock
Individual Cabinets
June 2016
(3 months after interventions)
K7A 95.3
K7B 98.5
C9A 95.0
C9B 95.0
C10A 91.7
C10B 95.5

24
Figures
Figure 1: LEAN Six Sigma Framework
LEAN
Focus on value-added solutions
Plan
DoStudy
Act
Define
What is the problem?
Measure
How are we doing?
Analyze
What are the sources of system
failure?
Improve
Which solution(s) will be
implemented?
Control
How can we sustain the
improvements?
25
Figure 2: Map of Methods
PSB: Patient-specific bin; ADC: Automated dispensing cabinet
Baseline Prospective Investigations
DECEMBER 2015
INTERVENTIONS
(K7, C9, C10 Nursing Units)FEB - MAR 2016
Comparative Retrospective Analysis
Proportion of Missing Meds
REASSESSMENT
Workload
Additional PSB Items
FEBRUARY 2016
Customer Experience Nurse Survey
APRIL 2016
Sustainability
Floor Stock Deviation
JUNE 2016
Pre
DECEMBER 2015
Post
MARCH 2016
1. Software Setting for PSB
2. Standardization of ADC Floor Stock
Process Mapping, Root Cause Analysis,
Intervention Analysis
JAN 2016

26
Figure 3: Baseline Investigations, Time of Recorded Missing Medications
Figure 4: Baseline Investigations, Missing Medications by Nursing Unit
0
5
10
15
20
25
30
35
40
45
50
07:30-10:29 10:30-13:29 13:30-16:29 16:30-19:29 19:30-22:30
Pe
rce
nta
ge o
f M
issi
ng
Me
dic
atio
ns
Time block
Time of day medications went missing for tracked items
K2ICU17%
C1012%
D4ICU11%
C910%
K67%
K97%
B47%
K36%
K75%
Other18%
Missing Medications by Nursing Unit
K= Kidd, C=Connell, B=Burr, D= Davies, ICU= Intensive Care Unit
27
Figure 5: Baseline Investigations, Reasons for Missing Medications
nurse unable to locate28%
not in patient-specific bin
24%patient transfer
17%
omnicell wardstock depleted
10%
pharmacy order entry issue
8%
pharmacy inventory issue
6%
could not identify5%
pharmacy dispensing error
2%
Identified Primary Reason for Missing Medications

28
Figure 6a: SIPOC Process Flow Diagram, Order Entry
Process Name: Pharmacy Order Entry
Order to be entered
with correctly
matched patient on
Pharmacy
Information System
(PIS) Order Tab
screen
Pharmacy
Technician enters
order using the
appropriate
mnemonic for the
medication, and
selects strength,
dosing schedule,
time, directions
Pharmacy
Technician chooses
dosage strength
according to
available strengths
in the ADC in the
patient’s location.
If multiple
strengths, the
lowest strength is
entered (trial and
error process)
Pharmacy
technician fills the
unit quantity field
to send a 24 hour
supply of
medication(until
the PSB will be
filled) if the
medication is not
normally stocked
on the floor ADC
Pharmacy
technician
completes entry of
order including any
supplementary
notes and
therapeutic
interchanges and
consults with
Pharmacist about
Medispan®
warnings not
previously
anticipated
Once processed,
pharmacy
technician
initials order
and places it on
the outside
window for the
dispensary
technician to
check

29
Suppliers Inputs/Specifications Process Outputs/Requirements Customers
Patient Care Orders Nursing and ward clerk staff to send order Pneumatic Tube System
Pharmacy Technician entering orders with knowledge of wardstock Order which has been reviewed and marked to enter by Pharmacist Pharmacy Information System (PIS) Interface between ADC and PIS displaying med attribute (Ctrl-Acc Cab)
See Steps Above Order profiled in PIS Order profiled in ADC for floor stock items Patient Specific Bin (PSB) assigned to patient for non-floor stock items by next report time Label prints for orders requiring submission of interim dose(s) Wardstock technician alerted of requirement to fill PSB via restock report (0730 &1730 h)
Dispensary and Wardstock Pharmacy Technicians Nurses able to access medication from ADC profile Patients

30
Figure 6b: SIPOC Process Flow Diagram, PSBs
Process Name: Configuration of Patient Specific Bins (PSBs) in Automated Dispensing Cabinets (ADCs)
Order entered in
the PIS for a
medication not
normally stocked
in the floor cabinet
Medication is
profiled to the
patient’s ADC
profile on the unit
through an
interface between
PIS and ADC
software
ADC Software
(program for PSB is
“Singlepointe”)
recognizes that a
medication is not
normally stocked in
the cabinet and
must be configured
to a patient-specific
bin
At the next
corresponding
report time (either
0730h or 1730h), a
PSB Restock List
will print for each
ward, issuing the
new medication to
the PSB in the ADC
that is assigned for
that patient bed
location on the unit
The Report will
calculate a PAR
(minimum) level
for the number of
unit dose
medications to
restock based upon
the required dose
Pharmacy
wardstock
technician
reads report
and selects
medication
from the
dispensary in
order to fill the
cabinet’s PSB
Suppliers Inputs/Specifications Process Outputs/Requirements Customers
Patients and Prescribers Nursing and ward clerk staff to send order
Order Entry Pharmacy Technician Order for a medication not already stocked in the ADC on the unit where the patient is located PIS ADC Interfacing capability with PIS and ability to synthesize data to generate report
See Steps Above Information System Pharmacist (responsibilities include maintaining medication catalogue with attributes and new entries) Correct strength of medication must be selected by entry technician In the Restocking set up screen in ADC software (Omnicentre®), medication must be checked “on” for “PSB Autofill” to be included in Restock reports
Wardstock Pharmacy Technicians Nurses able to access medication from ADC profile Patients
31
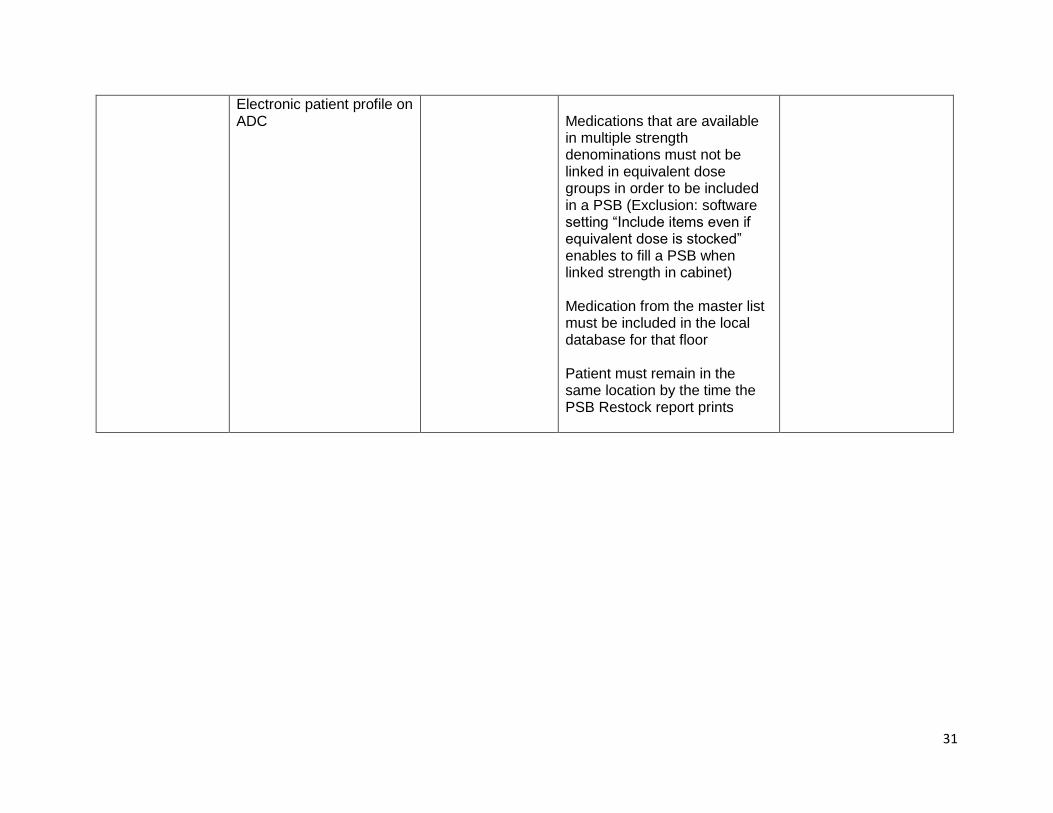
Electronic patient profile on ADC
Medications that are available in multiple strength denominations must not be linked in equivalent dose groups in order to be included in a PSB (Exclusion: software setting “Include items even if equivalent dose is stocked” enables to fill a PSB when linked strength in cabinet) Medication from the master list must be included in the local database for that floor Patient must remain in the same location by the time the PSB Restock report prints
32
Figure 7a: Cause and Effect Analysis, Equivalent Dose Medications
Problem: Medication will
not display on Restock List
if there is a linked
strength in the cabinet,
leading to missing
medications
Equipment
Materials
Process People
Management
Floor stock and equivalent
dose groups not reassessed
or monitored
ADC software and
Pharmacy
Information System
not well-synced
operationally
Inconsistent
technician entering
practices; speculation
that entering lowest
strength solves
problem
No clear procedure on
entry of separate
orders/strengths
Medications within
an equivalent dose
group not
identifiable / marked
Incomplete roll out of order
entry manual and SOP;
mixed messages to staff
No clear guidelines
for maximum #
tablets per “dose”
Floor stock list not easily
accessible
Nurses unaware
of how to use
equivalent dose
feature
Reluctance to trial and error
of system/ setting changes
No step for floor
stock technician to
manually inspect
PSB restock list
33
Figure 7b: Cause and Effect Analysis, Pharmacy Order Entry
Problem: Inconsistent
quantities sent for
initial doses, leading to
missing medications
Equipment
Materials
Process People
Environment Management
Item attribute in PIS may
be incorrectly assigned
Lack of
calculators
at entry
station
Pharmacy Information
System (PIS) does not
alert technician if a
dose must be sent
Entry technicians
perform calculations in
head under pressure
Patient Specific Bin
(PSB) fill times not
guaranteed (lack of
standardization)
Nursing administration
times not always
aligned with pharmacy
One size fits all
training rule to send
24 hour supply not
always applicable
Lack of consideration
for dosing schedule
& frequency
Extraneous
distractions; forget to
change quantity field
Confusion between
# of doses and # of
tablets
Not all
technicians
trained /
scheduled the
order entry role
to same extent
Procedure for sending
interim doses not
consistently defined
Patients transfer
and may require
new interim doses
No reference
guide or standard
operating
procedure to
assist entry
technician Lack of
communication
between staff

34
Equipment
Figure 7c: Cause and Effect Analysis, Floor Stock and PSB Assignment
Competing priorities:
technician fills PSB and
is called stat to
replenish floor stock
Nurse may remove from
floor stock instead of PSB,
floor stock becomes
prematurely depleted
Problem: When there are
two cabinets on a nursing
unit, the PSB and floor
stock are commonly cross-
assigned, leading to
missing medications
Process People
Environment Management
Insufficient space for all PSBs
in one cabinet
Floor stock is not
standardized across both
cabinets on the same ward
Lack of routine floor
stock reassessment by
pharmacy staff
Unclear procedure for
sending interim doses for
medications that could be
PSB or floor stock
No capacity to override
PSB assignment at order
entry
Pharmacy technicians add
or remove stock items
without approval or review
Nurse unaware to check
alternate cabinet
ADC software does not
prompt user to location of
PSB medication at the
patient profile screen
No enforcement of
policy to manage control
of floor stock
Lack of time to check both
cabinets and sign into second
cabinet for the remaining
medications
Inconsistent, unclear labelling
of bed numbers on ADCs to
indicate PSB assignment
Human resource
constraints
Incomplete or
inadequate training for
new staff on ADC
operation
Poor interfacing between pharmacy
software and ADC software; systems do
not have same capability to interpret
received data

35
Figure 8a: PICK Chart, Equivalent Dose Groups
0
0.5
1
1.5
2
2.5
3
3.5
0 0.5 1 1.5 2 2.5 3 3.5
Imp
act
Effort
Intervention Analysis (PICK Chart)Equivalent Dose Groups
Apply setting for PSBs: "Include item whereequivalent dose med stocked"
Provide more rigorous ADC training andeducation for nursing staff on doseequivalency function
Make mandatory that technician printdouble label upon call of missing medicationto prompt wardstock technician to manuallyadd and monitor PSB (status quo +1)Update order entry manual for CombinationOrders
Program Pharmacy Information System (PIS)to identify all available cabinet strengths of aparticular medication at the order screen
Hold training and re-education session onorder entry updates for pharmacytechnicians
Include all strengths of a tablet in the cabinetif they are linked
Manually customize dose linkage groups bymedication
Enable Omnicentre ADC reports and PISscreens to identify linked medications by amarking
Implement
Possible
Challenge
Kill
36
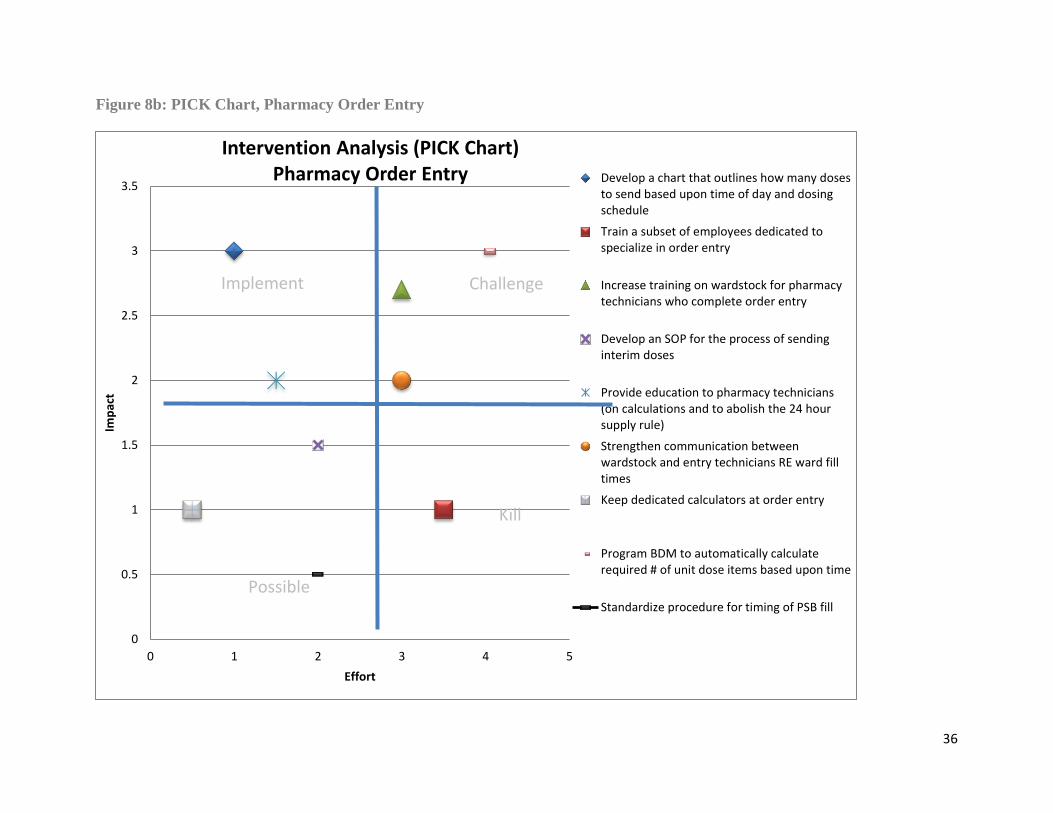
Figure 8b: PICK Chart, Pharmacy Order Entry
0
0.5
1
1.5
2
2.5
3
3.5
0 1 2 3 4 5
Imp
act
Effort
Intervention Analysis (PICK Chart)Pharmacy Order Entry Develop a chart that outlines how many doses
to send based upon time of day and dosingschedule
Train a subset of employees dedicated tospecialize in order entry
Increase training on wardstock for pharmacytechnicians who complete order entry
Develop an SOP for the process of sendinginterim doses
Provide education to pharmacy technicians(on calculations and to abolish the 24 hoursupply rule)
Strengthen communication betweenwardstock and entry technicians RE ward filltimes
Keep dedicated calculators at order entry
Program BDM to automatically calculaterequired # of unit dose items based upon time
Standardize procedure for timing of PSB fill
Implement
Possible
Challenge
Kill
37
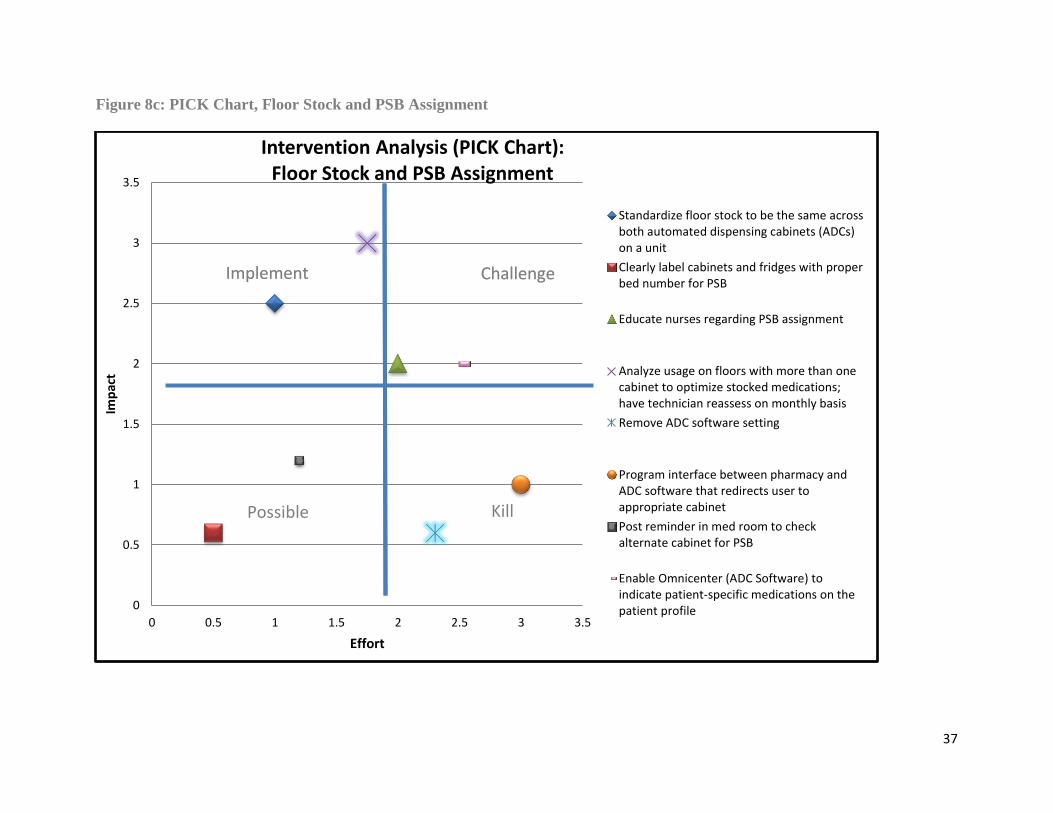
Figure 8c: PICK Chart, Floor Stock and PSB Assignment
0
0.5
1
1.5
2
2.5
3
3.5
0 0.5 1 1.5 2 2.5 3 3.5
Imp
act
Effort
Intervention Analysis (PICK Chart): Floor Stock and PSB Assignment
Standardize floor stock to be the same acrossboth automated dispensing cabinets (ADCs)on a unit
Clearly label cabinets and fridges with properbed number for PSB
Educate nurses regarding PSB assignment
Analyze usage on floors with more than onecabinet to optimize stocked medications;have technician reassess on monthly basis
Remove ADC software setting
Program interface between pharmacy andADC software that redirects user toappropriate cabinet
Post reminder in med room to checkalternate cabinet for PSB
Enable Omnicenter (ADC Software) toindicate patient-specific medications on thepatient profile
Implement ChallengeImplement
Possible
Challenge
Kill
38
Figure 9: Intervention #1 Assessment Workload
0
20
40
60
80
100
120
140
160
K6 K7 C9 C10
Number of items assigned to patient-specific bins (PSBs)
Nursing unit
Impact of software setting on patient-specific bin stocking (workload measurement)
February 2-9, 2016
Additionalitems (dueto change)
Usual items

39
Figure 10: Retrospective Comparative Analysis Results
0
5
10
15
20
25
30
35
40
14-Dec 15-Dec 16-Dec 17-Dec 18-Dec 14-Mar 15-Mar 16-Mar 17-Mar 18-Mar
Nu
mb
er
of
mis
sin
g m
ed
icat
ion
s p
er
day
Date
Missing medications pre and post-change
Other floors Experimental Group (K7, C9, C10)

40
Appendices
A. Description of Automated Dispensing Cabinets at KGH
The floor stock inventory kept in the automated dispensing cabinets (ADCs) at KGH is
customized to specific demands and volume of the nursing unit. Some nursing units with a high
patient volume are equipped with two ADCs (A and B), which were intended to contain identical
floor stock (this was not preserved). Each automated dispensing cabinet has several bins reserved
for patient-specific medications that are not already stocked in the cabinet’s wardstock. ADCs
range in size and the largest capacity at Kingston General Hospital are termed “double-wall”.
B. Definition of Terms
Equivalent Dose: Term used to describe a dose that can be totaled in more than one way using
different strengths of the same medication
Equivalent Dose Group: Predefined collection of medications available in multiple strengths
that are linked in the pharmacy information system and ADC software
Patient-Specific Bin (PSB): A compartment in the ADC intended for storage of unit dose
medications that are not routinely floor stocked
Missing Medication: A medication that is not available for the nurse to administer at the time it
is due (for a scheduled medication) or necessary (for PRNs). Several categories of missing
medications were established:
New: Order for the medication was entered by pharmacy <24 hours after discovered
missing
Refill: Order was entered ≥24 hours since personnel have reported it missing

41
Repeat: medications found to be missing on two or more consecutive occasions, at least
4 hours after the pharmacy has resent the medication
False missing: medication that is not truly missing and was appropriately delivered to the
floor in a timely manner
SIPOC Diagram: A type of process map that identifies its basic elements; the Suppliers, Inputs,
Process (and its boundaries), Outputs, and Customers. The SIPOC diagram is often completed at
the beginning of a project to align its scope and goals before work is planned.
PICK Chart: Process tool used to prioritize opportunities for improvement. Each opportunity is
assigned a relative score for estimated impact and required resources and plotted onto four
quadrants: Possible (low impact, low resource), Implement (high impact, low resource),
Challenge (high impact, high resource), and Kill (low impact, low resource)
Plan-Do-Study-Act (PSDA) Cycle: A four-step model for efficiently testing a change to a
process (often on a small scale) in pursuit of continuous quality improvement of the larger scale
Kaizen: term to describe a method of accelerated process improvement conducted and
implemented immediately (also referred to as “opportunity burst”)

42
C. Description of Interventions
The project team elected to target the leading pharmacy-related cause for missing medications
(“not in patient-specific bin”) and its associated root causes. One of the issues under this
umbrella cause was that the pharmacy information system would not trigger assignment of
medications linked in an equivalent dose group (e.g. medications that are available in multiple
strengths, see Appendix B) to the patient-specific bin. During the investigations period, a
software update to the information system that manages patient-specific inventory became
available, providing a setting that would direct all medications into patient-specific bins
independent of the strengths available in floor stock. Enabling this feature was expected to
decrease the number of missing medications, as it would circumvent the issue with the
equivalent dose groups. However, it would also directly increase the volume of patient-specific
bin items to be filled and managed by pharmacy. The first intervention was run as a rapid
improvement cycle (Kaizen, see Appendix B) and trialed for a week period on C9, C10, K6 and
K7. Pharmacy staff tracked workload measurements for stocking patient-specific bins. It was
decided by the pharmacy manager that the increase in patient-specific item volume was
negligible and justifiable in the context of a perceived decrease in missing medication requests.
The second intervention was chosen as a complement to the initial Kaizen opportunity, since the
software setting functions optimally when floor stock is standardized across both cabinets. A
pharmacy technician trained in ADCs was assigned the task, which was completed on three of
the four inpatient units (C9, C10 and K7). Steps followed:
i. Using the current Floor Stock Inventory Report, compared the A and B cabinet inventory
to identify discrepancies
43
ii. Using the PAR vs. Usage Report, identified items that are not often used on that floor and
removed these
iii. Using the Equivalent Dose Groups Report, identified medication strengths which could
be added to the floor stock for that unit and added these
iv. Using the PSB report, identified items that are frequently assigned as PSBs and added
these, space permitting
Finally, both cabinets on C9 were physically expanded to contain an additional drawer of
medications
The nursing units targeted (C9, C10, and K7) were among those identified in the baseline
analysis as having the greatest proportion of missing medications and each unit houses two
double-wall ADCs.

44
D. Project Scope Revision Log
# Date Requested by Proposed Change Assessment and Impact
Summary
Final Decision/
Approval 1.0 2016-01-
25 Project Manager, Maria Marchese
A subset of the missing medications whose reason for being missing was originally labelled as “not in PSB” will have to be re-classified as “impacted by order entry” and a new proportion (of total 83 missing medications) will be recalculated for this category.
After the stakeholder meeting discussing the results of the data collection, the project team selected order entry and setup of patient specific bins (PSBs) as a prioritized area to focus our interventions. Many medications that are missing from PSBs are closely related to how medications are profiled in the pharmacy information system (PIS) and interfaced with ADC software.
NOT ACCEPTED
1.1 2016-01-25
Patient Quality Advisor, Sue McIlroy
A value stream map will not be conducted for the initial state. Instead, the project team will engage in root cause analysis to examine the underlying problems at order entry that are causing missing medications. Possible solutions to several priority issues will be brainstormed and documented. The future state map displaying the ideal processes and procedures will be constructed at a later date and serve as a tool for continuous improvements in this project field.
The issues behind missing medications were successfully identified from the Pareto-style analysis of the December initial investigations period. It was deemed unnecessary to produce a current state map as it would not serve any additional value and would also be difficult to force a “fit” for mapping errors.
ACCEPTED
1.2 2016-01-25
Preceptor, Nancy Burge
Success for the project will be defined as a 50% relative decrease in the proportion of medications that are classified as being impacted by pharmacy order entry, from the initial data collection period in December, to the final data collection period in the Spring (date TBD). The Timeline report may be produced at the conclusion of the interventions.
As we will be focusing only on issues related to order entry, it would not be wise to utilize the Timeline report as the primary measure of success for the project. As described in the project management plan, and confirmed through sequential run comparisons, the Timeline report has limitations; it appears to be highly variable, and does not capture all medications that may be reported as missing. In addition, it would be difficult to predict and demonstrate a significant reduction in total missing medications if only a subset will be impacted by the project.
ACCEPTED; Wilma Hopman, statistician for the project, has approved this amendment as it relates to the statistical analysis.

45
1.3 2016-01-25
Preceptor, Nancy Burge
The project manager will undertake a subsequent data collection period in the Spring of 2016, aiming to follow up on approximately 80 missing medications with the same inclusion and exclusion criteria as defined in the study protocol. It will be conducted in a similar manner to the December data collection with the following exception: Rather than assigning one of eight categorical reasons for being missing, missing medications will be labelled as either “impacted by order entry” or “other-not impacted by order entry”. The final percentage of total missing medications during the data collection period determined to be impacted by order entry will be compared to the initial percentage to determine success.
This post-change measurement is more specific in its ability to confidently assess the impact of the project’s interventions. This method closely mirrors the pre-test data collection and would replace the report measure. It would be outside of the time constraints of this study and irrelevant to reproduce categorization of all potential reasons for missing medications (e.g. nurse unable to locate) that were not targeted in the interventions.
NOT ACCEPTED (due to availability of Timeline Report to now give location)
1.4 2016/03/18 Patient Quality Advisor, Sue McIlroy
The project manager should engage in surveying front-line nursing staff to obtain some opinions of missing medications.
Would enrich the results and obtain a qualitative perspective on the impact of the PDSA cycle intervention. Provides data to support or refute the statistical findings
Accepted
Other updates: Gunther Ha, Pharmacy IS Specialist, has relocated from KGH, and subsequently will be removed from the Project Team List. PY
Lau, an Information Systems Pharmacist at KGH, will fulfill this role along with Ron Koob for the remainder of the project.
Planned interventions (PDSA cycles) will be emailed to RAC committee as requested once finalized by project team.

46
E. Missing Medication Documentation Form
The technician who receives the request for the missing medication will document the time, their initials, and any other relevant information
pertaining to the medication and its potential cause for being missing. The technician will then proceed to print a duplicate no charge label from
the patient profile in the Pharmacy Information System. If the technician deems that the medication must be sent, it will be recorded and
investigated further by the project manager.
# Time Label If label unavailable: Gather ward, CR#, medication
Sent? Initial Notes / Reason for Missing /Insights
1
X
MM
Ex. 0906h –C9 – CR XXXXXXX, venlafaxine XR 150 mg, pt admitted last night and pharmacy missed entry
Or 0906h –D4ICU –CR XXXXXX, tetracycline 250 mg, was in PSB, nurse now found
2
3
4

47
F. Primary Analysis – Sample Data Entry Sheet
Missing Meds Data Entry Sheet
Day Time
Tech Pt.
code ward medication
Collateral med info
Sent
or not
Actually
missing or not
new
vs refill
Repeat?
Dosage Form type (oral solid,
oral liquid, topical
preparation, multi-dose)
Formulary
vs. NF vs. Pat Own
Cost /
sent
dose
Identified
Primary Reason
Notes and Comments

48
G. Survey of Nursing Staff Data Sheet
Date: _____________________________
Ward:
K7
C9
C10
K9 (no changes)
K6 (no changes)
K4 (no changes)
Name (optional):________________
Open- ended Feedback:
_____________________________________________________________________________________
_____________________________________________________________________________________
_____________________________________________________________________________________
Specific Questions:
Have you noticed a change in the demand for missing medications on this floor, specifically for Omnicell® and patient specific bins (effective March 2016)? Increase? Decrease?
The Omnicell® stock in each cabinet is more equal and expanded to contain a larger variety of strengths for drugs that come in multiple strengths. Were you informed? Have you noticed? Has this improved your ability to prepare medications in a timely fashion? If not, what barriers have you come across?
Have you had any difficulties accessing medications that are profiled correctly in Omnicell® using the equivalent dose option? Do you find that providing the most appropriate strength(s) to make up a patient’s dose will improve patient care by decreasing burden of # of pills?