Applying 6 Sigma Roadmap for Improving QualityApplying 6 Sigma Roadmap. for Improving Quality....
17
Mohsen Shah Baghi 01/05/2015 Applying 6 Sigma Roadmap for Improving Quality
Transcript of Applying 6 Sigma Roadmap for Improving QualityApplying 6 Sigma Roadmap. for Improving Quality....

Mohsen Shah Baghi01/05/2015
Applying 6 Sigma Roadmapfor Improving Quality

Peugeot 405 Seat Production Process
1. Forming of foam pad 2. Assembly of Cushion/ back frame
3. Assembly of injected parts
4. Heating (Wrinkle removing) 5. Inspection & electrical
part test6. Delivery

What is the Polyurethane Foam?
Rise Time Curing Time
ISO Poly
Gel TimeMixing Process and Cream Time
….
Why was this project conducted?
Poor continues flow(Internal Problem)
The defective percentage of Peugeot 405 front seat back polyurethane flexible foam (PUX26)
was highest among other flexible foam products.
Risk of loosing customers due to the poor deliveryPoor DIFOT KPI
Delivered In-Full, On-Time
(External Problem)

Stru
ctur
e of
this
Stu
dy .
. . .
. .
•To Define the problem
•To measure the defective percentage
•To analyze the problem
•To improve the process parameters
•To control the process and go forward for restarting the 6 sigma roadmap for further improvement
M
A
I
C
D

Define PhaseProject Charter
The major customer in Tehran was not satisfied with the delivery time. The DIFOT rate was bellow 90% on January while, other products DIFOT rate were above 98%.
Producing the seat back of Peugeot flexible foam product according to the required DIFOT KPI based on the defined lead time
Reducing the defective percentage of PUX26:• from 2σ to 4 σ level in 3 months• from 4 σ to 5 σ level in another 5 months
Measures: 1-shaping the team, 2-providing required support 3-scheduling the project based on the 6 sigma principles
Problem Statement
Scope
Project Goals and Measures
Expected Businessoutcomes
• Increasing customers’ satisfaction by delivering on time• Saving up to $330K per year by increasing σ level to 5
M
AI
CD
Team
M
embe
rsSI
POC
CTQ
Tre
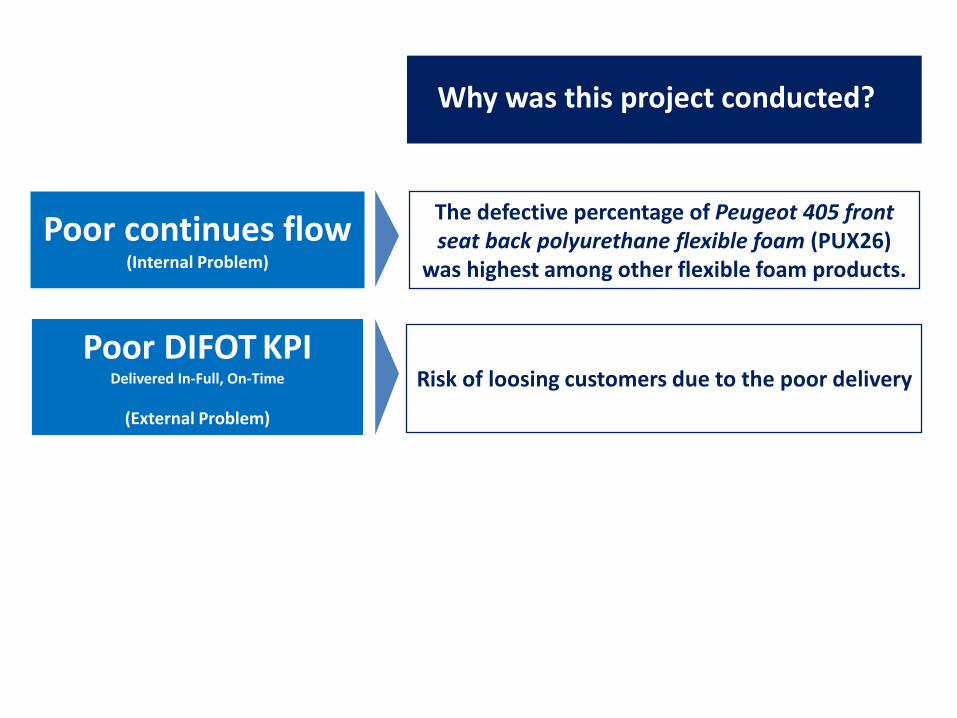
eMeasures in the Define Phase
Suppliers Inputs Process Output Customer
External suppliers Raw material Set up Production report
Internal Dep. and units
Production planning unit Production plan Production steps:
-Mixing components-Chemical reaction and Curing -Demolding and pressing-Trimming and repairing
PUX26Parts
Car manufacturer
Engineering Dep. Machines, molds and equipments
Maintenance Dep. Energy
Quality assurance and control Dep.
Technical documents, records and reports Final control and stock
• Champion (Sponsor): Vali Aslani (QA Manager and ISO TS admin)• Green Belt : Mohsen Shah Baghi• Shift managers, Shift production line supervisors• Maintenance and reliability, Engineering, QA & QC units representatives and OH&S officers
M
AI
CD
Business Need Drivers Business Big Y’s Process y’s
Fulfilling the external and internal customers’ needs
- Improving DIFOT KPI
- Producing products in an acceptable quality and time
- Reducing cost
- increasing reliability
- Reducing raw material consumption
- Reducing operational cost
- Improving OEE KPI
- Optimizing the new material formulation
- Reducing defects & material waste

Data Collection Plan
Sub Process step What Data type How Measured
Sampling notes
Sample size Frequency Who
mold preperation sub process Mold Temperature Continouos Refer to the
quality manualDay- Night shift 250
Injection sub process setup
Iso Temp Continouos Refer to the quality manual
Day- Night shift 250
Injection sub process setup
Poly Temp Continouos Refer to the quality manual
Day- Night shift 250
Injection sub process setup
Polyol Pressure Continouos Refer to the quality manual
Day- Night shift 250
Injection sub process setup
Iso Pressure Continouos Refer to the quality manual
Day- Night shift 250
Injection sub process setup
Poly Ratio Continouos Refer to the quality manual
Day- Night shift 250
Injection sub process setup
Product weight Continouos Refer to the quality manual
Day- Night shift 250
QC sub process Defects Discerete Refer to the quality manual
Day- Night shift 250
Sampling in 10 Day & 10 Night shifts
Qualified QC
Controller officer
M
AI
CD
M
AI
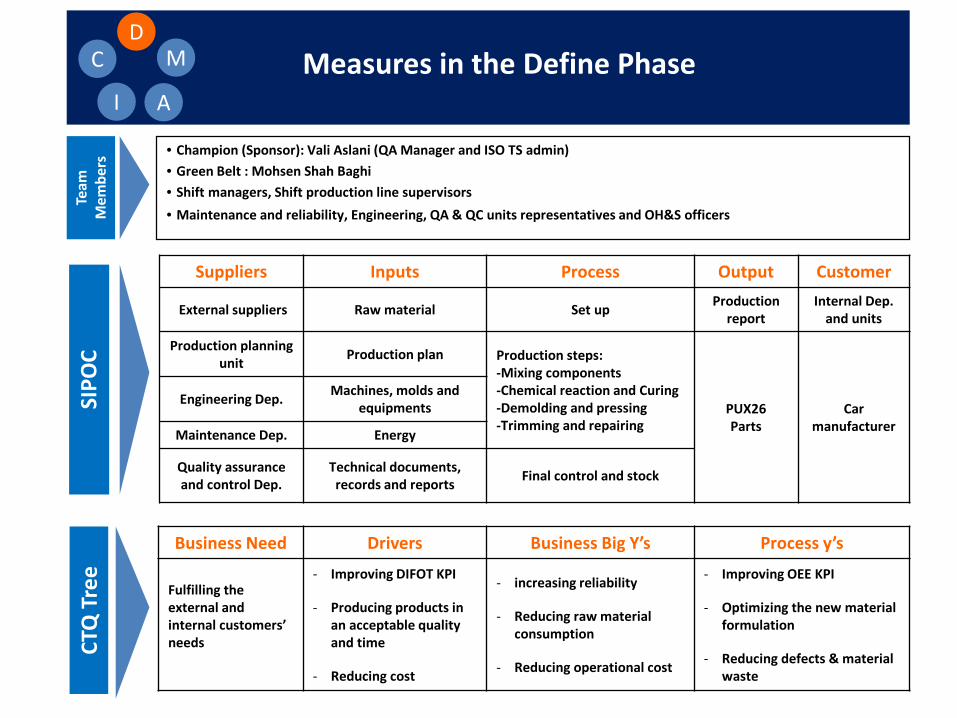
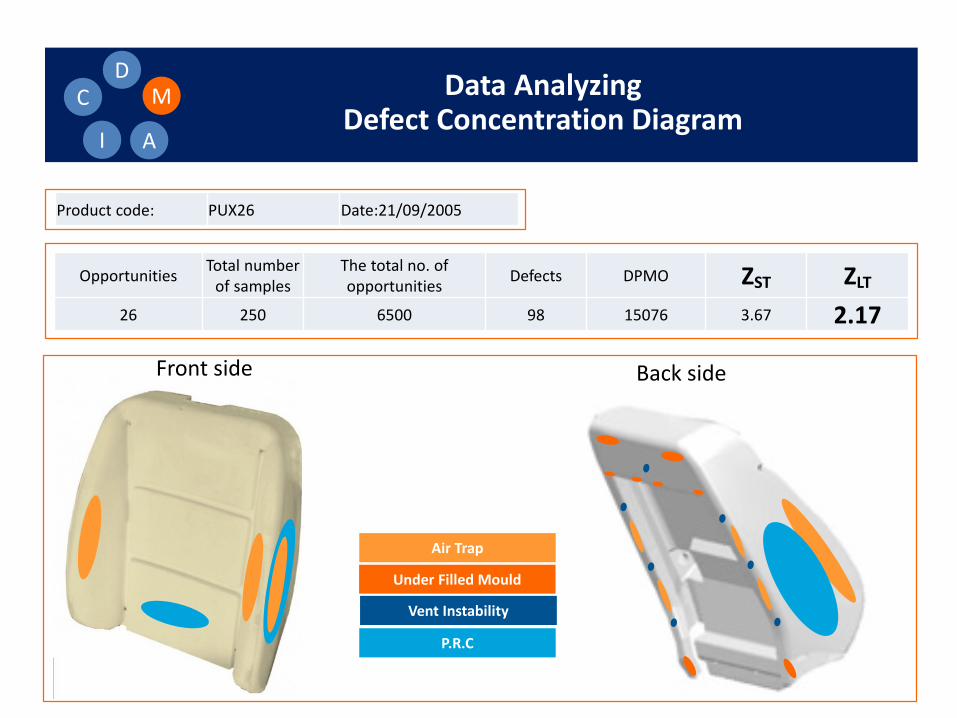
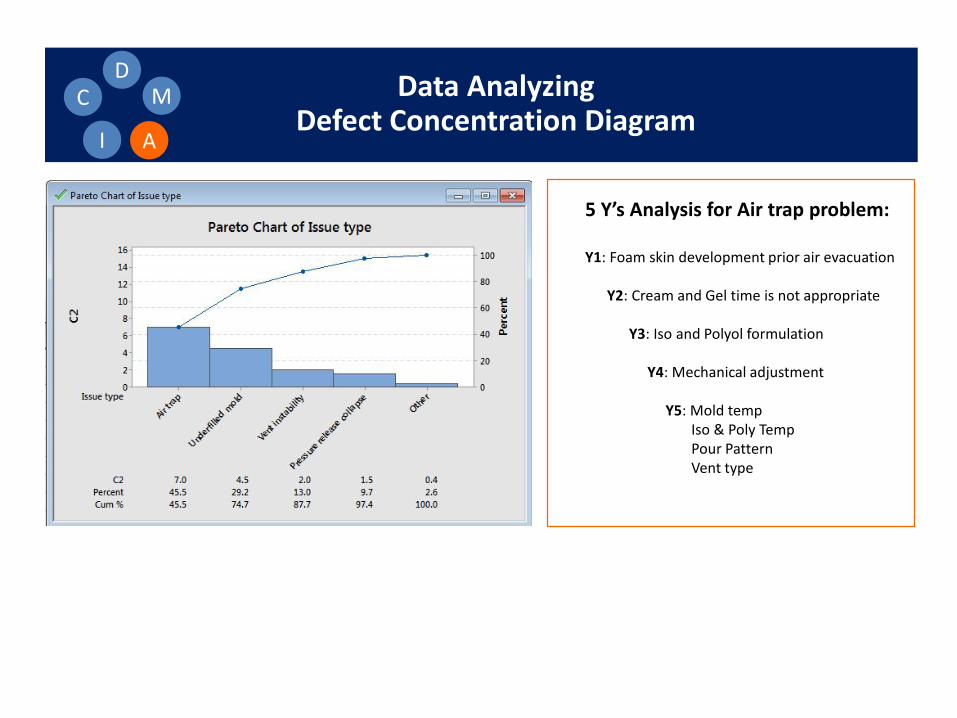
CD Data Analyzing
Defect Concentration Diagram
Front side
Product code: PUX26 Date:21/09/2005
Opportunities Total number of samples
The total no. of opportunities Defects DPMO ZST ZLT
26 250 6500 98 15076 3.67 2.17
Air Trap
Under Filled Mould
Vent Instability
P.R.C
Back side
Data AnalyzingDefect Concentration Diagram
M
AI
CD
5 Y’s Analysis for Air trap problem:
Y1: Foam skin development prior air evacuation
Y2: Cream and Gel time is not appropriate
Y3: Iso and Polyol formulation
Y4: Mechanical adjustment
Y5: Mold tempIso & Poly TempPour PatternVent type
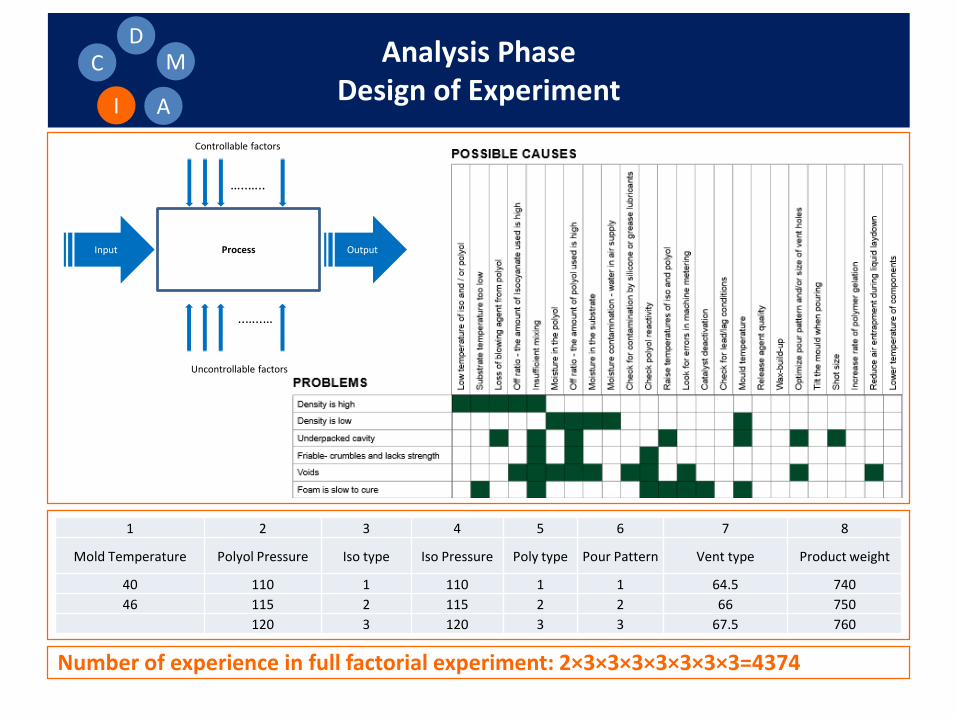
Analysis PhaseDesign of Experiment
1 2 3 4 5 6 7 8
Mold Temperature Polyol Pressure Iso type Iso Pressure Poly type Pour Pattern Vent type Product weight
40 110 1 110 1 1 64.5 74046 115 2 115 2 2 66 750
120 3 120 3 3 67.5 760
ProcessInput Output
Knowledge Attitude
…..…..
Controllable factors
…..…..
Uncontrollable factors
Number of experience in full factorial experiment: 2×3×3×3×3×3×3×3=4374
M
AI
CD

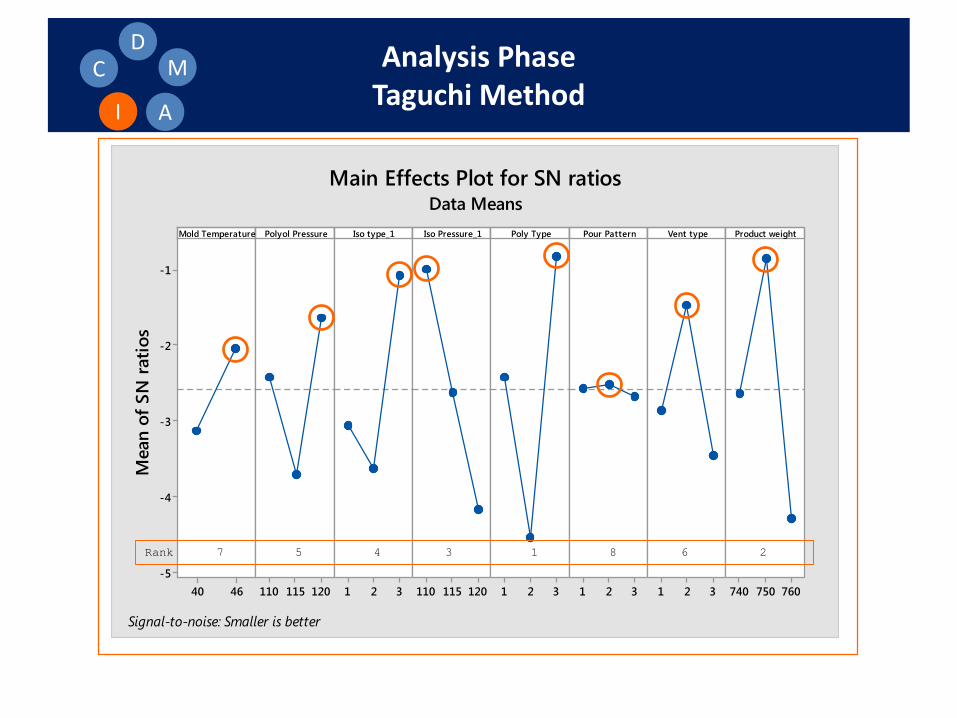
Analysis PhaseTaguchi Method
Taguchi Analysis: Sample 1, Sample 2, ... versus Mold Tempera, Polyol Press, ...
Response Table for Signal to Noise RatiosSmaller is better
Mold Polyol Iso Pour ProductLevel Temperature Pressure Iso type_1 Pressure_1 Poly Type Pattern Vent type weight1 -3.1333 -2.4104 -3.0574 -0.9797 -2.4104 -2.5734 -2.8585 -2.63132 -2.0430 -3.7167 -3.6288 -2.6150 -4.5409 -2.5233 -1.4537 -0.84043 -1.6373 -1.0782 -4.1698 -0.8131 -2.6677 -3.4522 -4.2927Delta 1.0903 2.0794 2.5506 3.1902 3.7278 0.1443 1.9985 3.4523Rank 7 5 4 3 1 8 6 2
Response Table for Means
Mold Polyol Iso Pour ProductLevel Temperature Pressure Iso type_1 Pressure_1 Poly Type Pattern Vent type weight1 1.2667 1.0333 1.2667 1.0333 1.1667 1.2000 1.1667 1.10002 1.0444 1.3667 1.3333 1.0333 1.4667 1.2667 1.0000 0.83333 1.0667 0.8667 1.4000 0.8333 1.0000 1.3000 1.5333Delta 0.2222 0.3333 0.4667 0.3667 0.6333 0.2667 0.3000 0.7000Rank 8 5 3 4 2 7 6 1
M
AI
CD
Analysis PhaseTaguchi Method
4640
-1
-2
-3
-4
-5120115110 321 120115110 321 321 321 760750740
Mold Temperature
Mea
n of
SN
rat
ios
Polyol Pressure Iso type_1 Iso Pressure_1 Poly Type Pour Pattern Vent type Product weight
Main Effects Plot for SN ratiosData Means
Signal-to-noise: Smaller is better
Rank 7 5 4 3 1 8 6 2
M
AI
CD

Analysis PhaseTaguchi Method
4640
1.6
1.5
1.4
1.3
1.2
1.1
1.0
0.9
0.8
120115110 321 120115110 321 321 321 760750740
Mold Temperature
Mea
n of
Mea
ns
Polyol Pressure Iso type_1 Iso Pressure_1 Poly Type Pour Pattern Vent type Product weight
Main Effects Plot for MeansData Means
Rank 8 5 3 4 2 7 6 1
M
AI
CD

Control PhaseSPC
M
AI
CD
191715131197531
751.0
750.5
750.0
749.5
749.0
Sample
Sam
ple
Mea
n
__X=750.029
UCL=751.302
LCL=748.756
191715131197531
4
3
2
1
0
Sample
Sam
ple
Ran
ge
_R=2.207
UCL=4.666
LCL=0
Xbar-R Chart of C1
754753752751750749748747746
99.9
99
9590
80706050403020
105
1
0.1
Mean 750.0StDev 0.9682N 100AD 0.389P-Value 0.379
C1
Perc
ent
Probability Plot of C1Normal - 95% CI

Outcome of the Study
Reducing defective percentage of PUX26from 17% to below 1% in 3 months and 0.1% in another 2 months
Selected projects and actions:
- Performing MSA project on dosing system and increasing process capability above 5σ- Designing new vent to reduce martial scrap - Reducing variations in mold temperature- Analysing the pour pattern - Performing FMEA- Running DOE using Taguchi method - Performing DOE using full factorial analysis - Study validating- Using SPC (statistical process control) to control the key process parameters
Suggestions for future study:
- Using 3 mixing head for pouring 2 arms and body of back seat foam at the same time- Working on other priorities which was highlighted on FMEA
Thank You!
Applying 6 Sigma Roadmapfor Improving Quality
Mohsen Shah [email protected] number: 0469 781 758