Application of Protocols Devised to Study Bi(III) Complex ...
18
Application of Protocols Devised to Study Bi(III) Complex Formation by Voltammetry: The Bi(III)–Picolinic Acid System Caren Billing *† and Ignacy Cukrowski ‡ † Molecular Sciences Institute, School of Chemistry, University of the Witwatersrand, P.O. Wits, Johannesburg, 2050, South Africa ‡ Department of Chemistry, University of Pretoria, Pretoria, 0002, South Africa *E-mail: [email protected]. Phone: +27 11 717-6768. Abstract Bi(III) coordination chemistry has been largely neglected due to the difficulties faced when studying these systems even though Bi(III) is used in various medicinal applications. This study of the Bi(III)– picolinic acid system by voltammetry applies the rigorous methodologies already developed to enable the study of Bi(III) systems starting in very acidic solutions to prevent precipitation. This includes calibrating the glass electrode accurately at these low pHs, compensating for the diffusion junction potential below pH 2 and determining the reduction potential of uncomplexed Bi(III) which cannot be directly measured. The importance of including nitrate from the background electrolyte as a competing species is highlighted, especially for data acquired below pH ∼ 2. From analysis of the voltammetric data, it was not clear whether a ML 3 OH species formed in solution or whether it was a combination of ML 4 and ML 4 OH. Information from crystal structures and electrospray ionization- mass spectrometry measurements was thus used to propose the most probable species model. The log β values determined were 7.77 ± 0.07 for ML, 13.89 ± 0.07 for ML 2 , 18.61 ± 0.01 for ML 3 , 22.7 ± 0.2 for ML 4 , and 31.4 ± 0.2 for ML 4 OH. Application of these methodologies thus opens the door to broaden our understanding of Bi(III) complexation.
Transcript of Application of Protocols Devised to Study Bi(III) Complex ...

Application of Protocols Devised to Study Bi(III) Complex Formation by Voltammetry: The Bi(III)–Picolinic Acid System
Caren Billing*† and Ignacy Cukrowski‡ † Molecular Sciences Institute, School of Chemistry, University of the Witwatersrand, P.O. Wits, Johannesburg,
2050, South Africa ‡ Department of Chemistry, University of Pretoria, Pretoria, 0002, South Africa
*E-mail: [email protected]. Phone: +27 11 717-6768.
Abstract
Bi(III) coordination chemistry has been largely neglected due to the difficulties faced when studying
these systems even though Bi(III) is used in various medicinal applications. This study of the Bi(III)–
picolinic acid system by voltammetry applies the rigorous methodologies already developed to
enable the study of Bi(III) systems starting in very acidic solutions to prevent precipitation. This
includes calibrating the glass electrode accurately at these low pHs, compensating for the diffusion
junction potential below pH 2 and determining the reduction potential of uncomplexed Bi(II I) which
cannot be directly measured. The importance of including nitrate from the background electrolyte as
a competing species is highlighted, especially for data acquired below pH ∼ 2. From analysis of the
voltammetric data, it was not clear whether a ML3OH species formed in solution or whether it was a
combination of ML4 and ML4OH. Information from crystal structures and electrospray ionization-
mass spectrometry measurements was thus used to propose the most probable species model. The
log β values determined were 7.77 ± 0.07 for ML, 13.89 ± 0.07 for ML2, 18.61 ± 0.01 for ML3, 22.7 ±
0.2 for ML4, and 31.4 ± 0.2 for ML4OH. Application of these methodologies thus opens the door to
broaden our understanding of Bi(III) complexation.

2
1. Introduction
Bismuth has been used in medicinal preparations for decades, as highlighted in several review
articles.(1-7) The most widespread use of bismuth compounds is in the treatment of peptic ulcers
where bismuth acts against Helicobacter pylori found in the human gastric mucosa which is
responsible for these ulcers.(3, 8-11) The antibacterial characteristics of bismuth have led to its use
in treating other bacterial or yeast infections.(1, 3, 12-14) The use of bismuth compounds as
antitumor drugs has also been investigated.(1, 5, 15, 16) The 212Bi and 213Bi α-particle emitters show
potential therapeutic value due to their short half-lives (61 and 46 min, respectively) and low
penetration (50–90 μm) which reduces toxicity to the surrounding healthy tissue.(1, 3-5)
Despite the variety of current and possible future medicinal uses of Bi(III), the coordination
chemistry and biochemistry of bismuth are still poorly understood.(1, 3) The deficiency of stability
constant data for Bi(III) complexes is due to numerous difficulties experienced in these studies. The
strong tendency of Bi(III) to hydrolyze in aqueous solutions causes hydrolysis products to form below
pH 1.(17) Furthermore, anions from the background electrolyte form insoluble salts with the
Bi6(OH)126+ polycondensate which precipitates under acid conditions (around pH 2).(18) In this work,
current sampled DC polarography was used to study Bi(III) complexation, since relatively low Bi(III)
concentrations (∼10–5 M) can be used, thereby postponing precipitation to higher pHs and reducing
the extent of formation of polynuclear species. Complexation by certain ligands increases the
solubility of Bi(III), but this must occur at low pH while Bi(III) is in solution. Large ligand-to-metal ion
concentration ratios drive complex formation, thus making voltammetry an ideal technique for these
studies, as this is a requirement to ensure that the solution at the electrode surface during
measurement represents the bulk conditions (generally [L]:[M] > 50).
That being said, several obstacles had to be overcome before this technique could be employed to
produce accurate formation constants. First, the procedure used to calibrate the glass electrode (GE)
had to be reassessed. Usually, when calibrating the GE using a strong acid–strong base titration, it is
recommended that narrow pH ranges (such as pH 2.3–2.9 and 10.8–11.3(19-21)) be used to obtain a
linear response. This is impossible to apply when studies must commence well below pH 2, as in the
case for Bi(III). Thus, procedures to accurately calibrate the GE below pH 2 were developed which
involved taking the slight deviation from linearity in the very acidic region into account so that the
function describing the potential-pH profile represented the experimental values as closely as
possible.(22) Second, in the voltammetric cell used, the diffusion junction potential (Ej) was
significant below pH 2 and increased considerably with decreasing pH. Protocols were developed
using Tl(I) as an in situ reference ion to evaluate and hence account for Ej in the cell used in metal–
ligand equilibria studies at each step in the pH titration.(23, 24) Third, the reduction potential of
uncomplexed Bi(III) (E(Bi)) is required to calculate formation constants. This value cannot be
determined directly, as Bi(III) hydroxide species already exist below pH 2. Additionally, the nitrate
background electrolyte employed which ensured that the Bi(III) reduction waves were reversible
resulted in Bi(III) nitrate complexes forming below pH 3. The methodology whereby E(Bi) was
determined by correcting for shifts in potential due to the formation of these species was also
developed.(25)

3
This paper presents the investigation of the Bi(III)–picolinic acid system. Picolinic acid is
endogenously produced as an intermediate during the degradation of L-tryptophan, an essential
amino acid, and has been shown to have a wide range of immunological, neuro-protective, and
antiproliferative effects in the human body.(26) Since early studies showed that the oral
administration of picolinic acid promoted the absorption of several metals via the small
intestine,(27, 28) studies with numerous metal ions such as Cu(II), Cr(III), Zn(II), and VO(II) have
followed. For example, the complexation of zinc by picolinic acid was shown to increase the
bioavailability of zinc in humans and is present in breast milk.(29)
Table 1. Constants for the Given Equilibria at 25 °C and the Given Ionic Strengths (μ)(33)
equilibrium log β μ (M)
H2O ⇌ H+ + OH
– –13.74 0.5
L– + H
+ ⇌ HL 5.18 0.5
HL + H+ ⇌ H2L
+ (0.86) 0.5
Bi3+
+ OH– ⇌ Bi(OH)
2+ 12.42
a 0.5
Bi3+
+ 2OH– ⇌ Bi(OH)2
+ 23.5 1.0
Bi3+
+ 3OH– ⇌ Bi(OH)3 31.88
a 0.5
Bi3+
+ 4OH– ⇌ Bi(OH)4
– 32.98
a 0.5
6 Bi3+
+ 12OH– ⇌ Bi6(OH)12
6+ 162.78
a 0.5
9 Bi3+
+ 20OH– ⇌ Bi9(OH)20
7+ 266.92
a 0.5
9 Bi3+
+ 21OH– ⇌ Bi9(OH)21
6+ 276.76
a 0.5
9 Bi3+
+ 22OH– ⇌ Bi9(OH)22
5+ 287.30
a 0.5
Bi3+
+ NO3– ⇌ Bi(NO3)
2+ 0.72 0.5
Bi3+
+ 2NO3– ⇌ Bi(NO3)2
+ (0.94) 0.5
Bi3+
+ 3NO3– ⇌ Bi(NO3)3 0.7 1.0
Bi3+
+ 4NO3– ⇌ Bi(NO3)4
– 0.6 2.0
aValues recalculated for 0.5 M ionic strength.(34)
Aside from its biochemical relevance, picolinic acid has been shown to form complexes under very
acidic conditions (due to the low pKa1 value as shown in Table 1) and complexation with Bi(III) has
been studied by voltammetry once before.(30) Their work, however, uses less rigorous
methodologies and the role of the Bi(III) nitrates was not yet realized.(30) The work presented here
is the culmination of various studies done up to this point,(22-25) as it illustrates how the protocols
that were designed to ultimately study Bi(III)–ligand systems are applied.

4
2. Experimental Section
2.1. Materials
Analytical grade reagents and deionized water (resistivity = 18 MΩ cm) were always used. Stock
solutions of 0.100 M Tl(I) nitrate in 0.5 M HNO3 and 0.100 M Bi(III) nitrate in 1 M HNO3 were made as
before.(25) Picolinic acid (PA) was supplied by Aldrich (99%, Milwaukee, USA).
2.2. Instrumentation
Polarographic experiments were carried out in a jacketed cell maintained at 25.0 ± 0.1 °C which
contained electrodes supplied by Metrohm (Herisau, Switzerland) as follows: a dropping mercury
working electrode, a Ag/AgCl (3 M KCl) reference electrode in a 0.5 M KNO3 salt bridge, a platinum
counter electrode, and a combination glass electrode (3 M KCl, Metrohm cat. no. 6.0234.100), as
well as a thermocouple to monitor the solution temperature. A BAS CV27 potentiostat was used as
part of an automated setup as described in detail elsewhere.(31) Current sampled DC polarography
was employed with a step time of 1 s, a current integration time of 100 ms, and a step potential of 4
mV.
Electrospray ionization-mass spectrometry (ESI-MS) was performed using a Thermo LXQ with a linear
ion trap. The capillary temperature and voltage were 200 °C and 24 V, respectively, the ESI voltage
was 3 kV, and the sheath gas flow rate was 10 (arbitrary units). Samples were continuously
introduced into the ionization source using a syringe pump while data was collected. Sample
solutions were purely aqueous and contained 1 × 10⁻⁴ M Bi(III), 1 × 10⁻² M PA, and 0.5 M NO3– to
reflect conditions used when determining formation constants as closely as possible. Solutions were
adjusted to pH 4.0 and 6.9 using KOH.
2.3. Procedure
The GE was calibrated before and after each experiment by the titration of 0.5 M HNO3 by 0.5 M
KOH (both standardized) as described before;(22) thus, pH implies −log*H+] in this work. Three
polarographic-pH titration experiments were performed, each having initial solutions of 0.5 M HNO3
with 1.0 × 10⁻⁵ M Bi(III) and 2.0 × 10⁻⁵ M Tl(I). A polarogram and the GE potential were recorded in
this solution before adding a known mass of PA such that the total ligand-to-Bi(III) concentration
ratios ([PAT]:[BiT]) were 94, 148, or 197. These solutions were then titrated with 0.5 M KOH, with a
polarogram and the GE potential being recorded after each pH step of about 0.1 (see Figure S1 in the
Supporting Information for a selected set of polarograms). An attempt was made to work at a
reasonable ionic strength (μ) of ∼0.5 M while employing very acidic initial conditions; thus, μ did
vary between 0.5 and 0.25 M during the titration because the acid and base solutions did not
contain supporting electrolyte.
The DC reduction waves for Bi(III) and Tl(I) were fitted separately, as before,(25) to determine the
half-wave potentials (E1/2) and diffusion-limited currents (Id) at each pH step. The reduction waves
showed reversible behavior in the presence of picolinic acid (as was previously found in the absence
of ligand in a 0.5 M nitrate solution(25)). The values of Ej (below pH ∼ 2) were calculated as a

5
function of pH using the E1/2(Tl) values as previously described,(23, 24) and hence, the E1/2(Bi) values
were corrected for shifts due to changes in Ej.
Formation constants were calculated using the relationship proposed by Cukrowski(32)
(1)
where E(M) and E(Mcomp) are the half-wave potentials of the free (uncomplexed) and complexed
metal ion, I(M) and I(Mcomp) are the diffusion-limited currents for the free and complexed metal ion,
and [M] and [MT] are the free and total metal ion concentrations, respectively. The subscript pH
indicates the parameters that are functions of pH (for I(M) and [MT], this only applies to account for
dilution when adjusting pH). These parameters are all determined experimentally, except for [M]
which is found by solving mass-balance equations (MBEs) which include the formation constants for
each solution species. Protonation constants for PA, Bi(III)–hydroxide, and Bi(III)–nitrate formation
constants and the dissociation constant for water used in the refinement process when determining
formation constants for the Bi(III)–PA species are given in Table 1. The left side of eq 1, which
calculates the corrected potential shifts, gives the experimental complex formation curve (ECFC)
when plotted vs pH, and the right side of the equation plotted vs pH gives the calculated complex
formation curve (CCFC). The metal–ligand species model and the respective formation constants are
refined such that the CCFC fits the ECFC as closely as possible.
3. Results and Discussion
3.1. Determining Stability Constants from Voltammetric Data Using Dedicated Software
When studying the complexation of Bi(III) by various ligands using polarography, the presence of Tl(I)
as an internal reference is essential. It is used in each experiment to monitor Ej as well as to predict
the value of E(Bi). From similar experiments run without added ligand,(25) it was illustrated that,
once the measured E1/2(Bi) values were corrected for shifts in potential due to Ej and the formation
of Bi(III)–hydroxide and Bi(III)–nitrate species, E(Bi) was determined by averaging these corrected
E1/2 values. The difference in the free metal ion potentials for Bi(III) and Tl(I), i.e., ΔE(M) = E(Bi) –
E(Tl), was determined for five experiments under the same experimental conditions as used in this
work and was found to be 495.3 ± 1.5 mV. Furthermore, a conditional free Bi(III) potential, Ec(Bi),
was determined by correcting only for shifts in potential due to Ej and the formation of Bi(III)–
hydroxides, as would occur in the presence of the Bi(III)–nitrate species.(25) The value of ΔEc(M) =
Ec(Bi) – E(Tl) was found to be 484.5 ± 1.7 mV for the five experiments and only applies in the pH
range where the Bi(III)–nitrate species are dominant in solution. The difference of 10.8 mV between
ΔE(M) and ΔEc(M) is thus due to the formation of Bi(III)–nitrates. It should be noted that both E(Bi)
and Ec(Bi) were calculated using data only up to pH ∼ 2, after which precipitation of a bismuth-oxy-
nitrate species occurred. In an experiment that contains ligand, E(Bi) or Ec(Bi) can be calculated using
these average values for ΔE(M) or ΔEc(M), respectively, and the E(Tl) value determined for that
particular experiment, since Tl(I) does not readily form complexes. In previous studies, no
complexation was observed for [PAT]:[TlT] up to 100 for measurements made up to pH 8.(23, 24)
6
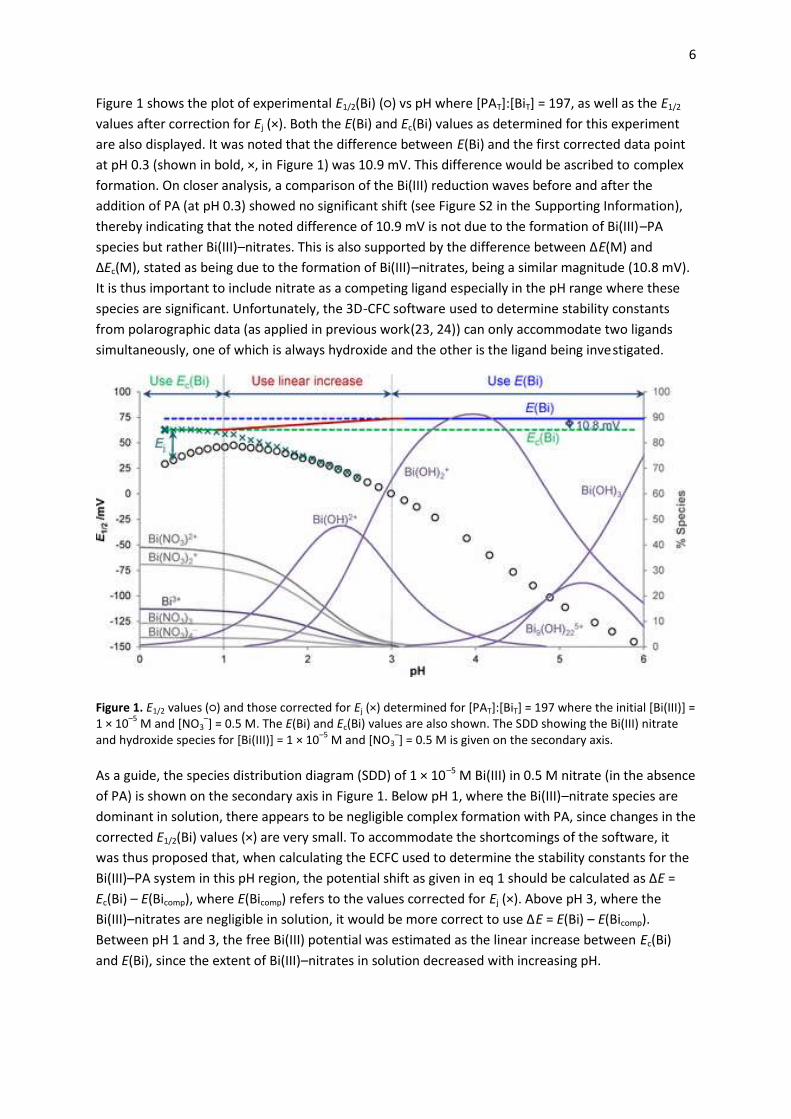
Figure 1 shows the plot of experimental E1/2(Bi) (○) vs pH where *PAT]:[BiT] = 197, as well as the E1/2
values after correction for Ej (×). Both the E(Bi) and Ec(Bi) values as determined for this experiment
are also displayed. It was noted that the difference between E(Bi) and the first corrected data point
at pH 0.3 (shown in bold, ×, in Figure 1) was 10.9 mV. This difference would be ascribed to complex
formation. On closer analysis, a comparison of the Bi(III) reduction waves before and after the
addition of PA (at pH 0.3) showed no significant shift (see Figure S2 in the Supporting Information),
thereby indicating that the noted difference of 10.9 mV is not due to the formation of Bi(III)–PA
species but rather Bi(III)–nitrates. This is also supported by the difference between ΔE(M) and
ΔEc(M), stated as being due to the formation of Bi(III)–nitrates, being a similar magnitude (10.8 mV).
It is thus important to include nitrate as a competing ligand especially in the pH range where these
species are significant. Unfortunately, the 3D-CFC software used to determine stability constants
from polarographic data (as applied in previous work(23, 24)) can only accommodate two ligands
simultaneously, one of which is always hydroxide and the other is the ligand being investigated.
Figure 1. E1/2 values (○) and those corrected for Ej (×) determined for [PAT]:[BiT] = 197 where the initial [Bi(III)] = 1 × 10
–5 M and [NO3
–] = 0.5 M. The E(Bi) and Ec(Bi) values are also shown. The SDD showing the Bi(III) nitrate
and hydroxide species for [Bi(III)] = 1 × 10⁻⁵
M and [NO3–] = 0.5 M is given on the secondary axis.
As a guide, the species distribution diagram (SDD) of 1 × 10⁻⁵ M Bi(III) in 0.5 M nitrate (in the absence
of PA) is shown on the secondary axis in Figure 1. Below pH 1, where the Bi(III)–nitrate species are
dominant in solution, there appears to be negligible complex formation with PA, since changes in the
corrected E1/2(Bi) values (×) are very small. To accommodate the shortcomings of the software, it
was thus proposed that, when calculating the ECFC used to determine the stability constants for the
Bi(III)–PA system in this pH region, the potential shift as given in eq 1 should be calculated as ΔE =
Ec(Bi) – E(Bicomp), where E(Bicomp) refers to the values corrected for Ej (×). Above pH 3, where the
Bi(III)–nitrates are negligible in solution, it would be more correct to use ΔE = E(Bi) – E(Bicomp).
Between pH 1 and 3, the free Bi(III) potential was estimated as the linear increase between Ec(Bi)
and E(Bi), since the extent of Bi(III)–nitrates in solution decreased with increasing pH.

7
Slope analysis of the ECFCs was done to predict the solution species by considering the reduction
reactions occurring, where the slope is approximated as 60/n × the number of protons involved in
the reaction at 25 °C. Slopes of 20, 40, and 60 mV correspond to the reduction of ML, ML2, and ML3
in the pH region where HL is the dominant form of the ligand. Figure 2a illustrates that all three of
these species are thus expected in solution. In the pH region where the ligand is fully deprotonated,
slope analysis can no longer be used provided no MLx(OH)y species are formed (where the value of y
could be determined if there is sufficient data). When including these three species in the model, the
CCFC did not describe the ECFC well and it was clear that other species were present at the higher
pH range. In a previous study of the Bi(III)–PA system by voltammetry, the species model proposed
was ML, ML2, ML3, ML4, and ML3OH.(30) In this case, it was impossible to refine the data when both
ML4 and ML3OH were included. By adding only ML3OH, a good fit was achieved (see Figure 2a), or
alternatively if ML4 was included, the ML4OH species also had to be added to obtain a good fit (see
Figure 2b). The average log β values (for all three titrations) obtained for both species models as well
as those from the literature are given in Table 2. In the Supporting Information, the ECFCs and CCFCs
are shown for each experiment (Figure S3) and the individual results are presented in Table S1.
Figure 2. ECFC (points) for [PAT]:[BiT] = 94 given with the slope analysis. The species models used to calculate the CCFCs (lines) are indicated. Both the ML, ML2, ML3, ML3OH model in part a and the ML, ML2, ML3, ML4, ML4OH model in part b give good fits (solid lines).

8
Table 2. Average log β Values at 25 °C for the Two Species Models in This Work at Ionic Strength 0.25–0.5 M
(K,H)NO3a
log β (this work) log β (this work) log β(30) b
ML 6.94 ± 0.19 6.97 ± 0.16 7.48 ± 0.01
ML2 13.93 ± 0.06 13.92 ± 0.06 13.94 ± 0.01
ML3 18.55 ± 0.06 18.64 ± 0.07 18.10 ± 0.04
ML3OH 28.21 ± 0.08 26.65 ± 0.03
ML4 22.7 ± 0.2 20.47 ± 0.25
ML4OH 31.5 ± 0.2
a These are compared to literature values.
bCukrowski et al.(30) quoted the ionic strength as 0.5 M (Na,H)NO3, but their titration procedure would also
lead to the ionic strength varying from 0.5 to 0.25 M.
Figure 3. SDDs for [BiT] = 10–5
M, [PAT] = 10–2
M, and [NO3–
T] = 0.5 M using the formation constants determined in this work for the species model including ML3OH (dotted lines) or ML4 and ML4OH (solid lines).

9
From the SDDs plotted using data in Table 2, the two possible species models were compared in
Figure 3. It is seen that in the pH range 3–6 the sum of the concentrations for ML4 and ML4OH is
approximately that for ML3OH. These species can all conceivably be formed, since Bi(III) has a highly
variable coordination number (ranging between 3 and 10) and frequently has an irregular
coordination geometry.(1, 3) It is impossible to distinguish which of these species models is correct
using only the polarographic data; thus, both crystal structure data and electrospray ionization-mass
spectrometry (ESI-MS) measurements were consulted to provide further information.
3.2. Using ESI-MS and Crystal Structures to Elucidate the Species Model
The Cambridge Structure Database (CSD)(35) was searched for evidence of structures containing
both PA and Bi(III), and two were found. These showed Bi(III) coordinated to three or four PA ligands
(REFCODES: YIZVEJ and YIZVAF, respectively). Of particular interest here was the structure for the
ML4 arrangement (see Figure S4 in the Supporting Information), where four PA ligands are bonded
bidentately to Bi(III) through pyridyl nitrogen and carboxylate oxygen atoms. Additionally, Na+ ions
interact with two carboxylate oxygen atoms on adjacent PA ligands that are bonded to Bi(III) which
could stabilize the ML4 arrangement. Since some prearrangement occurs in solution before crystal
growth ensues, ML4 could then also be present in solution (with similar interactions with K+ in this
work) especially at the high ligand-to-metal concentration ratios used here.
Burford(36-40) has used EIS-MS to identify various Bi(III)–ligand species in solution. Thus, in order to
further investigate the existence of ML4 in solution, ESI-MS was also used here. The solution
conditions were optimized to promote the formation of the species in question based on the
calculated formation constants (in Table 2). Aqueous solutions with 1 × 10⁻⁴ M Bi(III) were prepared
with an excess of PA required to prevent precipitation ([PAT]:[BiT] = 100). The excess PA was also
needed to ensure ML4 was the dominant species in solution at pH 4.0, if it did form (see the SDDs in
Figure S5 in the Supporting Information). At pH 6.9, either ML3(OH) or ML4(OH) would be dominant.
The mass-to-charge ratio (m/z) range in which data was collected was chosen such that large peaks
due to the excess ligand were excluded as far as possible.
Table 3 gives the peak assignments for the detection of the positive and negative ions at (a) pH 4.0
and (b) pH 6.9 where only m/z of the most abundant isotope is quoted (see Figures S6 and S7 for the
spectra in the Supporting Information). At pH 4.0, the formation of ML4 was clearly seen as the anion
BiL4– and the cation K2BiL4
+, where the latter could be directly correlated to the structure in Figure S4
in the Supporting Information. ML3 is present as KBiL3+ but is not observed in the spectra for
negative ions due to BiL3 being neutral, and no further protons can be lost to produce an anion. At
pH 6.9, a small peak at m/z of 357 indicated the presence of BiL4(OH)2–, but no peak was found at
m/z of 592 to denote BiL3(OH)− at either solution pH. These results clearly reinforce the species
model including ML4 and ML4(OH) rather than ML3(OH).

10
Table 3. Assignment of the Mass Spectra Peaks (Figures S6 and S7 in the Supporting Information) for Positive
and Negative Ions of Species Containing Bi(III)a
(a) pH 4.0
m/z (+ve) assignment (+ve) m/z (−ve) assignment (−ve)
614 KBiL3+ 697 BiL4
–
775 K2BiL4+ 858 KBiL5
–
936 K3BiL5+ 1019 K2BiL6
–
1097 K4BiL6+
876 K3BiL4(NO3)+
977 K4BiL4(NO3)2+
1037 K4BiL5(NO3)+
(b) pH 6.9
m/z (+ve) assignment (+ve) m/z (−ve) assignment (−ve)
614 KBiL3+ 697 BiL4
–
775 K2BiL4+ 357 BiL4(OH)
2–
936 K3BiL5+
1097 K4BiL6+
aSolutions analyzed contained 1 × 10
–4 M Bi(III) and 1 × 10
–2 M PA in 0.5 M NO3
– adjusted to (a) pH 4.0 and (b)
pH 6.9.
Species with the ML5 and ML6 stoichiometry were also detected at both pHs by ESI-MS.
Unfortunately, the relative abundance is not necessarily an indication of the concentration of the
species, as it depends on various other influences such as the efficiency of ionization, the mechanism
of detection, and factors leading to disproportionate transmission of the ions between the ionization
source and the detector. It was thus attempted to include these species in the model when analyzing
the voltammetric data, but their log β values could not be refined. If they were present in solution
under the conditions for the polarographic experiments, they were certainly minor species. Also,
direct correlation between the ESI-MS results and the solution species should be treated with
caution as the temperature and concentration conditions (among others) experienced by the
complexes change as evaporation of the solvent occurs before the ions are left in a gas phase and
analyzed.(41)
When assigning the peaks of species not containing Bi(III) (see Table S2 in the Supporting
Information), it was noted that the ligand underwent polymerization with the inclusion of K+ ions to

11
varying degrees, especially when analyzing solutions at pH 6.9. This is not surprising for ESI, as
adducts could form with other solute or solvent species.(41) The more extensive polymerization of
PA at pH 6.9 could be due to the higher concentration of K+ present and the almost complete
deprotonation of the ligand at this pH. The K+ could act as a bridge between two PA ligands (as
observed in Figure S4 in the Supporting Information), or it could also be coordinated to the PA
through the pyridine nitrogen atom and a carboxylate oxygen atom. To achieve the K+-to-L– ratios
observed, it is speculated that both processes occur to produce the cations, but possibly only
bridging occurs in the anions.
3.3. Determining Stability Constants When Incorporating the Bi(III)–Nitrates as Competing Species
Using a Spreadsheet
In order to circumvent the problem of having competing Bi(III)–nitrate species in solution and the
available software being unable to deal with this, it was decided to devise a simple spreadsheet to
calculate the stability constants when incorporating the Bi(III)–nitrate species. This involved
calculating MBEs for [M], [L], [H], and [X] (where X represents nitrate) which contain both the known
formation constants and those to be refined. A number of assumptions needed to be made up front
for these calculations to be feasible, as was done by Foti et al.(42) (i) Since [MT+ is very low (≤1 × 10⁻⁵
M), it was assumed that no polynuclear species are formed. (ii) Since [LT]:[MT] > ∼94, it was assumed
that [LT] is significantly greater than the concentration of all the metal–ligand species formed (i.e.,
∑*MLqHr]), and thus, when calculating [L], only the extent of protonation of the ligand needs to be
considered. (iii) Since the concentration of nitrate in solution is 50 000 times more than that of
Bi(III), it was assumed that [XT] is significantly greater than the concentration of all the Bi(III)–nitrate
species formed (i.e., ∑*MXz]). Also, nitrate was assumed to be fully deprotonated, thus [XT] = [X]. The
simplified MBEs used for [L] and [M] were
(2)
(3)
where β′1z (for z = 1 – 4) refers to the formation constants for the Bi(III)–nitrate species. [H] (and
[OH]) were determined directly from the pH measurements. A more detailed discussion can be
found in the Supporting Information.
Therefore, when analyzing the data using the spreadsheet, the ECFCs were calculated using the E(Bi)
value (as illustrated in Figure 1) throughout the pH range employed. When calculating the CCFCs, the
Bi(III) nitrates were included in the species model and their log β values were fixed (as given in Table
1). The average log β values now refined for the Bi(III)–PA system (see Table 4) compared to those
determined in Table 2 for this work, except for the log β(ML) value which was now 0.8 log units
greater. Note that only the species model including ML4 and ML4OH is considered here, as confirmed
by independent techniques. The complex formation curves (CFCs) and the log β values for each
experiment are shown in Figure S9a and Table S3a in the Supporting Information, respectively.

12
Table 4. Comparison of Average log β Values at 25 °C for the Proposed Species at Ionic Strength 0.25–0.5 M
(K,H)NO3 Using Two Different Calculation Strategies
use spreadsheet with a fixed E(Bi) and include MXz
species
use dedicated software with a sliding
Ec(Bi)
ML 7.77 ± 0.07 7.50 ± 0.12
ML2 13.89 ± 0.07 13.98 ± 0.06
ML3 18.606 ± 0.005 18.51 ± 0.04
ML4 22.7 ± 0.2 22.8 ± 0.2
ML4OH 31.4 ± 0.2 31.4 ± 0.2
From the CFCs plotted in Figure 4 (in red), it was noted that in the very acidic region (pH < ∼0.8) the
CCFC was greater than the ECFC (Δ). To assess the reason for this, a SDD was plotted for the actual
titration conditions, i.e., using the concentrations determined from solving the MBEs at each step in
the titration (Figure 5a). It is clear that the Bi(III)–nitrates are dominant at these low pHs, which is
highlighted by summing the percentage of all of these species (indicated by ∑MXz). The slight
overestimation of the CCFC is thus probably due to the log β values for the Bi(III)–nitrate species not
being very accurate as they are small. It is only due to nitrate having a concentration 50 000 times
that of Bi(III), that these species are present at significant concentrations at low pH.
Figure 4. ECFCs for [PAT]:[BiT+ = 94 as determined using the spreadsheet (Δ) or the 3D-CFC software with a sliding Ec(M) (○) for the ML, ML2, ML3, ML4, ML4OH species model. The CCFCs are given as dotted or solid lines, respectively.

13
Figure 5. (a) The SDD for [BiT]:[PAT] = 94 where the changing concentrations as determined at each pH step were used. (b) The percentage decrease in concentration of Bi(III), PA, and nitrate is shown together with the sliding Ec(Bi) values.
The fairly rapid decrease in concentration of the Bi(III)–nitrates in Figure 5a was initially unexpected
especially when compared to the SDDs in Figures 1 and 3, even though the changing total
concentrations of Bi(III), PA, and nitrate (see Figure 5b) were now being accounted for together with
the changing pH. These calculations were verified by employing data from SDDs plotted using the
program Sol-eq.(43) A series of SDDs were plotted using the Bi(III), PA, and nitrate concentrations at
each pH step in the titration and the log β values refined (Table 4). Only the data (i.e., the resultant
percentage of each species) for the particular pH at which these concentrations applied were
extracted. The data at each pH (and concentrations) were then combined, and the plot produced
was the same as that in Figure 5a. Therefore, when refining data with PA and nitrate as competing
ligands, it appears that the ML species forms to a greater extent from lower pHs than initially
predicted. The green line in the inset of Figure 4 shows the CCFC when the formation constants
determined in Table 2 were used together with that for the nitrate species. This clearly indicates the
effect of using E(Bi) throughout when incorporating nitrate as a competing ligand and why the log
β(ML) values refined were larger in this case. It was thus concluded that the calculations in section
3.1 where the fixed value of Ec(Bi) was used for data up to pH 1 (based on the SDD plotted under
fixed concentration conditions) gave erroneously low log β(ML) values.

14
Simply for comparison, a sliding Ec(Bi) was used to calculate the ECFC from pH 0.3 to the pH at which
less than 1% of Bi(III) existed as nitrate species (the actual pH differed according to [LT]:[MT]). The
value of Ec(Bi) at pH 0.3 corresponded to the fixed value used as indicated in Figure 1, and once
again, a linear variation between this value and E(Bi) was determined, as shown in Figure 5b (red
line). The 3D-CFC software was utilized to recalculate the formation constants on the basis of the
amended free Bi(III) potentials, and a CFC plot is shown in Figure 4 (in blue) (see Figure S9b in the
Supporting Information for all of the CFC plots). The average log β values obtained when using the
sliding Ec(Bi) are also given in Table 4 (see Table S3 in the Supporting Information for all of the
results), and it was noted that log β(ML) was now 0.5 log units greater than that in Table 2. This
highlights how assumptions about the Ec(Bi) values used could affect calculated log β values,
emphasizing the importance of rather incorporating the nitrates in the species model and using
E(Bi).
3.4. Comparison to Previous Methodology
Due to differences between the literature results and those obtained in this work, the approach
used by Cukrowski et al.(30) was considered in more detail. They performed two consecutive pH
titrations employing the same conditions, the one omitting the ligand and the other including the
ligand. For the titration where the ligand was absent, the expected potential shift due to hydrolysis
of Bi(III) was calculated and added to the experimental E1/2(Bi) values (acquired up to pH 2.1 after
which precipitation occurred). This new potential vs pH relationship was fitted using a third order
polynomial which approached a constant value at pH ∼ 2.5. Thus, when analyzing data to calculate
formation constants, below pH 2.5, ΔE = E(Bi) – E(Bicomp) was calculated as the difference between
this polynomial and the E1/2(Bi) values obtained from the titration including the ligand. Above pH 2.5,
E(Bi) was set equal to the constant value.
There are several possible sources of error in their approach. (i) The GE was calibrated by 0.5 M
HNO3–0.5 M NaOH titration, and a straight line relationship was assumed across the pH range. This
was shown not to be the case,(22) but due to the outstanding performance of the GE, this
calibration should only introduce small errors at the lowest pHs. (ii) Having separate pH titrations
(one without and one with the ligand in solution) could lead to small errors, as it is our experience
that slight fluctuations in the reference system could occur between each multihour titration
experiment. In this work, ΔE = 1.7 mV (for [PAT]:[BiT] = 197 and [BiT] = 1 × 10⁻⁵ M) at pH 0.3 when the
polarograms were collected directly after each other (see Figure S1 in the Supporting Information),
whereas Cukrowski et al.(30) found ΔE ∼ 5 mV (for [PAT]:[BiT] = 132 and [BiT] = 5 × 10⁻⁵ M) at
approximately the same pH for consecutive experiments. When calculating the expected shift at pH
0.3 for the formation of ML (using the same PA and Bi(III) concentrations they used), it was found to
be 4.2 mV when log β(ML) = 7.5 and 1.7 mV when log β(ML) = 7.0. Introducing Tl(I) as an internal
reference minimizes this error as far as possible. (iii) Bi(OH)2+ was not included as one of the
hydrolysis products, and since this species exists below pH 2.1 (see Figure 1), it would affect the
values fitted by the polynomial. Again this would only have a small effect, as the Bi(OH)2+
concentrations are small (about 12% of the Bi(III) exists as Bi(OH)2+ at pH 2 in a 0.5 M nitrate
solution). (iv) By using the third order polynomial values as the E(Bi) values, the shifts in potential
due to the formation of the Bi(III)–nitrates were inadvertently accounted for to an extent; however,
the authors mistakenly incorporated these potential shifts as part of the changing Ej. That being said,
neglecting to account for the Bi(III)–nitrates resulted in the fraction of Bi(III)–hydroxides present in

15
solution being overestimated especially in the low pH range and consequently in larger shifts in
potential due to the formation of Bi(III)–hydroxides being predicted. The values thus used to fit the
polynomial were inaccurate. This issue was evident from their results for the ligand titrations. These
were performed at pH 0.9, 1.37, and 1.85, and the respective log β(ML) values obtained were 7.50,
7.66, and 7.89.(30) They speculated that the systematic error observed was due to the formation
constant for BiOH2+ being too high, but it is actually due to the omission of competing nitrates which
effectively reduces the concentration of Bi(III)–hydroxides in solution as the pH decreases.
Interestingly, these results are comparable to the log β(ML) value of 7.77 ± 0.07, obtained from
calculations using the spreadsheet. It is suspected that the ligand results obtained at the higher pHs
would be more accurate because the concentrations of Bi(III)–nitrate species are lower and hence
would affect the calculation of the E(Bi) value they used to less of an extent. It should be mentioned
that one of the limitations used in this work is relying on the log β values for the Bi(III)–nitrate
species which are small and difficult to determine accurately.
For interest, the log β values for the Bi(III)–picolinic acid species were compared to that for the
picolinates of other metal ions, including some of biomedical interest. The results presented in Table
S4 in the Supporting Information clearly show the high stability of these Bi(III) complexes, with
values comparable to that for the Cu(II) and Hg(II) complexes (both of which only form the ML and
ML2 species). Only La(III), as well as the other lanthanide ions, also formed ML4 species.(33)
4. Conclusion
Methodologies developed to study Bi(III) complex formation using voltammetry were successfully
applied in this work. The importance of including nitrate as a competing ligand when determining
formation constants for Bi(III)–ligand species in a nitrate background was highlighted. This was not
achievable using the dedicated software available; thus, a spreadsheet was designed to do these
calculations. The spreadsheet also enabled the plotting SDDs for the actual titration conditions
(rather than at fixed concentrations as is usually the case), which more clearly revealed the changes
occurring in solution during the experiment. The use of crystal structures and ESI-MS data allowed
for the corroboration of the species model chosen.
Supporting Information
(1) A list describing selected symbols, (2) information from polarographic-pH titrations, (3) a structure of a Bi(III)–PA complex, (4) information regarding ESI-MS studies, (5) the derivation of the MBEs used to calculate formation constants using a spreadsheet, (6) information from polarographic-pH titrations when nitrates are included as competing species, (7) comparison of stability constants for various metal ion–picolinic acid complexes (PDF)

16
Author Contributions
The manuscript was written through contributions of all authors. All authors have given approval to the final version of the manuscript.
The authors declare no competing financial interest.
Acknowledgment
The authors thank Marelise Ferreira for her assistance with the ESI-MS measurements. This work is based on the research supported by the National Research Foundation (NRF) of South Africa and the University of the Witwatersrand. Any opinion, finding and conclusion or recommendation expressed in this material is that of the authors and the NRF does not accept responsibility in this regard.
References
1. Berners-Price, S. J.; Sadler, P. J.Coordination Chemistry of Metallodrugs: Insights into Biological Speciation from NMR Spectroscopy Coord. Chem. Rev. 1996, 151, 1– 40, DOI: 10.1016/S0010-8545(96)90191-5
2. Briand, G.; Burford, N.Bismuth Compounds and Preparations with Biological or Medicinal Relevance Chem. Rev. 1999, 99, 2601– 2657, DOI: 10.1021/cr980425s
3. Sadler, P. J.; Li, H.; Sun, H.Coordination Chemistry of Metals in Medicine: Target Sites for Bismuth Coord. Chem. Rev. 1999, 185–186, 689– 709, DOI: 10.1016/S0010-8545(99)00018-1
4. Hassfjell, S.; Brechbiel, M. W.The Development of the α-Particle Emitting Radionuclides 212 Bi and 213 Bi, and their Decay Chain Related Radionuclides for Therapeutic Applications Chem. Rev. 2001, 101, 2019– 2036, DOI: 10.1021/cr000118y
5. Tiekink, E. R. T.Antimony and Bismuth Compounds in Oncology Crit. Rev. Oncol. Hematol. 2002, 42, 217– 224, DOI: 10.1016/S1040-8428(01)00217-7
6. Yang, N.; Sun, H.Biocoordination Chemistry of Bismuth: Recent Advances Coord. Chem. Rev. 2007, 251, 2354– 2366, DOI: 10.1016/j.ccr.2007.03.003
7. Yang, Y.; Ouyang, R.; Xu, L.; Guo, N.; Li, W.; Feng, K.; Ouyang, L.; Yang, Z.; Zhou, S.; Miao, Y.Review: Bismuth Complexes: Synthesis and Applications in Biomedicine J. Coord. Chem. 2015, 68, 379– 397, DOI: 10.1080/00958972.2014.999672
8. Abrams, M. J.; Murrer, B. A.Metal Compounds in Therapy and Diagnosis Science 1993, 261, 725– 730, DOI: 10.1126/science.8102010
9. Dittes, U.; Vogel, E.; Keppler, B. K.Overview on Bismuth(III) and Bismuth(V) Complexes with Activity Against Helicobacter Pylori Coord. Chem. Rev. 1997, 163, 345– 364, DOI: 10.1016/S0010-8545(97)00042-8
10. Lambert, J. R.; Midolo, P.The Actions of Bismuth in the Treatment of Helicobacter Pylori Infection Aliment. Pharmacol. Ther. 1997, 11, 27– 33, DOI: 10.1046/j.1365-2036.11.s1.13.x
11. Zhang, L.; Mulrooney, S. B.; Leung, A. F. K.; Zeng, Y.; Ko, B. B. C.; Hausinger, R. P.; Sun, H.Inhibition of Urease by Bismuth(III): Implications for the Mechanism of Action of Bismuth Drugs BioMetals 2006, 19, 503– 511, DOI: 10.1007/s10534-005-5449-0

17
12. Nakhla, V.; Takwonoingi, Y. M.; Sinha, A.Myringoplasty: A Comparison of Bismuth Iodoform Paraffin Paste Gauze Pack and Tri-Adcortyl Ointment Ear Dressing J. Laryngol. Otol. 2007, 121, 329– 332, DOI: 10.1017/S0022215106002660
13. Brorson, Ø.; Brorson, S.-H.Susceptibility of Motile and Cystic Forms of Borrelia Burgdorferi to Ranitidine Bismuth Citrate Int. Microbiol. 2001, 4, 209– 215, DOI: 10.1007/s10123-001-0039-7
14. Murafuji, T.; Miyoshi, Y.; Ishibashi, M.; Rahman, A. F. M. M.; Sugihara, Y.; Miyakawa, I.; Uno, H.Antifungal Activity of Organobismuth Compounds Against the Yeast Saccharomyces Cerevisiae: Structure–Activity Relationship J. Inorg. Biochem. 2004, 98, 547– 552, DOI:
15. Wang, X.; Zhang, X.; Lin, J.; Chen, J.; Xu, Q.; Guo, Z.DNA-Binding Property and Antitumor Activity of Bismuth(III) Complex with 1,4,7,10-Tetrakis(2-Pyridylmethyl)-1,4,7,10-Tetraazacyclododecane J. Chem. Soc., Dalton Trans. 2003, 2379– 2380, DOI: 10.1039/b305290g
16. Song, Y. J.; Qu, C. F.; Rizvi, S. M. A.; Li, Y.; Robertson, G.; Raja, C.; Morgenstern, A.; Apostolidis, C.; Perkins, A. C.; Allen, B. J.Cytotoxicity of PAI2, C595 and Herceptin Vectors Labeled with the Alpha-Emitting Radioisotope Bismuth-213 for Ovarian Cancer Cell Monolayers and Clusters Cancer Lett. 2006, 234, 176– 183, DOI: 10.1016/j.canlet.2005.03.060
17. Baes, C. F., Jr.; Mesmer, R. E. The Hydrolysis of Cations; John Wiley and Sons Inc.: New York, 1976.
18. Kragten, J.; Decnop-Weever, L. G.; Gründler, P.Mixed Hydroxide Complex Formation and Solubility of Bismuth in Nitrate and Perchlorate Medium Talanta 1993, 40, 485– 490, DOI: 10.1016/0039-9140(93)80004-B
19. Nancollas, G. H.; Tomson, M. B.Guidelines for the Determination of Stability Constants Pure Appl. Chem. 1982, 54, 2675– 2692, DOI: 10.1351/pac198254122675
20. Brandariz, I.; Barriada, J. L.; Vilariño, T.; Sastre de Vicente, M. E.Comparison of Several Calibration Procedures for Glass Electrodes in Proton Concentration Monatsh. Chem. 2004, 135, 1475– 1488, DOI: 10.1007/s00706-004-0239-x
21. Hitchcock, D. I.; Taylor, A. E.The Standardization of Hydrogen Ion Determinations. I. Hydrogen Electrode Measurements with a Liquid Junction J. Am. Chem. Soc. 1937, 59, 1812– 1818, DOI: 10.1021/ja01289a007
22. Billing, C.; Cukrowski, I.Glass Electrode Calibration for Use in the Voltammetric Determination of Stability Constants under Extreme Acidic Conditions S. Afr. J. Chem. 2009, 62, 168
23. Billing, C.; Cukrowski, I.; Jordan, B.A Novel Approach to Monitoring of the Diffusion Junction Potential in Speciation Studies by Polarography under Very Acidic Conditions. Part I: The Reversible Cd(II)-Picolinic Acid System Electroanalysis 2013, 25, 2221– 2230, DOI: 10.1002/elan.201300256
24. Billing, C.; Cukrowski, I.A Novel Approach to Monitoring of the Diffusion Junction Potential in Speciation Studies by Polarography under Very Acidic Conditions. Part II: The Quasi-Reversible Cu(II)-Picolinic Acid System Electroanalysis 2015, 27, 494– 502, DOI: 10.1002/elan.201400466
25. Billing, C.; Cukrowski, I.Measurements and Modelling to Determine the Reduction Potential of Uncomplexed Bi(III) in Nitrate Solutions for Application in Bi(III)-ligand Equilibria Studies by Voltammetry J. Phys. Chem. B 2016, 120, 468– 478, DOI: 10.1021/acs.jpcb.6b00670
26. Grant, R. S.; Coggan, S. E.; Smythe, G. A.The Physiological Action of Picolinic Acid in the Human Brain Int. J. Tryptophan Res. 2009, 2, 71– 79
27. Krieger, I.; Cash, R.; Evans, G. W.Picolinic Acid in Acrodermatitis Enteropathica: Evidence for a Disorder of Tryptophan Metabolism J. Pediatr. Gastroenterol. Nutr. 1984, 3, 62– 68, DOI: 10.1097/00005176-198401000-00014
18
28. Aggett, P. J.; Fenwick, P. K.; Kirk, H.An In Vitro Study of the Effect of Picolinic Acid on Metal Translocation across Lipid Bilayers J. Nutr. 1989, 119, 1432– 1437
29. Evans, G. W.; Johnson, P. E.Characterization and Quantitation of a Zinc-Binding Ligand in Human Milk Pediatr. Res. 1980, 14, 876– 880, DOI: 10.1203/00006450-198007000-00007
30. Cukrowski, I.; Zhang, J. M.; van Aswegen, A.Voltammetry as a Virtual Potentiometric Sensor in Modelling of a Metal/Ligand System and Refinement of Stability Constants. Part 2. Differential-Pulse- and Sampled-Current-Polarographic and Virtual Free-Metal-Ion Potentiometric Study of a Bismuth(III)/Picolinic Acid/Hydroxide System Helv. Chim. Acta 2004, 87, 2135– 2158, DOI: 10.1002/hlca.200490194
31. Cukrowski, I.; Mkwizu, T.; Magampa, P.Voltammetry as Virtual Potentiometric Sensor in Modelling of a Metal/Ligand System and Refinement of Stability Constants. Part 5. Complexation Studies of Hydrolysis-Prone Lead(II) with Glycine and Sarcosine by Sampled-Direct-Current Polarography Involving Virtual Potential Helv. Chim. Acta 2006, 89, 2934– 2952, DOI: 10.1002/hlca.200690263
32. Cukrowski, I.A polarographic method of speciation for labile metal-ligand systems based on mass-balance equations. A Differential Pulse Polarographic Study at Fixed Ligand to Metal Ratio and Varied pH Anal. Chim. Acta 1996, 336, 23– 36, DOI: 10.1016/S0003-2670(96)00335-2
33. Martell, A. E.; Smith, R. M.; Motekaitis, R. J. NIST Standard Reference Database 46 Version 8.0. NIST Critically Selected Stability Constants of Metal Complexes Database, Gaithersburg, MD, 2004.
34. Cukrowski, I.; Hancock, R. D.; Luckay, R. C.Formation Constant Calculation for Non-Labile Complexes Based on a Labile Part of the Metal-Ligand System. A Differential Pulse Polarographic Study at Fixed Ligand to Metal Ratio and Varied pH: Application to Polarographically Inactive Complexes Anal. Chim. Acta 1996, 319, 39– 48, DOI: 10.1016/0003-2670(95)00467-X
35. Allen, F. H. The Cambridge Structural Database: A Quarter of a Million Crystal Structures and Rising, Acta Crystallogr., Sect. B, 2002, 58, 380–388. Cambridge Structural database Version 5.34, November 2012, update.
36. Burford, N.; Eelman, M. D.; Cameron, T. S.Comprehensive Characterisation of Bismuth Thiosalicylate Complexes: Models for Bismuth Subsalicylate Chem. Commun. 2002, 1402– 1403, DOI: 10.1039/b203110h
37. Briand, G. G.; Burford, N.; Eelman, M. D.; Aumeerally, N.; Chen, L.; Cameron, T. S.; Robertson, K. N.Identification, Isolation, and Characterization of Cysteinate and Thiolactate Complexes of Bismuth Inorg. Chem. 2004, 43, 6495– 6500, DOI: 10.1021/ic049594n
38. Burford, N.; Eelman, M. D.; Groom, K.Identification of Complexes Containing Glutathione with As(III), Sb(III), Cd(II), Hg(II), Tl(I), Pb(II) or Bi(III) by Electrospray Ionization Mass Spectrometry J. Inorg. Biochem. 2005, 99, 1992– 1997, DOI: 10.1016/j.jinorgbio.2005.06.019
39. Phillips, H. A.; Eelman, M. D.; Burford, N.Cooperative Influence of Thiolate Ligands on the Bio-Relevant Coordination Chemistry of Bismuth J. Inorg. Biochem. 2007, 101, 736– 739, DOI: 10.1016/j.jinorgbio.2007.01.003
40. Phillips, H. A.; Burford, N.Identification of Bismuth-Thiolate-Carboxylate Clusters by Electrospray Ionization Mass Spectrometry Inorg. Chem. 2008, 47, 2428– 2441, DOI: 10.1021/ic701657r
41. Fenn, J. B.; Mann, M.; Meng, C. K.; Wong, S. F.; Whitehouse, C. M.Electrospray Ionization–Principles and Practice Mass Spectrom. Rev. 1990, 9, 37– 70, DOI: 10.1002/mas.1280090103
42. Foti, C.; Lando, G.; Millero, F. J.; Samartano, S.Experimental Study and Modelling of Inorganic Cd2+ Speciation in Natural Waters Environ. Chem. 2011, 8, 320– 331, DOI: 10.1071/EN10138
43. Petit, L. D.; Powell, K. J. Sol-Eq, version 2.2; Academic Software: 1998