Application of Innovative Geophysical Methods for Subgrade ...
38
M oDOT TE211 .N49 1998 c.2 Devel op ment an d T ec hn ology Division ROT 98-004 Application of Innovative Geophysic al Methods for Subgrade Investigations in Karst Terrain Property of MoOOT TRANSPORTATION LIBRARY November , 1998
Transcript of Application of Innovative Geophysical Methods for Subgrade ...

MoDOT
TE211 .N49 1998 c.2
I ,,,-~.carch , Development and Technology Division
ROT 98-004
Application of Innovative Geophysical Methods for
Subgrade Investigations in Karst Terrain
Property of
MoOOT TRANSPORTATION LIBRARY
November, 1998

TECHNICAL REPORT DOCUMENTATION PAGE
, . Report No. 2. Government Accession No. 3. Recipient's Catalog No.
RDT-98 -004
4. Title and Subtitle 5. Report Dale
Application ofInnovative Geophysical Methods for Subgrade November 1998
Investigations in Karst Terrain 6. Perfonning Organization Code
(Nondestructive Testing) UMR&MoDOT
7. AUlhot(s) 8. Performing Organization Report No.
Tim Newton, Dr. Neil Anderson, Dr. Allen Hatheway RDT-98-004. RJ97-028.SPR97-7
9, Perfonning Organization Name and Address 10. Work Unit No.
University of Missouri Rolla, Department of Geology and Geophysics
125 McNutt Hall II , Contract or Granl No.
Rolla, Missouri 65409·0410
12. Sponsoring Agency Name and Address 13 . Type of Repon and Period Covered
Missouri Department of Transportation Final Report
Research, Development & Technology Division 14 . Sponsoring Agency Code
P.O. Box 270, lefTerson City. MO 65102 MoDOT
15. Supplementary Notes
The investigat ion was conducted by the University of Missouri Rolla in cooperation with the Missouri
Department of Transportat ion
16. Abstract
Geophysical surveys were conducted for the Missouri Department of Transportati on (MoDOT) by the Department of Geology and Geophysics at the University of Missouri-Rolla to determine the most probable cause or causes of ongoing subsidence along a distressed section of Interstate 44 in Springfield. Missouri.
Ground penetrating radar (GPR) and reflection seismic quickly assessed roadway and subsurface conditions with nondestructive. continuous profiles. The GPR proved to be of useful utility in defining upward-propagating voids in embankment fill material. The reflection seismic survey established the presence of reactivated paJeosinkholes in the area. These were responsible for swallowing the fill material as water drained through the embankment.
On the basis of interpretation of these data, MoDOT personnel were able to dri ll into the voids that had developed beneath the pavement (as a resuJt of washing out of the fine-grained material of the embankment fill) , and to devi se an effective grouting plan fo r stabilization of the roadway .
17. Key Words 18. Distribution Statement
ground penetrating radar. reflection seismic. karst, No restrictions. This document is available to the
subsidence, voids. sinkhole, nondestructive testing. public through National Technical Information
geophysics, subgrade investigation Center. Springfield. VA 22161
19. Security Classification (oflhis report) 20. Security Classification (orthis page) 2\. No. of Pages 22. Price
Unclassified Unclassified 29
Form DOT F 1700.7 t06f98J

Application of Innovative Geophysical Methods for Subgrade Investigations in Karst Terrain
FINAL REPORT
ROT 98-004 Research Investigation 97-028
PREPARED BY
MISSOURI DEPARTMENT OF TRANSPORTATION
MATERIALS DIVISION
By
Tim Newton Geotechnical Liaison
Dr. Neil Anderson Professor of Geophysics
University of Missouri - Rolla
Dr. Allen Hatheway Professor of Geological Engineering
University of Missouri - Rolla
November, 1998
The opinions, findings, and condusions expressed in this publication are those of the Missouri Department of Transportation

ACKNOWLEDGMENTS
It was the wish of MoDOT that as many "stakeholder" players as possible be included in the deliberations involving this investigation . Many state agencies and their personnel cooperated by providing input and expertise on the area being examined for this project. These welcome participants are listed below.
Dr. Neil Anderson , Professor, Department of Geology and Geophysics, University of Missouri at Rolla
Ms. Cynthia Brookshire, Prof. Geologist, Division of Geology and Land Survey
Mr. Jimmy Brown, Prof. Geologist, Division of Geology and Land Survey
Mr. Mike Descamps, MoDOT Maintenance Chief
Mr. Mike Fritz, P.E., MoDOT Soils & Geology Section Director
Mr, Gary Goessmann. Prof. Geologist, MoDOT
Dr. Allen Hatheway, P.E., Professor, Department of Geological and Petroleum Engineering , University of Missouri at Rolla
Mr. Joe Kelly, MoDOT Maintenance Worker
Mr. Tim Newton, Elc MoDOT Geotechnical liaison
Mr. 1im Smith , P.E.,Greene County Resource Management Director
Dr. Kenneth Thompson. Professor, Department of Geology, Southwest Missouri State University

ABSTRACT
Geophysical surveys were conducted for the Missouri Department of Transportation (MoDOT) by the Department of Geology and Geophysics at the University of MissouriRolla to determine the most probable cause or causes of ongoing subsidence along a distressed section of Interstate 44 in Springfield , Missouri. The Springfield area is associated with sinkholes and karst terrain. This particular section of highway had experienced gradual , but continual subsidence that was visually detectable on the both the shoulders and median. A sudden 1 meter diameter, 2.5 meter deep collapse on the shoulder signified the need of a rapid subgrade assessment procedure to ensure the safety of the traveling public. Ground penetrating radar (GPR) and shallow reflection seismic technologies were applied to the site immediately.
GPR and reflection seismic quickly assessed roadway and subsurface conditions with nondestructive, continuous profiles. They expedited both the investigation and mitigation of karst related voids. The geophysical surveys were successful. The GPR proved to be of useful utility in defining upward-propagating voids in embankment fill material. On the basis of interpretation of these data , MoDOT personnel were able to drill into the voids that had developed beneath the pavement (as a result of washing out of the finegrained material of the embankment fill) , and to devise an effective grouting plan for stabilization of the roadway.
The reflection seismic survey established the presence of reactivated paleosinkholes in the area , that had developed along essentially north-northwest trending fau ltlfracture zones. These were responsible for swallowing the fill material as water drained through the embankment. The site was later revisited for confirmation of the effectiveness of the stabilization of the grouting plan. Duplicate GPR profiles were acquired and indicated that the grouting program had been effective and that no substantial voids had developed in the interim.
i i

Table of Contents
Acknowledgments
Abstract
Table of Contents
List of Figures
Preface
Introduction
Design of the Geophysical Exploration Program
Geological Overview
Reflection Seismic Equipment and Field Acquisition Parameters
Reflection Seismic Data Processing
Interpretation of Reflection Seismic Data
Ground Penetrating Radar Equipment and Parameters
Ground Penetrating Radar Data Processing
Interpretation of Ground Penetrating Data
Geophysical Conclusions
MoDOT Conclusions
Implementation I Recommendations
Appendix A - Geologic Situation Leading To The Phenomenon
Appendix B (Photographs)
ii.i
Page
ii
iii
iv
v
1
3
3
5
5
5
11
11
11
16
20
21
22
25

List of Figures Page
Figure 1: Location of study area, along 144, Springfield Missouri. 1
Figure 2: Map of study area, showing locations of the reflection seismic lines 2 SP-1through SP-7 .
Figure 3: Map of study area. The locations of the GPR areas 1 through 6 3 are shown.
Figure 4: Map of study area. The locations of GPR areas through 6 are 4 shown. Data was acquired along lines 1-30 in May 1997, and again in October 1997. Data was acquired along lines 31-55 only in October 1997 (Survey 2) .
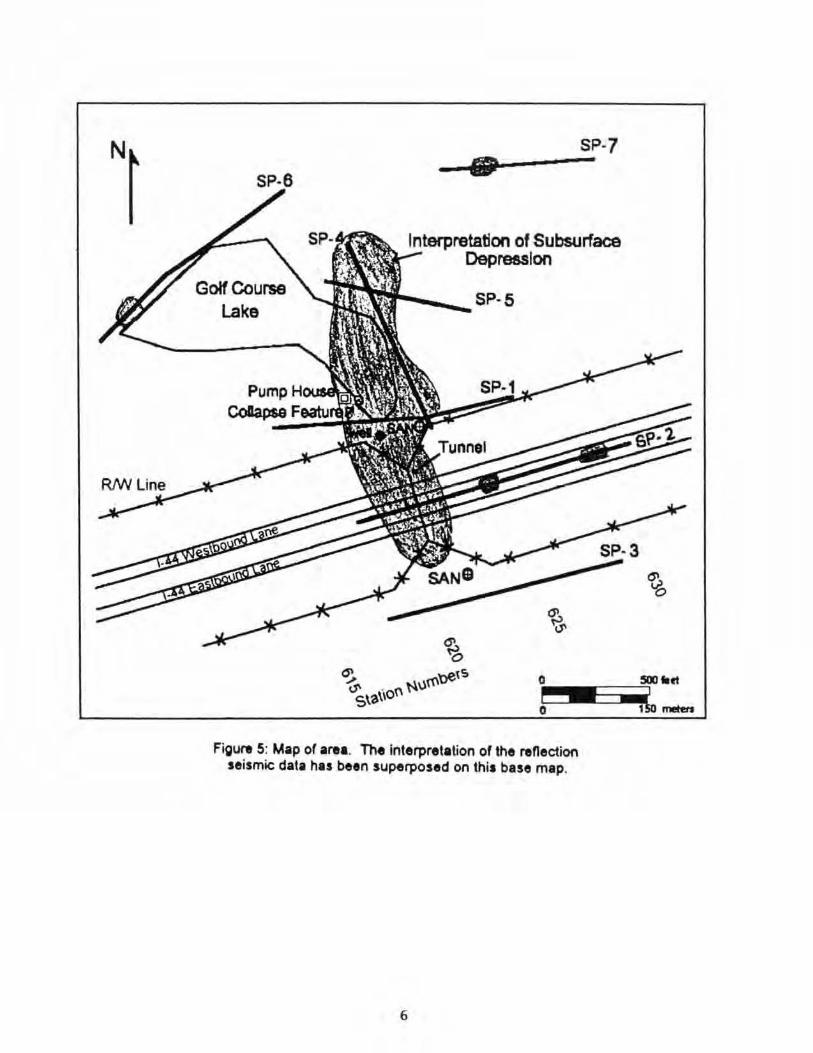
Figure 5: Map of area. The interpretation of the reflection seismic data has 6 been superposed on this base map.
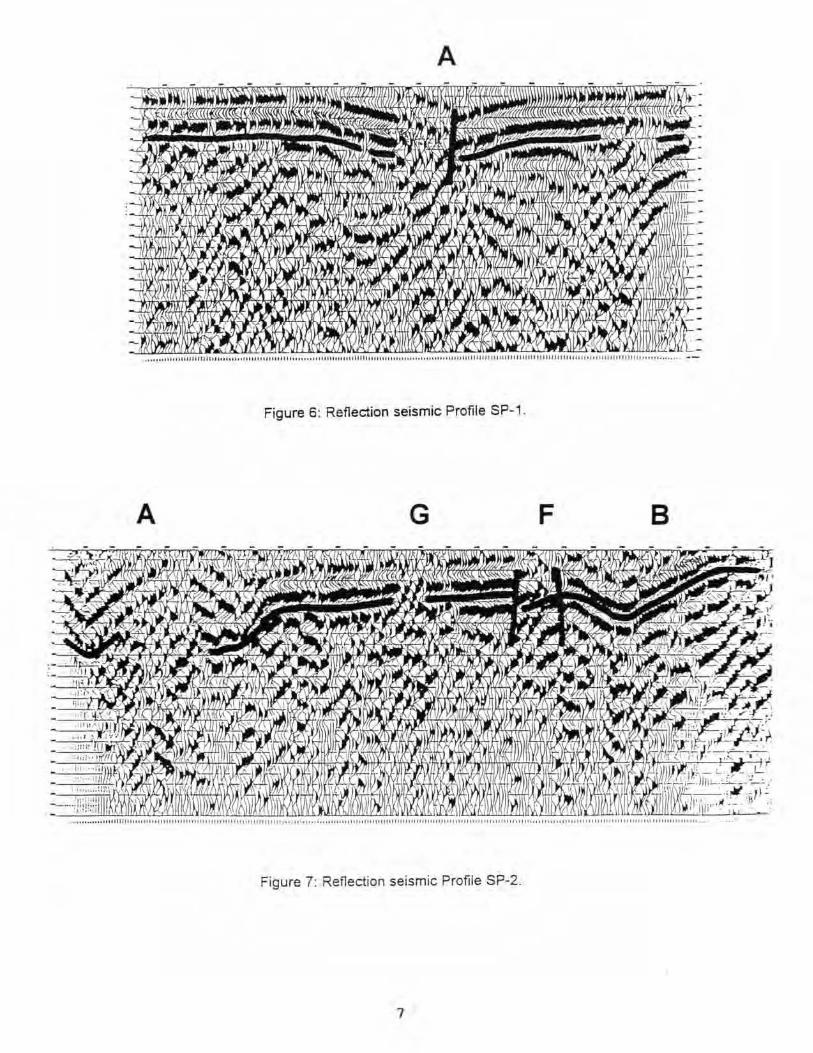
Figure 6: Reflection seismic Profile SP-1. 7
Figure 7: Reflection seismic Profile SP-2. 7
Figure 8: Reflection seismic Profile SP-3. 8
Figure 9: Reflection seismic Profile SP-4. 8
Figure 10: Reflection seismic Profile SP-5. 9
Figure 11: Reflection seismic Profile SP-6. 9
Figure 12: Reflection seismic Profile SP-7. 10
Figure 13: Map of GPR study area 1. Locations of ground-penetrating 12 profiles 1-10, with associated GPR anomalies.
Figure 14: Map of GPR study area 2. Locations of ground-penetrating pro- 12 files 11-20, with associated GPR anomalies.
Figure 15: Map of GPR study area 3. Locations of ground-penetrating 12 profiles 21-30, with associated GPR anomalies.
Figure 16: May and October versions of ground-penetrating radar profile 2 13 (Area 1; Figure 12). The upper GPR profile was acquired in May, the lower profile in October. Grout application borehole locations are shown.
Figure 17: May and October versions of ground-penetrating radar profile 4 14 (Area 1; Figure 12). The upper GPR profile was acquired in May, the lower profile in October. Grout-application borehole locations are shown.
Figure 18: May and October versions of ground-penetrating radar profile 5 15 (Area 1; Figure 12). The upper GPR profile was acquired in May, the lower profile in October. Grout-application borehole locations are shown.
Figure 19: Burden of Proof - Pre-construction drawing of area. 19
iv

PREFACE
This project presented itself as a need for innovative methods to quickly assess the potential of roadway collapse or subsidence in a near-crisis situation . Indications were that sufficient amounts of roadway fill and natural soil below had been removed by a form of "piping". The net result appeared to be internal erosion of the foundation fill soils infilling karstic dissolution features in the highly erodable limestone. This growing network of voids appeared to be migrating upward through the highway embankment to the concrete pavement itself. This created the potential for roadway subsidence and threatened public safety.
The vitality of interstate highways makes timely and accurate investigative data essential to protect the traveling public and to keep the roads open . The implications of karstic subsidence attracted the interests of many government agencies, all of which approached MoDOT with a willingness to assist. These include Greene County, Missouri Department of Natural Resources, and University of Missouri at Rolla personnel. A voluntary site visit by the University of Missouri-Rolla showed immediately that ground penetrating radar had potential use as an investigative tool for locating voids under the roadway. This was worth researching.
v

GROUND-PENETRATING RADAR (GPR) AND SHALLOW REFLECTION SEISMIC
SURVEYS FOR MITIGATION OF KARSTIC DAMAGE TO 1-44, SPRINGFIELD, MISSOURI
INTRODUCTION
In May of 1997, the Department of Geology and Geophysics at the University of Mlssouri·Rolia (UMR) conducted two reconnaissance-type geophysical surveys for the Missouri Department of Transportation (MaDOT) along and adjacent to a distressed section of Interstate 44, at Springfield. Missouri (Figure 1). This particular section of Interstate had experienced gradual , but continual and visually-detectable subsidence. Such subsidence was thought to be somehow related to the visual evidence of paleokarst features in the surrounding area. In Geophysical Survey lA, seven (7) reflection seismic profiles were acquired (Figures 2) , In Geophysical Survey 1 B, thirty (30) ground-penetrating radar profiles were acquired (Figures 3 and 4) . These data were processed at UMR, and interpreted by UMR researchers in consultation with Newton, Goessmann and other MoDOT staff.
Greene ~ ......
--
Figure 1: Location ofatudy ar ... lllong 14., Springfield MiMouri.
1

.. ·8
__ --"!'.7
:::::'t-__ .....
.... .1
• . .. ,-"""'-•
Figure 2: Map of study area, showing locations of the reflection seismic lines SP-1 through SP-7.
tn Survey 1 A, seven reflection seismic profiles were acquired along and near the Interstate 44. The intent was to image the shallow subsurface (especially bedrock) to a depth of about 60 m. The goal was to identify structural / lithologic patterns in the area, with a view to better understanding the origin of the subsidence features along the right·of·way (ROW). In Survey 1 B. 30 ground penetrating radar profiles were acquired along the concrete· paved sections of Interstate 44 . The intent was to image the shallow subsurface to a depth of about 4 m. The goal was to identify any voids beneath the lengths of the GPR profites.
Geophysical surveys 1A and 18 were successful. The reflection seismic survey established that there are reactivated paleosinkholes in the area, and that these had developed along essentially north· northwest trending faulVfracture zones. The ground· penetrating radar also proved to be a useful utility in defining upward-propagating voids in embankment fill material. On the basis 01 the interpretation of these data, MoDOT personnel were able to drill into the voids that had developed beneath the pavement (as a result of the washing out of the fine-grained material of the embankment fill), and to devise an effective grouting plan for stabilization of the roadway.
In October 1997, the study site was revisited for confirmation of the effectiveness of the stabilization of the grouting plan. At this time, a duplicate set of 30 ground-penetrating radar profiles and 2S additional GPR lines were acquired (SUlvey 2) . The interpretation of the dupticate profiles suggested that the grouting program had been effective, and that no substantial voids had developed between May and October. No new, prominent GPR anomalies were observed on the newly acquired coverage (25 profiles across previously untested areas).
2

DESIGN OF THE GEOPHYSICAL EXPLORATION PROGRAM
Geophysical surveys 1 A and 1 B were conducted with two specifi c objectives in mind :
Objective 1: The seven high-resolution reflection seismic profiles (Figure 2) were acquired along or near Interstate 44 (in places immediately adjacent to observable ground-surface distress). The intent was to image the shallow subsurface (especially bedrock) 10 a deplh 01 aboul 60 m. The goal was 10 idenlily any slruclurallgeologic patterns in the area, that might prove to be linked with the disruption visible at the ground surface.
~~. r "'~ RlNUne ~ ..J .... SP·1 • -::1. GPR loca6ona Areu
Araa 5 ~8a 1
-2 .
7 ma2 - _3~. TUMeI-
SMe SP-3
.. .. ~ 2 ~ ;; - ~ ~
Starion H\JI'I'IbMs • .... I - ""'-•
Figure 3: Map 01 sludy area. The localions ollhe GPR areas 1 Ihrough 6 are shown.
Objective 2. The ground-penetrating radar (GPR) proliles (Figures 3 and 4) were acquired along paved sections of Interstate 44 (in places immediately adjacent to recent subsidence features) . The intent was to image the shallow subsurface to a depth of about 4 m and to identify any sUb-pavement voids. The intent of MoDOT personnel was 10 drill and grout any areas designated as sUb-pavement voids.
GEOLOGICAL OVERVIEW
Limestone bedrock in the distress areas is characteristically cut by persistent north-northwest trending joints/fractures. These joints/fractures have provided conduits for vertically and laterally mobile waters, since Pennsylvanian time. Area groundwater is slightly acidic and slowly leaches the limestone through which it flows. Over time, the structural integrity of the limestone bedrock can be compromised, but more importanlly, the dissolution-widened joints can become inlilled with line- grained sediment that is highly subjecl to removal by flowing groundwater. When new development alters the local groundwater regime, these fine-grained sediments can be removed. Additionally, gradual to catastrophic collapse at bedrock and surface subsidence can occur (expressed as a reactivated paleokarst sinkhole).
J

..
Springfield GPR Line Locations
Area 1 Interstate 44
: ....................... ....................... 3 ....................... 's .. - - - - - - - - - - - - - - - - - - - -.. •
43 • ...................... •• ...................... . , Area 5
Area 3 Median Area 2
:: " , 21 ....................... ....................... I
~ ....................... 1
- - - - - - ~ - - - 3. - - - - - -51 ...... ... . _ .......... · 1
s: ....................... ., :I!;
C1'-v-'~, 200 300'
Area 6 Tunnel
Station 620+50
'l! 400'
..................•.•..•.•..•.. ..., 33 • ••• M ••••••••••••••••••••••••• ~ Area 35
sOc' , I
600' 700' 800'
May Lines
= October Lines
Figure 4: Map of study area. The locations of GPR .reas through 6 are shown. Olt. was acquired along lines 1-30 in May 1997, and again in October 1997. Data was acquired along lin .. 31-55 only in October 1997 (Survey 2).
4
-
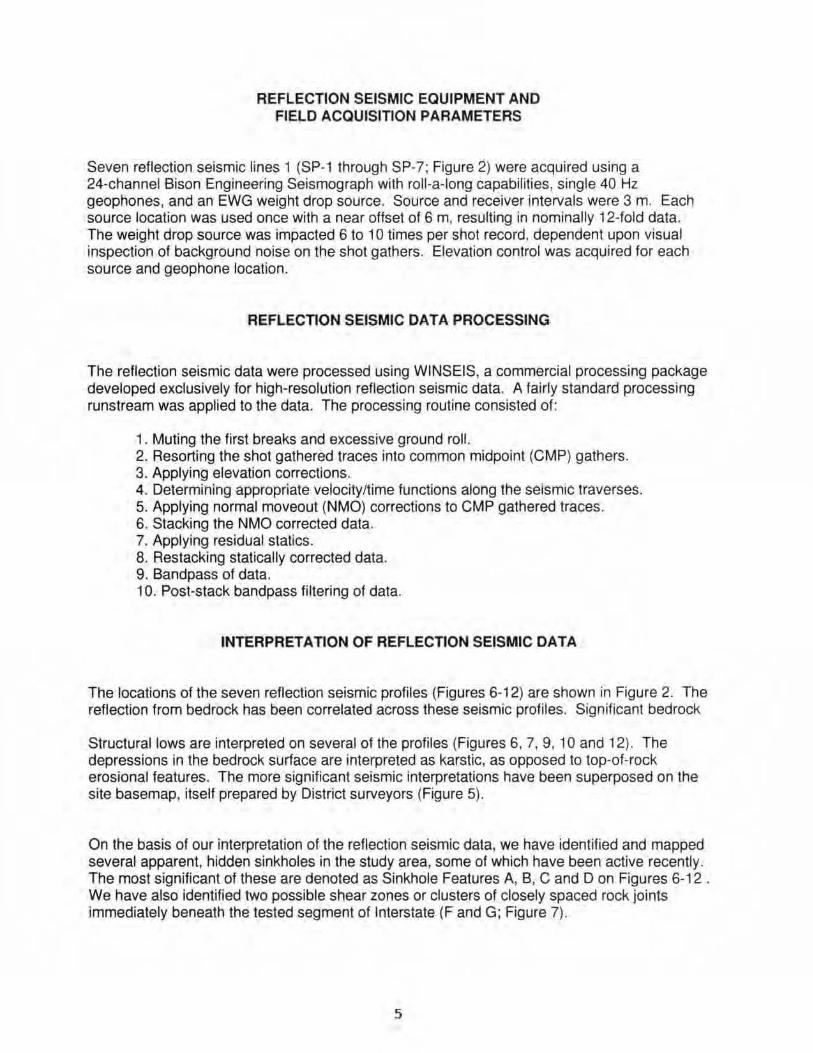
REFLECTION SEISMIC EQUIPMENT AND FIELD ACQUISITION PARAMETERS
Seven reflection seismic lines 1 (SP·1 through SP·7; Figure 2) were acquired using a 24-channel Bison Engineering Seismograph with roll-a-lon9 capabilities, single 40 Hz geophones, and an EWG weight drop source. Source and receiver intervals were 3 m. Each source location was used once with a near offset of 6 m, resulting in nominally 12-fold data. The weight drop source was impacted 6 to 10 times per shot record. dependent upon visual inspection of background noise on the shot gathers. Elevation control was acquired for each source and geophone location.
REFLECTION SEISMIC DATA PROCESSING
The reflection seismic data were processed using WINSEIS, a commercial processing package developed exclusively for high-resolution reflection seismic data. A fairly standard processing runstream was applied to the data. The processing routine consisted of:
1. Muting the first breaks and excessive ground roll. 2. Resorting the shot gathered traces into common midpoint (CMP) gathers. 3. Appl ying elevation corrections. 4. Determining appropriate velocity/time functions along the seismic traverses. 5. Applying normal moveout (NMO) correclions to CMP gathered traces. 6. Stacking the NMO corrected data. 7. Applying residual stallcs. 8. Restacking statically corrected data. 9. Bandpass of data. 10. Post-stack bandpass l iltering 01 data.
INTERPRETATION OF REFLECTION SEISMIC DATA
The locations of the seven reflection seismic profiles (Figures 6-12) are shown in Figure 2. The reflection from bedrock has been correlated across these seismic profiles. Significant bedrock
Structural lows are interpreted on several of the profiles (Figures 6. 7. 9, 10 and 12). The depressions in the bedrock surface are interpreted as karstic, as opposed to top-ai-rock erosional features. The more significant seismic interpretations have been superposed on the site basemap, itself prepared by District surveyors (Figure 5).
On the basis of our interpretation of the reflection seismic data, we have identilied and mapped several apparent, hidden sinkholes in the study area, some of which have been active recently . The most signilicant 01 these are denoted as Sinkhole Features A, B, C and 0 on Figures 6-12 . We have also identified two possible shear zones or clusters of closely spaced rock joints immediately benealh the tested segment of Interstate (F and G; Figure 7).
5
RIW
Lake
Pump HOUSI CoIapse
SP·7
~--
Interpretation 01 Subsurface Depression
___ SP· 5
SP· 3 ...
-o 5DO flit
~nwten Figure 5: Map of area. The Interpretation of the reflection
seismic data his been superposed on this base map.
6
A
Figure 6: Reflection seismic Profile SP-1 ,
A G F B
Figure 7: Reflection seismic Profile SP-2.
7

Figure B: Reflection seismic Profile SP·3.
A
Figure 9: Reflection seismic Profile SP..4
8

A E
Figure 10: Reflection seismic Profile SP-S,
c
Figure 11 : Reflection seismic Profile SP-6.
9

D
Figure 12: Reflection seismic Profile SP-7.
Sinkhole Feature A appears to represent an elliptical or elongate, north·northwesl trending sinkhole. This topographic low was selected for the 1993 placement of the nearby golf course irrigation lake (Deer Lake), Feature A is identified on Seismic Lines SP-1, SP-2. SP-4 and SP-5 (Figures 6, 7, 9 and 10, respectively). The interpretation ot Seismic Line SP·2 suggests that the underlying sinkhole extends southward beneath the Interstate (Figures 5 and 7). Sinkhole A appears to have been reactivated by leakage from nearby Deer Lake. Evidence of such leakage is shown by recent (April , 1997) collapse near the southeastern margin of the golf course lake. Catastrophic drainage of the lake should be studied in more detail. 10 ascertain if it constitutes a long-term threat (re: highway stability).
Subsurface sinkhole B is imaged only on Seismic Line SP-2 (reflection seismic control was not acquired either to the north or south of this feature) . Sinkhole B should be studied in more detail, to determine if it constitutes a potential long-term threat (re : highway stability).
Sinkholes C and 0 are manifested as recent collapse features (mapped in field studies), and are imaged on Seismic SP·6 and SP-7, respectively (Figures 11 and 12). Neither sinkhole is sufficiently dose to the highway to warrant further investigation . The shear zone systems along which these sinkholes developed probably extend beneath the Interstate. However, unless subsidence has been noted in these areas, further investigations may not be warranted at this time.
Sinkhole E is imaged only on Seismic SP· 5 (Figure 9). Sinkhole E does not appear to extend beneath the Interstate, and further investigation of this sinkhole probably is not warranted at this time.
Two additional anomalous subsurface features (in addition to Sinkholes A and B) are identified on Seismic SP- 2 (Features F and G; Figures 7). These anomalous features may be the images of the dissolution-widened joint systems through which much of the fine-grained fHl material has been removed. These features should be examined to ensure that they do not represent developing cavities , fed from roadway runoff.
10
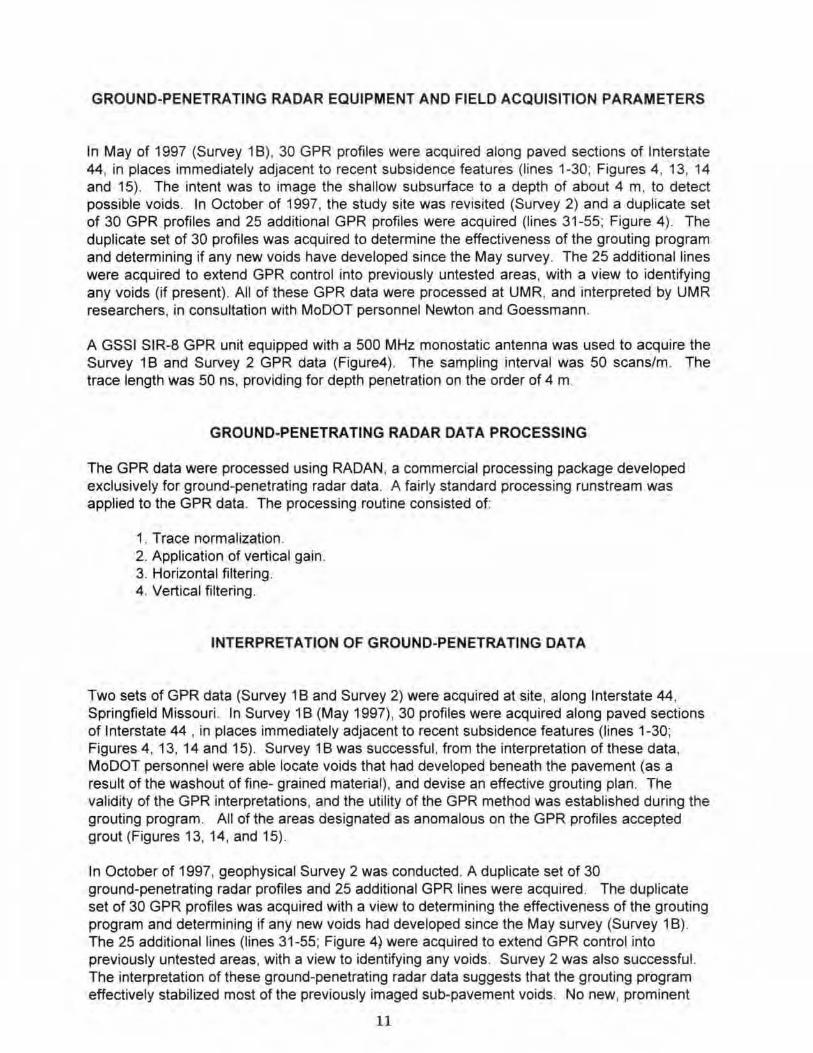
GROUND-PENETRATING RADAR EQUIPMENT AND FIELD ACQUISITION PARAMETERS
In May of 1997 (Survey 1 B). 30 GPR profiles were acquired along paved sections of Interstate 44, in places immediately adjacent to recent subsidence features (l ines 1-30; Figures 4, 13, 14 and 15). The intent was to image the shallow subsurface to a depth of about 4 m, to detect possible voids. In October of 1997, the study site was revisited (Survey 2) and a duplicate set of 30 GPR profiles and 25 additional GPR profiles were acquired (lines 31-55; Figure 4). The duplicate set of 30 profiles was acquired to determine the effectiveness of the grouting program and determining if any new voids have developed since the May survey. The 25 additional lines were acquired to extend GPR control into previously untested areas, with a view to identifying any voids (if present) . All of these GPR data were processed at UMR, and interpreted by UMR researchers, in consultation with MoDOT personnel Newton and Goessmann.
A GSSI SIR-8 GPR unit equipped with a 500 MHz monostatic antenna was used to acquire the Survey 18 and Survey 2 GPR data (Figure4). The sampling interVal was 50 scans/m. The trace length was 50 ns, providing for depth penetration on the order of 4 m
GROUND-PENETRATING RADAR DATA PROCESSING
The GPR data were processed using RADAN, a commercial processing package developed exclusively for ground-penetrating radar data. A fairly standard processing run stream was applied to the GPR data. The processing routine consisted of:
1. Trace normalization. 2. Application of vertical gain. 3. Horizontal filtering . 4, Vertical filtering .
INTERPRETATION OF GROUND-PENETRATING DATA
Two sets of GPR data (Survey 18 and Survey 2) were acquired at site, along Interstate 44 , Springfield Missouri. In Survey 18 (May 1997), 30 profiles were acquired along paved sections of Interstate 44 , in places immediately adjacent to recent subsidence features (lines 1-30; Figures 4, 13, 14 and 15). Survey 18 was successful . from the interpretation of these data, MoDOT personnel were able locate voids that had developed beneath the pavement (as a result of the washout of fine- grained materia!), and devise an effective grouting plan. The validity of the GPR interpretations, and the utility of the GPR method was established during the grouting program. All of the areas deSignated as anomalous on the GPR profiles accepted grout (Figures 13, 14, and 15).
In October of 1997, geophysical Survey 2 was conducted. A duplicate set of 30 ground-penetrating radar profiles and 25 additional GPR lines were acquired. The duplicate set of 30 GPR profiles was acquired with a view to determining the effectiveness of the grouting program and determining if any new voids had developed since the May survey (Survey 18). The 25 additional lines (lines 31-55; Figure 4) were acquired to extend GPR control into previously untested areas, with a view to identifying any voids. Survey 2 was also successful. The interpretation of these ground-penetrating radar data suggests that the grouting program effectively stabilized most of the previously imaged sub-pavement voids. No new I prominent
11

GPR anomalies were observed on either the duplicate data set (30 lines) or the newly acquired coverage (25 profiles across previously untested areas).
Three example duplicate GPR profiles (1, 2 and 3) are shown as Figures 16, 17 and 18, respectively. Areas designated as anomalous on the GPR profiles have been highlighted on Figures 13. 14. and 15. These anomalous zones are characterized on the GPR profi les by high amplitude diffractions (Figures 16, 17, and 18).
AREA 1: WESTBOUND LANE, 200' (61 mete",) LONG.
I I
I I
DATA ACQUIRED 4-28-417
Figure 13: Map of GPR study area 1. Locations of ground~ penetrating profiles 1 ~ 1 0, with associated GPR anomalies.
AREA 2: EASTBOUND LANE, 300' (91." meters) LONG. I~
I I ! DATAACOUIREO .. 2O.e1
Figure 14: Map of GPR study area 2. Locations of ground~penetrating profiles 11 ~20 , with associated GPR anomalies.
AREA 3: EASTBOUND LANE, 3O<r (9 1.4 meters) LONG, I~ ...... i i i I ! I i i
I I
Figure 15: Map of GPR study area 3. Locations of ground-penetrating profiles 21 -30, with associated GPR anomalies.
12

Figure 16: May and October versions of ground-penetrating radar profile 2 (Area l ' Figure 12). The upper GPR profile was acquired in May, the lower profile in October. Grout application borehole locations are shown

Figure 17 May and October verSions of ground-penetrating radar profile 4 (Area 1. Figure 12). The upper GPR profile was acquired In May, the lower profile In October . Grout application borehole locations are shown.

Figure 1 B: May and October versions of ground-penetrating radar profile 5 (Area 1: Figure 12) . The upper GPR profile was acquired in May, the lower profile in October . Grout application borehole locations are shown.

UNIVERSITY RESEARCH CONCLUSIONS
The engineering geophysical surveys
On the basis of our site inspections, our knowledge of the area, and our integrated interpretation of the geophysical data, we conclude that the tested section of Interstate overlies two active sinkholes. Although there is no evidence that catastrophic collapse is imminent anywhere along the tested section of Interstate, we recommend that these two sinkholes are investigated further. If these sinkholes are determined to be structurally stable, the tested segment of Interstate is not ~hjgh risk~ for catastrophic collapse. As far as the sub·pavement voids are concerned, we believe that the grouting program has effectively stabilized the shallow subsurface in the short term. However, fine- grained sediment will continue to be "washed out" as long as substantial volumes of water flow into the sinkholes. Pavement subsidence will be a reoccurring and long term problem, until drainage problems are mitigated.
Utility at the Reflection Seismic Method
The reflection seismic profiles (Figures 6-12) establish that high-resolution reflection seismic data can effectively image the shallow subsurface in the study area, and can be used to identify and map bedrock structure and sinkholes. These data demonstrate that the high-resolution seismic technique can be used effectively to image the shallow subsurface between depths of 3 and 60 meters. The data also demonstrate just how critical paramelers such as fold, geophone spacing , source type, and near-offset are to the successful acquisition of quality reflection seismic data in the study area.
On the basis of our experience in acquiring, processing and interpreting the seven reflection seismic lines, we have come up with a suite of recommendations for any additional seismic work. These are listed below under the headings: Data Coverage, Data Fold, Seismograph, Source, Geophones, Sampling Interval , Record Length, Spread Length , Near-offset, Elevation Control , Velocity Analysis, Processing, and other.
Optimal Reflection Seismic Survey Parameters
Data Coverage: Subsurface coverage on the order of 1.5 m is necessary to image significant lateral changes in shallow lithology and structure. This translates into a surface geophone spacing of 3 m.
Data Fold: Nominally 12-fold COP data is necessary to effectively image the shallowest subsurface as well as pre-bedrock reflectors. At lower folds , data redundancy both at shallow «6 m) and greater (>45 m) depths are unacceptably reduced due to unacceptable NMO stretch, and ground roll contamination respectively.
Seismograph: A 24-channel (or greater) seismograph with rOIl-a-long capabilities is necessary to acquire the data in an efficient manner.
Source: Given the shallow depth of the primary target zone, a near surface source is required. ThIs should consist of either a surface weight drop or a small explosive (shotgun shell for example) detonaled in a shallow (1 m deep), filled 8 em diameter drill hole. We recommend using a weight drop source, with multiple (6-8) impacts (to attenuate high frequency ground roll and airblast)_
16

Geophones: Geophones with a natural resonant frequency of 40 Hz (or more) should be used. These will effectively attenuate low frequency ground roll and yet allow for the recording of desired high·frequency reflection data. Although It is common practice to use single high· frequency geophones a closely clustered array would be preferable (assuming a multiple weight drop source). If single geophones are used, they should be buried at shallow depths (or covered with soil) to minimize noise from the wind and airblast.
Sampling Interval: A sampling interval of 0.5 ms is sufficient. Data with dominant frequencies between 50 and 100 Hz are expected.
Record Length: A record length of 500 ms is sufficient to image the subsurface to a depth of at least 300 m.
Spread Length and Near·offset : We recommend using an array of 24 geophones with a geophone spacing of about 3 m. We recommend using a near offset of 3 to 6 meters. This will result in nominal 12·fold data, with subsurface coverage at 1.5 m intervals.
Elevation Control: Source and receiver locations should be surveyed so that elevation corrections can be applied.
Velocity Analysis: Because of the variability in near·surface velocities, velocity analysis should be done for every tenth CMP gather, and more regularly where anomalous variations are noted.
Processing: Standard high·resolution processing routines should be followed, This would include the judicious muting of first breaks and excessive ground roll (or suitable F·K filtering), and the muting of excessively stretched NMO data.
Util ity of the Ground-penetrating Radar Method
The GPR profiles (Figures 16·18) demonstrale that SUb-pavement vo'ids can be located using the GPR tool. These data demonstrate that the GPR technique can be used effectively to image the shallow subsurface to depths of up to 4 m. The data also demonstrate just how critical parameters such as line spacing, antenna frequency, etc. are to the successful acquisition ...
Optima' GPR Survey Parameters
Antenna Frequency: A 500 MHz antenna provided both the necessary depth penetration and vertical resolution to image shallow sub-pavement voids, A 900 MHz would provide better vertical resolution. but significantly less depth penetration. A 120 MHz antenna will provide slightly greater depth penetration, bul substantially less vertical resolution (re: small voids).
Data Coverage: Subsurface coverage on the order of 2 em is necessary to image the sub· pavement strata.
Sampling Interval: A sampling interval of 50 scans/m (or more) is sufficient.
Record Length : A record length of 50 ns is sufficient to image the subsurtace to a depth of about 4 m.
17

Elevation Control : Elevation corrections should be applied.
Processing: Standard GPR processing routines should be followed.
University Research Recommendations (Additional Geophysical Work at Site)
On the basis of our interpretation of the geophysical data, we conclude that the lested secUon of Interstate overlies two reactivated sinkholes Although there is no evidence that catastrophic collapse is imminent anywhere along the tested section of Interstate, we recommend that these two sinkholes be investigated further. If these features do not constitute hazards (potential for catastrophic collapse), then our conclusion is that the tested segment of Interstate is not "high risk~ for catastrophic collapse. As far as the SUb-pavement voids are concerned. we believe that the grouting program has effectively stabi lized the shallow subsurface in the short term (May to October interval). However. fine-grained sediment will continue to be "washed our' as long as substantial volumes of groundwater flow into the sinkholes from the upgradient (north) , and pavement subsidence will be a on going and long-term problem.
1. We recommend further investigation of the geophysical anomalies identified as Features A. B, F, and G. (Features A and B are interpreted sinkholes; Features F and G are interpreted fractures.) These are the most anomalous features on Seismic SP-2 (Figures 5 and 7).
2. We recommend remedial action to ensure that surface runoff seepage along this segment of Interstate is minimized. This (combined with grouting and long-term monitoring) will ensure that "washout" related subsidence is minimized.
3. We recommend the acquisition of GPR profiles at regular (6 month) intervals, until the surface run-off problem has been minimized and subsidence has effectively ceased. The profiles should cover both lanes of the Interstate, in the immediate vicinity of the subsidence features.
18

, , , J
N£-SN . • ! _ "J·~·r.J---·-· -- -- - - -
Figure 19: Burden of Proof - Pre-construction drawing of area found after the investigation showing the dashed outlines of the sinks that were confi rmed with geophysics. Compare with Figure 5.
19

MoDOT CONCLUSIONS
The use of Ground Penetrating Radar (GPR) as an investigative tool reduced the time and cost of the project as compared to the traditional methodology of investigation and mitigation of karstic distress. Without GPR, subsurface information would be obtained by drilling auger holes through the highway pavement, shoulders, and median - a technique similar to finding a needle in the proverbial haystack, The impact of the numerous boreholes required would have a twofold effect on the stability of the roadway. The strength and integrity of the pavement bridging the subsurface voids would be greatly reduced, and secondly, the holes would act as conduits of stormwater, allowing water to flush additional soil downward and accelerate the growth of the voids ,
Time wise, GPR allowed MoDOT to quickly assess the threat of roadway subsidence to the traveling public. This data contributed to the decision making process of keeping both lanes of the Interstate open . Processed GPR images were used to locate voids and unconsolidated material underlying the pavement. These features were marked on the pavement, drilled , and pumped full of cement grout to stabilize the subgrade. This process required 44 tons of cement grout to fill all the voids and only required the closure of one lane of traffic. The grout appears to have now stabilized the pavement and subsurface. A second application of GPR to the mitigated areas confirmed the voids had been adequately filled. The cost of materials and labor involved in the grouting / mitigation process was about $7,000.
Without GPR data , a typical mitigation of the areas suspected of possible collapse would be to tear out the overlying existing pavement, laying base rock, and re-paving the interstate roadway at an estimated cost of $45 per square yard, not including removal and excavation costs. New pavement would be 40 feet wide per east / west bound lanes, The high cost, amount of time required , and the associated long term traffic delays of this scenario make it an undesirable alternative. The problem would be exacerbated by the lack of an adequate bypass of the area and the consequent inference with business of the adjacent golf course.
This study has demonstrated the effectiveness of Ground Penetrating Radar and Reflection Seismic geophysical methods to investigate karst related threats to roadway pavements. The penetration of GPR is dependent on the conductivity of the soil , which varies considerably with geography, Reflection Seismic, which shows the underlying bedrock structure , is highly reliable but only necessary when the local geology and location of sinkholes and faults is unknown. MoDOT should integrate these geophysical tools into investigations where typical methods would be more costly and only provide limited information. More research is needed to determine the effectiveness of these tools in different subsurface soil and geology types throughout the state of Missouri.
20

IMPLEMENTATION I RECOMMENDATIONS
Any threatening roadway stability situation involving the shallow subsurface that requires quick assessment is a candidate for the application of the technologies described in this report. However, ground penetrating radar and reflection seismic are complex tools that require skilled technical persons to operate. MoDOT is currently conducting much research on the many applications of these nondestructive geophysical techniques. The results of these studies will be used to determine if the expenditure for equipment and its dedicated personnel is warranted . At this time it is recommended to establish qualified consultants that would be able to make their services available on short notice. Prior arrangements to expedite the mobilization and data collection should be made as well. This would be in the best interest of the traveling public, ensuring safety while minimizing disruption of traffic.
21

APPENDIX A
GEOLOGIC SITUATION LEADING TO THE PHENOMENON
22

GEOLOGIC SITUATION LEADING TO THE PHENOMENON
Site Area Geology
Site-area geology is complex from two important perspectives, which are 1) the abundant residual soil blanketing most 01 the bedrock and, 2) alleasl a dual and possible triple-decked system 01 karstic dissolution. We went into the project lacking the subtle distinction between vadose-zone karst dissolution features and those centered at a greater depth .
Pinnacles & Grikes
These features represent the prominent bedrock knobs displayed prominently along both sides of the depressed (cut) section of 1-44 as it passes through the north side of Springfield . A few moments spent in reflection in this segment brings the viewer to the recognition that the karstic dissolution generally is bound to the uppermost 5 meters of bedrock and that most of the dissolution voids and gaps appear to terminate at a prominent bedding plane in the limestone and at a depth of about 5m.
"Grikes", the gaps, holidays, channels, and voids where limestone has been dissolved, are driven by original activity along the prominent vertical jointing system of most of the southwest Missouri limestone sequence. These grikes are by no means predictable, but we operate on a reference frame of about five (5) meters of lateral separation . Grikes normally are soil filled, by sloughing of silts and clay-sized particles furnished by gravity fall from the overlying residual clay soil.
Creation of the pinnacle-and-grike system of irregularity of the bedrock top-of-rock surface has occurred over literally millions of years. During th is time it responded to slow infiltration of precipitation , with movement of this water typically downward in the uppermost 5-meter vertical zone, then laterally, toward breakout pOints furnished by nearby topographic irregularities, probably more so in the past than is presently apparent. This would have naturally occurred earlier than later (present time), over the entire period of a few millions of years, during which time the topography has become smooth and subdued, erasing the evidence of side-hill breakout.
We do not mean to imply, within the context of this report, that the appearance of irrigation waters. in the perched water system, are believed to have caused dissolution of rock. Theoretically this is not possible over a period of only a few years. The waters, however, are believed to have piped-away existing soil infilling in the near-surface bedrock karstic voids.
23

Deeper Karst
Karstic features of a deep (or "deeper") origin remain as "sinkholes" (AKA "dolines"). which dot the countryside of Greene County in an apparently random fashion . We believe that there are essentially two generic sets of sinkholes, one set driven by groundwater movement in the Uppermost Aquifer (limestone sequence lying at elevations above the Northview Shale Member) and the Second Aquifer (lying below the not-always-present Northview Shale).
Subsurface Water Flow
Surface-water flow normally would not have a considerable influence on the geotechnical stability of karstic ground in Greene County, except where considerable amounts of storm-water discharge inadvertently reach sinkholes. Conventional wisdom among civil engineers is to avoid discharging runoff or accumulated storm water into sinkholes, for the dual threats of washing out supporting debris and initiating collapses, and for actually extending the dissolution process with carbonate-dissolving "hungry" water with low TDS (Total Dissolved Solids) contents.
At the subject site , we believe that it has been an excess of surface water infiltration that has reactivated the karst process. mainly by erosion-removal of the silt and clay-sized grike fillings and also establishing hydraulic communication with the subsurface karst flow network incorporating perched water of the vadose zone with flow of ground water in at least the Uppermost Aquifer. We had initially discounted participation of the Uppermost Aquifer until we learned that more than 100cm (cubic meters) of soil and rock backfill had been introduced by the Maintenance Crew into the median cracks and pits (typically smaller than one meter of surface-open area in a single location) over the 12-year period 1983-1995, and by our recent (beginning 5 May 1997) mitigation drilling support.
24

APPENDIX B
PHOTOGRAPHS
25

Photo No. I
"Pinnacle and Grike" geology exposed in roadcut near research project on Interstate 44, Springfield, Missouri

Photo No.2
Photo No. 3
Collapse on shoulder signified the threat of future roadway subsidence.
University of Missouri -Rolla personnel co llecting OPR data. Red box being pulled is OPR antenna.

Photo No. 4
Photo No.5
Geophone being placed in ground for reflection seismic data aquisition.
Truck mounted EWG seismic energy souirce "thumps" ground repeatedly to produce waves for reflection seismic data.

Photo No.6
Photo No.7
Pavement with OPR lines marked off. Interpreted data is be ing used to locate areas requiring mit igation.
Grouting operation in progress. Pavement is cored out with dri ll , then grout is pumped in to fill subsurface voids.