application of envisat sar imagery for mapping and estimation of natural oil seeps in the south
6
APPLICATION OF ENVISAT SAR IMAGERY FOR MAPPING AND ESTIMATION OF NATURAL OIL SEEPS IN THE SOUTH CASPIAN SEA Victoria V. Zatyagalova , Andrei Yu. Ivanov , (1) (2) Boris N. Golubov (3) (1) R&D Center ScanEx, Moscow, Russia, Email: [email protected] (2) P.P. Shirshov Institute of Oceanology, Russian Academy of Sciences, Moscow, Russia, Email: [email protected] (3) Institute of Dynamics of Geospheres, Russian Academy of Sciences, Moscow, Russia, Email: [email protected] ABSTRACT Numerous oil slicks of natural origin were revealed in the southwest part (SW) of Caspian Sea on the synthetic aperture radar (SAR) images acquired by the Envisat satellite in 2003-2004. Analysis of the SAR images together with bathymetry, geophysical and seismic data in geographic information system showed that the main hydrocarbon contribution visible on the sea surface as oil slicks comes from the natural seepage. Oil slicks are basically concentrated over the local geological formations of the sedimentary cover having oil and gas resources. In total about 90 seeps distributed across the SW Caspian Sea having repeating regime and an active type were identified. Seepage rate of oil in the SW Caspian Sea is estimated to be up to 16,000 metric tons per year. Conclusion is done that the SAR onboard the Envisat satellite is an excellent tool for studying oil seeps through observation oil slicks floating on the sea surface. 1. INTRODUCTION Active seepage refers to areas where subsurface hydrocarbons penetrate in large concentrations into shallow sediments and the overlying water column [1]. Such seeps occur in basins where hydrocarbons are now actively generating or they contain excellent migration pathways [1]. Examples of active seeps exist in the Gulf of Mexico, the Caspian Sea, offshore California and Brazil, West Africa and Indonesia. In the offshore conditions leaking oil are often can be detected due to the fact that oil comes to the surface from the seafloor as gas bubbles coated by oil or as oil drops [2]. Oil on the surface forms thin oil films, which in low sea state conditions are often visible as slicks. It is well-known that natural oil seeps can indicate the accumulations of hydrocarbon deposits. Natural oil seeps detected in many offshore basins sometimes mark continuations of the oil and gas fields located on the land. In the beginning of XX c. they had led to the discovery of the large oil fields worldwide, when first systematic studies of offshore seeps from ships and airplanes began with development of offshore exploration [2]. One of the largest and intense seepage occurs in the SW of the Caspian Sea [3,4]. The hydrocarbon seepage in the Caspian Sea has a long history. In the beginning of 1900s onshore seeps there were used by the explorers to identify petroleum fields and develop oil production onshore and offshore of the Apsheron Peninsula. Nowadays the Caspian Sea is one of the most important world’s production basins with proven oil reserves of 16- 30 billion barrels. Spaceborne synthetic aperture radar (SAR) systems, such as Advanced Synthetic Aperture Radar (ASAR) onboard the European Envisat satellite is an ideal tool for these applications, since they have day-and night capability and are not affected by cloud conditions. For the first time slicks related to seepage of crude oil have been detected on the SAR images acquired by the Seasat satellite offshore southern California [5]. Since launch the first SAR-equipped satellite many oil slicks associated with bottom seeps have been detected worldwide by the ERS-1/2, Almaz-1 and Radarsat-1 satellites [6-9]. Because relationship between surface manifestations and seafloor sources of hydrocarbons can be complicated, proper interpretation requires integration of SAR data with geographic, geologic, geophysical, seismic and oceanographic data. In this study slick identification and mapping approach developed in [10- 12] is applied to study seep characteristics and their impact on the marine environment of the Caspian Sea. 2. SAR IMAGE PROCESSING AND INTERPRETATION Seven pairs of Envisat ASAR images acquired in Image Mode (100 x 100 km swath and 25 m resolution) in period between July 2003 and October 2004, provide 200 km of data covering the SW Caspian Sea (Fig. 1). Five ASAR images showing multiple seepage slicks are depicted in Fig. 2. All SAR images were acquired under appropriate wind and sea-state conditions, at wind speed not exceed 6-7 m/s (Tab.). Processing of SAR image includes: (1) antenna pattern correction, SAR image resampling and speckle noise reduction, (2) detection of dark features, (3) interactive classification on the basis of geometrical/textural properties and contextual information, and (4) discrimination among other look-alikes. Then all identified oil slicks were vectorized, removed from an image background and put on the map projection. Finally oil spill vector layers were integrated in a GIS. In our case we include into the GIS information about coastline, coastal settlements, hydrography features (river mouths and coastal lakes), bathymetry, location of oil and gas formations and positions of known underwater mud volcanoes [11]. Additionally information about of earthquakes taken place in 2003- 2004 in the Caspian Region from the USGS database has been also collected, processed and included. Of course, _____________________________________________________ Proc. ‘Envisat Symposium 2007’, Montreux, Switzerland 23–27 April 2007 (ESA SP-636, July 2007)
Transcript of application of envisat sar imagery for mapping and estimation of natural oil seeps in the south

APPLICATION OF ENVISAT SAR IMAGERY FOR MAPPING AND ESTIMATION OF NATURAL OIL SEEPS IN THE SOUTH CASPIAN SEA
Victoria V. Zatyagalova , Andrei Yu. Ivanov , (1) (2) Boris N. Golubov(3)
(1) R&D Center ScanEx, Moscow, Russia, Email: [email protected](2) P.P. Shirshov Institute of Oceanology, Russian Academy of Sciences, Moscow, Russia, Email: [email protected]
(3) Institute of Dynamics of Geospheres, Russian Academy of Sciences, Moscow, Russia, Email: [email protected]
ABSTRACT Numerous oil slicks of natural origin were revealed in the southwest part (SW) of Caspian Sea on the synthetic aperture radar (SAR) images acquired by the Envisat satellite in 2003-2004. Analysis of the SAR images together with bathymetry, geophysical and seismic data in geographic information system showed that the main hydrocarbon contribution visible on the sea surface as oil slicks comes from the natural seepage. Oil slicks are basically concentrated over the local geological formations of the sedimentary cover having oil and gas resources. In total about 90 seeps distributed across the SW Caspian Sea having repeating regime and an active type were identified. Seepage rate of oil in the SW Caspian Sea is estimated to be up to 16,000 metric tons per year. Conclusion is done that the SAR onboard the Envisat satellite is an excellent tool for studying oil seeps through observation oil slicks floating on the sea surface.
1. INTRODUCTION Active seepage refers to areas where subsurface hydrocarbons penetrate in large concentrations into shallow sediments and the overlying water column [1]. Such seeps occur in basins where hydrocarbons are now actively generating or they contain excellent migration pathways [1]. Examples of active seeps exist in the Gulf of Mexico, the Caspian Sea, offshore California and Brazil, West Africa and Indonesia. In the offshore conditions leaking oil are often can be detected due to the fact that oil comes to the surface from the seafloor as gas bubbles coated by oil or as oil drops [2]. Oil on the surface forms thin oil films, which in low sea state conditions are often visible as slicks. It is well-known that natural oil seeps can indicate the accumulations of hydrocarbon deposits. Natural oil seeps detected in many offshore basins sometimes mark continuations of the oil and gas fields located on the land. In the beginning of XX c. they had led to the discovery of the large oil fields worldwide, when first systematic studies of offshore seeps from ships and airplanes began with development of offshore exploration [2]. One of the largest and intense seepage occurs in the SW of the Caspian Sea [3,4]. The hydrocarbon seepage in the Caspian Sea has a long history. In the beginning of 1900s onshore seeps there were used by the explorers to identify petroleum fields and develop oil production onshore and offshore of the Apsheron Peninsula. Nowadays the Caspian Sea is one of the most important
world’s production basins with proven oil reserves of 16-30 billion barrels. Spaceborne synthetic aperture radar (SAR) systems, such as Advanced Synthetic Aperture Radar (ASAR) onboard the European Envisat satellite is an ideal tool for these applications, since they have day-and night capability and are not affected by cloud conditions. For the first time slicks related to seepage of crude oil have been detected on the SAR images acquired by the Seasat satellite offshore southern California [5]. Since launch the first SAR-equipped satellite many oil slicks associated with bottom seeps have been detected worldwide by the ERS-1/2, Almaz-1 and Radarsat-1 satellites [6-9]. Because relationship between surface manifestations and seafloor sources of hydrocarbons can be complicated, proper interpretation requires integration of SAR data with geographic, geologic, geophysical, seismic and oceanographic data. In this study slick identification and mapping approach developed in [10-12] is applied to study seep characteristics and their impact on the marine environment of the Caspian Sea.
2. SAR IMAGE PROCESSING AND INTERPRETATION
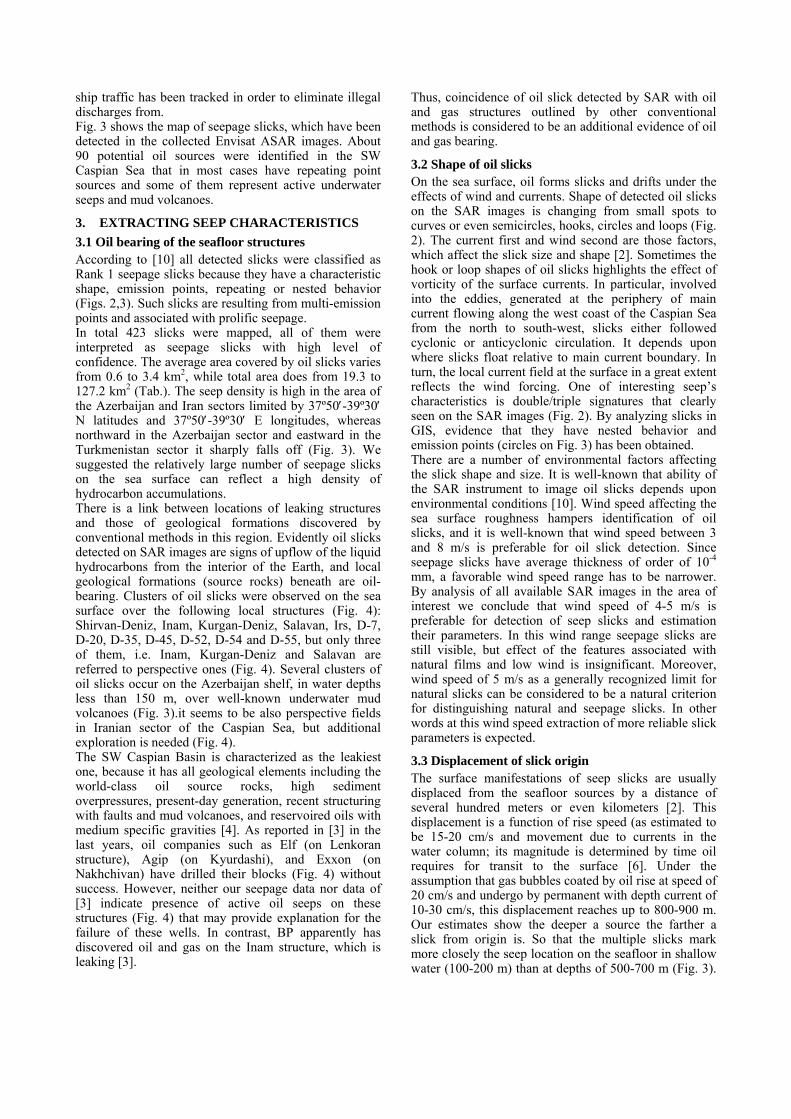
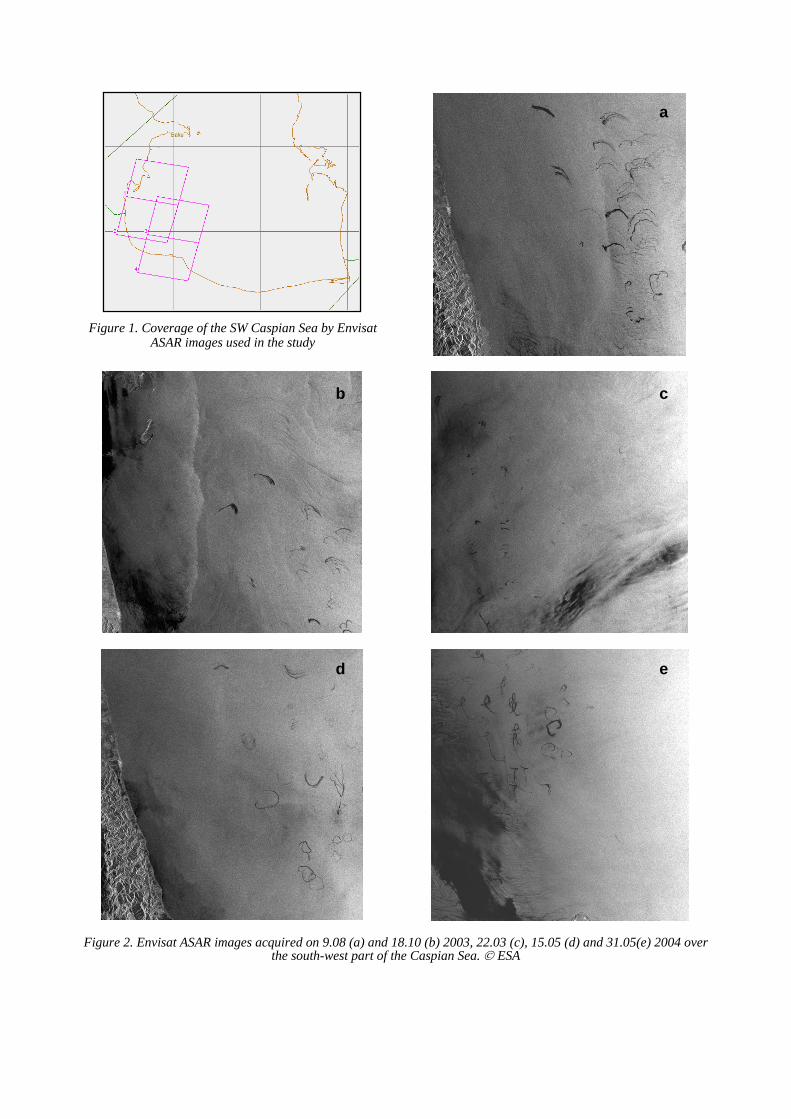
Seven pairs of Envisat ASAR images acquired in Image Mode (100 x 100 km swath and 25 m resolution) in period between July 2003 and October 2004, provide 200 km of data covering the SW Caspian Sea (Fig. 1). Five ASAR images showing multiple seepage slicks are depicted in Fig. 2. All SAR images were acquired under appropriate wind and sea-state conditions, at wind speed not exceed 6-7 m/s (Tab.). Processing of SAR image includes: (1) antenna pattern correction, SAR image resampling and speckle noise reduction, (2) detection of dark features, (3) interactive classification on the basis of geometrical/textural properties and contextual information, and (4) discrimination among other look-alikes. Then all identified oil slicks were vectorized, removed from an image background and put on the map projection. Finally oil spill vector layers were integrated in a GIS. In our case we include into the GIS information about coastline, coastal settlements, hydrography features (river mouths and coastal lakes), bathymetry, location of oil and gas formations and positions of known underwater mud volcanoes [11]. Additionally information about of earthquakes taken place in 2003-2004 in the Caspian Region from the USGS database has been also collected, processed and included. Of course,
_____________________________________________________
Proc. ‘Envisat Symposium 2007’, Montreux, Switzerland 23–27 April 2007 (ESA SP-636, July 2007)
ship traffic has been tracked in order to eliminate illegal discharges from. Fig. 3 shows the map of seepage slicks, which have been detected in the collected Envisat ASAR images. About 90 potential oil sources were identified in the SW Caspian Sea that in most cases have repeating point sources and some of them represent active underwater seeps and mud volcanoes.
3. EXTRACTING SEEP CHARACTERISTICS 3.1 Oil bearing of the seafloor structures According to [10] all detected slicks were classified as Rank 1 seepage slicks because they have a characteristic shape, emission points, repeating or nested behavior (Figs. 2,3). Such slicks are resulting from multi-emission points and associated with prolific seepage. In total 423 slicks were mapped, all of them were interpreted as seepage slicks with high level of confidence. The average area covered by oil slicks varies from 0.6 to 3.4 km2, while total area does from 19.3 to 127.2 km2 (Tab.). The seep density is high in the area of the Azerbaijan and Iran sectors limited by 37º50′-39º30′ N latitudes and 37º50′-39º30′ E longitudes, whereas northward in the Azerbaijan sector and eastward in the Turkmenistan sector it sharply falls off (Fig. 3). We suggested the relatively large number of seepage slicks on the sea surface can reflect a high density of hydrocarbon accumulations. There is a link between locations of leaking structures and those of geological formations discovered by conventional methods in this region. Evidently oil slicks detected on SAR images are signs of upflow of the liquid hydrocarbons from the interior of the Earth, and local geological formations (source rocks) beneath are oil-bearing. Clusters of oil slicks were observed on the sea surface over the following local structures (Fig. 4): Shirvan-Deniz, Inam, Kurgan-Deniz, Salavan, Irs, D-7, D-20, D-35, D-45, D-52, D-54 and D-55, but only three of them, i.e. Inam, Kurgan-Deniz and Salavan are referred to perspective ones (Fig. 4). Several clusters of oil slicks occur on the Azerbaijan shelf, in water depths less than 150 m, over well-known underwater mud volcanoes (Fig. 3).it seems to be also perspective fields in Iranian sector of the Caspian Sea, but additional exploration is needed (Fig. 4). The SW Caspian Basin is characterized as the leakiest one, because it has all geological elements including the world-class oil source rocks, high sediment overpressures, present-day generation, recent structuring with faults and mud volcanoes, and reservoired oils with medium specific gravities [4]. As reported in [3] in the last years, oil companies such as Elf (on Lenkoran structure), Agip (on Kyurdashi), and Exxon (on Nakhchivan) have drilled their blocks (Fig. 4) without success. However, neither our seepage data nor data of [3] indicate presence of active oil seeps on these structures (Fig. 4) that may provide explanation for the failure of these wells. In contrast, BP apparently has discovered oil and gas on the Inam structure, which is leaking [3].
Thus, coincidence of oil slick detected by SAR with oil and gas structures outlined by other conventional methods is considered to be an additional evidence of oil and gas bearing.
3.2 Shape of oil slicks On the sea surface, oil forms slicks and drifts under the effects of wind and currents. Shape of detected oil slicks on the SAR images is changing from small spots to curves or even semicircles, hooks, circles and loops (Fig. 2). The current first and wind second are those factors, which affect the slick size and shape [2]. Sometimes the hook or loop shapes of oil slicks highlights the effect of vorticity of the surface currents. In particular, involved into the eddies, generated at the periphery of main current flowing along the west coast of the Caspian Sea from the north to south-west, slicks either followed cyclonic or anticyclonic circulation. It depends upon where slicks float relative to main current boundary. In turn, the local current field at the surface in a great extent reflects the wind forcing. One of interesting seep’s characteristics is double/triple signatures that clearly seen on the SAR images (Fig. 2). By analyzing slicks in GIS, evidence that they have nested behavior and emission points (circles on Fig. 3) has been obtained. There are a number of environmental factors affecting the slick shape and size. It is well-known that ability of the SAR instrument to image oil slicks depends upon environmental conditions [10]. Wind speed affecting the sea surface roughness hampers identification of oil slicks, and it is well-known that wind speed between 3 and 8 m/s is preferable for oil slick detection. Since seepage slicks have average thickness of order of 10-4 mm, a favorable wind speed range has to be narrower. By analysis of all available SAR images in the area of interest we conclude that wind speed of 4-5 m/s is preferable for detection of seep slicks and estimation their parameters. In this wind range seepage slicks are still visible, but effect of the features associated with natural films and low wind is insignificant. Moreover, wind speed of 5 m/s as a generally recognized limit for natural slicks can be considered to be a natural criterion for distinguishing natural and seepage slicks. In other words at this wind speed extraction of more reliable slick parameters is expected.
3.3 Displacement of slick origin The surface manifestations of seep slicks are usually displaced from the seafloor sources by a distance of several hundred meters or even kilometers [2]. This displacement is a function of rise speed (as estimated to be 15-20 cm/s and movement due to currents in the water column; its magnitude is determined by time oil requires for transit to the surface [6]. Under the assumption that gas bubbles coated by oil rise at speed of 20 cm/s and undergo by permanent with depth current of 10-30 cm/s, this displacement reaches up to 800-900 m. Our estimates show the deeper a source the farther a slick from origin is. So that the multiple slicks mark more closely the seep location on the seafloor in shallow water (100-200 m) than at depths of 500-700 m (Fig. 3).
ed
cb
a
Figure 1. Coverage of the SW Caspian Sea by Envisat ASAR images used in the study
Figure 2. Envisat ASAR images acquired on 9.08 (a) and 18.10 (b) 2003, 22.03 (c), 15.05 (d) and 31.05(e) 2004 over the south-west part of the Caspian Sea. © ESA

Table. Estimated seepage rates in the SW Caspian Sea*
Estimates based on [14] Estimates based on [13] Date of image
acquisition
Wind speed,
m/s
Number of slicks
Total slick
area, km2 silvery, metric tons/day
rainbow, metric tons/day
metric tons/year
metric tons/day
metric tons/year
5.07.2003 3-6 30 101.6 2.0 30.5 11,125 35.56 12,9799.08.2003 2-7 78 113.9 2.3 34.1 12,450 39.80 14,52518.10.200 2-4 52 66.7 1.3 20.0 7,303 23.35 8,52022.03.200 2-6 64 31.4 0.6 9.4 3,438 10.99 4,01115.05.200 3-7 69 84.3 1.7 25.3 9,230 29.51 10,77131.05.200 2-4 98 127.2 2.5 38.2 13,928 44.52 16,2502.10.2004 2-5 32 19.3 0.4 5.8 2,113 6.75 2,465
* min and max estimates are in grey-filled cells. 3.4 Frequency of seeps Spatial analysis of the SAR images in GIS showed that action of underwater seeps can be of two kinds. On the one hand clusters of slicks can be produced by the same source acting periodically. On the other hand the slick clusters can be the results of action of group of different sources. Undoubtedly clusters of slicks above the Shirvan-Deniz, Inam, D-35, Kurgan-Deniz, D-7 and Irs local structures (Fig. 3) mark the locations of mud volcanoes [12]. Double/triple signatures from time to time visible on the SAR images (Fig. 2) are suggested to be a result of either acting of one source in periodic regime or manifestation of a group of close located underwater sources acting occasionally and simultaneously. In first case, taking into consideration the velocity of local surface current over the range of 10-30 cm/s and distance between two slicks (2-5 km), an estimate of acting period of 6-10 hr is obtained. It is concluded, therefore, the frequency of slick appearance on the sea surface is rather periodic than episodic. In the second case a distance between slicks on SAR image reflects the distance between underwater sources.
3.5 Seepage rate Estimates of seepage rate directly depend on the film thickness and area covered by oil. In [6] seepage film thickness and lifetime of oil slick on the sea surface are estimated to be 10-1-10-2 µm and 8-24 hr. These parameters strongly affect estimations of seepage rate. According to many observations a colour of oil films floating on the sea surface varies from silvery to rainbow (see, e.g. [9]) that assumes that average thickness of oil film to be as thick as 10-4 mm. A number of methods, similar in principle, have been applied to estimate a seepage rate. One of them was developed in [13] and based on experimental measurements of oil films in the ocean; another one is known as the Bonn Agreement’s method [14] based on colour coding of oil films. In the first approach is assumed that 1 km2 of oil film can contain up to 0.5 metric tons (t) of oil in average. The second one uses colour coding of oil films to calculate oil concentration: oil concentration in silvery films is about of 0.02 m3/km2 (or ~0.02 t/km2), in grey films – 0.1 m3/km2 (~0.1 t/km2) and in rainbow films – 0.3 m3/km2 (~0.3 t/km2) [14]. Having applied these methods to our data, min and max
estimates of seepage rates were obtained; they are presented in Tab.
3.6 Seepage rate and oil pollution Evidently seeps and mud volcanoes bring in the significant contribution to the marine environment of the Caspian Sea. Oil pollution due to seepage can be mistakenly attached to human activity or offshore oil production, although in reality that is one of most characteristic features of the Caspian Sea. In [16] natural oil emission estimated in 20,000 t per year (17.2 % of the total oil pollution, which estimated in 120,000 t per year). Our max estimate for the SW Caspian Sea gives 16,000 t per year or 13 % of the total oil pollution of the sea. To compare with other estimates let’s look at those acquired for the North American offshore. For example, in [17] the seep rate off the Southern California is estimated from 2,100 to 35,000 t of oil per year on a base of mapping of the geographical trends of seeps in the Santa Barbara Channel. Total oil seepage offshore Southern California based on more accurate measurements is now estimated to be about 17,000 t annually [17]. Using the satellite data estimated oil seepage rates in the Gulf of Mexico ranging from about 40,000 to 100,000 t per year, with an average rate of 70,000 t per year [17]. Thus, estimates for the Northern Gulf of Mexico can vary from 17,000 [6] to 100,000 [17] t per year. Estimate for the whole Gulf of Mexico is raging from 80,000 to 200,000 t per year [17]. Compared with per day mean estimate obtained for the Gulf of Mexico’s Cantarell Seep of about 46 t per day [9], our values range from 5.8 to 38.2 t per day.
3.7 A link with regional seismicity Another important factor affecting the number of oil slicks on the sea surface to be considered is a link between seepage, mud volcanism and regional seismisity ([15] and literature cited therein). After analysis of all available data and related publications on this topic we summarized that this link definitely exists. In suggestion of such link an analysis of earthquake data from USGS National Earthquake Information Center has been carried out. Fig. 5 shows a “first look” correlation between intensity of earthquakes and number of oil slicks detected on SAR images. As seen from Fig. 5, in the course of quiet seismic period from 01.01.2003 to 31.12.2004, there is a short-term ‘disturbing’ period (March-June 2004), which is characterized by increased

Figure 3. Integral map showing distribution oil slicks related to oil seeps
Figure 5. Map of earthquakes in the Caspian Region in 2003-2004 based on data of U.S. Geological Survey Earthquake Database (left) and correlation of their intensity (magnitude)with number of detected oil slicks (right)
number of oil slicks on SAR images
0
20
40
60
80
100
01.0
1.20
03
01.0
3.20
03
01.0
5.20
03
01.0
7.20
03
01.0
9.20
03
01.1
1.20
03
01.0
1.20
04
01.0
3.20
04
01.0
5.20
04
01.0
7.20
04
01.0
9.20
04
01.1
1.20
04
A z e r b a i j a nA z e r b a i j a n
I r a nI r a n
K u r aK u r a
Resht
Astara
Keshtper
Lenkoran
Narimanabad
Bendere-Enzeli
Astara (Iranian)
49°
49°
49°30'
49°30'
50°
50°
50°30'
50°30'
37°3
0'
37°3
0'
38°
38°
38°3
0'
38°3
0'
39°
39°
39°3
0'
39°3
0'
C a s p i a n C a s p i a n S e aS e a
1:1,000,0000 10 20 30 405kilometers
EE E E
E E E E
NN
NN
NN
NN
N N
depth contours700 m 500 m 400 m 300 m200 m150 m100 m50 m20 m10 m5 m
Legendcoastlinesettlementsriver
oil slicks (05.07.2003)oil slicks (09.08.2003)oil slicks (18.10.2003)oil slicks (22.03.2004)oil slicks (15.05.2004)oil slicks (31.05.2004)oil slicks (02.10.2004)
I r a nI r a n
Tu r k m e n i s t aTu r k m e n i s t a
K a z a k h s t a nK a z a k h s t a n
A z e r b a i j a nA z e r b a i j a n
Semnan
Zanjan Mazandaran
Krasnovodsk
Gilan
Baku
49°0'0"в. д. 50°0'0"в. д. 51°0'0"в. д. 52°0'0"в. д. 53°0'0"в. д. 54°0'0"в. д. 55°0'0"в. д.
36°0
'0"с
. ш.
37°0
'0"с
. ш.
38°0
'0"с
. ш.
39°0
'0"с
. ш.
40°0
'0"с
. ш.
41°0
'0"с
. ш.
42°0
'0"с
. ш.
43°0
'0"с
. ш.
C a s p i a n s e aC a s p i a n s e a
earthquake intensity
3,0
3,5
4,0
4,5
5,0
5,5
6,0
6,5
01.0
1.20
03
01.0
3.20
03
01.0
5.20
03
01.0
7.20
03
01.0
9.20
03
01.1
1.20
03
01.0
1.20
04
01.0
3.20
04
01.0
5.20
04
01.0
7.20
04
01.0
9.20
04
01.1
1.20
04
Figure 4. Distribution of seepage slicks in the SW Caspian Sea in relation to revealed (light brown) and perspective (dark grey) oil and gas bearing structures
Azerbaijan
Iran
CaspianSea
D-46
D-49
D-29D-25
D-26
D-59D-45D-56
D-55D-52
IrsAstara-deniz
Lenkoran-denizSalavan D-54 D-21 D-24
D-71D-17D-67
D-40
D-65
D-18D-7
D-20
D-53
Kurgan-deniz
Sara-denizTalysh-deniz
Aran-deniz D-35D-66
D-39D-6D-5
Itigam
InamD-72
Peik
KyurdashiD-37
Kyzylagach-deniz
D-42 D-41
Neftchala-denizGisas
Mugan-denizMidiya D-34
Zafar-Mashal
D-38
Nakhichevan
Sabail
Shirvan-deniz
Ateshgyakh
Yanan Tava
Byandovan-denizChigil-deniz
Dashly
Sangi-Mugan
Umud
D-31
49
49
50
50
38
39

number and magnitude of earthquakes in the Northern Iran (ellipse on Fig. 5). Thus, causal relationship exists between earthquakes, seep activity and number of oil slicks appeared on the sea surface [12]. We conclude, therefore, that number of seepage slick visible on the sea surface can reflect seismic activity of the basin interior.
4. CONCLUSIONS Seven pairs of Envisat ASAR images acquired over of the SW Caspian Sea offshore Azerbaijan and Iran in 2003-2004 document numerous oil slicks of natural origin associated with bottom oil seeps. Oil seeps in the Caspian Sea have been under examination mainly due to two reasons, i.e., (1) considerable accumulation of fuel resources, and (2) their role in regional oil pollution. On the basis of computer processing and analysis of SAR images together with bathymetry, geophysical and seismic data and information in GIS, a link between these slicks and active seepage phenomenon in the SW Caspian is established. Spatial analysis of multi-temporal SAR satellite imagery over the Caspian Basin provided information on seep locations, frequency and seep rates. Obtained results suggest that these oil seeps (1) have a prolific type, (2) have relatively high seepage rate, (3) associate with mud volcanoes, (4) seat within oil & gas bearing structures, and (5) linked with intensity of regional earthquakes. Results demonstrate that the SW Caspian Basin having high seepage concentration, high percentage of repeating seeps in time and seepage rate is to be one the leakiest world’s basins. These findings can be considered as one of the important criteria of availability of oil and gas. The oil and gas leaking structures revealed in the Azerbaijanian sector study may have significant volumes of oil and gas and still waiting discovery and exploration. There will be also perspective fields in the Iranian sector, but additional investigations are also needed. Seepage rate in the SW Caspian Sea based on SAR images is estimated to be 2,000-16,000 metric tons of oil per year. This maximum estimate is only 13 % of the total oil pollution of the sea according to the estimate by [16]. However, we consider our estimates as rank values only, because so many affecting factors must be taken into account to get more accurate estimates. We conclude the Envisat ASAR is an excellent tool for studying oil seeps and seep related phenomena. Technology of integration Envisat images with geophysical information in geographical information system can significantly improve the characterization of natural seeps through observations of slicks floating on the sea surface.
5. ACKNOWLEDGEMENTS Envisat ASAR images for this study have been received from ESA (Envisat AO project #226). Agency on Science & Innovation of Russian Federation and Russian Foundation for Basic Research, grant № 06-05-64468, provided financial support for this research.
REFERENCES 1. Schumacher, D. (2000). Surface geochemical exploration
for oil and gas: New life for an old technology. The Leading Edge, March, 258-261.
2. MacDonald, I.R. (1998). Natural oil spills, Sci. American, 279, 51-66.
3. Williams, A. & Huntley, A. (1998). Oil from space: detecting the sleeping giants of the deep-water Caspian by satellite. In Petroleum Exploration Society Conference, 1-3 Dec. 1998, London, UK.
4. Williams, A. & Lawrence, G. (2002). The role of satellite seep detection in exploring the South Atlantic’s ultradeep water. In Surface exploration case histories: Applications of geochemistry, magnetics, and remote sensing. AAPG Studies in Geology, 48, and SEG Geophysical References Series, 11, 327-344.
5. Vesecky, I.F. & Stewart, R.H. (1982). The observation of ocean surface phenomena using imagеry from the Seasat SAR: An assessment, J. Geophys. Res., 87, 3397-3430.
6. MacDonald, I.R., Guinasso, N.L. Jr., Ackleson, S.G., Amos, J.F., Duckworth, R., Sassen, R. & Brooks, J.M. (1993). Natural oil slicks in the Gulf of Mexico visible from space, J. Geophys. Res., 98, 16351-16364.
7. Scantland, S. & Biegert, E.K. (1996). Radar locates offshore oil slicks, Earth Obser. Mag., 5, 30-32.
8. Karlin, L.N. (Ed.) (1999). Atlas of annotated synthetic aperture radar images acquired by the Almaz-1 satellite. GEOS, Moscow, Russia.
9. de Miranda, F.P., Marmol, A.M.Q., Pedroso, E.C., Beisl, C.H., Welgan, P. & Morales, L.M. (2004). Analysis of Radarsat-1 data for offshore monitoring activities in the Cantarell Complex, Gulf of Mexico, using the unsupervised semivariogram textural classifier (USTC), Can. J. Rem. Sens., 30, 424-436.
10. Offshore Basin Screening Methodology (2003). at: www.npagroup.com/oilandmineral/offshore/obs.
11. Ivanov, A.Yu., Fang, M., He, M.-X. & Ermoshkin, I.S. (2004). An experience of using Radarsat, ERS-1/2 and Envisat SAR images for oil spill mapping in the waters of the Caspian Sea, Yellow Sea and East China Sea. In Envisat & ERS Symposium. ESA SP-572 (CD-ROM).
12. Ivanov A.Yu., Golubov, B.N. & Zatyagalova, V.V. (2007). On oil-gas bearing and unloading of underground fluids in the southern part of Caspian Sea based on synthetic aperture radar images, Issledovanie Zemli iz Kosmosa, 2, 62-81 (in Russian).
13. Nesterova, M.P. (Ed.) (1989). Problems of Chemical Pollution of the World Ocean, v. 8. Leningrad: Gidrometeoizdat, Russia.
14. Bonn Agreement Counter Pollution Manual (1999), at: www.bonnagreement.org/eng.html/counter-pollution_manual.
15. Aliyev, Ad.A. (2006). Mud volcanism of the South Caspian oil-bearing basin, Geology and Mineral Resources of World Ocean, 3, 35-51 (in Russian).
16. Caspian Environment Program (2003), at: www.caspianenvironment.org/pollution/load.htm.
17. Oil in the Sea: Inputs, Fates, and Effects (1985). National Academy Press, Washington, US.