Application of artificial intelligence in chronic liver ...
16
Decharatanachart et al. BMC Gastroenterol (2021) 21:10 https://doi.org/10.1186/s12876-020-01585-5 RESEARCH ARTICLE Application of artificial intelligence in chronic liver diseases: a systematic review and meta-analysis Pakanat Decharatanachart 1 , Roongruedee Chaiteerakij 2,3* , Thodsawit Tiyarattanachai 4 and Sombat Treeprasertsuk 2 Abstract Background: The gold standard for the diagnosis of liver fibrosis and nonalcoholic fatty liver disease (NAFLD) is liver biopsy. Various noninvasive modalities, e.g., ultrasonography, elastography and clinical predictive scores, have been used as alternatives to liver biopsy, with limited performance. Recently, artificial intelligence (AI) models have been developed and integrated into noninvasive diagnostic tools to improve their performance. Methods: We systematically searched for studies on AI-assisted diagnosis of liver fibrosis and NAFLD on MED- LINE, Scopus, Web of Science and Google Scholar. The pooled sensitivity, specificity, positive predictive value (PPV), negative predictive value (NPV) and diagnostic odds ratio (DOR) with their 95% confidence intervals (95% CIs) were calculated using a random effects model. A summary receiver operating characteristic curve and the area under the curve was generated to determine the diagnostic accuracy of the AI-assisted system. Subgroup analyses by diagnos- tic modalities, population and AI classifiers were performed. Results: We included 19 studies reporting the performances of AI-assisted ultrasonography, elastrography, com- puted tomography, magnetic resonance imaging and clinical parameters for the diagnosis of liver fibrosis and steatosis. For the diagnosis of liver fibrosis, the pooled sensitivity, specificity, PPV, NPV and DOR were 0.78 (0.71–0.85), 0.89 (0.81–0.94), 0.72 (0.58–0.83), 0.92 (0.88–0.94) and 31.58 (11.84–84.25), respectively, for cirrhosis; 0.86 (0.80–0.90), 0.87 (0.80–0.92), 0.85 (0.75–0.91), 0.88 (0.82–0.92) and 37.79 (16.01–89.19), respectively; for advanced fibrosis; and 0.86 (0.78–0.92), 0.81 (0.77–0.84), 0.88 (0.80–0.93), 0.77 (0.58–0.89) and 26.79 (14.47–49.62), respectively, for signifi- cant fibrosis. Subgroup analyses showed significant differences in performance for the diagnosis of fibrosis among different modalities. The pooled sensitivity, specificity, PPV, NPV and DOR were 0.97 (0.76–1.00), 0.91 (0.78–0.97), 0.95 (0.87–0.98), 0.93 (0.80–0.98) and 191.52 (38.82–944.81), respectively, for the diagnosis of liver steatosis. Conclusions: AI-assisted systems have promising potential for the diagnosis of liver fibrosis and NAFLD. Validations of their performances are warranted before implementing these AI-assisted systems in clinical practice. Trial registration: The protocol was registered with PROSPERO (CRD42020183295). © The Author(s) 2021. Open Access This article is licensed under a Creative Commons Attribution 4.0 International License, which permits use, sharing, adaptation, distribution and reproduction in any medium or format, as long as you give appropriate credit to the original author(s) and the source, provide a link to the Creative Commons licence, and indicate if changes were made. The images or other third party material in this article are included in the article’s Creative Commons licence, unless indicated otherwise in a credit line to the material. If material is not included in the article’s Creative Commons licence and your intended use is not permitted by statutory regulation or exceeds the permitted use, you will need to obtain permission directly from the copyright holder. To view a copy of this licence, visit http://creativecommons.org/licenses/by/4.0/. The Creative Commons Public Domain Dedication waiver (http://creativeco mmons.org/publicdomain/zero/1.0/) applies to the data made available in this article, unless otherwise stated in a credit line to the data. Open Access *Correspondence: [email protected]; [email protected] 2 Division of Gastroenterology, Department of Medicine, Faculty of Medicine, Chulalongkorn University and King Chulalongkorn Memorial Hospital, Thai Red Cross Society, 1873 Rama IV Rd., Pathum Wan, Bangkok 10330, Thailand Full list of author information is available at the end of the article
Transcript of Application of artificial intelligence in chronic liver ...

Decharatanachart et al. BMC Gastroenterol (2021) 21:10 https://doi.org/10.1186/s12876-020-01585-5
RESEARCH ARTICLE
Application of artificial intelligence in chronic liver diseases: a systematic review and meta-analysisPakanat Decharatanachart1, Roongruedee Chaiteerakij2,3* , Thodsawit Tiyarattanachai4 and Sombat Treeprasertsuk2
Abstract
Background: The gold standard for the diagnosis of liver fibrosis and nonalcoholic fatty liver disease (NAFLD) is liver biopsy. Various noninvasive modalities, e.g., ultrasonography, elastography and clinical predictive scores, have been used as alternatives to liver biopsy, with limited performance. Recently, artificial intelligence (AI) models have been developed and integrated into noninvasive diagnostic tools to improve their performance.
Methods: We systematically searched for studies on AI-assisted diagnosis of liver fibrosis and NAFLD on MED-LINE, Scopus, Web of Science and Google Scholar. The pooled sensitivity, specificity, positive predictive value (PPV), negative predictive value (NPV) and diagnostic odds ratio (DOR) with their 95% confidence intervals (95% CIs) were calculated using a random effects model. A summary receiver operating characteristic curve and the area under the curve was generated to determine the diagnostic accuracy of the AI-assisted system. Subgroup analyses by diagnos-tic modalities, population and AI classifiers were performed.
Results: We included 19 studies reporting the performances of AI-assisted ultrasonography, elastrography, com-puted tomography, magnetic resonance imaging and clinical parameters for the diagnosis of liver fibrosis and steatosis. For the diagnosis of liver fibrosis, the pooled sensitivity, specificity, PPV, NPV and DOR were 0.78 (0.71–0.85), 0.89 (0.81–0.94), 0.72 (0.58–0.83), 0.92 (0.88–0.94) and 31.58 (11.84–84.25), respectively, for cirrhosis; 0.86 (0.80–0.90), 0.87 (0.80–0.92), 0.85 (0.75–0.91), 0.88 (0.82–0.92) and 37.79 (16.01–89.19), respectively; for advanced fibrosis; and 0.86 (0.78–0.92), 0.81 (0.77–0.84), 0.88 (0.80–0.93), 0.77 (0.58–0.89) and 26.79 (14.47–49.62), respectively, for signifi-cant fibrosis. Subgroup analyses showed significant differences in performance for the diagnosis of fibrosis among different modalities. The pooled sensitivity, specificity, PPV, NPV and DOR were 0.97 (0.76–1.00), 0.91 (0.78–0.97), 0.95 (0.87–0.98), 0.93 (0.80–0.98) and 191.52 (38.82–944.81), respectively, for the diagnosis of liver steatosis.
Conclusions: AI-assisted systems have promising potential for the diagnosis of liver fibrosis and NAFLD. Validations of their performances are warranted before implementing these AI-assisted systems in clinical practice.
Trial registration: The protocol was registered with PROSPERO (CRD42020183295).
© The Author(s) 2021. Open Access This article is licensed under a Creative Commons Attribution 4.0 International License, which permits use, sharing, adaptation, distribution and reproduction in any medium or format, as long as you give appropriate credit to the original author(s) and the source, provide a link to the Creative Commons licence, and indicate if changes were made. The images or other third party material in this article are included in the article’s Creative Commons licence, unless indicated otherwise in a credit line to the material. If material is not included in the article’s Creative Commons licence and your intended use is not permitted by statutory regulation or exceeds the permitted use, you will need to obtain permission directly from the copyright holder. To view a copy of this licence, visit http://creat iveco mmons .org/licen ses/by/4.0/. The Creative Commons Public Domain Dedication waiver (http://creat iveco mmons .org/publi cdoma in/zero/1.0/) applies to the data made available in this article, unless otherwise stated in a credit line to the data.
Open Access
*Correspondence: [email protected]; [email protected] Division of Gastroenterology, Department of Medicine, Faculty of Medicine, Chulalongkorn University and King Chulalongkorn Memorial Hospital, Thai Red Cross Society, 1873 Rama IV Rd., Pathum Wan, Bangkok 10330, ThailandFull list of author information is available at the end of the article

Page 2 of 16Decharatanachart et al. BMC Gastroenterol (2021) 21:10
BackgroundChronic liver diseases and cirrhosis are the 11th lead-ing cause of death in the world, accounting for 1.1 million deaths annually [1]. The global prevalence of cirrhosis has been substantially rising from 71 mil-lion in 1990 to over 122 million in 2017 [2]. Common causes of cirrhosis are chronic hepatitis B virus (HBV) and hepatitis C virus (HCV) infections, alcohol-related liver disease and nonalcoholic steatohepatitis (NASH) [2]. Over the past decade, there has been a temporal shift in the prevalence of causes of cirrhosis, i.e., the prevalence of NASH has been dramatically increasing, whereas the prevalence of other causes has been slowly decreasing [3]. The estimated worldwide prevalence of nonalcoholic fatty liver disease (NAFLD) is 25% [4] and is projected to be to 33.5% by 2030, emphasizing the importance of both cirrhosis and NAFLD [5].
The spectrum of liver fibrosis ranges from minimal fibrosis to full-blown cirrhosis [6]. Patients with early cirrhosis are mostly asymptomatic because the liver is able to compensate. However, without a prompt diag-nosis and proper treatments, it can quickly deteriorate to decompensated cirrhosis, which eventually leads to complications and mortality. Patients with decompen-sated cirrhosis have an approximately tenfold higher risk of death than general populations [7]. Therefore, the detection and treatment of early-stage fibrosis and NASH can slow disease progression, reduce the risk of liver cancer and decrease mortality.
The gold standard for the diagnosis and staging of liver fibrosis and NAFLD is liver biopsy. However, liver biopsy is an invasive procedure that can lead to com-plications such as hemorrhage, biliary peritonitis and pneumothorax [8]. Another drawback of liver biopsy is a high rate of sampling error with interobserver and intraobserver variation in histologic evaluations [6, 9]. Additionally, liver biopsy is not always feasible as a fol-low-up method for liver diseases. Accordingly, serum markers and imaging modalities have been developed as alternative noninvasive diagnostic methods for liver fibrosis, but they have limited performance, particu-larly for early-stage fibrosis [8, 10]. For example, the sensitivity and specificity of the aspartate aminotrans-ferase-to-platelet ratio index (APRI) are 69% and 77%, respectively, and those of the Fibrosis-4 (FIB-4) score are 69% and 78%, respectively, for the detection of advanced fibrosis [11]. Various imaging modalities, e.g., magnetic resonance elastography (MRE), have also
been used for the diagnosis and classification of liver fibrosis with relatively reliable accuracy [12]. However, the availability of these modalities is limited. The per-formance of most of these tests needs to be improved.
Since the twenty-first century, there have been signifi-cant advancements in artificial intelligence (AI) technol-ogy, resulting in applications of AI in several aspects of medicine, particularly in aiding diagnosis. In gastroenter-ology, AI-assisted systems have been studied in various diseases such as the endoscopic detection and classifica-tion of colorectal cancer [13, 14]. Regarding the applica-tion of AI in liver diseases, machine learning algorithms has been developed to predict risk and outcomes of dis-eases using multiple clinical parameters, e.g. assessment of liver fibrosis and steatosis, predicting liver decompen-sation in primary sclerosing cholangitis, screening and selection of liver transplant recipients as well as predict-ing post-transplant survival and complications [15].
There have been some previous systematic reviews on AI in gastroenterology and liver disease [15, 16], however, very few meta-analyses have been conducted to evaluate the performance of the AI-assisted systems. In this sys-tematic review and meta-analysis, we focused mainly on liver parenchymal diseases, i.e., liver fibrosis and stea-tosis. The main objective of this study was to assess the performance of AI-integrated noninvasive tests for the diagnosis and staging of liver fibrosis and steatosis.
MethodsThe study was conducted based on the Preferred Report-ing Items for Systematic Review and Meta-Analysis (PRISMA) checklist.
Search strategyWe searched for studies on AI in liver fibrosis and stea-tosis. A literature search was conducted on MEDLINE, Scopus, Web of Science and Google Scholar databases. The search was conducted from the year 2000 through January 2020. We opted to exclude studies published before 2000 because most of these studies utilized obso-lete computer-assisted algorithms that are currently no longer used in the modern AI era. Keywords for the search were as follows: “artificial intelligence”, “computer-assisted”, “computer-aided”, “neural network”, “machine learning”, “deep learning”, “liver”, “hepatic”, “parenchyma”, “parenchymal”, “fibrosis”, “cirrhosis”, “steatosis”, “fatty”, “NASH”, and “NAFLD”.
Keywords: Artificial intelligence, Computer-assisted, Machine learning, Deep learning, Liver fibrosis, Cirrhosis, Liver steatosis, Fatty liver, NAFLD, Non-invasive diagnostic tests

Page 3 of 16Decharatanachart et al. BMC Gastroenterol (2021) 21:10
Inclusion and exclusion criteriaWe included all articles focusing on the utilization of AI in the diagnosis and/or staging of liver fibrosis and steatosis. The inclusion criteria were as follows: par-ticipants included in the study underwent liver biopsy as the gold standard for the diagnosis of liver fibrosis and steatosis. The reported results were sufficient for generating 2 × 2 tables, and the articles were in English. The exclusion criteria were as follows: articles that did not report our desired outcomes of sensitivity, speci-ficity, positive predictive value (PPV), negative predic-tive value (NPV); studies that did not provide sufficient information to calculate true positive (TP), false posi-tive (FP), true negative (TN) and false negative (FN) values; articles that did not clearly report training and test datasets or did not contain information on valida-tion methods; and conference proceedings or abstracts with incomplete information on population, AI meth-ods, and validation methods.
Data extraction and quality assessmentTwo authors (PD and TT) independently performed data extraction and quality assessment. Any disagree-ments were discussed with the third author (RC). Data extracted included the author, publication year, coun-try where the study was conducted, study design, liver diseases/conditions, diagnostic modalities, number of participants, type of AI models, number of samples in the development and validation cohorts, valida-tion method (e.g., k-fold cross validation, independent cohort), sensitivity, specificity, and crude number of TP, FP, TN and FN values. For the studies that developed multiple AI models, we included the AI model that had the best overall performance in the main analysis. Our criterion for the best overall performance was to cal-culate the mean between the sensitivity and specificity, i.e., (sensitivity + specificity)/2 [17]. This criterion was used because we equally emphasized the sensitivity and specificity. In the diagnosis of liver fibrosis, especially cirrhosis, we would like a diagnostic test to be sensi-tive in order to early detect liver fibrosis. However, we would also like to avoid incorrectly diagnosing patients as having liver fibrosis when they actually do not have the condition. Therefore, we opted for methods with a balanced false negative (sensitivity) and false positive (specificity) [17]. Moreover, sensitivity and specificity do not depend on prevalence or incidence in validation cohorts. We also extracted performance of AIs with the best sensitivity and specificity in studies with multiple AIs models in order to further perform sensitivity-focused and specificity-focused analysis.
Quality assessmentThe methodological quality of the included studies was evaluated using the Quality Assessment of Diag-nostic Accuracy Studies (QUADAS-2) tool [18]. The QUADAS-2 tool comprises 12 questions regarding 4 domains including patient selection, index test, refer-ence standard, and flow and timing. Some questions were slightly modified to specifically assess studies on AI. For example, in clinical studies on diagnostic tests, prespecified thresholds of the index test should be set prior to data collection and analysis to prevent post-hoc data analysis for the desired results. For AI research, we assessed this issue by identifying whether the developed AI model was validated in another set of cohorts apart from the training cohorts, e.g., test set, or external validation cohorts. Details of the modi-fied QUADAS-2 tool are provided in the Supplemental methods.
Statistical analysisAfter data extraction, the TP, FP, TN and FN values, if not available, were calculated using Review Manager version 5.3.5 [19]. All statistical analyses were performed using R software, version 3.6.3, Vienna, Austria [20]. The pooled sensitivity, specificity, positive predictive value (PPV), negative predictive value (NPV) and diagnostic odds ratio (DOR) with 95% confidence intervals (95% CIs) were calculated from the crude number of TP, FP, TN and FN values of each study using a random effects model. The summary receiver operating characteristics (SROC) curve was generated, and the area under the curve (AUC) was calculated to determine the diagnostic accuracy of the AI-assisted system. AUC values of 0.5–0.7, 0.7–0.9, and 0.9–1 indicate low, moderate and high accuracy, respectively [21]. Heterogeneity was assessed using I2 and Cochran’s Q statistics. To determine the source of hetero-geneity, subgroup analyses and regression analysis based on diagnostic modalities, population and AI classifiers were performed. Publication bias was assessed with the Deeks funnel plot. P values of < 0.05 were considered sta-tistically significant.
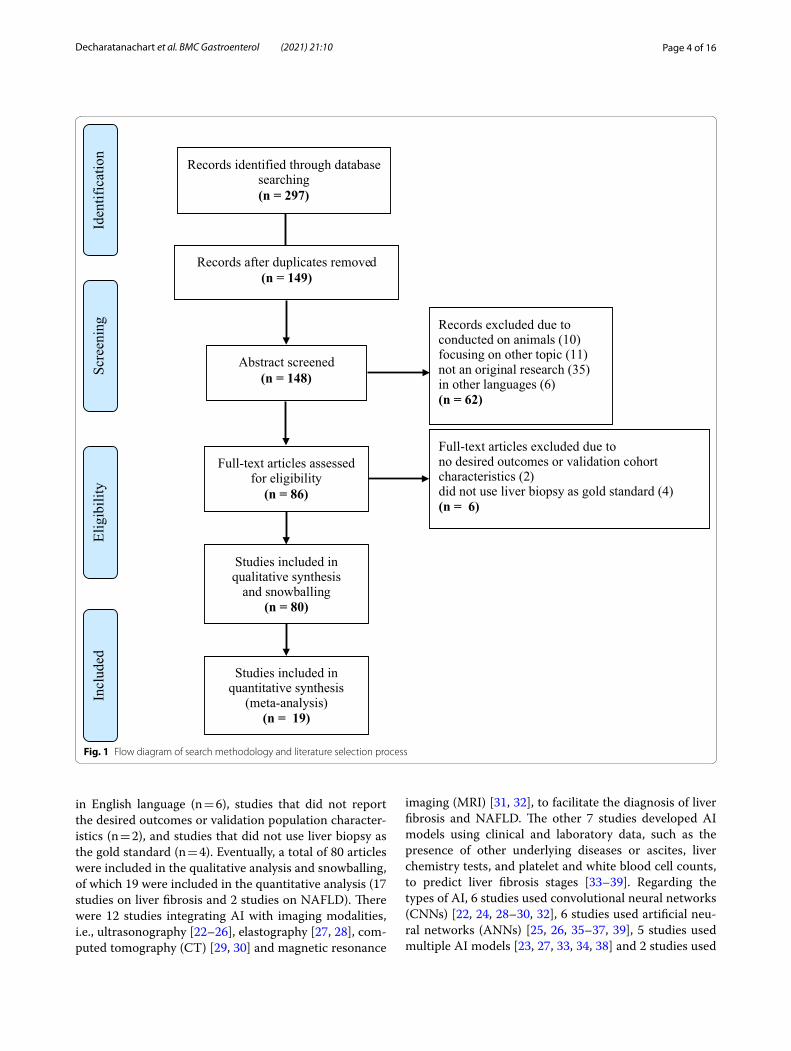
ResultsLiterature searchThe search results and process of selecting articles are shown in Fig. 1. After the literature search, a total of 297 articles were identified. Articles were excluded for the following reasons: studies that were duplicated (n = 149), studies that were conducted in animals (n = 10), studies focusing on diseases other than liver parenchymal dis-eases (n = 11), studies that were not original research, i.e., reviews, editorials (n = 35), studies that were not written
Page 4 of 16Decharatanachart et al. BMC Gastroenterol (2021) 21:10
in English language (n = 6), studies that did not report the desired outcomes or validation population character-istics (n = 2), and studies that did not use liver biopsy as the gold standard (n = 4). Eventually, a total of 80 articles were included in the qualitative analysis and snowballing, of which 19 were included in the quantitative analysis (17 studies on liver fibrosis and 2 studies on NAFLD). There were 12 studies integrating AI with imaging modalities, i.e., ultrasonography [22–26], elastography [27, 28], com-puted tomography (CT) [29, 30] and magnetic resonance
imaging (MRI) [31, 32], to facilitate the diagnosis of liver fibrosis and NAFLD. The other 7 studies developed AI models using clinical and laboratory data, such as the presence of other underlying diseases or ascites, liver chemistry tests, and platelet and white blood cell counts, to predict liver fibrosis stages [33–39]. Regarding the types of AI, 6 studies used convolutional neural networks (CNNs) [22, 24, 28–30, 32], 6 studies used artificial neu-ral networks (ANNs) [25, 26, 35–37, 39], 5 studies used multiple AI models [23, 27, 33, 34, 38] and 2 studies used
Records identified through database searching(n = 297)
Records after duplicates removed(n = 149)
Abstract screened(n = 148)
Records excluded due to conducted on animals (10) focusing on other topic (11) not an original research (35) in other languages (6) (n = 62)
Full-text articles assessed for eligibility
(n = 86)
Full-text articles excluded due to no desired outcomes or validation cohort characteristics (2) did not use liver biopsy as gold standard (4) (n = 6)
Studies included in qualitative synthesis
and snowballing (n = 80)
Studies included in quantitative synthesis
(meta-analysis)(n = 19)
Scre
enin
gIn
clud
edEl
igib
ility
Iden
tific
atio
n
Fig. 1 Flow diagram of search methodology and literature selection process
Page 5 of 16Decharatanachart et al. BMC Gastroenterol (2021) 21:10
Tabl
e 1
Char
acte
rist
ics
of in
clud
ed s
tudi
es
Stud
y/ye
arCo
untr
ySt
udy
coho
rtPo
pula
tion
AI
clas
sifie
rA
I m
odal
ity
Dev
elop
men
t coh
ort
Valid
atio
n co
hort
Valid
atio
n m
etho
dsSt
age
Sens
itivi
tySp
ecifi
city
TPFP
TNFN
Zhan
g,
2012
[2
5]
Chi
naPr
ospe
c-tiv
eC
hron
ic
hepa
titis
B,
C
AN
NU
SGF1
/F2/
F3/F
440
/22/
55/6
2F1
/F2/
F3/F
413
/8/1
9/20
Inde
pend
-en
t tes
t se
t
F40.
950.
8519
634
1
Che
n,
2017
[2
7]
Chi
naPr
ospe
c-tiv
eC
hron
ic
hepa
titis
BN
Ba , RFa ,
KNN
, SV
M
Elas
togr
a-ph
yS0
/S1/
S2/S
3/S4
119/
164/
88/7
2/70
N/A
k-fo
ld c
ross
va
lida-
tion
F40.
6866
0.88
5448
5139
222
≥ F
30.
7866
0.87
3811
247
324
30
≥ F
20.
7471
0.86
2117
239
244
58
≥ F
10.
7967
0.82
5031
421
9880
Cho
i, 20
18
[29]
Kore
aRe
tros
pec-
tive
Gen
eral
po
pula
-tio
n
CN
NC
TF0
/F1/
F2/F
3/F4
3357
/113
/284
/460
/324
7F0
/F1/
F2/F
3/F4
118/
109/
161/
173/
330
Inde
pend
-en
t tes
t se
t
F40.
846
0.96
627
919
242
51
≥ F
30.
946
0.95
447
618
370
27
≥ F
20.
955
0.89
963
423
204
30
Yasa
ka,
2018
[3
0]
Japa
nRe
tros
pec-
tive
Gen
eral
po
pula
-tio
n
CN
NC
TF0
/F1/
F2/F
3/F4
113/
36/5
6/66
/125
F0/F
1/F2
/F3/
F429
/9/1
4/16
/32
Inde
pend
-en
t tes
t se
t
F40.
750.
5724
2939
8
≥ F
30.
750.
6536
1834
12
≥ F
20.
760.
6847
1226
15
Yasa
ka,
2018
[3
2]
Japa
nRe
tros
pec-
tive
Gen
eral
po
pula
-tio
n
CN
NM
RIF0
/F1/
F2/F
3/F4
54/5
3/81
/113
/233
F0/F
1/F2
/F3/
F410
/10/
15/2
0/45
Inde
pend
-en
t tes
t se
t
F40.
760.
7634
1342
11
≥ F
30.
780.
7451
926
14
≥ F
20.
840.
6576
37
14
Li, 2
019
[23]
Chi
naPr
ospe
c-tiv
eC
hron
ic
hepa
titis
BA
dabo
osta ,
DT,
LR,
A
NN
, RF,
SVM
USG
F0/F
1/F2
/F3/
F415
/33/
38/2
3/35
N/A
Tenf
old
cros
s va
li-da
tion
≥ F
20.
875
0.76
984
1137
12
Wan
g,
2019
[2
8]
Chi
naPr
ospe
c-tiv
eC
hron
ic
hepa
titis
BC
NN
Elas
togr
a-ph
yF0
-1/F
2/F3
/F4
43/7
2/85
/66
F0-1
/F2/
F3/F
422
/37/
41/3
2In
depe
nd-
ent t
est
set
F40.
969
0.88
3112
881
≥ F
30.
904
0.98
366
158
7
≥ F
20.
691
0.90
976
220
34
Ahm
ed,
2020
[3
1]
Egyp
tPr
ospe
c-tiv
eC
hron
ic
hepa
titis
CSV
MM
RI22
fibr
otic
pat
ient
s15
hea
lthy
patie
nts
N/A
Leav
e on
e ou
t cro
ss
valid
a-tio
n
≥ F
10.
818
0.86
618
213
4
Lee,
202
0 [2
2]Ko
rea
Retr
ospe
c-tiv
eC
hron
ic li
ver
dise
ase,
he
patit
is
B, C
CN
NU
SGF0
/F1/
F23/
F436
3/39
4/16
52/1
566
F0/F
1/F2
3/F4
290/
17/7
2/19
3In
depe
nd-
ent t
est
set
F40.
778
0.93
715
024
355
43
≥ F
20.
913
0.82
424
254
253
23
Scha
wka
t, 20
20
[40]
Switz
er-
land
Pros
pec-
tive
Gen
eral
po
pula
-tio
n
SVM
MRI
F0/F
1/F2
/F3/
F45/
7/13
/8/8
F0/F
1/F2
/F3/
F43/
5/5/
5/3
Inde
pend
-en
t tes
t se
t
≥ F
30.
750
0.92
36
112
2
Pisc
aglia
, 20
06
[37]
Spai
nRe
tros
pec-
tive
Chr
onic
he
patit
is C
AN
NC
linic
al
data
F0/F
1/F3
/F4
216/
176/
87/3
1F3
/tot
al23
/96
Inde
pend
-en
t tes
t se
t
≥ F
30.
783
0.89
018
865
5

Page 6 of 16Decharatanachart et al. BMC Gastroenterol (2021) 21:10
Tabl
e 1
(con
tinu
ed)
Stud
y/ye
arCo
untr
ySt
udy
coho
rtPo
pula
tion
AI
clas
sifie
rA
I m
odal
ity
Dev
elop
men
t coh
ort
Valid
atio
n co
hort
Valid
atio
n m
etho
dsSt
age
Sens
itivi
tySp
ecifi
city
TPFP
TNFN
Wan
g,
2010
[3
6]
Chi
naRe
tros
pec-
tive
Chr
onic
he
patit
is C
AN
NC
linic
al
data
F0-1
/F2-
416
6/60
F0-1
/F2-
480
/36
Inde
pend
-en
t tes
t se
t
≥ F
20.
917
0.80
033
1664
3
Raou
fy,
2011
[3
9]
Iran
Pros
pec-
tive
Chr
onic
he
patit
is B
AN
NC
linic
al
data
Cirr
hotic
/non
-cirr
hotic
11/7
5C
irrho
tic/n
on-c
irrho
tic8/
50In
depe
nd-
ent t
est
set
F40.
875
0.92
07
446
1
Pour
nik,
20
14
[35]
Iran
Retr
ospe
c-tiv
eN
AFL
D
patie
nts
AN
NC
linic
al
data
Cirr
hotic
/non
-cirr
hotic
52/2
48C
irrho
tic/n
on-c
irrho
tic15
/65
Inde
pend
-en
t tes
t se
t
F40.
660.
9944
430
923
Shou
sha,
20
18
[34]
Egyp
tRe
tros
pec-
tive
Chr
onic
he
patit
is C
AN
Na , D
TC
linic
al
data
F0-2
/F3-
420
4/22
3N
/Ak-
fold
cro
ss
valid
a-tio
n
≥ F
30.
825
0.81
118
439
165
39
Wei
, 201
8 [3
3]U
SARe
tros
pec-
tive
Chr
onic
he
patit
is
B, C
DT,
RF,
GBa
Clin
ical
da
taS0
/S1/
S2/S
3/S4
46/1
69/1
34/5
6/85
S0/S
1/S2
/S3/
S415
/21/
12/1
1/27
Inde
pend
-en
t tes
t se
t
S40.
780.
8521
950
6
≥ S
30.
840.
8532
741
6
Li, 2
019
[38]
Chi
naRe
tros
pec-
tive
Chr
onic
he
patit
is B
DTa , R
Fa , LR
, SVM
Clin
ical
da
ta46
0 pa
tient
s46
0 pa
tient
sIn
depe
nd-
ent t
est
set
F40.
596
0.70
556
108
258
38
≥ F
30.
939
0.80
317
654
219
11
≥ F
20.
970
0.76
331
931
100
10
Kupp
ili,
2017
[2
6]
Port
ugal
Pros
pec-
tive
Mix
ed
popu
la-
tion
ELM
USG
NA
FLD
/non
-NA
FLD
36/2
7 pa
tient
sN
/AK-
fold
cro
ss
valid
a-tio
n
0.91
30.
921
332
253
Byra
, 201
8 [2
4]Po
land
Pros
pec-
tive
Obe
se
popu
la-
tion
CN
NU
SGN
AFL
D/n
on-N
AFL
D38
/17
patie
nts
N/A
Leav
e on
e ou
t cro
ss
valid
a-tio
n
1.00
00.
882
382
150
ANN
art
ifici
al n
eura
l net
wor
ks, C
NN
con
volu
tiona
l neu
ral n
etw
orks
, NB
Naï
ve B
ayes
, RF
rand
om fo
rest
, KN
N k
-nea
rest
nei
ghbo
r, SV
M s
uppo
rt v
ecto
r mac
hine
, MLP
mul
tilay
er p
erce
ptio
n, D
T de
cisi
on tr
ee, G
B gr
adie
nt
boos
ting,
LR
logi
stic
regr
essi
on, E
LM e
xtre
me
lear
ning
mac
hine
, F4
diag
nosi
s of
cirr
hosi
s, ≥
F3 d
iagn
osis
of a
dvan
ced
fibro
sis
(F3–
F4), ≥
F2 d
iagn
osis
of s
igni
fican
t fibr
osis
(F2–
F4)
a Sel
ecte
d A
Is in
the
anal
ysis
Page 7 of 16Decharatanachart et al. BMC Gastroenterol (2021) 21:10
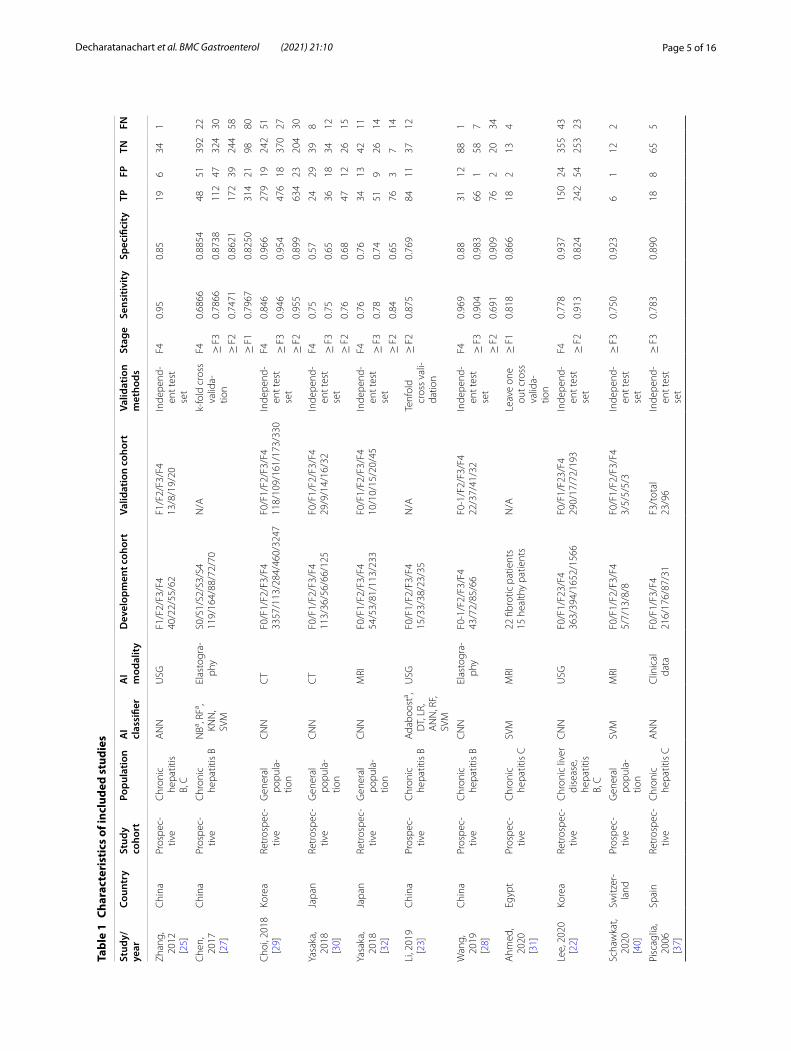
a support vector machine (SVM) [31, 40]. The study characteristics, sensitivity, specificity, prevalence, valida-tion methods and other extracted data from the included studies are shown in Table 1. The methodological assess-ment by QUADAS-2 is summarized in Additional file 1: Table S1.
Overall performance of AI in the diagnosis of liver cirrhosisFirst, we focused on the performance of AI in diagnos-ing liver cirrhosis (METAVIR F4). A total of 11 studies were included in this analysis [22, 25, 27–30, 32, 33, 35, 38, 39]. Five studies developed AI models using CNNs [22, 28–30, 32], 3 used ANNs [25, 35, 39], and the other 3 studies developed multiple AI models [27, 33, 38]. Dif-ferent imaging modalities were also employed as inputs for the AI systems: ultrasound was used in 2 studies [22, 25], elastography in 2 studies [27, 28], CT in 2 studies [29, 30], and MRI in 1 study [32]; 4 studies used multiple clinical and laboratory parameters as AI inputs [33, 35, 38, 39]. The results of the meta-analysis showed that AI-assisted systems were able to diagnose cirrhosis with a pooled sensitivity, specificity, PPV, and NPV of 0.78 (95% CI: 0.71–0.85), 0.89 (95% CI: 0.81–0.94), 0.72 (95% CI: 0.58–0.83) and 0.92 (95% CI: 0.88–0.94), respectively. The pooled DOR was 31.58 (95% CI: 11.84–84.25) (Fig. 2). For the sensitivity-focused analysis of the 11 studies, there was no change in the pooled sensitivity. On the other hand, the pooled specificity increased to 0.94 (95% CI: 0.86–0.97) in the specificity-focused analysis (Additional file 1: Table S2).
Overall performance of AI in the diagnosis of advanced fibrosis (METAVIR ≥ F3) and significant fibrosis (METAVIR ≥ F2)We identified 10 studies using AI models to diagnose advance fibrosis (≥ F3) [27–30, 32–34, 37, 38, 40]. Four studies developed CNNs [28–30, 32], 1 study developed an ANN [37], 1 study utilized SVM [40], and the other 4 studies developed multiple AI models [27, 33, 34, 38]. The AI models were integrated into elastrography in 2 studies [27, 28], CT images in 2 studies [29, 30], MRI images in 2 study [32, 40] and clinical and laboratory parameters in the other 4 studies [33, 34, 37, 38]. After combining all studies, AI-assisted analysis systems had a pooled sen-sitivity, specificity, PPV and NPV of 0.86 (95% CI 0.80–0.90), 0.87 (95% CI 0.80–0.92), 0.85 (95% CI 0.75–0.91), and 0.88 (95% CI 0.82–0.92), respectively, and a DOR of 37.79 (95% CI 16.01–89.19) for the diagnosis of advanced fibrosis. Sensitivity and specificity-focused analysis found similar pooled sensitivity but increased pooled specificity to 0.89 (95% CI 0.81–0.93). (Additional file 1: Table S2).
There were 8 studies investigating the performance of AI-assisted systems for the diagnosis of significant
fibrosis (≥ F2) [22, 23, 27, 28, 30, 32, 36, 38]. Four stud-ies used CNNs as AI models [23, 28, 29, 31], 1 study uti-lized an ANN [36], and the other 3 studies used multiple AI models [23, 27, 38]. In this group, the AI models were integrated into ultrasonography in 2 studies [22, 23], elas-tography in 2 studies [27, 28], CT in 1 study [30], MRI in 1 study [32], and clinical and laboratory parameters in 2 studies [36, 38]. We found that the pooled sensitivity, specificity, PPV and NPV were 0.86 (95% CI 0.78–0.92), 0.81 (95% CI 0.77–0.84), 0.88 (95% CI 0.80–0.93) and 0.77 (95% CI 0.58–0.89), respectively, and the DOR was 26.79 (95% CI 14.47–49.62). In the sensitivity-focused analysis, the pooled sensitivity increased to 0.91 (95% CI 0.76–0.97) while the specificity remained the same in specificity-focused analysis. (Additional file 1: Table S2).
Subgroup analysis by diagnostic modalityWe observed substantial heterogeneity in the overall performance of AI-assisted diagnosis system, e.g., I2 was 79%, 95%, 93%, 82% and 93% for the pooled sensi-tivity, specificity, PPV, NPV and DOR, respectively, for the diagnosis of liver cirrhosis. We conducted additional subgroup analyses by diagnostic modality for each stage of fibrosis (Table 2). As expected, there were statistically significant differences in the pooled sensitivity, speci-ficity, PPV, NPV and DOR among different diagnostic modalities. In most subgroups, the I2 values were mark-edly decreased.
For the diagnosis of cirrhosis, the pooled sensitivity, specificity, PPV, NPV and DOR of different diagnostic modalities were significantly different. The sensitivities were 0.79 (95% CI 0.73–0.84), 0.87 (95% CI 0.50–0.98), 0.84 (95% CI 0.80–0.87), and 0.65 (95% CI 0.58–0.72), and the specificities were 0.93 (95% CI 0.90–0.95), 0.88 (95% CI 0.85–0.91), 0.86 (95% CI 0.43–0.98) and 0.91 (95% CI 0.74–0.97), for ultrasonography, elastrography, CT, and clinical and laboratory parameters, respectively (p < 0.01 both). Significant differences in the PPV, NPV and DOR among AI-assisted systems for the diagnosis of cirrhosis were also found (p = 0.01, < 0.01 and 0.04, respectively) (Table 2). In the subgroup analyses, the het-erogeneity of most diagnostic subgroups of cirrhosis was markedly reduced. For example, I2 of the ultrasonography subgroup was 0% for the pooled sensitivity, specificity, PPV, NPV and DOR. Similarly, I2 was 0% for the pooled specificity and NPV of the elastrography subgroup, 0% for the pooled sensitivity and NPV of the CT subgroup and 0% for the pooled sensitivity of the clinical param-eters subgroup (Table 2, Fig. 2).
For advanced liver fibrosis (≥ F3), we observed a smaller magnitude of differences in diagnostic perfor-mance among diagnostic subgroups, with a smaller reduction in I2 values after subgroup analyses than the

Page 8 of 16Decharatanachart et al. BMC Gastroenterol (2021) 21:10
Fig. 2 Sensitivity (a), specificity (b), positive predictive value (c), negative predictive value (d) and diagnostic odds ratio (e) of AI-assisted diagnosis of liver cirrhosis (F4) with subgroup analysis according to diagnostic modality (ultrasonography, elastography, computed tomography and clinical data)

Page 9 of 16Decharatanachart et al. BMC Gastroenterol (2021) 21:10
Tabl
e 2
Sens
itiv
ity,
spe
cific
ity,
pos
itiv
e pr
edic
tive
val
ue,
nega
tive
pre
dict
ive
valu
e an
d di
agno
stic
odd
s ra
tio
of A
I-ass
iste
d di
agno
sis
of s
igni
fican
t liv
er
fibro
sis
(F2–
4), a
dvan
ced
fibro
sis
(F3–
4) a
nd c
irrh
osis
(F4)
wit
h su
bgro
up a
naly
sis
acco
rdin
g to
dia
gnos
tic
mod
alit
y (u
ltra
sono
grap
hy, e
last
ogra
phy,
com
pute
d to
mog
raph
y, c
linic
al d
ata)
and
pop
ulat
ion
(at-
risk
pop
ulat
ion,
gen
eral
pop
ulat
ion)
Ana
lysi
sN
o. o
f stu
dies
Pool
ed
sens
itivi
ty
(95%
-CI)
I2 (%)
Pool
ed s
peci
ficit
y (9
5%-C
I)I2 (%
)Po
oled
pos
itive
pr
edic
tive
valu
e (9
5%-C
I)
I2 (%)
Pool
ed n
egat
ive
pred
ictiv
e va
lue
(95%
-CI)
I2 (%)
Pool
ed d
iagn
ostic
od
d ra
tio (9
5%-C
I)I2 (%
)AU
C
Cirr
hosis
(F4)
Ove
rall
110.
78 (0
.71–
0.85
)79
a0.
89 (0
.81–
0.94
)95
a0.
72 (0
.58–
0.83
)93
a0.
92 (0
.88–
0.94
)82
a31
.58
(11.
84–8
4.25
)93
a0.
85
Sub
grou
p: m
odal
ity
Ultr
ason
ogra
phy
20.
79 (0
.73–
0.84
)0
0.93
(0.9
0–0.
95)
00.
85 (0
.79–
0.89
)0
0.90
(0.8
7–0.
92)
053
.78
(31.
99–9
0.40
)0
0.95
Ela
stog
raph
y2
0.87
(0.5
0–0.
98)
73a
0.88
(0.8
5–0.
91)
00.
59 (0
.42–
0.75
)70
a0.
95 (0
.93–
0.97
)0
50.5
9 (4
.05–
631.
72)
82a
0.89
CT
20.
84 (0
.80–
0.87
)0
0.86
(0.4
3–0.
98)
98a
0.78
(0.3
2–0.
96)
97a
0.91
(0.8
8–0.
93)
0a25
.61
(0.7
1–92
0.47
)98
a0.
84
MRI
10.
76 (0
.61–
0.86
)–
0.76
(0.6
3–0.
86)
–0.
72 (0
.58–
0.83
)–
0.79
(0.6
6–0.
88)
–9.
99 (3
.79–
25.1
0)–
–
Clin
ical
dat
a4
0.65
(0.5
8–0.
72)
00.
91 (0
.74–
0.97
)93
a0.
68 (0
.41–
0.87
)89
a0.
91 (0
.87–
0.94
)54
a27
.45
(3.5
9–20
9.65
)93
a0.
68
Sub
grou
p di
ffer-
ence
, Q25
.02
(p <
0.0
1)b
14.9
5 (p
< 0
.01)
b13
.11
(p =
0.0
1)b
20.5
7 (p
< 0
.01)
b9.
90 (p
= 0
.04)
b
Sub
grou
p: p
opul
atio
n
At-
risk
popu
latio
n7
0.80
(0.6
5–0.
90)
84a
0.90
(0.8
0–0.
95)
93a
0.67
(0.5
0–0.
80)
89a
0.94
(0.9
0–0.
97)
75a
36.7
8 (1
0.67
–126
.84)
90a
0.89
Gen
eral
pop
ulat
ion
40.
80 (0
.75–
0.85
)34
0.87
(0.6
7–0.
96)
96a
0.79
(0.5
7–0.
92)
94a
0.88
(0.8
3–0.
92)
60a
24.8
9 (5
.57–
111.
16)
95a
0.83
Sub
grou
p di
ffer-
ence
, Q0.
00 (p
= 0
.99)
0.12
(p =
0.7
3)1.
01 (p
= 0
.32)
4.57
(p =
0.0
3)b
0.16
(p =
0.6
9)
Adva
nced
fibr
osis
(F3–
4)
Ove
rall
100.
86 (0
.80–
0.90
)80
a0.
87 (0
.80–
0.92
)89
a0.
85 (0
.75–
0.91
)92
a0.
88 (0
.82–
0.92
)84
a37
.79
(16.
01–8
9.19
)91
a0.
92
Sub
grou
p: m
odal
ity
Ela
stog
raph
y2
0.84
(0.7
4–0.
91)
53a
0.94
(0.7
7–0.
99)
59a
0.92
(0.4
9–0.
99)
84a
0.91
(0.8
8–0.
94)
098
.96
(5.0
6–19
36.4
6)87
a0.
93
CT
20.
89 (0
.70–
0.96
)90
a0.
87 (0
.55–
0.97
)95
a0.
88 (0
.55–
0.98
)96
a0.
87 (0
.65–
0.95
)88
a45
.86
(0.7
8–26
98.1
7)98
a0.
93
MRI
20.
78 (0
.67–
0.86
)0
0.79
(0.6
5–0.
88)
00.
85 (0
.74–
0.92
)0
0.70
(0.5
7–0.
81)
012
.21
(4.9
6–30
.08)
00.
83
Clin
ical
dat
a4
0.87
(0.7
9–0.
92)
69a
0.82
(0.7
9–0.
92)
00.
79 (0
.75–
0.83
)8
0.90
(0.8
3–0.
95)
77a
32.8
1 (1
7.05
–63.
15)
61a
0.86
Sub
grou
p di
ffer-
ence
, Q2.
89 (p
= 0
.40)
2.82
(p =
0.4
2)2.
43 (p
= 0
.49)
18.7
6 (p
< 0
.01)
b3.
99 (p
= 0
.26)
Sub
grou
p: p
opul
atio
n
At-
risk
popu
latio
n6
0.86
(0.8
0–0.
91)
71a
0.87
(0.8
1–0.
91)
77a
0.82
(0.7
0–0.
90)
91a
0.90
(0.8
6–0.
94)
73a
36.7
0 (2
0.49
–65.
75)
67a
0.90
Gen
eral
pop
ulat
ion
40.
85 (0
.71–
0.93
)84
a0.
86 (0
.67–
0.94
)88
a0.
88 (0
.71–
0.95
)92
a0.
83 (0
.67–
0.92
)84
a29
.78
(2.6
3–33
6.82
)96
a0.
90
Sub
grou
p di
ffer-
ence
, Q0.
05 (p
= 0
.82)
0.03
(p =
0.8
7)0.
41 (p
= 0
.52)
1.94
(p =
0.1
6)0.
03 (p
= 0
.87)
Sign
ifica
nt fi
bros
is (F
2–4)
Ove
rall
80.
86 (0
.78–
0.92
)91
a0.
81 (0
.77–
0.84
)39
a0.
88 (0
.80–
0.93
)90
a0.
77 (0
.58–
0.89
)95
a26
.79
(14.
47–4
9.62
)77
a0.
86
Sub
grou
p: M
odal
ity
Ultr
ason
ogra
phy
20.
90 (0
.87–
0.93
)0
0.82
(0.7
7–0.
85)
00.
83 (0
.79–
0.87
)0
0.86
(0.7
2–0.
94)
80a
37.5
3 (1
8.66
–75.
49)
480.
92

Page 10 of 16Decharatanachart et al. BMC Gastroenterol (2021) 21:10
Tabl
e 2
(con
tinu
ed)
Ana
lysi
sN
o. o
f stu
dies
Pool
ed
sens
itivi
ty
(95%
-CI)
I2 (%)
Pool
ed s
peci
ficit
y (9
5%-C
I)I2 (%
)Po
oled
pos
itive
pr
edic
tive
valu
e (9
5%-C
I)
I2 (%)
Pool
ed n
egat
ive
pred
ictiv
e va
lue
(95%
-CI)
I2 (%)
Pool
ed d
iagn
ostic
od
d ra
tio (9
5%-C
I)I2 (%
)AU
C
Ela
stog
raph
y2
0.73
(0.6
8–0.
77)
00.
87 (0
.82–
0.90
)0
0.92
(0.7
1–0.
98)
79a
0.62
(0.2
9–0.
86)
95a
18.8
4 (1
2.24
–29.
00)
00.
85
CT
10.
76 (0
.64–
0.85
)–
0.68
(0.5
2–0.
81)
–0.
80 (0
.68–
0.88
)–
0.63
(0.4
8–0.
77)
–6.
79 (2
.77–
16.6
6)–
MRI
10.
84 (0
.75–
0.91
)–
0.70
(0.3
8–0.
90)
–0.
96 (0
.89–
0.99
)–
0.33
(0.1
7–0.
55)
–12
.67
(2.9
2–54
.96)
–
Clin
ical
dat
a2
0.96
(0.9
4–0.
98)
00.
78 (0
.72–
0.83
)0
0.83
(0.6
1–0.
94)
90a
0.93
(0.8
8–0.
96)
080
.11
(37.
50–1
71.1
6)19
0.86
Sub
grou
p di
ffer-
ence
, Q76
.00
(p <
0.0
1)b
12.0
7 (p
= 0
.02)
b9.
08 (p
= 0
.06)
45.0
4 (p
< 0
.01)
b20
.79
(p <
0.0
1)b
Sub
grou
p: p
opul
atio
n
At-
risk
popu
latio
n5
0.87
(0.7
4–0.
94)
93a
0.82
(0.7
7–0.
86)
39a
0.88
(0.7
7–0.
94)
90a
0.81
(0.6
0–0.
93)
94a
33.9
9 (1
5.73
–73.
41)
74a
0.88
Gen
eral
pop
ulat
ion
30.
86 (0
.77–
0.91
)72
a0.
78 (0
.77–
0.87
)32
a0.
87 (0
.74–
0.94
)82
a0.
69 (0
.34–
0.91
)94
a17
.06
(4.0
6–71
.69)
87a
0.87
Sub
grou
p di
ffer-
ence
, Q0.
07 (p
= 0
.79)
0.43
(p =
0.5
1)0.
00 (p
= 0
.95)
0.51
(p =
0.4
7)0.
69 (p
= 0
.41)
a p v
alue
for C
ochr
ane
Q <
0.1
b Sig
nific
ant d
iffer
ence
bet
wee
n su
bgro
ups
Page 11 of 16Decharatanachart et al. BMC Gastroenterol (2021) 21:10
subgroups of cirrhosis. For instance, a statistically sig-nificant difference was only detected in the pooled NPV among diagnostic subgroups (p < 0.01) (Table 2, Addi-tional file 1: Fig. S1).
The results of the subgroup analyses of significant liver fibrosis (F2-4) stage were similar to those of cirrhosis, i.e., there were significant differences in the pooled sensitiv-ity, specificity, NPV and DOR among diagnostic modal-ity groups (p < 0.05), and the heterogeneity accessed by I2 was greatly reduced in several subgroups. The I2 values were 0% for the pooled sensitivity, specificity and PPV in the ultrasonography subgroup, 0% for the pooled sensi-tivity, specificity and DOR in the elastography subgroup, and 0% for the pooled sensitivity, specificity and NPV in the clinical data subgroup (Table 2, Additional file 1: Fig. S2).
Figure 3 shows the SROC curves of AI-assisted sys-tems for the diagnosis of cirrhosis, advanced fibrosis and significant fibrosis with subgroup analysis by diagnostic modality. The overall AUC values were 0.85, 0.92 and 0.86 for the diagnosis of cirrhosis, advanced fibrosis and significant fibrosis, respectively. AUC values of subgroup analyses of different diagnostic modalities are shown in Table 2.
Subgroup analysis by study populationWe were able to identify 2 population groups in the selected studies. The first group of studies was con-ducted in a general population without any specific liver disease, while the second group was conducted in an “at-risk” population of individuals who already suf-fered from chronic liver diseases such as chronic viral hepatitis B and C infections. Therefore, we performed subgroup analyses according to the study population, i.e., the at-risk population and general population. The performance of AI-assisted systems for the diagnosis of F2-F4 fibrosis is summarized in Table 2. In contrast to the aforementioned subgroup analysis, the sensitivity and specificity of AI-assisted diagnostic systems in the at-risk population were similar to those in the general popula-tion in all stages of liver fibrosis. The heterogeneity was not dramatically reduced, and the subgroups’ I2 values remained high (70–90%). Additionally, there were no sig-nificant differences in diagnostic performance between subgroups (p ≥ 0.05) in almost all stages of liver fibro-sis. Therefore, we could infer that different populations are unlikely to have an impact on the performance of AI-assisted systems for diagnosing liver fibrosis. To con-firm this finding, we further performed a meta-regres-sion analysis with population as a covariate. The mixed effects model showed no statistically significant results, with p = 0.69, 0.70 and 0.35 for F4, ≥ F3 and ≥ F2 stages, respectively.
Subgroup analysis by AI classifiersWe divided AI-classifiers of the included studies into 2 main subgroups, i.e., neural network and non-neural net-work. Performance of each subgroup is shown in Addi-tional file 1: Table S3. We found that the performance of the 2 subgroups were relatively similar except for a slightly better sensitivity, specificity, PPV and DOR in the neural network group for the diagnosis of cirrhosis. There was no significant difference between AI-classifier sub-groups, except for the pooled sensitivity and PPV for the diagnosis of cirrhosis as well as pooled NPV for the diag-nosis of advanced fibrosis. We further stratified neural network-assisted studies by diagnostic modalities (ultra-sonography, elastography, CT, MRI and clinical data) as well as population (at-risk, general population) (Addi-tional file 1: Table S4). Furthermore, there was a reduc-tion in heterogeneity after subgroup by modalities. For example, I2 values were 0 for the pooled sensitivity, speci-ficity, PPN, NPV and DOR in the diagnosis of cirrhosis by neural network-assisted ultrasonography and the diagno-sis of advanced fibrosis by neural network-assisted clini-cal parameters. Difference between modalities were also observed in the pooled sensitivity, specificity, NPV and DOR for diagnosing cirrhosis as well as specificity, PPV, NPV and DOR for classifying advanced fibrosis; whereas subgroups by population revealed no significant change in overall performance or heterogeneity.
Overall performance of AI in the diagnosis of nonalcoholic fatty liver disease (NAFLD)Only 2 studies on the AI-assisted diagnosis of NAFLD had liver biopsy as the gold standard [24, 26]. One used an ANN, and the other one used a CNN as AI models. The pooled sensitivity, specificity, PPV, NPV and DOR were 0.97 (95% CI 0.76–1.00), 0.91 (95% CI 0.78–0.97), 0.95 (95% CI 0.87–0.98), 0.93 (95% CI 0.80–0.98), and 191.52 (95% CI 38.83–944.81), respectively, with I2 of 0% for all (Additional file 1: Table S5).
Publication biasDeeks funnel plots were generated for publication bias assessments. The slope coefficients were relatively sym-metrical with P values of 0.30, 0.21 and 0.35 for the diagnosis of cirrhosis, advanced fibrosis and significant fibrosis, respectively (Additional file 1: Fig. S3), suggest-ing that publication bias was not present.
DiscussionIn this meta-analysis, AI-assisted models had good per-formance in the assessment of liver fibrosis and steatosis. Interestingly, for the detection of cirrhosis, AI-assisted imaging-based models had greater sensitivities than AI-assisted clinical-based models, i.e., 0.79–0.87 versus

Page 12 of 16Decharatanachart et al. BMC Gastroenterol (2021) 21:10
Fig. 3 SROC curves demonstrating performance of AI-assisted diagnosis of liver cirrhosis (F4) (a), advanced fibrosis (F3–4) (b) and significant liver fibrosis (F2–4) (c) with subgroup analysis according to diagnostic modality (ultrasonography, elastography, computed tomography and clinical data)

Page 13 of 16Decharatanachart et al. BMC Gastroenterol (2021) 21:10
0.65. By contrast, for the diagnosis of significant fibrosis, clinical-based models had a greater sensitivity (0.96 ver-sus 0.73–0.90) but less specificity (0.78 versus 0.82–0.87) than imaging-based models. The NPV of AI-assisted models for detecting advanced liver fibrosis and cirrho-sis were approximately 90%, implying that the AI-assisted models were able to help guide clinical decisions that the patients unlikely had liver fibrosis, without the need for invasive methods such as liver biopsy.
AI-aided systems have some advantages over conven-tional noninvasive diagnostic tools. Unlike ultrasonogra-phy, which is an operator-dependent modality, AI utilizes multiple features from ultrasonographic images as inputs to systematically analyze the images, thus reducing bias in the image interpretation. Moreover, AI-assisted diag-nosis systems can potentially be used in both the general population and at-risk population. This was suggested by the results of the meta-regression analysis with popula-tion as a covariate and by the similar performance of AI-assisted systems between the 2 populations.
Transient elastography is currently the most com-monly used noninvasive tool for staging liver fibrosis. A recent meta-analysis showed that transient elastogra-phy had AUCs of 0.84, 0.89, and 0.94 for the diagnosis of ≥ F2, ≥ F3 and F4 stage fibrosis, respectively [41, 42]. Real-time elastography has also been frequently used as an alternative to transient elastography with an AUC of 0.72, 0.86 and 0.69 for the diagnosis of liver cirrhosis, advanced fibrosis and significant fibrosis, respectively [43]. Our meta-analysis showed that AI-assisted elastog-raphy had higher AUCs for the diagnosis of all stages of
liver fibrosis than real-time elastography. When compar-ing to transient elastography, AI-assisted elastography had a slightly lower AUC for identifying liver cirrhosis, but higher AUCs for classifying advanced fibrosis and significant fibrosis. Interestingly, among the 3 AI-assisted systems, AI-assisted ultrasonography had the best per-formance (Table 3). This could possibly be due to the dif-ference in types of input data. Studies using AI-assisted ultrasonography incorporated inputs with relatively larger region of interests (ROIs) and extracted different categories of radiomics, compared to AI-assisted elas-tography studies. Therefore, AI performance could be affected by the selected inputs. Further studies to specify the most appropriate inputs for each AI classifier is war-ranted in order to maximize the AI performance. Due to the satisfactory performance of AI-assisted ultra-sonography, AI has a potential application for staging liver fibrosis in areas where elastography machines are not available. Likewise, the FIB-4 score and APRI score are the most commonly used clinical parameters for predicting liver fibrosis. We found that, in line with the AI-assisted image analysis model, the AI-assisted clinical-based model had a lower AUC value for the diagnosis of stage F4 fibrosis but higher AUC values for the diagnosis of stage ≥ F2 and ≥ F3 fibrosis. Nevertheless, after exclud-ing one study [35] which had a different specific popula-tion, focusing only on cirrhosis in NALFD patients, the AUC value for F4 fibrosis dramatically increased from 0.68 to 0.86 which was better than APRI and FIB-4.
In this meta-analysis, we observed relatively high heterogeneity throughout the study. After performing
Table 3 Sensitivity, specificity and area-under-the-curve (AUC) of AI-assisted ultrasonography, AI-assisted elastography, and AI-assisted clinical data for the diagnosis of liver cirrhosis (F4), advanced fibrosis (F3–4) and significant liver fibrosis (F2–4)
Pooled sensitivity, specificity and AUC of transient elastography, real-time elastography, AST to Platelet Ratio Index (APRI) and Fibrosis-4 (FIB-4) for diagnosis of liver fibrosis from previous meta-analyses [41–44] are also shown
Analysis AI-assisted ultrasonography
AI-assisted elastography
AI-assisted clinical data
Transient elastography [41, 42]
Real-time elastography [43]
APRI [44] FIB-4 [44]
Cirrhosis (F4) (Cut-off 2.0) (Cut-off 1.62–2.65)
Sensitivity 0.79 (0.73–0.84) 0.87 (0.50–0.98) 0.65 (0.58–0.72) 0.83 (0.79–0.86) 0.74 (0.63–0.82) 0.31 (0.13–0.63) 0.64 (0.39–0.77)
Specificity 0.93 (0.90–0.95) 0.88 (0.85–0.91) 0.91 (0.74–0.97) 0.89 (0.87–0.91) 0.84 (0.79–0.88) 0.89 (0.81–0.96) 0.86 (0.75–0.98)
AUC 0.95 0.89 0.68 0.94 0.72 0.72 0.78
Advanced fibrosis (F3–4) (Cut-off 0.5) (Cut-off 1.45)
Sensitivity – 0.84 (0.74–0.91) 0.87 (0.79–0.92) 0.82 (0.78–0.86) 0.82 (0.75–0.88) 0.73 (0.63–0.83) 0.63 (0.50–0.71)
Specificity – 0.94 (0.77–0.99) 0.82 (0.79–0.85) 0.86 (0.82–0.89) 0.81 (0.72–0.88) 0.55 (0.37–0.72) 0.56 (0.14–0.80)
AUC – 0.93 0.86 0.89 0.86 0.76 0.80
Significant fibrosis (F2–4) (Cut-off 0.5) (Cut-off 1.45)
Sensitivity 0.90 (0.87–0.93) 0.73 (0.68–0.77) 0.96 (0.94–0.98) 0.79 (0.74–0.82) 0.79 (0.75–0.83) 0.70 (0.35–0.97) 0.65 (0.52–0.87)
Specificity 0.82 (0.77–0.85) 0.87 (0.82–0.90) 0.78 (0.72–0.83) 0.78 (0.72–0.83) 0.76 (0.68–0.82) 60 (0.34–0.87) 0.74 (0.65–0.85)
AUC 0.92 0.85 0.86 0.84 0.69 0.72 0.76
Page 14 of 16Decharatanachart et al. BMC Gastroenterol (2021) 21:10
subgroup analyses categorized by diagnostic modality (ultrasound, elastography, CT, MRI, and clinical data), the heterogeneity was dramatically reduced, i.e., the I2 value was 0% in many subgroups. Moreover, the per-formance of most subgroups was significantly different, indicating that the types of diagnostic modality had an impact on the performance of AI models. Interestingly, we found that AI-integrated ultrasonography had excep-tional performance with a relatively low heterogeneity throughout the analyses. Because ultrasound machines are widely available, this finding suggests that AI-assisted ultrasonography has tremendous potential for being uti-lized in real clinical practice.
This is one of the very first meta-analyses of the AI-supported systems in diagnosis of liver diseases. Apart from publications in medical journals, we also included articles from computer science and engineering journals, resulting in a comprehensive review of AI advancements regarding this topic. To reduce the chance of overesti-mating the diagnostic performance of AI models, only studies that had a validation cohort or equivalent method for evaluating the performance of the developed AI mod-els were included.
There are some limitations in this review and meta-analysis. First of all, there are several imaging modalities and AI classifiers included in the meta-analysis which contributed to the heterogeneity of the overall analysis. For different AI-assisted imaging modalities, we prespec-ified subgroup analysis by modalities. We also further performed subgroup analysis according to AI classifier, i.e., neural networks and non-neural networks (Addi-tional file 1: Table S3). We observed relatively similar performance except for a relatively better performance in the diagnosis of cirrhosis in the neural networks group. Additionally, we performed another subgroup analy-sis of imaging modalities and population including only studies with neural network AI classifier (Additional file 1: Table S4). We found that the heterogeneity was decreased. However, it is important to note that the input modalities and AI-assisted systems were not completely identical among studies included in the analysis, inter-pretation of the pooled diagnostic performance needs to be done with caution. Although there were an acceptable number of studies for meta-analysis, the number of stud-ies of each diagnostic tool was relatively small, given that several modalities are currently used for the assessment of liver fibrosis and steatosis. Therefore, the results of the subgroup analyses of each diagnostic modality need to be interpreted with caution. Furthermore, we selected only studies in which liver biopsy was used as the reference standard; consequently, some studies that demonstrated promising results but did not have liver biopsy to confirm the stage of liver fibrosis or steatosis were excluded. Nine
of the 19 studies (47%) were prospective; however, none of the included studies were randomized controlled tri-als. Only 1 study compared the performance between AI and humans [29]. Interestingly, this study showed that the AI-aided system outperformed humans in stag-ing liver fibrosis in CT images. Most included studies evaluated the performance of the developed AI systems on “internal” validation cohorts, of which the baseline patient characteristics were quite similar to those of the development cohort. Whether these developed AI models can be generalized to other populations in clini-cal practice needs to be further investigated. Moreover, long-term assessment of AI performance in real clinical settings and studies with direct comparisons between AI and conventional diagnostic methods would be beneficial in investigating real-world positive and negative impacts of the AI-assisted system.
ConclusionsThis meta-analysis demonstrates the promising potential of AI systems for aiding the diagnosis and staging of liver fibrosis and NAFLD. Integrating AI into conventional noninvasive tools yields effective diagnostic tools with an optimal balance of sensitivity and specificity. Validation of these AI models in other independent cohorts is war-ranted before implementing these AI-assisted systems into clinical practice.
Supplementary InformationThe online version contains supplementary material available at https ://doi.org/10.1186/s1287 6-020-01585 -5.
Additional file 1: Sensitivity, specificity, PPV, NPV and DOR of AI-assisted diagnosis of advanced fibrosis (F3-4), significant fibrosis (F2-4) and non-alcoholic fatty liver disease, Deeks funnel plot, quality assessment (QUA-DAS-2), sensitivity-focused and specificity-focused analyses, subgroup analysis according to AI classifiers, search strategy.
AbbreviationsAI: Artificial intelligence; TP: True positive; FP: False positive; TN: True negative; FN: False negative; PPV: Positive predictive value; NPV: Negative predictive value; DOR: Diagnostic odd ratio; NAFLD: Non-alcoholic fatty liver disease; NASH: Non-alcoholic steatohepatitis; HBV: Hepatitis B virus; HCV: Hepatitis C virus; CT: Computed tomography; MRI: Magnetic resonance imaging.
AcknowledgementsNone.
Authors’ contributionsAll authors were involved in the conception of the research. PD created the search strategy. Data acquisition was done by PD and TT. Data interpretation was performed by all authors. The manuscript was drafted by PD. Critical revision was done by RC and ST. All authors read and approved the final manuscript.
FundingThis research was funded by the Ratchadapisek Sompoch Endowment Fund (2019) under Telehealth Cluster, Chulalongkorn University, Bangkok, Thailand and Chulalongkorn University CU-GRS-62-02-30-01.

Page 15 of 16Decharatanachart et al. BMC Gastroenterol (2021) 21:10
Availability of data and materialsMaterials described in the manuscript, including all relevant raw data, will be freely available to any researcher wishing to use them for non-commercial purposes. Please contact Dr. Roongruedee Chaiteerakij, the corresponding author, for any inquiries for the data.
Ethics approval and consent to participateNot applicable.
Consent for publicationNot applicable.
Competing interestsThe authors deny any conflict of interest.
Author details1 Department of Medicine, Faculty of Medicine, Chulalongkorn University, Bangkok, Thailand. 2 Division of Gastroenterology, Department of Medicine, Faculty of Medicine, Chulalongkorn University and King Chulalongkorn Memorial Hospital, Thai Red Cross Society, 1873 Rama IV Rd., Pathum Wan, Bangkok 10330, Thailand. 3 Center of Excellence for Innovation and Endoscopy in Gastrointestinal Oncology, Faculty of Medicine, Chulalongkorn University, Bangkok, Thailand. 4 Faculty of Medicine, Chulalongkorn University, Bangkok, Thailand.
Received: 16 September 2020 Accepted: 16 December 2020
References 1. Asrani SK, Devarbhavi H, Eaton J, Kamath PS. Burden of liver diseases in
the world. J Hepatol. 2019;70(1):151–71. 2. Collaborators GBDC. The global, regional, and national burden of cirrhosis
by cause in 195 countries and territories, 1990–2017: a systematic analysis for the Global Burden of Disease Study 2017. Lancet Gastroenterol Hepa-tol. 2020;5(3):245–66.
3. Goldberg D, Ditah IC, Saeian K, Lalehzari M, Aronsohn A, Gorospe EC, et al. Changes in the prevalence of hepatitis C virus infection, nonalcoholic steatohepatitis, and alcoholic liver disease among patients with cirrhosis or liver failure on the waitlist for liver transplantation. Gastroenterology. 2017;152(5):1090–9.
4. Araujo AR, Rosso N, Bedogni G, Tiribelli C, Bellentani S. Global epidemiol-ogy of non-alcoholic fatty liver disease/non-alcoholic steatohepatitis: what we need in the future. Liver Int. 2018;38(Suppl 1):47–51.
5. Estes C, Razavi H, Loomba R, Younossi Z, Sanyal AJ. Modeling the epi-demic of nonalcoholic fatty liver disease demonstrates an exponential increase in burden of disease. Hepatology. 2018;67(1):123–33.
6. The French METAVIR Cooperative Study Group. Intraobserver and inter-observer variations in liver biopsy interpretation in patients with chronic hepatitis C. Hepatology. 1994;20(1 Pt 1):15–20.
7. Fleming KM, Aithal GP, Card TR, West J. All-cause mortality in people with cirrhosis compared with the general population: a population-based cohort study. Liver Int. 2012;32(1):79–84.
8. Piccinino F, Sagnelli E, Pasquale G, Giusti G. Complications following percutaneous liver biopsy. A multicentre retrospective study on 68,276 biopsies. J Hepatol. 1986;2(2):165–73.
9. Theodossi A, Skene AM, Portmann B, Knill-Jones RP, Patrick RS, Tate RA, et al. Observer variation in assessment of liver biopsies including analysis by kappa statistics. Gastroenterology. 1980;79(2):232–41.
10. Myers RP, Benhamou Y, Imbert-Bismut F, Thibault V, Bochet M, Charlotte F, et al. Serum biochemical markers accurately predict liver fibrosis in HIV and hepatitis C virus co-infected patients. AIDS. 2003;17(5):721–5.
11. Koksal I, Yilmaz G, Parlak M, Demirdal T, Kinikli S, Candan M, et al. Diag-nostic value of combined serum biomarkers for the evaluation of liver fibrosis in chronic hepatitis C infection: a multicenter, noninterventional, observational study. Turk J Gastroenterol. 2018;29(4):464–72.
12. Xiao G, Zhu S, Xiao X, Yan L, Yang J, Wu G. Comparison of laboratory tests, ultrasound, or magnetic resonance elastography to detect fibrosis in patients with nonalcoholic fatty liver disease: a meta-analysis. Hepatol-ogy. 2017;66(5):1486–501.
13. Renner J, Phlipsen H, Haller B, Navarro-Avila F, Saint-Hill-Febles Y, Mateus D, et al. Optical classification of neoplastic colorectal polyps—a computer-assisted approach (the COACH study). Scand J Gastroen-terol. 2018;53(9):1100–6.
14. Urban G, Tripathi P, Alkayali T, Mittal M, Jalali F, Karnes W, et al. Deep learning localizes and identifies polyps in real time with 96% accuracy in screening colonoscopy. Gastroenterology. 2018;155(4):1069-78 e8.
15. Spann A, Yasodhara A, Kang J, Watt K, Wang B, Goldenberg A, et al. Applying machine learning in liver disease and transplantation: a comprehensive review. Hepatology. 2020;71(3):1093–105.
16. Le Berre C, Sandborn WJ, Aridhi S, Devignes MD, Fournier L, Smail-Tab-bone M, et al. Application of artificial intelligence to gastroenterology and hepatology. Gastroenterology. 2020;158(1):76-94 e2.
17. Singh S, Muir AJ, Dieterich DT, Falck-Ytter YT. American Gastroentero-logical Association Institute Technical Review on the role of elastogra-phy in chronic liver diseases. Gastroenterology. 2017;152(6):1544–77.
18. Whiting PF, Rutjes AW, Westwood ME, Mallett S, Deeks JJ, Reitsma JB, et al. QUADAS-2: a revised tool for the quality assessment of diagnostic accuracy studies. Ann Intern Med. 2011;155(8):529–36.
19. Review Manager (RevMan) [Computer program]. Version 5.3 ed. Copenhagen: The Nordic Cochrane Centre, The Cochrane Collabora-tion; 2014.
20. R: A Language and Environment for Statistical Computing. Vienna, Austria: R Core Team; 2019.
21. Swets JA. Measuring the accuracy of diagnostic systems. Science. 1988;240(4857):1285–93.
22. Lee JH, Joo I, Kang TW, Paik YH, Sinn DH, Ha SY, et al. Deep learning with ultrasonography: automated classification of liver fibrosis using a deep convolutional neural network. Eur Radiol. 2020;30(2):1264–73.
23. Li W, Huang Y, Zhuang BW, Liu GJ, Hu HT, Li X, et al. Multiparametric ultrasomics of significant liver fibrosis: a machine learning-based analy-sis. Eur Radiol. 2019;29(3):1496–506.
24. Byra M, Styczynski G, Szmigielski C, Kalinowski P, Michalowski L, Paluszkiewicz R, et al. Transfer learning with deep convolutional neural network for liver steatosis assessment in ultrasound images. Int J Com-put Assist Radiol Surg. 2018;13(12):1895–903.
25. Zhang L, Li QY, Duan YY, Yan GZ, Yang YL, Yang RJ. Artificial neural network aided non-invasive grading evaluation of hepatic fibrosis by duplex ultrasonography. BMC Med Inform Decis Mak. 2012;12:55.
26. Kuppili V, Biswas M, Sreekumar A, Suri HS, Saba L, Edla DR, et al. Extreme learning machine framework for risk stratification of fatty liver disease using ultrasound tissue characterization. J Med Syst. 2017;41(10):152.
27. Chen Y, Luo Y, Huang W, Hu D, Zheng RQ, Cong SZ, et al. Machine-learn-ing-based classification of real-time tissue elastography for hepatic fibro-sis in patients with chronic hepatitis B. Comput Biol Med. 2017;89:18–23.
28. Wang K, Lu X, Zhou H, Gao Y, Zheng J, Tong M, et al. Deep learning Radiomics of shear wave elastography significantly improved diagnostic performance for assessing liver fibrosis in chronic hepatitis B: a prospec-tive multicentre study. Gut. 2019;68(4):729–41.
29. Choi KJ, Jang JK, Lee SS, Sung YS, Shim WH, Kim HS, et al. Develop-ment and validation of a deep learning system for staging liver fibrosis by using contrast agent-enhanced CT images in the liver. Radiology. 2018;289(3):688–97.
30. Yasaka K, Akai H, Kunimatsu A, Abe O, Kiryu S. Deep learning for staging liver fibrosis on CT: a pilot study. Eur Radiol. 2018a;28(11):4578–85.
31. Ahmed Y, Hussein RS, Basha TA, Khalifa AM, Ibrahim AS, Abdelmoaty AS, et al. Detecting liver fibrosis using a machine learning-based approach to the quantification of the heart-induced deformation in tagged MR images. NMR Biomed. 2020;33(1):e4215.
32. Yasaka K, Akai H, Kunimatsu A, Abe O, Kiryu S. Liver fibrosis: deep convo-lutional neural network for staging by using gadoxetic acid-enhanced hepatobiliary phase MR images. Radiology. 2018b;287(1):146–55.
33. Wei R, Wang J, Wang X, Xie G, Wang Y, Zhang H, et al. Clinical prediction of HBV and HCV related hepatic fibrosis using machine learning. EBioMedi-cine. 2018;35:124–32.
34. Shousha HI, Awad AH, Omran DA, Elnegouly MM, Mabrouk M. Data mining and machine learning algorithms using IL28B genotype and biochemical markers best predicted advanced liver fibrosis in chronic hepatitis C. Jpn J Infect Dis. 2018;71(1):51–7.

Page 16 of 16Decharatanachart et al. BMC Gastroenterol (2021) 21:10
• fast, convenient online submission
•
thorough peer review by experienced researchers in your field
• rapid publication on acceptance
• support for research data, including large and complex data types
•
gold Open Access which fosters wider collaboration and increased citations
maximum visibility for your research: over 100M website views per year •
At BMC, research is always in progress.
Learn more biomedcentral.com/submissions
Ready to submit your researchReady to submit your research ? Choose BMC and benefit from: ? Choose BMC and benefit from:
35. Pournik O, Dorri S, Zabolinezhad H, Alavian SM, Eslami S. A diagnostic model for cirrhosis in patients with non-alcoholic fatty liver disease: an artificial neural network approach. Med J Islam Repub Iran. 2014;28:116.
36. Wang D, Wang Q, Shan F, Liu B, Lu C. Identification of the risk for liver fibrosis on CHB patients using an artificial neural network based on routine and serum markers. BMC Infect Dis. 2010;10:251.
37. Piscaglia F, Cucchetti A, Benlloch S, Vivarelli M, Berenguer J, Bolondi L, et al. Prediction of significant fibrosis in hepatitis C virus infected liver transplant recipients by artificial neural network analysis of clinical fac-tors. Eur J Gastroenterol Hepatol. 2006;18(12):1255–61.
38. Li N, Zhang J, Wang S, Jiang Y, Ma J, Ma J, et al. Machine learning assess-ment for severity of liver fibrosis for chronic hbv based on physical layer with serum markers. IEEE Access. 2019;7:124351–65.
39. Raoufy MR, Vahdani P, Alavian SM, Fekri S, Eftekhari P, Gharibzadeh S. A novel method for diagnosing cirrhosis in patients with chronic hepatitis B: artificial neural network approach. J Med Syst. 2011;35(1):121–6.
40. Schawkat K, Ciritsis A, von Ulmenstein S, Honcharova-Biletska H, Jungst C, Weber A, et al. Diagnostic accuracy of texture analysis and machine learning for quantification of liver fibrosis in MRI: correlation with MR elastography and histopathology. Eur Radiol. 2020;30(8):4675–85.
41. Friedrich-Rust M, Ong MF, Martens S, Sarrazin C, Bojunga J, Zeuzem S, et al. Performance of transient elastography for the staging of liver fibro-sis: a meta-analysis. Gastroenterology. 2008;134(4):960–74.
42. Tsochatzis EA, Gurusamy KS, Ntaoula S, Cholongitas E, Davidson BR, Burroughs AK. Elastography for the diagnosis of severity of fibrosis in chronic liver disease: a meta-analysis of diagnostic accuracy. J Hepatol. 2011;54(4):650–9.
43. Kobayashi K, Nakao H, Nishiyama T, Lin Y, Kikuchi S, Kobayashi Y, et al. Diagnostic accuracy of real-time tissue elastography for the staging of liver fibrosis: a meta-analysis. Eur Radiol. 2015;25(1):230–8.
44. Xiao G, Yang J, Yan L. Comparison of diagnostic accuracy of aspartate aminotransferase to platelet ratio index and fibrosis-4 index for detecting liver fibrosis in adult patients with chronic hepatitis B virus infection: a systemic review and meta-analysis. Hepatology. 2015;61(1):292–302.
Publisher’s NoteSpringer Nature remains neutral with regard to jurisdictional claims in pub-lished maps and institutional affiliations.