APPENDIX K - RTC Transit
15
APPENDIX K ENVIRONMENTAL JUSTICE ANALYSIS
Transcript of APPENDIX K - RTC Transit

APPENDIX K
ENVIRONMENTAL JUSTICE ANALYSIS

| ACCESS 2050 APPENDIX K-1 |
Environmental Justice According to FHWA, “environmental justice principles and procedures improve all levels of transportation decision-making by enabling practitioners to make transportation decisions that meet the needs of all people.” The Regional Transportation Commission Metropolitan Planning Organization (MPO) is committed to promoting and advancing environmental justice in regional transportation planning.
Projects in the Regional Transportation Plan, including roadway, sidewalk, bike facilities, and transit improvements, have potential social, economic, and health impacts on daily lives, such as:
Access to work, education, healthcare, shopping, recreation, and social destinations;
Indirect and costs, such as travel time, congestion delay, pollution, and land use impacts;
Costs as a significant share of household expenses, which impact the affordability of other essentials (e.g. housing, healthcare);
Land values and economic development opportunities; and Health costs and impacts related to physical activity, air quality, and
crashes.
Therefore, the MPO considers environmental justice and equity impacts in its transportation and regional plans and related outreach efforts. Additionally, maps provided in Appendix K: Environmental Justice depict the geographic distribution of Regional Transportation Projects in relationship to:
1) Title VI: Census tracts that include an above average percentage of minority, senior, disabled, low-income, and limited English proficiency populations; and
2) Composite Equity Factors: Census tracts that have a low equity/high inequity composite score based on the factors shown above plus no vehicle households and youth.
Legal Framework As a recipient of federal funds, the MPO is subject to the laws and regulations related to environmental justice, including:
• Title VI of the Civil Rights Act of 1964, which prohibits discrimination on the basis of race, color, or national origin in programs receiving federal assistance;
• Environmental Justice Executive Order 12898, which aims to identify and address disproportionately high and adverse human health or environmental effects on minority populations and low-income populations; and
• FHWA Title VI Program (23 CFR 200), which ensures that federal funding recipients comply with Title VI and related civil rights authorities. Additionally, FHWA is broader than Title VI and EJ requirements and protects populations based on race, color, national origin, sex, age, disability, low-income, and limited English proficiency.
Related Plans The MPO implements Title VI laws and regulations and encourages transportation decision-makers to consider the needs of all people through planning documents and tools, including:
• Title VI Report Update (2019), which summarizes non-discrimination policies and procedures, demographic changes, Language Assistance Plan, recent outreach and committees, and Title VI maps;
• Public Participation Plan (2019), which establishes outreach requirements for transportation plans; and
• Southern Nevada Community Data and Health and Equity maps that provide access to key demographic data through online interactive tools.

| ACCESS 2050 APPENDIX K-2 |
Transportation Equity Maps MPO staff has completed GIS analysis to identify equity focus areas. Based on the adopted 2017 Regional Bicycle and Pedestrian Plan equity map, the Composite Equity Score Map (right and available at this link) serves as a tool for integrating the needs of all people in transportation plans, projects, and outreach.
Methodology The analysis utilizes quartiles of the following equity factors: limited English proficiency, youth, seniors, people with disabilities, low-income, minority, and no vehicle households. Scores are assigned to census tracts for each variable based on the percentile the data represents. For tracts that were located in the 75th percentile, a score of 1 (lowest) was assigned; census tracts located in the 25th percentile were assigned a score of 4 (highest). The scores for all indicators were combined into a composite score, ranging from 7 (lowest) to 28 (highest), as follows:
• High Score: Tracts that scored higher have a higher identified need and typically represent low-income, minority neighborhoods who rely more heavily on bicycling, walking, or transit as their primary form of transportation.
• Low Score: Areas with lower scores generally represent more affluent neighborhoods, where access to an automobile is more readily available and where poverty levels are low.
RTP Equity Focus Area Maps The following maps illustrate the geographic distribution of active transportation, roadway maintenance, transit, and all Regional Transportation Plan projects in relationship with locations with the highest equity scores, shown in orange and red on the Composite Equity Score by Census Tract Map (right).
Data Source: U.S. Census Bureau, 2013-2017 American Community Survey 5-Year Estimates

| ACCESS 2050 APPENDIX K-3 |
Map: Regional Transportation Plan projects, including highway, major roadway, transit, trail, intersection and safety improvements, are located throughout the region and in equity focus areas, which have a high percentage of no vehicle households and minority, low-income, low English proficiency, disabled, senior, and youth populations.

| ACCESS 2050 APPENDIX K-4 |
Map: Active transportation and transit projects, which improve health and increase mobility for people without access to cars or the ability to drive, and roadway maintenance projects, which demonstrate reinvestment in existing neighborhoods, are located across the valley and in equity focus areas.

| ACCESS 2050 APPENDIX K-5 |
Map: Active transportation projects in equity focus areas include Complete Streets at Sahara Avenue and Boulder Highway, trails along CC-215, Saint Rose Parkway, and Spencer Greenway, bicycle and pedestrian bridges at US-95, and Safe Routes to School and pedestrian improvements at multiple locations.

| ACCESS 2050 APPENDIX K-6 |
Map: Transit projects in equity focus areas include projects that implement the On Board Mobility Plan, such as transit lanes along Boulder Highway, Rancho Drive, Charleston, and Maryland Parkway, monorail improvements, and bus turnouts at multiple locations.

| ACCESS 2050 APPENDIX K-7 |
Map: Roadway maintenance projects planned along several corridors cross equity focus areas, including Charleston Boulevard, North 5th Street, and Nellis Boulevard. Additionally, roadway maintenance projects will occur in conjunction with many RTP active transportation and transit projects.

| ACCESS 2050 APPENDIX K-8 |
Title VI Demographic Maps & Analysis As completed in the Title VI MPO Report, the geographic distribution of RTP projects is evaluated through mapping analysis. Population data comes from the U.S. Census Bureau, American Community Survey (ACS) 2013-2017 Five Year Estimates. The RTC uses census block-level data with the exception of the analysis of locations with people with disabilities, which uses census tract-level data. Data sources are shown below:
Low Income: 2013-2017 American Community Survey, 5-Year Estimates, Table C17002, “Ratio of Income to Poverty Level in the Past 12 Months”
Minority: 2013-2017 American Community Survey, 5 year Estimates, Table B02001, “Race”
Limited English Proficiency: 2013-2017 American Community Survey, 5 year Estimates, Table B16004, “Age by Language Spoken at Home by Ability to Speak English for the Population 5 Years and Over”
Seniors: 2013-2017 American Community Survey, 5 year Estimates, Table B01001, “Sex by Age”
People with Disabilities: 2013-2017 American Community Survey, 5 year Estimates, Table S1810, “Disability Characteristics”
Map Methodology The methodology to determine the location and concentration of identified population groups involves the following three steps:
Step 1: Define the population groups.
Low-income means a person whose median household income is at or below the Department of Health and Human Service (HHS) poverty guidelines for 2017.
Non-white means a person who is Black/African American, Hispanic, Asian American, American Indian, or Alaskan Native.
White refers to a non-Hispanic Caucasian.
Limited English proficiency means a person who speaks English "less than very well."
Senior means a person who is at 65 years of age or older.
People with disabilities refers to individuals with one or more of the following: hearing difficulty, vision difficulty, cognitive difficulty, ambulatory difficulty, self-care difficulty, and independent living difficulty.
Step 2: Determine the average percentage for each population group.
For each census block group or tract, the total number of each population group is tallied using the definitions in step 1.
To obtain the census block group or tract percentage for a given population group, the total population group number is divided by the total population number of the census tract.
To obtain the average County percentage for a given population group, the total of all census block group or tract percentages is divided by the number of census block groups or tracts in Clark County, Nevada.
Step 3: Develop demographic maps by census block group or tract.
For census block groups or tracts at or above the average Clark County percentage for a given population group, that block group or tract was assigned colors on the map. Census block groups or tracts below the average percentage do not include a corresponding color.
Maps on the following pages show the location of RTP projects in relationship to target population groups.

| ACCESS 2050 APPENDIX K-9 |

| ACCESS 2050 APPENDIX K-10 |

| ACCESS 2050 APPENDIX K-11 |

| ACCESS 2050 APPENDIX K-12 |
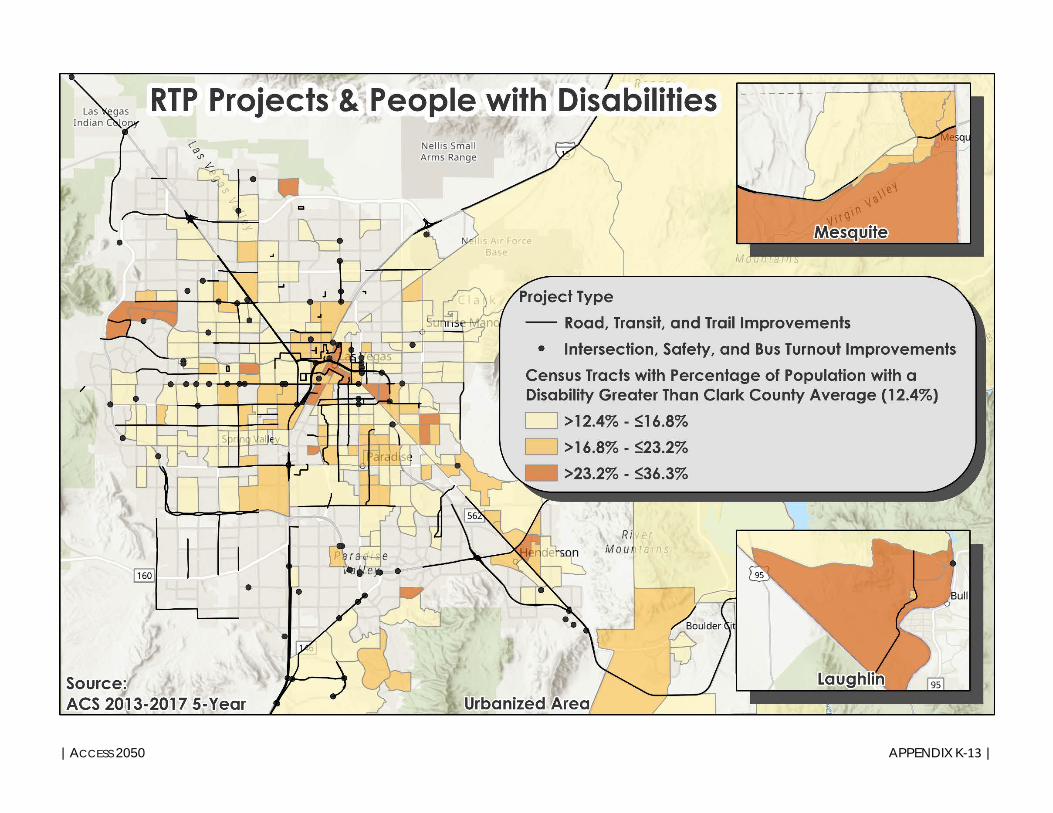
| ACCESS 2050 APPENDIX K-13 |

| ACCESS 2050 APPENDIX K-14 |
Demographic Map Analysis Demographic maps are used to analyze the impacts of RTP projects on minority, low income, LEP, senior, and populations with disabilities. These projects serve regional transportation needs such as access to and from locations outside of Southern Nevada, major activity centers in the region, major planned developments such as new retail malls, sports complexes, or employment centers, or transportation terminals.
Projects included in the MPO Title VI analysis are: 1) included in the Transportation Improvement Program (TIP), 2) federally funded, and/or 3) a regionally significant project included in the Access 2050: Regional Transportation Plan. Access 2050 implements five primary strategies (improve safety, manage congestion, enhance multimodal connectivity, maintain current infrastructure, promote economic development) by funding transportation projects that are intended to advance one or more of those strategies and achieve outcomes that improve conditions for Southern Nevadans.
The MPO Title VI analysis is limited since not all RTP projects may fully benefit target populations. Additionally, the analysis does not include the following project types:
- Projects that are not regionally significant or funded by federal dollars, such roadway maintenance projects funded by local fuel taxes;
- Projects not measured in miles, such as bus stop improvements; and - Transit capital projects, such as purchasing new buses.
Mapping software is used to find the aggregate amount of regionally significant projects crossing census block groups or tracts with a greater than average concentration of minority, low income, senior, LEP, and disabled populations. The following table shows the approximate total portion in miles of regionally significant projects that cross each EJ population group by census block group or census tract.
Regionally Significant Projects in Locations with Above Average Populations of Title VI Groups
Next Steps The MPO will continue to expand equity analysis of RTP projects through the Southern Nevada Transportation Impacts on Health study, which will evaluate disparate health benefits and costs related to transportation and performance measures. Additionally, future transportation modeling capabilities may allow for analysis of multi-modal accessibility, scenario planning, and impacts of transportation and land use decisions across demographics.
Several plans have documented transportation needs of vulnerable populations through community outreach, including the On Board Mobility Plan, Regional Bicycle and Pedestrian Plan, Coordinated Public Transit-Human Services Transportation Plan, and Southern Nevada Strong. The MPO continues to encourage RTP project sponsors to consider the transportation needs of Title VI population groups in comprehensive/master plans and at the project level in order to develop an equitable, sustainable transportation system for all.
Title VI Population Total RTP Project Miles
% of RTP Projects in Title VI Block Group
Location Low Income Block Groups 188.248 32% Minority Block Groups 150.4133 25% Senior Block Groups 289.4719 49% Limited English Proficiency Block Groups 149.0165 25%
Disability Block Groups 327.3962 55% Total projects 590.8761 -