Appendix D – Materials Characterisation Study
79
Appendix D - Materials Characterisation Study
Transcript of Appendix D – Materials Characterisation Study
Appendix D - Materials Characterisation Study

Error! No text of specified style in document.
i
Primary Gold Ltd
Materials Characterisation Study 28 September 2021

Table of Contents
ii
Table of Contents Section 1 Introduction – Rustlers Roost and Quest 29 Preliminary Geochemical Assessment .................................... 1
Section 2 Objective and Scope of Works .................................................................................................................. 4
Section 3 Geology and Mineralisation ...................................................................................................................... 5 3.1.1 Geology - Regional Setting (Pine Creek Inlier) ...................................................................................................................... 5
3.2 Local Geological Setting ..................................................................................................................................... 8 3.2.1 Rustlers Roost ....................................................................................................................................................................... 9 3.2.2 Quest 29 ............................................................................................................................................................................... 9
Section 4 Geochemical Characterisation – Previous Studies.................................................................................... 10
4.1 Mine Waste ...................................................................................................................................................... 11 4.1.1 Rustlers Roost ..................................................................................................................................................................... 11 4.1.2 Quest 29 ............................................................................................................................................................................. 11
4.2 Drill Programs ................................................................................................................................................... 12
4.3 Sample Limitations ........................................................................................................................................... 12
Section 5 Geochemical Assessment Approach ........................................................................................................ 13
5.1 Sample Selection .............................................................................................................................................. 13 5.1.1 Approach ............................................................................................................................................................................ 13 5.1.2 Rustlers Roost ..................................................................................................................................................................... 13 5.1.3 Quest 29 ............................................................................................................................................................................. 14
5.2 Phased Analytical Approach ............................................................................................................................. 15
5.3 Relevant Guidelines ......................................................................................................................................... 15
Section 6 Results - Rustlers Roost .......................................................................................................................... 16
6.1 Phase 1 Static Testing ....................................................................................................................................... 16 6.1.1 Paste pH .............................................................................................................................................................................. 16 6.1.2 Paste Electrical Conductivity ............................................................................................................................................... 17 6.1.3 Total Sulfur Content ........................................................................................................................................................... 18 6.1.4 Carbon ................................................................................................................................................................................ 21
6.2 Phase 2 – Static Testing (Rustlers Roost) ......................................................................................................... 22 6.2.1 Sulfur Speciation ................................................................................................................................................................. 22 6.2.2 Carbon Speciation ............................................................................................................................................................... 24
6.3 Net Acid Generation and Net Acid Production Potential (RR) ......................................................................... 26
6.4 Geochemical Classification (Rustlers Roost) .................................................................................................... 28
6.5 Multi Element Content (Rustlers Roost) .......................................................................................................... 30
6.6 Phase 3 Static Testing - Additional Characterisation (Rustlers Roost) ............................................................. 34
6.7 Acid Buffering Characterisation Curves............................................................................................................ 34
6.8 Kinetic NAG (Rustlers Roost) ............................................................................................................................ 35
6.9 Phase 4 Static Testing – Characterisation of NAG Liquors (Rustlers Roost) ..................................................... 35 6.9.1 NAG Liquor Analysis and Sample Selection ........................................................................................................................ 35 6.9.2 NAG Liquor pH and Electrical Conductivity ......................................................................................................................... 36

Table of Contents
iii
6.9.3 NAG Liquor Elemental Composition ................................................................................................................................... 36
6.10 Water Quality Prediction – Rustlers Roost ....................................................................................................... 38
6.11 Data Handling ................................................................................................................................................... 38
6.12 Preliminary Risk Assessment (RR) .................................................................................................................... 38
6.13 Phase 5 Static Testing - Mineralogy Results (Rustlers Roost) .......................................................................... 40
6.14 Life of Mine Tailings ......................................................................................................................................... 41 6.14.1 Tailings Sulfur Content ........................................................................................................................................................ 41 6.14.2 Tailings Carbon Content ..................................................................................................................................................... 41 6.14.3 Tailings Acid Base Accounting ............................................................................................................................................. 42 6.14.4 Tailings Cyanide Species ..................................................................................................................................................... 42
6.15 Rustlers Roost Discussion ................................................................................................................................. 43
Section 7 Results – Quest 29 .................................................................................................................................. 45
7.1 Phase 1 Static testing (Quest 29) ..................................................................................................................... 45 7.1.1 Paste pH and Electrical Conductivity .................................................................................................................................. 45 7.1.2 Total Sulfur Content (Quest 29) .......................................................................................................................................... 47 7.1.3 Total Carbon (Quest 29) ..................................................................................................................................................... 48
7.2 Phase 2 – Static Testing (Quest 29) .................................................................................................................. 50 7.2.1 Sulfur Speciation ................................................................................................................................................................. 50
7.3 Carbon Speciation (Quest 29) .......................................................................................................................... 51
7.4 Net Acid Generation and Net Acid Production Potential (Quest 29) ............................................................... 53
7.5 Geochemical Classification (Quest 29) ............................................................................................................. 54
7.6 Multi Element Content (Quest 29) ................................................................................................................... 56
7.7 Phase 3 Static Testing (Quest 29) ..................................................................................................................... 59
7.8 Phase 4 Static Testing – Characterisation of NAG Liquors (Quest 29) ............................................................. 59 7.8.1 NAG Liquor pH and Electrical Conductivity ......................................................................................................................... 59
7.9 NAG Liquor Composition (Quest 29) ................................................................................................................ 59 7.9.1 Cations ................................................................................................................................................................................ 59 7.9.2 Anions ................................................................................................................................................................................. 62
7.10 Water Quality Prediction (Quest 29) ................................................................................................................ 62
7.11 Preliminary Risk Assessment ............................................................................................................................ 62
7.12 Phase 5 Static Testing - Mineralogy Results (Quest 29) ................................................................................... 64
7.13 Ore.................................................................................................................................................................... 64
7.14 Discussion and Conclusions (Quest 29) ............................................................................................................ 65
Section 8 Naturally Occurring Radioactive Material ................................................................................................ 67
8.1 NORM Discussion ............................................................................................................................................. 69
Section 9 Overall Conclusions ................................................................................................................................ 70 Disclaimer and Limitations .................................................................................................................................................................... 72

Figures
iv
Figures Figure 1 Rustlers Roost Existing and Proposed Infrastructure ..................................................................................................... 2 Figure 2 Quest 29 Existing and Proposed Infrastructure .............................................................................................................. 3 Figure 3 Geological Map of Pine Creek Inlier (GA Online Resource, Geological Map sd5208 Pine Creek .................................... 6 Figure 4 Regional Stratigraphy from Ahmed 1998 ....................................................................................................................... 7 Figure 5 Archaean to Early Proterozic Stratigraphy and Lithological Descriptions (Geological Map Northern Territory
Geological Survey 1993) ................................................................................................................................................. 8 Figure 6 Paste pH - Fresh Zone – Rustlers Roost ........................................................................................................................ 16 Figure 7 Paste pH Oxide Zone – Rustlers Roost .......................................................................................................................... 17 Figure 8 Paste pH Transition Zone – Rustlers Roost ................................................................................................................... 17 Figure 9 Paste Electrical Conductivity, Fresh Zone – Rustlers Roost .......................................................................................... 17 Figure 10 Paste Electrical Conductivity, Oxide Zone – Rustlers Roost .......................................................................................... 18 Figure 11 Paste Electrical Conductivity, Transition Zone – Rustlers Roost ................................................................................... 18 Figure 12 Total Sulfur Content (S%) of all Samples – Rustlers Roost ............................................................................................ 19 Figure 13 Total Sulfur Content (%S) for all Lithologies with %S above LOR – Rustlers Roost ....................................................... 19 Figure 14 Total Sulfur (%S) Fresh Zone – Rustlers Roost .............................................................................................................. 20 Figure 15 Total Sulfur (%S) Oxide Zone – Rustlers Roost ............................................................................................................. 20 Figure 16 Total Sulfur (%S) Transition Zone – Rustlers Roost ....................................................................................................... 20 Figure 17 Total Carbon (%C) for Rustlers Roost Samples ............................................................................................................. 21 Figure 18 Total Carbon Content (%C) in Fresh Zone – Rustlers Roost .......................................................................................... 21 Figure 19 Total Carbon Content (%C) in Oxide Zone – Rustlers Roost ......................................................................................... 22 Figure 20 Total Carbon Content (%C) in Transition Zone – Rustlers Roost .................................................................................. 22 Figure 21 Geochemical Classification of Transition and Oxide Lithologies in Rustlers Roost ....................................................... 29 Figure 22 Geochemical Classification of Fresh Zone Lithologies of Rustlers Roost ...................................................................... 30 Figure 23 Trace Elemental Distribution in all Zones at Rustlers Roost ......................................................................................... 32 Figure 24 Distribution of Selected Trace Elements in Lithologies at Rustlers Roost .................................................................... 33 Figure 25 pH and Electrical Conductivity of NAG Liquors ............................................................................................................. 36 Figure 26 Elemental Composition of NAG Liquors (all concentrations are mg/L) ........................................................................ 37 Figure 27 Paste pH Values for the Oxide and Transition Zone – Quest 29 ................................................................................... 45 Figure 28 Paste pH Values for the Fresh Zone – Quest 29 ........................................................................................................... 46 Figure 29 Paste EC (mS/m) Values for the Oxide and Transition Zone – Quest 29 ...................................................................... 46 Figure 30 Paste EC Values in mS/m for the Fresh Zone – Quest 29 ............................................................................................. 47 Figure 31 Total sulfur (%S) in Oxide and Transition Zone Lithologies – Quest 29 ........................................................................ 47 Figure 32 Total sulfur (%) in Fresh Zone Lithologies of Quest 29 ................................................................................................. 48 Figure 33 Total carbon (%) Content of Oxide and Transition Zone Lithologies from Quest 29 .................................................... 49 Figure 34 Total Carbon (%) in Fresh Zone Lithologies from Quest 29 .......................................................................................... 49 Figure 35 Geochemical Classification of Lithologies in the Fresh Zone at Quest 29 .................................................................... 55 Figure 36 Geochemical Classification of Lithologies in the Oxide and Transition Zone of Quest 29 ............................................ 55 Figure 37 Average Trace Elemental Content Expressed as ppm for all Lithologies in all Weathering Zones ............................... 57 Figure 38 Average Elemental Concentrations (below 6000ppm) for all Weathering Zones ........................................................ 58 Figure 39 pH and Electrical Conductivity of NAG Liquors ............................................................................................................. 59 Figure 40 Elemental Signature in NAG Liquors from Quest 29 Samples ...................................................................................... 60 Figure 41 Trace Elemental Signature in NAG Liquors from Quest 29 Samples ............................................................................. 61

Tables
v
Tables Table 1 Rustlers Roost Pit Waste Volumes by Weathering Zone .............................................................................................. 11 Table 2 Quest 29 Pit Waste Volumes by Weathering Zone ...................................................................................................... 11 Table 3 Number of Samples Available for Analysis at Rustlers Roost ....................................................................................... 13 Table 4 Major Lithologies Present in Rustlers Roost Dataset .................................................................................................... 14 Table 5 Number of Samples Available from each Major Lithology and Number Selected for Analysis at Quest 29 ................. 14 Table 6 Phased Geochemical Assessment Approach – Initial Sample Numbers ....................................................................... 15 Table 7 Summary of Saturated Paste and Total Sulfur – Rustlers Roost ................................................................................... 16 Table 8 Sulfur Speciation Results; Acid Soluble Sulfur and Chromium Reducible Sulfur for Rustlers Roost ............................. 23 Table 9 Carbon Speciation – Rustlers Roost .............................................................................................................................. 25 Table 10 Net Acid Generation pH – Rustlers Roost ..................................................................................................................... 27 Table 11 Acid Generation Classification System ......................................................................................................................... 28 Table 12 Samples Selected for Further Acid Base Accounting .................................................................................................... 34 Table 13 Results of Acid Buffering Characterisation ................................................................................................................... 34 Table 14 Results of Kinetic NAG Testing ..................................................................................................................................... 35 Table 15 NAG Liqour Composition Screened Against ANZECC 2000 Freshwater Criteria ........................................................... 39 Table 16 Results of Mineralogical Assessment ........................................................................................................................... 40 Table 17 Results of Sulfur Speciation in Tailings ......................................................................................................................... 41 Table 18 Results of Carbon Speciation in Tailings ....................................................................................................................... 41 Table 19 Results of Paste, ANC and NAG Testing in Tailings ....................................................................................................... 42 Table 20 Results of Cyanide Species Testing in Tailings .............................................................................................................. 42 Table 21 Summary of Saturated Paste and Total Sulfur – Quest 29 ........................................................................................... 45 Table 22 Sulfur Speciation Results; Acid Soluble Sulfur and Chromium Reducible Sulfur for Quest 29...................................... 50 Table 23 Carbon Speciation – Quest 29 ...................................................................................................................................... 51 Table 24 Net Acid Generation pH – Quest 29 ............................................................................................................................ 53 Table 25 Quest 29 NAG Liquor Composition Screened Against ANZECC Freshwater Guidelines ............................................... 63 Table 26 X-ray Diffraction Results – Quest 29 Presented as Weight % ....................................................................................... 64 Table 27 Static Test Results for Ore Sample ............................................................................................................................... 64 Table 28 Uranium and Thorium Content of Waste, Ore and Tailings for Rustlers Roost and Quest 29 ..................................... 67 Table 29 Total Activities of each Lithology, Ore and Tailings for Rustlers Roost and Quest 29 ................................................. 68
Appendices Appendix A – Disclaimer and Limitations ............................................................................................................... 71

vi
Document History & Status Revision Date issued Reviewed by Approved by Date approved Revision type
Rev. A 24/09/2021 R. Olson R. Olson 24/09/2021 Draft
Rev. 0 26/09/2021 R. Olson P. Davey 28/09/2021 Final
Distribution of Copies Version Date issued Quantity Electronic Issued to
Draft 20/09/2021 01 Word and PDF Primary Gold
Final 28/09/2021 01 PDF Primary Gold
Last Saved: 29 September 2021
File Name: Appendix D-Materials Characterisation Study_final_27092021
Author: Karen MacKenzie
Technical Reviewer: Roger Olsen
Project Manager: Paul Davey
Client: Primary Gold Ltd
Document Title: Appendix D – Materials Characterisation Study
Document Version: Final
Project Number: 1001087

Appendix D – Materials Characterisation Study
1
Section 1 Introduction – Rustlers Roost and Quest 29 Preliminary Geochemical Assessment
The Rustlers Roost and Quest 29 Open-cut Mine Redevelopment (herein referred to as the Project) will involve open-cut mining with the expansion of all existing open-cut pits and the development to two new smaller pits at Rustlers Roost. Primary Gold Limited (PGO) is the proponent of the mine redevelopment. The mine sites are located approximately 11 km apart and are connected by an existing unsealed access track, which will be upgraded to accommodate haulage of ore from the Quest 29 satellite pits to Rustlers Roost processing facility. Ore mined at both sites will be processed at a new purpose-built processing facility located at the Rustlers Roost site to produce gold bullion. The rate of production will be up to 5 Mtpa over an approximately ten-year life-of-mine (LOM).
Waste rock will be deposited in surface waste rock dumps (WRDs) and will be used to backfill a number of pits where mine scheduling permits. At Quest 29, a new surface WRD is proposed for mining of the first pit (Zamu), with the waste material from the four consecutive pits to be backfilled into Zamu pit and a portion of oxide material used for rehabilitation of the decommissioned heap leach facility. At Rustlers Roost, the majority of the waste rock material will be deposited within two surface WRDs (located partially over the historic WRD to the north-west of the main pit) and a portion backfilled into the two new minor pits (Annie’s Dam pit and Annie’s Oakley pit) (refer to Figure 1 and Figure 2).
Mined ore will be processed using a Carbon in Leach (CIL) processing method, which extracts gold from the ore by mixing with a cyanide solution. Tailings produced from the processing facility will be deposited in a Tailings Storage Facility (TSF) to be constructed as part of the Project.
The mining methodology will be consistent over Rustlers Roost and Quest 29, with the open-cut mining operation being conducted with conventional truck and shovel methods. Mining of Rustlers Roost and Quest 29 will be undertaken concurrently with each site having their own mining fleet.
Mined ore from each of the Quest 29 pits will be placed on the surface crest of the pit where it will be loaded into a haul truck and transported to the Rustlers Roost ROM for processing (refer to Figure 1).

Appendix D – Materials Characterisation Study
2
Figure 1 Rustlers Roost Existing and Proposed Infrastructure

Appendix D – Materials Characterisation Study
3
Figure 2 Quest 29 Existing and Proposed Infrastructure
Appendix D – Materials Characterisation Study
4
Section 2 Objective and Scope of Works
The objective of this assessment is to consider the risk of acid and/or metalliferous drainage (AMD) generation from mining associated with the Project within the Pine Creek Inlier (Rustlers Roost and Quest 29).
In order to inform the risks and management measures necessary for the Project Environmental Impact Statement (EIS) to following scope has been completed:
Task 1 - Desktop study: Review the available geological, hydrogeological and exploration information (drill hole assay data base, block model (descriptors of lithologies combined for each geozone) and cross-sectional outputs based on sulfur) for Quest 29 and any additional information of Rustlers Roost as an initial assessment for potential acid rock drainage issues for the two areas of interest; and
Task 2 - Complete a Static Geochemical Assessment: The static program was costed for a total of 150 samples collected from available drill core from Rustlers Roost and Quest 29. Rustlers Roost sampling was completed on historical drill core pulps, while Quest 29 sampling was completed on cores raised during the 2020 drilling program;
Task 3 - Complete a Kinetic Geochemical Assessment: A kinetic column program is currently underway. Ten columns containing waste, low grade ore, ore and tailings have progressed to month 5 of the possible 12-month schedule. The results of this program are not part of this report but will be issued as an addendum once a minimum of 6 months of data have been received and interpreted.
Appendix D – Materials Characterisation Study
5
Section 3 Geology and Mineralisation
A detailed summary of the geology, soils, stream sediments, climate and hydrogeology has been provided previously by CDM Smith (CDM Smith 20191). The following is a short summary of the geology and mineralisation of the region to support interpretation of the geochemical results.
3.1.1 Geology - Regional Setting (Pine Creek Inlier)
The Pine Creek inlier can be divided into five sub-regions: Lichfield Province, Rum Jungle Region, Central Region, South Alligator Valley and Alligator River (Ahmed 19981).
Pine Creek is a metamorphosed and deformed Palaeoproterozoic sequence of pellites and psammites (silty and sandy sediments), with minor carbonate sediments and volcanics. Dolerite sills intruded into the region (Zamu Dolerite and equivalents) before the metamorphism and deformation (Ahmed 19981).
During the regional deformation and metamorphism, the lithologies were tightly folded and faulted, metamorphic grades range from sub-greenschist facies (Lichfield Province) to upper Amphibolite facies (western Lichfield Province to eastern Alligator River). A series of younger granites cut through the Proterozoic metamorphic sequence (refer to Figure 3 below, Ahmed 19982).
The mineral deposits are predominantly found within the central region where the granitoids dominate the geology.
The Pine Creek Inlier gold deposits have been into three groups; gold-quartz vein, stratiform gold lenses in iron rich sediments and stratabound zinc-lead-copper-gold-silver lenses (Ahmed et al., 19933).
1 CDM Smith, 2019. Desktop Geochemical Assessment of the Rustlers Roost deposit. Report prepared for Primary Gold. April 2019. 2 Ahmed M., 1998, Geology and Mineral Deposits of the Pine Creek Inlier and McArthur Basin, Northern Territory. AGSO Journal of Australian Geology and Geophysics, 17(3), 1-17. 3 Ahmed, M., Wygralak, A.S., Ferenczi, P.A. and Bajwah, Z.U. 1993, 1:250 000 Metallogenic Map Series, Pine Creek, Northern Territory Geological Survey, Explanatory Notes, SD52-8.

Appendix D – Materials Characterisation Study
6
Figure 3 Geological Map of Pine Creek Inlier (GA Online Resource, Geological Map sd5208 Pine Creek

Appendix D – Materials Characterisation Study
7
Figure 4 Regional Stratigraphy from Ahmed 1998

Appendix D – Materials Characterisation Study
8
3.2 Local Geological Setting
Locally, the geology is described as highly weathered, thus the mining operations in the region have predominantly developed oxide ore. However, a substantial amount of transitional and sulfide mineralisation occurs beneath the oxide ore.
Figure 5 Archaean to Early Proterozic Stratigraphy and Lithological Descriptions (Geological Map Northern Territory Geological Survey 1993)
Appendix D – Materials Characterisation Study
9
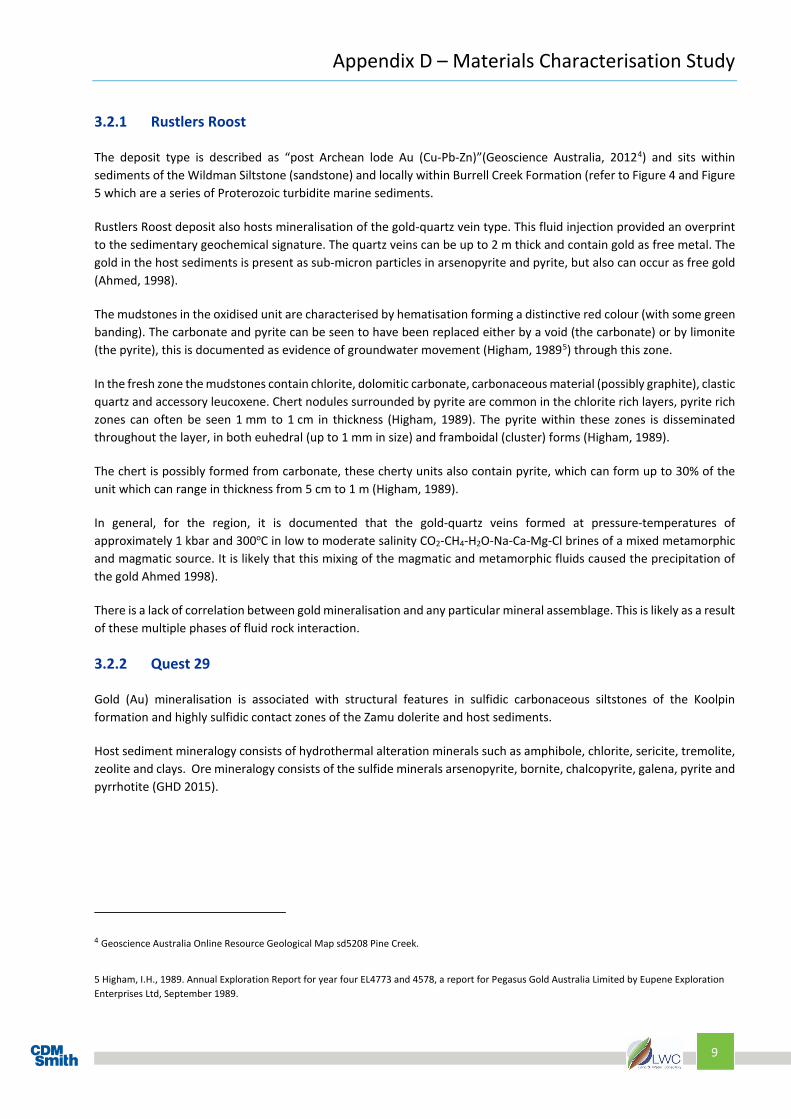
3.2.1 Rustlers Roost
The deposit type is described as “post Archean lode Au (Cu-Pb-Zn)”(Geoscience Australia, 20124) and sits within sediments of the Wildman Siltstone (sandstone) and locally within Burrell Creek Formation (refer to Figure 4 and Figure 5 which are a series of Proterozoic turbidite marine sediments.
Rustlers Roost deposit also hosts mineralisation of the gold-quartz vein type. This fluid injection provided an overprint to the sedimentary geochemical signature. The quartz veins can be up to 2 m thick and contain gold as free metal. The gold in the host sediments is present as sub-micron particles in arsenopyrite and pyrite, but also can occur as free gold (Ahmed, 1998).
The mudstones in the oxidised unit are characterised by hematisation forming a distinctive red colour (with some green banding). The carbonate and pyrite can be seen to have been replaced either by a void (the carbonate) or by limonite (the pyrite), this is documented as evidence of groundwater movement (Higham, 19895) through this zone.
In the fresh zone the mudstones contain chlorite, dolomitic carbonate, carbonaceous material (possibly graphite), clastic quartz and accessory leucoxene. Chert nodules surrounded by pyrite are common in the chlorite rich layers, pyrite rich zones can often be seen 1 mm to 1 cm in thickness (Higham, 1989). The pyrite within these zones is disseminated throughout the layer, in both euhedral (up to 1 mm in size) and framboidal (cluster) forms (Higham, 1989).
The chert is possibly formed from carbonate, these cherty units also contain pyrite, which can form up to 30% of the unit which can range in thickness from 5 cm to 1 m (Higham, 1989).
In general, for the region, it is documented that the gold-quartz veins formed at pressure-temperatures of approximately 1 kbar and 300oC in low to moderate salinity CO2-CH4-H2O-Na-Ca-Mg-Cl brines of a mixed metamorphic and magmatic source. It is likely that this mixing of the magmatic and metamorphic fluids caused the precipitation of the gold Ahmed 1998).
There is a lack of correlation between gold mineralisation and any particular mineral assemblage. This is likely as a result of these multiple phases of fluid rock interaction.
3.2.2 Quest 29
Gold (Au) mineralisation is associated with structural features in sulfidic carbonaceous siltstones of the Koolpin formation and highly sulfidic contact zones of the Zamu dolerite and host sediments.
Host sediment mineralogy consists of hydrothermal alteration minerals such as amphibole, chlorite, sericite, tremolite, zeolite and clays. Ore mineralogy consists of the sulfide minerals arsenopyrite, bornite, chalcopyrite, galena, pyrite and pyrrhotite (GHD 2015).
4 Geoscience Australia Online Resource Geological Map sd5208 Pine Creek.
5 Higham, I.H., 1989. Annual Exploration Report for year four EL4773 and 4578, a report for Pegasus Gold Australia Limited by Eupene Exploration Enterprises Ltd, September 1989.
Appendix D – Materials Characterisation Study
10
Section 4 Geochemical Characterisation – Previous Studies
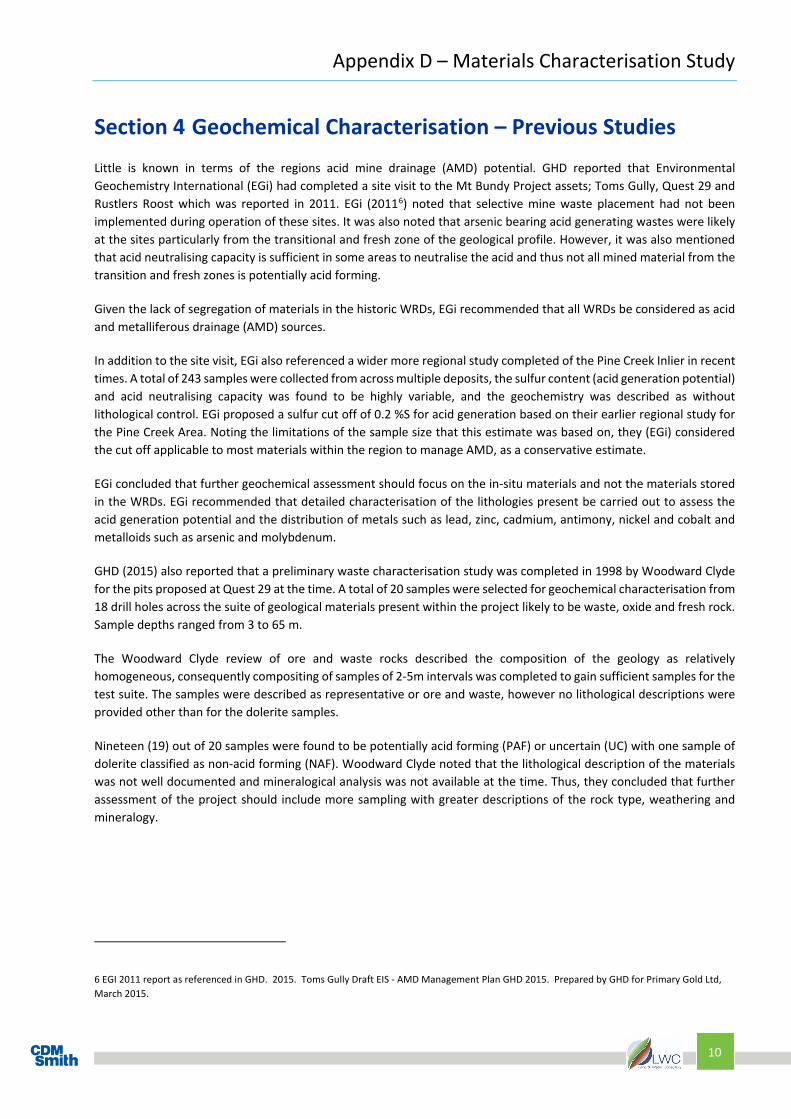
Little is known in terms of the regions acid mine drainage (AMD) potential. GHD reported that Environmental Geochemistry International (EGi) had completed a site visit to the Mt Bundy Project assets; Toms Gully, Quest 29 and Rustlers Roost which was reported in 2011. EGi (20116) noted that selective mine waste placement had not been implemented during operation of these sites. It was also noted that arsenic bearing acid generating wastes were likely at the sites particularly from the transitional and fresh zone of the geological profile. However, it was also mentioned that acid neutralising capacity is sufficient in some areas to neutralise the acid and thus not all mined material from the transition and fresh zones is potentially acid forming.
Given the lack of segregation of materials in the historic WRDs, EGi recommended that all WRDs be considered as acid and metalliferous drainage (AMD) sources.
In addition to the site visit, EGi also referenced a wider more regional study completed of the Pine Creek Inlier in recent times. A total of 243 samples were collected from across multiple deposits, the sulfur content (acid generation potential) and acid neutralising capacity was found to be highly variable, and the geochemistry was described as without lithological control. EGi proposed a sulfur cut off of 0.2 %S for acid generation based on their earlier regional study for the Pine Creek Area. Noting the limitations of the sample size that this estimate was based on, they (EGi) considered the cut off applicable to most materials within the region to manage AMD, as a conservative estimate.
EGi concluded that further geochemical assessment should focus on the in-situ materials and not the materials stored in the WRDs. EGi recommended that detailed characterisation of the lithologies present be carried out to assess the acid generation potential and the distribution of metals such as lead, zinc, cadmium, antimony, nickel and cobalt and metalloids such as arsenic and molybdenum.
GHD (2015) also reported that a preliminary waste characterisation study was completed in 1998 by Woodward Clyde for the pits proposed at Quest 29 at the time. A total of 20 samples were selected for geochemical characterisation from 18 drill holes across the suite of geological materials present within the project likely to be waste, oxide and fresh rock. Sample depths ranged from 3 to 65 m.
The Woodward Clyde review of ore and waste rocks described the composition of the geology as relatively homogeneous, consequently compositing of samples of 2-5m intervals was completed to gain sufficient samples for the test suite. The samples were described as representative or ore and waste, however no lithological descriptions were provided other than for the dolerite samples.
Nineteen (19) out of 20 samples were found to be potentially acid forming (PAF) or uncertain (UC) with one sample of dolerite classified as non-acid forming (NAF). Woodward Clyde noted that the lithological description of the materials was not well documented and mineralogical analysis was not available at the time. Thus, they concluded that further assessment of the project should include more sampling with greater descriptions of the rock type, weathering and mineralogy.
6 EGI 2011 report as referenced in GHD. 2015. Toms Gully Draft EIS - AMD Management Plan GHD 2015. Prepared by GHD for Primary Gold Ltd, March 2015.

Appendix D – Materials Characterisation Study
11
4.1 Mine Waste
4.1.1 Rustlers Roost
A total of 56.4 Mt of waste material will be produced from Rustlers Roost pits (Table 1). A large portion of this waste material will be oxide zone materials (37%) and fresh zone materials (47%) (Table 1). Most of the waste will be placed within the two proposed surface WRDs, with the southern WRD being partially located over the historic WRD. A total of 5.36 Mt will be back filled into the mined pits.
Table 1 Rustlers Roost Pit Waste Volumes by Weathering Zone
Waste Zone M Tonnes
Oxide 20.7
Transitional 9.0
Fresh 26.7
Total waste 56.4
The final WRD designs will be developed following geochemical characterisation of waste material. Graeme Campbell and Associates undertook a material characterisation program as part of the 1997 Public Environmental Review (PER) for stage 2 development. All fresh material was determined to be PAF and transitional material was a mixture of NAF and PAF. This current geochemical assessment of the materials available from the recent drilling program has been undertaken to further characterise the geochemistry of each of the main lithologies, with a particular focus on those in the transitional zone.
4.1.2 Quest 29
Total waste produced from Quest 29 is 12.1 Mt. Approximately 38% of waste material from Quest 29 will be oxide, 23% transitional and 39% fresh (Table 2).
Table 2 Quest 29 Pit Waste Volumes by Weathering Zone
Waste Zone M Tonnes
Oxide 4.6
Transitional 2.8
Fresh 4.7
Total waste 12.1
A total of 4.39 Mt of waste from Zamu pit will be placed on the surface (just north of the Zamu pit) to create a new WRD. The WRD construction will commence with the placement of NAF material for the base and outer annulus. PAF material encountered will be placed onto of the NAF base, encapsulated within the centre of the WRD. No PAF material will be placed on outer perimeter, slopes, toe, surface or base of the dump.
The balance of waste material from mining will either be backfilled within Zamu pit or NAF material used to rehabilitate the decommissioned heap leach facility.
Appendix D – Materials Characterisation Study
12
4.2 Drill Programs
The most recent drill program at Rustlers Roost was completed in 2018. For Quest 29, PGO completed their drill program in late 2020. Rock samples (pulps, chips and core) were available for the preliminary geochemical assessment.
Cross-sections depicting the location of each drillhole were provided which were annotated by PGO. For Rustlers Roost, waste and ore zones were depicted with the proposed pit design.
For Quest 29, the cross-sections provided an indication of the location of the drill hole and the proposed pit shell outline. One drill hole per pit was available for sampling, with the exception of the two new small pits at Rustlers Roost.
Assay data was also provided for both deposits for these recent drill programs. Most samples were analysed for their gold (Au) content only.
As presented above, at each deposit three weathering zones exist. Sample selection was designed to select samples from each geological unit present in the data set, across each weathering zone while providing as best a spatial distribution as the sample set allowed.
4.3 Sample Limitations
For both deposits, the samples available for geochemical assessment are derived from drill programs designed to provide information for the areas designated for the proposed pit expansions.

Appendix D – Materials Characterisation Study
13
Section 5 Geochemical Assessment Approach
Our iterative geochemical assessment approach drew upon the results of each phase of assessment to build a body of evidence of the geochemical nature of each material type (lithology).
This staged approach was one where the geological description drove the initial sample selection, with 30-50% of the samples selected for each subsequent phase of testing with a goal of selecting units for kinetic testing.
The static program was designed to support the material characterisation for full acid base accounting (ABA) analysis suite and elemental concentrations enabling classification for the potential for acid drainage (AD), saline drainage (SD) and neutral metalliferous drainage (NMD).
5.1 Sample Selection
5.1.1 Approach
Sampling has been undertaken from the pulps remaining from exploration assays. For Rustlers Roost these samples are those in storage from the 2018 drill program, material from nine drill holes were available for testing. At Quest 29, samples were selected from six drill holes undertaken during the 2020 drill program which targeted the waste units within the proposed expanded pits.
The sampling program was designed to sample all major lithologies described in the available data, with coverage of all weathering zones while providing as great a spatial distribution as possible.
The samples were selected from the assay database. This data set contained the hold identification (i.d.), sample i.d., gold concentration and also provided some indication of the sulfide mineralogy present.
5.1.2 Rustlers Roost
A total of 2,154 samples were listed in the assay database. Of these samples, 180 samples had insufficient mass remaining for further testing. A number of lithologies were poorly represented in the data set. The majority of the samples available were from the fresh zone (Table 3).
Table 3 Number of Samples Available for Analysis at Rustlers Roost Total No. Pulp Samples Listed Weathering Zone No. Pulps
2154 Fresh 1465 Transition 144 Oxide 445
The major lithologies (those present as greater than 2% of drill hole length in the data set) were identified, reducing the number of samples to select from to a total of 2001 pulp samples.

Appendix D – Materials Characterisation Study
14
The number of samples selected for each major lithology in each weathering zone is presented in Table 4.
Table 4 Major Lithologies Present in Rustlers Roost Dataset Weathering Zone
Pct Psh Psl Pst Rsl Scs Ss Total
Lithology Possible Chert
Shale Siltstone Sandstone Lower Saprolite
Cherty Shale
Shale
Oxide 150 40 31 46 159 426 Transition 1 13 44 2 1 83 144
Fresh 229 313 65 3 821 1431 Total No. Samples Selected
1
23
32
5
2
1
67
131
Where Sulfur data was not available, the visible presence of pyrite logged was used as an indicator for sample selection.
A total of 80 samples were recommended for analysis from the transition zone, eight from the oxide zone and 43 from the fresh zone. Samples were selected from each lithology and each core where that lithology was recorded to provide as best a spatial representation as possible.
It is noted that the pulps remaining for Rustlers Roost under-represents the transitional zone as the samples for the transitional zone were only available for a limited area of the proposed pit.
Some samples of shale could not be found and thus were replaced by samples directly above or below the selected interval. This led to cherty shale (Scs) being introduced to the list of lithologies tested.
5.1.3 Quest 29
A total of 773 pulp samples were available for the study from nine drill holes. Assay for gold (Au) had been completed on the pulps at 1 m intervals for all nine drill holes. A total of 664 samples from the sample set had a gold concentration of less than or equal to 0.3% Au and thus would be considered waste. The majority of the gold is hosted within the units Pdz (dolerite), Psh (shale), Pst (sandstone), Sbs (black shale) and Vq (vein quartz).
Sulfur (S) data was not available, thus, as for Rustlers Roost, the visible presence of sulfide in the log was used as an indicator for sample selection. Sulfide was reported in 403 samples logged as pyrite, py (389), pyrrhotite, po (3) and arsenopyrite, ap (11).
There are seven main lithologies within the Quest 29 sample set (lithologies which have less than 12 samples in total in the sample set have been omitted) (Table 5). Noting the ore unit Vq is not included, given its minor presence in the logged core. All other ore lithologies are included.
Table 5 Number of Samples Available from each Major Lithology and Number Selected for Analysis at Quest 29
Weathering Zone Psh Rc Rsr Pst Pdz Psl Sbs Total
Lithology Shale Clay Saprock Sandstone Dolerite Siltstone Black Shale
Oxide 1 40 16 21 78 Transition 11 32 11 18 1 3 76
Fresh 17 34 191 44 198 480 Samples Selected 5 4 8 7 16 4 16 60

Appendix D – Materials Characterisation Study
15
A minimum of three samples per lithology were selected, with one from each weathering zone where possible. Where possible, samples were selected from the top and bottom of the unit thickness to assist with delineation of any PAF, UC and NAF zones.
The gave a total of 60 samples to be selected for geochemical analysis comprising oxide (13), transition zone (10) and fresh (37). As far as possible the selected samples were located within the pit shell outline provided.
5.2 Phased Analytical Approach A phased approach has been adopted for implementation of the geochemical assessment as presented in Table 6. The initial batch of 191 samples were selected for phase 1 of the analytical program, the number of samples moving through to each subsequent phase is indicative only, the final numbers selected were based on the interpretation of results from the preceding phase. Thus, the final number moving through to each phase are presented and discussed in each relevant results section.
Table 6 Phased Geochemical Assessment Approach – Initial Sample Numbers
Phase of Testing Analytical Suite No. of Samples
1 Paste pH, paste EC and total sulfur and total carbon 191
2
Acid base accounting - • Net acid generation – NAG, single addition • Acid neutralising capacity – ANC • Calculation of net acid production potential, NAPP and maximum potential acidity,
MPA from total S • Multi elemental determination via four acid digest
50
3 Kinetic NAG and Acid buffering characterisation curves (ABCC) 50
4 Mineralogy – quantitative x-ray diffraction 20
5
Batch leach test program in de-ionised (DI) water Sequential 18 hr bottle roll at low liquid solid ratio (2:1) (5 steps) Assessment of leachates for a broad suite of components Note that that if no readily soluble materials are present this DI program can be replaced by a sequential NAG and liquor characterisation program to assess the drainage composition from the oxidation of fresh materials.
20 samples
100 leachates
5.3 Relevant Guidelines The scope of works has been developed with consideration to the following guidelines:
AMIRA (2002). ARD Test Handbook. Project P387A Prediction and kinetic control of acid mine drainage;
Department of Foreign Affairs and Trade (DFAT) and Department of Industry Innovation and Science (2016). Leading Practice Sustainable Development Program for the Mining Industry: Preventing Acid and Metalliferous Drainage. Canberra;
The International Network for Acid Prevention (INAP) (2009). Global Acid Rock Drainage Guide. Online resource;
NT Environment Protection Authority (2013). Environmental Assessment Guidelines: Acid and Metalliferous Drainage. Version 2.0; and
ANZECC/ARMCANZ 2018 Water quality guidelines.

Appendix D – Materials Characterisation Study
16
Section 6 Results - Rustlers Roost
6.1 Phase 1 Static Testing
The analyses used to screen the samples for their potential to generate acid are paste pH, paste electrical conductivity and total sulfur (S %) results. Table 7 provides a summary of the data received for the Rustlers Roost deposit.
Table 7 Summary of Saturated Paste and Total Sulfur – Rustlers Roost
Paste pH Paste EC µS/cm S % Max 9.6 1180 2.55 Min 4.5 38 0.01 (LOR) Average 7.2 183 0.336
Of the 131 samples analysed, 61 samples had measured S% below the limit of reporting (LOR) (0.01% S).
The following depicts these data in more detail. Box and whisker plots have been created which display the maximum and minimum values recorded (these are joined to form the vertical whisker), 25th and 75th percentiles are calculated which are represented by the top and bottom extent of the box which represents the interquartile range (IQR). The mean is represented by the line within the IQR, the median value of the data is represented by a cross (x).
Using the box and whisker presentation of these data, one can clearly determine whether there is a significant difference between the lithologies. If the IQR overlap, one can say that there is not a significant difference between the results.
6.1.1 Paste pH
Samples display a varied paste pH ranging from 4.5 to 9.6 (Figure 6, Figure 7 and Figure 8). The shale (Psh) in the transition zone had the lowest pH (with a pH value of 4.5).
Figure 6 Paste pH - Fresh Zone – Rustlers Roost

Appendix D – Materials Characterisation Study
17
Figure 7 Paste pH Oxide Zone – Rustlers Roost
Figure 8 Paste pH Transition Zone – Rustlers Roost
6.1.2 Paste Electrical Conductivity
The samples displayed a varied range of EC values from fresh (38-500 µS/cm) to brackish (500 µS/cm -1180 µS/cm) (Figure 9, Figure 10 and Figure 11).
Figure 9 Paste Electrical Conductivity, Fresh Zone – Rustlers Roost

Appendix D – Materials Characterisation Study
18
Figure 10 Paste Electrical Conductivity, Oxide Zone – Rustlers Roost
Figure 11 Paste Electrical Conductivity, Transition Zone – Rustlers Roost
It is clear that the transition zone lithologies (Figure 11) produce the highest paste EC values and also the greatest range of EC values of the sample set.
6.1.3 Total Sulfur Content
Total sulfur content of all selected samples was measured via the LECO combustion method. Figure 12 depicts the range of sulfur concentrations (as %S) measured in all samples, samples reporting sulfur below the LOR have been included with the value at the LOR (0.01 %S).

Appendix D – Materials Characterisation Study
19
Figure 12 Total Sulfur Content (S%) of all Samples – Rustlers Roost
Figure 13 Total Sulfur Content (%S) for all Lithologies with %S above LOR – Rustlers Roost
When one compares Figure 12 with Figure 13, it is noted that the unit Rsl has no sample with a measured total sulfur concentration above LOR. Thus, although the two samples of this lithology had relatively low paste pH (below pH 6), this is not due to the presence of sulfur.
Based on these results, the unit Rsl was removed from further assessment.
A comparison of the measured sulfur contents of each lithology within each weathering zone has been undertaken to determine whether there is evidence of a relative sulfur depletion/enrichment for each zone. Figure 14, Figure 15 and Figure 16 present the results of this comparison.

Appendix D – Materials Characterisation Study
20
Figure 14 Total Sulfur (%S) Fresh Zone – Rustlers Roost
Figure 15 Total Sulfur (%S) Oxide Zone – Rustlers Roost
Figure 16 Total Sulfur (%S) Transition Zone – Rustlers Roost

Appendix D – Materials Characterisation Study
21
The highest sulfur values in the sample set are located in shales (Psh and Ss) within the transition zone. The fresh zone has a relatively low sulfur content for all lithologies and the oxide lithologies are also generally low in sulfur.
The sulfur in the shales may have two forms; disseminated fine sulfides with sulfur contents of less than 1%S, and larger sulfide crystals, the larger crystals may represent the outliers in the data set. For example, in shale, Ss, in the oxide zone one sample was measured as containing 0.28%S, an order of magnitude higher than the remaining samples in the data set.
6.1.4 Carbon
Total carbon content of all samples was measured as %C, via the LECO combustion method, LOR was 0.1%C.
Figure 17 Total Carbon (%C) for Rustlers Roost Samples
Total carbon content of the samples was had values below the LOR (0.1% C) to a maximum of 2.27%. Figure 17 depicts the total carbon content of all samples assessed, where values were reported below LOR, these are graphed as LOR.
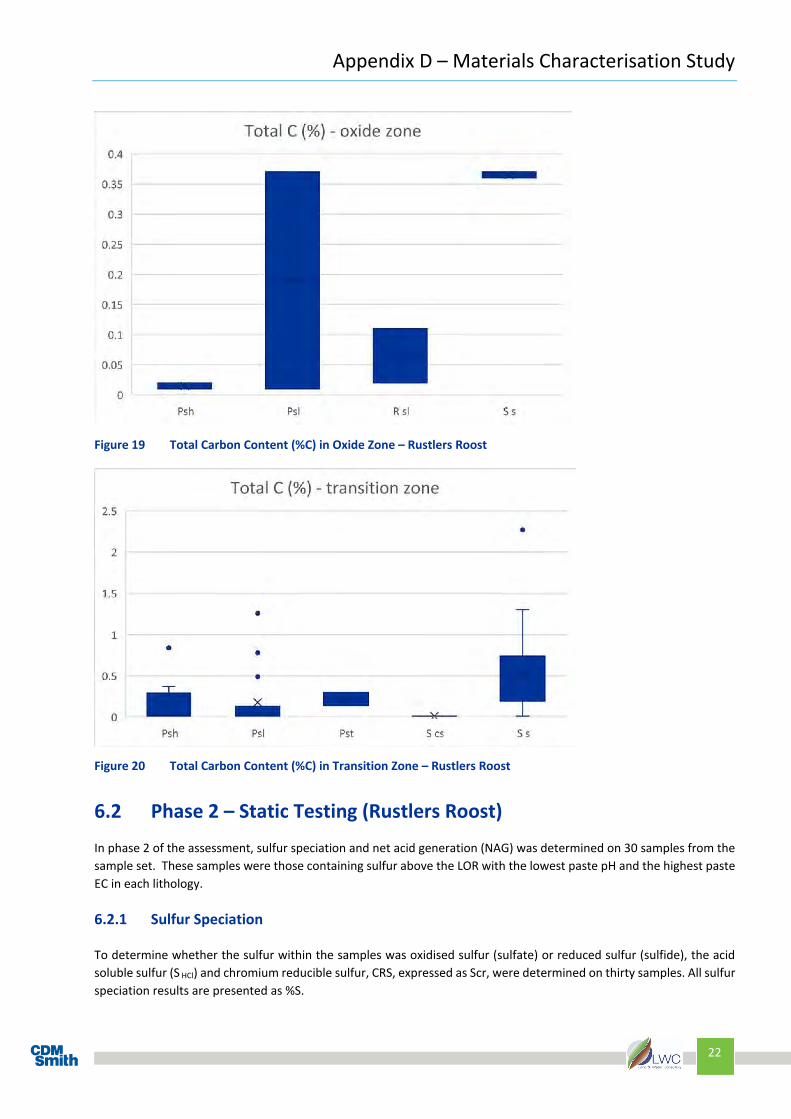
As completed for sulfur, a comparison of the carbon content of each major lithology within each weathering zone was completed. The results demonstrate that the transition zone samples host the highest carbon content of the sample set (Figure 20), the higher carbon values appear to generally be outliers given the majority of results are below 0.5%C in all weathering zones for all lithologies (Figure 18, Figure 19 and Figure 20).
Figure 18 Total Carbon Content (%C) in Fresh Zone – Rustlers Roost
Appendix D – Materials Characterisation Study
22
Figure 19 Total Carbon Content (%C) in Oxide Zone – Rustlers Roost
Figure 20 Total Carbon Content (%C) in Transition Zone – Rustlers Roost
6.2 Phase 2 – Static Testing (Rustlers Roost)
In phase 2 of the assessment, sulfur speciation and net acid generation (NAG) was determined on 30 samples from the sample set. These samples were those containing sulfur above the LOR with the lowest paste pH and the highest paste EC in each lithology.
6.2.1 Sulfur Speciation
To determine whether the sulfur within the samples was oxidised sulfur (sulfate) or reduced sulfur (sulfide), the acid soluble sulfur (S HCl) and chromium reducible sulfur, CRS, expressed as Scr, were determined on thirty samples. All sulfur speciation results are presented as %S.
Appendix D – Materials Characterisation Study
23
Acid soluble sulfate, SHCl, recovers soluble and exchangeable sulfate, sulfate from gypsum and a large proportion of the relatively insoluble iron and aluminium hydroxy sulfate compounds (for example jarosite, natrojarosite, schwertmannite). It also will allow the measured measurement of the concentration of some sulfur from organic matter, but not pyrite sulfur.
Chromium reducible sulfur determines the sulfide sulfur (Scr) content, without interference from organic sulfur.
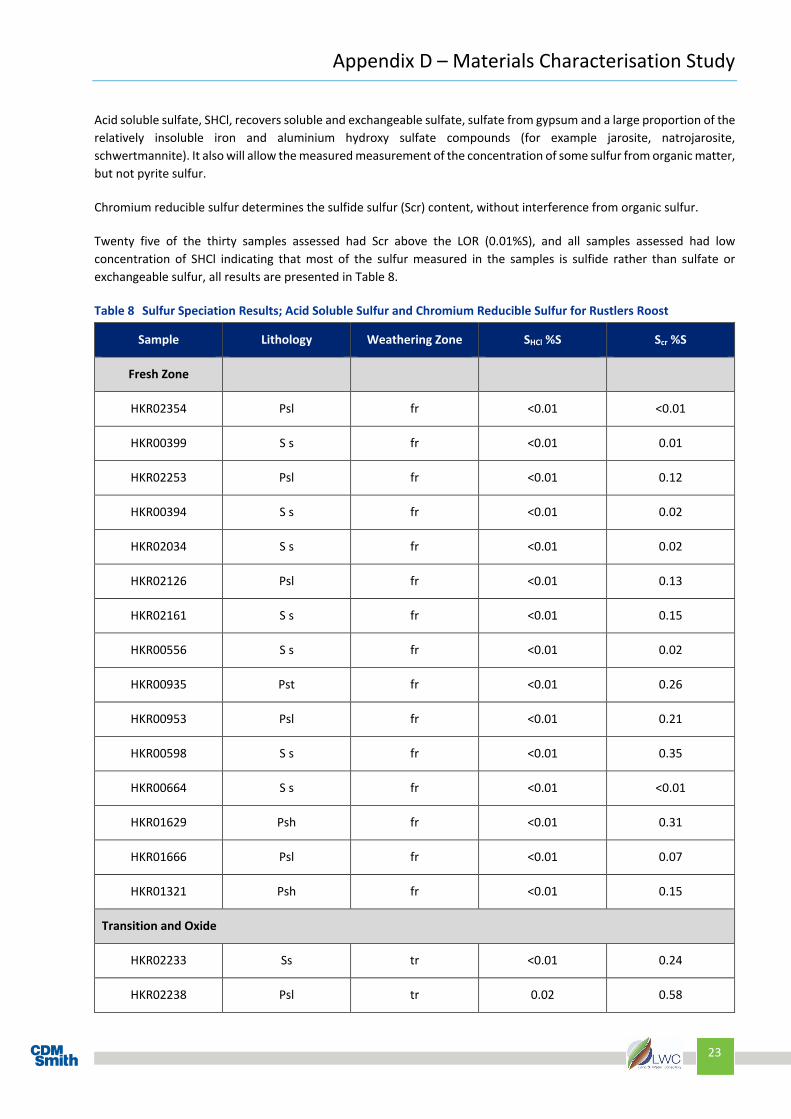
Twenty five of the thirty samples assessed had Scr above the LOR (0.01%S), and all samples assessed had low concentration of SHCl indicating that most of the sulfur measured in the samples is sulfide rather than sulfate or exchangeable sulfur, all results are presented in Table 8.
Table 8 Sulfur Speciation Results; Acid Soluble Sulfur and Chromium Reducible Sulfur for Rustlers Roost
Sample Lithology Weathering Zone SHCl %S Scr %S
Fresh Zone
HKR02354 Psl fr <0.01 <0.01
HKR00399 S s fr <0.01 0.01
HKR02253 Psl fr <0.01 0.12
HKR00394 S s fr <0.01 0.02
HKR02034 S s fr <0.01 0.02
HKR02126 Psl fr <0.01 0.13
HKR02161 S s fr <0.01 0.15
HKR00556 S s fr <0.01 0.02
HKR00935 Pst fr <0.01 0.26
HKR00953 Psl fr <0.01 0.21
HKR00598 S s fr <0.01 0.35
HKR00664 S s fr <0.01 <0.01
HKR01629 Psh fr <0.01 0.31
HKR01666 Psl fr <0.01 0.07
HKR01321 Psh fr <0.01 0.15
Transition and Oxide
HKR02233 Ss tr <0.01 0.24
HKR02238 Psl tr 0.02 0.58

Appendix D – Materials Characterisation Study
24
Sample Lithology Weathering Zone SHCl %S Scr %S
HKR00007 S s tr <0.01 0.01
HKR00009 S s tr <0.01 <0.01
HKR00879 Psl tr <0.01 <0.01
HKR00681 Psh tr 0.04 0.73
HKR00684 Psh tr 0.09 1.3
HKR00687 Psh tr 0.06 0.83
HKR00695 Psh tr 0.02 0.32
HKR00696 Psh tr 0.04 0.86
HKR00697 Psh tr 0.04 0.74
HKR01141 Psl ox <0.01 <0.01
HKR01147 Psh tr 0.02 0.30
HKR01148 Psh tr 0.02 0.32
HKR01154 Psl tr <0.01 0.06
6.2.2 Carbon Speciation
To determine the proportion of carbon present as organic carbon, the total organic carbon (TOC) content was determined through acid digest of the sample followed by analysis of the residue by LECO combustion method. The inorganic carbon content is the Total Carbon (TC) value minus the TOC content.
Acid neutralising capacity (ANC) was also determined via the modified Sobek7 method (as referenced in AMIRA 20028). The Sobek method uses a known volume of hot hydrochloric acid to digest an accurately weighed sample of soil or rock. Sufficient time is allowed for the sample to react, then the resultant liquor is back titrated with sodium hydroxide to determine the amount of unreacted hydrochloric acid. The amount of acid consumed is then calculated and expressed as equivalents of sulfuric acid per unit mass of sample (kg H2SO4/t). If the sample has little acid neutralising capacity it will not react with the hot acid, or only has acid generating capacity, there will be an excess of acid in the final liquor. Both these situations will produce a low to below detection ANC result. If the sample has a mineral which reacts with the hydrochloric acid, this is measured as ANC.
The results are presented per lithology in each weathering zone in Table 9.
7 Sobek AA Schuller WA, Freeman JR and Smith RM, 1978. Field and Laboratory Methods Applicable to Overburdens and Mine Soils, EPA-600/2-78-054, pp 47-50.
8 AMIRA (2002). ARD Test Handbook. Project P387A Prediction and kinetic control of acid mine drainage.

Appendix D – Materials Characterisation Study
25
Table 9 Carbon Speciation – Rustlers Roost
Sample Lithology Weathering Zone TOC %C ANC kg H2SO4/t
Fresh Zone
HKR02354 Psl fr 0.09 4.6
HKR00399 S s fr 0.11 12
HKR02253 Psl fr 0.31 5.0
HKR00394 S s fr 0.15 5.5
HKR02034 S s fr 0.08 2.3
HKR02126 Psl fr 0.09 11
HKR02161 S s fr 0.73 44
HKR00556 S s fr 0.11 18
HKR00935 Pst fr 0.10 20
HKR00953 Psl fr 0.12 5.6
HKR00598 S s fr 0.89 38
HKR00664 S s fr <0.05 1.2
HKR01629 Psh fr 0.21 11
HKR01666 Psl fr 0.25 5.8
HKR01321 Psh fr 0.15 18
Transition and Oxide
HKR02233 Ss tr 0.08 2.4
HKR02238 Psl tr 0.21 2.0
HKR00007 S s tr 0.23 2.5
HKR00009 S s tr 0.12 3.7
HKR00879 Psl tr <0.05 1.9
HKR00681 Psh tr 0.35 <0.5
HKR00684 Psh tr 0.52 0.6

Appendix D – Materials Characterisation Study
26
Sample Lithology Weathering Zone TOC %C ANC kg H2SO4/t
HKR00687 Psh tr 0.51 1.5
HKR00695 Psh tr 0.43 2.6
HKR00696 Psh tr 0.14 2.9
HKR00697 Psh tr 0.31 <0.5
HKR01141 Psl ox <0.05 1.4
HKR01147 Psh tr 0.31 2.0
HKR01148 Psh tr 0.39 0.9
6.3 Net Acid Generation and Net Acid Production Potential (RR)
The pH of the sample following digestion in a solution of hot hydrogen peroxide at a 1:100 solid to liquid ratio was conducted on the same 30 samples from Rustlers Roost as those tested for the previous analytes in phase 2 of the analytical program.
The fresh zone lithologies generally reported slightly higher NAG pH (from pH 2.9 to pH 8.8, with an average pH 5.05) than the lithologies present in the oxide and transition zone (pH 2.4 to pH 7.7, average pH 4.87).
The shale Psh produced the lowest NAG pH in both the fresh and transition weathering zones.
Net acid production potential (NAPP) is calculated from sulfide sulfur (Scr) to calculate the maximum potential acidity (MPA) in kg of sulfuric acid per tonne of rock, and the measured ANC, also expressed as kg sulfuric acid per tonne of rock.
Sulfide sulfur, Scr (%S) x 30.6 gives MPA in kg H2SO4/t
MPA – ANC = NAPP
If the MPA is less than the measured ANC, the NAPP is negative which indicates the sample may have sufficient ANC to neutralise the acid it could generate (MPA). If the MPA exceeds the ANC, the NAPP will be positive indicating the sample could be acid generating.
The results of the NAG pH testing and NAPP calculations are presented in Table 10.

Appendix D – Materials Characterisation Study
27
Table 10 Net Acid Generation pH – Rustlers Roost
Sample Lithology Weathering Zone NAG pH
pH Units NAPP kg H2SO4/t
Fresh Zone
HKR02354 Psl fr 6.2 -4.60
HKR00399 S s fr 7.6 -11.69
HKR02253 Psl fr 4.0 -1.32
HKR00394 S s fr 7.0 -4.88
HKR02034 S s fr 5.6 -1.68
HKR02126 Psl fr 7.1 -7.02
HKR02161 S s fr 8.8 -39.41
HKR00556 S s fr 7.9 -17.38
HKR00935 Pst fr 6.6 -12.04
HKR00953 Psl fr 3.2 0.82
HKR00598 S s fr 8.3 -27.29
HKR00664 S s fr 5.8 -1.20
HKR01629 Psh fr 2.9 -1.51
HKR01666 Psl fr 4.6 -3.65
HKR01321 Psh fr 6.3 -13.41
Transition and Oxide
HKR02233 Ss tr 3.3 4.94
HKR02238 Psl tr 2.7 15.74
HKR00007 S s tr 6.1 -2.19
HKR00009 S s tr 6.3 -3.7
HKR00879 Psl tr 7.7 -1.9
HKR00681 Psh tr 2.6 22.33
HKR00684 Psh tr 2.4 39.18
Appendix D – Materials Characterisation Study
28
Sample Lithology Weathering Zone NAG pH
pH Units NAPP kg H2SO4/t
HKR00687 Psh tr 2.6 23.89
HKR00695 Psh tr 3.3 7.19
HKR00696 Psh tr 2.6 23.41
HKR00697 Psh tr 2.6 22.64
HKR01141 Psl ox 6.9 -1.40
HKR01147 Psh tr 3.2 7.18
HKR01148 Psh tr 3.0 8.89
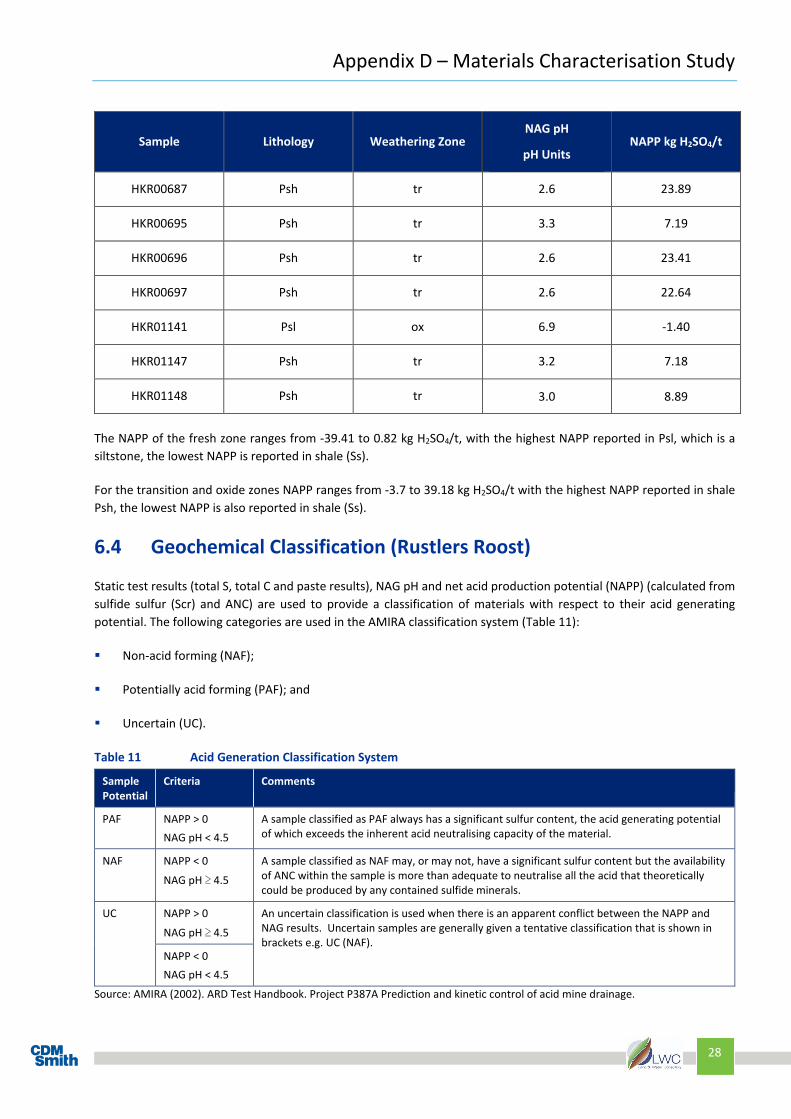
The NAPP of the fresh zone ranges from -39.41 to 0.82 kg H2SO4/t, with the highest NAPP reported in Psl, which is a siltstone, the lowest NAPP is reported in shale (Ss).
For the transition and oxide zones NAPP ranges from -3.7 to 39.18 kg H2SO4/t with the highest NAPP reported in shale Psh, the lowest NAPP is also reported in shale (Ss).
6.4 Geochemical Classification (Rustlers Roost)
Static test results (total S, total C and paste results), NAG pH and net acid production potential (NAPP) (calculated from sulfide sulfur (Scr) and ANC) are used to provide a classification of materials with respect to their acid generating potential. The following categories are used in the AMIRA classification system (Table 11):
Non-acid forming (NAF);
Potentially acid forming (PAF); and
Uncertain (UC).
Table 11 Acid Generation Classification System
Sample Potential
Criteria Comments
PAF NAPP > 0 NAG pH < 4.5
A sample classified as PAF always has a significant sulfur content, the acid generating potential of which exceeds the inherent acid neutralising capacity of the material.
NAF NAPP < 0
NAG pH ≥ 4.5
A sample classified as NAF may, or may not, have a significant sulfur content but the availability of ANC within the sample is more than adequate to neutralise all the acid that theoretically could be produced by any contained sulfide minerals.
UC NAPP > 0
NAG pH ≥ 4.5
An uncertain classification is used when there is an apparent conflict between the NAPP and NAG results. Uncertain samples are generally given a tentative classification that is shown in brackets e.g. UC (NAF).
NAPP < 0 NAG pH < 4.5
Source: AMIRA (2002). ARD Test Handbook. Project P387A Prediction and kinetic control of acid mine drainage.

Appendix D – Materials Characterisation Study
29
The results of the classification are presented for the transition and oxide and fresh zones separately.
Figure 21 Geochemical Classification of Transition and Oxide Lithologies in Rustlers Roost
Of the 14 samples analysed from the transition zone, three have been characterised as potentially acid forming (PAF), the majority of the lithologies plot as uncertain (UC) they have a positive NAPP, but produce neutral to alkaline NAG pH.
This may be due to the NAG test not fully digesting the sulfide present given that only three out of the 14 samples did not report sulfide present as Scr (%S).

Appendix D – Materials Characterisation Study
30
Figure 22 Geochemical Classification of Fresh Zone Lithologies of Rustlers Roost
6.5 Multi Element Content (Rustlers Roost)
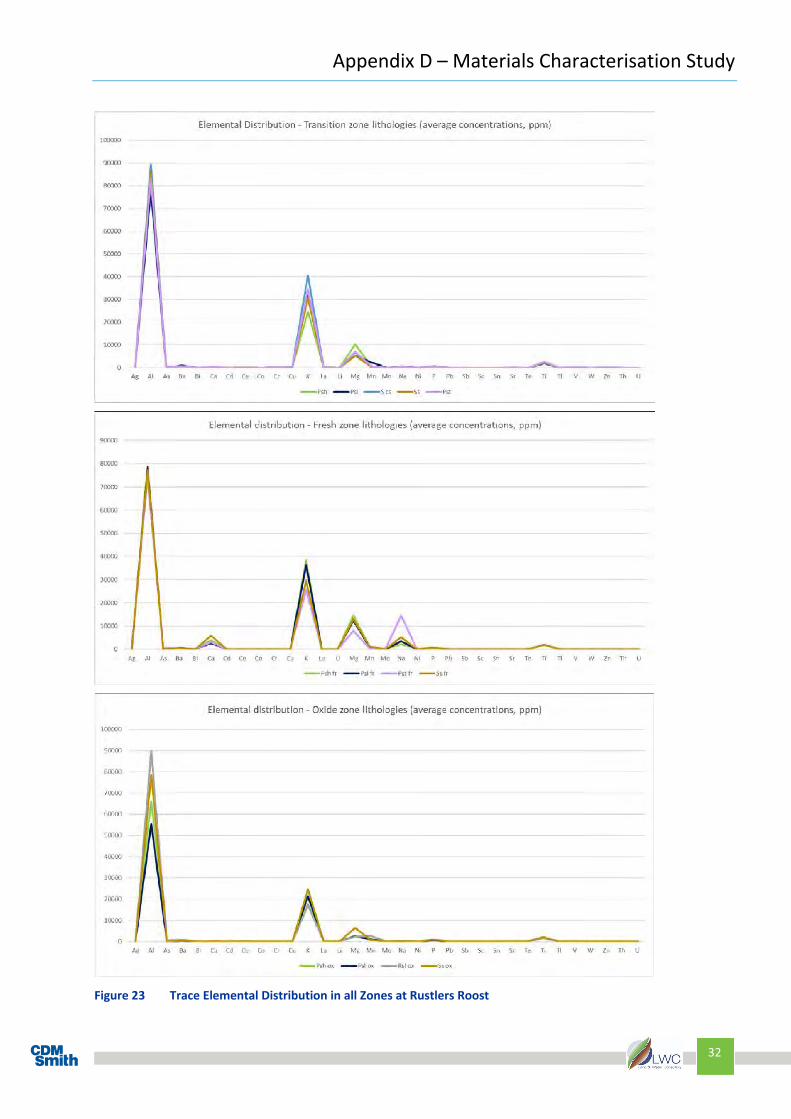
All samples selected for phase 2 of the geochemical program were digested with four acids and their elemental composition determined. Figures of all trace elements assessed for each weathering zone is presented in Figure 23.
In general, there is little to distinguish the lithologies or which weathering zone they are from. The major components of all lithologies are Fe, C, and S which are present at levels measured in % (not shown). The remaining elements (trace elements) were reported as parts per million (or mg/kg), Figure 23.Of these trace elements, those dominating the signature of all lithologies are Al, K, Mg, P and Ti. One differentiating feature of the fresh zone lithologies is their Ca and Na concentrations, these are significantly higher than those of the oxide and transition zones.
The trace elemental signatures are also presented with the dominant trace elements removed to allow for differences within these elements of lower concentration to be observed (Figure 24). At the lower concentrations, Arsenic (As) is noted as having a relatively strong signature in the fresh zone Pst and oxide zone Rsl (Figure 24). This is likely due to the presence of arsenopyrite which has been documented in the logging of the core at the site and is a known sulfide mineral in the region.
Aluminium (Al) likely indicates the presence of alumino-silicates. The variable Na in each weathering zone with K one of the major elements present may be evidence of alkali feldspars (e.g. Albite (Na end member, high temperature) or Microcline (low temperature)). Sodium (Na) may also be evidence of sodic end members of the amphibole mineral group, which are common in hydrothermally altered sediments.

Appendix D – Materials Characterisation Study
31
Calcium (Ca) and Mg may reflect influences from magnesian calcite or dolomite (Ca, Mg, carbonate) but can equally be due to Ca and Mg silicates such as olivine and diopside, pyroxenes or amphiboles such as hornblende which are common in gneiss and schists. Hydrothermal alteration minerals containing Ca and Mg such as chlorites are also likely to be present.
Manganese (Mn) and Ti possibly reflect marine mud influences of the original sediments prior to alteration and metamorphism.
Given Ce and La are present any phosphates may include Monazite. Fluorapatite is also a common phosphate in metamorphosed rocks, noting that fluorapatite has been reported with inclusions/solid solution with Monazite, this co-existence is possibly due to mobilisation of light rare earth elements with hydrothermal brines during the metamorphic event.
Appendix D – Materials Characterisation Study
32
Figure 23 Trace Elemental Distribution in all Zones at Rustlers Roost

Appendix D – Materials Characterisation Study
33
Figure 24 Distribution of Selected Trace Elements in Lithologies at Rustlers Roost

Appendix D – Materials Characterisation Study
34
6.6 Phase 3 Static Testing - Additional Characterisation (Rustlers Roost)
Further characterisation was completed on materials where the classification was unclear, that is where the sample results plotted on or close to a boundary in the classification plot (Figure 21 and Figure 22).
Further characterisation consists of better defining the acid generation and buffering capacity of the materials, the two methods adopted were acid buffering characterisation curves (ABCC) and a kinetic NAG test. These methods treat the sample with the reactant for a longer period of time than the screening tests; ANC and NAG, and measure the pH change over this time, thus allowing for a more robust calculation of NAPP.
Six samples from the Rustlers Roost deposit were selected for additional characterisation (Table 12).
Table 12 Samples Selected for Further Acid Base Accounting CoC# Sample ID Hole ID From (m) To (m) Lithology
RR 039 HKR00394 RRDH02 115 116 Shale (Ss) RR 084 HKR00953 RRDH06 141 142 Sandstone (Pst) RR 097 HKR00664 RRDH08 79 80 Siltstone (Psl) RR 112 HKR01629 RRDH08 249 250 Shale (Psh) RR 113 HKR01666 RRDH08 282 282.35 Siltstone (Psl) RR 125 HKR01154 RRDH09 105 106 Siltstone (Psl)
6.7 Acid Buffering Characterisation Curves
Acid base characterisation curves (ABCC) depict the change in pH of the solution as incremental volumes of hydrochloric acid are added (two concentrations are used, 0.1M and 0.5M). As described for the Sobek method for ANC determination the concentration of HCl added is converted to sulfuric acid equivalents which is then plotted against the measured pH.
Six samples classified as UC based on their NAG pH and NAPP, had their ANC further assessed via the ABCC method. The results of testing are summarised in Table 13 alongside the original ANC values measured for the sample in the initial ANC determination (Sobek initial).
Table 13 Results of Acid Buffering Characterisation Sample ID Hole ID Lithology ANC(Sobek
initial) kg H2SO4/t
ANC(Sobek repeat)
kg H2SO4/t
ANC(ABCC) kg H2SO4/t
HKR00394 RRDH02 Shale (Ss) 5.0 5.5 17.3 HKR00953 RRDH06 Sandstone (Pst) 5.6 5.6 15.4 HKR00664 RRDH08 Siltstone (Psl) 1.2 1.2 13.5 HKR01629 RRDH08 Shale (Psh) 11 11 18.3 HKR01666 RRDH08 Siltstone (Psl) 5.8 5.8 17.3 HKR01154 RRDH09 Siltstone (Psl) 1.4 1.4 17.3
The difference between the two results is possibly due to the Sobek method only measuring the readily available carbonate buffering capacity whereas the ABCC method has released additional buffering capacity from silicates or less soluble carbonates such as dolomite. Characterisation of the mineralogical content of these samples is used to assess what has caused this difference in ANC for the materials.
Appendix D – Materials Characterisation Study
35
6.8 Kinetic NAG (Rustlers Roost)
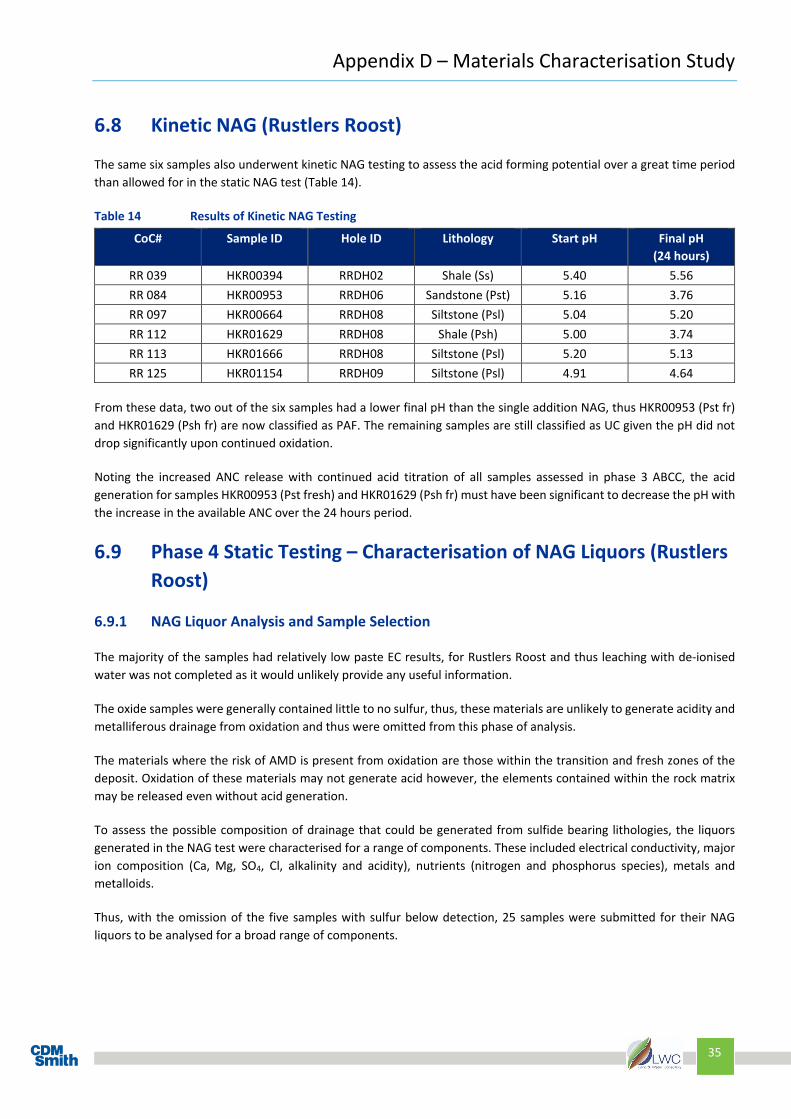
The same six samples also underwent kinetic NAG testing to assess the acid forming potential over a great time period than allowed for in the static NAG test (Table 14).
Table 14 Results of Kinetic NAG Testing
CoC# Sample ID Hole ID Lithology Start pH Final pH (24 hours)
RR 039 HKR00394 RRDH02 Shale (Ss) 5.40 5.56 RR 084 HKR00953 RRDH06 Sandstone (Pst) 5.16 3.76 RR 097 HKR00664 RRDH08 Siltstone (Psl) 5.04 5.20 RR 112 HKR01629 RRDH08 Shale (Psh) 5.00 3.74 RR 113 HKR01666 RRDH08 Siltstone (Psl) 5.20 5.13 RR 125 HKR01154 RRDH09 Siltstone (Psl) 4.91 4.64
From these data, two out of the six samples had a lower final pH than the single addition NAG, thus HKR00953 (Pst fr) and HKR01629 (Psh fr) are now classified as PAF. The remaining samples are still classified as UC given the pH did not drop significantly upon continued oxidation.
Noting the increased ANC release with continued acid titration of all samples assessed in phase 3 ABCC, the acid generation for samples HKR00953 (Pst fresh) and HKR01629 (Psh fr) must have been significant to decrease the pH with the increase in the available ANC over the 24 hours period.
6.9 Phase 4 Static Testing – Characterisation of NAG Liquors (Rustlers Roost)
6.9.1 NAG Liquor Analysis and Sample Selection
The majority of the samples had relatively low paste EC results, for Rustlers Roost and thus leaching with de-ionised water was not completed as it would unlikely provide any useful information.
The oxide samples were generally contained little to no sulfur, thus, these materials are unlikely to generate acidity and metalliferous drainage from oxidation and thus were omitted from this phase of analysis.
The materials where the risk of AMD is present from oxidation are those within the transition and fresh zones of the deposit. Oxidation of these materials may not generate acid however, the elements contained within the rock matrix may be released even without acid generation.
To assess the possible composition of drainage that could be generated from sulfide bearing lithologies, the liquors generated in the NAG test were characterised for a range of components. These included electrical conductivity, major ion composition (Ca, Mg, SO4, Cl, alkalinity and acidity), nutrients (nitrogen and phosphorus species), metals and metalloids.
Thus, with the omission of the five samples with sulfur below detection, 25 samples were submitted for their NAG liquors to be analysed for a broad range of components.
Appendix D – Materials Characterisation Study
36
6.9.2 NAG Liquor pH and Electrical Conductivity
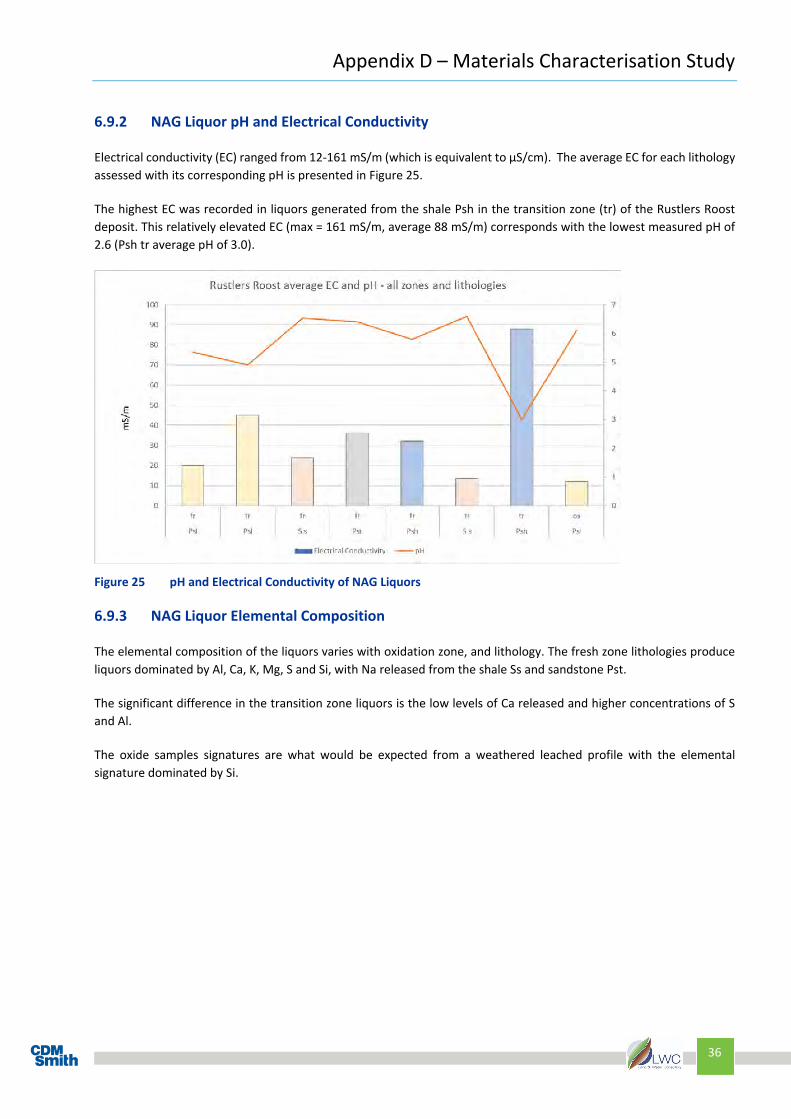
Electrical conductivity (EC) ranged from 12-161 mS/m (which is equivalent to µS/cm). The average EC for each lithology assessed with its corresponding pH is presented in Figure 25.
The highest EC was recorded in liquors generated from the shale Psh in the transition zone (tr) of the Rustlers Roost deposit. This relatively elevated EC (max = 161 mS/m, average 88 mS/m) corresponds with the lowest measured pH of 2.6 (Psh tr average pH of 3.0).
Figure 25 pH and Electrical Conductivity of NAG Liquors
6.9.3 NAG Liquor Elemental Composition
The elemental composition of the liquors varies with oxidation zone, and lithology. The fresh zone lithologies produce liquors dominated by Al, Ca, K, Mg, S and Si, with Na released from the shale Ss and sandstone Pst.
The significant difference in the transition zone liquors is the low levels of Ca released and higher concentrations of S and Al.
The oxide samples signatures are what would be expected from a weathered leached profile with the elemental signature dominated by Si.

Appendix D – Materials Characterisation Study
37
Figure 26 Elemental Composition of NAG Liquors (all concentrations are mg/L)

Appendix D – Materials Characterisation Study
38
6.10 Water Quality Prediction – Rustlers Roost
To assess the possible risk to water quality from drainage that could be produced during long-term storage of mine wastes generated from the Rustlers Roost deposit, the NAG liquor composition was used as a proxy for the possible drainage quality and to provide a preliminary risk assessment. This assessment was completed by comparing the data to national water quality guidelines.
The most relevant guideline to assess risk to water quality at the site, in the absence of site-specific criteria are the freshwater guidelines documented by the Australian and New Zealand Governments; ANZECC and ARMCANZ freshwater criteria published in 2018. We have applied the default 95% species protection values and where relevant we have also applied low reliability criteria as recently recommended by ANZECC. For nitrogen species, pH and EC, tropical northern Australian values have been adopted. These guidelines are designed to provide a preliminary assessment of possible risk to surface water species living in waters with low EC values (EC less than 500 µS/cm). They are not relevant to the protection of groundwater quality. If groundwater has the potential to flow into surface water environments, the quality of the groundwater may be screened against the freshwater guidelines to assess the potential risk of impact to the receiving environment (the surface water body) but not to assess impacts to a freshwater groundwater resource. To assess risk to groundwater, the NAG liquors results should be compared to local groundwater quality when such data becomes available.
6.11 Data Handling
It is noted that the LORs for Silver (Ag), Mercury (Hg), Titanium (Ti) and nitrate (NO3) are above the guideline value documented. For these chemicals, although all values are technical exceedances due to the LOR, to highlight those samples with measured values, we have only included values reported above the LOR as exceedances. Where a value equals the criterion this is deemed an exceedance.
A criterion is not available for all chemicals, and thus a preliminary assessment of risk cannot be completed for all chemicals. Consideration of a site-specific assessment for chemicals without a criterion should be considered. This assessment can be completed through comparison with surface and groundwater quality data from across the site.
6.12 Preliminary Risk Assessment (RR)
A summary of the exceedances is presented in Table 15, and at the back of this memo. The following components of the liquors were found to exceed the nominated water quality criterion: Ag, As, Al, Cd, Co, Cr, Cu, Fe, Mo, Ni, P, Pb, Se, Ti, U, V and Zn, and nitrate.
When these elements are compared to the pH of the liquor generated, key chemicals of concern in neutral liquors were As, Cr, Cu, Ti, V and nitrate.
Whereas, for the acid liquors there was a broader suite of chemicals of potential concern identified which include Ag, Cd, Co, Cr, Cu, Fe, Mo, Ni, P, Pb, Se, Ti, U, V and Zn, and nitrate.

Appendix D – Materials Characterisation Study
39
Table 15 NAG Liqour Composition Screened Against ANZECC 2000 Freshwater Criteria
COC #
RR 020 RR 024 RR 035 RR 036 RR 038 RR 055 RR 057 RR 058 RR 061 RR 067 RR 068 RR 079 RR 083 RR 095 RR 102 RR 103 RR 105 RR 106 RR 107 RR 108 RR 113 RR 115 RR 119 RR 120 RR 129
Sample IDRRDH01_HKR02354 RRDH02_HKR00399 RRDH02_HKR02233 RRDH02_HKR02238 RRDH02_HKR02253 RRDH03_HKR02034 RRDH03_HKR02126 RRDH03_HKR02161 RRDH03_HKR00556 RRDH05_HKR00007 RRDH05_HKR00009 RRDH06_HKR00879 RRDH06_HKR00935 RRDH07_HKR00598 RRDH08_HKR00681 RRDH08_HKR00684 RRDH08_HKR00687 RRDH08_HKR00695 RRDH08_HKR00696 RRDH08_HKR00697 RRDH08_HKR01666 RRDH09_HKR01141 RRDH09_HKR01147 RRDH09_HKR01148 RRDH09_HKR01321
LithologyPsl S s S s Psl Psl S s Psl S s S s S s S s Psl Pst S s Psh Psh Psh Psh Psh Psh Psl Psl Psh Psh Psh
Weatheringfr fr fr tr fr fr fr fr fr tr tr tr fr fr tr tr tr tr tr tr fr ox tr tr fr
UNITS LORANZECC 2018
Freshwater default guideline values (mg/L)
MetalsSilver mg/L 0.0001 0.00005 <0.0001 <0.0001 0.0002 0.0011 <0.0001 <0.0001 <0.0001 <0.0001 <0.0001 <0.0001 <0.0001 <0.0001 <0.0001 <0.0001 0.0016 0.0012 0.0012 0.0003 0.0006 0.0017 <0.0001 <0.0001 0.0005 0.0005 <0.0001Aluminium mg/L 0.005 0.055 <0.005 <0.005 6.7 14 2 0.017 <0.005 0.044 0.053 <0.005 <0.005 <0.005 <0.005 0.49 18 26 19 10 20 18 0.87 <0.005 7.2 7.8 <0.005Arsenic mg/L 0.001 0.013** 0.001 0.078 <0.001 0.002 <0.001 0.006 0.006 0.005 0.023 0.002 0.005 0.013 0.44 0.012 0.009 0.002 <0.001 <0.001 <0.001 <0.001 <0.001 0.005 <0.001 <0.001 <0.001Boron mg/L 0.005 0.37 <0.005 0.036 0.044 0.04 0.042 0.017 0.018 0.011 0.027 <0.005 0.035 0.016 0.027 0.028 0.04 0.05 0.042 0.017 0.019 0.06* 0.051 0.02 0.06* 0.07* 0.07*Barium mg/L 0.0001 0.0044 0.0057 0.13 0.09 0.083 0.0092 0.016 0.014 0.022 0.0078 0.0036 0.5 0.051 0.0067 0.086 0.079 0.065 0.12 0.09 0.079 0.15 0.33 0.13 0.094 0.055Beryllium mg/L 0.0001 <0.0001 <0.0001 0.0011 0.0018 0.0007 <0.0001 <0.0001 <0.0001 <0.0001 <0.0001 <0.0001 <0.0001 <0.0001 <0.0001 0.0028 0.0022 0.0013 0.0013 0.0011 0.0015 0.0004 <0.0001 0.0013 0.002 <0.0001Calcium mg/L 0.1 0.2 7.7 0.5 0.7 2.5 0.2 12.5 22.8 16.9 0.5 0.1 0.1 23.4 19.3 1 0.9 0.6 0.6 0.5 0.5 1.7 0.3 0.8 0.9 17.9Cadmium mg/L 0.0001 0.0002 <0.0001 <0.0001 0.0001 0.0014 <0.0001 0.0002 <0.0001 <0.0001 <0.0001 <0.0001 <0.0001 <0.0001 <0.0001 <0.0001 0.0009 0.0002 0.0001 0.0001 0.0007 0.0005 <0.0001 <0.0001 0.0001 0.0001 <0.0001Cerium mg/L 0.0005 <0.0005 <0.0005 0.0071 0.014 <0.0005 <0.0005 <0.0005 <0.0005 <0.0005 <0.0005 <0.0005 <0.0005 <0.0005 <0.0005 0.012 0.011 0.0084 0.0073 0.013 0.011 <0.0005 <0.0005 0.0058 0.0083 <0.0005Cobalt mg/L 0.0001 0.0014 0.0001 <0.0001 0.06 0.072 0.064 0.0012 <0.0001 <0.0001 <0.0001 <0.0001 <0.0001 <0.0001 <0.0001 <0.0001 0.052 0.097 0.16 0.088 0.1 0.18 0.014 <0.0001 0.056 0.052 0.0026Chromium mg/L 0.0005 0.001*** 0.0072 0.0048 0.0071 0.0046 0.0039 0.007 0.001 0.0049 0.0015 0.009 0.0056 <0.0005 0.0016 0.0065 0.0053 0.0071 0.0049 0.0025 0.0073 0.0064 0.0064 0.0006 0.0013 0.0012 0.0033Copper mg/L 0.0001 0.0014 <0.0001 <0.0001 0.038 0.19 <0.0001 <0.0001 <0.0001 <0.0001 <0.0001 <0.0001 <0.0001 <0.0001 <0.0001 <0.0001 0.47 0.64 0.55 0.2 0.38 0.26 <0.0001 <0.0001 0.19 0.33 <0.0001Iron mg/L 0.005 <0.005 <0.005 0.068 1 0.011 <0.005 <0.005 <0.005 <0.005 <0.005 <0.005 <0.005 <0.005 <0.005 1.5 4.1 1.6 0.14 1.6 1.4 <0.005 <0.005 0.22 0.37 <0.005Mercury mg/L 0.0001 0.00006 <0.0001 <0.0001 <0.0001 0.0042 <0.0001 <0.0001 <0.0001 <0.0001 <0.0001 <0.0001 <0.0001 <0.0001 <0.0001 <0.0001 <0.0001 <0.0001 <0.0001 <0.0001 <0.0001 <0.0001 <0.0001 <0.0001 <0.0001 <0.0001 <0.0001Potassium mg/L 0.1 6.8 5.4 11.8 5.3 4.2 2.8 4.6 4.6 <0.1 1.1 <0.1 <0.1 <0.1 1.4 3.3 2.5 0.8 5.2 2.5 4.7 5.1 <0.1 4.1 4.8 4.5Lithium mg/L 0.0001 0.001 0.0012 0.0098 0.011 0.0048 0.0006 0.0019 0.0021 0.0009 0.0004 <0.0001 0.0004 0.0008 0.0007 0.02 0.018 0.013 0.011 0.016 0.013 0.0024 <0.0001 0.0069 0.0066 0.0004Magnesium mg/L 0.1 2.3 3.4 3.5 4.6 5.8 1.3 5.7 2.7 4.9 1.8 1.7 0.4 10.7 0.8 1.3 7.3 6.9 4.3 6.4 4.1 4 0.3 2.7 3 10.3Manganese mg/L 0.0001 1.9 0.07 0.036 0.12 0.23 0.43 0.048 0.29 0.017 0.07 0.12 0.051 0.94 0.28 0.0033 0.13 0.86 1 0.43 0.84 0.42 0.25 1.7 0.21 0.17 1.2Molybdenum mg/L 0.001 0.034 <0.001 0.001 <0.001 <0.001 0.001 0.003 <0.001 0.018 <0.001 <0.001 <0.001 0.003 <0.001 <0.001 <0.001 <0.001 <0.001 <0.001 <0.001 <0.001 0.009 <0.001 0.037 0.017 <0.001Sodium mg/L 0.1 0.3 0.6 0.8 0.3 0.3 0.2 0.5 0.3 2.8 <0.1 <0.1 0.3 2.1 0.7 0.2 0.2 <0.1 0.1 <0.1 0.2 0.7 0.1 0.1 0.1 0.4Nickel mg/L 0.001 0.011 0.012 0.001 0.069 0.076 0.063 <0.001 <0.001 <0.001 <0.001 <0.001 <0.001 <0.001 <0.001 <0.001 0.06 0.09 0.14 0.066 0.13 0.15 0.036 <0.001 0.07 0.062 <0.001Phosphorus mg/L 0.1 <0.1 <0.1 <0.1 <0.1 <0.1 <0.1 <0.1 <0.1 <0.1 <0.1 <0.1 <0.1 <0.1 <0.1 <0.1 <0.1 <0.1 <0.1 <0.1 <0.1 <0.1 <0.1 <0.1 <0.1 <0.1Lead mg/L 0.0001 0.0034 <0.0001 <0.0001 0.0025 0.068 0.0004 <0.0001 <0.0001 <0.0001 <0.0001 <0.0001 <0.0001 <0.0001 <0.0001 <0.0001 0.0007 0.0016 0.01 0.002 0.0078 0.017 0.0004 <0.0001 0.0004 0.0021 <0.0001Rubidium mg/L 0.0001 0.021 0.029 0.046 0.034 0.033 0.028 0.036 0.028 0.0061 0.024 0.024 0.021 0.015 0.025 0.027 0.034 0.025 0.042 0.032 0.043 0.039 0.0097 0.035 0.03 0.018Sulphur mg/L 0.1 0.9 1.2 27 57 18 2.8 18 7.9 1.1 1.3 <0.1 <0.1 35 7.8 74 110 74 33 73 68 12 0.1 29 35 32Antimony mg/L 0.0001 0.0002 0.0008 <0.0001 <0.0001 <0.0001 0.0007 0.0006 0.0007 0.0008 <0.0001 0.0003 0.0001 0.0012 0.0008 <0.0001 <0.0001 <0.0001 <0.0001 <0.0001 <0.0001 <0.0001 <0.0001 <0.0001 <0.0001 0.0002Selenium mg/L 0.001 0.005 0.001 <0.001 0.002 0.002 <0.001 <0.001 0.001 0.001 <0.001 0.002 <0.001 <0.001 0.004 0.001 0.01 0.011 0.007 0.001 0.002 0.002 0.005 <0.001 0.005 0.006 0.004Silica mg/L 0.1 16 11 24 34 24 13 11 9.6 12 17 15 7.6 11 6.6 34 48 39 33 44 41 21 8.6 23 23 11Strontium mg/L 0.0001 0.0022 0.0075 0.0037 0.0044 0.0094 0.0017 0.016 0.044 0.0085 0.0016 0.0012 0.01 0.011 0.039 0.016 0.014 0.0051 0.0044 0.0078 0.0054 0.01 0.003 0.007 0.0067 0.011Thorium mg/L 0.0001 <0.0001 <0.0001 <0.0001 0.0002 <0.0001 <0.0001 <0.0001 <0.0001 <0.0001 <0.0001 <0.0001 <0.0001 <0.0001 <0.0001 0.0012 0.0034 0.0006 <0.0001 0.0005 0.0009 <0.0001 <0.0001 <0.0001 <0.0001 <0.0001Titanium mg/L 0.0001 0.00003 <0.0001 <0.0001 0.0002 0.0001 0.0001 <0.0001 <0.0001 <0.0001 <0.0001 <0.0001 <0.0001 0.0017 <0.0001 <0.0001 0.0001 0.0002 0.0002 0.0002 0.0002 0.0003 0.0002 0.0006 0.0002 0.0001 <0.0001Uranium mg/L 0.0001 0.0005 0.0001 0.0002 0.0008 0.0027 0.0002 0.0002 <0.0001 <0.0001 0.0002 0.0001 <0.0001 <0.0001 <0.0001 <0.0001 0.0045 0.006 0.0031 0.0011 0.0019 0.0056 <0.0001 <0.0001 0.0013 0.0017 <0.0001Vanadium mg/L 0.005 0.006 0.011 0.005 0.009 0.016 0.006 0.008 <0.005 0.006 <0.005 0.02 0.009 <0.005 <0.005 0.005 0.021 0.01 0.018 0.014 0.014 0.016 0.015 <0.005 0.011 0.01 <0.005Zinc mg/L 0.001 0.008 <0.001 <0.001 0.075 0.096 0.019 <0.001 <0.001 <0.001 <0.001 <0.001 <0.001 <0.001 <0.001 <0.001 0.047 0.1 0.1 0.064 0.11 0.1 <0.001 <0.001 0.042 0.062 <0.001
NutrientsNitrate (as N) mg/L 0.05 0.005^ 40 40 42 35 31 35 40 39 38 36 36 36 37 34 35 32 32 35 32 34 35 35 34 36 38Sulphate as (SO4) mg/L 1 3 5 76 170 50 12 55 26 4 5 <1 <1 110 24 220 340 220 100 220 200 38 <1 90 100 91
AlkalinityAcidity (as CaCO3) mg/L 2 100 14 76 170 60 110 7 <5 <5 72 43 <5 6 <5 240 360 220 89 220 210 39 10 81 100 11Total Alkalinity (as CaCO3) mg/L 1 <3 38 <3 <3 <3 <3 3 58 71 <3 3 <3 <3 39 <3 <3 <3 <3 <3 <3 <3 <3 <3 <3 <3
GeneralChloride mg/L 1 7 4 6 4 4 6 4 4 4 5 5 4 4 4 4 4 3 4 4 4 5 4 4 4 4Electrical Conductivity mS/m 0.2 12.3 18.7 31.7 78.4 22.6 14 26.3 28.2 25.3 14.4 12.6 11.4 36.3 24.9 113 161 101 37.9 97.8 96.2 19.5 12 42 55.1 32.2pH 0.1 6.0 - 8.0^ 6.2 7.6 3.6 2.9 4.3 5.5 6 7.3 8 6.5 6.7 6.9 6.4 7.2 3 3 3 4 3 3 5 6.1 3 3 6
* Denotes ICP analysis and higher LOR**Value for AsV adopted
*** Value for CrVI adopted^ Default trigger values for tropical Australia freshwater
Analyte

Appendix D – Materials Characterisation Study
40
6.13 Phase 5 Static Testing - Mineralogy Results (Rustlers Roost)
Semi-quantitative x-ray diffraction (XRD) was completed on four composite samples from the Rustlers Roost deposit and a tailings sample provided by PGO. These samples were analysed by Microanalysis Australia.
The composite samples were the samples selected for the kinetic program currently underway. The kinetic program includes waste, low grade ore, ore and tailings across both Rustlers Roost and Quest 29 deposits. Each composite is lithologically distinct, and representative of the transition and fresh weathering zones. The sample set from Rustlers Roost allow comparison of two of the major lithologies (Siltstone and Shale) in two of the weathering zones, transition and fresh.
The oxide zone was not included in the mineralogical assessment, the composites assessed were those materials displaying characteristics of acid generation and or the potential to generate deleterious drainage quality. The materials in the oxide zone are predominantly NAF with low levels of dissolved solutes released in aqueous environment and upon oxidation, thus, as oxide samples present a low risk with respect to AMD, neutral drainage (ND) or saline drainage generation, oxide lithologies were not included in this phase of testing.
PGO provided a LOM tailings sample for inclusion in the mineralogical and kinetic program. The tailings data is presented below alongside the waste rock samples.
Only crystalline material present in the sample give peaks in the XRD scan. Amorphous (non-crystalline) material will add to the background. The search match software used was Eva 4.3.
An up-to-date international crystallographic library was used. The X-ray source was cobalt radiation. The LOR for XRD is 0.1 wt%.
Results of the mineralogical assessment are presented in Table 16.
Table 16 Results of Mineralogical Assessment Sample Mineral
Siltstone (Psl) Fresh Zone
Siltstone (Psl) Transition Zone
Shale (Psh) Transition Zone
Shale (Psh) Fresh Zone Tailings
Quartz 4 43 9 24 17 Muscovite 4 27 5 14 12 Clinochlore 44 17 54 46 42 Microcline 17 5 13 3 8
Pyrite 1 3 4 3 2 Calcite (Mg
bearing) 1 2 1 1 1
Maghemite 2 1 1 Albite 13 1 4 1 4
Magnesio – ferro
hornblende 14 11 12
Vermiculite 2 Grossular 2 1
Fluorapatite (Th bearing) 6 1
The mineralogy of the samples is generally dominated by sheet silicates such as Clinochlore, an iron bearing chlorite mineral (the dominant mineral phase in four out of the five samples assessed) and Muscovite, both indicators of low temperature alteration. Quartz and the feldspars Albite and Microcline are also abundant. The assemblage also includes

Appendix D – Materials Characterisation Study
41
Calcite, Hornblende and Garnet (Grossular) with a thorium bearing Fluorapatite, and Vermiculite, a clay mineral. These are common minerals associated with the metamorphism of limestones.
The presence of maghemite may suggest that siderite (iron carbonate) was also present in the original sediment. During metamorphism siderite would be transformed through loss of carbon dioxide to the iron oxide, maghemite.
Pyrite was reported in all samples assessed, but no arsenopyrite was reported.
6.14 Life of Mine Tailings
The tailings sample considered representative of the LOM (pers comm PGO) was provided for geochemical characterisation.
The sample underwent phases 1, 2 and 5 of the static suite of tests. Additionally, the sample was assessed for its cyanide content.
6.14.1 Tailings Sulfur Content
The sulfur within the samples was assessed as both reduced (Scr) and oxidised forms (sulfate sulfur, S_SO4). The results received are presented in Table 17. The majority of the sulfur present is sulfide. Total oxidisable sulfur (TOS) is greater than the sulfide sulfur, Scr component, thus in addition to sulfide there is potentially elemental sulfur present.
Table 17 Results of Sulfur Speciation in Tailings
Analyte TS S_SO4 TOS Scr
Sample Units %S %S %S %S
Tailings 1.76 0.02 1.74 1.5
Where S= sulfur, SO4 = sulfate, TOS = total oxidisable sulfur, Scr = chromium reducible sulfur (sulfide)
6.14.2 Tailings Carbon Content
Carbon within the samples was assessed as total carbon C, and total organic carbon (TOC) each expressed as %C. The results of the analysis are presented in Table 18.
Table 18 Results of Carbon Speciation in Tailings
Analyte C TOC
Sample Units %C %C
Tailings 0.92 0.52
Approximately half the carbon present is organic carbon thus total C is not a good proxy for acid neutralising capacity (carbonate required for neutralisation is inorganic carbon).

Appendix D – Materials Characterisation Study
42
6.14.3 Tailings Acid Base Accounting
Saturated paste results for the tailings sample indicate that the tailings are neutral to alkaline when in contact with water and release a low level of dissolved solutes resulting in a low paste EC value (Table 19).
Table 19 Results of Paste, ANC and NAG Testing in Tailings
Analyte pH (1:2) EC (1:2) ANC NAGpH NAG
Sample Units pH units mS/m (µS/cm) kg H2SO4/t pH Units kg H2SO4/t
Tailings 8.6 30 27 2.4 30
The tailings sample has a positive net acid generation (NAG) and a low NAG pH indicating that the ANC present is insufficient to buffer the acid generated and upon oxidation the tailings are acid forming (Table 19).
The low EC in the paste test is likely due to the neutral to alkaline pH that the tailings have at present. Once acidified it is expected that the EC of any drainage from the tailings will increase.
6.14.4 Tailings Cyanide Species
The tailings sample was leached in de-ionised water to release the stored cyanide compounds. The leachate produced was assessed via colorimetric methods. The results of these tests are presented in Table 20.
Table 20 Results of Cyanide Species Testing in Tailings
Analyte CN_total CN_WAD SCN_L
Sample Units mg/kg mg/kg mg/kg
Tailings <0.5 <0.5 27
Where CN_total is total cyanide (CN), CN_WAD is weak acid dissociable cyanide, which includes free and moderately stable complexes such as those with Cu, Cd and Zn. SCN_L is thiocyanate, the sulfur cyanide complex. From these results it is clear the cyanide in the tailings sample is present as thiocyanate, the sulfur form. Toxicity and stability of this complex is dependent on the cation associated with this anion.
The tailings are acid forming and thus the thiocyanate may decompose to free cyanide during tailing storage. This in turn could be a source of HCN either as a gas or dissolved solute in water. Both the gas and solute are toxic to organisms.
Consequently, management measures will need to be adopted which minimise the contact of tailings leachate with surface or groundwater.
In summary, the LOM tailings for Rustlers Roost will need to be managed to minimise their contact with water as they are acid forming and will likely generate acidic, possibly saline drainage when oxidised, also appropriate measures need to be put in place to manage the residual cyanide content. Once the tailings acidify, the thiocyanate will become unstable and there is the potential that HCN gas will be released.

Appendix D – Materials Characterisation Study
43
6.15 Rustlers Roost Discussion
The Rustlers Roost deposit consists of leached saprolite over lying hydrothermally altered marine and lacustrine sediments. Quartz veins cross-cut these sediments, the veining likely represents one or more of the fluid flows which penetrated the sediments during the metamorphic events.
The host sediments were likely pyritic; however, the hydrothermal alteration brought additional sulfur into the system which formed additional sulfide phases within the deposit. Thus, sulfide is distributed throughout the deposit.
Gold was introduced to the deposit through this hydrothermal activity and thus the presence of gold, is also not lithologically controlled. Permeability controlled the pathway of the ore bearing fluids, with fractures and discontinuities providing a migration path. Thus, gold is found in areas of greatest fracturing rather than in any particular lithology.
The fluids were likely both silica rich, leading to the formation of quartz veins, and carbonate rich, leading to the presence of carbonate phases throughout the deposit. Thus, as with the mineralisation, the presence of acid neutralising phases is not lithologically controlled.
The results of geochemical assessment demonstrate this pervasive sulfide and carbonate distribution. All of the major lithologies present within the deposit are acid forming. Noting that each lithology is not always acid forming, however the density of sampling is not sufficient to delineate areas where a higher risk of acid generation is present.
It has been demonstrated by others (e.g Graham Campbell 19979) that the weathered waste rock units in the oxide zone are generally non-acid forming, with increasing uncertainty of the acid forming nature of the materials with increasing depth from natural ground surface into the fresh zone. The results presented here corroborate these findings. However, the fresh zone contains significant ANC concentrations leading to many of the fresh zone lithologies classifying as UC or NAF.
Additional characterisation through kinetic NAG and ABCC demonstrates that the uncertain materials may be long lag time PAF materials. Acid neutralising capacity may increase with ongoing acid generation thus the final net acid generation potential of these uncertain materials remains, uncertain.
The dominant sulfide identified in this assessment was pyrite. Although arsenic was identified in the multi-elemental analysis, arsenopyrite was not identified in the mineralogical characterisation.
None of the mineral phases identified are particularly soluble as they are predominantly silicates. However, the characterisation of the oxidised liquors demonstrates that the acid generation is sufficient to cause release of elements in sufficient quantities to pose a potential risk to surface water quality. Characterisation of the oxidised liquors also demonstrated silica is released into solution indicating that silicate buffering is likely a key mechanism maintaining/buffering the pH of the NAG liquor above pH 2.5, particularly when carbonates are not present.
The preliminary water quality risk assessment completed listed the following chemicals of potential concern (COPC): Ag, As, Al, Cd, Co, Cr, Cu, Fe, Mo, Ni, P, Pb, Se, Ti, U, V and Zn, and nitrate.
The pH of the leachate has an influence on the release of these COPC. The multi-elemental analysis demonstrated that there was little data to distinguish the lithologies from each other in terms of the distribution and concentration of elements present. However, in the liquor analysis, where neutral leachates were generated, the composition of the leachate was far simpler than the acidic leachates, with the COPC reduced to As, Cr, Cu, Ti, V and nitrate.
9 Acid Forming Potential and Multi-Element Composition of Waste Rock and Ore Samples – Implications for Waste Rock Management. Report prepared by Graham Campbell and Associates Pty Ltd for Rustlers Roost Mining Pty Ltd in January 1997.

Appendix D – Materials Characterisation Study
44
Further, a thorium (Th) bearing Fluorapatite was identified in the fresh zone shales (Psh) through XRD analysis. Fluorapatite, a phosphate, has a low solubility in water, but its solubility increases in saline conditions, thus even without acidification, fluorapatite may dissolve over time as salinities increase. This will potentially release phosphate and Th into aquatic environments at concentrations of concern given that this mineral was present at concentration up to 6 wt%.
Thus, both pH and salinity are important controls on the release of COPC from the materials at Rustlers Roost.
The preliminary risk assessment only provides an indication of risk for those chemicals with available default water quality guideline values. To understand better the range of COPC at the Project, the results of the NAG liquor characterisation should be compared against site-specific water quality data. This water quality should be characterised for the same suite of chemicals to allow for direct comparison of the concentrations.
Tailings are characterised as acid forming, the water leachable cyanide species remaining in the tailings is thiocyanate, the sulfur cyanide complex. The toxicity and stability of this sulfur complex is dependent on the cation associated with this anion. Further characterisation of this leachate is possible during the kinetic column program, and thus there is an opportunity to improve the understanding of the risk the leachates present to the environment. Given the tailings represent a composite of all lithologies at Rustlers Roost, and are acid forming, from our preliminary risk assessment, the additional COPCs likely to be released from tailings are Ag, As, Al, Cd, Co, Cr, Cu, Fe, Mo, Ni, P, Pb, Se, Ti, U, V and Zn, and nitrate.
In terms of management of the waste, ore and tailings at Rustlers Roost, any materials mined from within the transition zone and fresh zone of the deposit should be managed as PAF. The oxide zone is generally NAF, however, shales (Ss) within this zone may contain sufficient sulfide to present an acid generation risk.
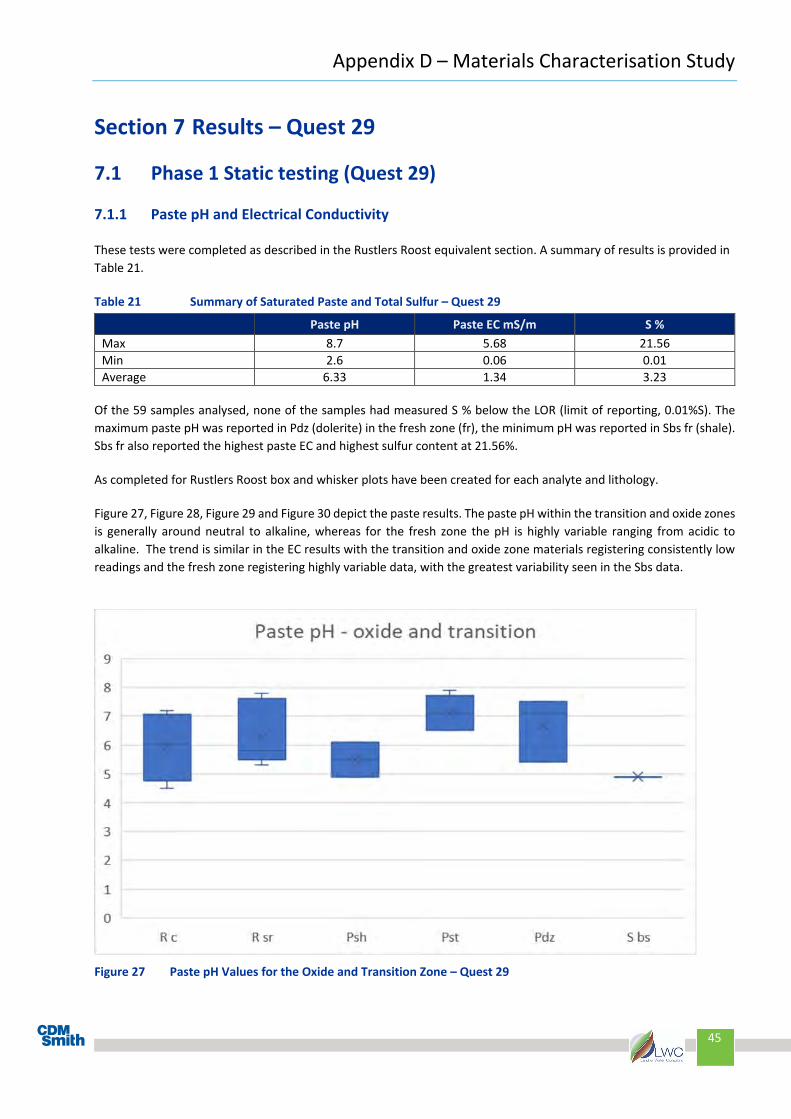
Appendix D – Materials Characterisation Study
45
Section 7 Results – Quest 29
7.1 Phase 1 Static testing (Quest 29)
7.1.1 Paste pH and Electrical Conductivity
These tests were completed as described in the Rustlers Roost equivalent section. A summary of results is provided in Table 21.
Table 21 Summary of Saturated Paste and Total Sulfur – Quest 29
Paste pH Paste EC mS/m S % Max 8.7 5.68 21.56 Min 2.6 0.06 0.01 Average 6.33 1.34 3.23
Of the 59 samples analysed, none of the samples had measured S % below the LOR (limit of reporting, 0.01%S). The maximum paste pH was reported in Pdz (dolerite) in the fresh zone (fr), the minimum pH was reported in Sbs fr (shale). Sbs fr also reported the highest paste EC and highest sulfur content at 21.56%.
As completed for Rustlers Roost box and whisker plots have been created for each analyte and lithology.
Figure 27, Figure 28, Figure 29 and Figure 30 depict the paste results. The paste pH within the transition and oxide zones is generally around neutral to alkaline, whereas for the fresh zone the pH is highly variable ranging from acidic to alkaline. The trend is similar in the EC results with the transition and oxide zone materials registering consistently low readings and the fresh zone registering highly variable data, with the greatest variability seen in the Sbs data.
Figure 27 Paste pH Values for the Oxide and Transition Zone – Quest 29

Appendix D – Materials Characterisation Study
46
Figure 28 Paste pH Values for the Fresh Zone – Quest 29
Figure 29 Paste EC (mS/m) Values for the Oxide and Transition Zone – Quest 29

Appendix D – Materials Characterisation Study
47
Figure 30 Paste EC Values in mS/m for the Fresh Zone – Quest 29
7.1.2 Total Sulfur Content (Quest 29)
Total sulfur content of all selected samples was measured via the LECO combustion method. The results for the oxide, transition zone and fresh zone lithologies are presented on Figure 31 and Figure 32.
Figure 31 Total sulfur (%S) in Oxide and Transition Zone Lithologies – Quest 29

Appendix D – Materials Characterisation Study
48
Figure 32 Total sulfur (%) in Fresh Zone Lithologies of Quest 29
Comparing the weathering zones demonstrates that the oxide and transition zones have a number of lithologies (Rc, Psh and Sbs) with little measurable sulfur (Figure 31). However, all samples reported S above the LOR.
The fresh zone is significantly more sulfur rich than the transition and oxide zone (Figure 32). There are clear differences in the lithological distribution of the sulfur in each zone. In the oxide and transition zone the sulfur lies predominantly in the regolith (Rsr), sandstones (Pst) and dolerite (Pdz), whereas in the fresh zone although the sulfur levels in the sandstone are similar, over all the sulfur content of the zone is higher due to the shales.
7.1.3 Total Carbon (Quest 29)
Total carbon content of all samples was measured as %C, via the LECO combustion method; the LOR was 0.1 %C.
Total carbon content of the samples was recorded from values below the LOR to a maximum of 8.21 %C in Sbs fr. Figure 33 and Figure 34depict the total carbon content of all samples assessed, where values were reported below the LOR, these are graphed as LOR.

Appendix D – Materials Characterisation Study
49
Figure 33 Total carbon (%) Content of Oxide and Transition Zone Lithologies from Quest 29
Figure 34 Total Carbon (%) in Fresh Zone Lithologies from Quest 29

Appendix D – Materials Characterisation Study
50
7.2 Phase 2 – Static Testing (Quest 29)
In phase 2 of the assessment, sulfur speciation and net acid generation (NAG) was determined on 20 samples from the sample set.
As discussed in the Rustlers Roost results, samples with sulfur above the limit of reporting were selected. At least one sample from each of the major lithologies was selected based on their paste results (lowest pH and highest EC).
7.2.1 Sulfur Speciation
To determine whether the sulfur within the samples was oxidised sulfur (sulfate) or reduced sulfur (sulfide), the acid soluble sulfur (S HCl) and chromium reducible sulfur, CRS, expressed as Scr, were determined.
Acid soluble sulfate, SHCl recovers soluble and exchangeable sulfate, sulfate from gypsum and a large proportion of the relatively insoluble iron and aluminium hydroxy sulfate compounds (for example jarosite, natrojarosite, schwertmannite), as well as some sulfur from organic matter, but not pyrite sulfur.
Chromium reducible sulfur determines the sulfide sulfur (Scr) content, without interference from organic sulfur.
All bar one sample (HKR34244, Pst tr) reported Scr above the LOR (0.01%S), SHCl was above the LOR in most samples with the exception of HKR33648 P sh_fr/fx and HKR34147 Sbs tr. The acid soluble sulfur content ranges from below LOR to 2% (average 0.3%S) in the fresh zone which is lower than in the transition and oxide zone where the soluble sulfate content ranges from 2.2 %S to 7.8%S (average 5.24 %S), Table 22.
Table 22 Sulfur Speciation Results; Acid Soluble Sulfur and Chromium Reducible Sulfur for Quest 29
Sample Lithology Weathering
Zone SHCl %S Scr %S Total S %S
Fresh Zone
HKR34178 Pdz Fresh 0.53 2.71 3.27
HKR34252 Pdz Fresh 0.6 0.93 1.4
HKR34263 Pdz Fresh 0.04 1.59 2.39
HKR33883 Psh Fresh 0.05 2.26 2.84
HKR33875 Psl Fresh 0.06 1.04 1.31
HKR33693 Pst Fresh 0.27 1.41 2.12
HKR33768 S bs Fresh 2 10.2 14.97
HKR33798 S bs Fresh 0.1 16.3 21.56
HKR34089 S bs Fresh 0.03 2.83 4.87
HKR33648 P sh_fr/fx Fr-fx <0.010 0.02 0.05

Appendix D – Materials Characterisation Study
51
Sample Lithology Weathering
Zone SHCl %S Scr %S Total S %S
HKR33678 Pdz_fr/fx Fr-fx 0.03 0.6 0.89
Transition and Oxide Zone
HKR33909 Pst Ox 0.02 0.03 0.06
HKR34267 Pst Ox 0.07 2.11 2.72
HKR34034 R sr Ox 0.05 0.02 0.08
HKR34049 Pdz tr 0.07 0.77 1.07
HKR34265 Pdz tr 0.08 2.77 3.39
HKR33855 Psh tr 0.04 0.02 0.06
HKR34244 Pst tr 0.08 <0.01 0.02
HKR33824 R sr tr 0.1 0.01 0.04
HKR34147 S bs tr <0.010 0.01 0.09
When these results are compared to the total sulfur content of each sample, it is clear that the majority of the sulfur in all zones is sulfide sulfur.
Noting that for Sbs there is also likely to be organic sulfur present given that the sum of the sulfate and sulfide content does not equal the total sulfur value.
7.3 Carbon Speciation (Quest 29)
To determine the proportion of carbon present as organic carbon, the TOC content was determined through acid digest of the sample followed by analysis of the residue by LECO combustion method. The inorganic carbon content is the Total Carbon (TC) value minus the TOC content.
The ANC was also determined via the amended Sobek method (AMIRA 2002), as completed for the Rustlers Roost samples. The results are presented per lithology in each weathering zone in Table 23.
Table 23 Carbon Speciation – Quest 29
Sample Lithology Weathering
Zone TOC %C ANC kg H2SO4/t TC %C
Fresh Zone
HKR34178 Pdz Fresh 0.09 21 0.53
HKR34252 Pdz Fresh <0.05 12 0.02

Appendix D – Materials Characterisation Study
52
Sample Lithology Weathering
Zone TOC %C ANC kg H2SO4/t TC %C
HKR34263 Pdz Fresh <0.05 15 0.12
HKR33883 Psh Fresh 0.1 12 0.88
HKR33875 Psl Fresh 0.14 17 0.17
HKR33693 Pst Fresh 0.1 67 0.93
HKR33768 S bs Fresh 2.59 <0.5 6.72
HKR33798 S bs Fresh 1.59 <0.5 7.76
HKR34089 S bs Fresh 1.97 <0.5 6.08
HKR33648 P sh_fr/fx Fr-fx 0.12 2.3 0.48
HKR33678 Pdz_fr/fx Fr-fx <0.05 17 0.06
Transition and Oxide Zone
HKR33909 Pst Ox <0.05 6.5 0.06
HKR34267 Pst Ox <0.05 5.9 0.05
HKR34034 R sr Ox <0.05 2.8 0.04
HKR34049 Pdz tr 0.08 8.9 0.67
HKR34265 Pdz tr <0.05 8.1 0.02
HKR33855 Psh tr <0.05 19 0.23
HKR34244 Pst tr <0.05 24 0.04
HKR33824 R sr tr <0.05 2.3 0.04
HKR34147 S bs tr 0.05 1.6 6.46
The TOC content is low with the exception of Sbs in the fresh zone where it accounts for about a third of the total carbon content of the sample.
Given this finding, and the potentially negligible ANC content, total carbon would not be a useful proxy for predicting ANC content of these lithologies.

Appendix D – Materials Characterisation Study
53
7.4 Net Acid Generation and Net Acid Production Potential (Quest 29)
The pH of the sample following digestion in a solution of hot hydrogen peroxide at a 1:100 solid to liquid ratio was conducted on 20 samples from Quest 29. The results are presented in Table 24.
As before, NAPP and MPA were calculated from sulfide sulfur (Scr) values.
Table 24 Net Acid Generation pH – Quest 29
Sample Lithology Weathering Zone NAGpH
pH Units NAPP kg H2SO4/t
Fresh Zone
HKR34178 Pdz Fresh 2.3 61.92
HKR34252 Pdz Fresh 2.5 16.45
HKR34263 Pdz Fresh 2.4 14.82
HKR33883 Psh Fresh 2.5 498.28
HKR33875 Psl Fresh 0.05 86.098
HKR33693 Pst Fresh 6.7 58.66
HKR33768 S bs Fresh 2.1 14.662
HKR33798 S bs Fresh 2 -18.38
HKR34089 S bs Fresh 2.2 -23.69
HKR33648 P sh_fr/fx Fr-fx 4.7 33.65
HKR33678 Pdz_fr/fx Fr-fx 2.9 57.15
Transition and Oxide
HKR33909 Pst Ox 7.1 -23.85
HKR34267 Pst Ox 2.3 311.62
HKR34034 R sr Ox 5.6 -1.68
HKR34049 Pdz tr 2.8 1.36
HKR34265 Pdz tr 2.2 -5.58
HKR33855 Psh tr 7.5 -2.18
HKR34244 Pst tr 7.8 76.66

Appendix D – Materials Characterisation Study
54
Sample Lithology Weathering Zone NAGpH
pH Units NAPP kg H2SO4/t
HKR33824 R sr tr 5 -1.99
HKR34147 S bs tr 6.9 -1.29
The NAG pH ranges from 2.1 to 6.7 (with an average pH of 3) in the fresh zone which is lower than in the transition and oxide zone where NAG pH ranges from 2.2 to 7.8 (with an average pH of 5.24). The higher NAG and lower NAPP average values happen because of the excess neutralising capacity of the sandstone Pst samples in the data set causing a negative NAPP value. The presence of sandstone however cannot be used to predict the acid generation capacity as one of the highest acid generation values is reported in the sandstone HKR34267.
From these data, the lithology or degree of weathering cannot be used to assign acid generation risk as there is variable acid generation potential in each lithology and highly acid generating materials in the oxide zone as well as in the fresh zone.
7.5 Geochemical Classification (Quest 29)
Static test results (total S, total C and paste results), NAG pH and net acid production potential (NAPP) (calculated from sulfide sulfur (Scr) and ANC) are used to provide a classification of materials with respect to their acid generating potential as presented in Table 11 of the Rustlers Roost section. As a reminder the three main classifications are:
Non-acid forming (NAF);
Potentially acid forming (PAF); and
Uncertain (UC).
The results of the classification are presented for the transition and oxide and fresh zones separately (Figure 35 and Figure 36).

Appendix D – Materials Characterisation Study
55
Figure 35 Geochemical Classification of Lithologies in the Fresh Zone at Quest 29
Figure 36 Geochemical Classification of Lithologies in the Oxide and Transition Zone of Quest 29

Appendix D – Materials Characterisation Study
56
Of the samples assessed, 14 are classified as PAF and seven are classified as NAF. PAF lithologies are present in both the fresh, oxide and transition zones.
The sandstones (Pst) can be either PAF or NAF, as can the shales (Sbs). The dolerite (Pdz) and siltstones (Psl) are PAF and the residual saprock (Rsr) in both the oxide and transition zones is NAF.
Although a number of samples plotting very close to the boundary of the NAF classification, the ANC/AP is above 1.5, and therefore there is a sufficient safety factor to manage the acid production in these lithologies to not warrant further assessment of the availability of the ANC.
In summary, at least one sample of each lithology classifies as PAF. The PAF is present across all weathering zones. However, although PAF is present in the oxide and transition zone, these lithologies contain significant acid buffering capacity.
7.6 Multi Element Content (Quest 29)
All 59 samples selected for phase 2 of the geochemical program were digested with four acids and their elemental composition determined.
In general, as seen at Rustlers Roost there is little to distinguish the lithologies or their degree of weathering. The major components of all lithologies are Fe, C, and S which are present at levels measured in % (not shown). The remaining elements (trace elements) were reported as parts per million (equivalent to mg/kg) (Figure 37). Of the trace elements, the elements dominating the signature of all lithologies are Al, Ca, K, Na, Mg, P and Ti. One differentiating feature of the fresh zone lithologies is their Ca and Na concentrations, with Na displaying significantly higher concentrations in the fresh zone lithologies than in the oxide and transition zone lithologies, and Ca reported at comparatively lower concentrations in the oxide zone.
As documented in the Rustlers Roost lithologies, when the dominant elements are removed from the graphs, slight variances in the suite of elements can be observed. In the fresh zone, it is clear that the rare earth elements Ce and La are associated with the sandstones Pst and arsenic is associated with the dolerite Pdz and shales Sbs. The dolerites also host the higher concentrations of Mn and Zn. The shales can be distinguished by higher concentrations of Cu and Pb.
In the transition zone, the dolerite isn’t present in the data set. The sandstones in this zone are still distinguishable from the shales through the presence of Ce, Ba is also notably higher in concentration in the sandstones in this zone. In the oxide zone, all oxide units contain As. In the sandstones, As levels are higher than those measured in the fresh zone lithologies.

Appendix D – Materials Characterisation Study
57
Figure 37 Average Trace Elemental Content Expressed as ppm for all Lithologies in all Weathering Zones

Appendix D – Materials Characterisation Study
58
Figure 38 Average Elemental Concentrations (below 6000ppm) for all Weathering Zones

Appendix D – Materials Characterisation Study
59
7.7 Phase 3 Static Testing (Quest 29)
Phase 3, consisting of ABCC and kinetic NAG was not completed. The ABCC and kinetic NAG tests are designed to provide additional information to assess the acid generation potential and availability of the ANC. As the samples assessed at Quest 29 were generally NAF or PAF, and the ANC/AP ratio for NAF was above 1.5, it was not deemed necessary to complete this phase of testing, as there were few lithologies providing ambiguous classification.
7.8 Phase 4 Static Testing – Characterisation of NAG Liquors (Quest 29)
All samples from phase 2 (59) were submitted for NAG liquor analysis to assess the possible composition of drainage that could be generated from the oxidation of sulfide bearing lithologies. The liquors generated in the NAG test were characterised for a range of components. These included electrical conductivity, major ion composition (Ca, Mg, SO4, Cl, alkalinity and acidity), nutrients (nitrogen and phosphorus species), metals and metalloids.
7.8.1 NAG Liquor pH and Electrical Conductivity
The pH of the NAG liquors was generally acidic (pH 2.0 in Sbs to pH 3.8 in Psh, Figure 25) with the exception of the sandstone Pst which reported a neutral pH 6.8. The lowest pH (pH 1.8) correlated to the highest EC (896 mS/m) in the shale unit (Sbs). Although the pH of the liquors was low, the EC of the liquor was only brackish (between 500 -2500 mS/m) not saline (over 2500 mS/m) (Figure 39).
Figure 39 pH and Electrical Conductivity of NAG Liquors
7.9 NAG Liquor Composition (Quest 29)
7.9.1 Cations The elemental composition of the liquors varies with oxidation zone, and lithology. Although all weathering zones and lithologies liquors are dominated by the major ions Al, Fe, Ca, Mg, K, and S (Figure 40) the trace elemental signature, the element present with the highest concentration is Mn (4.8 ppm in Sbs tr), there are a number of elements with concentrations around 1 ppm in all weathering zones, these are Cu, Pb and Zn, with Ni appearing at this concentration level in the fresh zone (Figure 41).

Appendix D – Materials Characterisation Study
60
Figure 40 Elemental Signature in NAG Liquors from Quest 29 Samples
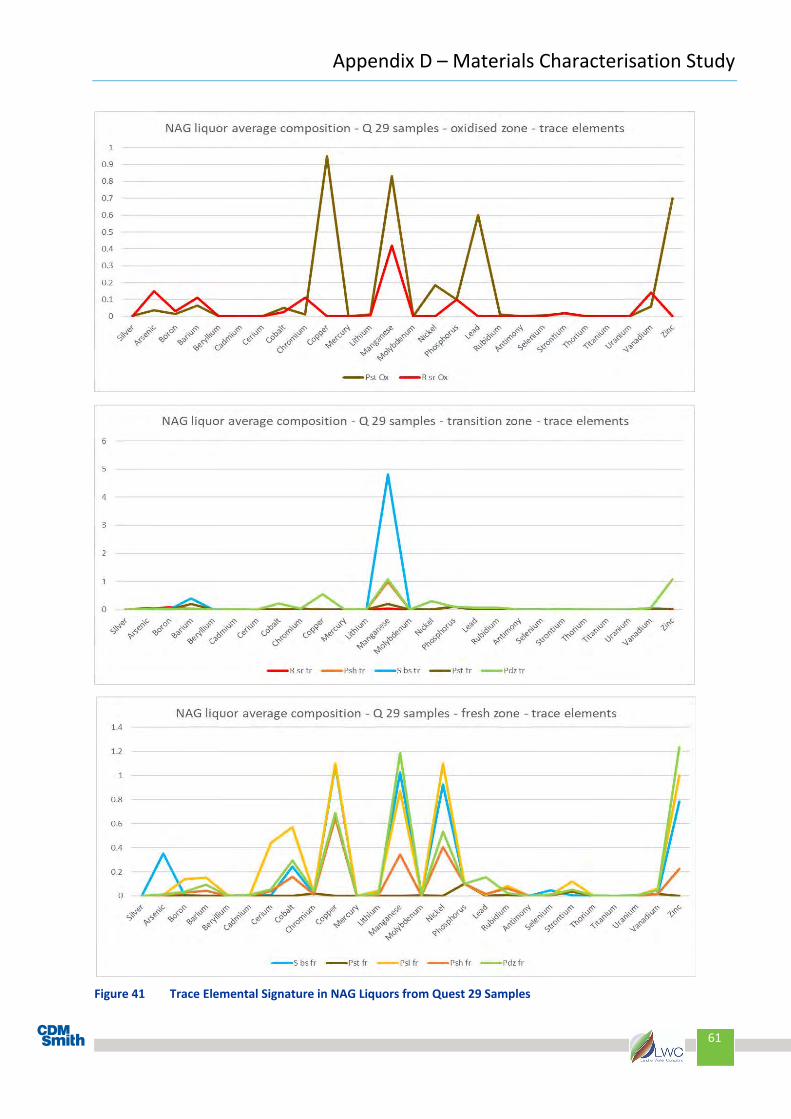
Appendix D – Materials Characterisation Study
61
Figure 41 Trace Elemental Signature in NAG Liquors from Quest 29 Samples
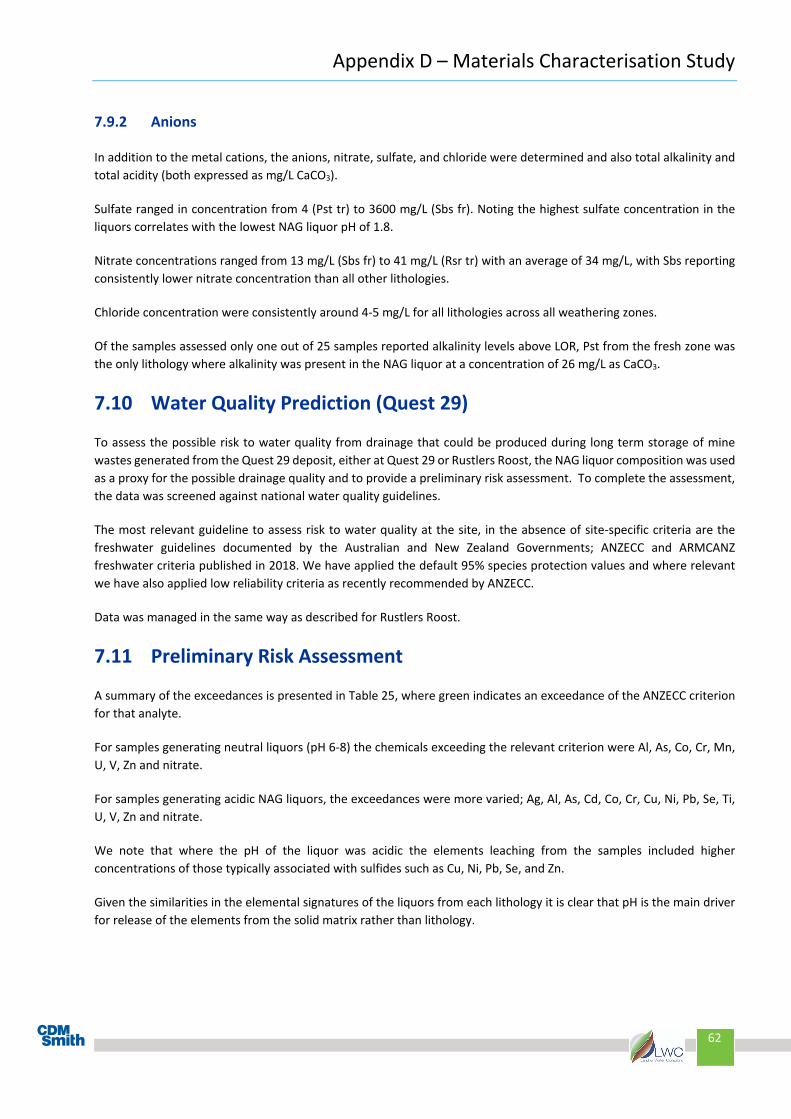
Appendix D – Materials Characterisation Study
62
7.9.2 Anions
In addition to the metal cations, the anions, nitrate, sulfate, and chloride were determined and also total alkalinity and total acidity (both expressed as mg/L CaCO3).
Sulfate ranged in concentration from 4 (Pst tr) to 3600 mg/L (Sbs fr). Noting the highest sulfate concentration in the liquors correlates with the lowest NAG liquor pH of 1.8.
Nitrate concentrations ranged from 13 mg/L (Sbs fr) to 41 mg/L (Rsr tr) with an average of 34 mg/L, with Sbs reporting consistently lower nitrate concentration than all other lithologies.
Chloride concentration were consistently around 4-5 mg/L for all lithologies across all weathering zones.
Of the samples assessed only one out of 25 samples reported alkalinity levels above LOR, Pst from the fresh zone was the only lithology where alkalinity was present in the NAG liquor at a concentration of 26 mg/L as CaCO3.
7.10 Water Quality Prediction (Quest 29)
To assess the possible risk to water quality from drainage that could be produced during long term storage of mine wastes generated from the Quest 29 deposit, either at Quest 29 or Rustlers Roost, the NAG liquor composition was used as a proxy for the possible drainage quality and to provide a preliminary risk assessment. To complete the assessment, the data was screened against national water quality guidelines.
The most relevant guideline to assess risk to water quality at the site, in the absence of site-specific criteria are the freshwater guidelines documented by the Australian and New Zealand Governments; ANZECC and ARMCANZ freshwater criteria published in 2018. We have applied the default 95% species protection values and where relevant we have also applied low reliability criteria as recently recommended by ANZECC.
Data was managed in the same way as described for Rustlers Roost.
7.11 Preliminary Risk Assessment
A summary of the exceedances is presented in Table 25, where green indicates an exceedance of the ANZECC criterion for that analyte.
For samples generating neutral liquors (pH 6-8) the chemicals exceeding the relevant criterion were Al, As, Co, Cr, Mn, U, V, Zn and nitrate.
For samples generating acidic NAG liquors, the exceedances were more varied; Ag, Al, As, Cd, Co, Cr, Cu, Ni, Pb, Se, Ti, U, V, Zn and nitrate.
We note that where the pH of the liquor was acidic the elements leaching from the samples included higher concentrations of those typically associated with sulfides such as Cu, Ni, Pb, Se, and Zn.
Given the similarities in the elemental signatures of the liquors from each lithology it is clear that pH is the main driver for release of the elements from the solid matrix rather than lithology.

Appendix D – Materials Characterisation Study
63
Table 25 Quest 29 NAG Liquor Composition Screened Against ANZECC Freshwater Guidelines
Client ID
Q29 005 Q29 008 Q29 012 Q29 016 Q29 017 Q29 018 Q29 020 Q29 023 Q29 025 Q29 028 Q29 037 Q29 039 Q29 043 Q29 046 Q29 048 Q29 052 Q29 053 Q29 054 Q29 055 Q29 056
Sample DateHKR33768 HKR33798 HKR33648 HKR33678 HKR33693 HKR33824 HKR33855 HKR33875 HKR33883 HKR33909 HKR34034 HKR34049 HKR34089 HKR34147 HKR34178 HKR34244 HKR34252 HKR34263 HKR34265 HKR34267
Sample NumberS bs S bs P sh Pdz Pst R sr Psh Psl Psh Pst R sr Pdz S bs S bs Pdz Pst Pdz Pdz Pdz Pst
fr fr fr/fx fr/fx fr tr tr fr fr Ox Ox tr fr tr fr tr fr fr tr Ox
UNITS LORANZECC 2018
Freshwater default guideline values (mg/L)
MetalsSilver mg/L 0.0001 0.00005 <0.0001 <0.0001 <0.0001 0.0003 <0.0001 <0.0001 <0.0001 <0.0001 <0.0001 <0.0001 <0.0001 <0.0001 <0.0001 <0.0001 0.0009 <0.0001 0.0016 0.0008 0.0006 0.0088Aluminium mg/L 0.005 0.055 8.4 18 0.058 6.7 0.13 <0.005 <0.005 18 52 0.01 <0.005 3.4 28 <0.005 21 <0.005 9.3 8.8 17 11Arsenic mg/L 0.001 0.013** 0.47 0.57 0.005 0.01 0.003 0.017 0.036 0.01 0.002 0.053 0.15 0.003 0.017 <0.001 0.007 0.053 0.008 0.02 0.036 0.022Boron mg/L 0.005 0.37 <0.005 <0.005 0.03* 0.09* <0.005 0.08* 0.033 0.14 0.025 0.023 0.031 0.032 <0.005 <0.005 <0.005 <0.005 0.043 <0.005 0.007 <0.005Barium mg/L 0.0001 0.0017 <0.0001 0.013 0.12 0.0029 0.016 0.0031 0.15 0.078 0.069 0.11 0.071 <0.0001 0.4 0.1 0.21 0.089 0.063 0.012 0.061Beryllium mg/L 0.0001 0.0016 0.0029 0.0002 0.0037 <0.0001 <0.0001 <0.0001 0.0039 0.0034 <0.0001 <0.0001 0.0008 0.0027 <0.0001 0.0018 <0.0001 0.0033 0.0013 0.0019 0.0032Calcium mg/L 0.1 1.6 2.3 0.4 34.6 102 1.2 5.6 27.5 53.7 5 1.8 25.8 5.7 0.2 67.7 4.7 22.5 41.9 10.2 7.8Cadmium mg/L 0.0001 0.0002 0.021 0.0037 <0.0001 0.0017 <0.0001 0.0001 <0.0001 0.0018 0.001 <0.0001 <0.0001 0.0057 0.0007 0.001 0.021 <0.0001 0.013 0.0015 0.041 0.0033Cerium mg/L 0.0005 0.0023 0.0052 <0.0005 0.11 <0.0005 <0.0005 <0.0005 0.44 0.08 <0.0005 <0.0005 0.0035 0.012 <0.0005 0.097 <0.0005 0.0093 0.012 0.0086 0.0023Cobalt mg/L 0.0001 0.0014 0.39 0.16 0.0015 0.27 <0.0001 0.0041 0.0006 0.57 0.32 0.0026 0.027 0.16 0.18 0.0003 0.14 <0.0001 0.33 0.44 0.27 0.099Chromium mg/L 0.0005 0.001*** 0.019 0.022 0.0076 0.024 0.022 0.026 <0.0005 0.029 0.02 0.0015 0.11 0.036 0.015 <0.0005 0.035 0.035 0.072 0.034 0.041 0.021Copper mg/L 0.0001 0.0014 0.73 0.52 <0.0001 0.35 <0.0001 <0.0001 <0.0001 1.1 1.3* <0.0001 <0.0001 0.19 2* <0.0001 0.91 <0.0001 0.89 0.61 0.9 1.9*Iron mg/L 0.005 660 1100 0.016 0.26 <0.005 0.023 <0.005 0.63 4.3 0.006 <0.005 0.54 54 <0.005 22 <0.005 2.5 12 36 18Mercury mg/L 0.0001 0.00006 <0.0001 <0.0001 <0.0001 <0.0001 <0.0001 <0.0001 <0.0001 <0.0001 <0.0001 <0.0001 <0.0001 <0.0001 <0.0001 <0.0001 <0.0001 <0.0001 <0.0001 <0.0001 <0.0001 <0.0001Potassium mg/L 0.1 <0.1 <0.1 2 6.4 2.5 <0.1 <0.1 18.9 17.6 <0.1 <0.1 3.3 <0.1 3.9 9.2 <0.1 2.6 2.4 9.9 3.6Lithium mg/L 0.0001 0.0059 0.023 0.0007 0.024 0.0014 0.0012 0.0065 0.044 0.021 0.0055 0.0054 0.028 0.042 <0.0001 0.014 0.0076 0.029 0.021 0.03 0.018Magnesium mg/L 0.1 4.2 14.3 1.5 13.7 0.4 1.8 5.3 15.1 5.3 6.7 5.3 18.1 15.8 0.5 11.5 3.1 18.1 16.5 18.5 14.7Manganese mg/L 0.0001 1.9 0.13 2.6* 0.16 1.7* <0.0001 0.038 1 0.87 0.53 1.4* 0.42 1.7* 0.35 4.8* 0.8 0.21 0.75 1.5* 0.47 0.26Molybdenum mg/L 0.001 0.034 0.025 0.028 0.005 0.018 0.005 0.002 0.002 0.01 <0.001 0.002 <0.001 0.013 <0.001 0.013 <0.001 0.003 <0.001 <0.001 <0.001 <0.001Sodium mg/L 0.1 <0.1 <0.1 0.2 0.3 0.2 0.3 0.2 0.8 1.7 0.6 0.9 1 <0.1 0.9 1 0.4 1.1 1.2 0.3 0.1Nickel mg/L 0.001 0.011 0.73 1.3* 0.001 0.96 <0.001 0.009 <0.001 1.1* 0.81 <0.001 0.002 0.26 0.75 <0.001 0.45 0.003 0.32 0.4 0.35 0.37Phosphorus mg/L 0.1 <0.1 <0.1 <0.1 <0.1 <0.1 <0.1 <0.1 <0.1 <0.1 <0.1 <0.1 <0.1 <0.1 <0.1 <0.1 <0.1 <0.1 <0.1 <0.1 <0.1Lead mg/L 0.0001 0.0034 0.001 0.001 <0.0001 0.0032 <0.0001 <0.0001 <0.0001 0.01 0.032 <0.0001 <0.0001 0.016 0.0022 <0.0001 0.24 <0.0001 0.15 0.23 0.13 1.2*Rubidium mg/L 0.0001 0.0032 0.0029 0.017 0.032 0.01 0.011 <0.0001 0.081 0.11 <0.0001 <0.0001 0.021 0.019 0.012 0.039 <0.0001 0.015 0.013 0.11 0.023Sulphur mg/L 0.1 920 1300 2.6 70 73 2.7 5.6 95 180 6.1 5.6 77 240 3.4 220 1.3 110 160 220 160Antimony mg/L 0.0001 0.0025 0.0054 0.0001 <0.0001 0.0003 <0.0001 0.0003 <0.0001 <0.0001 0.0003 0.0002 <0.0001 <0.0001 <0.0001 <0.0001 0.0008 <0.0001 <0.0001 <0.0001 <0.0001Selenium mg/L 0.001 0.005 0.054 0.068 <0.001 0.006 0.004 <0.001 <0.001 0.006 0.01 <0.001 <0.001 0.011 0.021 <0.001 0.021 <0.001 0.016 0.007 0.008 0.011Silica mg/L 0.1 4.6 29 10 48 3.6 11 12 67 140 12 34 57 61 14 75 16 51 43 44 31Strontium mg/L 0.0001 0.0038 0.0027 0.0052 0.076 0.038 0.0029 0.014 0.12 0.1 0.022 0.019 0.038 0.0069 0.013 0.041 0.0095 0.049 0.044 0.016 0.013Thorium mg/L 0.0001 0.0023 0.0036 <0.0001 <0.0001 <0.0001 <0.0001 <0.0001 0.0001 0.0053 <0.0001 <0.0001 <0.0001 0.0022 <0.0001 0.022 <0.0001 <0.0001 0.0005 0.0006 0.0001Titanium mg/L 0.0001 0.00003 0.0008 0.0011 <0.0001 0.0003 <0.0001 <0.0001 <0.0001 0.0011 0.0013 <0.0001 <0.0001 0.0003 0.0017 0.0053 0.0008 <0.0001 0.0008 0.0008 0.0037 0.0002Uranium mg/L 0.0001 0.0005 0.0095 0.0064 0.0004 0.0019 <0.0001 0.0001 <0.0001 0.0032 0.0039 <0.0001 <0.0001 0.002 0.0054 0.0002 0.012 <0.0001 0.0004 0.0002 0.0004 0.0009Vanadium mg/L 0.005 0.006 0.016 0.033 0.028 0.084 0.016 0.035 0.032 0.062 <0.005 0.11 0.14 0.093 <0.005 0.057 <0.005 0.027 0.087 0.012 0.005 <0.005Zinc mg/L 0.001 0.008 0.46 1.4* 0.02 0.21 <0.001 0.025 <0.001 1 0.43 <0.001 <0.001 0.77 0.49 <0.001 3.7* <0.001 0.24 0.79 1.4* 1.4*
NutrientsNitrate (as N) mg/L 0.05 0.005^ 19 13 39 38 36 41 35 35 39 37 37 38 31 39 37 39 37 35 34 36Sulphate as (SO4) mg/L 1 2400 3600 11 210 230 9 18 290 550 20 18 220 660 11 700 4 320 480 690 480
AlkalinityAcidity (as CaCO3) mg/L 2 2800 4300 110 99 5 49 <5 170 450 5 7 110 720 5 550 <5 230 370 650 460Total Alkalinity (as CaCO3) mg/L 1 <3 <3 <3 <3 26 <3 <3 <3 <3 <3 <3 <3 <3 <3 <3 <3 <3 <3 <3 <3
GeneralChloride mg/L 1 4 5 6 4 5 5 4 4 4 5 4 4 4 5 5 4 4 4 4 4Electrical Conductivity mS/m 0.2 752 896 13.4 75.7 63.3 12.7 15.4 94.8 146 17.1 15.5 99.1 296 15.3 266 13.4 154 228 338 250pH pH units 0.1 6.0 - 8.0^ 2 2 5 3 6.4 6 6.4 3 3 6 6 3 2 6 2 6 3 2 2 2
* Denotes ICP analysis and higher LOR**Value for AsV adopted
*** Value for CrVI adopted^ Default trigger values for tropical Australia freshwater
Analyte

Section 7 Results – Quest 29
64
7.12 Phase 5 Static Testing - Mineralogy Results (Quest 29)
Semi-quantitative x-ray diffraction (XRD) was completed on 5 composite samples of the principle lithologies at Quest 29 including a sample of the ore. As described in the Rustlers Roost section, the composite samples were prepared in the most part, from the static program discrete samples for the purpose of preparing kinetic columns. The composite sample representative of the contents of the kinetic column were submitted to Microanalysis Australia and analysed on the same instrument using the same software as described in the Rustlers Roost section. The results of the mineralogical analysis are presented in Table 26.
Table 26 X-ray Diffraction Results – Quest 29 Presented as Weight % Sample Mineral
Pdz fr Sbs fr Pdz (LG) Ore Sbs Ore Pdz tr
Dolerite Black Shale Dolerite Black Shale Dolerite Quartz 38 44 38 30 24
Muscovite 27 31 13 19 17 Clinochlore 28 18 28 31 53 Microcline 2 1 2
Pyrite 1 2 1 2 Dolomite 12 2
Albite 2 1 trace 3 1 Kaolinite 3 5 19 2
The mineralogy of the two lithologies assessed (the shale (Sbs fr) and the dolerite Pdz fr) are dominated by quartz, muscovite and clinochlore. The dolerite in the transition zone contains dolomite, a magnesian carbonate whereas it is below LOR for the same lithology in the fresh zone.
Kaolinite is present in the fresh (Pdz fr, Sbs fr) and ore samples (Pdz (LG ore) and Sbs ore. This clay mineral is noted as one of the ore minerals in the Mt Bundy logging codes provided by PGO.
7.13 Ore
The initial sample set available for the geochemical assessment did not include high grade ore samples as these had all been used for gold assay. Thus, an additional sample of high-grade ore black shale (sample ID MTS_248-251) was provided by PGO which was representative of ore at the Rustlers Roost and Quest 29 deposits for the kinetic program. As the sample had not undergone any static testing, a limited program of testing inclusive of paste pH and EC, NAG pH, sulfur and carbon speciation and ANC was completed. The results are summarised in Table 27.
Table 27 Static Test Results for Ore Sample ANC EC(1:2) NAG pH(1:2) S S-S04 TOS
Units kg H2SO4/t mS/m kg H2SO4/t % % % MTS_248-
251 14 75 110 6.9 7.51 0.05 7.46 Where TOS = total oxidisable sulfur
Mineralogical analysis was also completed, please refer to sample Sbs ore presented in Table 26.
The ore is classified as PAF (Figure 35), and plots within the same area of the PAF classification as the other samples of black shale assessed in this study.

Section 7 Results – Quest 29
65
The mineralogical analysis of the ore sample indicates that the ore contains appreciable carbonate (12 wt%) however, it is clear that it is not immediately available to neutralise the acid generated even at relatively low pyrite contents (1 wt % py). The carbonate present is dolomite, this magnesian carbonate has low solubility however, may be available for long term acid management. The results of the kinetic program will be useful in determining whether this carbonate becomes available during sulfide oxidation.
7.14 Discussion and Conclusions (Quest 29)
At Quest 29, the oxide and transition zones represent a smaller proportion of the mine void than at Rustlers Roost. The majority of the ore at Quest 29 lies within the fresh zone. The majority of the gold is hosted within the units Pdz, Psh, Pst, Sbs and Vq (vein quartz).
Sulfur, S, data was not available in the assay data set thus, to assess the potential for acid formation, as for Rustlers Roost, the visible presence of sulfide in the log was used as an indicator for sample selection. Sulfide was reported in 403 samples logged as pyrite, py (389), pyrrhotite, po (3) and arsenopyrite, ap (11) within seven (7) key lithologies. All sulfide bearing lithologies with sufficient samples/proportion of the available core were selected for geochemical characterisation; Fifty nine samples consisting of shale, Psh, clay Rc, saprock Rsr, sandstone Pst, dolerite Pdz, siltstone Psl and black shale Sbs were selected based on the interpretation of their phase 1 screening results:
All 59 samples assessed for their sulfur content had concentrations above LOR.
The paste results showed a wide range of pH and EC values, with the black shales providing the highest sulfur content, lowest pH and highest EC.
The sulfur present is predominantly sulfide, with some organic sulfur present in the black shales, correlating with a higher organic carbon content. Organic carbon can account for up to a third of the carbon content in these shales.
For most of the samples assessed, the ANC content was variable. Of the twenty samples that were selected for detailed acid base accounting, eight samples had a negative NAPP. The lithologies did not have consistent classifications, with all lithologies having at least one sample with insufficient ANC to manage its acid generating potential and thus all lithologies have the potential to host PAF materials. PAF material were present in all weathering zones, including the oxide zone. The only carbonate mineral identified in the deposit is dolomite. This magnesian carbonate will neutralise acid, however not as readily as calcite.
From the historical work completed at the site it is thought the distribution of PAF is likely related to the structural setting within the area of interest. The ore fluids would have contained sulfide, their pathway was structurally not lithologically controlled (refer to Geochemical desk study 2019 and references therein). The PAF zones will likely correlate to the ore zones, although they will extend into the waste zones following the fluid pathway. From the data generated in this study there is insufficient data to delineate areas of greatest PAF risk but generalisations can be made:
The lithologies at Quest 29 are generally more sulfidic than those at Rustlers Roost, particularly in the fresh zone.
The sandstones, siltstones, shales and dolerite all contain sulfides which can be found unoxidized even in the oxide zone.
The saprock and clays in the oxide zone are NAF and are unlikely to contain PAF material, the low paste pH reported is likely due to free iron in the solution and not from the oxidation of sulfides.
The elemental content of the lithologies reflects the hydrothermal setting, with all lithologies displaying a similar elemental signature. The mineralogy is consistent with these findings, with the lithologies across the weathering zones being relatively indistinguishable from each other mineralogically. One would have expected a shale (a metamorphic sediment) to have a different mineralogy to a dolerite (a mafic igneous rock) but that was not the case at this site.
Section 7 Results – Quest 29
66
The major elemental components of all lithologies are Fe, C, and S which are present at levels measured in %. The remaining elements (trace elements) were reported as parts per million (ppm – mg/kg). Of the trace elements, the elements dominating the signature of all lithologies are Al, Ca, K, Na, Mg, P and Ti.
The trace elemental signature displayed notable concentrations of As in the elemental composition of the sandstones both in the oxide and fresh zones of the deposit.
On further data evaluation we noted Arsenic (As) has a positive correlation with the concentration of iron in the transition zone. This is not unexpected as the transition zone hosts the majority of the ore, with arsenopyrite a known ore mineral. However, the relationship with iron does not continue in the oxide and fresh zones. This is interpreted as demonstrating the numerous sources of iron in the fresh and oxide zones that are not related to the ore forming processes. For example, the chlorite mineral clinochlore which represents over 50% of the mineralogy of the dolerite, contains iron but not arsenic. Chlorites are formed during alteration of the host rock, thus although they are a direct consequence of the hydrothermal event, they did not precipitate directly from the hydrothermal fluids, unlike the gold and arsenopyrite. In the oxide zone there are likely many mineral phases containing iron which can sequester As onto their surface or into the mineral matrix such as carbonates, oxides, sulfates and phosphates. We note that As can be released from these phases upon wetting particularly in high pH waters which can eventuate during the first flush events following a prolonged dry period.
The elemental signature of the NAG liquors is also reflective of the mineralogy recorded in the major lithologies. As previously discussed, the chlorite mineral clinochlore is present as a major mineral phase, although Mg and Fe are the typical elements associated with this aluminium silicate, other divalent elements such as Ni may also substitute into the mineral matrix. The presence of these elements in the elemental and NAG liquor signature suggests that such substitutions are likely to have occurred in this system.
Arsenic is released from the fresh and oxide zones. For the oxide zones, the As was likely released by the higher pH generated in these liquors as As is known to desorb from solid phases at pH above 8.5 (Smedley and Kinniburgh, 2001). The high pH in the oxide zones may be due to evaporation, or concentration of dissolved salts due to surface water percolation through the soil/sediment profile. Other elements likely to also be released by this desorption mechanism are Mn, Se, V, and U.
In the fresh zone, particularly in the sulfidic black shales, As was likely released during the oxidation of sulfides. The low pH generated by the oxidation of sulfides caused a wide range of elements to be released from the minerals present, by both mineral dissolution and desorption mechanisms. The elements typically associated with sulfides such as As, Cu, Pb, Ni, Se and Zn are all represented in the acidic NAG liquors.
Based on the preliminary risk assessment completed in this study, there are a range of chemicals of potential concern (COPC) with respect to site water quality. The current site water quality is a freshwater system.

Section 8 Naturally Occurring
67
Section 8 Naturally Occurring Radioactive Material
The head of chain radionuclides uranium (U) and thorium (Th) content of the principles lithologies present within the two deposits, Rustlers Roost and Quest 29 were measured (Table 28).
All pulps collected for the static geochemical assessment described above were digested with four acids and their total U and total Th content determined.
The average content of each lithology is presented in Table 28 along with the content measured in the ore and tailings samples provided by PGO.
Table 28 Uranium and Thorium Content of Waste, Ore and Tailings for Rustlers Roost and Quest 29
Quest 29 Th U mg/kg mg/kg
Pdz fr 6.16 1.45 Psh fr 11.40 2.76 Psl fr 32.09 6.65 Pst fr 32.09 6.65 S bs fr 16.08 13.92 Pdz fr/fx 5.57 1.56 Pst fr/fx 4.96 2.15 Pst tr 40.6 6.53 R sr tr 15.52 3.79 S bs tr 13.93 1.99 R c Ox 9.02 3.13
Life of Mine Th U mg/kg mg/kg
Tailings 15.41 4.41 Ore 28.26 20.47
Rustlers Roost Th U mg/kg mg/kg
Psh fr 18.82 5.24 Psl fr 19.30 4.87 Pst fr 21.94 5.48 Ss fr 18.05 4.46
Psh tr 18.93 5.34 Psl tr 19.90 5.17 Pst tr 17.78 4.14 S cs tr 31.68 7.7 Ss tr 19.26 4.76
Psh ox 14.8 3.60 Psl ox 12.28 3.18 Rsl ox 24.47 7.15 Ss ox 16.45 3.48

Section 8 Naturally Occurring
68
Under the guidance from the National Directory (ARPANSA) a material is deemed radioactive if the concentration of any radionuclide in the U and Th decay chain is above the exemption values in schedule 4. The exemption value is 1 Bq/g.
As we have not measured the activities of the U and Th, only the total content. To calculate the activities we must assume that the minerals at the site are in secular equilibrium that is that their radioactivity is directly proportional to the total head of chain elemental concentration.
Published specific activities for natural uranium and thorium isotopes in a system in equilibrium are as follows:
U-238 specific activity = 12.4 Bq/kg; and
Th-232 specific activity = 4 Bq/kg.
Thus, the activity is measured concentration (mg/kg) x 0.0124 for U to give Bq/g. The activity is measured concentration (mg/kg) x 0.004 for Th to give Bg/g.
U-238 and Th-232 are the most common isotopes, to calculate the total activity of the sample we add the activities of the U and Th head of chain elements together (Table 29).
Table 29 Total Activities of each Lithology, Ore and Tailings for Rustlers Roost and Quest 29 Quest 29
Th U Th U Total Activity
mg/kg mg/kg Activity Bq/g Activity Bq/g Bq/g Pdz fr 6.16 1.45 0.02 0.02 0.04 Psh fr 11.40 2.76 0.05 0.03 0.08 Psl fr 32.09 6.65 0.13 0.08 0.21 Pst fr 32.09 6.65 0.13 0.08 0.21 S bs fr 16.08 13.92 0.06 0.17 0.24 Pdz fr/fx 5.57 1.56 0.02 0.02 0.04 Pst fr/fx 4.96 2.15 0.02 0.03 0.05 Pst tr 40.60 6.53 0.16 0.08 0.24 R sr tr 15.52 3.79 0.06 0.05 0.11 S bs tr 13.93 1.99 0.06 0.02 0.08 R c Ox 9.02 3.13 0.04 0.04 0.07
Life of Mine Th U Th U Total Activity mg/kg mg/kg Activity Bq/g Activity Bq/g Bq/g
Tailings
15.41 4.41 0.06 0.05 0.12 Ore
28.26 20.47 0.11 0.25 0.37
Rustlers Roost
Th U Th U Total Activity mg/kg mg/kg Activity Bq/g Activity Bq/g Bq/g
Psh fr 18.82 5.24 0.08 0.06 0.14 Psl fr 19.3 4.87 0.08 0.06 0.14 Pst fr 21.94 5.48 0.09 0.07 0.16 Ss fr 18.05 4.46 0.07 0.06 0.13
Psh tr 18.93 5.34 0.08 0.07 0.14 Psl tr 19.9 5.17 0.08 0.06 0.14 Pst tr 17.78 4.14 0.07 0.05 0.12 S cs tr 31.68 7.7 0.13 0.10 0.22 Ss tr 19.26 4.76 0.08 0.06 0.14
Psh ox 14.8 3.6 0.06 0.04 0.10 Psl ox 12.28 3.18 0.05 0.04 0.09 Rsl ox 24.47 7.15 0.10 0.09 0.19 Ss ox 16.45 3.48 0.07 0.04 0.11

Section 8 Naturally Occurring
69
There are no samples exceeding the 1 Bq/g activity limit based on their average U and Th content.
8.1 NORM Discussion
The Australian Radiation Protection and Nuclear Safety Authority (ARPANSA) published the national codes and guidance in the Radiation Protection Series (RPS)10 to provide guidance and promote protection of human health and the environment from radiation.
In 2020, ARPANSA published a guide to classification of radioactive wastes, RPS G-4, which includes guidance on the classification of mine waste. They acknowledge that the criteria for assessing NORM is different than that for manmade radioisotopes. The principal factors informing the management measures are activity and half-life of the radioisotopes present. NORM tends to have a very long half-life, which is why we can still measure it in geological strata that were deposited many years prior.
Exemption levels exist for materials mined from areas with NORM, exemption levels are presented in the National Directory for Radiation Protection Series No 6 published in February 2014 and Schedule I of the General Safety Requirements No. GSR Part 3 Radiation Protection and Safety of Radiation Sources: International Basic Safety Standards4, published by the IAEA (2014)11. The exemption levels for natural U and Th is 1 Bq/g for each isotope in the U and Th decay chain. Thus, based on the data presented here (which provides an indication of the NORM content and activities of subsurface materials that could be present in the wastes, ore and tailings generated from mining of the Rustlers Roost and Quest 29 deposits) in the most part an exemption may be possible.
It is noted that some samples contain a considerable amount of fluorapatite which was found to be Th bearing (up to 6 wt% of the sample tested). Thus, there are likely areas of the Rustlers Roost mine where total activities may be higher than documented here.
For radiation protection requirements for NORM the reader is directed to RPS 9 (ARPANSA 2005) and RPS 15 (ARPANSA 2008) for more information.
Given the data presented above, further assessment of these materials is required to better understand the radionuclide content of this material given the activity of the one ore sample assessed. Therefore, it is recommended that prior to operation, further radionuclide analysis is conducted on the materials which includes and assessment of the total activity and assessment of each material’s secular equilibrium.
10 https://www.arpansa.gov.au/regulation-and-licensing/regulatory-publications/radiation-protection-series/guides-and-recommendations
11 https://www-pub.iaea.org/MTCD/Publications/

Section 9 Overall Conclusions
70
Section 9 Overall Conclusions
The Rustlers Roost and Quest 29 project areas contain waste materials (rock and tailings) which are acid forming, these materials will require management to minimise the impacts to the surrounding environment from the release of solutes (leachable elements and compounds).
Oxide waste materials (all lithologies assessed) are predominantly NAF; however, caution must be adopted in assigning all materials in the oxide zone as NAF given at the boundary into the transitional zone, the oxide materials can classify as PAF.
Additional NAF waste (in the shales) is present in the fresh zone at depth at Rustlers Roost. Transitional zone waste is generally classified as UC (long lag PAF) or PAF. The ore (from Quest 29) is also PAF.
For the ore transported from Quest 29 to Rustlers Roost for processing, measures to manage both acidic leachate and radioactivity should be put in place.
As more information is obtained about the site materials, site-specific criteria for classifying PAF waste rock can be generated and incorporated into a block model to estimate the quantities of materials that have the potential to generate acid or mobilise metals at each stage of mining. In turn, this information can be used to update the site conceptual model, perform more detailed risk assessment, design and implement control and management strategies for both operations and post-closure phase.
Typical management considerations where the avoidance of disturbance is not an option include:
Segregation and selective placement;
Encapsulation;
Backfilling of hydrogeologically contained voids with minimal re-handling of materials; and
Water management measures such as bunding.
The selection of the most appropriate management measures is based on site-specific environmental considerations including the climate, geology, hydrogeology, hydrology and geochemistry of the materials and cost and schedule implications to the Project.
Encapsulation should consider not only the acid generation potential of the waste but should also consider radioactivity requirements given the results gathered for the ore.

Section 9 Overall Conclusions
71
Appendix A – Disclaimer and Limitations

Appendix A – Disclaimer and Limitations
Disclaimer and Limitations This report has been prepared by CDM Smith Australia Pty Ltd (CDM Smith) for the sole benefit of Primary Gold Ltd for the sole purpose of providing preliminary geochemical assessment for the Rustlers Roost and Quest 29 Open-Cut Mine Redevelopment project.
This report should not be used or relied upon for any other purpose without CDM Smith’s prior written consent. Neither CDM Smith, nor any officer or employee of CDM Smith, accepts responsibility or liability in any way whatsoever for the use of or reliance on this report for any purpose other than that for which it has been prepared.
Except with CDM Smith’s prior written consent, this report may not be:
a. released to any other party, whether in whole or in part (other than to officers, employees and advisers of PrimaryGold Ltd);
b. used or relied upon by any other party; or
c. filed with any Governmental agency or other person or quoted or referred to in any public document.
Neither CDM Smith, nor any officer or employee of CDM Smith, accepts responsibility or liability for or in respect of any use or reliance upon this report by any third party.
The information on which this report is based has been provided by Primary Gold Ltd and third parties. CDM Smith (including its officers and employees):
a. has relied upon and presumed the accuracy of this information;
b. has not verified the accuracy or reliability of this information (other than as expressly stated in this report);
c. has not made any independent investigations or enquiries in respect of those matters of which it has no actualknowledge at the time of giving this report to Primary Gold Ltd; and
d. makes no warranty or guarantee, expressed or implied, as to the accuracy or reliability of this information.
In recognition of the limited use to be made by Primary Gold Ltd of this report, Primary Gold Ltd agrees that, to the maximum extent permitted by law, CDM Smith (including its officers and employees) shall not be liable for any losses, claims, costs, expenses, damages (whether in statute, in contract or tort for negligence or otherwise) suffered or incurred by Primary Gold Ltd or any third party as a result of or in connection with the information, findings, opinions, estimates, recommendations and conclusions provided in the course of this report.
If further information becomes available, or additional assumptions need to be made, CDM Smith reserves its right to amend this report.