
Appendix 5j: Understanding Customer Values Trust ...
65
Appendix 5j: Understanding Customer Values_ Trust Experiment Report
Transcript of Appendix 5j: Understanding Customer Values Trust ...

Appendix 5j: Understanding Customer Values_ Trust Experiment
Report

PR19 Understanding Customer Values: Work Package 6 – Trust Experiment
Prepared for Yorkshire Water


Acknowledgements
AECOM would like to thank Professor Nicholas Hanley (University of St. Andrews) for providing peer review of
the work undertaken for this work package.
Quality information
Document name Prepared for Prepared by Date Approved by
Work Package 6
Draft Report
Yorkshire Water Chris White
(AECOM)
Petrina Rowcroft
(AECOM)
01/11/17 Petrina Rowcroft
(AECOM) Work Package 6
FInal Report
Yorkshire Water Petrina Rowcroft
(AECOM)
30/11/17 Chris White
(AECOM) AECOM Infrastructure & Environment UK Limited (AECOM) has prepared this Report for the sole use of Yorkshire Water (“Client”) in accordance with the terms and conditions of appointment. No other warranty, expressed or implied, is made as to the professional advice included in this Report or any other services provided by AECOM. This Report may not be relied upon by any other party without the prior and express written agreement of AECOM. Where any conclusions and recommendations contained in this Report are based upon information provided by others, it has been assumed that all relevant information has been provided by those parties and that such information is accurate. Any such information obtained by AECOM has not been independently verified by AECOM, unless otherwise stated in the Report.

Contents
Contents ............................................................................................................................................................................ 2
Work Package 6 – Trust Experiment Summary ................................................................................................................. 3
Aims ................................................................................................................................................................................... 3
Method ............................................................................................................................................................................... 3
Results ............................................................................................................................................................................... 5
Implications ........................................................................................................................................................................ 7
Appendix - Methodology and Results ……………………………………………..……………………………………………...11

Work Package 6 – Trust Experiment
Context The aim of this project is to undertake primary research to ascertain the values that Yorkshire Water (YWS)
customers place on changes in service measures such as interruptions to supply or drinking water failures.
These values will then be used to populate the Decision Making Framework (DMF) in order to inform the
investment planning process and support the wider Outcome Delivery Incentives (ODI) work stream.
In light of Ofwat’s recommendations for improving the approach to understanding customer’s values in PR19,
the project includes six work packages (see Figure 1) which draw on a range of data to allow methodological
triangulation; whereby data of different types are used to cumulatively refine and validate research outputs.
Figure 1. Overview of the six work packages
The aim of this work package is to assess the extent to which customer trust in YWS has a measurable impact
on the financial performance of the business and to trial an approach (or approaches) to quantifying and valuing
this. The underlying hypothesis is that service measure failures such as sewer flood events or drinking water
quality failures lead to lower levels of trust in YWS amongst its customers, which in turn results in a larger
number of customers refusing to pay their water bills, and thereby financial costs to YWS.
The analyses conducted here are an attempt to establish a quantifiable relationship between trust and
willingness-to-pay (WTP) that will provide an important contribution to our understanding of social capital. It is
nevertheless recognised that progress in this area is limited by the available data. As such, this work package
is considered to be an experimental approach to understanding trust that is intended to provide a first step in
developing a better understanding of trust.
Aims The questions that this work package aims to answer are as follows: (1) What factors define trust?; (2) to what
extent do different service measure failures impact levels of customer trust in YWS?; (3) Which service
measures are most important in terms of determining customer trust?; (4) What impact does trust have on
customers’ willingness-to-pay (WTP)?; (5) Do service measure failures impact the likelihood of customers
paying their water bills?; and (6) Do service measure failures mean that YWS incurs higher levels of debt?
Method The first step in this work package was to undertake a review of the literature surrounding the measurement
and valuation of trust. The main aim of the review was to identify and evaluate approaches to quantifying and
valuing trust that could potentially be adapted to obtain a measure of the impact of changes in levels of customer

trust on the financial performance of YWS. The review revealed four broad potential approaches:
• Valuing trust as an attribute of customer WTP.
• Exploring trust as an incentive for customers to stay with YWS.
• Understanding trust as a factor behind decision making in a resource allocation game.
• Measuring the impact of trust on customer’s payment of water bills.
The last-mentioned of these four approaches was considered to offer the most promising approach to explore
as part of this work package given that: the necessary data required to undertake the analysis was likely be
more readily available; the second- and third-mentioned approaches are subject to significant hypothetical bias
and may not yield reliable results; and it could potentially provide useful insights beyond generating values for
the use in the DMF. In particular, the approach may reveal opportunities for YWS to increase levels of trust
amongst its customer base by targeted improvements in service areas, thereby improving cost recovery and
reducing debt.
Figure 2 shows the assumed impact pathway (or ‘logic chain’) that underlies the selected methodology. This
hypothesises that a service measure failure impacts on customers’ trust in YWS to provide the expected level
of service. This in turn impacts upon customers’ propensity to pay their water bills which means that YWS is not
able to recover the costs of the service provided and may incur interest charges on the debt.
Figure 2: Logic chain of assumptions underlying the methodology
YWS holds numerous datasets that were identified as being potentially useful for implementing the
methodology. Based on a high-level review of these datasets, three analytical approaches were tested:
• Analysis of company-wide / aggregate data on service measure failures and payment records: the
aim of this analysis was to try to establish a direct link between service measure failures and bill
repayment levels (with trust assumed to be an implicit factor in customers’ propensity to pay) at an
aggregate or company-wide level. This analysis involved two stages: (1) establishing whether there
is a link between service measure failures and the number of customers who have defaulted on
payment, where defaults are assumed to be payment refusals; and (2) establishing the cost to YW
as a result of customer payment refusals. The first stage comprised an analysis of YWS time series
data on the number of payment refusals each year and the number service measure failures each
year between 2012/13 and 2016/7. A regression analysis was then undertaken to establish if there
is a quantifiable link between the two factors. The final step was then to estimate the average cost
to YWS for each customer with defaulted payment status. This was done by combining information
on the average water bills of customers who refuse to pay and the additional costs incurred by YWS
such as interest charges on debt incurred and/or penalties and missed rewards under Ofwat’s
Outcome Delivery Incentive (ODI) scheme.
• Analysis of Customer Tracker survey data: the analysis described above attempts to quantify the
relationship between service measure failures and the likelihood of payment refusals, where trust
is considered to be an implicit factor in customer behaviour. Using YWS Customer Tracker data, it
was possible to undertake an alternative analysis in which trust is explicitly accounted for as an
intermediary factor in customer behaviour. This analysis took broadly the same form as that above
although there was a need to first establish a relationship between service measure failures and
trust, and then between levels of trust and numbers of payment refusals at a company-wide level.
• Analysis of individual customer records: in contrast to the analyses described above, the third
approach that was tested investigated individual customer records on both payment history over a
one-year period (2016) and the number of service measure failures experienced over the previous
year(s).There was insufficient explanatory power to support a regression analysis and so a more

simple percentage attribution was undertaken to establish a link at an individual customer level.
Results What factors define trust?
Despite emerging evidence from market research on the importance of trust in influencing customer behaviour,
scholarly research on the topic is limited. Very little academic research has attempted to document empirically
the factors that affect trust and where attempts have been made, this research has not systematically
investigated the significance of trust in relation to other potential explanatoryfactors.
Market research conducted amongst water company customers in the UK suggests that higher levels of trust
are associated with reliable water and sewerage services, value for money and customer service. Conversely,
low levels of trust are associated with perceptions of poor value for money, high profits and inaffordability.
To what extent do different service measure failures impact levels of customer trust in YWS?
An analysis of 7,300 responses to the Customer Tracker survey over the period 2015-17 – in which respondents
are asked the extent to which they agree or disagree with the statement “Yorkshire Water are a company I trust”
– found that trust in YWS is typically high and that the majority (> 75%) of customers consistently ‘strongly
agree’ with the statement. A regression analysis of this dataset found that drinking water quality, internal
flooding, and odour related service measure failures all have a quantifiable negative impact on levels of trust in
YWS. However, it is important to note that service measure failures only explain a very small amount of the
variance in customers’ levels of trust in YWS.
An analysis of the proportion of individual YWS customers who have experienced service measure failures
found that customers experiencing unplanned supply interruptions, drinking water quality events, internal and
external floods, and pollution incidents are more likely to be in arrears in the following year than typical YWS
customers (see Figure 3). At least part of the explanation for the increased likelihood of being in arrears may
be related to a loss of trust in YWS.
Figure 3. YWS customers in arrears
The results therefore suggest that, while there are a wide range of factors which impact on trust, there is some
evidence that unplanned supply interruptions, drinking water quality events, internal and external floods, and
pollution incidents may have negative impacts on trust in YWS; with the evidence being strongest for drinking
water quality, internal flooding, and odour.
Which service measures are most important in terms of determining customer trust?
Analysis of the Customer Tracker survey results found that odour events have the most significant negative
27%
7%
68%
45%
56%
70%
20%
0%
10%
20%
30%
40%
50%
60%
70%
80%
Unplannedinterruption
Plannedinterruption
Water(bio/chem)
Water(aesthetic)
Externalflooding
Internalflooding
Pollutionevents
% YWS customers experiencing SMFs in arrears % of total YWS customers in arrears

impact on trust; with each customer experiencing an odour event giving, on average, a 0.63 lower score on the
tracking survey. Odour was followed by internal flooding events (leading to a 0.49 lower score) and drinking
water quality events (with a 0.32 lower score). The analysis of individual customer data also found that internal
flooding events led to the most significant increase in likelihood of a customer going into arrears (57% more
likely) followed by drinking water quality events (55% more likely). This analysis found that biological/chemical
water quality incidents, as opposed to aesthetic incidents, had the greatest impact on customers going into
arrears. There was no data in this analysis on odour related issues.
The results therefore suggest that odour events are the most important service measure in terms of influencing
customer trust followed by internal flooding and drinking water quality events (particularly biological/chemical
incidents).
What impact does trust have on customers’ willingness-to-pay (WTP)?
It was not possible to explore this question with respect to Yorkshire Water within the agreed scope of the work
package. Nevertheless, the academic research points clearly to a positive relationship between social capital
(of which different aspects of trust are key components) and WTP. The literature review also highlighted some
of the aproaches that could be considered for similar projects in future:
• Valuing trust as an attribute of WTP – one approach could be to include a series of attitudinal
questions within a typical Stated Preference survey. The responses to these attitudinal questions
could then be analysed to estimate the component of the overall WTP value which could be
attributed to trust. This approach would be based on the assumption that customers with higher
levels of trust in YWS would be likely to expect YWS to use money raised from their customers
reliably, and thereby would be more likely to have a higher WTP for investing in tackling service
measure failures.
• Trust as an incentive for customers to stay with YWS – an alternative approach could be to
undertake a Stated Preference survey which estimates the level of monetary incentive customers
would be willing to accept in order to switch from YWS to a new, untested water utility. This
approach would be based on the assumption that customers with high levels of trust in YWS would
be more likely to require a higher incentive to switch to an untested new provider.
• Analysing the results from Work Packages 1, 2 & 5 – as an alternative to undertaking additional
primary research, the data collected as part of Work Packages 1, 2 & 5 could be used to explore
this question in more depth. For example, WP1 examined the extent to which respondents’
experiences of service measure failures influenced WTP and found that there was generally a
positive relationship between service measure failures and WTP (i.e. those who had experienced
failures exhibited a higher WTP for at least). Moreover, the information collated for each of these
work packages is spatially explicit (i.e. can be attached to individual postcodes) and thus could be
combined with YWS data on arrears (by postcode) to reveal whether or not stated preferences (i.e.
the WTP estimates) track actual payment behaviour).
Do service measure failures impact the likelihood of customers paying their water bills?
The analysis of individual customer data found that customers who experienced service measure failures in
2016 (aside from planned supply interruptions) were more likely than the average YWS customer to be in arrears
the following year. For example, in 2016-17 it was estimated that around 14% of customers were in arrears, by
contrast, around double the proportion of customers experiencing unplanned supply interruptions were in
arrears in 2017.
The proportion of people experiencing service measure failures in 2016 and being in arrears in 2017 was highest
for internal flood events and drinking water quality (biological/chemical) events; such that 70% and 68% of all
customers experiencing these service measure failures were in arrears the following year. This suggests that a
large proportion of the customers who experience these service measure failures may fail to repay their bills in
future.
The average water bill for defaulted customers in 2016-17 was estimated to be £405 per year, while the wider
costs of bill payment refusals were estimated to be £3.976 million or around £23 per defaulting customer. The
total average cost per payment refusal is thus estimated to be around £428 per year. It can be seen from Figure
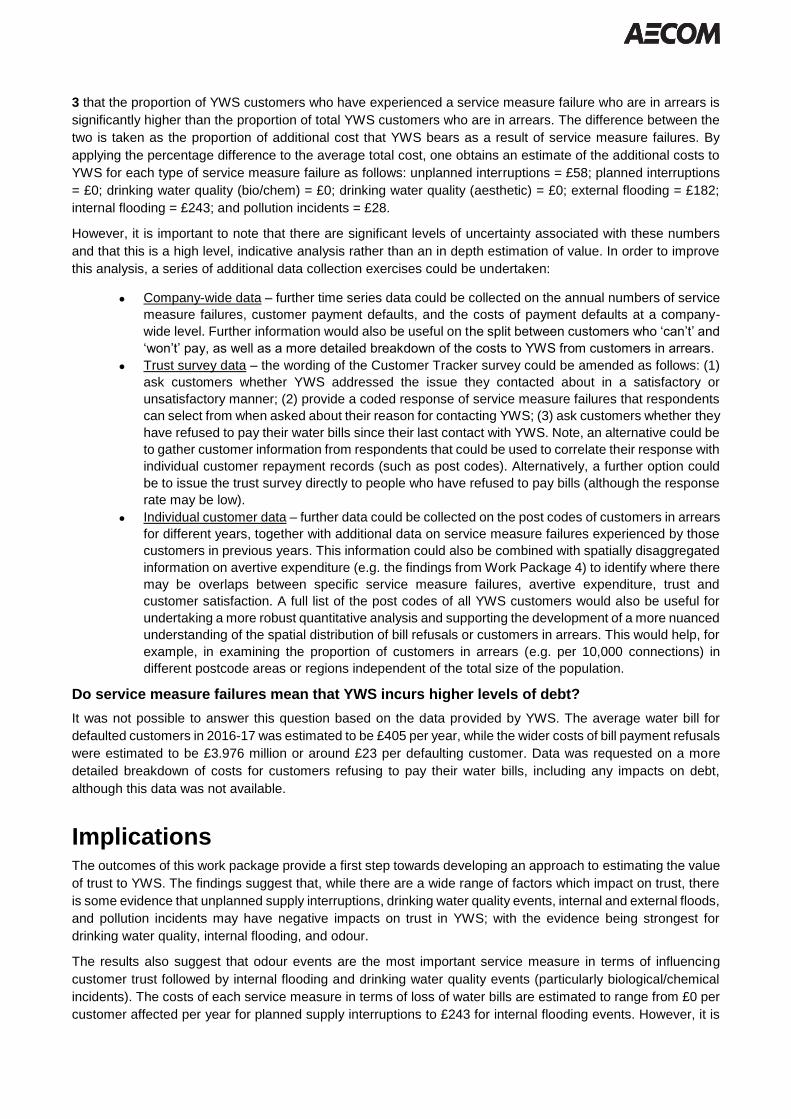
3 that the proportion of YWS customers who have experienced a service measure failure who are in arrears is
significantly higher than the proportion of total YWS customers who are in arrears. The difference between the
two is taken as the proportion of additional cost that YWS bears as a result of service measure failures. By
applying the percentage difference to the average total cost, one obtains an estimate of the additional costs to
YWS for each type of service measure failure as follows: unplanned interruptions = £58; planned interruptions
= £0; drinking water quality (bio/chem) = £0; drinking water quality (aesthetic) = £0; external flooding = £182;
internal flooding = £243; and pollution incidents = £28.
However, it is important to note that there are significant levels of uncertainty associated with these numbers
and that this is a high level, indicative analysis rather than an in depth estimation of value. In order to improve
this analysis, a series of additional data collection exercises could be undertaken:
• Company-wide data – further time series data could be collected on the annual numbers of service
measure failures, customer payment defaults, and the costs of payment defaults at a company-
wide level. Further information would also be useful on the split between customers who ‘can’t’ and
‘won’t’ pay, as well as a more detailed breakdown of the costs to YWS from customers in arrears.
• Trust survey data – the wording of the Customer Tracker survey could be amended as follows: (1)
ask customers whether YWS addressed the issue they contacted about in a satisfactory or
unsatisfactory manner; (2) provide a coded response of service measure failures that respondents
can select from when asked about their reason for contacting YWS; (3) ask customers whether they
have refused to pay their water bills since their last contact with YWS. Note, an alternative could be
to gather customer information from respondents that could be used to correlate their response with
individual customer repayment records (such as post codes). Alternatively, a further option could
be to issue the trust survey directly to people who have refused to pay bills (although the response
rate may be low).
• Individual customer data – further data could be collected on the post codes of customers in arrears
for different years, together with additional data on service measure failures experienced by those
customers in previous years. This information could also be combined with spatially disaggregated
information on avertive expenditure (e.g. the findings from Work Package 4) to identify where there
may be overlaps between specific service measure failures, avertive expenditure, trust and
customer satisfaction. A full list of the post codes of all YWS customers would also be useful for
undertaking a more robust quantitative analysis and supporting the development of a more nuanced
understanding of the spatial distribution of bill refusals or customers in arrears. This would help, for
example, in examining the proportion of customers in arrears (e.g. per 10,000 connections) in
different postcode areas or regions independent of the total size of the population.
Do service measure failures mean that YWS incurs higher levels of debt?
It was not possible to answer this question based on the data provided by YWS. The average water bill for
defaulted customers in 2016-17 was estimated to be £405 per year, while the wider costs of bill payment refusals
were estimated to be £3.976 million or around £23 per defaulting customer. Data was requested on a more
detailed breakdown of costs for customers refusing to pay their water bills, including any impacts on debt,
although this data was not available.
Implications The outcomes of this work package provide a first step towards developing an approach to estimating the value
of trust to YWS. The findings suggest that, while there are a wide range of factors which impact on trust, there
is some evidence that unplanned supply interruptions, drinking water quality events, internal and external floods,
and pollution incidents may have negative impacts on trust in YWS; with the evidence being strongest for
drinking water quality, internal flooding, and odour.
The results also suggest that odour events are the most important service measure in terms of influencing
customer trust followed by internal flooding and drinking water quality events (particularly biological/chemical
incidents). The costs of each service measure in terms of loss of water bills are estimated to range from £0 per
customer affected per year for planned supply interruptions to £243 for internal flooding events. However, it is

important to note that trust is complex and there are levels of uncertainty associated with these numbers.

Appendix 1: Methodology
1.1 Overview
The aim of this work package is to assess the extent to which customer trust in Yorkshire Water (YWS) has a
measurable impact on the financial performance of the business and to trial an approach (or approaches) to
quantifying and valuing this. While there does not appear to be an explicit definition of trust offered by water
companies, Ofwat or the Consumer Council on Water (CC Water), ‘trust’ is understood here to be customers’
belief in YWS to provide reliable, safe and affordable waste and wastewater services and to engage in honest,
regular and co-operative behaviour. The underlying hypothesis is that service measure failures such as flood
events or drinking water quality failures lead to lower levels of trust in YWS amongst its customers, which in
turn results in a larger number of customers refusing to pay their water bills, and thereby financial costs to YWS.
The specific questions that the work package seeks to answer are as follows:
• What factors define trust?
• To what extent do different service measure failures impact upon levels of customer trust in YWS?
• Which service measures are most important in terms of determining customer trust?
• What impact does trust have on customers’ willingness-to-pay (WTP)?
• Do service measure failures impact the likelihood of customers paying their water bills?
• Do service measure failures mean that YWS incurs higher levels of debt?
An enhanced understanding of the relationship between service measure failures and levels of trust in YWS
may provide useful insights in terms of identifying, for example:
• Which service measures typically have the most influence on customer trust levels.
• Where YWS should prioritise investment to increase levels of trust and thereby promote cost recovery.
Establishing a quantitative link between service measure failures and the value of their impact on trust will also
allow trust – as a factor that is both impacted by investment decisions and affects YWS’s overall financial
performance – to be incorporated into the Decision Making Framework (DMF) and YWS’ wider investment
planning decisions.
It is, however, recognised that there are potentially a wide range of factors that determine levels of trust
(including, for example, reliability (based on past experience), communication and customer service,
transparency, value-for-money, affordability, perceptions of profits, and the extent to which the business is
considered a good employer)1. Furthermore, the available evidence on the relationship between trust and
willingness to pay is relatively sparse (see Nocella et al, 2014; Vainen et al, 2017, Temperini et al, 2017, Jones
et al., 2015 for some examples).
Within the water sector, the Consumer Council for Water (CCW) conducts annual surveys of household
1 See http://utilityweek.co.uk/news/water-company-trust-issues/1158632#.WekTMWhSyUk and https://www.ofwat.gov.uk/about-us/meeting-the-challenges/

customers’ views on their water and sewerage services, including their level of trust in their water company and
water companies (including YWS) themselves monitor customer satisfaction and trust. These surveys do not,
however, extend as far as placing a value on trust or measuring the extent to which trust is a determinant of
WTP for the services received.
The analyses conducted here are an attempt to establish a quantifiable relationship between trust and WTP
that will provide an important contribution to our understanding of social capital. It is nevertheless recognised
that progress in this area is limited by the available data. As such, this work package is considered to be
experimental and is intended to provide a first step in developing a better understanding of trust.
This Appendix provides an overview of the methodology used in this work package, the following Appendix sets
out the results and implications for YWS.
1.2 Literature review
There is a substantial literature focusing on the determinants of demand (or willingness to pay, WTP) for
environmental goods and services and natural resource management (see for example Mitchell and Carson,
1989; Nielsen et al., 2003; Spash, 2006; Kayaga et al., 2003; Yao et al., 2014; Breffle et al., 2015). It is only
relatively recently, however, that specific attention has been devoted to understanding how social capital
influences individuals' WTP (Glaeser et al., 2000; Nocella et al., 2010; Polyzou et al., 2011; Jones et al., 2015)
where social capital is broadly defined as the links, shared values and understandings in society that enable
individuals and groups to trust each other and to work together (Putnam, 2001; WBCSD, 2016; A4S, 2016).
Trust as an indicator of social capital and WTP
Despite the importance of trust, scholarly research on the topic is limited. Very little academic research has
attempted to document empirically the factors that affect trust and where attempts have been made (e.g.,
Crosby et al., 1990), this research has not systematically distinguished trust from related factors.
Putnam (1995) identifies trust as a key measure of social capital, defining it as “features of social organization
such as networks, norms, and social trust that facilitate coordination and cooperation for mutual benefit”
(Putnam, 1995: 67). Jones et al. (2015) and Polyzou et al. (2011) identify four components of social capital that
are of particular relevance to WTP:
• Social trust, which refers to trust towards people in general or to specific social groups (Uslaner and
Conley, 2003). Halkos and Jones (2012) and Polyzou et al (2011) posited that social trust is likely to
have a positive influence on individuals’ WTP as individuals with higher levels of social trust will view
more positively the principle of paying for an improvement in an environmental good or service due to
their belief that other community members will also act collectively, and will similarly be prepared in
practice to contribute towards the cost of the proposed intervention.
• Institutional trust, referring to trust in the institutions that operate within a community (e.g.
Government, local authorities, non-governmental organisations) (e.g. Paxton, 1999). Previous studies
have shown that both the intention and WTP of individuals are significantly determined by the level of
trust in the proposed management body, or the public authority to use moneys prudently and
appropriately (Krystallis and Chryssohoidis, 2005; Meyerhoff and Liebe, 2006; Whitehead and Cherry,
2007; Anderson, 2017; Habivov et al., 2017). Distrust towards the management actor, is regarded as
one of the main reasons for protest responses and reluctance or refusal to pay (Jones et al., 2008; Yoo
et al., 2001; Whitehead and Cherry, 2007).
• Social networks and civic participation, relating to the involvement of individuals in formal and
informal networks and also their interest for collective issues of their community (Putnam, 2000). Recent
studies (Yao et al., 2014) have shown, for example, that people who are members of environmental
NGOs are also more willing to pay for natural resource management measures. This is because

environmental NGOs tend to raise awareness of headline issues, such as climate change impacts, and
this increased environmental awareness can lead to a higher WTP contribution (Polyzou et al., 2011).
• Compliance with social norms, and specifically the tendency of individuals to comply with formal or
informal community rules aimed at protecting the interests of their community (van Oorschot et al.,
2006), including contributing money for environmental protection and improvement. Alló and Loureiro
(2014), for example, performed a meta-analysis of data from a large number of empirical studies on the
willingness to pay for climate change mitigation to explain the social and cultural determinants of the
cross-country differences that they observe in the sample. They found that countries with a high
propensity to conform to social norms are associated with willingness to pay for climate change
mitigation.
There are a number of studies that have tried to identify the impact of social capital by using attitudinal measures
of trust from survey questionnaires. Knack and Keefer (1997), for example, show that an increase of one
standard deviation in country-level trust predicts an increase in economic growth of more than one-half of a
standard deviation. More recently, however, the focus has shifted to examining specific behaviours using
experiments (Glaeser et al., 2000) or empirical data Polyzou et al., 2011; Jones et al., 2015). This follows from
research by Glaeser al., (2000) which found that responses to attitudinal questions were weak predictors of
trust in that the responses did not necessarily correspond to actual trusting behaviours. They found that past
trusting behaviour was better than the abstract attitudinal questions in predicting subjects’ experimental choices.
This suggests that other elements of social capital (e.g. compliance with social norms, participation in social
networks, etc may be just as important in determining behaviour.
The findings of the Edelman Trust Barometer, an annual global trust and credibility survey involving some
33,000 respondents across 28 countries, reveal that trust carries important implications for future business
success. Respondents indicated that trust or lack of trust in a particular company has influenced their behaviors
in the previous 12 months. In the 2015 survey, 80 percent of respondents said that they chose to buy a particular
product or service because they trusted the company behind it. Sixty-three percent said they refused to
purchase a product or service because they distrusted a particular company (see Figure 4).
Figure 4. Behaviours based on trust (Edelman Trust Barometer, 2015)
Several studies have examined the extent to which social capital, and specifically levels of social and
institutional trust and participation in social networks, influences WTP for goods and services across a range of

sectors. These cover a range of sectors including energy, water, flood protection and biodiversity.
Wiser (2007) estimated WTP for 1,574 individual households to determine their preferences between public and
private supplies of renewable energy technologies. The findings suggested that households were willing to pay
more if the money was to be paid to the private suppliers (the agent of trust) than to the government (the agent
of mistrust).
Haile and Slangen (2009) used stated preference surveys (contingent valuation methodology) to evaluate the
willingness to pay for the benefits of Agri-Environmental Schemes (AES) by households living in Winterswijk,
the Netherlands. Households in the sample were asked to state their WTP values for land use benefits within
the AES which is provided by farmers. The findings suggest that WTP depends positively on the level of trust
as well as the extent to which households are members of or support environmental organisations.
Oh and Hong (2012) sought to investigate the extent to which trust determines citizens’ WTP for public projects
in Korea. Using the Hicksian compensating variation method and citizen’s subjective views on the
trustworthiness of government, the authors were able to establish a positive association between citizens’ trust
in government and their WTP.
Using a contingent valuation survey, Polyzou et al., (2011) examined the influence of social capital parameters
on individuals’ WTP for improvements in tap water quality within a community in Greece, and specifically the
relationship between social capital and zero and protest responses. The survey was designed to capture
information on environmental practices (including the frequency with which individuals drink tap water),
demography and social capital. Social and institutional trust were measured using a Likert scale, where zero
represented the lowest level of trust and 10 the highest. Institutional trust was examined in relation to the
institutions responsible for water management – the Government, the Ministry of Environment and the
Municipality. The study found that higher levels of social capital were associated with higher bids for the
improvement of water quality. Moreover, 60% of the respondents refused to pay as they felt that they already
paid enough through state taxes, that the management by local government actors was inefficient and that
financing the improvements was the responsibility of the state.
Closer to home, Jones et al. (2015) investigated the WTP of residents in rapidly eroding coastal zones in south-
east England to contribute towards the costs of constructing and maintaining hard engineered coastal defences
and explored, using the same approach as Polyzou et al. (2011), the influence of social capital parameters
(social trust, institutional trust, social reciprocity and social networks) on respondents’ WTP. They found that
three out of the four social capital parameters measured had a statistically significant impact on WTP. In
particular, both institutional and social trust had a positive influence, suggesting that respondents who tend to
trust their fellow citizens and also trust coastal management agencies are more willing to pay for defence works.
The unexpectedly high level of protest responses (refusals to pay) were attributed to low levels of instititutional
trust.
Social networks, however, were found to have a largely negative impact on WTP, contradicting the assumptions
that participation in social networks increases monetary contributions (Polyzou et al., 2011; Veronesi et al.,
2014). This may, at least in part, be explained by the existing networks in the area that help sustain the idea
that construction and maintenance of coastal defences should be the responsibility of institutions (in this case
the Environment Agency) and that local communities should not be burdened with their funding.
Customer satisfaction, trust and WTP
Prior research in the marketing field has shown that trust and satisfaction are positively correlated (Crosby et
al., 1990; Yoon, 2002). Evidence outlined by Kennedy et al. (2001) shows that customer satisfaction is an
antecedent of trust in the service provider. However, meta-analytical studies on satisfaction (Szymanski and
Henard, 2001) and trust (Geyskens et al., 1998) have shown that while satisfaction and trust are closely related,
they are conceptually different.
Ranaweera and Prabhu (2003) note, for example, that while successful service delivery may satisfy the
customer, it may not be possible to erase all the negative feelings associated with the initial service failure,
especially where the failure is noted and the recovery process is initiated by the customer. Customers may be
entirely satisfied with the response and recovery process, but they may not necessarily forget the incident and
trust the service provider not to make similar mistakes in the future. Trust has therefore been shown to be an
important factor in customer loyalty.
Research supports the notion that there is a positive relationship between customer satisfaction and financial
performance (e.g., Anderson, Fornell, and Rust 1997; Rust and Zahorik 1993; Homburg et al., 2005). Anderson
et al. (1994) analysed data obtained from the Swedish Customer Satisfaction Index and found that “firms that
actually achieve high customer satisfaction also enjoy superior economic returns (p. 63).” Similarly, through two
experimental studies, Homburg et al. (2005) revealed the existence of a strong positive impact of customer
satisfaction on willingness to pay.
Trust in the provision of water and wastewater services
Customer satisfaction with their service and their ability to pay bills underpins trust and confidence in water and
wastewater services (Ofwat, 2017). The most recent household satisfaction survey (Water Matters)2 conducted
on behalf of the Consumer Council for Water (CCWater) revealed that:
• The level of trust in the industry has fallen significantly since 2015 across both England and Wales (7.59
vs. 7.75 in 2015)3 although the overall five-year trend remains stable.
• Amongst the water and sewerage companies (WaSCs), Yorkshire Water ranked fourth in terms of its
five-year rolling average trust score and has a higher rolling average than the collective industry and
WaSC average.
• Trust was found to be highest amongst customers who are retired (7.83 vs 7.46 for those who are not
retired), without children in the household (7.68 of those earning less than £10,000 and 7.72 of those
earning between £10,000 and £19,999 compared to the average), and those living in rural areas (7.73
vs 7.58 for urban customers and 7.49 for suburban customers).
• Households are significantly less likely to trust their water company in cases where they have contacted
their water company in the past 12 months compared to those who have not (7.36 vs 7.63), where they
disagree that their bill is clear about how much needs to be paid and when (6.03 vs 7.82 who agree
their bill is clear), where they are dissatisfied with the value for money of water services (5.94 vs 7.98
satisfied with value for money), and where they disagree that their water company cares about the
service it provides (4.98 vs 8.25 who agree that their water company cares).
• The main reasons for distrust are the feeling that water companies are too expensive or poor value for
money and that they are generally untrustworthy / dishonest (14% each). These reasons were closely
followed by the perception that water companies are more concerned with making money than they are
2 Water Matters is the annual household satisfaction tracking survey commissioned by the Consumer Council for Water. Commissioned first in 2006, Water Matters aims to identify household customers’ views of water and sewerage services across England and Wales and monitors changes in these views over time. The 2016 survey consisted of 5,420 telephone interviews with household water bill payers between 10th October 2016 and 15th January 2017. A minimum of 200 interviews were carried out with each Water and Sewerage Company (WaSC) and a minimum of 150 with each Water only Company (WoC). 3 Customers were asked to what extent they trust their water company on a scale of 1 – 10 with 1 being ‘do not trust them at all’ and 10 being ‘trust them completely’.

about their customers (see Figure 6).
Figure 5. Reasons for lack of trust in water companies (bmg research for CC Water, 2016)
In a 2015 survey of 1,000 households in England and Wales, DJS Research looked into why customers trust or
don’t trust their water company. In line with the CCWater findings, it found that the majority of customers (64
per cent) trust their water company. The main reason why customers trust their water company is because their
water and sewerage services are reliable. Two-thirds (67 per cent) of those who trust their supplier picked this
as one of the top three reasons why, with this figure increasing to 87 per cent among those aged 65+.
Second to reliability comes value for money and customer service, with 41 per cent saying that their bills are
good value and 39 per cent saying they have had good customer service from their water company. In London
and the South East, having an affordable bill (45 per cent and 43 per cent respectively) is the next most selected
reason for trust, whereas in the North East, South West, Wales and East Midlands a good customer service
experience is chosen ahead of affordability (41 per cent, 35 per cent, 38 per cent and 40 per cent).
Where customers expressed distrust in their water supplier, this tended to be based on views about charges
and principles rather than service, which again accords with the CCWater findings. The research revealed that
one in ten customers does not trust their supplier and this is most likely to be because they see their water bills
as poor value for money (42 per cent), or as unaffordable (20 per cent). Perceptions of water company profits
are also important, with 46 per cent choosing this as one of their reasons to distrust. Some customers (25 per
cent) feel fairly neutral about trust. When asked what their water company could do to help them form a more
trusting view, almost two-thirds (62 per cent) said that reducing their bill or giving less money to shareholders
(31 per cent) would help.
These findings accord with the complaints data compiled by CCWater (2017) which shows that in the 2016/17
period, just under half (43.8%) of the written complaints received by Yorkshire Water were related to billing and

charges (see Figure 6).
Figure 6. Written customer complaints to water companies by category (CCWater, 2017)
Conclusions
While there is a small but growing body of evidence that demonstrates the positive relationship between
customer satisfaction, trust and individuals’ willingness to pay (WTP), empirical identification of the effect of
trust, and social capital more generally, on firm performance in general, and against specific metrics in particular,
is challenging and its measurement and valuation is not straightforward.
The research that has been undertaken as part of Work Package 6 and that is presented below is
unprecedented; it is, we believe, the first time that information on customer satisfaction, trust and actual payment
data has been combined and analysed in order to establish the extent to which customer trust in an organisation
(in this case Yorkshire Water) affects actual payment levels.
1.3 Scoping potential approaches
The literature review pointed to a number of potential approaches that could be considered and applied to
quantifying the value of trust to YWS. These included:
• Valuing trust as a determinant of WTP. Following the lead of Jones et al (2015)4, one approach
identified was to include a series of attitudinal questions within the Stated Preference surveys carried
out in Work Packages 1 and 2. The responses to these attitudinal questions could then be analysed to
estimate the proportion of the total WTP value which could be attributed to trust, similar to the way in
which use and non-use values are being differentiated in Work Packages 1 and 2. This approach is
based on the assumption that those customers with higher levels of trust in YWS are those that perceive
YWS to reinvest money raised from their customers reliably, and are therefore also more likely to have
a higher WTP for investing in tackling service measure failures. A potential limitation with this approach
4 Jones et al. (2015) 'Social capital and willingness-to-pay for coastal defences in south-east England', Ecological Economics, vol. 119, pp. 74-82.

is that it would not generate a separate or standalone value for trust within the DMF, but instead would
support an analysis of the relative contribution of the constituent components of total WTP.
• Trust as an incentive for customers to stay with YWS – an alternative approach could be to
undertake a separate Stated Preference survey in order to estimate the level of monetary incentive
required for customers to switch from YWS to a new, untested water utility. This approach would be
based on the assumption that customers with high levels of trust in YWS would be more likely to require
a higher incentive to switch to an untested new provider. Unlike the previous approach, this would
generate a standalone value for trust in the DMF but it is subject to hypothetical bias as respondents
would be asked about their preferences for a service provider that does not exist (notwithstanding
opening up of retail competition for household customers). Respondents would also need to consider
the transaction costs associated with a switch to an alternative provider.
• Understanding trust as a factor behind decision making in a resource allocation game – a third
approach could be to ask YWS customers to play the role of an investor who needs to decide where
and how much to invest in different hypothetical water companies with different levels of trust and rates
of service measure failures. The results could then be used to explore trade-offs between money
allocated and trust in terms of the players’ expectations that the investment would be used to deliver
services that customers want and can afford, in an equitable and environmentally responsible way. This
approach would rest on the assumption that participants in the game would be more likely to invest in
utilities with higher levels of trust. A challenge with this approach would lie in the potential complexity of
designing this game to generate a reliable value of trust given that trust may be only one amongst a
number of factors governing an investor’s propensity to invest.
• Measuring the impact of trust on customer’s payment of water bills – a final approach identified
for valuing the impact of trust would be to look at data collected by YWS in terms of service measure
failures and numbers of customers refusing to pay water bills in order to try to establish whether there
is a quantifiable link between the two factors. This approach would be based on the assumption that
customers experiencing service measure failures would be more likely to have lower levels of trust in
YWS and thereby a greater likelihood of refusing to pay their water bills. This approach does, however,
rely on the availability of relevant time-series data that is collected on a regular and consistent basis.
Following discussions with YWS, it was agreed that the last-mentioned of these four approaches was
considered to offer the most promising approach to explore as part of this Work Package given that:
• the necessary data required to undertake the analysis was likely be more readily available;
• the second- and third-mentioned approaches are subject to significant hypothetical bias and may not
yield reliable results; and
• it could potentially provide useful insights beyond generating values for the use in the DMF. In particular,
the approach may reveal opportunities for YWS to increase levels of trust amongst its customer base
by targeted improvements in service areas, thereby improving cost recovery and reducing debt.
1.4 Developing a methodology
Figure 6 shows the assumed impact pathway (or ‘logic chain’) that underlies the selected methodology. This
hypothesises that a service measure failure impacts on customers’ trust in YWS to provide the expected level
of service. This in turn impacts upon customers’ propensity to pay their water bills which means that YWS is not
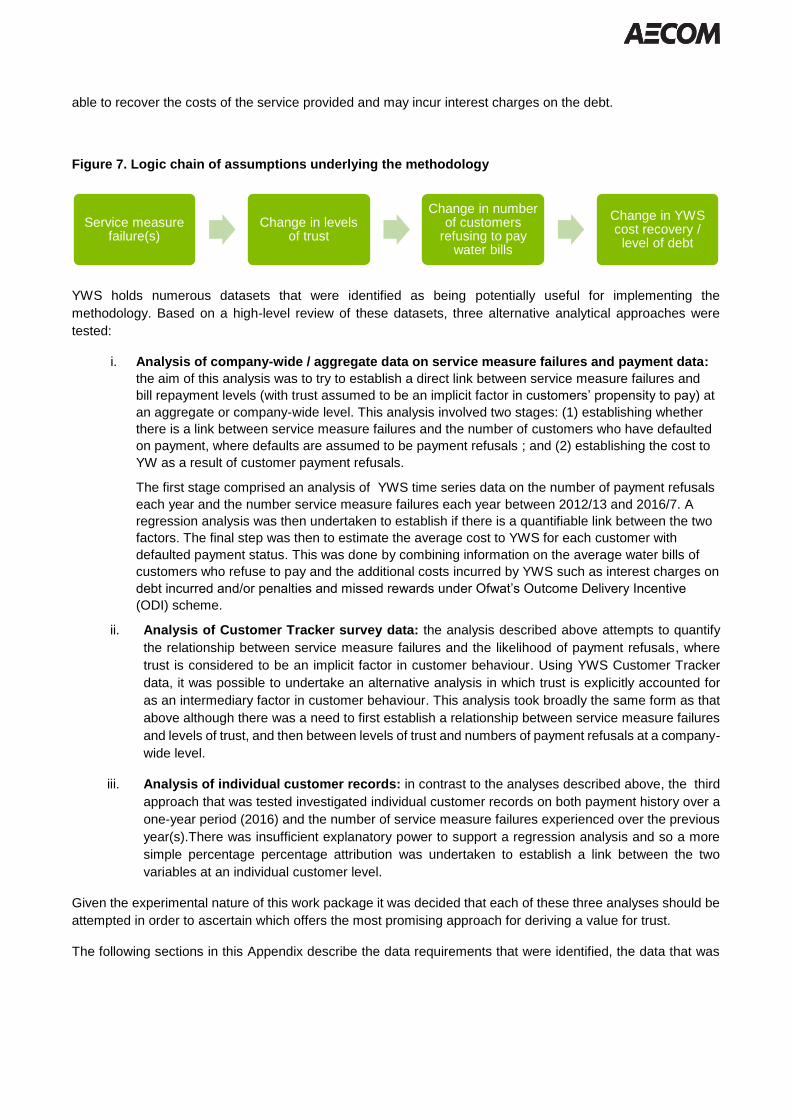
able to recover the costs of the service provided and may incur interest charges on the debt.
Figure 7. Logic chain of assumptions underlying the methodology
YWS holds numerous datasets that were identified as being potentially useful for implementing the
methodology. Based on a high-level review of these datasets, three alternative analytical approaches were
tested:
i. Analysis of company-wide / aggregate data on service measure failures and payment data:
the aim of this analysis was to try to establish a direct link between service measure failures and
bill repayment levels (with trust assumed to be an implicit factor in customers’ propensity to pay) at
an aggregate or company-wide level. This analysis involved two stages: (1) establishing whether
there is a link between service measure failures and the number of customers who have defaulted
on payment, where defaults are assumed to be payment refusals ; and (2) establishing the cost to
YW as a result of customer payment refusals.
The first stage comprised an analysis of YWS time series data on the number of payment refusals
each year and the number service measure failures each year between 2012/13 and 2016/7. A
regression analysis was then undertaken to establish if there is a quantifiable link between the two
factors. The final step was then to estimate the average cost to YWS for each customer with
defaulted payment status. This was done by combining information on the average water bills of
customers who refuse to pay and the additional costs incurred by YWS such as interest charges on
debt incurred and/or penalties and missed rewards under Ofwat’s Outcome Delivery Incentive
(ODI) scheme.
ii. Analysis of Customer Tracker survey data: the analysis described above attempts to quantify
the relationship between service measure failures and the likelihood of payment refusals, where
trust is considered to be an implicit factor in customer behaviour. Using YWS Customer Tracker
data, it was possible to undertake an alternative analysis in which trust is explicitly accounted for
as an intermediary factor in customer behaviour. This analysis took broadly the same form as that
above although there was a need to first establish a relationship between service measure failures
and levels of trust, and then between levels of trust and numbers of payment refusals at a company-
wide level.
iii. Analysis of individual customer records: in contrast to the analyses described above, the third
approach that was tested investigated individual customer records on both payment history over a
one-year period (2016) and the number of service measure failures experienced over the previous
year(s).There was insufficient explanatory power to support a regression analysis and so a more
simple percentage percentage attribution was undertaken to establish a link between the two
variables at an individual customer level.
Given the experimental nature of this work package it was decided that each of these three analyses should be
attempted in order to ascertain which offers the most promising approach for deriving a value for trust.
The following sections in this Appendix describe the data requirements that were identified, the data that was
Service measure failure(s)
Change in levels of trust
Change in number of customers
refusing to pay water bills
Change in YWS cost recovery /
level of debt

available from YWS, the methods used for analysing the data as well as any underlying assumptions.
1.5 Company-wide / aggregate analysis of service measure failure and payment data
The aim of this analysis was to establish whether there is a quantifiable link between the number of service
measure failures each year and the costs incurred by YWS from refusals to pay water bills at a company-wide
level. This assumes that customers who have experienced a service measure failures will implicitly have a lower
degree of trust in YWS and that this in turn adversely affects their propensity to pay. In order to undertake the
analysis a request was sent to YWS for the following datasets:
• Customer payment status by year i.e. annual payment data and specifically information on the number
of customers who refuse to pay their bills each year at a company-wide level.
• Service measure failures by year i.e. the number and type of service measure failures each year at a
company-wide level.
• Costs of payment refusals i.e. the monetary cost to YWS associated with customers who refuse to pay
their bills each year.
1.5.1 Customer payment status by year
YWS supplied annual data on the number of customers failing to pay their bills at a company-wide level over
the period 2012-13 to 2016-17.5 Bill payers were classified into nine categories depending on their payment
status (see Table 1).
It is recognised that there is likely to be a difference between customers who ‘can’t’ pay their bills versus
customers who ‘won’t’ pay their bills; although it was not possible to distinguish between these two categories
on the basis of the available data. As such, it was assumed that all customers in the ‘defaulted’ category refused
to pay their water bills. This analysis, therefore, represents an oversimplification of a complex issue asthose
who cannot pay their bills could be more sensitive to service measure failures in cases where they may have
fewer coping mechanisms and are therefore less resilient. Furthermore, given that affordability was identified
by CCWater as one of the key drivers of stated levels of trust (see Section 1.2), it is possible that those who
cannot pay and who have experiened a service outage would have significantly lower levels of trust (and would
be even less likely to pay) than whose who simply refuse to pay. Further information on the proportion of
customers who can’t pay their bills relative to those who won’t pay would be needed to extend the analysis. This
should include multi-dimensional, time-series data that will allow for other factors that may contribute to non-
5 YWS (2017) ‘Trust data overview V3.xls’

payment over the course of a year (e.g. proximity to Christmas, start of school terms, etc).
Table 1. Summary of customer payment status by year
No. customers by payment status 2012-13 2013-14 2014-15 2015-16 2016-17
Up to date with payments
(% of total customer base)
1,899,780
(91.16)
2,109,662
(89.75)
2,130,183
(88.16)
2,158,866
(88.10)
2,191,738
(86.39)
1 Month down 21,769 38,751 21,308 21,132 26,809
2 Months down 31,441 34,224 44,044 38,739 89,342
3 Months down 22,871 24,603 33,760 22,818 12,786
4 Months down (paying on special arrangement) 6,167 5,706 11,447 7,897 4,418
5 Months down (paying on special arrangement) 16,729 13,511 13,499 10,459 1,977
6 Months down (paying on special arrangement) 23,121 23,409 20,278 26,434 9,286
Defaulted
(% of total customer base)
47,090
(2.26)
83,524
(3.55)
118,911
(4.92)
140,238
(5.72)
172,311
(6.79)
Under query 15,003 17,239 22,707 23,844 28,400
Total customers 2,083,971 2,350,629 2,416,137 2,450,427 2,537,067
1.5.2 Service measure failures by year
YWS provided information on the number service failures per year for a range of service measures over the
period 2007-08 to 2016-17. There were some limitations with the data insofar as it:
• Was not available for each measure consistently across this period
• Did not use the same classification system as the DMF, and therefore necessitated a number of
assumptions in order to align the information provided with the DMF service measure categories as far

as possible.
The way in which the datasets were aligned with the DMF service measure categories is set out in Table 2.
Table 2. Overlap between service measure failures data provided by YWS and DMF categories

DMF Service
Measure DMF Impact Category Corresponding Dataset Categorisation in Dataset
Unplanned
Interruption to
Supply
< 3hrs Table 02.xls Interruptions
and Low Pressure -
3 - 6hrs Table 02.xls Interruptions
and Low Pressure
(i) Unplanned interruptions - 3
hours exactly + (iii) Interruptions
caused by third parties - 3 hours
exactly + (iv) Unplanned
interruptions (overruns of planned
interruptions) - 3 hours exactly +
(i) Unplanned interruptions – More
than 3 hours + (iii) Interruptions
caused by third parties – More
than 3 hours
6 - 12hrs Table 02.xls Interruptions
and Low Pressure
(i) Unplanned interruptions – more
than 6 hours + (iii) Interruptions
caused by third parties – More
than 6 hours + (iv) Unplanned
interruptions (overruns of planned
interruptions) – More than 6 hours
12 - 24hrs Table 02.xls Interruptions
and Low Pressure
(i) Unplanned interruptions – more
than 12 hours + (iii) Interruptions
caused by third parties – More
than 12 hours + (iv) Unplanned
interruptions (overruns of planned
interruptions) – More than 12 hours
>24hrs Table 02.xls Interruptions
and Low Pressure
(i) Unplanned interruptions – more
than 24 hours + (iii) Interruptions
caused by third parties – More
than 24 hours + (iv) Unplanned
interruptions (overruns of planned
interruptions) – More than 24 hours
Planned
Interruption to
Supply
< 3hrs Table 02.xls Interruptions
and Low Pressure -
3 -6hrs Table 02.xls Interruptions
and Low Pressure
(ii) Planned and warned
interruptions - 3 hours exactly +
(ii) Planned and warned
interruptions – More than 3 hours
6 - 12hrs Table 02.xls Interruptions
and Low Pressure
(ii) Planned and warned
interruptions – More than 6 hours
12 - 24hrs Table 02.xls Interruptions
and Low Pressure
(ii) Planned and warned
interruptions – More than 12 hours
Poor Pressure Pressure below minimum
acceptable level
Table 02.xls Interruptions
and Low Pressure
Properties below reference level at
end of year
Leakage Leakage Table 10 Total leakage
Drinking Water
Quality
(Biological &
Chemical)
Trivial/ threshold sample failure Table 11a APR17 Final
Water Quality (Overall
Compliance)
WQ parameter sample
exceeds PCV at WTW - no
health impact
Table 11a APR17 Final
WQ parameter sample
exceeds PCV at WTW - health
impact
Table 11a APR17 Final

DMF Service
Measure DMF Impact Category Corresponding Dataset Categorisation in Dataset
WQ parameter sample
exceeds PCV at SRE - no
health impact
Table 11a APR17 Final
WQ parameter sample
exceeds PCV at SRE - health
impact
Table 11a APR17 Final
WQ parameter sample
exceeds PCV at Customer
Property - no health impact
Table 11a APR17 Final
WQ parameter sample
exceeds PCV at Customer
Property - health impact
Table 11a APR17 Final
Protective advice required /
Health impact due to PCV
exceedence
Table 11a APR17 Final
Drinking Water
Quality
(Aesthetic)
Taste and Smell Table 11a APR17 Final
Consumer Contacts - Discoloration
(per 1000 population)
Discolouration Table 11a APR17 Final
Acceptability - Milky / Cloudy /
Particles Table 11a APR17 Final
Internal
Property Sewer
Flooding
(Hydraulic and
Other Causes)
Internal flooding of a cellar
(Other Causes)
Table 03. Internal Sewer
Flooding
Properties where flooding limited to
uninhabited cellars only (other
causes)
Internal flooding of habitable
area (Other Causes)
Table 03. Internal Sewer
Flooding
Properties flooded in the year
(other causes)
Internal flooding of a cellar
(Hydraulic)
Table 03. Internal Sewer
Flooding
Properties where flooding limited to
uninhabited cellars only (o/loaded
sewers)
Internal flooding of habitable
area (Hydraulic)
Table 03. Internal Sewer
Flooding
Properties flooded in the year
(overloaded sewers) + Properties
flooded in the year (Stability &
Reliability)
External Sewer
Flooding
(Hydraulic and
Other Causes)
Flooding of minor roads (Other
Causes)
Table 03a External Sewer
Flooding
Flooding incidents (other causes -
equipment failure) + Flooding
incidents (other causes -
blockages) + Flooding incidents
(other causes - collapses)
Flooding of major roads (Oher
Causes)
Table 03a External Sewer
Flooding
External flooding within the
property boundary not inhibiting
access (Other Causes)
Table 03a External Sewer
Flooding
External flooding within the
property boundary inhibiting
access. (Other Causes)
Table 03a External Sewer
Flooding
External flooding causing
societal disruption i.e. impact
on Schools, Hospitals,
Sensitive properties etc. (Other
Causes)
Table 03a External Sewer
Flooding
Flooding of minor roads
(Hydraulic)
Table 03a External Sewer
Flooding
Total flooding incidents
(overloaded sewers)

DMF Service
Measure DMF Impact Category Corresponding Dataset Categorisation in Dataset
Flooding of major roads
(Hydraulic)
Table 03a External Sewer
Flooding
External flooding within the
property boundary not inhibiting
access (Hydraulic)
Table 03a External Sewer
Flooding
External flooding within the
property boundary inhibiting
access. (Hydraulic)
Table 03a External Sewer
Flooding
External flooding causing
societal disruption i.e. impact
on Schools, Hospitals,
Sensitive properties etc.
(Hydraulic)
Table 03a External Sewer
Flooding
Pollution
Incidents
Category 1 pollution incident Table 44 Pollution Cat 1 Pollution Incidents - Legacy
Network + Cat 1 Pollution Incidents
Category 2 pollution incident Table 44 Pollution Cat 2 Pollution Incidents - Legacy
Network + Cat 2 Pollution Incidents
Category 3 pollution incident Table 44 Pollution Cat 3 Pollution Incidents - Legacy
Network + Cat 3 Pollution Incidents
Category 4 pollution incident Table 44 Pollution -
1.5.3 Costs of bill payment refusals
YWS provided data on the average bills of defaulted customers in 2016-17 (more historical and detailed data
was not available) which was estimated to be £405 per year.6 Data was also requested on the wider costs of
bill payment refusals to YWS. For the 2016-17 period this was estimated to be £3.976 million7 or around £23
per defaulting customer. Adding these togethersuggests a total cost per payment refusal of £428 per year.
1.5.4 Analysis
Table 3 provides a summary overview of the collated dataset. A regression analysis was then run in order to
establish whether there is a quantifiable link between the number of customers defaulting each year and the
6 Yorkshire Water (2017), ‘Data actions no of contacts & debt.xslx’. 7 Yorkshire Water (2017), ‘Data actions no of contacts & debt.xslx’.

number of service measure failures each year at a company-wide level.
Table 3. Data collated for regression analysis
Dependent Variable 2007-
08
2008-
09
2009-
10
2010-
11
2011-
12
2012-
13
2013-
14
2014-
15
2015-
16
2016-
17
Defaulted (no.) - - - - - 47,090 83,524 118,911 140,238 172,311

Independent Variables 2007-
08
2008-
09
2009-
10
2010-
11
2011-
12
2012-
13
2013-
14
2014-
15
2015-
16
2016-
17
Unplanned Interruptions (no.) 21,484 35,893 69,842 129,219 102,621 72,278 89,349 63,488 88,879 76,014
< 3hrs (no.) - - - - - - - - - -
3 - 6hrs (no.) 17,662 30,268 59,474 79,721 79,633 57,420 70,854 47,424 62,677 62,020
6 - 12hrs (no.) 2,929 4,480 9,009 33,281 22,565 14,496 18,384 15,735 21,347 13,807
12 - 24hrs (no.) 784 1,110 1,334 14,327 412 258 107 297 3,430 181
>24hrs (no.) 109 35 25 1,890 11 104 4 32 1,425 6
Planned Interruptions (no.) 101,674 53,326 8,991 15,179 54,569 13,207 9,385 22,091 21,738 15,617
< 3hrs (no.) - - - - - - - - - -
3 - 6hrs (no.) 60,868 36,260 7,473 10,623 42,006 11,080 7,927 19,670 17,886 12,203
6 - 12hrs (no.) 40,806 17,066 1,518 4,556 12,563 2,127 1,458 2,421 3,852 3,414
12 - 24hrs (no.) 0 0 0 0 0 0 0 0 0 0
Poor Pressure (no.) 102 86 115 11 4 10 14 9 11 8
No. props. at start of year (no.) 102 86 115 11 4 10 14 9 11 8
Leakage (Ml/d) 293.63 295.02 294.70 325.40 273.84 264.62 282.27 288.42 285.12 295.16
Total leakage (Ml/d) 293.63 295.02 294.70 325.40 273.84 264.62 282.27 288.42 285.12 295.16
Drinking Water Quality
(Biological/Chemical) (%) - - - - 99.95 99.93 99.96 99.94 99.96 99.97
Trivial/ threshold sample failure (%) - - - - 99.95 99.93 99.96 99.94 99.96 99.97
Exceeds PCV at WTW - no health
impact (%) - - - - - - - - - -
Exceeds PCV at WTW - health
impact (%) - - - - - - - - - -
Exceeds PCV at SRE - no health
impact (%) - - - - - - - - - -
Exceeds PCV at SRE - health
impact (%) - - - - - - - - - -
Exceeds PCV at Customer Property
- no health impact(%) - - - - - - - - - -
Exceeds PCV at Customer Property
- health impact (%) - - - - - - - - - -
Protective advice required / Health
impact (%) - - - - - - - - - -
Drinking Water Quality
(Aesthetic) (no./1,000 pop.) - - - 1.61 1.26 1.16 1.33 1.20 1.03 0.97
Taste and Smell (no./1,000 pop.) - - - 1.61 1.26 1.16 1.33 1.20 1.03 0.97
Discolouration (no./1,000 pop.) - - - - - - - - - -
Acceptability - Milky / Cloudy /
Particles (no./1,000 pop.) - - - - - - - - - -
Internal Sewer Flooding (no.) 811 840 708 682 700 1005 680 821 731 724
Internal flooding of a cellar (Other
Causes) (no.) 180 305 244 254 255 289 219 201 243 260
Internal flooding of habitable area
(Other Causes) (no.) 374 443 355 340 363 420 319 292 346 372
Internal flooding of a cellar
(Hydraulic) (no.) 71 16 29 19 14 68 30 61 23 15
Internal flooding of habitable area
(Hydraulic) (no.) 186 76 80 69 68 228 112 267 119 77
External Sewer Flooding (no.) 1,581 2,832 3,215 2,896 3,554 5,532 3,794 3,928 3,987 3,809
Flooding of minor roads (Other
Causes) (no.) 1,231 2,472 2,876 2,635 3,399 4,608 3,535 3,495 3,635 3,668

Independent Variables 2007-
08
2008-
09
2009-
10
2010-
11
2011-
12
2012-
13
2013-
14
2014-
15
2015-
16
2016-
17
Flooding of major roads (Oher
Causes) (no.) - - - - - - - - - -
Ext. flooding not inhibiting access
(Other Causes) (no.) - - - - - - - - - -
Ext. flooding inhibiting access
(Other Causes) (no.) - - - - - - - - - -
Societal disruption (Other Causes)
(no.) - - - - - - - - - -
Flooding of minor roads (Hydraulic)
(no.) 350 360 339 261 155 924 259 433 352 141
Flooding of major roads (Hydraulic)
(no.) - - - - - - - - - -
Ext. flooding not inhibiting access
(Hydraulic) (no.) - - - - - - - - - -
Ext. flooding inhibiting access
(Hydraulic) (no.) - - - - - - - - - -
Societal disruption (Hydraulic) (no.) - - - - - - - - - -
Pollution Incidents (no.) - - - 335 311 263 255 195 239 259
Cat 1 (no.) - - - 0 0 0 3 0 0 1
Cat 2 (no.) - - - 13 15 6 8 4 7 6
Cat 3 (no.) - - - 322 296 257 244 191 232 252
Cat 4 (no.) - - - 0 0 0 0 0 0 0
1.6 Analysis of Customer Tracker survey data
The aim of this analysis is to establish whether there is a quantifiable link between: (1) the number of service
measure failures each year and the level of trust in YWS; and (2) the level of trust in YWS and the costs incurred
by YWS from refusals to pay water bills. The analysis was performed using YWS data on:
• Levels of trust by year i.e. average consumer trust scores for YWS customers.
• Customer payment status by year i.e. annual payment data and specifically information on the number
of customers who refuse to pay their bills each year at a company-wide level.
• Costs of bill payment refusals i.e. the monetary cost to YWS associated with customers who refuse to
pay their bills each year.
1.6.1 Levels of trust by year
YWS provided the results of the Customer Tracker survey over the period January 2012 to September 2017.
The survey is sent to 300 respondents on a monthly basis and includes questions on both levels of trust and
experiences of service measure failures by respondents.
With regards to trust, respondents are asked the extent to which they ‘strongly agree’, ‘somewhat agree’, ‘neither
agree nor disagree’, ‘somewhat disagree’ or ‘strongly disagree’ with the statement “Yorkshire Water are a
company I trust” (note, respondents are also able to select ‘don’t know’ as a response). However, this question
has only been included consistently in the survey design since August 2015 so the data prior to this could not
be used in the analysis. Despite this, as the survey is repeated on a monthly basis, the dataset provides a
relatively large sample size of measures of customer trust in YWS, with around 7,300 responses to the question.
With regards to service measure failures, respondents are asked “When was the last time you contacted
Yorkshire Water either via telephone or any other method of contact?” followed by an open-ended question
“What was the reason for this contact?” While the survey does not directly ask about service measure failures,
it is possible to analyse the customer responses in terms of their broad alignment with the service measures

used in the DMF. Note, however, that the customer responses do not necessarily align with the DMF service
measure categories so it was therefore necessary to match each of the responses as closely as possible with
the DMF categories. The alignment is not perfect but it is expected to provide a reasonable indication of the
issues that are of most concern to YWS customers.
It is also important to note that customers are not asked to provide any indication of the timeframes in which
they have experienced service measure failures, how often these have occurred or how quickly they were
resolved, but rather are simply asked about the last time they contacted YWS.
1.6.2 Customer payment status by year
As noted in Section 1.5.1, YWS provided data on the annual number of customers failing to pay their bills at a
company-wide level over the period 2012-13 to 2016-17.8 A longer time series dataset was requested although
this was unavailable.
1.6.3 Costs of bill payment refusals
YWS also provided information on the average cost per customer refusing to pay their bills which was estimated
to be around £428 per year.
1.6.4 Analysis
The information was collated and organised into a table showing the level of trust in YWS recorded for each of
the customers surveyed and the reason for the last reported contact with YWS. Each of the customer responses
to the question about the last contact they had with YWS was then mapped onto the one of the following service
measure categories within the DMF:
• Supply interruption (note that it was not possible to distinguish between planned and unplanned
interruptions so these were grouped into one category)
• Low pressure
• Drinking water quality (note that that it was not possible to distinguish between biological/chemical and
aesthetic water quality issues so these were grouped into one category)
• Leakage
• Internal flooding
• External flooding
• Odour (note that while there were no mentions of pollution events in the customer contact reports, odour
8 YWS (2017) ‘Trust data overview V3.xls’
was raised as an issue for contacting YWS and so was included in the analysis)
Any responses which did not fit into these service measure categories were categorised as follows:
• Billing (and other general account related contacts)
• Water meter
• Drains (acknowledging that there be potential overlaps with flooding and odour)
• Other
• No information / contact reason provided
Aa regression analysis was then conducted to investigate whether or not there is a relationship between service
measure failures and levels of trust. The dependent variable of the regression was the reported level of trust
(scored on a -2 to +2 numerical scale) with the explanatory variables corresponding to the service measure
categories (scored on a 1/0 scale). Those responses ‘No information / contact reason provided’ were excluded
from the dataset.
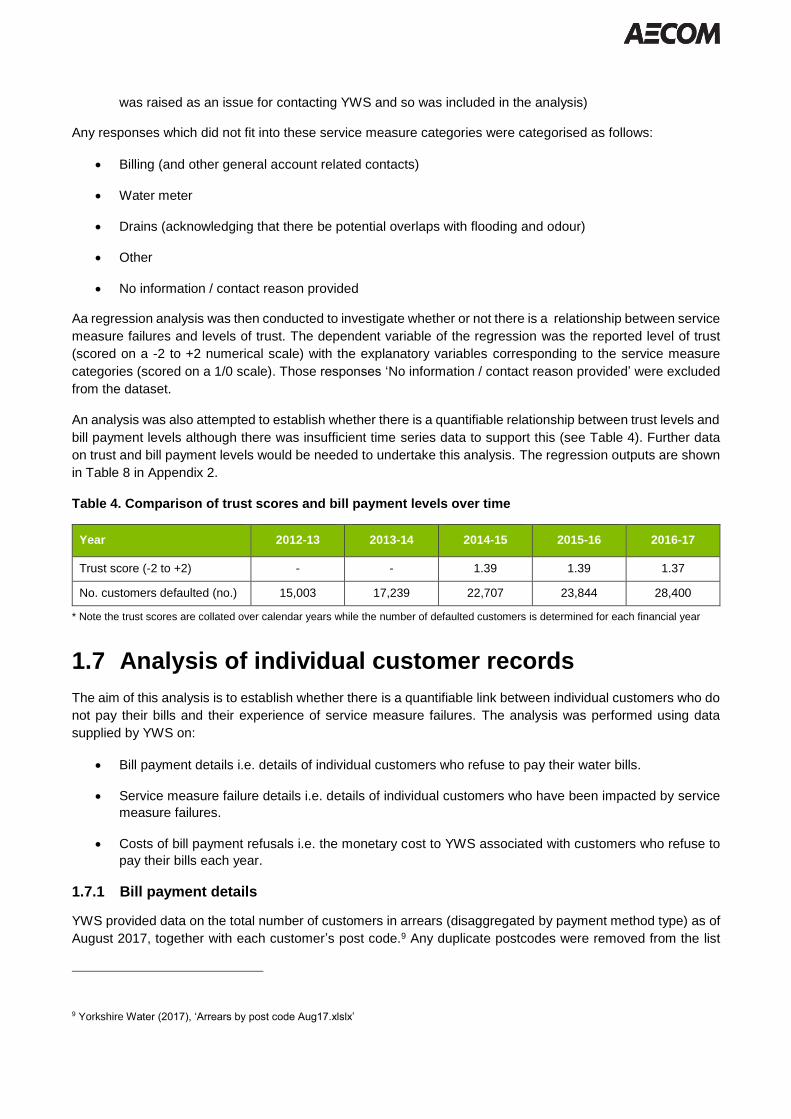
An analysis was also attempted to establish whether there is a quantifiable relationship between trust levels and
bill payment levels although there was insufficient time series data to support this (see Table 4). Further data
on trust and bill payment levels would be needed to undertake this analysis. The regression outputs are shown
in Table 8 in Appendix 2.
Table 4. Comparison of trust scores and bill payment levels over time
Year 2012-13 2013-14 2014-15 2015-16 2016-17
Trust score (-2 to +2) - - 1.39 1.39 1.37
No. customers defaulted (no.) 15,003 17,239 22,707 23,844 28,400
* Note the trust scores are collated over calendar years while the number of defaulted customers is determined for each financial year
1.7 Analysis of individual customer records
The aim of this analysis is to establish whether there is a quantifiable link between individual customers who do
not pay their bills and their experience of service measure failures. The analysis was performed using data
supplied by YWS on:
• Bill payment details i.e. details of individual customers who refuse to pay their water bills.
• Service measure failure details i.e. details of individual customers who have been impacted by service
measure failures.
• Costs of bill payment refusals i.e. the monetary cost to YWS associated with customers who refuse to
pay their bills each year.
1.7.1 Bill payment details
YWS provided data on the total number of customers in arrears (disaggregated by payment method type) as of
August 2017, together with each customer’s post code.9 Any duplicate postcodes were removed from the list
9 Yorkshire Water (2017), ‘Arrears by post code Aug17.xlslx’

giving around 62,000 unique customers in arrears.
1.7.2 Service measure failure details
YWS provided data for a range of service failures over the period 2012 to 2017 and the post codes of customers
who were affected, although data was not available for each measure consistently across this period and thus
only 2016 data (for which data was available across all service measures) was used. The information on service
failures is not classified using the service measures as defined in the DMF and thus various assumptions had

to be made in order to align the information on service failures with the DMF service measure categories.
An overview of these assumptions is set out in Table 5.
Table 5. Overlap between service measure failures data provided by YWS and DMF categories
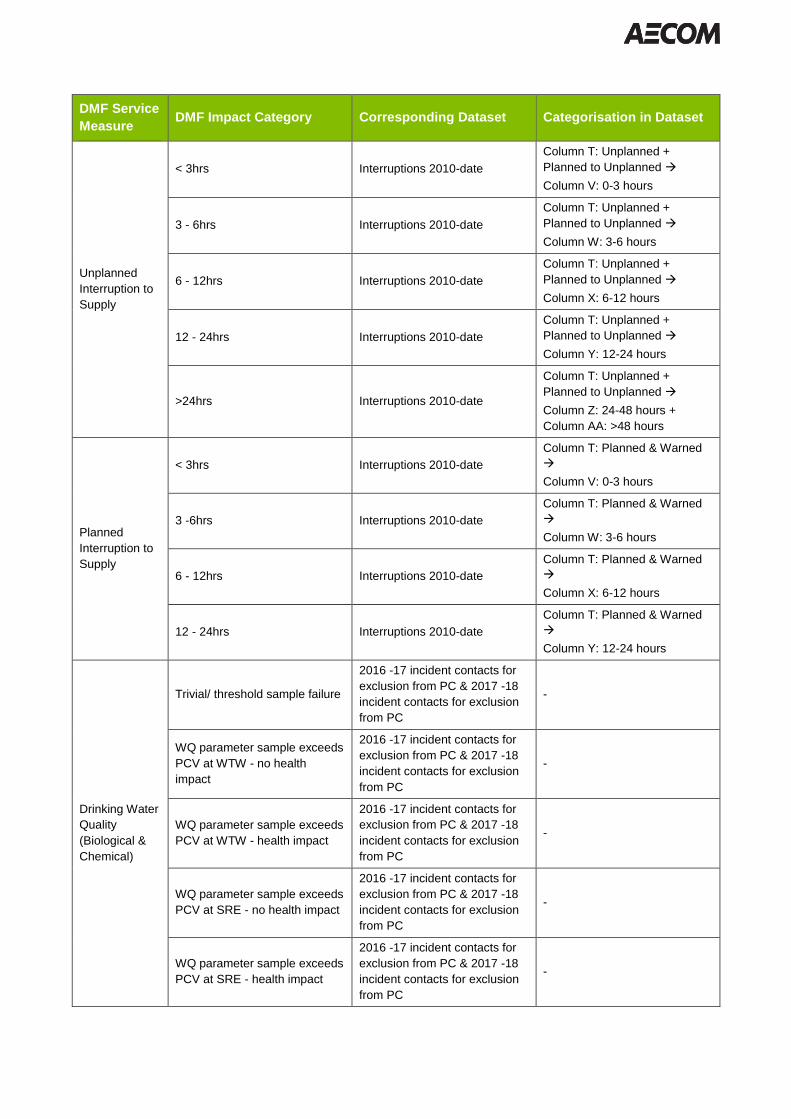
DMF Service
Measure DMF Impact Category Corresponding Dataset Categorisation in Dataset
Unplanned
Interruption to
Supply
< 3hrs Interruptions 2010-date
Column T: Unplanned +
Planned to Unplanned
Column V: 0-3 hours
3 - 6hrs Interruptions 2010-date
Column T: Unplanned +
Planned to Unplanned
Column W: 3-6 hours
6 - 12hrs Interruptions 2010-date
Column T: Unplanned +
Planned to Unplanned
Column X: 6-12 hours
12 - 24hrs Interruptions 2010-date
Column T: Unplanned +
Planned to Unplanned
Column Y: 12-24 hours
>24hrs Interruptions 2010-date
Column T: Unplanned +
Planned to Unplanned
Column Z: 24-48 hours +
Column AA: >48 hours
Planned
Interruption to
Supply
< 3hrs Interruptions 2010-date
Column T: Planned & Warned
Column V: 0-3 hours
3 -6hrs Interruptions 2010-date
Column T: Planned & Warned
Column W: 3-6 hours
6 - 12hrs Interruptions 2010-date
Column T: Planned & Warned
Column X: 6-12 hours
12 - 24hrs Interruptions 2010-date
Column T: Planned & Warned
Column Y: 12-24 hours
Drinking Water
Quality
(Biological &
Chemical)
Trivial/ threshold sample failure
2016 -17 incident contacts for
exclusion from PC & 2017 -18
incident contacts for exclusion
from PC
-
WQ parameter sample exceeds
PCV at WTW - no health
impact
2016 -17 incident contacts for
exclusion from PC & 2017 -18
incident contacts for exclusion
from PC
-
WQ parameter sample exceeds
PCV at WTW - health impact
2016 -17 incident contacts for
exclusion from PC & 2017 -18
incident contacts for exclusion
from PC
-
WQ parameter sample exceeds
PCV at SRE - no health impact
2016 -17 incident contacts for
exclusion from PC & 2017 -18
incident contacts for exclusion
from PC
-
WQ parameter sample exceeds
PCV at SRE - health impact
2016 -17 incident contacts for
exclusion from PC & 2017 -18
incident contacts for exclusion
from PC
-

DMF Service
Measure DMF Impact Category Corresponding Dataset Categorisation in Dataset
WQ parameter sample exceeds
PCV at Customer Property - no
health impact
2016 -17 incident contacts for
exclusion from PC & 2017 -18
incident contacts for exclusion
from PC
-
WQ parameter sample exceeds
PCV at Customer Property -
health impact
2016 -17 incident contacts for
exclusion from PC & 2017 -18
incident contacts for exclusion
from PC
Column A: Illness + Skin
Irritation
Protective advice required /
Health impact due to PCV
exceedence
2016 -17 incident contacts for
exclusion from PC & 2017 -18
incident contacts for exclusion
from PC
-
Drinking Water
Quality
(Aesthetic)
Taste and Smell
2016 -17 incident contacts for
exclusion from PC & 2017 -18
incident contacts for exclusion
from PC
Column A: Chlorine T&O +
Earthy T&O + Hard Water +
Other T&O + Phenolic T&O +
Repeat T&O
Discolouration
2016 -17 incident contacts for
exclusion from PC & 2017 -18
incident contacts for exclusion
from PC
Column A: Disc Water-
Coloured + Disc Water-Historic
+ Disc Water-Grade 1 + Disc
Water-Grade 2 + Disc Water-
Grade 3 + Disc Water-Grade 4
+ Disc Water-Sand
Acceptability - Milky / Cloudy /
Particles
2016 -17 incident contacts for
exclusion from PC & 2017 -18
incident contacts for exclusion
from PC
Column A: Biofilm + Milky/Air
Internal
Property
Sewer
Flooding
(Hydraulic and
Other Causes)
Internal flooding of a cellar
(Other Causes) PR19 Sewer Flooding
Column A: INT
Column C: Other Causes
Column H: Cellar
Internal flooding of habitable
area (Other Causes) PR19 Sewer Flooding
Column A: INT
Column C: Other Causes
Column H: BKUPFACLTY +
Garden + Ground Floor +
Integral/Att’d Garage + Other
Internal + Under Floor
Internal flooding of a cellar
(Hydraulic) PR19 Sewer Flooding
Column A: INT
Column C: Overloaded
Column H: Cellar
Internal flooding of habitable
area (Hydraulic) PR19 Sewer Flooding
Column A: INT
Column C: Overloaded
Column H: BKUPFACLTY +
Garden + Ground Floor +
Integral/Att’d Garage + Other
Internal + Under Floor
External Sewer
Flooding
(Hydraulic and
Other Causes)
Flooding of minor roads (Other
Causes) PR19 Sewer Flooding
Column A: EXT
Column C: Other Causes Flooding of major roads (Oher
Causes) PR19 Sewer Flooding

DMF Service
Measure DMF Impact Category Corresponding Dataset Categorisation in Dataset
External flooding within the
property boundary not inhibiting
access (Other Causes)
PR19 Sewer Flooding
External flooding within the
property boundary inhibiting
access. (Other Causes)
PR19 Sewer Flooding
External flooding causing
societal disruption i.e. impact
on Schools, Hospitals,
Sensitive properties etc. (Other
Causes)
PR19 Sewer Flooding
Flooding of minor roads
(Hydraulic) PR19 Sewer Flooding
Column A: EXT
Column C: Overloaded
Flooding of major roads
(Hydraulic) PR19 Sewer Flooding
External flooding within the
property boundary not inhibiting
access (Hydraulic)
PR19 Sewer Flooding
External flooding within the
property boundary inhibiting
access. (Hydraulic)
PR19 Sewer Flooding
External flooding causing
societal disruption i.e. impact
on Schools, Hospitals,
Sensitive properties etc.
(Hydraulic)
PR19 Sewer Flooding
Pollution
Incidents
Category 1 pollution incident PR19 Pollution Column X: 1
Category 2 pollution incident PR19 Pollution Column X: 2 + 2c
Category 3 pollution incident PR19 Pollution Column X: 3 + 3c + 3sw
Category 4 pollution incident PR19 Pollution Column X: 4 + 4c + 4sw
1.7.3 Costs of bill payment refusals
As noted in Section 1.5.3, the average cost per bill refusal is estimated to be around £428 per year.
1.7.4 Analysis
In order to undertake the analysis, the data was collated and organised to show the year and postcode

corresponding to each service measure failure across the following categories:
• Unplanned supply interruptions
• Planned supply interruptions (note, there was no data on low pressure or leakage events)
• Drinking water (bio/chemical)
• Drinking water (aesthetic)
• Internal flooding
• External flooding
• Pollution incidents
This data was then transferred into a GIS and maps were developed for each service measure to show the
spatial distribution of each event. Post code data on the number of customers in arrears was also used to map
the spatial distribution of customers failing to pay their water bills. As with the previous analysis, it was not
possible to distinguish between those customers who were in arrears because they could not pay (i.e. where
affordability was an issue) and those that were in arrears because they would not pay. One could conceivably
overlay the spatial data on arrears with the indices of multiple deprivation (on the basis that there is an
established relationship between levels of deprivation and bad debt charges10) and thereby refine the analysis
by excluding (or at least discounting) customers in arrears that are located in areas of high deprivation and who
are therefore more likely to fall into the ‘can’t pay’ rather than ‘won’t pay’ category.
A regression analysis was then attempted to establish whether there is a quantifiable link between a customer
being in arrears (the dependent variable) and whether that customer has experienced any of the service
measure failures listed above (the explanatory variables). The post codes of customers in arrears were then
mapped on to the service measure failure post code data for the same year (2016) to produce a dataset setting
out the number of customers in arrears and the service measures they experienced in 2016. It is possible that
more reliable results could be obtained by:
• analysing data in shorter (e.g. quarterly), successive time periods, .e.g. by examining the extent to which
service failures in each quarter are a determinant of non-payment in that quarter or in future quarters.
This follows from the finding of Ranaweera and Prabhu (2003) that while customers may be entirely
satisfied with the response and recovery process following a service failure, they may not necessarily
forget the incident or trust YWS not to make similar mistakes in the future.
• Controlling for other individual-level factors that may determine non-payment. For example, in the case
of internal sewer flooding, customers may not be able to pay their bills due to the financial burden of
uninsured flood losses. There may be seasonable factors that affect their ability to pay.
However, since there was no data available on the post codes of customers not in arrears, it was not possible
to undertake the regression analysis as there was no variance in the dependent variable to be able to analyse
whether or not the explanatory variables have any significance. In order to make the regression analysis
possible, a full list of the post codes of all YWS customers (both customers in arrears and customers who paid
on time) would be needed, together with data on whether or not they are in arrears, and any service measure
failures they have experienced. A probit-type model could then be estimated on whether service failure in time
t makes it more or less likely that a customer would not pay in period t, or period t+1.
As an alternative approach, the available data was analysed in order to assess what proportion of customers
10 PWC (2017) Retail Services Efficiency benchmarking. Report for Ofwat [online] available at https://064f1d25f5a6fb0868ac-0df48efcb31bcf2ed0366d316cab9ab8.ssl.cf3.rackcdn.com/wp-content/uploads/2017/10/250717-Ofwat-Retail-Services-Efficiency-12.pdf

who experienced a service measure failure in 2016 were then recorded as being in arrears in 2017. This was
then compared to the average proportion of customers in arrears across YWS in order to assess whether
customers are more likely to be in arrears if they have experienced a service measure failure than if not. The
results of this analysis were then combined with the average cost per customer refusing to pay their bills in order
to provide a high level indication of the monetary costs of service measure failures.
1.8 References
A4S (2017) Essential Guide to Social and Human Capital Accounting [online] available at
https://www.accountingforsustainability.org/content/dam/a4s/corporate/home/KnowledgeHub/Guide-
pdf/A4S%20Essential%20Guide%20to%20Social%20and%20Human%20Capital%20Accounting.pdf.downloa
dasset.pdf (last accessed 28/10/2017)
Accounting for Sustainability (2016) Natural and social capital accounting. An introduction for finance teams
[online] available at
https://www.accountingforsustainability.org/content/dam/a4s/corporate/home/KnowledgeHub/Guide-
pdf/A4S%20Natural%20and%20social%20capital%20accounting.pdf.downloadasset.pdf (last accessed
25/10/2017).
Alló, Maria, and Maria L. Loureiro. 2014. “The Role of Social Norms on Preferences towards Climate Change
Policies: A Meta-Analysis.” Energy Policy 73 (C): 563–74.
Anderson, E. W., Fornell, C., & Lehmann, D. R. (1994). Customer satisfaction, market share, and profitability:
Findings from Sweden. The Journal of Marketing, 53-66.
Anderson, E. W., Fornell, C., & Rust, R. T. (1997). Customer satisfaction, productivity, and profitability:
Differences between goods and services. Marketing Science, 16(2), 129-145.
Anderson, J. E. (2017). Trust in Government and Willingness to Pay Taxes in Transition
Countries. Comparative Economic Studies, 59(1), 1-22.
BMG Research (2016) Water Matters Household customers’ views on their water and sewerage services
2016. Report prepared on behalf of the Consumer Council for Water [online] available at
https://www.ccwater.org.uk/wp-content/uploads/2017/06/CCWater-Water-Matters-2016.pdf (last accessed
28/10/2017).
Breffle, W. S., Eiswerth, M. E., Muralidharan, D., & Thornton, J. (2015). Understanding how income influences
willingness to pay for joint programs: A more equitable value measure for the less wealthy. Ecological
Economics, 109, 17-25.
Carattini S., Leven S. and Tavoni A. (2017) “Cooperation in the climate commons” Working paper 258,
Grantham Institute for Climate Change, LSE [online] available at http://www.lse.ac.uk/GranthamInstitute/wp-
content/uploads/2017/01/working-paper-259-Carattini-et-al.pdf (last accessed 24/11/20107).
CCWater (2017) Complaints to Water Companies England and Wales April 2016 – March 2017 [online]
accessed at https://www.ccwater.org.uk/wp-content/uploads/2017/09/Complaints-report-2017.pdf (last
accessed 29/10/2017)
Crosby, L. A., Evans, K. R., & Cowles, D. (1990). Relationship quality in services selling: an interpersonal
influence perspective. The Journal of Marketing, 68-81.
Geyskens, I., Steenkamp, J. E. M. and Kumar, N. (1998) ‘Generalisations about trust in marketing channel

relationships using meta-analysis’, International Journal of Research in Marketing, Vol. 15, pp. 223–248
Glaeser, E. L., Laibson, D. I., Scheinkman, J. A., and Soutter, C. L. (2000). Measuring trust. The Quarterly
Journal of Economics, 115(3), 811-846.
Habibov, N., Cheung, A., and Auchynnikava, A. (2017). Does social trust increase willingness to pay taxes to
improve public healthcare? Cross-sectional cross-country instrumental variable analysis. Social Science &
Medicine, 189, 25-34.
Haile, D. T., and Slangen, L. (2009). Estimating the willingness to pay for the benefit of AES using the
contingent valuation method. Journal of Natural Resources Policy Research, 1(2), 139-152.
Halkos, G. E., & Jones, N. (2012). Modeling the effect of social factors on improving biodiversity
protection. Ecological Economics, 78, 90-99.
Homburg, C., Koschate, N., and Hoyer, W. D. (2005). Do satisfied customers really pay more? A study of the
relationship between customer satisfaction and willingness to pay. Journal of Marketing, 69(2), 84-96.
Jones, N., Clark, J. R., and Malesios, C. (2015). Social capital and willingness-to-pay for coastal defences in
south-east England. Ecological Economics, 119, 74-82.
Jones, N., Sophoulis, C. M., & Malesios, C. (2008). Economic valuation of coastal water quality and protest
responses: a case study in Mitilini, Greece. The Journal of Socio-Economics, 37(6), 2478-2491.
Kayaga, S., Calvert, J., & Sansom, K. (2003). Paying for water services: effects of household
characteristics. Utilities Policy, 11(3), 123-132.
Kennedy, M. S., Ferrell, L. K., & LeClair, D. T. (2001). Consumers' trust of salesperson and manufacturer: an
empirical study. Journal of Business Research, 51(1), 73-86.
Knack, S., & Keefer, P. (1997). Does social capital have an economic payoff? A cross-country
investigation. The Quarterly journal of economics, 112(4), 1251-1288.
Krystallis, A., and Chryssohoidis, G. (2005). Consumers' willingness to pay for organic food: Factors that
affect it and variation per organic product type. British Food Journal, 107(5), 320-343.
Meyerhoff, J., & Liebe, U. (2006). Protest beliefs in contingent valuation: explaining their
motivation. Ecological economics, 57(4), 583-594.
Mitchell, R. C., & Carson, R. T. (1989). Using surveys to value public goods: the contingent valuation method.
Resources for the Future.
Nielsen, J. B., Gyrd-Hansen, D., Kristiansen, I. S., & NexØE, J. (2003). Impact of socio-demographic factors
on willingness to pay for the reduction of a future health risk. Journal of Environmental Planning and
Management, 46(1), 39-47.
Nocella, G., Hubbard, L., & Scarpa, R. (2010). Farm animal welfare, consumer willingness to pay, and trust:
Results of a cross-national survey. Applied economic perspectives and policy, 32(2), 275-297.
Ofwat (2017) Delivering Water 2020: Consulting on our methodology for the 2019 price review [online]
available at https://www.ofwat.gov.uk/consultation/delivering-water2020-consulting-on-our-methodology-for-
the-2019-price-review/ (last accessed 29/10/2017).
Oh, H., and Hong, J. H. (2012). Citizens’ trust in government and their willingness-to-pay. Economics
Letters, 115(3), 345-347.
Paxton, P. (1999). Is social capital declining in the United States? A multiple indicator assessment. American

Journal of sociology, 105(1), 88-127.
Polyzou, E., Jones, N., Evangelinos, K. I., and Halvadakis, C. P. (2011). Willingness to pay for drinking water
quality improvement and the influence of social capital. The Journal of Socio-Economics, 40(1), 74-80.
Putnam, R. (2001). Social capital: Measurement and consequences. Canadian Journal of Policy
Research, 2(1), 41-51 [online] available at https://search.oecd.org/edu/innovation-education/1825848.pdf (last
accessed 28/10/2017)
Putnam, R. D. (1995). Bowling alone: America's declining social capital. Journal of democracy, 6(1), 65-78.
Ranaweera, C., and Prabhu, J. (2003). The influence of satisfaction, trust and switching barriers on customer
retention in a continuous purchasing setting. International journal of service industry management, 14(4), 374-
395.
Rust, R. T., & Zahorik, A. J. (1993). Customer satisfaction, customer retention, and market share. Journal of
retailing, 69(2), 193-215.
Spash, C. L. (2006). Non-economic motivation for contingent values: Rights and attitudinal beliefs in the
willingness to pay for environmental improvements. Land Economics, 82(4), 602-622.
Szymanski, D. M. and Henard, D. H. (2001) ‘Customer satisfaction: A meta-analysis of the empirical
evidence’, Journal of the Academy of Marketing Science, Vol. 29, No. 1, pp. 16–35.
Temperini, V., Limbu, Y., & Jayachandran, C. (2017). Consumers’ Trust in Food Quality and Willingness to
Pay More for National Parks’ Brands: Preliminary Evidence from Italy. Journal of International Food &
Agribusiness Marketing, 29(2), 120-138.
Uslaner, E. M., & Conley, R. S. (2003). Civic engagement and particularized trust: The ties that bind people to
their ethnic communities. American Politics Research, 31(4), 331-360.
Utility Week (2015) Water company trust issues. [online] available at http://utilityweek.co.uk/news/water-
company-trust-issues/1158632#.VcSHZ_lt (last accessed 29/10/2017).
Vainio, A., Paloniemi, R., & Varho, V. (2017). Weighing the Risks of Nuclear Energy and Climate Change:
Trust in Different Information Sources, Perceived Risks, and Willingness to Pay for Alternatives to Nuclear
Power. Risk Analysis, 37(3), 557-569.
Van Oorschot, W., Arts, W., & Gelissen, J. (2006). Social capital in Europe: Measurement and social and
regional distribution of a multifaceted phenomenon. Acta sociologica, 49(2), 149-167.
Veronesi, M., Chawla, F., Maurer, M., & Lienert, J. (2014). Climate change and the willingness to pay to
reduce ecological and health risks from wastewater flooding in urban centers and the environment. Ecological
Economics, 98, 1-10.
WBCSD (2016) Social Capital Protocol [online] available at
http://docs.wbcsd.org/2017/04/Social_Capital_Protocol_Guide.pdf (last accessed 28/10/2017).
Whitehead, J. C., & Cherry, T. L. (2007). Willingness to pay for a green energy program: a comparison of ex-
ante and ex-post hypothetical bias mitigation approaches. Resource and energy economics, 29(4), 247-261.
Wiser, R. H. (2007). Using contingent valuation to explore willingness to pay for renewable energy: a
comparison of collective and voluntary payment vehicles. Ecological economics, 62(3), 419-432.
Yao, R. T., Scarpa, R., Turner, J. A., Barnard, T. D., Rose, J. M., Palma, J. H., & Harrison, D. R. (2014).
Valuing biodiversity enhancement in New Zealand's planted forests: Socioeconomic and spatial determinants
of willingness-to-pay. Ecological Economics, 98, 90-101.
Yoo, S. H., Kwak, S. J., & Kim, T. Y. (2001). Modelling willingness to pay responses from dichotomous choice
contingent valuation surveys with zero observations. Applied Economics, 33(4), 523-529.
Yoon, S. J. (2002). The antecedents and consequences of trust in online‐purchase decisions. Journal of
interactive marketing, 16(2), 47-63.

Appendix 2: Results
2.1 Overview
This Appendix provides an overview of the results for each of the three analyses undertaken as part of this work
package. A final section then provides a discussion of the implications of the findings for YWS.
2.2 Company-wide / aggregate analysis of service measure failure and payment data
In order to try to establish whether there is a quantifiable relationship between service measure failures and
rates of bill payment at a company-wide level a regression analysis was run on the data set out in Table 6.
Table 6. Summary of data used in the company-wide regression analysis
Dependent variable 2012-13 2013-14 2014-15 2015-16 2016-17
Defaulted customers (no.) 47,090 83,524 118,911 140,238 172,311
Explanatory variables 2012-13 2013-14 2014-15 2015-16 2016-17
Unplanned Interruptions (no.) 72,278 89,349 63,488 88,879 76,014
Planned Interruptions (no.) 13,207 9,385 22,091 21,738 15,617
Poor Pressure (no.) 10 14 9 11 8
Drinking Water Quality (Biological/Chemical) (%) 99.93 99.96 99.94 99.96 99.97
Drinking Water Quality (Aesthetic) (no./1,000
pop.) 1.16 1.33 1.20 1.03 0.97
Leakage (Ml/d) 264.62 282.27 288.42 285.12 295.16
Internal Sewer Flooding (no.) 1,005 680 821 731 724
External Sewer Flooding (no.) 5,532 3,794 3,928 3,987 3,809
Pollution Incidents (no.) 263 255 195 239 259
However, there were insufficient observations (given the number of explanatory variables) to identify a
meaningful relationship between the dependent and explanatory variables. Graphs of the data set out above
(see Figure 8) highlight that there is a high degree of correlation between some of the explanatory variables (in
particular internal and external flooding, leakage and external flooding, and internal flooding and drinking water
quality (biological/chemical)). A much larger dataset would therefore be required to establish whether there is a
quantifiable relationship between bill payment rates and individual service measure failures at a company-wide
level.
Ongoing data collection could allow this type of analysis to take place in future in order to try to establish whether
there is a relationship between service measure failures and costs to YWS. Further information would also be

needed on the split between customers who ‘can’t’ and ‘won’t’ pay in order to establish a meaningful relationship.
Figure 8. Graphical representation of trends in the variables analysed

0
5,000
10,000
15,000
20,000
25,000
2012-13 2013-14 2014-15 2015-16 2016-17
Planned Interruptions (no.)
0
10,000
20,000
30,000
40,000
50,000
60,000
70,000
80,000
90,000
100,000
2012-13 2013-14 2014-15 2015-16 2016-17
Unplanned Interruptions (no.)
0
2
4
6
8
10
12
14
16
2012-13 2013-14 2014-15 2015-16 2016-17
Poor Pressure (properties per year)
245
250
255
260
265
270
275
280
285
290
295
300
2012-13 2013-14 2014-15 2015-16 2016-17
Leakge (Ml/d)
99.91
99.92
99.93
99.94
99.95
99.96
99.97
99.98
2012-13 2013-14 2014-15 2015-16 2016-17
Drinking Water Quality (Biological/Chemical) (% of samples
pass the quality test)
0
0.2
0.4
0.6
0.8
1
1.2
1.4
2012-13 2013-14 2014-15 2015-16 2016-17
Drinking Water Quality (Aesthetic) (no. of contacts about water quality / 1,000
pop.)

2.3 Analysis of Customer Tracker survey data
The analysis of YWS Customer Tracker survey data suggests that trust in YWS is generally high and there is
little variation on an annual basis (average score of 1.39 in 2015, 1.39 in 2016, and 1.37 in 2017) although there
is a greater degree of variation on a monthly basis (see Figure 9).
Across YWS customers, half of all contacts were related to billing or other account related matters. Of the
service measures, most contacts were about leakage (7%) followed by drinking water quality (3%), supply
interruptions, and external flooding (3%). For many of the responses it was unclear how they should best be
0
200
400
600
800
1,000
1,200
2012-13 2013-14 2014-15 2015-16 2016-17
Internal Sewer Flooding (no. of properties affected)
0
1,000
2,000
3,000
4,000
5,000
6,000
2012-13 2013-14 2014-15 2015-16 2016-17
External Sewer Flooding (no. of incidents outside homes on their land)
0
50
100
150
200
250
300
2012-13 2013-14 2014-15 2015-16 2016-17
Pollution Incidents (no.)
0.00%
1.00%
2.00%
3.00%
4.00%
5.00%
6.00%
7.00%
8.00%
9.00%
2012-13 2013-14 2014-15 2015-16 2016-17
Defaulted Customers (% total)
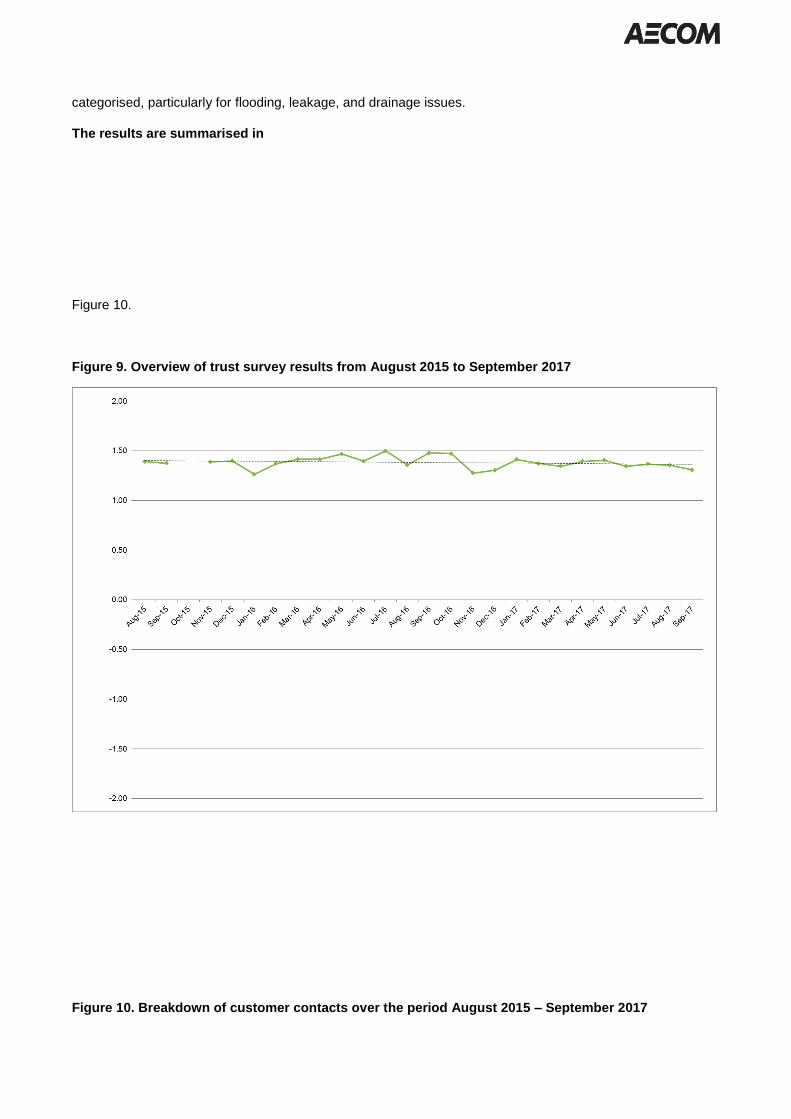
categorised, particularly for flooding, leakage, and drainage issues.
The results are summarised in
Figure 10.
Figure 9. Overview of trust survey results from August 2015 to September 2017
Figure 10. Breakdown of customer contacts over the period August 2015 – September 2017

In order to try to establish whether there is a quantifiable relationship between service measure failures and
levels of trust a linear regression analysis was run on the data as set out in Table 7.
Table 7. Summary of data used in the trust survey regression analysis
Dependent Explanatory
Level of
trust
(-2 to +2)
Customer
contacted
about
leakage
(0,1)
Customer
contacted
about
drinking
water
quality (0,1)
Customer
contacted
about
internal
flooding
(0,1)
Customer
contacted
about
external
flooding
(0,1)
Customer
contacted
about low
pressure
(0,1)
Customer
contacted
about
supply
interruptio
n (0,1)
Customer
contacted
about
odour (0,1)
-2 0 1 0 0 0 0 0
… … … … … … … …
The results of the regression analysis are set out in Table 8 and suggest that each of the service measure
failures has a negative impact on trust in YWS. However, of the explanatory variables, only that of drinking
water quality, internal flooding, and odour were found to be statistically significant; of these, odour was found to
have the strongest negative impact on trust. As such, the findings can be interpreted as providing some evidence
that drinking water quality, internal flooding, and odour related service measure failures have a quantifiable
impact on levels of trust in YWS; such that for every customer affected they are estimated to lead to a 0.32,
0.49, and 0.63 lower score on the trust survey respectively.
It is important to note that the R squared value for the regression was low – with the explanatory variables only
explaining around 0.59% of the variance in trust scores. This suggests that any results should be carefully
caveated with the understanding that there are numerous factors affecting trust levels in YWS and service
48%
18%
10%
7%
5%
3%
3%3% 2% 1% 0.4%
Billing
Water meter
Other
Leakage
Drains
Drinking water quality
Supply interruption
Ext flooding
Low pressure
Int flooding
Odour

measure failures are only one small aspect of this.
One of the challenges with analysing the data is that it is often difficult to translate the customer’s response
about why they have contacted YWS to the relevant service measure categories – this is particularly the case
for leakage, drainage, and flooding events.
A second issue is that the respondent’s level of trust is likely to be impacted, not just by whether they have
experienced a service measure failure directly, but how YWS dealt with that event. For example, if a flooding
event is responded to promptly and efficiently, trust in YWS may actually increase.
A further complicating issue is that customers are responding about service measure failures experienced over
different time periods as the survey does not specify a specific time period for recording responses. As such,
some customers reported recent events whereas others may be referring to events – and possibly more than
one event - that took place some time ago. The survey also does not pick up frequency of contacts with YWS
and only captures the most recent contact.
In order to improve the analysis, the wording of the trust survey could be amended to allow a more precise
analysis of this issue as follows:
• Ask customers whether YWS addressed the issue they contacted about in a satisfactory or
unsatisfactory manner.
• Provide a coded response of service measure failures that respondents can select from when asked
about their reason for contacting YWS (note this cold include an open response for ‘other’ reasons in
addition to the coded list).
• Ask customers whether they have refused to pay their water bills since their last contact with YWS. An
alternative approach could be to gather customer information from respondents that could be used to
correlate their response with individual customer repayment records (such as post codes) although one
would have to test for spatial auto-correlation (i.e. clustering effects). Alternatively, a further option could
be to issue the trust survey directly to people who have refused to pay bills (although the response rate
may be low).
Further data could also be collected on customer repayment rates over time to facilitate a regression analysis

of trust scores against repayment levels.
Table 8. Results of regression analysis of trust survey data
Regression Statistics
Multiple R 0.07709446
R Square 0.005943556
Adjusted R Square 0.004977917
Standard Error 0.862999184
Observations 7,214
df SS MS F
Regression 7 32.08856696 4.584080994 6.155048959
Residual 7,206 5,366.79527 0.744767592
Total 7,213 5,398.883837
Coefficients Standard Error t Stat P-value
Intercept 1.393488809 0.010796772 129.0653145 0
Supply interruption -0.080055973 0.075329525 -1.062743627 0.287933843
Low pressure -0.056646704 0.089197697 -0.635069127 0.525403495
Leakage -0.0320853 0.052247391 -0.614103388 0.539166396
Drinking water quality -0.324523292 0.072476883 -4.477611066 0.000007665
Internal flooding -0.488726904 0.133600644 -3.658117883 0.000255887
External flooding -0.047694416 0.084124997 -0.566947022 0.570767835
Odour -0.628782927 0.209586327 -3.000114245 0.002708015
2.2 Analysis of individual customer records
The spatial analysis (see Figures A to H) shows that, unsurprisingly, the areas with the highest concentration
of customers in arrears (see Figure H) are also the areas with the highest populations (i.e. Leeds, Bradford,
Doncaster, Sheffield, and Hull). With regards to the service measures, there are no obvious spatial correlations
between the number of service measure failures and the location of customers in arrears.

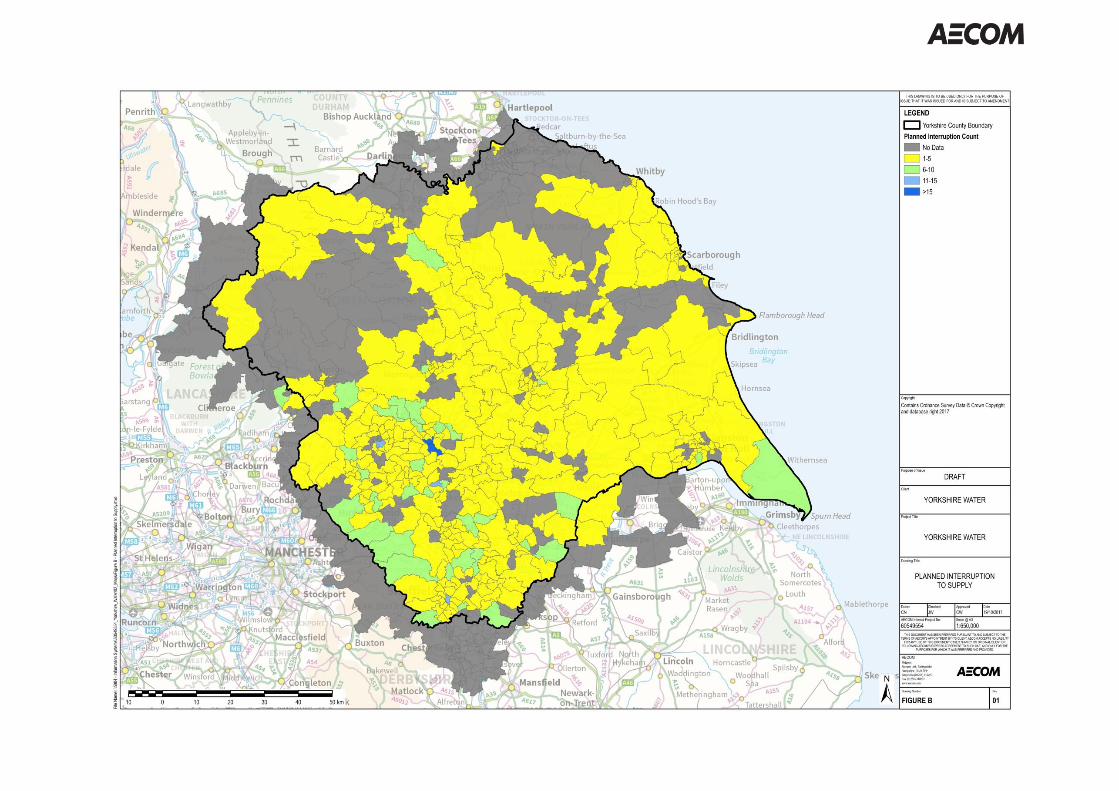


For the quantitative analysis, customers who experienced service measure failures in 2016 (aside from planned
supply interruptions) were found to be more likely than the average proportion of YWS customers to be in arrears
the following year. For example, in 2016-17 it was estimated that around 14%11 of customers were in arrears;
by contrast, around 27% of customers experiencing unplanned supply interruptions were in arrears in 2017.
However, further work would be required to assess the extent to which service measure failures are randomly
distributed across households or whether there is some factor that makes service measure failures more likely
for a given household. If there is a factor that makes service measure failures more likely for any given
household (i.e. where they experience repeat events), and this is also correlated with willingness to pay one’s
bill, then this complicates interpretation. Again, time-series data would be required to support such an analysis.
The proportion of people experiencing service measure failures in 2016 and being in arrears in 2017 was highest
for internal flood events and drinking water quality (biological & chemical) events; such that 70% and 68% of all
customers experiencing these service measure failures were in arrears the following year. This suggests that a
large proportion of the customers who experience these service measure failures are likely to fail to repay their
bills in future. These findings correlate with those of Analysis B which also identified internal flooding and
drinking water quality events as having the most significant impact on trust.
Assuming that the difference in likelihood of being in arrears following a service measure failure relative to the
average rate can be used as a proxy of the impact of service measure failures on bill repayment levels, and
assuming an average cost per payment refusal of £428 per year (see Section 1.5.3), indicative values of the
impact of service measure failures can be estimated as set out in Table 9 and Figure 11.
The results of this high level analysis suggest that the average cost per service measure failure ranges from £0
per year for planned interruptions to £243 per year for internal flood events. However, it is important to note that
there are significant levels of uncertainty associated with these numbers and that this is a high level, indicative
analysis rather than an in depth estimation of value.
In order to improve this analysis, the collection of time series would allow an examination of how long service
measure failures persist in influencing bill repayment levels. A wider dataset would also provide context on
whether this is a particularly unusual year or whether this is a regular pattern. A regression analysis of the
number of customers in arrears against their experience of service measure failures would provide a more
robust understanding of the link between these two factors. Further a more detailed understanding of the costs
to YWS from customers in arrears would also be useful to develop a better understanding of the value of trust
11 Yorkshire Water (2017), ‘Trust data overview V4.xslx’

to YWS.
Table 9. High level estimation of the cost of service measure failures in terms of customer repayments
Factor
Unplanned
interruptio
n
Planned
interruptio
n
Water
bio/chem
Water
aesthetic
External
flooding
Internal
flooding
Pollution
events
No. experiencing service
measure failures 808 434 41 288 9,171 1,867 479
No. experiencing service
measure failure and in arrears 220 30 28 129 5,151 1,313 96
% in arrears of no. experiencing
service measure failure 27.2% 6.9% 68.3% 44.8% 56.2% 70.3% 20.0%
% of all YWS customers in
arrears 13.6% 13.6% 13.6% 13.6% 13.6% 13.6% 13.6%
Difference relative to average of
% experiencing failures in
arrears
+13.6% -6.7% +54.7% +31.2% +42.6% +56.7% +6.4%
Average cost per person in
arrears each year £428 £428 £428 £428 £428 £428 £428
Additional cost per service
measure failure each year £58 - £234 £133 £182 £243 £28
Figure 11. High level comparison of the costs of service measures in terms of customer repayments
2.4 Findings
This section provides an overview of the findings for YWS based around the six overarching research questions
£58
£0
£234
£133
£182
£243
£28
£0
£50
£100
£150
£200
£250
£300
Unplannedinterruption
Plannedinterruption
Waterbio/chem
Wateraesthetic
Externalflooding
Internalflooding
Pollutionevents

for this work package.
1) What factors define trust?
Despite emerging evidence from market research on the importance of trust in influencing customer behaviour,
scholarly research on the topic is limited. Very little academic research has attempted to document empirically
the factors that affect trust and where attempts have been made, this research has not systematically
investigated the significance of trust in relation to other potential explanatoryfactors.
Market research conducted amongst water company customers in the UK suggests that higher levels of trust
are associated with reliable water and sewerage services, value for money and customer service. Conversely,
low levels of trust are associated with perceptions of poor value for money, high profits and inaffordability.
2) To what extent do different service measure failures impact upon levels of customer trust in YWS?
An analysis of 7,300 responses to the Customer Tracker survey over the period 2015-17 – in which respondents
are asked the extent to which they agree or disagree with the statement “Yorkshire Water are a company I trust”
– found that the trust in YWS is typically high and that the majority (>75%) of customers consistently ‘strongly
agree’ with the statement. A regression analysis of this dataset found that drinking water quality, internal
flooding, and odour related service measure failures all have a quantifiable negative impact on levels of trust in
YWS. However, it is important to note that service measure failures only explain a very small amount of the
variance in customers’ levels of trust in YWS.
An analysis of the proportion of individual YWS customers who experience service measure failures found that
customers experiencing unplanned supply interruptions, drinking water quality events, internal and external
floods, and pollution incidents are more likely to be in arrears in the following year than typical YWS customers
(see Figure 12).It is not, however, possible to say for certain whether or not this effect is due to changes in trust
as there may multiple other factors that determine non-payment. As noted earlier, investigating quarterly time-
step data over successive periods, controlling for other confounding factors and including trust as an explicit

determinant of payment behaviour may start to yield more reliable results.
Figure 12: YWS customers in arrears
The results therefore suggest that, while there are a wide range of factors which impact on trust, there is some
evidence that unplanned supply interruptions, drinking water quality events, internal and external floods, and
pollution incidents may have negative impacts on trust in YWS; with the evidence being strongest for drinking
water quality, internal flooding, and odour.
3) Which service measures are most important in terms of determining customer trust?
Analysis of the Customer Tracker survey results found that odour events have the most significant negative
impact on trust; with each customer experiencing an odour event giving, on average, a 0.63 lower score on the
trust survey. Odour was followed by internal flooding events (leading to a 0.49 lower score) and drinking water
quality events (with a 0.32 lower score).
The analysis of individual customer data also found that internal flooding events lead to the most significant
increase in likelihood of a customer going into arrears (57% more likely) followed by drinking water quality events
(55% more likely). This analysis found that biological/chemical water quality incidents as opposed to aesthetic
incidents, had the greatest impact on customers going into arrears. There was no data in this analysis on odour
related issues.
The results therefore suggest that odour events are the most important service measure in terms of influencing
customer trust followed by internal flooding and drinking water quality events (particularly biological/chemical
incidents).
4) What impact does trust have on customers’ willingness-to-pay (WTP)?
It was not possible to explore this question with respect to Yorkshire Water within the agreed scope of the work

package. Nevertheless, the academic research points clearly to a positive relationship between social capital
(of which different aspects of trust are key components) and WTP.
The literature review also highlighted some of the aproaches that could be considered for similar projects in
future:
• Valuing trust as an attribute of WTP – one approach could be to include a series of attitudinal questions
within a typical Stated Preference survey. The responses to these attitudinal questions could then be
analysed to estimate the component of the overall WTP value which could be attributed to trust. This
approach would be based on the assumption that customers with higher levels of trust in YWS would
be likely to expect YWS to use money raised from their customers reliably, and thereby would be more
likely to have a higher WTP for investing in tackling service measure failures.
• Trust as an incentive for customers to stay with YWS – an alternative approach could be to undertake
a Stated Preference survey which estimates the level of monetary incentive customers would be willing
to accept in order to switch from YWS to a new, untested water utility. This approach would be based
on the assumption that customers with high levels of trust in YWS would be more likely to require a
higher incentive to switch to an untested new provider.
• Analysing the results from Work Packages 1, 2 & 5 – as an alternative to undertaking additional primary
research, the data collected as part of Work Packages 1, 2 & 5 could be used to explore this question
in more depth. For example, WP1 examined the extent to which respondents’ experiences of service
measure failures influenced WTP and found that there was generally a positive relationship between
service measure failures and WTP (i.e. those who had experienced failures exhibited a higher WTP for
at least). Moreover, the information collated for each of these work packages is spatially explicit (i.e.
can be attached to individual postcodes) and thus could be combined with YWS data on arrears (by
postcode) to reveal whether or not stated preferences (i.e. the WTP estimates) track actual payment
behaviour).
5) Do service measure failures impact the likelihood of customers paying their water bills?
The analysis of individual customer data found that customers who experienced service measure failures in
2016 (aside from planned supply interruptions) were more likely than the average YWS customer to be in arrears
the following year. For example, in 2016-17 it was estimated that around 14% of customers were in arrears, by
contrast, around double the proportion of customers experiencing unplanned supply interruptions were in
arrears in 2017.
The proportion of people experiencing service measure failures in 2016 and being in arrears in 2017 was highest
for internal flood events and drinking water quality (biological & chemical) events; such that 70% and 68% of all
customers experiencing these service measure failures were in arrears the following year. This suggests that a
large proportion of the customers who experience these service measure failures may fail to repay their bills in
future.
The average water bill for defaulted customers in 2016-17 was estimated to be £405 per year, while the wider
costs of bill payment refusals were estimated to be £3.976 million or around £23 per defaulting customer. The
total average cost per payment refusal is thus estimated to be around £428 per year. It can be seen from Figure
3 that the proportion of YWS customers who have experienced a service measure failure who are in arrears is
significantly higher than the proportion of total YWS customers who are in arrears. The difference between the
two is taken as the proportion of additional cost that YWS bears as a result of service measure failures. By
applying the percentage difference to the average total cost, one obtains an estimate of the additional costs to

YWS for each type of service measure failure as follows:
• Unplanned interruption = £58 per customer affected per year
• Planned interruption = £0 per customer affected per year
• Drinking water quality (biological/chemical = £234 per customer affected per year
• Drinking water quality (aesthetic) = £133 per customer affected per year
• External flooding = £182 per customer affected per year
• Internal flooding = £243 per customer affected per year
• Pollution events = £28 per customer affected per year
However, it is important to note that there are significant levels of uncertainty associated with these numbers
and that this is a high level, indicative analysis rather than an in depth estimation of value.
In order to improve this analysis, a series of additional data collection exercises could be undertaken:
• Company-wide data – further time series data could be collected on the annual numbers of service
measure failures, customer payment defaults, and the costs of payment defaults at a company wider
level. Further information would also be useful on the split between customers who ‘can’t’ and ‘won’t’
pay, as well as a more detailed breakdown of the costs to YWS from customers in arrears.
• Trust survey data – the wording of the Customer Tracker survey could be amended as follows: (1) ask
customers whether YWS addressed the issue they contacted about in a satisfactory or unsatisfactory
manner; (2) provide a coded response of service measure failures that respondents can select from
when asked about their reason for contacting YWS; (3) ask customers whether they have refused to
pay their water bills since their last contact with YWS. Note, an alternative could be to gather customer
information from respondents that could be used to correlate their response with individual customer
repayment records (such as post codes). Alternatively, a further option could be to issue the trust survey
directly to people who have refused to pay bills (although the response rate may be low).
• Individual customer data – further data could be collected on the post codes of customers in arrears for
different years, together with additional data on service measure failures experienced by those
customers in previous years. This information could also be combined with spatially disaggregated
information on avertive expenditure (e.g. the findings from Work Package 4) to identify where there may
be overlaps between specific service measure failures, avertive expenditure, trust and customer
satisfaction. A full list of the post codes of all YWS customers would also be useful for undertaking a
more robust quantitative analysis and supporting the development of a more nuanced understanding of
the spatial distribution of bill refusals or customers in arrears. This would help, for example, in examining
the proportion of customers in arrears (e.g. per 10,000 connections) in different postcode areas or
regions independent of the total size of the population.
6) Do service measure failures mean that YWS incurs higher levels of debt?
It was not possible to answer this question based on the data provided by YWS. The average water bill for
defaulted customers in 2016-17 was estimated to be £405 per year, while the wider costs of bill payment refusals
were estimated to be £3.976 million or around £23 per defaulting customer. Data was requested on a more
detailed breakdown of costs for customers refusing to pay their water bills, including any impacts on debt,
although this data was not available. For this issue to be explored more detailed data would be required on the

impact of customer payments on debt levels.

AECOM Infrastructure & Environment UK Limited
Aldgate Tower
2 Leman Street
London
E1 8FA
aecom.com


