The roles of human values and generalized trust on stated ...
31
Munich Personal RePEc Archive The roles of human values and generalized trust on stated preferences when food is labeled with environmental footprints: insights from Germany Grebitus, Carola and Steiner, Bodo and Veeman, Michele Morrison School of Agribusiness and Resource Management, Arizona State University, Danfoss Center of Global Business, Department of Border Region Studies, University of Southern Denmark, Denmark, Department of Resource Economics and Environmental Sociology, University of Alberta, Canada, 2014 Online at https://mpra.ub.uni-muenchen.de/64630/ MPRA Paper No. 64630, posted 29 May 2015 07:56 UTC
Transcript of The roles of human values and generalized trust on stated ...
Munich Personal RePEc Archive
The roles of human values and
generalized trust on stated preferences
when food is labeled with environmental
footprints: insights from Germany
Grebitus, Carola and Steiner, Bodo and Veeman, Michele
Morrison School of Agribusiness and Resource Management, Arizona
State University, Danfoss Center of Global Business, Department of
Border Region Studies, University of Southern Denmark, Denmark,
Department of Resource Economics and Environmental Sociology,
University of Alberta, Canada,
2014
Online at https://mpra.ub.uni-muenchen.de/64630/
MPRA Paper No. 64630, posted 29 May 2015 07:56 UTC
1
The roles of human values and generalized trust on stated preferences when food is
labeled with environmental footprints: Insights from Germany
March 2014
Carola Grebitus1, Bodo Steiner2 and Michele Veeman3*
1 Morrison School of Agribusiness and Resource Management, Arizona State University,
2 Department of Border Region Studies, University of Southern Denmark, Denmark
3 Department of Resource Economics and Environmental Sociology, University of Alberta, Canada,
Abstract
This study explores influences of human values and trust on stated preferences for food labeled
with environmental footprints. We apply survey data to assess influences of these individual-
specific characteristics on German consumers’ stated choices of potatoes, through an attribute-
based choice experiment in which product alternatives are described by footprint labels and
prices. We find that accounting for consumers’ value systems, but not generalized trust beliefs,
aids in understanding choices and identifying possible markets for footprint-labeled food
products.
Key words: carbon footprint, ecological, Rokeach Value Survey, environmental
sustainability, mixed logit
*Senior authorship of this manuscript is shared.
2
1. Introduction
Consumer choices for environmentally sustainable foods are of interest given links between
carbon dioxide and global warming (e.g., IPCC Report 2007), as well as concerns regarding
human intervention in the global hydrological cycle as this relates to the production of agri-
food products (Rost et al. 2008). In Germany, where the first “Product Carbon Footprinting
(PCF) World Summit” was held in 2009, it is estimated that 40% of climate-relevant emissions
can be related to consumption patterns (Schächtele and Hertle 2007; Klockenhoff 2009)1.
Consequently, shifting consumption patterns may have important implications for entire supply
chains (Edwards-Jones et al. 2009), particularly for agri-food (Weber and Mathews 2008).
However, current knowledge is insufficient to understand whether, how and why consumers
might shift to more sustainable consumption patterns (Thøgersen and Ölander 2002). We
consider two basic concepts in analyzing consumer choices for sustainable products. These are
human values, since these guide consumers’ attitudes and judgments (Rokeach 1973), and
individuals’ generalized trust beliefs, which are viewed to reflect innate moral beliefs (Uslaner
2002).
The objective of this paper is to identify differences in consumers’ choices as
determined by trust and human values. Varying information content of labels is explored
relative to environmentally sustainable choices through attribute-based choice experiments
(Louviere et al. 2000), while controlling for trust through measurement of perceptions of the
trustworthiness of others (Luhmann 1979) and consumers’ value systems (Rokeach 1973).
Our emphasis on labeling recognizes that consumers with preferences for environmental
attributes can only adjust consumption patterns in line with these preferences if environmentally
sustainable products can be identified at point of purchase. Early analysts such as Rees (1992)
proposed a “nutrition label for the planet”. This ecological concept includes carbon and water
1 This figure does not include information on farm-level production and industry level.
3
footprints which refer, respectively, to the amounts of CO2 created and water used during food
production, processing, storage, packaging and distribution. Several countries and retail chains
have established pilot projects to support reduction of carbon emissions by providing
information through product labeling, e.g., ‘Carbon Counted Canada’.2 The world’s first
footprint labels were commercially introduced in 2007 in the UK (Economist 2011).
Subsequently the food retailer Tesco introduced a carbon footprint label in cooperation with the
Carbon Trust during 2009. However, Tesco dropped this in early 2012. Reasons cited for this
change were that consumers found the labels to be complicated and difficult to understand; that
Tesco had only been able to label 500 instead of 50,000 own-brand products due to time
requirements for label calculation; and that other retailers were slow to adopt footprint labeling
(Financial Times 2012; Upham et al. 2010).3 Introduction of such labels has also been slow in
other countries (e.g., Powers 2011), despite survey results that found 72% of EU citizens
supportive of carbon labeling and agreeing that this should be mandatory (Upham et al. 2010).
This paper makes contributions to the sparse food-related research on carbon footprint
labeling and human values. While we are aware of studies on the influence of trust on food
consumption and the importance of values to consumption decisions, we are not aware of
previous studies that consider the impact of both features on food choices or environmental
sustainability. The following section outlines the conceptual model, discusses relevant
literature, and develops hypotheses. Methods and experimental design are introduced in section
3, followed by results in section 4, and further discussion and conclusions in the fifth section.
2. Literature, hypotheses and conceptual model
2 See: www.carboncounted.com. 3 Carbon Trust was a private company established by the UK government, with the stated aim of facilitating a
low carbon economy (Upham et al. 2010).
4
In a study of Canadians’ choices among unprocessed meat products (ground beef) labeled for
environmental footprints, Grebitus, Steiner and Veeman (2013) find that several human values
have predictive power. Furthermore, Viscusi, Huber and Bell (2011) highlight that individuals’
environmentally sustainable behavior is potentially influenced by human values regarding
environmental quality and economic incentives. However, although human values are
increasingly recognized to be important to consumers’ choices, the influence of this concept on
the possible impact of environmental implications of food choices has received little attention.
This study builds primarily on three concepts and strands of literature: ecological
footprints trust, and human values. Each contributes to our conceptual model (Figure 1). A brief
discussion of some of the key literature on each concept is followed by hypotheses. The
conceptual model depicts the main relationships between the component variables that are
expected to influence consumer choices of ecologically footprint labeled products. It is
postulated that consumers’ socio-demographic characteristics as well as individuals’ trusting
beliefs (generalized trust) and value systems determine related attitudes and subsequent
behavior. Consumers’ ‘emotional engagement’ associated with climate change (Roeser 2012)
is expected to amplify their interpretation of footprint-labeled products, raising their motivation
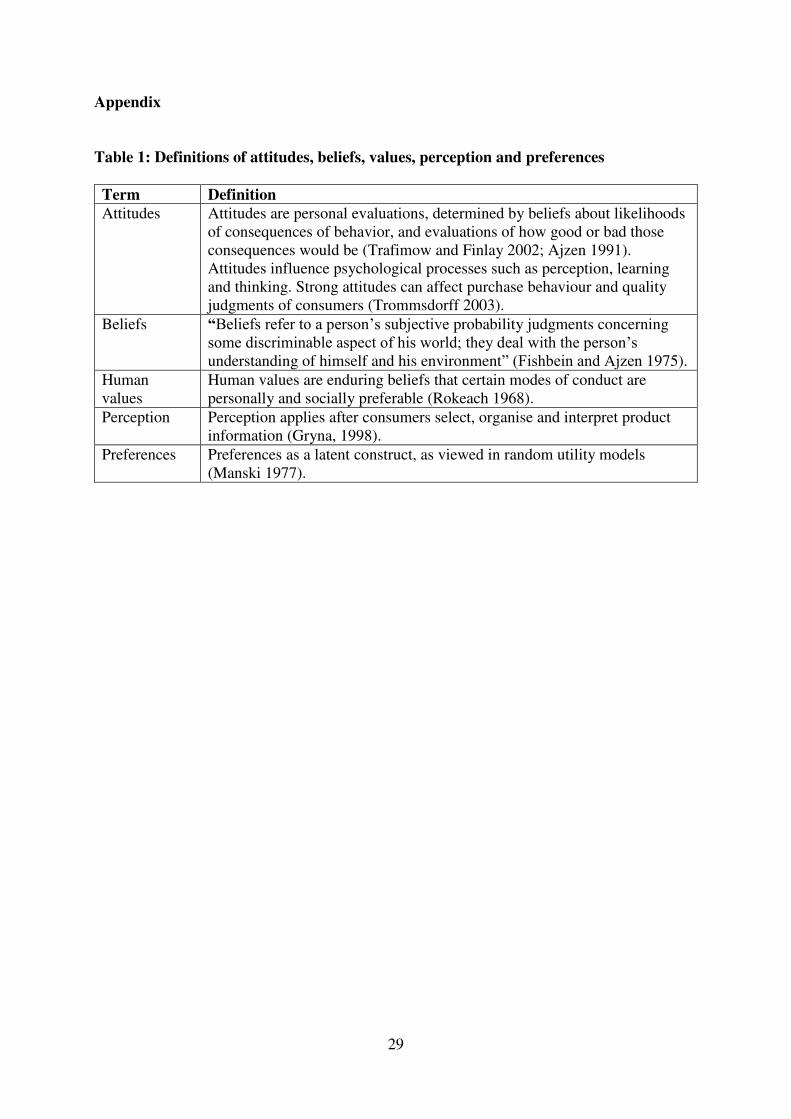
to choose such products. For specific definitions of the terms used in the model and the
following sections see appendix table 1.
Figure 1 here.
Ecological footprints
It has been argued that the ecological footprint concept provides an intuitive framework for
understanding the bottom-line of ecological sustainability (Wackernagel and Rees 1997). A
rapidly expanding literature has focused on the calculation of water and carbon footprints for a
range of food products (e.g., Chapagain and Hoekstra 2007). Information on carbon footprints,
typically expressed as a single figure in units of carbon dioxide equivalents, has been generated
5
as part of life cycle analyses (Chapagain and Orr 2009) and incorporated into labeling studies.
Some studies have focused on the relative unfamiliarity with the primary unit of carbon
labeling. For example, when compared to nutritional labeling, carbon labeling is not very
familiar to consumers because there is a lack of commonplace experiences in which consumers
can contextualize carbon equivalents (e.g., Teisl 2003).
Previous research shows that consumer behavior reflects support for environmental
policies, i.e., consumer behavior is based on support (commitment/value) for environmentally-
friendly products. Kempton (1991) demonstrates that U.S. consumers’ desire to preserve the
environment for their descendants is a key concern to many. Hersch and Viscusi (2006)
consider consumers’ risk beliefs regarding climate change, providing evidence from a 1999
Eurobarometer survey that decision-making governed by self-interest, rather than broader
social welfare calculations, predominates when consumers are queried on support for gasoline
price increases. These authors project that the degree to which consumers benefit directly from
climate change policies will decline with age, with younger persons benefiting more as they
anticipate longer periods of exposure to problems associated with ongoing climate change.
However, the extent of intergenerational differences in support for climate change policies may
hinge on sources of consumer preferences: priority on bequest value for future generations will
soften age-related differences, contrasting to any dominant role of individual-use values
(Hersch and Viscusi 2006). These considerations lead to our first hypothesis:
H1: Younger consumers are more likely to choose products labelled for higher levels of
environmental sustainability.
Trust
As we indicate (Figure 1 and Appendix Table 1), the role of trust has increasingly been
recognized in consumer studies (e.g., Allen et al. 2008; Steiner and Yang 2010; Baddeley et al.
2012; Ding, Veeman and Adamowicz 2012). A study by Gulev (2012) finds positive
6
associations between specific cultural attitudes, including trust, and views of business practices
that enable social and environmental sustainability. The role of trust is considered to be of
particular importance where information is sparse, hard to assess or complex; in these
situations, trust can substitute for full knowledge (Luhmann, 1978). An extensive literature
explores varied trust concepts. Individuals’ generalized trust beliefs are frequently viewed to
reflect a person’s innate moral beliefs and world view (Uslaner 2002, 2008). Consequently, in
this study the role of generalized trust is explored in the context of footprint labeling:
H2: Consumers who display greater levels of generalized trust are more likely to choose
products labelled for higher levels of environmental sustainability.
Human values
The concept of human values was developed in the context of social preferences (Rokeach
1968, 1973). Rokeach (1968) emphasizes that human values are enduring beliefs that certain
modes of conduct are personally and socially preferable. Values are likely to shape attitudes,
emotional reactions and choice behavior (Clawson and Vinson 1978; Alwin and Krosnick 1985;
Beatty et al. 1985; Thøgersen and Ölander 2002); (Figure 1). such that we expect ‘emotional
engagement’ associated with climate change to be potentially an important element in risk-
communication about climate change as it raises awareness and motivates individuals to act
(Roeser 2012). In line with Roeser’s (2012) emotional engagement hypothesis, it is believed
that human values define personal goals and provide standards enabling individuals to evaluate
and compare their own and others’ attitudes and behavior (Leiserowitz, Kates, and Parris 2006).
Rokeach (1973) distinguishes instrumental and terminal values. Terminal values in
particular are conceived to be either intrapersonal (e.g., peace of mind) or interpersonal (e.g.,
world peace), and can be distinguished in terms of personal orientation or social orientation
(Rokeach 1973). While previous studies indicate that social orientation rather than of personal
orientation influences attitudes to sustainable behavior (e.g., Gulev 2012, Schultz and Zelezny
2003), there is also evidence that appeals to the personal effects of sustainability which are more
7
likely to change the behavior of many individuals (eg., Manning 2009, Schultz and Zelezny
2003). This literature leads to the third hypothesis:
H3: Social orientation increases the likelihood to choose products labelled for higher
levels of environmental sustainability, as revealed by footprint labels.
Footprint labels are also relevant in terms of value-symbol congruity since this may
impact consumers’ taste evaluations (e.g., Wansink, van Ittersum, and Painter 2005; Allen,
Gupta and Monnier 2008). Specifically, where there is value-symbol congruency, consumers
describe foods as having better taste and aroma and develop more favorable attitude and
behavior intention (Allen et al. 2008). Value-symbol congruency occurs when the symbolic
properties of a product are congruent with a consumer’s values. Hence, human values can
directly impact consumer food choices and purchase likelihoods when consumers differ in the
extent to which symbolic meaning is important, as may be embedded in food labels (Allen and
Ng 1999; 2003). Consumers make judgments about products based on a product’s attributes, if
those attributes align with their values (knowledge and beliefs) they will have more favorable
judgments of those products. Thus value-symbol congruency is a function of consumers’
capability to make judgments in line with their knowledge and beliefs (e.g., Allen et al. 2008).
Consequently, we expect that greater capability to make product judgments in line with existing
value systems leads to more favorable behavior intentions with regards to footprint labeled
products. This leads to the fourth hypothesis:
H4: Consumers characterized by social orientation perceive greater congruency with
footprint labels associated with higher levels of sustainability, compared to personal-
oriented consumers. Therefore, compared to personal-oriented individuals, social-
oriented individuals display greater propensities to purchase products labeled for
environmental sustainability.
3. Methods and experimental design
8
Study design and sample characteristics
A focus group of 14 consumers preceded an online consumer survey, conducted in Germany
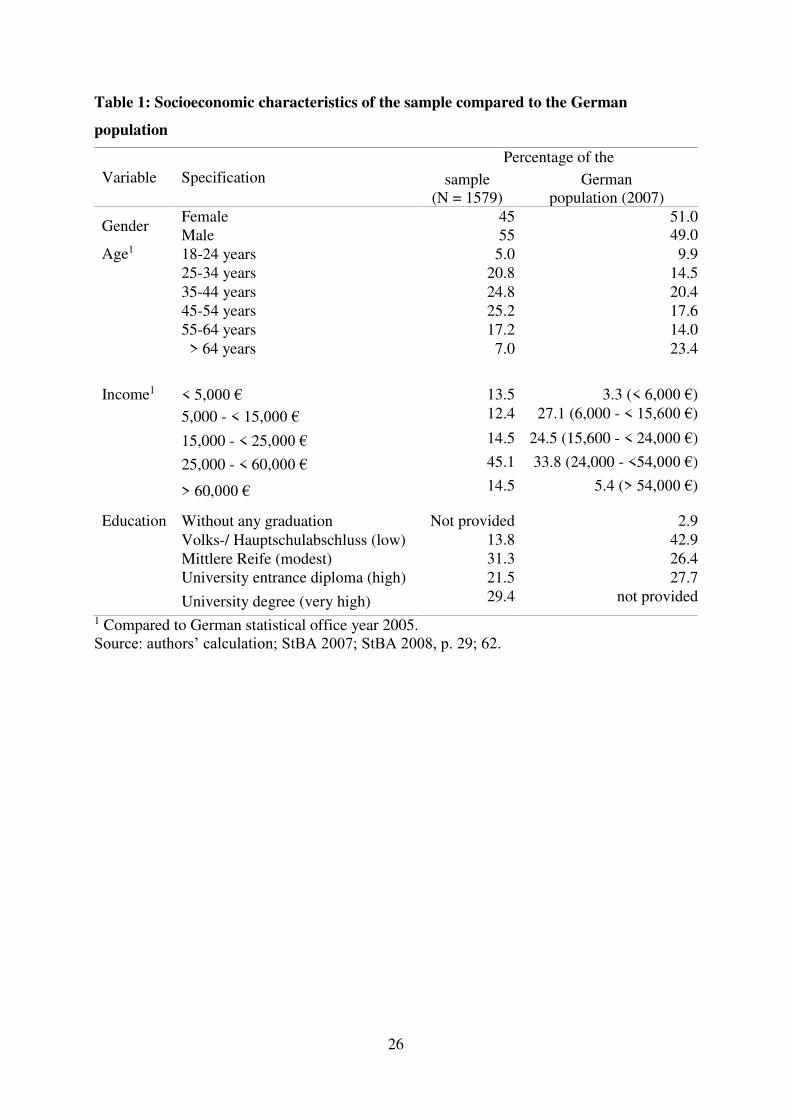
with 1579 respondents in early 2011. A professional marketing firm was contracted to ensure
that the sample would be reasonably representative in terms of major socio-demographics (see
Table 1). The sampled participants were on average 45 years old; 55% were female and the
average annual income was 28,000 Euros. About 30% of the sample has some type of higher
education (e.g., bachelor or master degree). Household sizes ranged from 1 to 7 individuals,
with a mean of 2.2. Some 19% of participants had at least one child in the household.
Table 1 about here
Choice experiment
As potatoes are widely consumed in Germany they are chosen as the research product. The
design of our attribute-based choice experiments (Louviere, Hensher, and Swait 2000) provides
different combinations of price, carbon emission equivalents and water usage; three levels are
included for each (Table 1). Carbon equivalents and water usage numbers used in this analysis
are based on estimates from previous studies (Chapagain and Hoekstra 2004; Potato Council
2010). The identified prices are a range that encompasses observed market prices at regular
food retailers in Bonn, Germany, in fall 2010, based on the mean observed price, plus and minus
one standard deviation (Grebitus et al. 2013). The prices observed are for potatoes that were
not labelled with water or carbon footprints.
Table 2 here.
Ngene software (Ngene manual 2012) was used to generate a random parameter panel
efficient design with three choice alternatives (A, B, C), using the random parameter panel for
efficiency, 500 replications, and 250 Halton draws. Each participant was assigned two choice
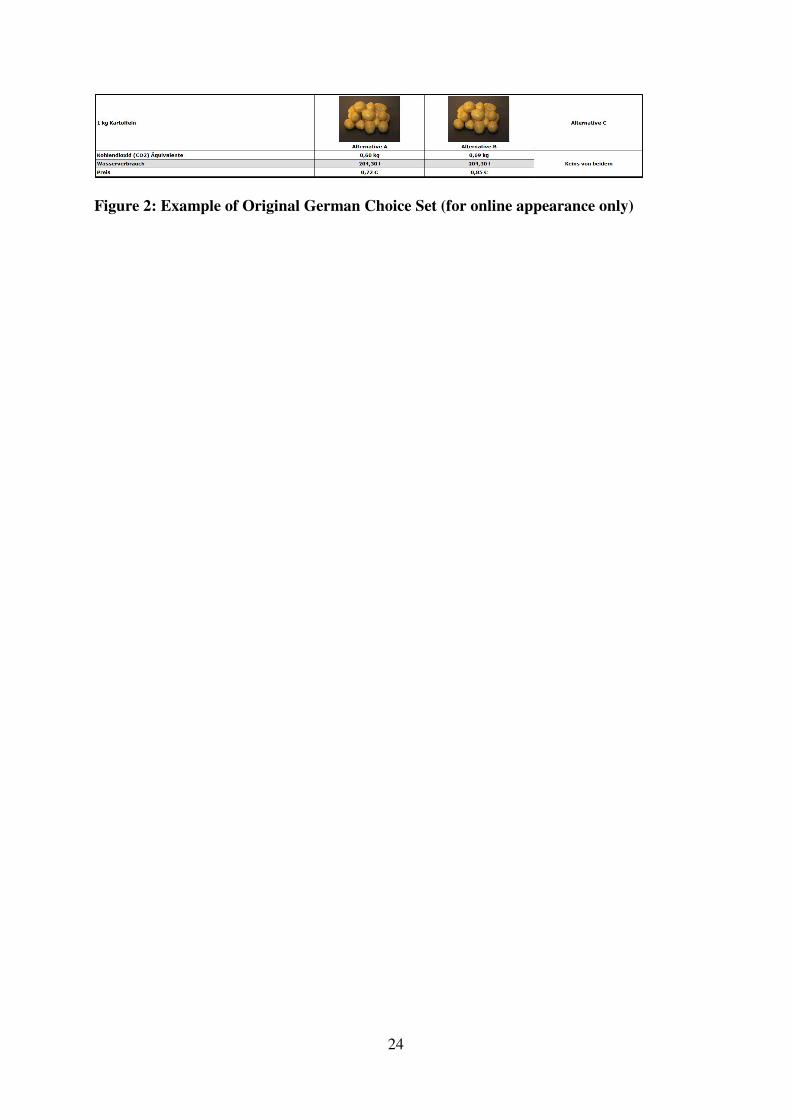
sets. Figure 2 shows an example choice set for potatoes.
9
Figure 2 here (for online appearance only).
Generalized trust
To analyze the role of generalized trust (Hong and Bohnet 2007; Georgarakos and Pasini 2011)
we employ one of the questions of the Generalized Social Survey and focus thus on one item
for measuring generalized trust (Reeskens and Hooghe 2008): “Generally speaking, would you
say that most people can be trusted, or that you can’t be too careful in dealing with people?”
Respondents chose between “yes”, “no” and “I don’t know”. These responses are subsequently
included as an explanator of choices in the estimations.
Rokeach Value Survey
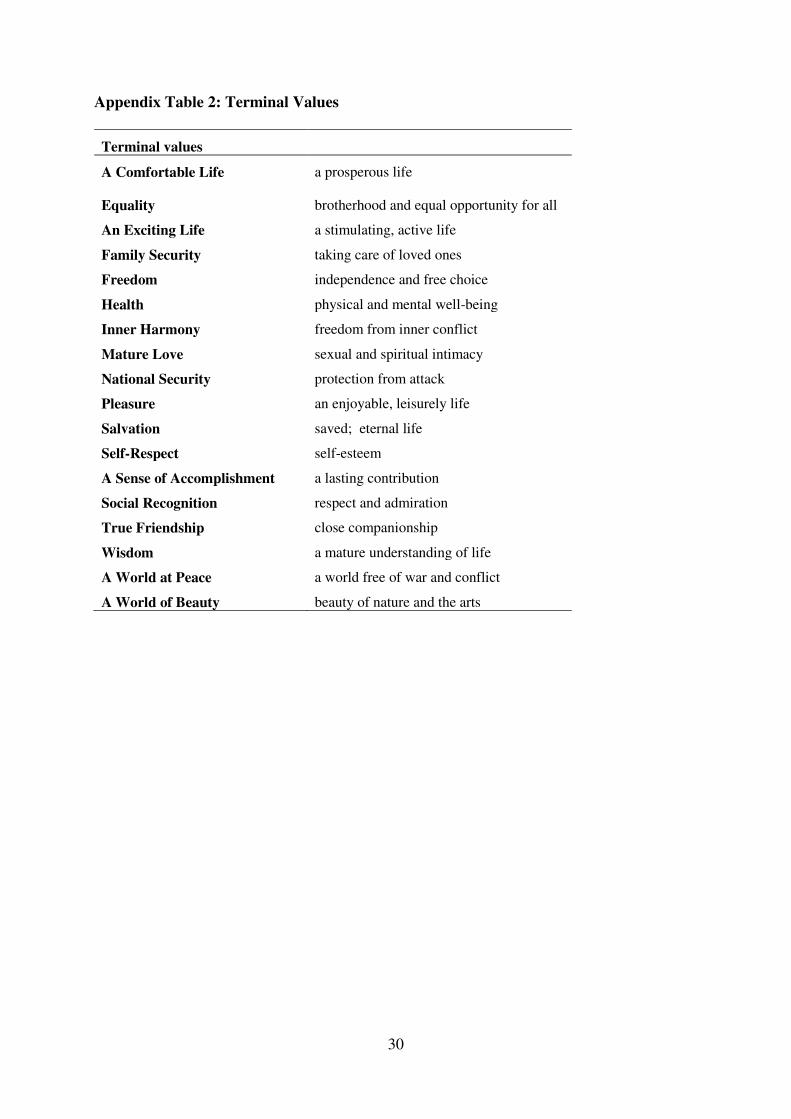
We apply the Rokeach Value Survey (1973), whereby participants were exposed to 18 terminal
values that relate to “end states of existence” (e.g., a world at peace) (see appendix table 2 for
the complete set of terminal values). These values form the basis for identifying the terminal
value system (Rokeach 1968). Respondents ranked each of the alphabetically ordered values
(which were accompanied by a short description) from 1 (most important) to 18 (least
important) based on the perceived relative order of importance. To aid ranking, participants
were asked to consider how much each value acted as a guiding principle in their life.
Following Rokeach (1973), the large number of single values is reduced to fewer
indices, in our case, personal orientation and social orientation, since it is anticipated that these
are particularly relevant for explaining choice propensities related to ecological footprints
(Hypothesis 4). Following Rokeach (1973), unweighted indices were calculated by summing
those values that belong to a given index, and dividing that sum by the number of values
included in the respective index.4 Social orientation is comprised of the values: A World at
4 Example: Assume that respondent i ranked the values as follows: A World at Peace (10) + Freedom (6) + Equality
(15) + National Security (2) = 33/4 = 8.25 for ‘social orientation’ for respondent i.
10
Peace; Freedom; Equality; National Security. Personal orientation is comprised of the values:
True Friendship; Self-Respect. The two value indices are included as independent variables in
the analysis.
Multinomial and Mixed Logit Models
The stated preference data are analyzed using both multinomial and mixed logit models, to
explore insights into the heterogeneity of consumer preferences and allow for plausible
substitution patterns (Train 2009). Underlying the approach is the model of consumer’s random
utility (U), where the utility of alternative j=1,…,J (J=3) for individual i=1,…,I (I=1579) in
choice situation t=1, 2 is described by:
(1) Uijt = Vijt + εijt
where Vijt is the systematic portion of the indirect utility function and εijt is the stochastic
(random) error component, assumed to be independently and identically distributed over all
individuals, alternatives, and choice situations. The probability that subject i chooses option j
in choice situation t is given by:
(2) Prob(Uijt > Uikt) = Prob(Vijt + εijt > Vikt + εikt) k
Assuming the observable portion of utility is linear in parameters, we initially specify
Vijt as:
(3) Vijt = α0Pjt + β1Pricejt + β2Carbon_footprint(CF)jt + β3Water_footprintjt +
β4CF*Trustjt + β5Personal orientationjt + β6CF*Social orientationjt + β7CF*Genderjt
+ β8CF*Agejt + β9CF*Educationjt + β10 None_of_thesejt
where Pricejt is the price of alternative j in choice situation t (a continuous variable measured
in Euros); and Carbon_footprintjt and Water_footprintjt are continuous variables of carbon
11
emission equivalents in kg and water usage in 1,000 liters, respectively. Since our primary
analytic interest here is on carbon footprinting, we include only interaction terms with
Carbon_footprintjt. CF*Trustjt, is an interaction term between generalized trust and carbon
footprint5; CF*Personal orientationjt and CF*Social orientationjt are interaction effects
between carbon footprint and personal and social orientation, respectively. CF*Gender
(female)jt; CF*Agejt; and CF*Educationjt; are interaction terms between carbon footprint,
gender, age, and education, respectively. None_of_thesejt refers to the alternative specific
constant (ASC) equal to one if the participant chose to make no purchase (alternative C), and 0
if alternative A or B was chosen6. The ASC ‘none of these’ was chosen 2.82 % out of all
choices.
The estimation strategy starts with multinomial logit models to identify candidate
attributes and confirm deterministic functional forms for the subsequent mixed logit (MXL)
models (Hensher, Rose and Greene 2005). . Carbon_footprintjt; Water_footprintjt; CF*Trustjt;
CF*Personal orientationjt; CF*Social Orientationjt; None_of_thesejt and socio-demographic
interaction effects are modeled as random parameters to test for variation in preference
heterogeneity. The price is modeled as fixed parameter.
4. Results
Generalized trust
Assessment begins with examination of descriptive statistics of participants’ trust measures and
human values. Those who answered “Yes” to the question on trust in others are characterized
as trusting; some 22% of participants gave this response. Some 71% of respondents indicated
5 Although we provide estimates for the interaction terms, interpretation of these in our non-linear model is less than straight-forward (Ai and Norton 2003). 6 Aside from capturing the average effects on utility of attributes not included in choice-specific labeling attributes (Louviere, Hensher and Swait 2000), the ASC accounts for possible status quo effect on the systematic utility component (Scarpa et al. 2005).
12
“No” indicating they are non-trusting. Only 7% of participants indicated “Don’t know”. We
merged responses for “no” and “don’t know” into an untrusting group (78%) and include this
as a dummy variable in the following analysis.
Human values
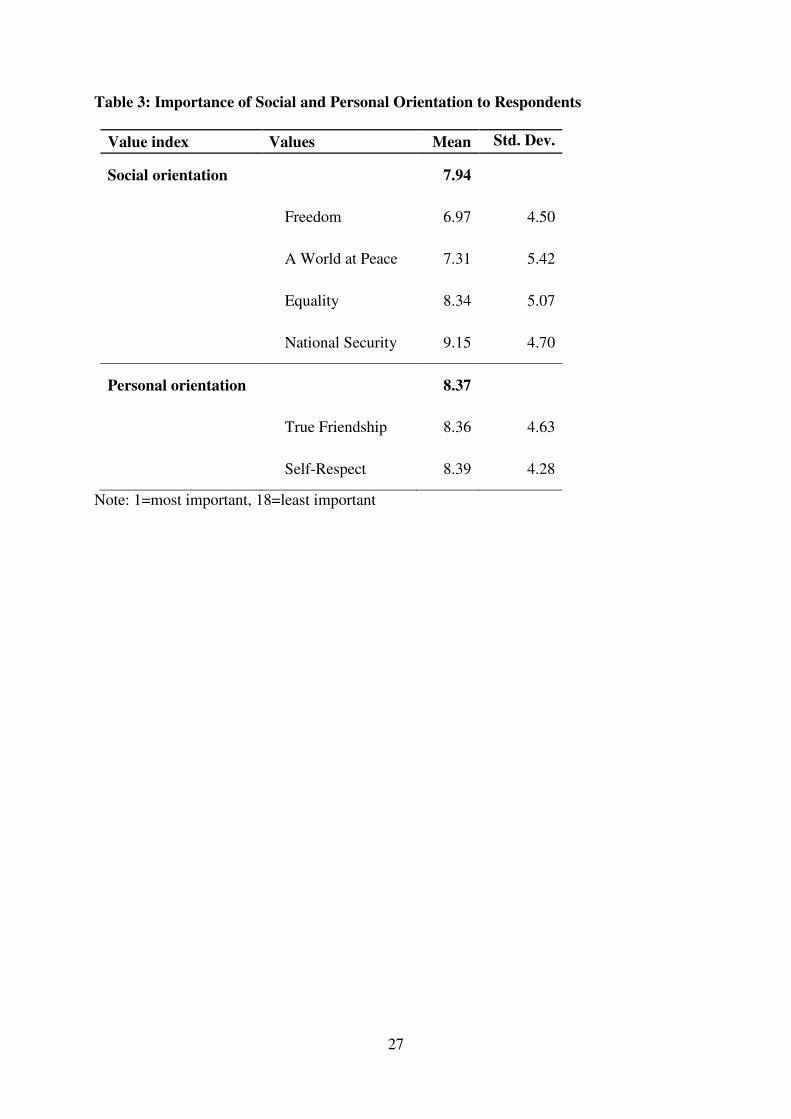
The most important values regarding the personal and social orientation indices are “Freedom”
(M=6.97, SD=4.50) and “A World at Peace” (M=7.31, SD=5.42). As seen from their standard
deviations, there is some lack of certainty for these rankings which could influence
interpretation of the econometric results. Consequently, to account for heterogeneity in
consumer preferences, we ultimately estimate a mixed logit model. Since mixed logit models
provide estimates for both parameter mean and standard deviation, we are able to account for
ranking uncertainties in interpreting results. Table 3 shows the structure and importance of the
value indices.
Table 3 here.
Choice modeling results
To analyze the role of trust and values for consumers’ choices with regard to environmentally
labeled potatoes, we employ a step-wise regression approach. After conducting likelihood-ratio
tests we reject the hypothesis of homogeneity of the model coefficients, and consider MNL 4
as our preferred model (table 4). Considering the BIC index (Schwarz 1978), MNL 4 is a
statistically significant improvement in terms of overall fit compared to MNL 1 to 3. However,
since the MNL models do not take into account that the choices of a given individual may be
correlated across choice sets, we also estimate MNL 4 as the mixed logit model (i.e. model 5,
MXL) (Train 2003). Considering MNL4 and MXL5, the BIC as well as the size of the
likelihood values favor the mixed logit model. Similarly, the likelihood ratio test rejects the
model specification of MNL4 in favor of MXL5. We conclude that allowing for correlations
13
across choice sets and allowing for random parameters yields a significant improvement in
model fit for MXL5, also judged by the likelihood ratio test (Chi squared= 16.919, degrees of
freedom = 9, p < 0.01). We have some evidence for significant variation in preference
heterogeneity, although these effects are not very strong (Carbon-Age interaction).
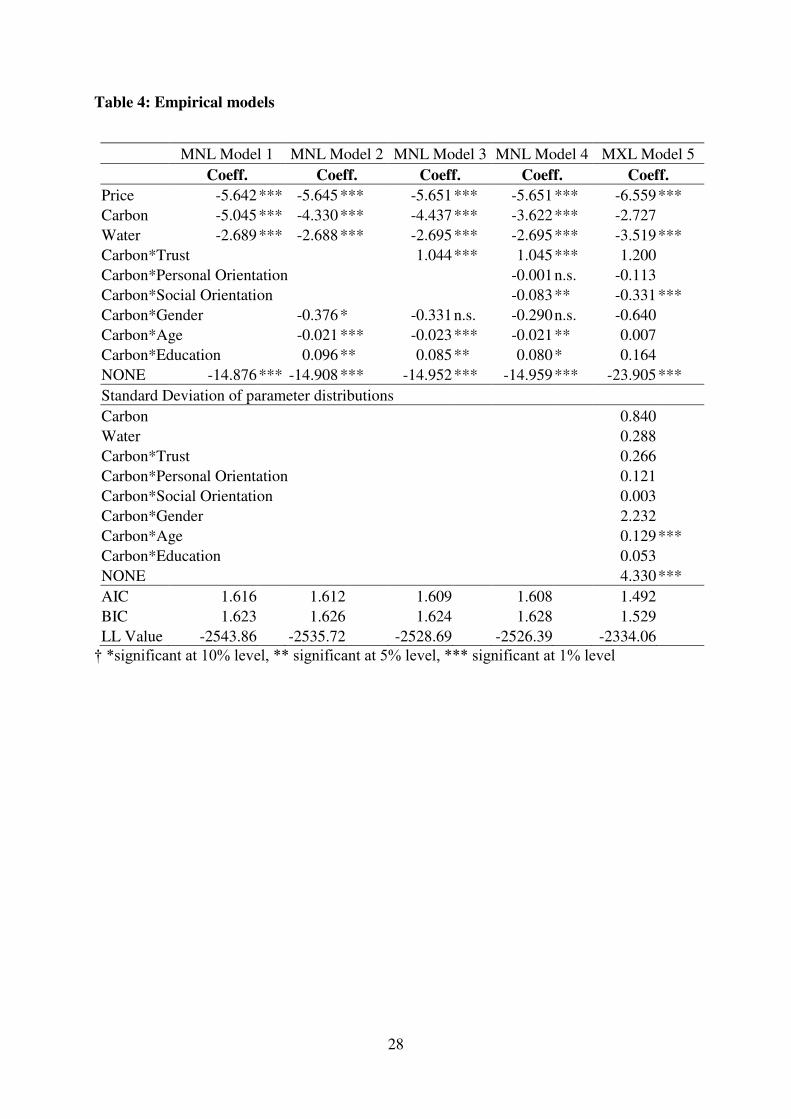
Table 4 here.
Model 1
(MNL1)
Model 2
(MNL2)
Model 3
(MNL3)
Model 4
(MNL4)
Model 5
(MXL)
Coeff. Coeff. Coeff. Coeff. Coeff.
Price -5.642 *** -5.645 *** -5.651 *** -5.651 *** -6.559 *** Carbon -5.045 *** -4.330 *** -4.437 *** -3.622 *** -2.727 Water -2.689 *** -2.688 *** -2.695 *** -2.695 *** -3.519 *** Carbon*Trust 1.044 *** 1.045 *** 1.200 Carbon*Personal Orientation -0.001 -0.113 Carbon*Social Orientation -0.083 ** -0.331 *** Carbon*Gender -0.376 * -0.331 -0.290 -0.640 Carbon*Age -0.021 *** -0.023 *** -0.021 ** 0.007 Carbon*Education 0.096 ** 0.085 ** 0.080 * 0.164 NONE -14.876 *** -14.908 *** -14.952 *** -14.959 *** -23.905 *** Standard Deviation of parameter distributions Carbon 0.840 Water 0.288 Carbon*Trust 0.266 Carbon*Personal Orientation 0.121 Carbon*Social Orientation 0.003 Carbon*Gender 2.232 Carbon*Age 0.129 *** Carbon*Education 0.053 NONE 4.330 *** AIC 1.616 1.612 1.609 1.608 1.492 BIC 1.623 1.626 1.624 1.628 1.529 LL Value -2543.86 -2535.72 -2528.69 -2526.39 -2334.06
Results for all models show that the price coefficient is statistically significant and negative, as
expected, since utility declines with higher prices. Carbon and water footprint estimates are
statistically significant and negative in all models, including MXL5 where the interaction of
14
social orientation and carbon content is, however, highly significant. Overall, it appears that
respondents tend to prefer potatoes that are labeled with lower carbon and water footprints7.
Though the results of models 3 and 4 suggest that those who are more trusting are more
likely to choose products with a higher carbon emission rating, this is not evidenced by model
5. From the mixed logit model, trust has no effect on choosing products labeled with carbon or
water footprint. On the basis of this result hypothesis 2 can be rejected. Again there is no
preference heterogeneity with regard to Carbon footprinting to report.
Valuing personal orientation has no effect on choosing products labeled with carbon
footprints. However, valuing social orientation leads to a stated preference for products with
lower carbon emissions. This is in line with much of the literature and supports hypothesis 3.
This result may also provide a rationale for the anticipated role of value-symbol congruency in
affecting choices of consumers with high social orientation values (Hypothesis 4). There is no
preference heterogeneity to report for either personal or social orientation.
Regarding socio-demographics, we find significant results in the MNL models but not
in the MXL model for the mean parameters. However, we do find significant results for the
standard deviation of the parameter for age. This leads to the conclusion that, in support of
hypothesis 1 and in line with Hersch and Viscusi’s (2006) insight, support for environmental
policies may not only be governed by self-interest but can also be age-specific.
The ASC (“none of these”) is negative and statistically significant in all models,
suggesting a general disinclination to not selecting an eco-labeled product when these are
presented as the product alternatives. However, the results show preference heterogeneity for
the variable NONE indicating that some participants are more likely to opt out than others.
7The non-significant carbon coefficient in MXL4 might arise from the high number of carbon interaction effects included in this equation.
15
5. Conclusions
In analyzing choice propensities for environmentally sustainable foods, what is the benefit of
accounting for measures of generalized trust and human values in addition to traditional socio-
demographics? Overall, we conclude that accounting for human values contributes to a better
understanding of consumer choices for an environmentally sustainable food, relative to
traditional socio-demographic explanators. The results relating to consumers’ trust attitudes
suggest that more work to understand these in the context of environmental issues may be
necessary—at face value, the results of models 3 and 4 suggest that those with high levels of
generalized trust are not concerned about environmental consequences of the food choices
considered here, to the extent that this is reflected in carbon footprint labels of potatoes.
However, consumers’ trust attitudes captured here by one of the questions of the Generalized
Social Survey did not prove to be significant in our main model. To clarify the impacts of trust
in this context, further work is desirable to assess the relationships of those who trust others
relative to those who support environmentally sustainable food consumption patterns, including
whether and how these may interact in building social trust (Rosenblum 1998).
We find that individuals who have a strong social orientation are more likely to choose
potatoes labeled for lower footprints, relative to consumers who show a strong personal
orientation – a result which finds parallels to other studies (e.g., Gulev 2012, Schultz and
Zelezny 2003). These results provide some support for our hypothesis that consumers
characterized by social orientation perceive greater congruency with footprint labels associated
with higher levels of sustainability, thus providing further support for the role of value-symbol
congruity in food choices as evident from previous studies (e.g., Wansink, van Ittersum, and
Painter 2005; Allen, Gupta and Monnier 2008). Regarding traditional socio-demographics, we
find a significant standard deviation parameter for age. However, no significant mean
parameters were found, a result in line with earlier evidence for a processed non-food product
that did not find such differentiation either (Henion 1972; Sandahl and Robertson 1989).
16
Policy implications of our results arise from finding that consumer heterogeneity
matters to at least some degree in the context of labeling vegetables for environmental
footprinting in Germany. There is some heterogeneity in reactions to footprint labeling, and
while many avoid ecologically unfriendly choices, this may not be true for all. To communicate
potential benefits and costs of eco-footprints more effectively, public agents and interested
groups will find it helpful to recognize heterogeneity of different consumer segments, assess
potentially simpler or more direct label statement methods that signal ecological sustainability.
Nonetheless, clarifying the role of trust in the context of sustainable choices requires further
research.
References
Ai, C. R., Norton, E. C. 2003. Interaction terms in logit and probit models, Economics Letters,
80(1) 123-129.
Ajzen, I. 1991. The Theory of Planned Behavior. Organizational Behavior and Human
Decision Processes, 50, 179-211.
Alhakami, A., Slovic, P. 1994. A psychological study of the inverse relationship between
perceived risk and perceived benefit. Risk Analysis, 14: 1085–1096
Allen, M. W., Ng, S. H., 1999. The Direct and Indirect Influences of Human Values on
Product Ownership, Journal of Economic Psychology 20 (1): 5–39.
Allen, M. W., Ng, S. H., 2003. Human Values, Utilitarian Benefits and Identification:
The Case of Meat, European Journal of Social Psychology: 33 (1): 37–56.
Allen, M. W., Gupta R, Monnier, A., 2008. The Interactive Effect of Cultural Symbols
and Human Values on Taste Evaluation, Journal of Consumer Research 35: 294-308.
Alwin, D.F., Krosnick, J.A., 1985. The Measurement of Values in Surveys: A Comparison of
Ratings and Rankings. Public Opinion Quarterly 49(04), 535-552.
17
Beatty, S.E., L.R., Kahle, P. Homer, Misra, S., 1985. Alternative Measurement Approaches to
Consumer Values: The List of Values and the Rokeach Value Survey. Psychology &
Marketing, 1985(2), 181- 200.
Chapagain, A.K., Hoekstra, A.Y., 2004.Water Footprints of Nations. Volume 2: Appendices.
Research Report Series ‘Value of Water’ No. 16. Delft: NESCOIHE.
Chapagain, A.K., Hoekstra, A.Y., 2007. The water footprint of coffee and tea consumption in
the Netherlands. Ecological Economics 64 (1): 109–118.
Clawson, C.J., Vinson, D.E., 1978. Values and consumption patterns: A closed loop. In H.K.
Hunt (Ed.), Advances in consumer research, 5, 403-407.
Ding, Y., Veeman, M. M., Adamowicz, W. L., 2012. The Impact of Generalized Trust and
Trust in the Food System on Choices of a Functional GM Food. Agribusiness, 28, 54–66.
doi: 10.1002/agr.20287.
Economist 2011. Following the footprints, June 2nd 2011
Edwards-Jones, G., Plassmann, K., York, E., Hounsome, B., Jones, D., Canals, M., 2009.
Vulnerability of exporting nations to the development of a carbon label in the United
Kingdom, Environmental Science and Policy 12: 479-490
Financial Times, 2012. Tesco steps back on carbon footprint labeling. January 31, By Louise
Lucas and Pilita Clarke.
Fishbein, M., Ajzen, I. 1975. Belief, Attitude, Intention, and Behavior: An Introduction to
Theory and Research. Reading, MA: Addison-Wesley.
Georgarakos, D., & G. Pasini (2011) Trust, sociability, and stock market participation. Review
of Finance, 15(4): 693-725.
Grebitus, C., Steiner, B., Veeman, M., 2012. Personal Values and Decision Making: Evidence
from Environmental Footprint Labeling in Canada, Am. J. Agr. Econ. first published
online October 15, 2012 doi:10.1093/ajae/aas109
18
Grebitus, C., Jensen, H.H., Roosen, J., Sebranek, J.G. 2013. Fresh meat packaging: Consumer
acceptance of modified atmosphere packaging including carbon monoxide. Journal of
Food Protection, 76(1), 99-107.
Grunert, S.C., Juhl, H.J., 1995. Values, environmental attitudes, and buying of organic foods.
Journal of Economic Psychology, 16, 39-62.
Gryna, F.M. 1998. Market Research and Marketing. In: Juran, J.M, Godfrey, A.B., Hoogstoel,
R.E. and E.G. Schilling (eds): Juran’s Quality Handbook. McGraw-Hill, New York, USA,
5th edition, 18.1.
Gulev, R.E. (2012): Exploring cultural values connected to sustainability: why some people
are more likely to act in a sustainable manner than others. International Journal of
Sustainable Economy, 4(3), 286-299.
Henion, K., 1972. The effect of ecologically relevant information on detergent sales, Journal
of Marketing Research 9(2): 10-14.
Hersch, J., Viscusi, W.K., 2006. The generational divide in support for environmental
policies: European evidence. Climatic Change 77 (1–2): 121–136.
Hong, K., & I. Bohnet (2007) Status and distrust: The relevance of inequality and betrayal
aversion, Journal of Economic Psychology, 28: 197–213.
Intergovernmental Panel on Climate Change, eds. (IPCC). 2007. Summary for Policymakers.
In: Climate Change 2007: The Physical Science Basis. Contribution of Working Group I to
the fourth Assessment Report of the IPCC. Cambridge University Press, Cambridge.
http://www.ipcc.ch/pdf/ assessment-report/ar4/wg1/ar4-wg1-spm.pdf, visited 12/4/2011.
Johnson, B. & Slovic, P. (1994) ‘Improving’ risk communication and risk management:
legislated solutions or legislated disasters? Risk Analysis, 14, 905–906
Kempton, W., 1991. Lay perspectives on global climate change, Global Environmental
Change 1(3): 183–208.
19
Klockenhoff, J., 2009. Product Carbon Footprinting und der Kohlendioxid-bewusste
Konsument, Journal of Consumer Protection and Food Safety, 4: 191-201.
Leiserowitz, A.A., R.W. Kates, Parris, T.M., 2006. Sustainability values, Attitudes, and
Behaviors: A Review of Multinational and Global Trends. Annual Review of Environment
and Resources, 31,413–444.
Louviere J. J., Hensher, D.A, .Swait, J.D., 2000. Stated Choice Methods: Analysis and
Applications. Cambridge: Cambridge University Press
Luhrnann, N., 1979. Trust and Power. Chichester, NY: Wiley.
Manning, C. 2009. The Psychology of Sustainable Behavior. Tips for empowering
people to take environmentally positive action. Minnesota Pollution Control Agency.
Document Number: p-eel-01. http://webcache.googleusercontent.com/search?q=cache:http:/
/www.cogsci.umn.edu/colloquia/docs_F12/Manning_2012.pdf, accessed 2/12/2014.
Manski, C.F. (1977). The structure of random utility models. Theory and Decision, 8: 229–
254.
McKnight, H., Choudhury, D., Kacmar, C., 2002. The impact of initial consumer trust on
intentions to transact with a web site: a trust building model. The Journal of Strategic
Information Systems 11(3): 297-323.
Ngene Manual, 2012. http://www.choice-metrics.com/documentation.html.
Potato Council, 2010. http://www.potato.org.uk/media_files/seed/garethedwards-jones.pdf,
viewed October 2010.
Powers, G., 2011. Retailers move to put carbon footprint labels on products. MSN Money,
www.everyday money.ca/2011/06/retailers-move-to-put-carbon-footprint-labels-on-
products.html, visited 12/4/2011.
Rees, W. E. (1992) Ecological footprints and appropriated carrying capacity: what urban
economics leaves out, Environment and Urbanization, 4(2): 120-130.
20
Reeskens, T., & M. Hooghe (2008) Cross-cultural measurement equivalence of generalized
trust. Evidence from the European Social Survey (2002 and 2004). Social Indicators
Research, 85(3): 515-532.
Roeser, S., 2012. Risk Communication, Public Engagement, and Climate Change: A Role for
Emotions, Risk Analysis, early view DOI: 10.1111/j.1539-6924.2012.01812.x)
Rokeach, M., 1968. The Role of Values in Public Opinion Research. The Public Opinion
Quarterly, 32 (4), 547-559.
Rokeach, M., 1973. The Nature of Human Values. New York: Free Press.
Rosenblum, N. 1998. Membership and Morals. Princeton, NJ: Princeton University Press.
Rost, S., Gerten, D., Bondeau, A., Lucht, W., Rohwer, J., Schaphoff, S., 2008. Agricultural
green and blue water consumption and its influence on the global water system. Water
Resources Research 44 (9) W09405, doi:10.1029/2007WR006331.
Sandahl, D.,Robertson, R., 1989. Social determinants of environmental concern: specification
and test of the model, Environment and Behavior, 21(1): 57-81.
Schächtele, K., Hertle, H., 2007. Die CO2 Bilanz des Bürgers. Publikationen des
Umweltbundesamtes.
Schultz, P.W.; Zelezny, L. 2003. Reframing environmental messages to be congruent with
Americanvalues. Human Ecology Review, 10(2), 126-136.
Scarpa, R.; Ferrini, S.; Willis, K. (2005) Performance of Error Component Models for Status-
Quo Effects in Choice Experiments. In: Applications of Simulation Methods in
Environmental and Resource Economics; Scarpa, R., Alberini, A., (Eds.) Kluwer Acadenic
Publishers: London, UK.
Steiner, B., Yang, J., 2010. How do US and Canadian consumers value credence attributes
associated with beef labels after the North American BSE crisis of 2003? International
Journal of Consumer Studies, 34 (4): 449-463.
21
Teisl, M. F., 2003. What we may have is a failure to communicate: labeling environmentally
certified forest products. Forest Science 49: 668–680
Thøgersen, J., Ölander, F., 2002. Human values and the emergence of a sustainable
consumption pattern: A panel study. Journal of Economic Psychology, 23, 605–630.
Trafimow, D., Finlay, K.A. 2002. The Prediction of Attitudes from Beliefs and Evaluations:
The Logic of the Double Negative. British Journal of Social Psychology, 41, 77-86.
Thurstone, L.L. (1927). A law in comparative judgement. Psychological Review, 34: 273–
286.
Train, K., 2009. Discrete Choice Models with Simulation. Cambridge University Press,
Cambridge, UK 2nd ed..
Trommsdorff, V. 2003. Konsumentenverhalten (Consumer behaviour). Kohlhammer,
Stuttgart, Germany.
Uslaner, E, M., 2002. The Moral Foundations of Trust. Cambridge University Press.
Cambridge, UK.
Uslaner, E.M., 2008. Trust as a moral value. In D. Castiglione, J.W. van Deth, & G. Wolleb
(Eds.), The handbook of social capital (pp. 101–121). New York: Oxford University Press
Vinson, D. E., Scott, J.E., Lamont, L.M., 1977. The Role of Personal Values in Marketing and
Consumer Behavior. Journal of Marketing, 41(2), 44-50.
Viscusi , W.K., Huber, J., Bell, J., 2011. Promoting Recycling: Private Values, Social Norms,
and Economic Incentives. American Economic Review: Papers & Proceedings, 101(3), 65-
70.
Wackernagel, M., Rees, W., 1997. Perceptual and structural barriers to investing in natural
capital: economics from an ecological footprint perspective. Ecological Economics 20 (1):
3–24.
Walter, S., Schmidt, M., 2008. Carbon Footprints und Carbon Label – eine echte Hilfe
bei der Kaufentscheidung? UFW 16:175–181, DOI 10.1007/s00550-008-0082-3
22
Wansink, B., van Ittersum, K., Painter, J.E., 2005. How Descriptive Food Names Bias
Sensory Perceptions in Restaurants. Food Quality and Preference 16 (5): 393–400.
Weber, C.L., Mathews, H.S. 2008. Food-Miles and the Relative Climate Impacts of Food
Choices in the United States. Environmental Science and Technology 42 (10): 3508–3513.
Williams, R.M., 1968. Values. In D.L. Sills (ed.), International Encyclopedia of the Social
Sciences. New York: Macmillan.
Acknowledgements
Funding from the Canadian Consumer and Market Demand Network
(http://www.consumerdemand.rees.ualberta.ca/) is gratefully acknowledged.

23
Figure 1:
Conceptual model
24
Figure 2: Example of Original German Choice Set (for online appearance only)

25
Table 1: Attributes and Attribute Levels for 1 kg of Potatoes used in the Choice
Experiment
Attribute Level
Carbon (CO2) emission equivalents 0.69 kg 0.60 kg 0.51 kg
Water usage 2.35 liter 2.04 liter 1.74 liter
Price 0.98 Euro 0.85 Euro 0.72 Euro
26
Table 1: Socioeconomic characteristics of the sample compared to the German
population
Variable Specification Percentage of the
sample (N = 1579)
German population (2007)
Gender Female 45 51.0 Male 55 49.0
Age1 18-24 years 5.0 9.9 25-34 years 20.8 14.5 35-44 years 24.8 20.4 45-54 years 25.2 17.6 55-64 years 17.2 14.0 > 64 years 7.0 23.4
Income1
< 5,000 € 13.5 3.3 (< 6,000 €)
5,000 - < 15,000 € 12.4 27.1 (6,000 - < 15,600 €)
15,000 - < 25,000 € 14.5 24.5 (15,600 - < 24,000 €)
25,000 - < 60,000 € 45.1 33.8 (24,000 - <54,000 €)
> 60,000 € 14.5 5.4 (> 54,000 €)
Education Without any graduation Not provided 2.9 Volks-/ Hauptschulabschluss (low) 13.8 42.9
Mittlere Reife (modest) 31.3 26.4 University entrance diploma (high) University degree
21.5 27.7 University degree (very high) 29.4 not provided
1 Compared to German statistical office year 2005. Source: authors’ calculation; StBA 2007; StBA 2008, p. 29; 62.
27
Table 3: Importance of Social and Personal Orientation to Respondents
Value index Values Mean Std. Dev.
Social orientation 7.94
Freedom 6.97 4.50
A World at Peace 7.31 5.42
Equality 8.34 5.07
National Security 9.15 4.70
Personal orientation 8.37
True Friendship 8.36 4.63
Self-Respect 8.39 4.28
Note: 1=most important, 18=least important
28
Table 4: Empirical models
MNL Model 1 MNL Model 2 MNL Model 3 MNL Model 4 MXL Model 5 Coeff. Coeff. Coeff. Coeff. Coeff.
Price -5.642 *** -5.645 *** -5.651 *** -5.651 *** -6.559 *** Carbon -5.045 *** -4.330 *** -4.437 *** -3.622 *** -2.727 Water -2.689 *** -2.688 *** -2.695 *** -2.695 *** -3.519 *** Carbon*Trust 1.044 *** 1.045 *** 1.200 Carbon*Personal Orientation -0.001 n.s. -0.113 Carbon*Social Orientation -0.083 ** -0.331 *** Carbon*Gender -0.376 * -0.331 n.s. -0.290 n.s. -0.640 Carbon*Age -0.021 *** -0.023 *** -0.021 ** 0.007 Carbon*Education 0.096 ** 0.085 ** 0.080 * 0.164 NONE -14.876 *** -14.908 *** -14.952 *** -14.959 *** -23.905 *** Standard Deviation of parameter distributions Carbon 0.840 Water 0.288 Carbon*Trust 0.266 Carbon*Personal Orientation 0.121 Carbon*Social Orientation 0.003 Carbon*Gender 2.232 Carbon*Age 0.129 *** Carbon*Education 0.053 NONE 4.330 *** AIC 1.616 1.612 1.609 1.608 1.492 BIC 1.623 1.626 1.624 1.628 1.529 LL Value -2543.86 -2535.72 -2528.69 -2526.39 -2334.06
† *significant at 10% level, ** significant at 5% level, *** significant at 1% level
29
Appendix
Table 1: Definitions of attitudes, beliefs, values, perception and preferences
Term Definition
Attitudes
Attitudes are personal evaluations, determined by beliefs about likelihoods of consequences of behavior, and evaluations of how good or bad those consequences would be (Trafimow and Finlay 2002; Ajzen 1991). Attitudes influence psychological processes such as perception, learning and thinking. Strong attitudes can affect purchase behaviour and quality judgments of consumers (Trommsdorff 2003).
Beliefs “Beliefs refer to a person’s subjective probability judgments concerning some discriminable aspect of his world; they deal with the person’s understanding of himself and his environment” (Fishbein and Ajzen 1975).
Human values
Human values are enduring beliefs that certain modes of conduct are personally and socially preferable (Rokeach 1968).
Perception Perception applies after consumers select, organise and interpret product information (Gryna, 1998).
Preferences Preferences as a latent construct, as viewed in random utility models (Manski 1977).
30
Appendix Table 2: Terminal Values
Terminal values
A Comfortable Life a prosperous life
Equality brotherhood and equal opportunity for all
An Exciting Life a stimulating, active life
Family Security taking care of loved ones
Freedom independence and free choice
Health physical and mental well-being
Inner Harmony freedom from inner conflict
Mature Love sexual and spiritual intimacy
National Security protection from attack
Pleasure an enjoyable, leisurely life
Salvation saved; eternal life
Self-Respect self-esteem
A Sense of Accomplishment a lasting contribution
Social Recognition respect and admiration
True Friendship close companionship
Wisdom a mature understanding of life
A World at Peace a world free of war and conflict
A World of Beauty beauty of nature and the arts


![Derived categories and rationality of conic bundles · 2013. 12. 2. · via generalized homological mirror symmetry, leads to the conjectures stated in [Kat09,Kat10]. Anyway we do](https://static.fdocuments.net/doc/165x107/5feb6a27fa4af95b0b7d718e/derived-categories-and-rationality-of-conic-bundles-2013-12-2-via-generalized.jpg)


![CENTERITY SERVICE PACK FOR CLOUDERA€¦ · OOZIE [roles status] • CLOUDERA ROLES SOLR [roles status] • CLOUDERA ROLES SPARK [roles status] • CLOUDERA ROLES SQOOP [roles status]](https://static.fdocuments.net/doc/165x107/5fc0df6d43307a59a12ae0a7/centerity-service-pack-for-cloudera-oozie-roles-status-a-cloudera-roles-solr.jpg)