Aplus Wave 1.5 Final Report
32
A rizona P athways to L ife Success for U niversity S tudents Wave 1.5 Economic Impact Study: Financial Well-Being, Coping Behaviors and Trust among Young Adults National Endowment for Financial Education ® (NEFE ® ) John & Doris Norton School of Family & Consumer Sciences College of Agriculture and Life Sciences Take Charge America Institute for Consumer Financial Education and Research January 2010
Transcript of Aplus Wave 1.5 Final Report

Arizona Pathways to Life Success for University Students Wave 1.5 Economic Impact Study: Financial Well-Being, Coping Behaviors and Trust among Young Adults
National Endowment for Financial Education® (NEFE®)John & Doris Norton School of Family & Consumer SciencesCollege of Agriculture and Life SciencesTake Charge America Institute for Consumer Financial Education and Research
January 2010

2
Dear Colleagues,
In 2007 we launched APLUS, a longitudinal study following a freshmen cohort group through its college years to better understand the financial development processes of young adults. The only longitudinal study of its kind, APLUS is a crucial first step in learning how to better prepare our youth to be financially self-sufficient.
From the inception of the study, we believed that the normative financial developmental process of young people can be significantly altered by unexpected and uncontrollable events, such as major natural disasters or economic crisis. Consequently, the current economic crisis, unfortunate in many ways, presented a natural laboratory to study the impact of global economic instability on young people’s financial attitudes, behaviors and well-being.
Media and public interest in Wave 1 and the ensuing interest in Wave 1.5 demonstrate the importance and timeliness of this research, both in understanding the formation of financial behaviors and identifying opportunities to improve the behaviors and well-being of emerging adults. In this report, we re-examine APLUS benchmark data, collected prior to the economic crisis (spring 2008), alongside data collected during the economic crisis (spring 2009)—an “Impact Sample”—to create a unique and powerful data set, one that will enhance our scientific understanding of the financial socialization process that individuals pass through on their way to adulthood.
Once again, I am indebted to many people for making Wave 1.5 of the APLUS project a success. First, I am grateful to my partner, Dr. Joyce Serido, Co-Principal Investigator, who not only provides keen intellectual input but also keeps the project team working in a timely fashion. Also, without the continuous support and partnership of the National Endowment for Financial Education® (NEFE®), we might have missed this unique opportunity. Together, we were able to conduct a more in-depth study of the impact of the recession on our young adults. Finally, I owe thanks to my colleagues, Co-investigators Dr. Noel Card for his statistical assistance, Dr. Bonnie Barber for her insight into young adults’ developmental processes, Dr. Jing Xiao for his expertise in personal finance and Dr. Michael Staten for his ongoing support in conjunction with the Take Charge America Institute. Thanks also to Robert Lanza for his technical expertise; to graduate student researchers, Mr. Chuanyi Tang, Ms. Sun-Young Ahn and Mr. Chiraag Mittal; and to our numerous campus partners at The University of Arizona.
Last but not least, I want to thank the APLUS students, who shared their candid opinions and attitudes as well as their personal stories regarding how the current economic crisis has affected them and their families. Together, we are changing scholarly inquiry in the field of financial literacy and bringing the importance of financial well-being in people’s lives to the attention of mainstream social science researchers.
Thank you.
Sincerely,
Soyeon Shim, Ph.D.Professor and Principal Investigator, APLUS
Soyeon ShimProfessor
Principal InvestigatorAPLUS

3
13-1
Table of Contents
Authors Soyeon Shim, Ph.D., Director and Professor, The University of ArizonaJoyce Serido, Ph.D., MBA, Assistant Research Scientist, The University of Arizona
Acknowledgement:This study has been made possible through the generous support of the National Endowment for Financial Education® (NEFE®). The authors would like to thank NEFE® for their dedication to research, education and outreach in promoting financial literacy.
Joyce SeridoAssistant Research ScientistCo-PI and Project Manager
APLUS
Executive Summary
Introduction
The Changing Lives of the APLUS Students
Economic Impact
How Crisis Affects What We Know (and What We Think We Know)
How Crisis Affects Financial Behavior
How Crisis Affects Well-Being
Matters of Trust
Coping with Financial Change
Summary and Implications
What’s Next for APLUS?
References
4
6
8
10
13
15
19
22
26
27
29
30

4
Arizona Pathways to Life Success for University Students (APLUS) is a longitudinal study of students who entered the University of Arizona as freshmen in 2007. We collected Wave 1 benchmark data from February to April, 2008, from 2,098 students—more than a third of the freshman class.
The U.S. financial crisis that erupted soon after we collected the benchmark data ignited a wave of global economic challenges, creating a unique, limited period of time in which to examine the immediate effects of those events through a follow-up study on a smaller group from our original sample. While we expected to obtain a few hundred completed surveys in this short window of opportunity, the response rate of more than twice what we anticipated (N=748) suggests that students were eager to share and process their experiences in the wake of economic turmoil.
We surveyed this “Impact Sample” (named for the timing of the study, not for attributes inherent to the sample) between April and February, 2009. In this report, we summarize our findings regarding changes in many of the variables we explored in Wave 1—financial literacy, coping behaviors, well-being, etc.—and differences in those changes based on gender, ethnicity, socio-economic status (SES) and other factors.
Beyond merely documenting the effects of economic crisis, we look to Wave 1.5 data to help us understand how young adults adapt. At the same time, we report findings on a dimension new to the APLUS study: trust. Finally, we’ve added to our reporting students’ own voices—open-ended responses from our survey—which bring to life in a clear, compelling way students’ feelings about economic circumstances and the challenges they face.
The APLUS study began in 2008 with survey data from more than 2,000 college freshmen.
Soon after, the U.S. financial crisis presented a natural laboratory for studying the effects of economic crisis.
We refer to the 700+ students of the current study as the “Impact Sample.” Through them, we hope to better understand how young people adapt to economic hardship and uncertainty.
Executive Summary

5
Key Findings
Economic impact. Nearly all students reported that the economic crisis had impacted their families (95%), their own finances (93%) and their money management (95%). Women, African Americans, lower-SES and lower-GPA (below 3.0) students reported greater impact.
Overall, the students reporting the most impact also reported:• The highest increases in credit card debt• The deepest declines in psychological, physical and financial well-being• Significantly more responsible budgeting behaviors but fewer savings behaviors• Significantly more typical and extreme coping strategies
Gender differences. The economic impact from Wave 1 to Wave 1.5 affected women more financially and men more academically.
• Financial self-confidence (self-assessments of financial knowledge) dropped 22% for women, double that of men
• Men adopted more responsible borrowing behaviors, whereas women increased risky borrowing behaviors
• Academic satisfaction decreased more for men: a 6% drop for men compared to a 2% drop for women
Racial differences. Self-assessed and objective measures provide evidence of the disproportionate burden of the recession on minority students:
• Financial self-confidence of Native American and Hispanic students dropped the most —25% and 23% respectively. African American students, already lowest in Wave 1—remained lowest with a further 19% decline
• Credit card debt increased 219% for African American students and 105% for Hispanic students – compared to a 64% increase for White students
• Self-assessed health of African American students dropped 14% - the lowest of all groups. In Wave 1, self-assessed health of African American students was second only to White students
Additional Findings
Risky coping strategies. While typical cost-cutting strategies rose moderately, risky coping strategiesrose at an alarming rate: three times as many students (+169%) dropped classes, twice as many (+106%) took leaves of absence, and 78% postponed health care. We also saw a 26% rise in the use of one credit card to pay another.
Well-being. Students reported lower satisfaction and well-being in all categories—psychological,financial, physical, relational and academic—with declines ranging from 3 to 8%.
Trust. The percentage of APLUS students indicating strong trust in financial institutions is more than 50% lower in comparison to a national study of young adults conducted in 1997. Nearly 20% of the Impact Sample students indicated hardly any confidence at all.
Given the soberingeconomic statistics of2008, it’s not surprisingthat our study founda majority of studentsreporting lower well being and greater debt.
Women, minoritiesand students fromlower-SES families wereover-represented amongstudents hit hardest by the economic downturn.
They also shared moresignificant declinesas compared to theircircumstances, feelingsand behaviors comparedto a year earlier.
Men and women bothsaw declines betweenWave 1 to Wave 1.5surveys, with womenfeeling the effects morefinancially and menfeeling them moreacademically.
Our findings support theconcept of a racial dividein the wake of recession.Judging by Wave 1.5data, African Americanand Hispanic studentswere especially hard hitby the economic crisis.

6
While most college students rely on their parents for some material assistance (Schoeni & Ross, 2005), they frequently make independent financial decisions. In their routine, daily lives, they practice financial management, develop financial habits, cultivate economic aspirations and acquire financial knowledge, both directly and indirectly.
Developmental studies of college-age youth have historically neglected the financial domain, though researchers have clearly shown that financial circumstances and attitudes have far-reaching impact on overall well-being and personal satisfaction.
When unexpected, macro-level events like the recent economic crisis disrupt normative financial development, that interference creates a natural laboratory for studying the impact of economic instability on well-being and “financial character”—values, knowledge, skills, goals and behaviors related to personal finances and money management.
Wave 1.5 Focus and ObjectivesExamining current data in relation to that from APLUS Wave 1, collected prior to the economic crisis, the current report:
• Assesses how the economic crisis affected financial literacy, behavior, coping and well-being• Identifies and profiles those individuals made most vulnerable as a result of the economic crisis• Assesses trust in financial institutions • Offers a conceptual model for how students adapt to economic hardships
Background on APLUS Wave 1Arizona Pathways to Life Success for University Students (APLUS) is a landmark longitudinal research study examining the connections between financial behaviors and well-being.
SampleThe 2,098 students who completed the survey made up 32% of the 2007 first-year cohort.
Research Goals• Short term - To understand how young adults form financial behaviors • Longer term - To understand how those financial behaviors affect later success and well-being
Wave 1 Data Collection: February – April, 2008Our initial data focused on how family background, parental roles and financial socialization (both growing up and in the first-year at college) affected financial literacy and well-being.
MethodStudents completed an online or paper/pencil, 15-minute survey about their well-being, their family financial environments, high school financial education and work experience, and financial attitudes and behaviors. Roughly 85% completed the survey online.
ResultsBenchmark data led to the development of a conceptual model for pathways by which students develop responsible financial behaviors. Two findings, in particular, stood out:
• Higher parental expectations and students’ own positive financial attitudes were linked to students engaging in fewer risky behaviors
• While work experience and formal financial education both influenced students’ financial knowledge, direct teaching by parents had more influence than those two factors combined
The economic crisis created a unique opportunity to study changes in “financial character,” an integration of money-related values, knowledge, behaviors and more.
Among other elements, APLUS 1.5 helps us understand which students are most vulnerable to economic crisis and how they cope.
Our original data set came from 32% of the UA’s 2007 entering freshmen and helped reveal how family, education and work experience shape financial character.
One of the most significant findings from our initial data set was that more than anything or anyone else, parents shape students’ financial character.
Introduction
7
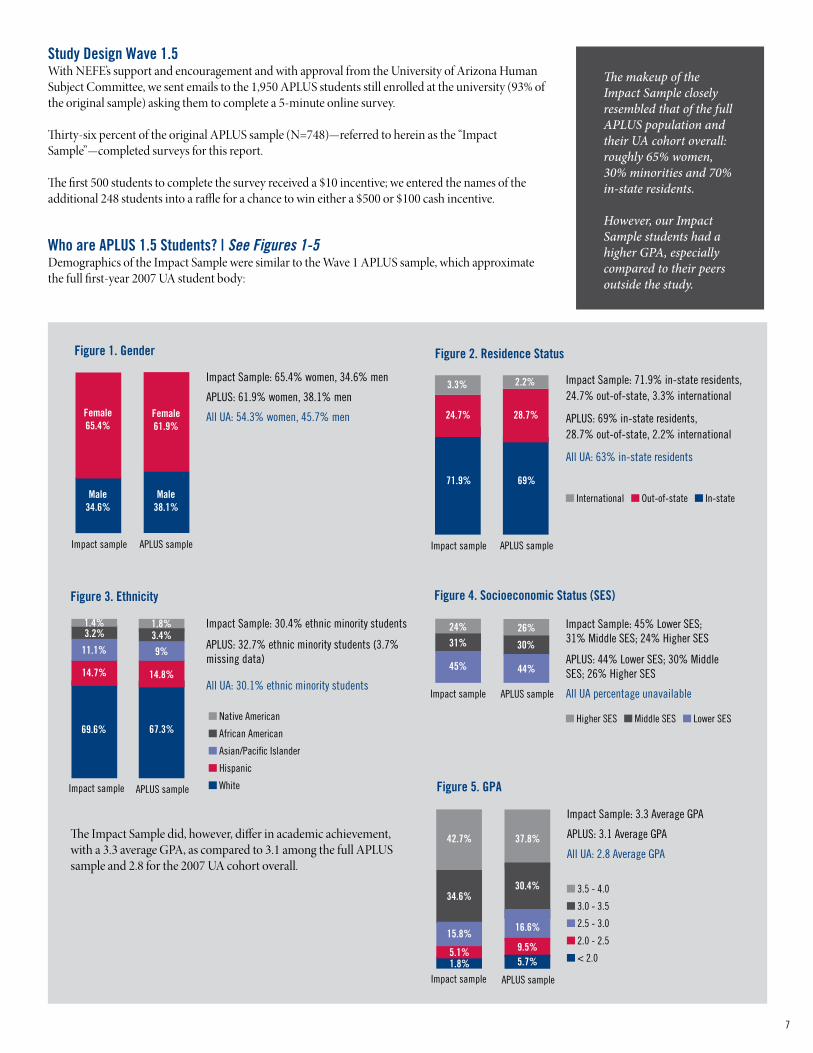
Study Design Wave 1.5With NEFE’s support and encouragement and with approval from the University of Arizona Human Subject Committee, we sent emails to the 1,950 APLUS students still enrolled at the university (93% of the original sample) asking them to complete a 5-minute online survey.
Thirty-six percent of the original APLUS sample (N=748)—referred to herein as the “Impact Sample”—completed surveys for this report.
The first 500 students to complete the survey received a $10 incentive; we entered the names of the additional 248 students into a raffle for a chance to win either a $500 or $100 cash incentive.
Who are APLUS 1.5 Students? | See Figures 1-5Demographics of the Impact Sample were similar to the Wave 1 APLUS sample, which approximate the full first-year 2007 UA student body:
The makeup of the Impact Sample closely resembled that of the full APLUS population and their UA cohort overall: roughly 65% women, 30% minorities and 70% in-state residents.
However, our Impact Sample students had a higher GPA, especially compared to their peers outside the study.
Figure 1. Gender
Female61.9%
Male38.1%
APLUS sample
Female65.4%
Male34.6%
Impact sample
Impact Sample: 65.4% women, 34.6% men
APLUS: 61.9% women, 38.1% men
All UA: 54.3% women, 45.7% men 24.7%
71.9%
Impact sample
3.3%
International Out-of-state In-state
Impact Sample: 71.9% in-state residents, 24.7% out-of-state, 3.3% international
APLUS: 69% in-state residents, 28.7% out-of-state, 2.2% international
All UA: 63% in-state residents
Figure 2. Residence Status
28.7%
69%
APLUS sample
2.2%
The Impact Sample did, however, differ in academic achievement, with a 3.3 average GPA, as compared to 3.1 among the full APLUS sample and 2.8 for the 2007 UA cohort overall.
Impact Sample: 30.4% ethnic minority students
APLUS: 32.7% ethnic minority students (3.7% missing data)
All UA: 30.1% ethnic minority students
Figure 3. Ethnicity
APLUS sampleImpact sample
Native American
African American
Asian/Pacific Islander
Hispanic
White
Impact Sample: 45% Lower SES; 31% Middle SES; 24% Higher SES
APLUS: 44% Lower SES; 30% Middle SES; 26% Higher SES
All UA percentage unavailable
Figure 4. Socioeconomic Status (SES)
Higher SES Middle SES Lower SES
Impact sample APLUS sample
30%
26%
45% 44%
24%31%
1.8%3.4%
9%
14.8%
67.3%
1.4%3.2%
11.1%
14.7%
69.6%
Impact Sample: 3.3 Average GPA
APLUS: 3.1 Average GPA
All UA: 2.8 Average GPA
Figure 5. GPA
APLUS sample
16.6%
30.4%
37.8%
1.8%5.1%
15.8%
34.6%
42.7%
3.5 - 4.0
3.0 - 3.5
2.5 - 3.0
2.0 - 2.5
< 2.0
Impact sample
9.5%5.7%

8
Demands of College Life | See Table 1 While our primary interest was in understanding the impact of the financial crisis, we know that students take on additional responsibilities as they progress through college (more challenging classes, living off-campus, new relationships).
To account for the impact of these demands separately from the financial crisis, we first asked students about perceived changes in the demands of college life as compared to those of the previous year in three areas: personal responsibilities, academic demands and financial obligations.
Rating “increasing demands” on a 5-point scale, students reported some level of increase in all areas:
3 = “Somewhat” & 4 = “A lot”• Academics: 3.72• Personal responsibilities: 3.68• Financial obligations: 3.46
Other findings in this area include:• Gender difference: Men reported a greater increase in personal responsibilities• Ethnic difference: Hispanic students reported a greater increase in financial obligations compared
to White students • GPA difference: Students with GPAs below 3.5 reported a greater increase in academic demands
and financial obligations• SES difference: Students from lower- and middle-class families reported greater increases in
financial obligations
Men in the Impact Sample felt a greater increase in personal responsibilities compared to women, and lower achieving students reported academics becoming significantly more demanding.
The Changing Lives of the APLUS Students
Table 1. Perceived Changes in Demands Since Freshman Year
GEnDER EThniCiTY GPA SES
Changes in Average Male Female White African Asian/ hispanic native < 3.0 3.0 – 3.5 > 3.5 Lower Middle higher Amercian Pacific American islanderPersonal Responsibilities 3.68 3.84a 3.59b 3.63 3.70 3.84 3.74 3.83 3.80 3.72 3.59 3.70 3.68 3.63
Academic Demands 3.72 3.73 3.71 3.67 4.04 3.83 3.73 3.94 3.89a 3.81a 3.57b 3.73 3.71 3.67
Financial Obligations 3.46 3.46 3.46 3.36a 3.83 3.44 3.73b 3.86 3.78a 3.55a 3.23b 3.63a 3.43a 3.14b
Notes: Letters (a, b) indicate statistically significant group differences.

9
Progress Toward Self-Sufficiency | See Figure 6 & Table 2We gauged students’ progress towards self-sufficiency by first asking them to assess their own adult status, then asking if they’re financially independent (their parents do not claim them as a dependent on tax returns).
More than 90% of students reported feeling progress toward adulthood. Nearly 80% reported financial dependence on their parents.
Other findings in this area include:• Gender difference: Men reported feeling more adult• Ethnic difference: White students reported feeling more adult compared to Asian/Pacific
Islander students• SES difference: More lower-SES students reported financial independence
While 9 in 10 students felt more adult, 8 in 10 were still financially dependent on their parents.
Figure 6. Perceived Progress Toward Adult Status
No 1.2%
Not really 6.5%
In some ways 41.2%
In most ways 36.9%
Yes 14.2%
Table 2. Perceived Progress Toward Self-Sufficiency
GEnDER EThniCiTY GPA SES
Average Male Female White African Asian/ hispanic native < 3.0 3.0 – 3.5 > 3.5 Lower Middle higher American Pacific American islanderReaching Adulthood 3.57 3.67a 3.52b 3.62a 3.62 3.28b 3.48 3.92 3.57 3.60 3.56 3.66 3.53 3.51
Dependant on Parents 79.6% 76% 81% 81% 78% 80% 74% 69% 79% 78% 81% 69%a 87%b 88%b
Notes: Letters (a, b) indicate statistically significant group differences.

10
Given the widespread impact of the 2008 economic crisis across the United States (Kansas, 2009), it’s not surprising that most students we surveyed felt the effects. In the APLUS 1.5 data set, women, African Americans, students with a GPA < 3.0 and lower-SES students all reported greater impact compared to their peers, and more than half of the Impact Sample (432 students) provided narrative insights as to how they’ve been affected, sharing comments like this one:
“The economic situation has made it difficult to feel comfortable in where I stand financially. It has always been difficult for college students to pay for many things and now with the economy the way it is, it is just that more difficult.”
To understand the economic impact of the financial crisis on the students, we developed a conceptual model for managing the ups and downs of life (Hobfoll, 1989; Lazarus & Folkman, 1984).
When external events, in this case the recent financial crisis, cause a change in financial resources:• Students may think and feel differently about their financial well-being• And change their financial strategies and behaviors to handle the changes
Subjective impact of the Economic Crisis | See Figure 8 & Table 3
Challenges at school. Most often, students cited concerns over UA budget cuts and resulting impact on programs and classes (101 students) and tuition increases (97 students). One student commented,
“The current economic situation has had a profound impact on my education in terms of course offerings for next semester and whether I will be able to graduate on time. With budget cuts, class sizes will increase, programs that I participate in will be cut or receive less funding and my selection of classes will greatly decrease.”
Increased tuition caused students— including several students on fixed scholarships—concern over how to pay for the increases. As one student explained,
“The current economic situation has made me lose hours at work, which stresses me out because I’m always going to be tight on money now. The situation has also increased my tuition and my scholarship no longer covers all the expenses. I now have to pay out of my own pocket to cover tuition cost plus books and everything else that comes with going to college.”
Challenges at home. Ninety-five percent of students reported that the current economic crisis affected their family finances, with roughly half reporting “a lot” or “a great deal” of impact. One student explained her family situation as follows:
As a new element in Wave 1.5 data, we collected narrative accounts from more than 400 students.
Roughly one in four of these students expressed concerns about the economic crisis increasing tuition or damaging the quality of his/her education.
Economic Impact
Nine out of ten students said the economic crisis had affected their personal finances. Nearly half reported “a lot” or “a great deal” of impact on family finances.
Figure 7. Managing Life’s Ups and Downs
ChAnGES in RESOURCESFinAnCiAL CRiSiS
ChAnGES in FEELinG
ChAnGES in ThinKinG ChAnGES in DOinG

11
“My parents’ jobs are both in jeopardy and I’m a full time student (don’t work), so there’s a lot of concern over whether there’ll be enough money for me to continue my education without having to take out loans and such. A lot of money that was supposed to be for educational costs was lost in the stock market...”
Personal blows. More than 90% of students also indicated that the economic crisis directly affected their own finances, often accompanied by more responsibility for personal expenses. One student explained,
“My parents have lost a lot of money and so I am now more responsible for more of my finances. I have to work a lot more. I hesitate a lot to engage in social activities that cost money.”
Working students were also affected. Said one student,
“My employer just recently (March 2nd) declared bankruptcy so I lost my job. I live at my parents’ house but I pay for my own food and transportation (gas, etc). I worked at the company for almost 2 years and now it will be hard to find a job with the economy the way it is.”
Changing coping strategies. Finally, most students (95%) reported changing their money management with many echoing the sentiments expressed by the student who commented,
“I need try to eat at my sorority everyday to save money on food. I also am not able to see movies or [participate in] recreational activities very much. I need to make sure I always have around $40 for the bills each month with a monthly allowance of $100 from my parents.”
Other findings in this area include:• Gender difference: Women felt more impact on their financial situation and the way they manage money• Ethnic difference: African American students felt the most impact overall, more impact on their financial situation as compared to White or
Asian/Pacific Islander students, and more impact on their families and their money management as compared to Asian/Pacific Islander students• GPA differences: Students with GPAs below 3.0 reported a greater impact on their financial situation and their money management compared
to students with GPAs of 3.5 and higher• SES differences: Lower-SES students reported more impact compared to higher-SES students in all areas; middle-SES students reported feeling
more impact on their financial situations compared to higher-SES students
African American students felt the most financial impact compared to other ethnicities. Not surprisingly, students from higher-SES families tended to feel less impact.
Table 3. Perceived Financial impact
GEnDER EThniCiTY GPA SES
Average Male Female White African Asian/ hispanic native < 3.0 3.0 – 3.5 > 3.5 Lower Middle higher American Pacific American islanderOn Family 3.39 3.28 3.45 3.37 3.87a 3.13b 3.61 3.34 3.58 3.36 3.31 3.54a 3.33 3.21b
On Personal Finances 3.19 3.03b 3.27a 3.13b 3.90a 3.08b 3.36 3.29 3.48a 3.23 2.99b 3.33a 3.25a 2.87b
On Personal Money Management 3.35 3.16b 3.45a 3.31 3.96a 3.15b 3.54 3.43 3.52a 3.39 3.23b 3.46a 3.34 3.19b
Notes: Letters (a, b) indicate statistically significant group differences.
Figure 8. Magnitude of Financial impact
Own financial situation
Family financialsituation
A great deal
A lot
Moderate
A little bit
Not at all
18.4%
30.1%
26.2%
20.5%
4.8%
22.5%
30.0%
22.6%
17.1%
7.8%
20.0%
28.0%
28.3%
18.6%
5.1%
Ways you manage money

12
Following the economic crisis, students carried dramatically higher monthly credit card balances.
Credit card balances tripled for African American students and doubled for Hispanic students.
$0
$1,000
$2,000
$3,000
$4,000
$5,000
$6,000
+86%+45%
+162%+147%
Overall$1,041 $1,932
White$835 $1,212
Asian/Pacific Islander
$907 $2,380Native American$920 $2,732
African American$1,613 $5,140
Hispanic$2,078 $4,205
+219%
+102%
Figure 10. Changes in Educational Loans
Figure 9. Changes in Credit Card Debt
Wave 1 Impact Sample
$0
$50
$100
$150
$200
$250
$300
$350
Overall$95 $152
White$72 $118
+60%+64%
+219%
African American$81 $258
Native American$127 $197
Hispanic$147 $302
Asian/Pacific Islander
$161 $123
+105%
-24%+55%
Wave 1 Impact Sample
Objective impact of the Economic Crisis | See Figures 9-10To compare perceived economic impact with more objective indicators, we asked students to report their outstanding debt in three categories—credit cards, educational loans and other loans (e.g., car loans)—and found that some debt balances had increased significantly compared to Wave 1 data:
Credit card balance not paid in full each month:Wave 1: $95Impact Sample: $152Up 60%
These increases varied across groups:• Credit card debt tripled for African American students and doubled for Hispanic students• The gap between Hispanic and Asian/Pacific Islander students widened with respect to credit
card balances• Students reporting higher economic impact also reported greater increases in credit card debt
Although increasing educational loan balances are to be expected as students’ progress through college, increases for minority students were much higher compared to White students.
• Educational loan balances tripled for African American and Native American students and doubled for Hispanic and Asian/Pacific Islander students
• The gap between Hispanic and White students widened with respect to educational loans
Outstanding educational loans:Wave 1: $1,041Impact Sample: $1,932Up 86%

13
Consistent with the Wave 1 benchmark APLUS study, we looked at students’ financial knowledge and understanding of money management from three perspectives:
• Objective—a rating of student’s factual knowledge measured through true/false questions (adapted from Hilgert, Hogarth & Beverly, 2003)
• Comparative—a relative measure of how students see themselves compared to friends • Subjective—a self-assessed measure of financial self-confidence or how students rate their own knowledge
Changes in Financial Knowledge | See Figures 11-12
Objective financial knowledge. The Impact Sample students’ financial knowledge, as measured objectively, increased slightly:
Measured as percent correct of 15 true/false questionsWave 1: 66.2%Impact Sample: 66.7%Up 0.9%
Comparative knowledge. Though we found no significant differences between groups, students’ beliefs about their own financial knowledge as compared to their friends dropped overall:
Measured on a 5-point scale where 3 = “Moderate Understanding”Wave 1: 3.53Impact Sample: 3.11Down 12%
As in Wave 1, we assessed financial knowledge both objectively and subjectively.
Although their objective financial knowledge was actually slightly higher than earlier measurements, the financial self-confidence of the Impact Sample declined in the one-year period since the Wave 1 survey.
How Crisis Affects What We Know (and What We Think We Know)
Note: To visually compare the three perspectives, we converted the objective measure results to a five-point scale before computing the overall average for the Impact Sample students.
Figure 11. Changes in Financial Knowledge
3.53
3.313.34
2.56
high 4
Moderate 3
Low 2
Fina
ncia
l Kno
wled
ge
3.14 3.11
Wave 1 impact Sample
Comparative Objective Subjective

14
Subjective financial knowledge. As students progress through college, we would expect them to gain more confidence in their financial management skills, as they gain experience with daily financial transactions. However, the Impact Sample students rated themselves less knowledgeable about finances than before, despite a small but significant increase in objective financial knowledge:
Measured on a 5-point scale where 2 = “Low understanding” and 3 = “Moderate Understanding”Wave 1: 3.14Impact Sample: 2.56Down 19%
Looking more closely at the changes in subjective financial knowledge:• Women scored lower than men in both waves and had a sharper decline, dropping 22% compared to
11% for men: from 3.07 to 2.39 for women vs. 3.28 to 2.91 for men• Native American and Hispanic students reported the sharpest declines, dropping 25% (3.19 to 2.58) and 23% (3.16 to 2.43) respectively• African American students had the lowest self-assessments in both waves, dropping 19% from 2.71 to 2.19
Figure 12. Decline in Subjective Financial Knowledge by Gender
3.28
3.07 2.91
2.39
high 4
Moderate 3
Low 2
Wave 1 impact Sample
Subj
ectiv
e Fi
nanc
ial K
nowl
edge
Male Female

15
From comments by the Impact Sample students, it’s clear that the recession generated much uncertainty about their future financial prospects and the relative value of their current education. As one student commented,
“I am currently not making as much money as I might if the economy was better. It is also getting me down about my future career because I am becoming less hopeful of landing a good job once I graduate because job opportunities are decreasing. This puts thoughts into my mind about how college might be a waste of time unless I go on to graduate school.”
Given this uncertainty, we expected to see changes in students’ financial behaviors as they adapted to the changing economy.
Changes in Financial Behaviors | See Figure 13To assess those changes, we asked the Impact Sample the same questions about budgeting, paying, borrowing and saving as asked in the Wave 1 benchmark study, behaviors we define as:
• Budgeting—money management behaviors, including creating a budget, staying within it and tracking expenses
• Paying—cash management behaviors, including paying bills on time and paying credit card bills in full each month
• Borrowing—risky behaviors such as maxing out credit cards and tapping credit lines or payday loan services
• Saving—putting money aside for emergencies, future needs and longer-term goals
Students indicated a 1 through 5 response, with 5s indicating more responsible budgeting, paying, and saving behaviors and more risky borrowing behaviors.
In narrative responses, students expressed declining hopes for rewarding jobs after college.
We looked at changes in four categories of financial behaviors: budgeting, paying, borrowing and saving.
How Crisis Affects Financial Behavior
Never 1
2
Sometimes 3
4
Very Often 5
3.65 3.55 3.6 3.54
1.32 1.38
2.89 2.7
Budgeting* Paying Borrowing Saving*
Figure 13. Changes in Financial Behaviors
Wave 1 Impact Sample
Note: * indicates statistically significant differences between Wave 1 and the Impact Sample

16
Changes in Budgeting & Saving | See Figures 14-15Generally, responsible behaviors declined and risky behaviors increased. The Impact Sample reported using fewer budgeting and saving behaviors as compared to the Wave 1 benchmark data.
Extent of budgeting behaviors:Wave 1: 3.66Impact Sample: 3.56Down 3%
Extent of saving behaviors:Wave 1: 2.89Impact Sample: 2.70Down 6%
However, the Impact Sample students who felt the most economic impact increased their budgeting behaviors by 3%, though their saving behaviors dropped 11%.
Students most impacted by the recession had less money available – they budgeted more carefully and had little left over to save.
Figure 14. Financial impact and Budgeting
3.74
Often 4
3.5
Sometimes 3
Wave 1 impact Sample
3.5
3.37
3.67
3.643.63 Low impact
high impact Moderate impact

17
Changes in Borrowing | See Figure 16Although we found no overall difference with respect to borrowing behaviors in the Impact Sample versus the Wave 1 benchmark data, we did find an interesting gender difference.
Wave 1: Women reported less risky borrowing behaviors than menImpact Sample: Women’s risky borrowing increased 2% while men’s dropped 1%Men and women swapped relative positions in risky borrowing behaviors
Since women reported being more dependent on their parents, it is possible that they are borrowing to cover expenses previously covered by their parents. As one women explained:
“I used to rely on my parents, but they are hurting financially and will be less able to help.”
Our data suggest that the economic crisis affected men and women differently, with women adopting more risky borrowing behaviors as men scale back.
Figure 15. Financial impact and Saving
Sometimes 3
2.9
2.8
Wave 1 impact Sample
2.47
2.7
2.6
2.5
Rarely 2.4
2.86
2.93
2.81
2.92
2.8 Moderate impact Low impact
high impact
Figure 16. Change in Borrowing Behavior by Gender
Rarely 1.5
1.4
never 1.2
Wave 1 impact Sample
1.36
1.40
1.3
Borr
owin
g (h
ighe
r sco
re =
mor
e ris
ky b
ehav
ior)
1.39
1.29
Male Female

18
Changes in Financial Coping Strategies | See Figure 17We know that severe economic downturn has spurred Americans to spend less (Harris Interactive, 2009), but we wondered if college students—who must meet rising education costs with fixed financial resources—were managing day-to-day financial demands differently. One student explained,
“Being asked to pay for more things regarding school, coupled with receiving less hours at work due to the economy, has put a strain on my financial status and I have cut back on a lot of personal things just so I am able to pay for school and rent.”
To examine this question systematically, we again asked students about financial coping strategies first explored in the Wave 1 benchmark survey. These methods for handling money problems included four typical, economizing strategies—cutting back on entertainment and food spending, for example—and five more extreme coping strategies, such as using one credit card to pay another.
Typical financial coping strategies. There were significant increases in the use of typical financial coping strategies ranging from roughly 10 to 30%, involving cutting back on entertainment, communication expenses, etc.
Higher-SES Impact Sample students reported a greater increase in typical coping strategies, narrowing the gap between their behavior and that of middle-SES students.
The gap widened between students reporting a high economic impact and those reporting only a low or moderate impact with respect to typical coping strategies.
Finally, in addition to an overall increase in typical coping strategies between Wave 1 and Wave 1.5 data, group differences in these strategies were consistent with earlier findings:• Women reported using more typical coping strategies than men in both waves• African American and Asian/Pacific Islander students engaged in typical coping strategies more
often than White or Hispanic students
Risky coping strategies. We found that high-risk coping had increased overall, with an alarming increase in four of the five high-risk coping strategies.
Impact Sample High-Risk Money Management• Dropped classes: Up 169% • Took a leave of absence: Up 106% • Postponed healthcare: Up 78% • Used one credit card to pay off another: Up 26%
Students from higher-SES families and those who felt less economic impact – increased typical coping strategies more.
Our most significant findings showed dramatic increases in high-risk financial coping, with sharp rises in the number of students cutting back on education and healthcare.
Figure 17. Use of Financial Coping Strategies
0
20
40
60
80
100
Cut back onentertainment
expenses
Cut back on on food
expenses
Cut back on personal
care expenses
Cut back on communication
expenses
Postponed medical/
dental care
Reducednumber of
classes
Used highinterestloans
Used onecredit card to pay off another
Took leave of absence from school
+12%+25% +20%
+31%
+78%+169%
-30% +26% +106%
Perc
enta
ge o
f Stu
dent
s
Typical Risky

19
We asked students about their current well-being from multiple perspectives: • Overall— psychological well-being• Specific domains of life—finances, academics, physical health, relationships with parents and friends• Academic aspirations
We scored all perspectives on a 5-point scale with higher values indicating more positive outcomes.
It’s not surprising that Impact Sample students’ well-being dropped across all domains as compared to Wave 1 benchmark data pre-dating the global recession. One student explained,
“I am only taking 12 credits instead of my planned 15 in order to work 18 hours a week. I also have applied to be an RA and am still considering working at my old job because it pays more, despite the possibility of having less time to do homework. It has also added stress through the worry of my parents having less money than they would like to have in order to live comfortably.”
While many of the narratives echo these themes, we found that the economic crisis affected groups of students in significantly different ways.
Overall Well-Being | See Figure 18Overall, the psychological well-being of students in the Impact Sample dropped:
Wave 1: 3.71Impact Sample: 3.51Down 5%
We also found a substantial decline among African American students, who reported the lowest level of psychological well-being and the largest decrease within the Impact Sample:Wave 1: 3.64Impact Sample: 2.95Down 19%
Other findings in this area include:• The gap in psychological well-being widened between African American and Asian/Pacific Islander students• Students who reported the most economic impact had scores 6% below the Wave 1 average, compared to scores 3 and 4% higher than the average
for students reporting low and moderate economic impact respectively
Compared to Wave 1data, students reportedless well-being acrossthe board.
Greater financial impact correlated with greater declines in psychological well-being, with African American students indicating the sharpest drops.
How Crisis Affects Well-Being
Figure 18. Declines in Well-Being
4.09
Very Good 4.5
Good 3.5
Fair 2.5
Wave 1 impact Sample
3.52
2.96
4.164.14
3.923.713.573.55
3.23
Relationship with friends Relationship with parents Psychological Physical Academics Finances

20
Well-Being across Five Domains | See Figures 18-19
Financial well-being. Financial well-being, or reported satisfaction with one’s finances, dropped significantly for the Impact Sample:
Wave 1: 3.23Impact Sample: 2.96Down 8%
Other findings in this area:• Students in the higher-SES category showed sharpest declines: -13% versus -6% and -8% for lower-
and middle-SES groups respectively• However, students who reported the lowest financial well-being in Wave 1 also reported the most
economic impact in the current study and showed the sharpest declines in financial well-being, dropping 17%, compared to a 4% drop for students who felt low or moderate economic impact
Physical well-being. Overall the Impact Sample reported a decline in physical health:
Wave 1: 3.57Impact Sample: 3.47Down 3%
Other findings in this area:• At a rating of 3.0, African American students reported the steepest declines(14%). Although the
health level for African American students was second highest in Wave 1, they reported the poorest health among ethnic groups in the Impact Sample
• Students who reported the greatest economic impact reported a 6% decline in physical well-being, double the average decline for the entire Impact Sample; the health of these students was in the middle in Wave 1 and lowest in Wave 1.5
Financial well-being showed the largest drop, followed by well-being in relationships, and finally physical and academic well-being (tied).
Reported health of African American students dropped most, with Wave 1.5 ratings the lowest of all ethnic groups.
Figure 19. Change in Financial Well-Being By SES
Very good 4.0
3.5
2.5
Wave 1 impact Sample
3.23
3.73
Good 3.0
Fina
ncia
l Wel
l-Bei
ng
3.25
3.00
2.962.77
higher SES Middle SES Lower SES

21
As in the earlier data set, African American students reported the least satisfaction in relationships, and women reported less satisfaction than men.
Relational well-being. Satisfaction in relations with friends declined between Wave 1 data and the Impact Sample:
Wave 1: 4.14Impact Sample: 4.09Down 6%
Other findings in this area:• Women reported lower satisfaction with friendships in both data sets, though men’s satisfaction
dropped more: from 4.27 to 4.01 for men vs. 4.09 to 3.87 for women • African American students reported the steepest declines (-18%) and lowest levels of friendship
satisfaction (3.30), as well as the least satisfying relations with parents in both waves of data • Native American students also reported declines in friendship satisfaction (-3%) but reported greater
satisfaction in relations with their parents (+8%)
Academic well-being. Academic satisfaction declined between Wave 1 data and the Impact Sample:
Wave 1: 3.55Impact Sample: 3.45Down 3%
Other findings in this area:• Men reported less satisfaction in both waves and showed a sharper decline: from 3.47 to 3.27 for men
vs. 3.59 to 3.54 for women—a 6% decline for men vs. 2% for women• Native American students reported the least academic satisfaction and the sharpest decline of 11%,
from 3.22 in Wave 1 to 2.86 in Wave 1.5• Lower-SES students reported the least academic satisfaction in Wave 1 and Wave 1.5 data, with
scores of 3.46 and 3.32 respectively
Academic AspirationsAlthough the Impact Sample didn’t show significant declines in academic aspirations, their open-ended responses revealed concerns about threats to their academic careers. One student explained,
“I have to work a lot to pay my bills, which takes away time from school and studying. I also feel like because I work so much I won’t be able to pursue a degree of more difficulty that I might be capable of achieving just because I won’t have the time to put the effort it takes to succeed. I want to do good in school, but it’s hard while working part-time at jobs that don’t pay much. And now because of the economy, employers are looking for people with more open availability rather than a student who can only work a few hours each day.”
Since budget cuts and tuition increases would not take effect until the beginning of the next academic year for these students, it’s possible that the recession’s full impact on their academic aspirations will emerge in future waves of the APLUS study.

22
At a time when young people should be developing a sense of trust in the larger community, they’re confronting skepticism in the wake of economic uncertainty and concern for the well-being of the country and their own financial futures.
To consider how economic uncertainty affects development of trust, we asked students to rate their level of confidence in four public institutions:
• Public education and higher education• The executive branch of the federal government• The U.S. Supreme Court• The U.S. Congress
and three private institutions:
• The press• Banks and other financial institutions• Major companies and organizations
We adapted a measure used in national surveys (Smith, 2005), asking the Impact Sample students to rate each on a scale of 1 to 3:
1 = A great deal of confidence2 = Only some confidence3 = Hardly any confidence at all
Overall, most students expressed only some confidence across the board, with most students reporting almost no confidence in the press.
Other findings in this area:• Students reporting high economic impact reported less trust in corporations than students reporting
only moderate impact• Native American students reported less trust in financial institutions compared to White and Asian/
Pacific Islander students•Middle-SES students reported more trust in educational institutions compared to lower-SES students
Adapting measures from previous national surveys we were able to examine how economic crisis has affected Impact Sample students’ trust in public- and private-sector organizations.
For the most part, students reported no more than “some confidence” for most institutions, though responses varied somewhat by demographics and economic impact.
Matters of Trust

23
Trust in Financial institutions | See Figure 20Because young adults are just beginning to use the services of financial institutions, we were particularly interested in their trust in these institutions in the midst of current economic conditions. Their ratings reveal a standard bell curve, outside the 7% who indicated “Don’t Know”:
• 19.1% reported a “great deal of confidence”• 54.4% reported “only some confidence”• 19.4% reported “hardly any confidence at all”
For financial institutions, trust followed a bell curve in the Impact Sample, with about 20% at either extreme.
Figure 20. Reported Confidence and Trust at Wave 1.5
7.7%22.7%
57.8%11.8%
7.0%19.4%
54.5%19.1%
7.9%44.9%
41.8%5.3%
8.6%26.3%
54.9%10.2%
10.3%17.4%
52.7%19.7%
9.6%20.1%
48.4%22.0%
4.0%13.4%
53.8%28.8%
Major companies
Banks/Financial inst
Press
Congress
Supreme Court
Executive Branch
Education
0 = Don’t know 3 = Hardly any 2 = Only some 1 = A great deal

24
Relative Trust among institutions | See Figure 21Overall, the Impact Sample leans more towards distrust than trust though they showed no clear pattern by category.
• Leaning towards a great deal of confidence: education• A solid “some confidence” rating: the Supreme Court, the executive branch of the federal
government, financial institutions and major companies • Leaning towards no confidence: Congress and the press
historical Ratings of Trust | See Table 4Since the Wave 1 survey didn’t include questions about trust, we compared the Impact Sample responses to data collected from national samples of 18-24 year olds in 1985 and in 1997.
Sadly, the comparison shows that when it comes to feeling “a great deal of confidence,” the trust of young adults in the Impact Sample is significantly lower in every category:
Note that while all three samples generally show a downward trend in “great deal of confidence” trust in education had held steady in the national surveys conducted in 1985 and 1997, with 39% of both samples expressing a great deal of trust, compared to only 20% of the Impact Sample.
The lower percentages among the APLUS students may be understood in the context of how they have been directly affected. As one student explained.
“If I had known that my [National Merit] scholarship would not support me here all four years, I may not have chosen to come to UA, and I have considerably less confidence in the value of merit scholarships.”
The rating for banks and financial institutions had actually increased between 1985 and 1997 — from 33% to 39%, compared to only 19% in the APLUS Impact Sample. It is possible that this lower rating is a response to the financial credit crisis that triggered the economic recession.
Students reported the most confidence in education and the least confidence in the press.
Impact Sample students expressed dramatically less trust in the press compared to young adults surveyed in 1985 and 1997. While they maintained some trust in education and the executive branch, even these institutions inspired less confidence compared to previous generations.
Figure 21. Relative Trust Levels in institutions
Press Congress MajorCompanies
Banks/Financial
institutions
SupremeCourt
ExecutiveBranch
Educationhardly
Any Trust
AGreatDealOf
Trust

25
Factors Related to Trust in Financial institutionsTo better understand how both subjective and objective factors may be related to trust in financial institutions, we took a closer look at factors linked to varying levels of confidence.
We found that students with the least trust in financial institutions also had:• Lower subjective knowledge (less financial self-confidence)• Lower financial and psychological well-being• Greater debt• Lower-SES family backgrounds
Conversely, students expressing greater trust in financial institutions had:• Higher financial well-being• Higher subjective knowledge (more financial self-confidence)
Note that these correlations include both subjective and objective measures. As we better understand the relationship between these two categories of data and how, together, these factors shape the development of pathways to success, we hope to also gain a better understanding of how young adults develop—or lose—trust in external institutions.
Not surprisingly, students with more debt and lower SES tend to trust financial institutions less.
DiFFEREnCE BETWEEn APLUS 2009 % 1997 % 1985 % iMPACT SAMPLE AnD 1985 nATiOnAL SAMPLE
Supreme Court -63% 20 38 54
Education -26% 29 39 39
Banks/Financial inst -42% 19 39 33
Major companies -60% 12 29 30
Executive Branch -24% 22 14 29
Press -81% 5 16 27
Congress -62% 10 12 26
Note: Figures represent percentage of young adults indicating a “great deal of confidence” in each institution. Comparison data taken from General Social Service Surveys (GSSs) of the National Opinion Research Center, University of Chicago (Davis, Smith & Marsden, 2001).
Table 4. Comparison of impact Sample Students’ Confidence in institutions To 1985 and 1997 national Samples of 18-24 year olds

26
Financial strain is a significant source of stress for college students (Staats, Cossmar, & Kaffenberger, 2007). Over time, it raises the risks of depression, anxiety and other mental health problems (Eisenberg et al. 2007) and lowers the likelihood of graduating from college (Kim, 2007).
As we mentioned in the Executive Summary of this report, beyond merely documenting the effects of economic crisis, we look to Wave 1.5 data to help us better understand how young adults change their financial behaviors to adapt to financial strain and changing economic conditions.
Conceptualizing the Response to Financial StrainBy examining how young adults cope with the financial strain of global recession, we believe we can gain deeper insights into how they do (and can) develop effective financial behaviors.
To that end, we developed a conceptual model of Financial Coping during Economic Crisis.
Within this model, we conceptualize financial strain as changes in financial resources, including both objective changes (e.g. greater debt) and subjective beliefs about changes (e.g. a self-assessed drop in resources) that may indicate students’ concerns about their futures and financial prospects.
Measures from the Impact Sample survey help us understand how students change in the face of new financial challenges.
Our model for financial coping addresses how students adapt to objective changes and their changing beliefs about their circumstances.
Students coped with financial challenges by a variety of means, ranging from budgeting to high-risk behaviors like postponing healthcare.
Students with higher debt reported more reactive behaviors as opposed to preventive coping.
Coping with Financial Change
The Coping SpectrumWe propose that students change their financial behaviors to reduce financial strain by way of three types of coping behaviors.
• Proactive coping behaviors—actions to accumulate excess resources for future use, e.g. saving money• Preventive coping behaviors—actions to alleviate future financial demands, e.g. budgeting or paying off credit card balances each month• Reactive coping behaviors—actions in response to immediate financial demands: the previously mentioned typical strategies, such as cutting
back on expenses, as well as high-risk behaviors, like postponing healthcare or using one credit card to pay off another
Students using proactive & reactive coping. Applying the model, we found that students’ assessments of their financial well-being proved the best indicator of financial functioning in the face of economic uncertainty:
• Students with higher financial well-being had lower debt and their coping strategies were more often proactive and less often reactive• Conversely, students with lower financial well-being also had higher debt and relied more on reactive coping and less on proactive coping
Students using preventive coping. While financial well-being didn’t correlate with preventive coping strategies, we found that this set of behaviors (budgeting, tracking expenses, etc.) was the most common response among students who felt most impacted by the economic crisis.
Together, the Financial Coping model and Wave 1.5 data reveal co-occurring patterns of positive financial functioning. That is, accounting for gender, race and SES differences, greater financial well-being is associated with more proactive coping behaviors and less reactive coping behaviors.
Statistical results for the full Structured Equation Model are available upon request.
Figure 22. Student Financial Coping During Economic Crisis
ChAnGES in FinAnCiAL STRAin
SubjectiveFinancial Well-BeingPerception of impact
ObjectiveDebt
ChAnGES in FinAnCiAL BEhAViORS
Proactive Coping
Preventive Coping
Reactive Coping

27
In 2008, there were 19 bank failures, 1.2 million people lost their jobs and more than 130 million new people fell into poverty as families struggled to pay for food and fuel (Cermak, 2008).
Given the magnitude of the financial crisis, it’s not surprising that in the one-year period since the Wave 1 survey, the overall well-being of the Impact Sample students declined and debts increased. In addition to feeling the immediate effects of the recession on current expenses, savings, and employment – students were bombarded with local news of university budget cuts, tuition increases, and limited job opportunities amidst news reports of a global recession – the worst since the Great Depression.
Within that profound overall effect, our Wave 1.5 findings reveal a number of factors linked to who felt the impact and how they responded.
• More women, more African Americans, students with lower academic achievement and those from lower- and middle-SES families reported a greater immediate impact of the recession
• Financial self-confidence (subjective knowledge), especially of women and minority students, declined substantially
• The impact was more evident in financial areas for women while men were more affected academically
• Financial strain, the combination of declining financial self-confidence and increasing debt, was most evident among minority students, particularly African American and Hispanic students
• An expected increase in the use of cost-cutting strategies was overshadowed by a dramatic increase in extreme financial coping strategies (dropped classes, leaves of absence and postponed health care), with the potential for future financial hardship
Consistent with news reports of American adults and the effects of the recession, our findings show that college students were also deeply affected. And like these reports, students hit the hardest were the ones with the fewest resources. In other words, while the economic crisis altered the finances of most students, those with the most resources were better able to handle the impact.
College students were not immune to the effects of this Great Recession.
Their financial character - their values, attitudes and behaviors – may be forever altered by their current experiences.
Financial education is needed to restore the financial self-confidence of young adults so they can make sound financial decisions.
Collaborative efforts to build trust in financial institutions among young adults may help to promote economic recovery.
Summary and Implications
The real story then is not the impact of the recession, but rather, the implications of the recession on students’ pathways to adulthood.
Financial character. For young adults undergoing a transition from financial dependence to self-sufficiency, the current economic climate may play an important role in re-shaping their financial values, attitudes, and behaviors. As with the generation growing up in the Great Depression, the economic impact of the Great Recession may be interpreted as a period of scarcity and lack or an era of opportunity and change (Elder, 1974). Young adults with fewer resources may adapt to this changing social and economic landscape by adopting a more conservative financial character, limiting their future financial prospects whereas those with more resources may adopt a more expansive financial character, looking for opportunities to invest and grow their financial resources.
At this time, the need for financial education may be greater than ever before, particularly for young people lacking the financial self-confidence and knowledge to make sound financial decisions for their future well-being.
Preparing for future careers. Career uncertainty and limited job opportunities may prompt many students to re-consider their course of study. Instead of pursuing challenging academic programs, or those that appeal to their interests, students may be choosing courses that help them “get a job” rather than “build a career.” Availability of resources may contribute to the course of study students pursue, for example, high-achieving students with fewer resources may forego their interests in medicine or law, or resign their passion for music to a hobby, in favor of a career that requires less of a financial investment -- or promises a more immediate financial payout. Whether such choices lead to self-satisfaction and well-being or greater disparities in later life success is a question that will emerge in future studies.
However, the need for students to balance the cost and benefits of a college education may be an important topic for college administrators and curriculum planners to consider. Further, high school counselors may need to become involved much earlier in helping students make decisions about higher education alternative and sources to fund their education.

28
Waning trust. Trust in individuals, organizations and societies builds social capital, a fundamentalrequirement for social integration, democracy and national wealth (Putnam, 2000). Yet young adults today are coming of age amidst grim economic realities that may further undermine their trust and confidence in both public and private institutions. For young people who are just beginning to establish independent relationships with banks and financial institutions, a growing lack of confidence following this severe recession may inadvertently slow the economic recovery. A sense that financial institutions are not trustworthy may cause young people to avoid investing in their services, to their detriment and that of the overall economy.
To protect these young adults from the misinformation and/or misunderstandings that can result from aggressive marketing campaigns, consumer financial advocates or consumer protection agencies have an opportunity to work collaboratively with banks and financial institutions to educate young people about sound practices and consumer safety regarding banking and financial products.
Positive adaptation. Using the Impact Sample data, we’ve taken a step toward understanding how changes in a young adult’s resources relate to changes in financial behaviors.
We found that students who felt greater financial well-being also showed more positive financial coping, and students who felt most impacted by the financial crisis took steps to manage their resources by budgeting their money and tracking their expenses more carefully.
Stronger money management skills may promote greater feelings of financial well-being, which in turn may lead to more positive coping strategies to help students become self-sufficient more quickly.
Yet, when students are unable to meet their current financial demands, they may need help in deciding on the most prudent course of action to avoid a short-term quick fix at the expense of a longer term financial problem. Programs designed to promote financial literacy among young adults might address this by including alternative solutions for coping with common financial problems young adults encounter.
Preparing young people for life success. We prepare young people to face the academic challenges of college and we caution them to avoid risky health behaviors, yet our findings suggest that a lack of preparedness for the financial responsibilities of college may undermine their future success.
Our Wave 1 findings proposed a pathway to students’ success and well-being that highlighted the supporting roles of parents, education and work experiences (Shim, Barber, Card, Xiao, & Serido, 2009; Shim, Serido, & Xiao, 2009). With this Wave 1.5 economic impact study we add another dimension, that is, the important role that adults can play in increasing young adults’ ability to effectively cope with life’s expected, unexpected – and sometimes severe – financial challenges.
It is crucial that parents, educators, and administrators explore new ways to promote an open and ongoing dialogue with students to help them avoid costly mistakes as they navigate the financial challenges of the next few years.
The economic crisis presents significant opportunities for studying trust among young adults and how their current lack of trust in public and private entities may shape financial recovery.
As a whole, information from our Wave 1.5 study suggests a positive feedback loop linking financial well-being, better money management and more positive coping behaviors.

29
Wave 1 data collected from students in their first year of college—prior to the recession—provided a firm foundation for understanding how family background, parental roles and financial socialization while growing up and in the first year at college can shape financial literacy and various dimensions of well-being. The Impact Sample follow-up data—Wave 1.5, collected during these students’ sophomore year—brings us closer to understanding how financial behaviors are formed and how they change.
For young people transitioning from financial dependence to financial self-sufficiency, the current economic climate may play an important role in shaping their financial behaviors as adults. They grew up in an era of easy credit and lenient attitudes towards consumer debt; they are entering adulthood when the opposites are true—in a time of economic hardship and uncertainty.
Studies of families during the Great Depression (Elder, 1974) provide evidence that economic upheaval has long-lasting effects on the courses of people’s lives. Young people today seem to know this inherently. Indeed, in a recent national survey, 80% of undergraduates indicated the need for more education on financial management topics (Sallie Mae, 2009).
In the wake of recession, government relief programs, regulation and legislation regarding consumer credit (Credit CARD Act, 2009) and changes in college loan financing (e.g., Income Based Repayment, 2009) will continue to shape college students’ financial attitudes and behaviors.
We believe that the Arizona Pathways for Life Success in University Students (APLUS) project is uniquely positioned to illuminate the combined impact of developmental and changing economic factors on the formation of financial character (i.e., financial values, knowledge, skills, goals and behaviors) and life success among emerging adults.
We plan to launch the next wave of data collection in the fall of 2010, as the APLUS students prepare for their careers after college. In that study, we will examine the role of typical changes during college (changes in family relationships, romantic relationships and job and career plans) as well as the longer-term effects of the recession on young adults’ financial attitudes and behaviors.
With Wave 1 data establishing baseline information and Wave 1.5 data showing change in the face of unanticipated crisis, our next set of surveys will examine financial character, as students complete their undergraduate educations and prepare for adult careers.
What’s Next for APLUS?

30
Cermak, C. (2008). World Bank: Recession likely worst since Great Depression (Roundup). Retrieved July 2, 2009 from http://www.monstersandcritics.com/news/business/news/article_1447427.php#ixzz0Kgk10Y2t&C
Davis, J. A., Smith, T. W., & Marsden, P. V. (2001). General Social Survey, 1972-2000: Cumulative Codebook. Chicago: National Opinion Research Center. Retrieved 10/1/09 from http://www.norc.org/nr/rdonlyres/21c53aac-1267-43b6-a915-a38857dc9d63/1304/introduction.pdf
Eisenberg, D., Gollust, S.E., Golberstein, E., & Hefner, J.L. (2007). Prevalence and correlates of depression, anxiety, and suicidality among university students. American Journal of Orthopsychiatry, 77, 534-542.
Elder, G. H. (1974). Children of the Great Depression: Social change in life experience. Chicago: University of Chicago Press.
Harris Interactive, (June 26, 2009). Consumers are saving more and spending and borrowing less. Retrieved 11/14/2009 from http://www.harrisinteractive.com/harris_poll/harrispollbydate2009.asp
Hilgert, M. A., Hogarth, J. M., & Beverly, S. G. (2003). Household Financial Management: The Connection Between Knowledge and Behavior. Federal Reserve Bulletin July: 309-322.
Hobfoll, S. E. (1989). Conservation of resources: A new attempt at conceptualizing stress. American Psychologist, 44, 513-524.
Kansas, D. (2009). The Wall Street Journal guide to the end of Wall Street as we know it. New York: Harper Collins Publisher.
Kim, D. (2007). The effect of loans on students’ degree attainment: Differences by student and institutional characteristics. Harvard Educational Review, 77, 64-100.
Lazarus, R. S. & Folkman, S. (1984). Stress, Appraisal, and Coping. New York: Springer Publishing.
Putnam, R. D., (2000). Bowling Alone: The Collapse and Revival of American Community. New York: Simon & Schuster.
Sallie Mae. (2009). How undergraduate students use credit cards: Sallie Mae’s national study of usage rate and trends 2009. Retrieved May 12, 2009, from http://www.salliemae.com/NR/rdonlyres/0BD600F1-9377-46EA-AB1F-6061FC763246/10744/SLMCreditCardUsageStudy41309FINAL2.pdf
Schoeni, R. F., & Ross, K. E. (2005). Material assistance from families during the transition to adulthood. In R. A. Settersten, Jr., F. F. Furstenberg, Jr., and R. G. Rumbaut (Eds.), On the frontier of adulthood: Theory, research, and public policy (pp. 396-416). Chicago: University of Chicago Press.
Shim, S., Barber, B., Card, N., Xiao, J. & Serido, J. (2009). Financial socialization of young adults: the role of family, work, and education. Journal of Youth and Adolescence. DOI 10.1007/s10964-009-9432-x
Shim, S., Serido, J. & Xiao, J. (2009). Arizona pathways to life success for university students: Cultivating positive financial attitudes and behaviors for healthy adulthood. Available at http://aplus.arizona.edu/finalReport.pdf.
Smith, T. W. (2005). Generation gaps and values from the 1970s to the 1990s. In R. A. Settersten, Jr., F. F. Furstenberg, Jr., and R. G. Rumbaut (Eds.), On the frontier of adulthood: Theory, research, and public policy (pp. 396-416). Chicago: University of Chicago Press.
Staats, S., Cosmar, D., & Kaffenberger, J. (2007). Sources of happiness and stress for college students: A replication and comparison over 20 years. Psychological Reports, 101, 685-696.
References
NEFE® is an independent, nonprofit foundation committed to educating Americans on a broad range of financial topics and empowering them to make positive and sound decisions to reach their financial goals. For more than 30 years, NEFE® has been providing funding, logistical support, and personal finance expertise to develop a variety of materials and programs, including the award winning High School Financial Planning Program® (HSFPP), the CashCourse® college program, and the consumer-oriented Smart About Money public awareness campaign. NEFE® funds research and awards research-based development grants that advance innovative thinking and contribute to our understanding of financial behavior. NEFE® also serves segments of the American public in need of specialized financial information through partnerships with numerous organizations, including the National Urban League, the YWCA, the American Red Cross, and Habitat for Humanity®.To learn more about NEFE®, visit www.nefe.org or call 303.741.6333.

Often I hear the lament from business and government leaders that if they’d only started studying an issue earlier, they would be ready with a solution when it was needed. Fortunately, the APLUS project was launched just in time to provide a benchmark for young consumer financial attitudes prior to the global financial meltdown and “Great Recession” of 2008 – 2009. Now we are all adjusting to “The New Normal.” Consumers, corporations, nonprofits and governments are learning how to do more with less. That lesson is evident in the responses from our APLUS Impact Sample. It remains to be seen whether this marks a temporary shift in outlook or indicates a fundamental “sea-change” in thinking for young adults in this country. Either way, this project will continue to give us the data and insights needed to build more effective programs to prepare our students – and through them their families, friends and neighbors – for whatever challenges face them in this emerging era.
Michael StatenProfessor and Director, TCAI
TAKE ChARGE AMERiCA inSTiTUTE FOR COnSUMER FinAnCiAL EDUCATiOn AnD RESEARCh ADViSORY BOARD
Lynne BordenExtension Specialist The University of Arizona
Thomas E. BrownSenior Vice PresidentJP Morgan Chase
Robert FisherChief Legal CounselTake Charge America
Michael HallChairman of the BoardTake Charge America
Cathleen JohnsonDepartment of EconomicsEller College of ManagementUniversity of Arizona
Kellie Terhune NeeleyVice President, MarketingHughes Federal Credit Union
James P. PfeifferVice President, Business BankingWells Fargo Bank
Jane L. RojasVice President - InvestmentsUBS Financial Services, Inc.
Soyeon ShimDirector, John & Doris NortonSchool Family & Consumer Sciences The University of Arizona
Michael StatenDirectorTake Charge America Institutefor Consumer Financial Education and ResearchThe University of Arizona
Michael SullivanDirector of EducationTake Charge America
Email: [email protected] site: cals.arizona.edu/fcs/tcai
John & Doris Norton School Family and Consumer Sciences The Unversity of ArizonaTucson, ArizonaPhone: 520.621.7147
Take Charge America Institute for Consumer Financial Education and ResearchThe Unversity of ArizonaPhone: 520.626.4209Web site: tcainstitute.org
ThE APLUS TEAM
Soyeon Shim, Principal Investigator (PI)
Joyce Serido, Co-PI/Project Manager
Co-Investigators: Michael Staten, TCAIBonnie L. Barber, Murdoch UniversityNoel Card, University of ArizonaJing Xiao, Rhode Island University
Graduate Research Associates: Chuanyi Tang, Chiraag Mittal, Sunyoung Ahn
UA CAMPUS PARTnERS
Advising Resource CenterMulticultural Center for Student Affairs Arizona AthleticsCredit-Wise CatsDean of StudentsDepartment of ChemistryDepartment of EngineeringDepartment of EnglishEnrollment ManagementFSHD AmbassadorsCollege of Fine Arts School of MusicOffice of Student Computing Resources (OSCR)Office of Student Financial Aid
Office of the PresidentOffice of the ProvostOffice of the VP for Student AffairsRCSC AmbassadorsRegistrar’s OfficeResidence LifeUA BookstoresUA Parents & Family AssociationUniversity Teaching CenterUniversity Information Technology ServicesUniversity Professional Advisors Council