“TRAINING OF TRAINERS” (TOT) · Extraction is a fundamental process in pesticide residue...
51
“TRAINING OF TRAINERS” (TOT) Program on Analysis of pesticide residues May 2017 at ICAR-NRCG, Pune TRAINING MANUAL Organized by Food Safety and Standards Authority of India (FSSAI), New Delhi (Ministry of Health & Family Welfare, Government of India) In collaboration with ICAR-National Research Center for Grapes (NRCG), Pune (Under Indian Council of Agricultural Research, New Delhi) The Global Food Safety Partnership of the World Bank University of Maryland, JIFSAN
Transcript of “TRAINING OF TRAINERS” (TOT) · Extraction is a fundamental process in pesticide residue...

“TRAINING OF TRAINERS” (TOT)
Program on
Analysis of pesticide residues
May 2017 at ICAR-NRCG, Pune
TRAINING MANUAL
Organized by
Food Safety and Standards Authority of India (FSSAI), New Delhi (Ministry of Health & Family Welfare, Government of India)
In collaboration with
ICAR-National Research Center for Grapes (NRCG), Pune (Under Indian Council of Agricultural Research, New Delhi)
The Global Food Safety Partnership of the World Bank
University of Maryland, JIFSAN
1
Food Safety and Standards Authority of India
Ministry of Health and Family Welfare, Government of India
Training Manual
For
Analysis of Pesticide Residues

2
CONTENTS
S No. TITLE Page No.
1
Sampling, transport, traceability and storage of laboratory
samples
1
2 Preparation of standards 2
3 Sample preparation: AOAC- QuEChERS method 7
4
Multi residue analysis by ethyl acetate method by LC-MS/
MS and GC-MS/MS
13
5 Analysis of plant growth regulators by LC-MS/MS 15
6 Analysis of Dithiocarbamate residues in sample by GC-MS 17
7 Chromatographic separation and detection 23
8 Method validation 43
9 References 48

3
1. Sampling, transport, traceability and
Storage of laboratory samples
Sampling: Sampling is a very important activity. A sample has to be representative of the
population, whether it is carried out at pre- or post-harvest level. Sampling should be done in
a randomized way in accordance with international guidelines, e.g.European Commission
Directive 2002/63/EC or similar.
Transport:Samples must be transported under appropriate conditions to the laboratory in
clean containers and robust packaging. Polythene or polypropylene bags, ventilated if
appropriate, are acceptable for most samples but low-permeability bags (e.g. nylon film)
should be used for samples to be analyzed for residues of fumigants. Samples of
commodities pre-packed for retail sale should not be removed from their packaging before
transport. Very fragile or perishable products (e.g. ripe raspberries) may have to be frozen to
avoid spoilage and then transported in “dry ice” or similar, to avoid thawing in transit.
Samples that are frozen at the time of collection must be transported without thawing.
Samples that may be damaged by chilling (e.g. bananas) must be protected from both high
and low temperatures.Rapid transport to the laboratory, preferably within one day, is
essential for samples of most fresh products. The condition of samples delivered to the
laboratory should approximate to that which would be acceptable to a discerning purchaser;
otherwise samples should be considered as unfit foranalysis.
Traceability: Samples must be identified clearly and indelibly, in a way to ensure
traceability. The use of marker pens containing organic solvents should be avoided for
labelling bags containing samples to be analyzed for fumigant residues, especially if an
electron capture detector is to be used.On receipt, each laboratory sample must be allocated
a unique code by the laboratory.
Storage:Laboratory samples which are not analyzed immediately should be stored under
conditions that minimize decay. Fresh products should be stored in the refrigerator, but
typically no longer than 5 days. Dried products may be stored at room temperature, but if
storage time is expected to exceed two weeks, they should be sub-sampled and stored in the
freezer.
Reference: Sante/11945/2015

4
2. Preparation of standards
Preparation of Stock Solution
Choose a clean container (glass/polypropylene bottle as required) of appropriate
capacity for reference standard stock solution preparation.
Ensure the precision balance is clean and calibrated.
Put the container on precision balance weighing pan.
Adjust the zero reading on the balance.
Take the reference standard and note down description (e.g. Purity and expiry date).
Weigh the standard (approx 10mg) in standard preparation bottle.
Weigh suitable solvent (e.g. approx 5 to 10 g ethyl acetate, acetonitrile, methanolor
water) to dissolve the weighed amount of standard.
Specific gravity for ethyl acetate (0.89 g/mL), acetonitrile (0.786 g/mL), methanol
(0.79 g/mL) and water (1.0 g/mL)
Sonicate/ vortex the standard for proper solubility.
Calculate the concentration of the standard in µg/mL.
Weight of standard (corrected, a) = [weight of standard x Purity]/ 100
Volume of solvent (mL, b) = [weight of solvent / Specific gravity]
Calculated conc.(μg/mL) = [Corrected weight of standard (a)/ Volume of solvent
(b)]*1000
Label the container with lab code, name of chemical, concentration in µg/mL, name
of solvent, date of preparation, date of expiry.
Enter the data in the respective logbook and registers.

5
Flow chart of preparation - standard solutions
(w/w method –based on weight of solvent)
Ensure that the balance is calibrated
Put empty vial with cap on balance
Tare the balance
Transfer about 10 mg of standard powder/liquid in vial
Note down weight of standard
Tare the balance
Transfer about 10 mL of solvent in vial
Note down weight of solvent
Calculate concentration of stock solution
Calculate the concentration of the standard in µg/mL
Weight of standard (corrected, a) = [weight of standard x Purity]/ 100
Volume of solvent (mL, b) = [weight of solvent / Specific gravity]
Calculated conc.(µg/mL) = [Corrected weight of standard (a) / Volume of solvent (b)]*1000

6
Flow chart of preparation - standard solutions
(w/v method – based on volume of solvent)
Ensure that the balance is calibrated
Put empty 10 mL volumetric flask on balance
Tare the balance
Transfer about10 mg of standard powder/liquid in volumetric flask
Note down weight of standard
Transfer solvent and make up the volume up to mark (10 mL)
Calculate concentration of stock solution
Calculate the concentration of the standard in µg/mL.
Weight of standard (corrected, a) = [weight of standard x Purity]/ 100
Solvent (mL, b) = Volume of solvent in mL
Calculated conc.(µg/mL) = [Corrected weight of standard (a) / Volume of solvent (b)]*1000

7
Preparation of Pesticide CRM stock, intermediate and calibration standards
Lab work notes

8

9
3. Pesticide residue analysis in fruits & vegetables using
QuEChERS method
Introduction
The analysis of pesticide residues in food samples, particularly in fruits and
vegetables is increasingly becoming an important activity. Pesticides residue laboratories
are required to undertake analyses of an ever increasing number of samples. The analyses
typically involve use of multi-residue methods (both GC-MS and LC-MS) to test for over
500 pesticides residues. Extraction is a fundamental process in pesticide residue analysis.
Extraction may be defined as the procedure or step adopted to isolate the pesticides from
the samples. This is accomplished by employing suitable solvents which remain in contact
with the sample for a specific duration. Extraction and clean-up methods vary greatly with
the matrix used. It largely depends on the moisture, fat and sugar contents of the
commodity. The quantity of sample to be taken for extraction will depend upon the
expected levels of residues as well as the sensitivity of technique or tool employed in the
subsequent step of identification and quantification.
An ideal extraction procedure should be capable of extracting 100% of pesticides
only, leaving behind other materials. However, this is not the actual practice. An extraction
method should satisfy the following requirements:
Rapid
Small solventusage
Good recovery of the target pesticides: 70 to120%.
Robust: RSD (relative standard deviation) of the recoveries less than 20% atLOQ.
Due to its ease of use and proven robustness, the QuEChERS extraction has
become the method of choice for pesticide multi-residue analyses in wide range of
matrices.
This course is designed to introduce the concept of method development, and we
will start by showing the existing method of pesticide sample preparation. Fortified and
blank samples will be utilized to validate the analytical method. Liquid and gas
chromatography, coupled with triple quadrupole (TQD) mass spectrometry are used to
analyzepesticides.
The three steps in Pesticide residue analysis method
Sample extraction
Separation of multi
residues
Detection and
quantification
QuEChERS
GC and LC
MS/MS

10
Sample preparation: QuEChERS(AOAC Official Method)
The QuEChERSis a simple sample preparation technique suitable for multi-
pesticide residue analysis in a diverse variety of food and agricultural products. This
method is a streamlined approach that makes it easier and less expensive for analytical
chemists to examine pesticide residues in food. Once the samples are extracted into the
solvent they will be further processed for separation by Gas chromatography (GC) or
Liquid chromatography (LC). The GC and LC separation methods are then linked with
mass spectrometric detection.
The procedure steps are summarized below:
Objective: Participants will review and practice sample preparation using theQuEChERS
method
Materials requirement for sample preparation
1. Fruits and vegetablesare the target food products for thissession.
2. Equipment:
Blender or Homogenizer (Highvolume)
Homogenizer (Highvolume)
Centrifuge: Rotor head with holding capacity: 2 mL, 10 -15 mL and 50 mL
centrifugetubes
GC-MS/MS andLC-MS/MS
Electronic Balance: Capacities 3-5 kg & 0.01 to 100g
Vortexshaker
Solvent evaporator
Muffle furnace: Capable of 500°Coperation
3. Apparatus and Reagents:
Acetonitrile (MeCN): Quality of sufficient purity.
Anhydrous sodium acetate (NaOAc): Powder form (NaOAc.3H2O) may be
substituted, but 0.17 g per g of sample must be used rather than 0.1 g
anhydrous NaOAc per gof sample.
Anhydrous magnesium sulfate (MgSO4): Powder form; purity > 98%; heated to
500°C for > 5 hr to remove phthalates and residualwater.

11
Acetic acid (HOAc): Glacial, quality of sufficientpurity.
TPP: Triphenylphosphine
Primary Secondary Amine: 40 µm particle size.
Methanol (MeOH): Quality of sufficient purity forLC-MS/MS
Water: Quality of sufficient purity forLC-MS/MS
Formic acid: Quality of sufficientpurity
Ammonium acetate: Quality of sufficientpurity
Ethyl acetate: Quality of sufficientpurity
N-Hexane: Quality of sufficientpurity
DistilledWater
Measuring Cylinder (50mL)
Vials (2 & 4 mL)
Micropipette (1mL)
Centrifuge bottle (15 & 50mL)
Sample preparation and processing prior to analysis
On receipt, each laboratory sample must be allocated a unique reference code by
the laboratory. Sample preparation, sample processing and sub-sampling to obtain
analyticalportion should take place before visible deterioration occurs.
Grape and tomato samples were prepared following the “AOAC Official Method
2007.01 Pesticide Residues in Foods by Acetonitrile Extraction and Partitioning with
Magnesium Sulfate”. The fresh samples were stored at room temperature. Once
homogenized, the samples were stored in the refrigerator.
Sample preparation
The sample is homogenized or blended to obtain a uniformmatrix.
Sample Extraction
Sample Extraction is defined as the procedure or step adopted to isolate the
pesticides from the samples. This is accomplished by employing suitable solvents which
remain in contact with the sample for a specific duration.

12
Procedure
1. Comminute >1 Kg sample withvertical cutter. Homogenize about 200 g
subsample with probe blender.
2. Weigh 15 g of crushed sample in 50 mL Centrifuge tube.
3. Add 15 mL of 1% acetic acid in acetonitrile, vortex for 30 sec. and add 6 g
anhydrous MgSO4, 1.5 g of anhydrous sodium acetate and 75 µL I. S. solution
4. Shake vigorously for 1 min.
Centrifuge at 4000 rpm for 1 min.
5. Transfer 1mL supernatant into 15 mL centrifuge tube containing 50mg PSA &
150mg anhydrous MgSO4and shake for 30 s.
6. Centrifuge 4000 rpm for 1 min.
7. Transfer 0.6 mL extract to GC vial and add TPP.
Transfer 0.25mL extract and 0.75 mL water to LC vail
8. Analysis by GC-MS/MS and LC-MS/MS
Laboratory Session: Sample Extraction for LC and GC
Extraction procedure for LC
Label ten 50 mL disposable screwcap centrifuge tubesas
1. Blank1
2. Blank2
3. Blank3
4. Blank4
5. Spike1
6. Spike2
7. Spike3
8. Test1
9. Test2 10. Test3
Weigh 15 g of sample in each tube and note down theweight
Spike the sample in the spike labelled tubes with knownconcentration.
Start the extraction process as given in the extraction procedureearlier.
After the filtration of the sample prepare Matrix match standard by using blank
extracted matrix
Now the samples in the vials are analyzed byLC-MS/MS and GC-MS/MS

13
Sample Preparation, Extraction & Clean -up
Crush/Grind Weigh 15 g in 50 mL centrifuge tube
Centrifuge Homogenize Vortex (30 sec)
Vortex (30 sec)
Sample filtration 4000 rpm for 1 min
15 mL (1%)
Acetic acid in
acetonitrile
+ 6 g MgSO4
+ 1.5 g
SodiumAcetate
Transfer 0.6 mL
supernatant in
GC vial.
Transfer 0.25
mL extract and
0.75 mL water
to LC vail
1-8 mL
supernatant
+ 50 mg
PSA + 150
mg MgSO4
14
Discussion
1. What is the role of different salts – MgSO4, Na2SO4
2. What is the role of acetic acid?
3. What is the role of PSA and C18?
4. Why do we use diethylene glycol?
5. Why do we exchange acetonitrile with other solvents?
6. Why do we filter the samples?
7. Why do we use refrigerated centrifuge?
8. Can we use methanol, acetone or ethyl acetate as extraction solvents?
Lab work notes
15
4. Multiresidue analysis by ethyl acetate method by LC-
MS/MS and GC-MS/MS
Procedure:
Weigh 10g homogenized sample in a 50 mL polypropylene centrifuge tube.
Add 10 mL ethyl acetate and vortex for 1 min, add 10 g anhydrous sodium sulfate and
homogenize it at 15000 rpm for 2 minute.
Centrifuge at 5000 rpm for 5 minutes.
For LC-MS/MS amenable compounds, take 5 mL supernatant into 15 mL
polypropylene.
Centrifuge tubes containing 25 mg primary secondary amine (PSA), shake for 30
secondsand centrifuge it for 5 minutes at 10000 rpm.
Draw 2 mL supernatant in the test tube containing 200 μL of 10% diethylene glycol
(DEG) solution.
Evaporate it to dryness under nitrogen at 35°C.
Reconstitute with 1 mL methanol and 1 mL 0.1 % acetic acid in water (do not add
thesesolvents initially, first add methanol and then 0.1% acetic acid in water).
Sonicate for 1 min and vortex for 30 seconds.
Centrifuge the extract at 10000 rpm for 5 min and filter through 0.2 μm Nylon 6, 6
membrane filter into a LC vial.
Inject 5 - 20 μL from the extract into the LC-MS/MS.
For GC-MS/MS, take 1 mL supernatant in the Eppendorf tube containing 25 mg PSA
and shake vigorously for 30 s.
Centrifuge at 10000 rpm for 5 min. Take supernatant extract in GC auto sampler vial.
Inject the cleaned extract into the GC-MS/MS.

16
Flow chartof ethyl acetate method extraction
10 g Sample + 10 mL Ethyl acetate
Vortex for 1 min.
Add 10 g anhyd.Na2SO4
Vortex for 2 min.
Centrifuge at 5000 rpm for 5 min.
LC-MS/MS GC-MS/MS
5 mL supernatant + 25 mg PSA
Vortex for 30 sec.
Centrifuge for 5 min. at 10,000 rpm
Draw 2 mL supernatant + 200 µL DEG
Evaporate it to dryness under N2 at 35ºC
Reconstitute with 1 mLMeOH and
1 mL 0.1% Acetic acid in water
Sonicate for 1 min. and vortex for 30 sec.
Centrifuge extract 5 min. at 10,000 rpm
1 mL supernatant + 25 mg PSA
Vortex for 30 sec.
Centrifuge for 5 min. at 10,000
rpm
Take supernatant in auto sampler
vial

17
Filter extract 0.2 μm Nylon 66 into LC vial
5. Analysis of plant growth regulators by LC-MS/MS
Procedure:
Weigh 10 g homogenized sample in 50 mL polypropylene centrifuge tube.
Add an internal standard (CCC d4), mix thoroughly by vortexing for 1 min.
Add 20 mL methanol (1% formic acid).
Homogenize/vortex the sample for 2 min and centrifuge at 5000 rpm for 5 minute.
Draw 0.5 mL supernatant and dilute with 0.5 mL water (for C18 column analysis).
Draw 0.5 mL supernatant and dilute with 0.5 mL methanol (for HILIC analysis).
Inject into LC-MS/MS.
Analytes for C18: 6-Benzyl adenine, Forchlorfenuron, Homobrassinolide, Gibberellic
acid, (GA-3), 2,4-D, 4-Chlorophenoxy acetic acid, and 1-Naphthylacetic acid.
Analytes for HILIC: Chlormequat, Mepiquat, Ethephon, Uracil and Fosetyl Al.

18
Flow chartof plant growth regulators extraction method
10 g Sample + 20 mL (with 1 % Formic acid) MeOH and add internal
standard (CCC d4)
Vortex for 1 min.
Centrifuge at 5000 rpm for 5 min.
0.5 mL extract + 0.5 mL H2O [For C18 Column]
0.5 mL extract + 0.5 mLMeOH [For HILICcolumn]
Vortex vial and inject to LC-MS/MS

19
6. Analysis of Dithiocarbamate residues in sample by GC-MS
Procedure for sample preparation
a) Weigh 25 g sample in 250mL in screw capped bottle.
b) Add 75 mL of reaction mixture. [Weigh 30 g of Tin (II) Chloride and dissolve it in the
1000 mL of HCl]
c) Add 25 mL of isooctane and immediately close the bottle with screw cap.
d) Place the bottle in water bath at 80 (±5) °C.
e) Mix the content of the bottle by inversion after approximately 20 min.
f) Repeat step ‘e’ after every 20 min.
g) After the total reaction time of 60 min, remove the bottle from the water bath and mix the
content of bottle.
h) Transfer the bottle in cool ice water bath to cool down the temperature quickly.
i) After cooling the reaction mixture to about 10-20°C, transfer 1.8 mL of isooctane layer in 2
mL micro centrifuge tube.
j) Centrifuge at 5000 rpm for 5 min at 10°C.
k) Transfer the supernatant (1 mL) to an auto sampler vial.
l) Inject in to GC-MS.

20
Flow chartfor analysis of dithiocarbamate residues in
sample
GC-MS parameters
Sr. No. Parameter
Specification
Sr. No. Parameter
Specification
Sr. No. Parameter Specification
1. Column DB-5 ms (5 % diphenyl, 95 % dimethyl
polysiloxane, 30 m x 0.25
mm ID, 0.1 μm film thickness) capillary column
OR
Rxi-624 30 m x 0.32 mm id, 1.8 μ film
thickness having 6%
cyanopropyl / 94% dimethyl polysiloxane
2. Oven
Temperature
40 °C for 5 min hold time and then ramp it from
40 °C to 200 °C with
5 min hold time.
3. Injector
program
Programmable Temperature Vaporization with
Large Volume
Injection volume:10 μl
Injection Program: start temperature 40°C with
0.1 min hold, then
250 ml of screw cap bottle
Weigh 25 g of grape berry or homogenized sample
Add 75 ml SnCl2 reaction mixture
Add 25
ml of
isooctane
Keep on water
bath at 80°C
for 1 hour
Intermediate
shaking after
every 20 min.
Transfer
the bottle in
ice cold
water.
Two
separate
layers
Take
upper
layer 1-2
ml
Micro-
centrifuge
at 10 °C
Transfer
to GC
vial
Keep bottle at
room
temperature or
in normal
temperature of
water

21
ramp @10°C/s up to 80°C with 0.3 min hold,
then ramp up to 110°C at
rate of 10°C/s. For cleaning purpose of liner, the
temperature was
increased up to 290°C for 4 min.
OR
Splitless 2 μL at 200 °C
4. Detector EI - 70 eV
Ion source temperature: 200°C
Scan Range: In full scan mode, scanning range
= 50-100 amu. Inselected ion monitoring mode,
select the m/z 76 and m/z 78.
Preparation of Reaction Mixture:
a) Weigh 30 g of Tin (II) Chloride and dissolve it in the 1000 mL ofHCl.
b) Take a plastic can having capacity 2500-3000 mL.
c) Add 1000 mL water in it.
d) Then gradually add 1000 mL of Tin (II) chloride and dissolve inHCl with stirring. Finally
a clear solution isobtained.
Standards
Carbon disulphide standard solution:
a) Take 20 mL bottle with screw cap (air tight) and tare the weight.
b) Fill the bottle with isooctane, put cap on the bottle and note down the weight in grams.
This isthe weight of the solvent in gram. By using following formula convert weight in gram
to mL.
Weight of the solvent in mL (A)
= (weight of the solvent in gram/ density of the solvent in g/mL)
c) Change the unit on the balance gram to milligram (mg)
d) Add pure CS2 about 20 μL, cap the bottle and note down the weight in mg. This is the
weightof the CS2 standard.
Actual weight of the Standard (B) = (Weight of standard × Purity of standard)/100
Actual concentration of CS2 stock std solution (C1) = (Actual weight of the Std (B)/mL of the

22
solvent (A))
e) Prepare the working standard of 100 μg/ mL (C2) of 5 mL (V2) in isooctane by using
following formula
C1 V1 = C2V2
V1= C2V2/C1
Standard solution of Thiram:
a) Weigh accurately 10 mg of Thiram in closed standard bottle.
b) Note down the weight of the Thiram in the mg unit.
c) Check the purity of Thiram standard
d) Calculate the actual weight of the Thiram by using following formula
e) Actual weight of the Thiram Standard (x) = (Weight of standard × Purity of standard)/100
f) Cap the bottle with screw cap and tare it.
g) Change the unit of balance mg to g.
h) Add ethyl acetate in bottle and closed the bottle with screw cap.
i) Note down the weight of the ethyl acetate which has been taken in to the glass bottle in the
gram.
j) Convert gram weight of the ethyl acetate in the mL weight. By using following formula.
Weight of the Solvent in mL (y) =
(Weight of the solvent in gram/ density of the ethyl acetate solvent in (g/mL))
k) Calculate the actual concentration of the standard (mother stock) by using following
formula.
Actual concentration of thiram mother (stock) solution (C1) =
(Actual weight of the Std (x)/ mL of the solvent (y))
l) Use isooctane for further dilution. Prepare working standard (C2) 1μg/mL of 5 mL (V2)
in isooctane by using following formula.
C1 V1 = C2V2

23
m) Store mother stock solution at - 20°C.
n) Store the working standard solution at 0°C.
o) Perform further dilutions in isooctane.
p) 1 g of Thiram liberates 0.6333 g of CS2
External calibration solvent standards for GC-MS
a) Freshly prepare fivepoints calibration standards at 0.01, 0.02, 0.05, 0.1 and 0.2μg/mL
freshly every day from the working standard of 1μg/mL of CS2.
b) Prepare matrix matched standard at the same concentrations by extracting fresh sample
usingthe procedure and spiking the extract with appropriate volumesof working standards
(1μg/mL)
Recovery sample preparation
For recovery experiment, spike calculated amount of thiram in the aqueous layer,
Immediatelyclose the bottle and follow the same extraction procedure.
For recovery level 1 ppm, spike quantity from working standard= 0.4 mL
For recovery level 0.5 ppm spike quantity from working standard =0.2 mL

24
Lab work notes

25
7. Chromatographic separation and detection
Chromatography is a separation technique. The components of a mixture are
distributed between two phases, the stationary phase and the mobile phase. The mobile phase
moves through or over the surface of the fixed (stationary) phase. The components of the
mixture have different affinities for each phase, hence some are retained longer on the
stationary phase than others causing separation.High performance liquid chromatorgraphy
(HPLC) and Gas chromattography (GC) are two widely used separation techniques in
analytical world.
Principle: Analogous to extraction except that in chromatography one phase is held in place
while the other phase is moving. The phase which is moving is called mobile phase and the
one that is stationary phase is called stationary phase
Fig 1: Schematic representation of principle of chromatography

26
Parts of GC
Carrier gas
Injector
Column
Oven
Detector
Computer
Other important accessories - Gas purification system, Septa, Ferrules, Liners,
Syringes etc.
Fig 2: Schematic representation of Gas chromatography
Lab work notes
27
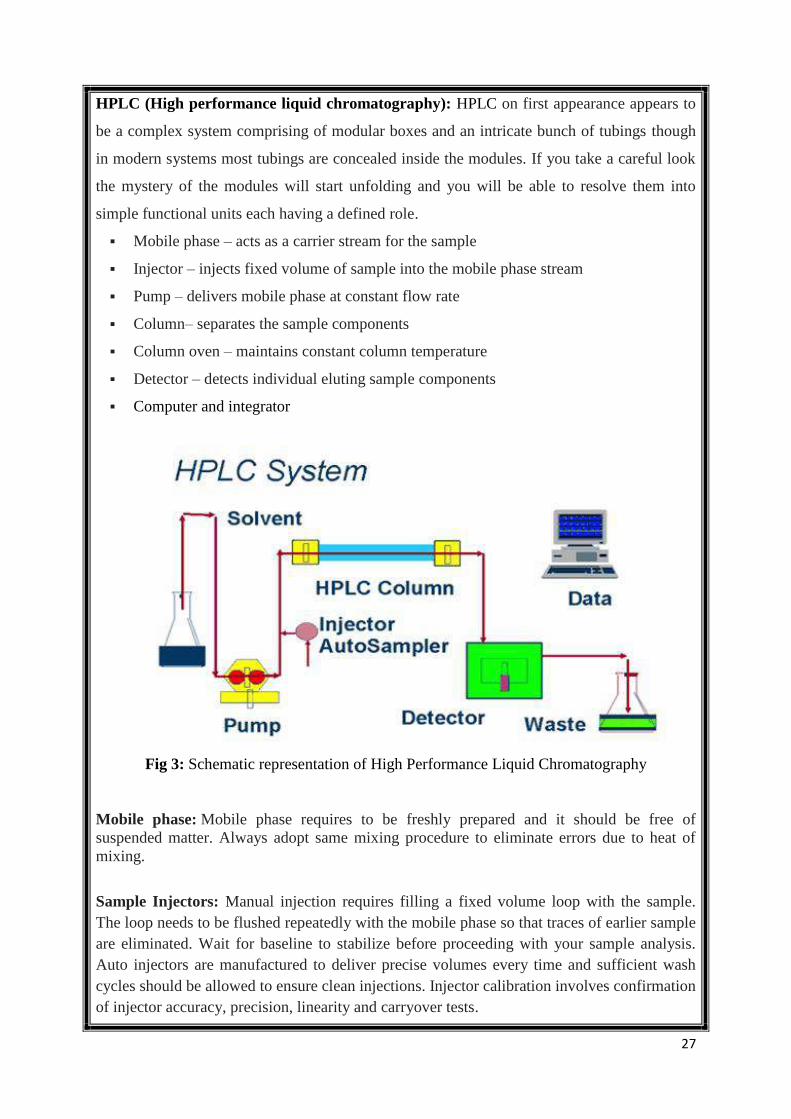
HPLC (High performance liquid chromatography): HPLC on first appearance appears to
be a complex system comprising of modular boxes and an intricate bunch of tubings though
in modern systems most tubings are concealed inside the modules. If you take a careful look
the mystery of the modules will start unfolding and you will be able to resolve them into
simple functional units each having a defined role.
Mobile phase – acts as a carrier stream for the sample
Injector – injects fixed volume of sample into the mobile phase stream
Pump – delivers mobile phase at constant flow rate
Column– separates the sample components
Column oven – maintains constant column temperature
Detector – detects individual eluting sample components
Computer and integrator
Fig 3: Schematic representation of High Performance Liquid Chromatography
Mobile phase: Mobile phase requires to be freshly prepared and it should be free of
suspended matter. Always adopt same mixing procedure to eliminate errors due to heat of
mixing.
Sample Injectors: Manual injection requires filling a fixed volume loop with the sample.
The loop needs to be flushed repeatedly with the mobile phase so that traces of earlier sample
are eliminated. Wait for baseline to stabilize before proceeding with your sample analysis.
Auto injectors are manufactured to deliver precise volumes every time and sufficient wash
cycles should be allowed to ensure clean injections. Injector calibration involves confirmation
of injector accuracy, precision, linearity and carryover tests.

28
Pumps: A pump comprises of several parts that are precisely designed to deliver consistent
flow rates. However, due to regular usage wear and tear results in flow rate deviations.
Timely replacement of worn out parts improves the precision of flow delivery but still regular
calibration is necessary. Pump calibration involves establishing flow rate accuracy and
gradient composition accuracy.
Columns: A column is the most critical component of the HPLC system. If a column is not
well maintained it loses its separation efficiency. Using working standards you should
establish that the system suitability parameters remain within the prescribed limits. In case of
deviations outside the specified limits the column should be replaced
Column oven: The retention times of the compounds are dependent on mobile phase
viscosity which in turn is temperature dependent. The column should be maintained within
specified temperature limits to get consistency of retention times. It becomes necessary to
calibrate the temperature reproducibility of the column oven from time to time.
Detector: A detector gives absorbance signals that are dependent on wavelength of
absorption by the sample components. The absorption signals can drop due to lamp life,
residual impurities or other contributing factors. Timely replacement of lamps and regular
cleaning of detector eliminates such problems but detector requires regular calibration using
specified reference compounds which are injected into the mobile phase stream. The two
main parameters requiring calibration are linearity of response and wavelength accuracy.
Mass Spectrometry: A mass spectrometer determines the mass of a molecule by measuring
the mass-to-charge ratio (m/z) of its ion. Ions are generated by inducing either the loss or gain
of a charge from a neutral species. Once formed, ions are electrostatically directed into a
mass analyzer where they are separated according to m/z and finally detected. The result of
molecular ionization, ion separation, and ion detection is a spectrum that can provide
molecular mass and even structural information. An analogy can be drawn between a mass
spectrometer and a prism, as shown in Figure. In the prism, light is separated into its
component wavelengths which are then detected with an optical receptor, such as
visualization. Similarly, in a mass spectrometer the generated ions are separated in the mass
analyzer, digitized and detected by an ion detector
Mass spectrometry is the art of measuring atoms and molecules to determine their molecular
weight. Such mass or weight information is sometimes sufficient, frequently necessary, and
always useful in determining the identity of a species. To practice this art one puts charge on
the molecules of interest, i.e., the analyte, then measures how the trajectories of the resulting
ions respond in vacuum to various combinations of electric and magnetic fields.

29
Fig 4: The mass analysis process as compared to the dispersion of light by a prism.
Mass Spectrometer as detector for LC and GC
A mass spectrum is a graph of ion intensity as a function of mass-to-charge ratio
Components of Mass spectrometer are
1. Producing ions from the sample
2. Separating ions of differing masses
3. Detecting the number of ions of each mass produced
4. Collecting the data and generating the mass spectrum
Fig 5:Schematic representation of Mass Spectrometer
30
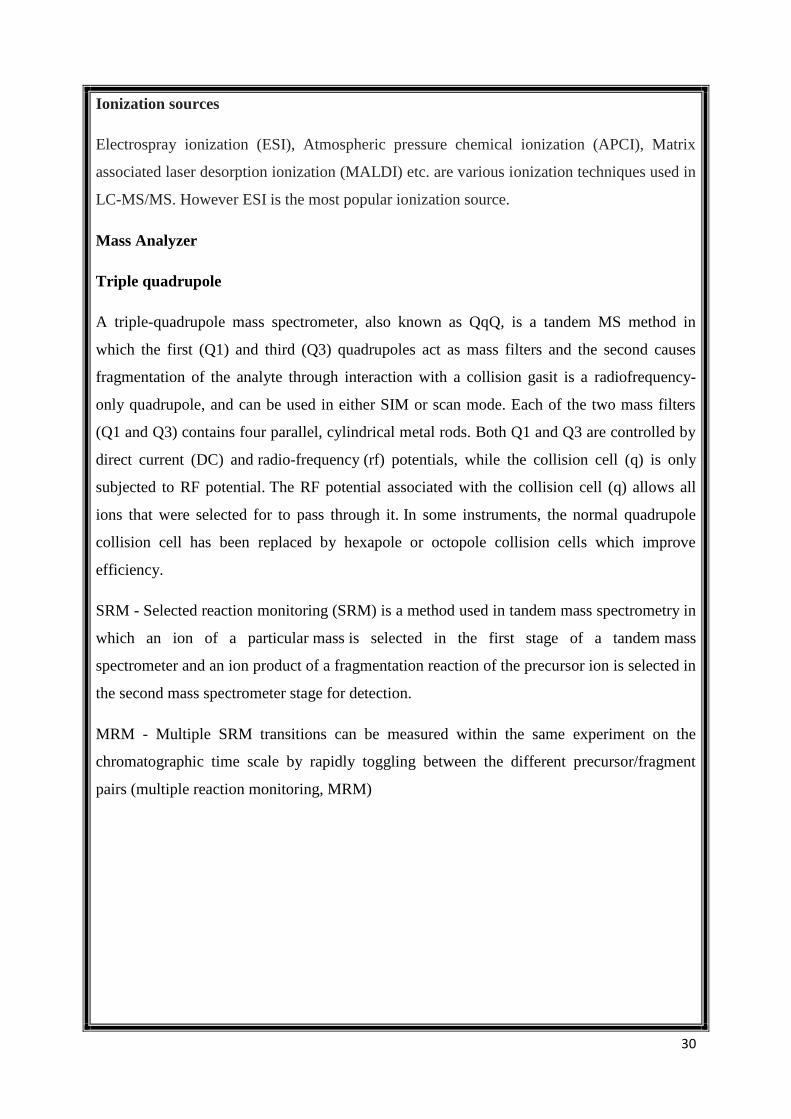
Ionization sources
Electrospray ionization (ESI), Atmospheric pressure chemical ionization (APCI), Matrix
associated laser desorption ionization (MALDI) etc. are various ionization techniques used in
LC-MS/MS. However ESI is the most popular ionization source.
Mass Analyzer
Triple quadrupole
A triple-quadrupole mass spectrometer, also known as QqQ, is a tandem MS method in
which the first (Q1) and third (Q3) quadrupoles act as mass filters and the second causes
fragmentation of the analyte through interaction with a collision gasit is a radiofrequency-
only quadrupole, and can be used in either SIM or scan mode. Each of the two mass filters
(Q1 and Q3) contains four parallel, cylindrical metal rods. Both Q1 and Q3 are controlled by
direct current (DC) and radio-frequency (rf) potentials, while the collision cell (q) is only
subjected to RF potential. The RF potential associated with the collision cell (q) allows all
ions that were selected for to pass through it. In some instruments, the normal quadrupole
collision cell has been replaced by hexapole or octopole collision cells which improve
efficiency.
SRM - Selected reaction monitoring (SRM) is a method used in tandem mass spectrometry in
which an ion of a particular mass is selected in the first stage of a tandem mass
spectrometer and an ion product of a fragmentation reaction of the precursor ion is selected in
the second mass spectrometer stage for detection.
MRM - Multiple SRM transitions can be measured within the same experiment on the
chromatographic time scale by rapidly toggling between the different precursor/fragment
pairs (multiple reaction monitoring, MRM)

31
Fig 6:Schematic representation of Triple QuadrupoleMass Spectrometer with Scan and SIM
modes
Fig 7:Schematic representation of Triple QuadrupoleMass Spectrometer with SRM mode

32
Lab work notes

33
Operation of Liquid chromatography with Mass Spectrometer (LC-MS/MS):
Some Basics:
Four basic components are, for the most part, standard in all mass spectrometers: a sample
inlet, an ionization source, a mass analyzer and an ion detector. Some instruments combine
the sample inlet and the ionization source, while others combine the mass analyzer and the
detector. However, all sample molecules undergo the same processes regardless of instrument
configuration. Sample molecules are introduced into the instrument through a sample inlet.
Once inside the instrument, the sample molecules are converted to ions in the ionization
source, before being electrostatically propelled into the mass analyzer. Ions are then separated
according to their m/z within the mass analyzer. The detector converts the ion energy into
electrical signals, which are then transmitted to a computer.
Sample Introduction Techniques
Sample introduction was an early challenge in mass spectrometry. In order to perform mass
analysis on a sample, which is initially at atmospheric pressure (760 torr), it must be
introduced into the instrument in such a way that the vacuum inside the instrument remains
relatively unchanged (~10-6 torr). The most common methods of sample introduction are
direct insertion with a probe or injection into the ionization source such as ESI-MS.
Fig 8:Mass spectrometer

34
Fig 9:Components of a mass spectrometer
Ionization
Ionization method refers to the mechanism of ionization while the ionization source is the
mechanical device that allows ionization to occur. The different ionization methods,
summarized here, work by either ionizing a neutral molecule through electron ejection,
electron capture, protonation, cationization, or deprotonation, or by transferring a charged
molecule from a condensed phase to the gas phase.
Electrospray Ionization
A more physical explanation of ESI is that the needle voltage produces an electrical gradient
on the fluid which separates the charges at the surface. This forces the liquid to emerge from
the needle as a Taylor cone. The tip of the Taylor cone protrudes as a filament until the
liquid reaches the Rayleigh limit where the surface tension and electrostatic repulsion are
equal and the highly charged droplets leave the filament. The droplets that break away from
the filament are attracted to the entrance of the mass spectrometer due to the high opposite
voltage at the mass analyzer's entrance. As the droplet moves towards the analyzers, the
Coulombic repulsion on the surface exceeds the surface tension, the droplet explodes into
smaller droplets ultimately releasing ions.

35
Fig 10:Electro spray ionization (ESI) mass spectrometry
Mass Analysis
Analytical instruments in general have variations in their capabilities as a result of their
individual design and intended purpose. This is also true for mass spectrometers. While all
mass spectrometers rely on a mass analyzer, not all analyzers operate in the same way; some
separate ions in space while others separate ions by time. In the most general terms, a mass
analyzer measures gas phase ions with respect to their mass-to-charge ratio (m/z), where the
charge is produced by the addition or loss of a proton(s), cation(s), anion(s) or electron(s).
The addition of charge allows the molecule to be affected by electric fields thus allowing its
mass measurement. This is an important aspect to remember about mass analyzers they
measure the m/z ratio, not the mass. It is often a point of confusion because if an ion has
multiple charges, the m/z will be significantly less than the actual mass.
Fig 11: The effect of resolution up on mass accuracy

36
Tuning the mass spectrometer
Tuning is the process of selecting all the parameters that will be used in MS acquisition
method. These include
Ion mode
Instrument parameters
ESI and collision gases
During the tuning the parent and product ions of each pesticide molecule are identified and
optimized with respect to the fragmentor voltage and collision energy.
Introduction to mass spectrometer set up for tuning
Method editor – QQQ parameters – Source
Let us take an example of spinetoram.
Prepare a 1 ppm solution of spinetoramin a suitable solvent and add it to the tuning vial.
Its molecular weight is 748. As per the literature survey, it is analysed in the positive mode.
Therefore M+1 i.e. 749 mass needs to be subjected for MS analysis.
In the MS2 scan, choose the mass range between 700 to 800 m/z. 749 will be shown as a
peak.
37
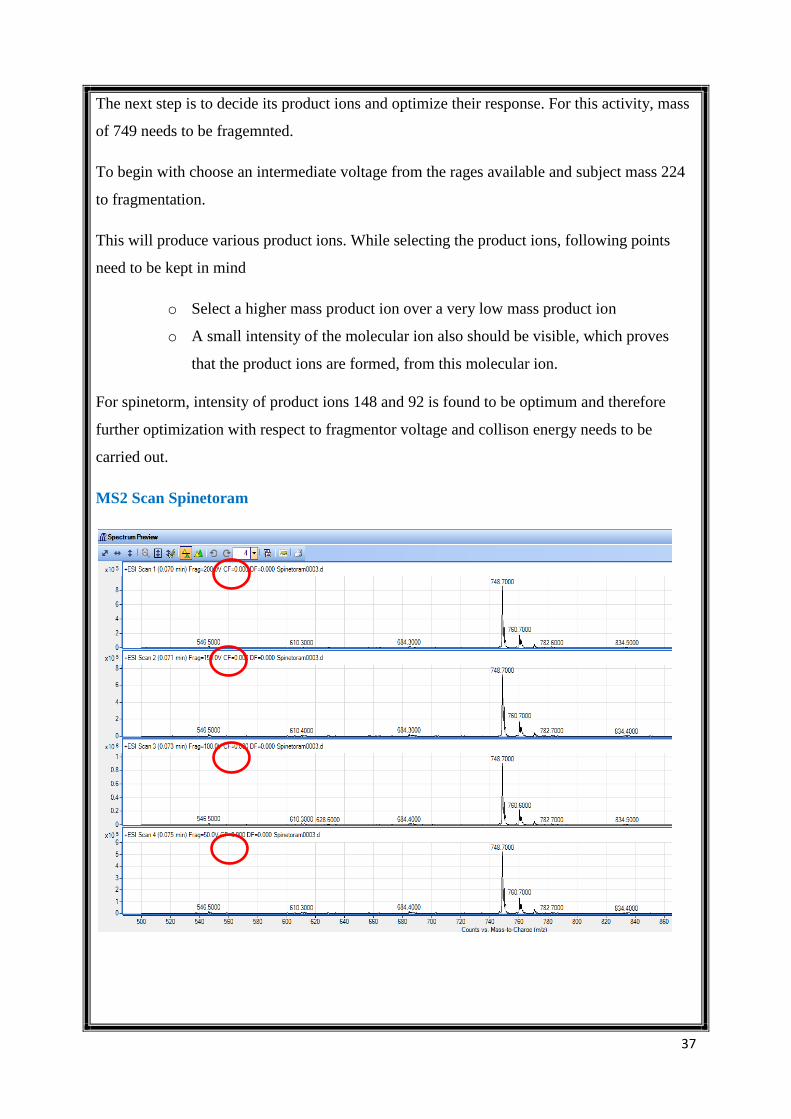
The next step is to decide its product ions and optimize their response. For this activity, mass
of 749 needs to be fragemnted.
To begin with choose an intermediate voltage from the rages available and subject mass 224
to fragmentation.
This will produce various product ions. While selecting the product ions, following points
need to be kept in mind
o Select a higher mass product ion over a very low mass product ion
o A small intensity of the molecular ion also should be visible, which proves
that the product ions are formed, from this molecular ion.
For spinetorm, intensity of product ions 148 and 92 is found to be optimum and therefore
further optimization with respect to fragmentor voltage and collison energy needs to be
carried out.
MS2 Scan Spinetoram

38
Fragmentation of molecular ion (749) into Product Ions
Optimization of Product Ion 749 142

39
Optimization of Product Ion 749 98
Confirmation of MRM

40
Apart from parent and product ions, Source parameters have to be optimized for highest
response of analytes. These parameters include gas flow, nebulizer temperature and sheath
gas temperature, sheath gas flow, capillary and nebulizer voltages etc.
Mass Parameters
Once all the above parameters are optimized, the LC-MS (GC-MS) acquisition method can
be set up
Acquisition method

41
The calibration standards and samples are analysed using this acquisition method. For
quantification of samples, a processing method needs to be set up. This processing method
addresse following points - Name of the pesticides, their retention times, their MRMs,
Calibration levels, quantification ion, qualifier, ratio of quantifier to qualifier ion, acceptable
% deviation for this ratio. For every single pesticide, these parameters have to be filled in.
Processing method for Quantification
Once the processing method is ready, calibration standards and samples are processed using it
and a quantification file is obtained. The quantification file include matrix linearity and
results of samples.
Matrix Linearity

42
Once the results are obtained, confirmation needs to be carried out based on calibration,
retention time, area of quantifier ion, qualifier: quantifier ratio and recovery of the pesticide
at the LOQ level.
Verification of results based on the ion ratios
Lab Work Notes – Enter the MS parameters

43
Lab Work Notes – Enter the MRM parameters
Lab work notes

44

45
8. Method validation
Method validation is the process used to confirm that the analytical procedure
employed for a specific test is suitable for its intended use. Results from method validation
can be used to judge the quality, reliability and consistency of analytical results.
Different Parameters in method validation
Specificity/Selectivity
Linearity
Method Sensitivity: Limit of detection (LOD) & Limit of quantitation(LOQ)
Accuracy:Trueness & Precision, Repeatability &Reproducibility
Ruggedness
Uncertainty
Standards and Reagent Preparation:
Individual standards should be prepared gravimetrically in ~1000 mg/L
concentration by weighing 10 mg from each standard into a 20 mL amber screw cap vial on
a five digit analytical balance and dissolving in 10 mL of appropriate solvent (acetone,
toluene or acetonitrile depending on the individual compound). Concentrations of each
individual standard stock solution can be calculated gravimetrically using weight of added
compounds and solvents. All individual standard stocks should be stored in a freezer at -20
°C. Validity of individual standard stock solutions is 6 month. Form this working solutions
can be prepared by serial dilution.
Reagent Blank
Reagent blank should be made to identify sources of interference. To study the
signals of “apparent residues” or blank signals appear due to un-removed co-extractives in
the extraction process, or impurities in the solvents or reagents or instrument noise.
Specificity/Selectivity
• Predominantly a function of the measuring technique. Can vary according to class
of compound or matrix. At least 3 “processed” blanks have to undergo the whole
procedure before being analyzed. Any interfering substances derived from the

46
analytical process to beidentified.
There should be no peak(s) at the same retention time as the analyte of interest.
Linearity
Ability to elicit test results that are directly proportional to the concentration of
analytes in samples within a given range.To get the calibration curves standard has to
prepare at six levels (matrix matched) and inject in duplicate. The linearity of calibration
curves can assessed in calibration ranges of 10–200, ng/g. Correlation coefficient values
should be >0.99.
Matrix effects can be evaluated by plotting of measured relative peak areas of
calibration standards in solvent against the areas in the relevant matrix.
Limit of Detection (LOD)
The lowest concentration that can be identified positively using a particular method in a
particular matrix. Samples that do not bear residues at or above the LOD are referred to as
“non- detects” (NDs).
Limit of Quantitation (LOQ)
The lowest tested concentration at which an acceptable mean recovery (normally 70-110%)
and RSD (normally <20%) are obtained.Samples that do not bear residues ≥ LOQ are often
referred to as “nonquantifiable.”
Accuracy
This can be defined as the closeness of agreement between a test result and the accepted
reference value. It is determined by determining trueness and precision. The portion of the
compound, recovered in the final determinative step, after processing of the sample
(Extraction and Clean-up).
Trueness
Method trueness can be assessed by recovery studies using blank matrices spiked at three
concentration levels (L1, L2 and L3) and inject in six individually prepared replicates.
Spiking of samples should be prior to sample preparation. The sample concentrations,
recovery and relative standard deviation (% RSD) can be calculated. According to SANCO
requirements recovery values are deemed acceptable if between 70–120%.
The analytical material is fortified, extracted and analyzed.
Recovery (%) = (Recovered Concentration/Added Concentration) x100
Precision
Instrument injection precision was tested for both retention time and peak area for all target
compounds by subsequent injections (n=6) of low concentration level (L1) standard
solutions. Instrument injection precision for retention time should be below 2% and for
area below 5% for indicating reliable instrument performance.
Repeatability
The precision under conditions where independent test results are obtained with the same

47
method, identical test material, same laboratory or same operator.
Reproducibility
Precision under reproducibility conditions like same method, identical test items, different
laboratories, different operators, and different equipment.
Ruggedness
Defined as: “The susceptibility of an analytical method to changes in experimental
conditions which can be expressed as a list of the sample materials, analytes, storage
conditions, environmental and / or sample preparation conditions under which the method
can be applied as presented or with specified minor modifications.
Conditions which could in practice be subject to fluctuation (e.g. stability of reagents,
composition of the sample, pHand temperature) any variations which could affect the
analytical result should be indicated.”
Uncertainty
Uncertainty can be estimated by the standard deviation calculated on within laboratory
reproducibility.
Laboratory Session on Method Validation:
Specificity:
To check the retention time of an individual analyte, inject individual analyte
solution six times at oneconcentration.
Calculate standard deviation and RSD (Relative Standard Deviation) for
retentiontime.
To check retention Time of Mixture of analytes, inject Mixture of standard solution
six times at oneconcentration.
Calculate standard deviation and RSD for retentiontime.
To study on Area of individual analyte, inject individual analyte solution six times
at one concentration.
Calculate standard deviation and RSD for retentiontime.
To study on Area in mixture of analytes, inject Mixture of standard solution six
times at oneconcentration.
Calculate standard deviation and RSD for retentiontime.
Linearity
a) Linearity onStandard
Individual: Inject 5 different linear concentrations in triplicate. Calculate % RSD
for the area under thepeak.
Mixture: Inject mixture of an analytes at 5 different concentrations intriplicate.
Calculate standard deviation and RSD for the area under the peak.
b) Matrix Match Standard
Prepare the extract of samplematrix.
Prepare required 5 concentrations standard dilutions with sample extract(matrix).
Inject sample matrix blank intriplicate.

48
Inject mixture of standard solution in sample matrix three times at 5 linear
concentrations for GC-MS/MS &LC-MS/MS.
Determination of LOD (Level of Detection):
Spike the sample with standards at minimum five levels starting from lowest at
which all analyte are detected plot the calibration curve and from the curve calculate LOQ using followingformula:
LOD = 3 x (Standard Deviation /Slope).
Determination of LOQ (Level of Quantitation):
Spike the sample with standards at minimum five levels starting from lowest at
which all analyte are detected and plot the calibration curve and from the curve
calculate LOQ using followingformula:
LOQ = 10 x (Standard Deviation /Slope)
Accuracy
Spike the sample at LOQ, 5 times LOQ, and 10 or 50 times LOQ level in 6
replications each.
Calculate % Recovery and RSD forrecovery.
Repeatability
Spike the sample at 5 times LOQ in 3 replicationseach.
Calculate % Recovery and RSD for recovery on same
day.
Reproducibility
Spike the sample at 5 times LOQ level in 3 replicationseach.
Calculate % Recovery and RSD for recovery with other analyst, otherday.
Ruggedness
Spike the sample at 5 times LOQ. Carry out the analysis it will be repeated by
change in analyst or change in technique or change in equipment or change in analytical
column (i.e. Different Brand column).
ACCEPTANCE CRITERIA:
For PesticideResidue Analysis
Sr.
No. Parameters Acceptance Limit
1 Linearity –
The coefficient of correlation > 0.99
2
Specificity –
RSD of Retention
time RSD of Area
<2.0 %
<5.0 %

49
3 Matrix Match Standard –
Matrix Interference
No interference of matrix in the
method
4
Accuracy –
% Recovery & RSD at LOQ
% Recovery & RSD at 5 times LOQ
% Recovery & RSD at 10 times
LOQ
% Recovery should be within 70
– 130% RSD should be <20%.
5 Repeatability –
% Recovery & RSD at 5 times LOQ
% Recovery should be within 70
– 130% RSD should be <15%.
6 Reproducibility
% Recovery & RSD at 5 times LOQ
% Recovery should be within 70
– 130% RSD should be <15%.
7. Ruggedness
% Recovery & RSD at 5 times LOQ % Recovery should be within 70
– 130% RSD should be <15%.
Laboratory safety:
Safety is our priority and will enforce all normal laboratory safety procedures applicable
Please fallow the safety precautions
1. Laboratory coat should be worn in thelaboratory
2. Use fume hoods whenever handling volatile or hazardouschemicals
3. Safety goggles should be worn at all times in thelaboratory
4. Appropriate gloves should be worn asneeded
5. Gloves should not be worn outside thelaboratory
6. Label all yoursamples
In the event of an emergency please contact one of the supervising instructors immediately.

50
9. Reference
SANTE/11945/2015: Guidance document on analytical quality control and method
validation procedures for pesticides residues analysis in food and feed.
European Committee for Standardization/Technical Committee CEN/TC275
(2008), Foods of plant origin: Determination of pesticide residues using GC-MS
and/or LC- MS/MS following acetonitrile extraction/ partitioning and cleanup by
dispersive SPE QuEChERS-method.
Validation of a GC–MS method for the estimation of dithiocarbamate fungicide
residues and safety evaluation of mancozeb in fruits and vegetables
SumaiyyaMujawar, Sagar C. Utture, Eddie Fonseca, Jessie Matarrita, Kaushik
Banerjee, Food Chemistry, 2014, 150, 175–181.
Multiresidue Analysis of Plant Growth Regulators in Grapes by Triple Quadrupole
(QqQ) and Quadrupole–Time of Flight (Q-ToF) Based Liquid
Chromatography/Mass Spectrometry
Dasharath P. Oulkar and Kaushik Banerjee, Journal of AOAC International Vol.
2011, 94, 6.
AOAC Official Method 2007.07 Pesticide Residues in Food by Acetonitrile
Extraction and Partitioning with Magnesium Sulfate. Gas Chromatography/Mass
Spectrometry and Liquid Chromatography/Tandem Mass Spectrometry.
Multiresidue Analysis of Multiclass Plant Growth Regulatorsin Grapes by Liquid
Chromatography/Tandem MassSpectrometry
Dasharath P. Oulkar, Kaushik Banerjee,Manoj S. Ghaste, and Sahadeo D. Ramteke,
Journal of AOAC International,2011, 94, 3.
Quantitative Screening of Agrochemical Residues in Fruits andVegetables
byBuffered Ethyl Acetate Extraction and LC-MS/MSAnalysis
Manjusha R. Jadhav, Dasharath P. Oulkar, AhammedShabeer T. P., and Kaushik
Banerjee, J. Agric. Food Chem, DOI: 10.1021/jf505221e.