“History doesn’t repeat itself, but it often rhymes” · “History doesn’t repeat itself,...
24
“History doesn’t repeat itself, but it often rhymes” Sohn Conference | May 2019 1
Transcript of “History doesn’t repeat itself, but it often rhymes” · “History doesn’t repeat itself,...

“History doesn’t repeat itself,
but it often rhymes”
Sohn Conference | May 2019
1

2
Disclosure
This presentation is for informational purposes only and is not a recommendation to buy or sell
securities. Please do your own research. Certain accounts managed by me are invested in securities
mentioned in this presentation through shares and/or derivatives. I may increase, decrease and/or
exit my position in the future without notice, and I am under no obligation or agreement to take, or
not take, any action or restrict my actions in any manner. My views are subject to change without
notice and I may trade in any manner, whether consistent or inconsistent with this presentation.
The information provided is from public sources. I have not independently verified this information
and make no representations as to the accuracy or correctness of any such information. I undertake
no obligation to update any information provided.

3
Econ 101…the laws of supply and demand
The market clears at an equilibrium price where supply meets demand
➢ Supply growth > Demand growth = Prices
➢ Demand growth > Supply growth = Prices
Source: Google images.

4
“The cure for high prices is high prices”
“Typically, capital is attracted into high-return businesses and leaves when returns fall below the
cost of capital. This process is not static, but cyclical – there is a constant flux. The inflow of
capital leads to new investment, which over time increases capacity in the sector and eventually
pushes down returns. Conversely, when returns are low, capital exits and capacity is reduced; over
time, then profitability recovers” – Capital Returns (Marathon Asset Management)
Source: Capital Returns by Edward Chancellor and Marathon Asset Management, Google images, Web Donuts and Gruhn.

5
Why am I telling you this?
These are basic ideas underpinning a repeatable investment framework
Source: Google images, Karate Kid.

6
Boom/bust framework
From time to time industry S&D growth gets meaningfully imbalanced
leading to boom and bust cycles that create asymmetric and profitable short
and long opportunities across sectors and geographies
➢ Situations get mispriced for several durable reasons including those rooted in human behavior
▪ People have a tendency towards overextrapolation of recent experience into the future
▪ People have a tendency towards forecasting linearly vs. changes in S&D lead to impacts that
are often non-linear and unintuitive
➢ Analysts often capitalize boom-time earnings at peak-multiples and bust-time earnings at
trough-multiples…this leads to asymmetry as there is a coiled effect working for you in both a
variance to earnings and a multiple re-rating if your timing and analysis of S&D are good
➢ Cycles can last for months or decades, but when barriers to entry are low, economic gravity leads to
a mean reversion/normalization in economic returns over time
➢ Most powerful when applied to industries/businesses where S&D analysis is not standard

7
Despite its simplicity, this framework works!
d
➢ d
Source: CNBC, Reuters, Bloomberg, WSJ, Globe and Mail, Metal Bulletin, Laser Market Research.

8
What’s next?…a short opportunity in Idaho
Source: Google images, Disney.

9
Lamb Weston (LW) is a short
LW is a supply-driven boom/bust short with 40-50% absolute downside over the next 12 months and a skewed risk/return
➢ A period of perfect industry dynamics driven by a sexy demand story and minimal new supply led to an unsustainable surge in per-unit pricing and margins for LW’s processed potato products
➢ The market is extrapolating profit growth and margins linearly into future years
➢ Extrapolation has led the market to capitalize peak-margins at a big multiple befitting a safe and growing staple, when the business is in fact much more vulnerable to S&D dynamics than investors believe – the current valuation implies that LW is trading at 2.0-3.0x replacement cost
➢ Above-normal profits and attractive returns on capital have incented an observable supply response, with a wave of +10-12% capacity coming online in the next 6-12 months (and +16% in the next 24 months) vs. demand growing at 1.5-2.5% p.a.
➢ As new capacity overwhelms demand and capacity utilization heads much lower, per unit margins should deteriorate and the myth that LW is a bulletproof staple should be debunked
➢ LW should miss Consensus earnings estimates by 30-40% in FY20/FY21 (5/30 YE) and the multiple should de-rate, leading to 40-50% equity downside
➢ If this hypothesis is wrong and per-unit margins continue to improve, there is ~10-15% upside if prices re-set to fair value today and 20-25% in the next 12 months if LW hits its numbers/sustains elevated profitability levels and its multiple re-rates up
Source: Proprietary estimates, primary research, company filings, Bloomberg.

10
Business description
➢ Lamb Weston is in the business of potato processing – purchasing raw potatoes and processing
them primarily into fries (and to a lesser degree tater tots, hash browns and chips) that are sold to
foodservice (QSRs and restaurants) end customers
➢ Purchase potatoes from fragmented base of growers primarily in the Pacific Northwest (typically
negotiated annually) and sells through a network of independent brokers/distributors
➢ Spends 0.4% of sales on R&D (commodity business); MCD accounts for 11% of sales
➢ Only publicly traded player in NA potato oligopoly (controls 80-90% of supply) after spin-off from
ConAgra in 11/2016 – McCain/Simplot/Cavendish are private and family owned
FY18 EBIT by End-Market FY18 Sales by Geography
Source: Company filings.
Global (Top 100 Chains/Intl. = Foodservice)
44%
Foodservice (Oustide of Top
100)43%
Retail10%
Other2%
US/Canada81%
Other (Japan/China/Korea
/Mexico/Taiwan)19%

11
Summary financials
Source: Proprietary estimates, primary research, company filings, Bloomberg.
Capitalization Financial Summary (Historical & Consensus)
Normalized Management 5/31/14 5/31/15 5/31/16 5/31/17 5/31/18 5/31/19 5/31/20 5/31/21
Share Price (5/2/19) $66.37 $66.37 2014A 2015A 2016A 2017A 2018A 2019E 2020E 2021E
S/O FD 147.4 147.4 Revenue $2,815 $2,925 $2,994 $3,168 $3,424 $3,725 $3,942 $4,178
MC ($mm) $9,783 $9,783 y/y 3.9% 2.4% 5.8% 8.1% 8.8% 5.8% 6.0%
(+) Gross Debt 2,425 2,425 Gross Profit $587 $662 $779 $880 $972 $1,035 $1,105
(−) Cash and Equivalents (17) (17) % Margin 20.1% 22.1% 24.6% 25.7% 26.1% 26.3% 26.5%
(+) NCI/Equity Inv./Other (223) Adj. EBITDA (incl. Unconsolidated JVs) $503 $526 $593 $707 $820 $902 $972 $1,016
EV ($mm) $11,968 $12,190 y/y 4.7% 12.8% 19.2% 16.0% 9.9% 7.8% 4.5%
% Margin 17.8% 18.0% 19.8% 22.3% 24.0% 24.2% 24.7% 24.3%
3M ADTV ($mm) $106 EBITDA (excl. Unconsolidated JVs) $466 $479 $534 $648 $728 $814 $862 $900
SI % of Float/Borrow 6.75% / GC y/y 2.7% 11.6% 21.4% 12.2% 11.9% 5.9% 4.5%
% Margin 16.6% 16.4% 17.8% 20.5% 21.2% 21.8% 21.9% 21.5%
Adj. EPS $2.14 $2.33 $2.68 $3.20 $3.50 $3.89
y/y 8.7% 15.1% 19.4% 9.4% 11.1%
Est. Rev/lb. Processed $0.512 $0.532 $0.536 $0.566 $0.611 $0.631 $0.657 $0.688
Est. GP/lb. Processed $0.106 $0.107 $0.119 $0.139 $0.157 $0.171 $0.180 $0.188
Est. Segment EBIT/lb. Processed $0.103 $0.103 $0.115 $0.137 $0.151 $0.164 $0.174 $0.182
Consensus Multiples 2019E Guidance and Bridge to FCF
2019E 2020E Low Mid High
EV/Revenue 3.2x 3.0x Adj. EBITDA incl. Unconsolidated JVs $895 $900 $905
EV/Adj. EBITDA 13.5x 12.5x Est. JV EBITDA Bridge (91) (91) (91)
EV/EBITDA 14.7x 13.9x LW EBITDA $804 $809 $814
P/E 20.7x 19.0x D&A (150) (150) (150)
Interest (110) (110) (110)
ND/EBITDA 3.0x 2.8x Adj. EBIT $544 $549 $554
Tax Rate 22.5% 22.5% 22.5%
NI $422 $426 $430
Guidance Equity Method Earnings 71 71 71
MC/Reported FCF 33.9x Income to NCI (9) (9) (9)
MC/Normalized FCF 20.0x D&A 150 150 150
CapEx (350) (350) (350)
Reported FCF Yield 2.9% Reported FCF for LW Shareholders $285 $288 $292
Normalized FCF Yield 5.0% FCF at Normalized CapEx (CapEx = D&A) $485 $488 $492
Management definition of Adj. EBITDA includes
proportional interest in unconsolidated JVs

12
Perfect period of S&D led to a pricing spike
Sexy demand story from QSR unit growth in EMs following the GFC +
minimal industry supply additions = big tightening of industry utilization
➢ Demand growth was negative-to-flat during the mid-2000s as health trends like the Atkins diet
supported a shift towards low-carb diets and away from carb-heavy products like fries
➢ Combined with demand destruction during the GFC led to some shuttering of industry capacity
and a reluctance to add new supply…LW was aggressive and benefitted by expanding a bit
➢ Tight industry backdrop allowed processors to take pricing while cost inflation was benign
Source: Company filings, primary research.
(1.0%)
4.0%
6.0%
3.0%
4.0%
3.0% 3.0%
5.0%
7.0%
8.0% 8.0%
6.0%
3.0%
(2.0%)
(1.0%)
0.0%
1.0%
2.0%
3.0%
4.0%
5.0%
6.0%
7.0%
8.0%
9.0%
FY2016 FY2017 FY2018 2Q17 3Q17 4Q17 1Q18 2Q18 3Q18 4Q18 1Q19 2Q19 3Q19
LW Price/Mix Contribution to Revenue y/y

13
Margins boomed and market is extrapolating
Source: Company filings, proprietary estimates, Bloomberg, sell-side broker research.
$0.000
$0.040
$0.080
$0.120
$0.160
$0.200
$0.240
2014A 2015A 2016A 2017A 2018A 2019E 2020E 2021E
5/31/14 5/31/15 5/31/16 5/31/17 5/31/18 5/31/19 5/31/20 5/31/21
Est. Unit Economics (Per lb. Processed)
Segment EBIT/lb. Processed GP/lb. Processed
Consensus (Sell-Side Broker Proxy)
20.8%20.1%
22.1%
24.6%25.7% 26.1% 26.3% 26.5%
17.8% 18.0%
19.8%
22.3%
24.0% 24.2% 24.7% 24.3%
10.0%
12.5%
15.0%
17.5%
20.0%
22.5%
25.0%
27.5%
30.0%
32.5%
2014A 2015A 2016A 2017A 2018A 2019E 2020E 2021E
5/31/14 5/31/15 5/31/16 5/31/17 5/31/18 5/31/19 5/31/20 5/31/21
Margins
GPM% Adj. EBITDA % Margin (incl. Uncon. JVs)
Consensus
14
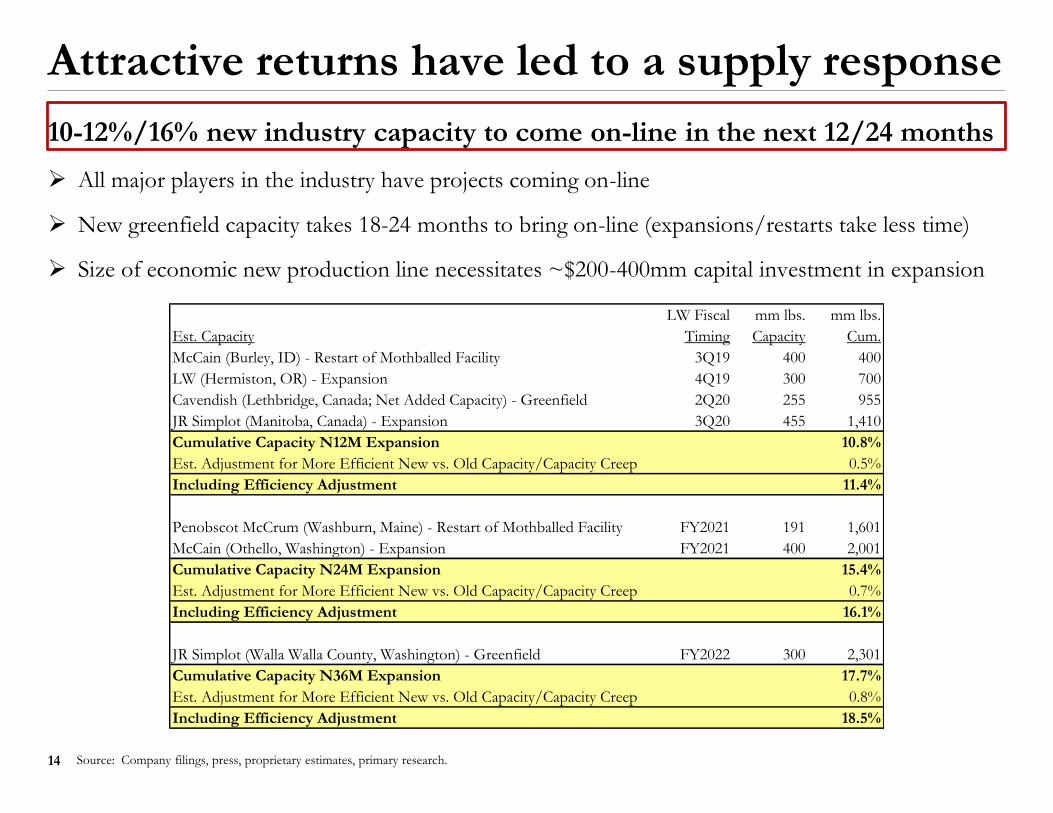
Attractive returns have led to a supply response
10-12%/16% new industry capacity to come on-line in the next 12/24 months
➢ All major players in the industry have projects coming on-line
➢ New greenfield capacity takes 18-24 months to bring on-line (expansions/restarts take less time)
➢ Size of economic new production line necessitates ~$200-400mm capital investment in expansion
Source: Company filings, press, proprietary estimates, primary research.
LW Fiscal mm lbs. mm lbs.
Est. Capacity Timing Capacity Cum.
McCain (Burley, ID) - Restart of Mothballed Facility 3Q19 400 400
LW (Hermiston, OR) - Expansion 4Q19 300 700
Cavendish (Lethbridge, Canada; Net Added Capacity) - Greenfield 2Q20 255 955
JR Simplot (Manitoba, Canada) - Expansion 3Q20 455 1,410
Cumulative Capacity N12M Expansion 10.8%
Est. Adjustment for More Efficient New vs. Old Capacity/Capacity Creep 0.5%
Including Efficiency Adjustment 11.4%
Penobscot McCrum (Washburn, Maine) - Restart of Mothballed Facility FY2021 191 1,601
McCain (Othello, Washington) - Expansion FY2021 400 2,001
Cumulative Capacity N24M Expansion 15.4%
Est. Adjustment for More Efficient New vs. Old Capacity/Capacity Creep 0.7%
Including Efficiency Adjustment 16.1%
JR Simplot (Walla Walla County, Washington) - Greenfield FY2022 300 2,301
Cumulative Capacity N36M Expansion 17.7%
Est. Adjustment for More Efficient New vs. Old Capacity/Capacity Creep 0.8%
Including Efficiency Adjustment 18.5%
15
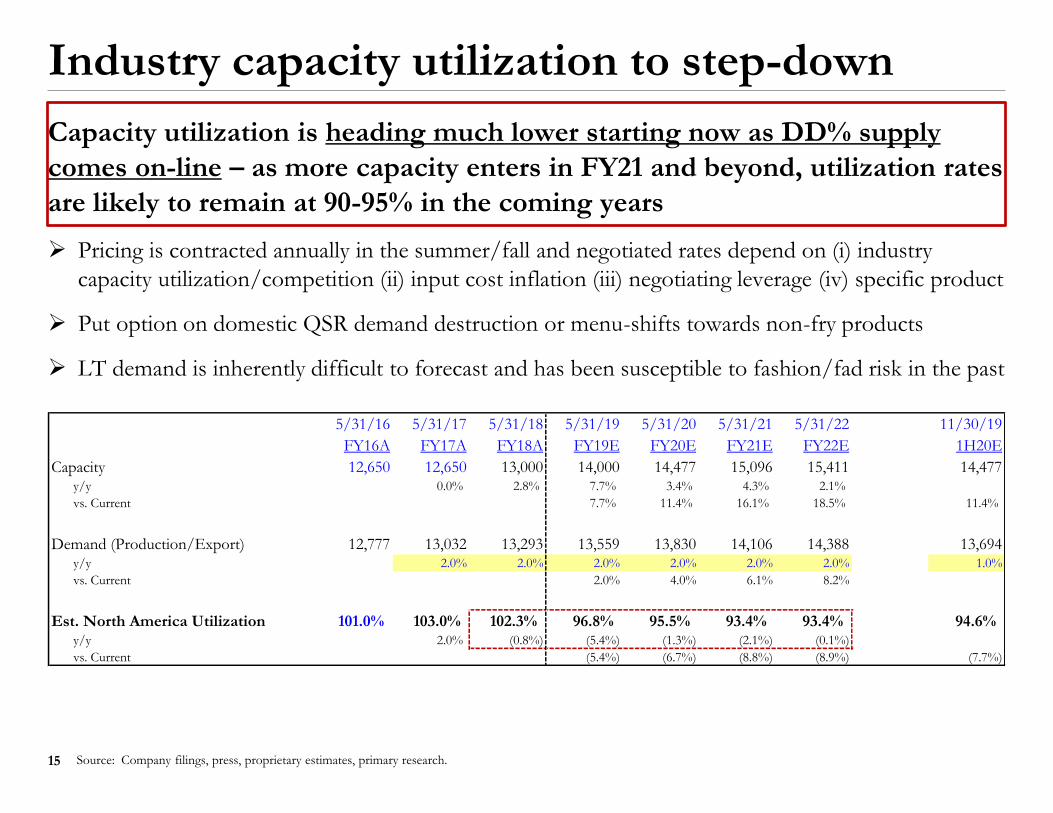
Industry capacity utilization to step-down
Capacity utilization is heading much lower starting now as DD% supply
comes on-line – as more capacity enters in FY21 and beyond, utilization rates
are likely to remain at 90-95% in the coming years
➢ Pricing is contracted annually in the summer/fall and negotiated rates depend on (i) industry
capacity utilization/competition (ii) input cost inflation (iii) negotiating leverage (iv) specific product
➢ Put option on domestic QSR demand destruction or menu-shifts towards non-fry products
➢ LT demand is inherently difficult to forecast and has been susceptible to fashion/fad risk in the past
Source: Company filings, press, proprietary estimates, primary research.
5/31/16 5/31/17 5/31/18 5/31/19 5/31/20 5/31/21 5/31/22 11/30/19
FY16A FY17A FY18A FY19E FY20E FY21E FY22E 1H20E
Capacity 12,650 12,650 13,000 14,000 14,477 15,096 15,411 14,477y/y 0.0% 2.8% 7.7% 3.4% 4.3% 2.1%
vs. Current 7.7% 11.4% 16.1% 18.5% 11.4%
Demand (Production/Export) 12,777 13,032 13,293 13,559 13,830 14,106 14,388 13,694y/y 2.0% 2.0% 2.0% 2.0% 2.0% 2.0% 1.0%
vs. Current 2.0% 4.0% 6.1% 8.2%
Est. North America Utilization 101.0% 103.0% 102.3% 96.8% 95.5% 93.4% 93.4% 94.6%y/y 2.0% (0.8%) (5.4%) (1.3%) (2.1%) (0.1%)
vs. Current (5.4%) (6.7%) (8.8%) (8.9%) (7.7%)

16
Economics suggest margins should compress
Segment EBIT/lb. processed could fall 50%+ before returns on expansion
CapEx fall below the cost of capital…new expansion announcements should
continue as current returns are unsustainable and will continue to incent new
supply until above-normal returns are competed down
➢ Processors are achieving 20-25% pre-tax and 15-20% post-tax RoC on expansion CapEx at current
profitability levels (assuming LW has a cost advantage still implies very high RoC for other players)
➢ Signpost: McCain just announced additional ~400mm lb. expansion in Othello, WA on 5/2/19
Source: Company filings, press, proprietary estimates, primary research.
RoC on Expansion/Newbuild CapEx
LW Achieved FY15 FY16 FY17 FY18 Run-Rate Consensus FY20/21
Segment EBIT/lb. Processed $0.080 $0.090 $0.100 $0.110 $0.120 $0.130 $0.140 $0.150 $0.160 $0.166 $0.170 $0.180 $0.190
% to LW Current Run-Rate (52%) (46%) (40%) (34%) (28%) (22%) (16%) (10%) (4%) 0% 2% 8% 14%
Pre-Tax RoC
$0.90 8.9% 10.0% 11.1% 12.2% 13.3% 14.4% 15.6% 16.7% 17.8% 18.4% 18.9% 20.0% 21.1%
$0.85 9.4% 10.6% 11.8% 12.9% 14.1% 15.3% 16.5% 17.6% 18.8% 19.5% 20.0% 21.2% 22.4%
$0.80 10.0% 11.3% 12.5% 13.8% 15.0% 16.3% 17.5% 18.8% 20.0% 20.8% 21.3% 22.5% 23.8%
$0.75 10.7% 12.0% 13.3% 14.7% 16.0% 17.3% 18.7% 20.0% 21.3% 22.1% 22.7% 24.0% 25.3%
$0.70 11.4% 12.9% 14.3% 15.7% 17.1% 18.6% 20.0% 21.4% 22.9% 23.7% 24.3% 25.7% 27.1%
Post-Tax RoC (Assumes 22.5% Tax Rate)
$0.90 6.9% 7.8% 8.6% 9.5% 10.3% 11.2% 12.1% 12.9% 13.8% 14.3% 14.6% 15.5% 16.4%
$0.85 7.3% 8.2% 9.1% 10.0% 10.9% 11.9% 12.8% 13.7% 14.6% 15.1% 15.5% 16.4% 17.3%
$0.80 7.8% 8.7% 9.7% 10.7% 11.6% 12.6% 13.6% 14.5% 15.5% 16.1% 16.5% 17.4% 18.4%
$0.75 8.3% 9.3% 10.3% 11.4% 12.4% 13.4% 14.5% 15.5% 16.5% 17.2% 17.6% 18.6% 19.6%
$0.70 8.9% 10.0% 11.1% 12.2% 13.3% 14.4% 15.5% 16.6% 17.7% 18.4% 18.8% 19.9% 21.0%
Cap
Ex/
lb.

17
We’ve seen this movie before
Source: “Competitive Forces Threaten to Knock Idaho from Top” in NY Times on 4/12/1997, primary research.
While historical industry data is opaque and today’s situation differs from the
past, in the late 1990s a boom in potato processing supply greater than
demand growth led to a period where processor economics deteriorated
“The Canadians' bargain-basement exports created a french-fry glut in the United States, prompting the nation's largest
processors, Lamb-Weston Inc., a Conagra Inc. subsidiary, and the J. R. Simplot Company to cut production and lay off
about 500 workers at plants in southern Idaho”
“United States french-fry market expands only about 3 percent a year, while the capacity of American and Canadian
processing plants is growing faster. That means future competition for french-fry sales will be equally fierce”

18
Framing the range of outcomes
Base/downside cases assume RoC approaches FY15-FY16 levels vs.
Consensus assumes continued surge in per-unit margins and RoC
Source: Company filings, press, proprietary estimates, primary research.
$0.090
$0.110
$0.130
$0.150
$0.170
$0.190
2014A 2015A 2016A 2017A 2018A 2019E 2020E 2021E
5/31/14 5/31/15 5/31/16 5/31/17 5/31/18 5/31/19 5/31/20 5/31/21
Range of Outcomes - Segment EBIT/lb.
Upside Base Downside Consensus (Sell-Side Broker Proxy)
99%
12.9%19.4%
Est. YE NA Capacity Utilization
Est. Pre-Tax RoC on $0.80/lb CapExSegment EBIT % Margin
101%
14.4%21.4%
103%
17.1%24.1%
102%
18.9%24.8%
97%
20.0%25.3%
95%
14.7%19.3%
93%
15.3%19.3%
97%
12.8%20.0%

19
Variant perception
✓ LW is a high-quality business and a
safe/growing staple with attractive Asia fry
export end-market demand
✓ LW has secular pricing power
✓ LW will take pricing that will drop-through at
high incremental margins (which the sell-side
mis-models) and will drive earnings beats
✓ Management is conservative and consistently
beats/raises
✓ European drought will lead to an NA export
demand surge offsetting new supply
Prevailing view Variant view
LW is a good, cyclical business being misunderstood as a bulletproof staple and more downside vs. upside LT demand risk
Cyclical pricing power masquerading as secular and not being viewed holistically with inflating costs (need pricing > costs for margin expansion)
Well understood by most investors such that the “market” is higher than Consensus
Well understood by buy-side/sell-side and management benefitted from demand tailwind
Potential demand upside is over-blown and export tracking data so far suggests it is not necessarily materializing

20
Refuting common bull arguments➢ North America potato processing is a well-behaving and disciplined oligopoly that will phase capacity
▪ Primary research suggest incumbent processors view the game as a war for market share in a low-growth pie
▪ DD% capacity coming on at once is dis-confirmatory evidence – one would assume rationality would influence the decision point of whether to bring on new capacity…it is much harder to be rational when processors need to fill new lines that come online after spending ~$200-400mm in investment capital…the best way to fill capacity is with large volume customers and those customers typically need to be stolen from other processors
▪ Industry has been consolidated for a long time and LW was earning 10-12% post-tax RoC in FY2014-2016
▪ “None of these companies is likely to be idle while their competitors build new production lines, for fear of losing market share. Therefore, capacity expansion could come in increments of 1.2-1.6 billion pounds. That creates the potential for three to four years of incremental capacity to come online simultaneously. That could result in bidding wars between processors to fill the new capacity” – Bruce Huffaker, North America Potato Market News
➢ French fries are high GP $ and GPM% products, so processors can push through price increases because QSRs pay pennies on the dollar and can pass pricing on to customers
▪ Competition is from the processor side to bid down pricing and win volumes to fill new lines/take market share
▪ Large QSRs have sophisticated raw material procurement teams in place and keep tabs on industry dynamics and negotiate hard on pricing; in recent years large QSRs have approved more global fry suppliers, allowing them to retaliate in other regions if NA processors get greedy…restaurants run on thin margins and cost savings matter
➢ Demand is strong and has been capacity constrained
▪ Industry should follow the laws of S&D – price should already reflect demand and it follows that if pent-up demand is so strong that existing/new customers would have bid the price up (especially because they are high GPM%) in order to support adding fries or new fry products to their menus
▪ Last few years have benefitted from positive demand shocks such as all-day breakfast
▪ Growing export demand is already reflected in LW’s 1.5-2.5% y/y global demand growth estimate
Source: Company filings, press, proprietary estimates, primary research, North America Potato Market News, Potato Country.

21
Valuation and risk/return
➢ Upside case: Segment EBIT/lb. expands $0.005/lb. in FY20/FY21 and implied pre-tax RoC on
newbuilds to 20-22%...LW EBITDA roughly in-line with consensus and multiple re-rates up
➢ Base case: Segment EBIT/lb. declines to FY16 levels and implied pre-tax RoC on newbuilds to
14-15%...EBITDA misses consensus by ~30% and multiple de-rates ~10%
➢ Downside case: Segment EBIT/lb. declines to FY15/FY16 levels and implied pre-tax RoC on
newbuilds to 13-14%...EBITDA misses consensus by ~35-40% and multiple de-rates ~15-20%
Source: Company filings, proprietary estimates, Bloomberg.
~40-50% absolute downside and a skewed R/R
5/2/19 5/31/20 Forward 5/31/21 5/31/21 5/31/21 Forward 5/31/20
PV at 10% CoE '20 Valuation EV/EBITDA '21 EBITDA'21 Seg. EBIT/lb. '21 EPS Implied P/E '20 Net Lev.
Upside $74.40 $82.46 14.2x $996 $0.170 $3.92 21.0x 2.5x
% U/(D) 12% 24% 13% (2%) (6%) 1% 11%
Base $35.65 $39.51 11.4x $708 $0.118 $2.32 17.0x 4.2x
% U/(D) (46%) (40%) (9%) (30%) (35%) (40%) (10%)
Downside $25.73 $28.52 10.4x $632 $0.105 $1.90 15.0x 5.0x
% U/(D) (61%) (57%) (17%) (38%) (42%) (51%) (21%)
Current $66.37 $66.37 Consensus Estimates
R/R (Base/Up) 3.8x 1.7x
R/R (Down/Up) 5.1x 2.4x 12.5x $1,016 $0.182 $3.89 19.0x 2.8x
Dividend Yield 1.2% 1.2%

22
Valuation implies big EV/replacement cost
Source: Company filings, press, proprietary estimates, primary research.
LW is trading at 2.0-3.0x the replacement cost of its assets
➢ LW has ~5.9bn lbs./year of processing capacity (~6.2bn after 4Q19E Hermiston, OR expansion)
➢ New capacity CapEx is $0.75-0.85/lb. based on recent/planned industry additions
$4,720 $4,960
$12,301 $12,301
$0
$2,000
$4,000
$6,000
$8,000
$10,000
$12,000
$14,000
Current Post-Hermiston (4Q19)
Replacement Cost of LW Assets
Replacement Cost of LW excl. JVs Current EV of Core LW

23
Where could this hypothesis be wrong?
➢ NT mark-to-market risk: LW has a good 4Q19E print in 7/2019 and guides for strong FY20 (negotiations for next year’s pricing conclude in the fall) and the multiple re-rates up as bulls argue a strong guide invalidates the bear case
➢ Processors shutter existing capacity or new supply is delayed/phased in slowly, and the industry proves to be a “rational” oligopoly
▪ Have not observed or discovered intent to shutter capacity in primary research, but can track it
▪ Note industry maintenance tends to take 1-2 months, so if incumbents take down existing lines to upgrade them it would be temporary and upgraded lines allow for capacity creep
▪ If per-unit margins improve as capacity ramps up, it will be a signal to exit as the thesis would be broken
➢ Europe export demand is strong and offsets supply in near-term and bull view on demand is proven correct
▪ Export data so far suggests this is not materializing; can track via USA/EU export and World Potato Market data
➢ LW currently has 3.0x net leverage on consensus FY19E EBITDA vs. a stated target ratio of 3.5-4.0x
▪ LW could lever-up and repurchase 5-6% of its S/O or engage in potentially accretive M&A (KHC is rumored to be selling its Ore-Ida business)…if the short thesis proves correct LW would be levering up on peak-margins
➢ Buyout by struggling CPG company
▪ Assuming a 20% premium, an acquiror would generate a ~5% unlevered ROIC (including full synergies equal to 7% of sales on top of what may be peak-margins, which is aggressive) – share price likely needs to drop quite a bit before an acquisition would generate an attractive enough ROIC to make sense – still, always a possible risk
Source: Company filings, press, proprietary estimates, primary research, USDA, World Potato Market.

24
Potato processor boom/bust?
➢ Big pricing spike
➢ Above-normal profits achieved by incumbents
➢ Observable supply response
➢ Sell-side forecasts linearly and extrapolates recent history
Asset bubble checklist
1
2
3
4
✓
✓
✓
✓