Antisense oligonucleotide–mediated MDM4 exon 6 … Rambow, 1,2 Mark Fiers,2 Aljosja Rogiers,...
17
The Journal of Clinical Investigation RESEARCH ARTICLE 68 jci.org Volume 126 Number 1 January 2016 Introduction The MDM2-related protein MDM4 contributes to p53 inactiva- tion during embryonic development (1). In contrast to MDM2, however, MDM4 is only expressed at low or undetectable levels in most adult tissues (2) and is largely dispensable for adult tissue homeostasis (3–6). Therefore, whereas MDM2 functions in both proliferating and terminally differentiated cells, MDM4 assists MDM2 in suppressing p53 only in highly proliferating cells such as those found during embryonic development or in the prolifer- ative compartment of the intestinal epithelium (7). Consistently, MDM4 is expressed in the highly proliferating murine embryonic stem cells (mESCs), and its expression decreases upon retinoic acid–induced (RA-induced) differentiation (8). MDM4 expression is often increased in cancer cells as one mechanism to inhibit p53-mediated tumor suppression. MDM4 mRNA expression is elevated in a substantial fraction of human tumors such as stomach and small intestine cancers (43%), glioblastomas (8%), colorectal cancers (20%), and breast can- cers (20%) (9–12). The mechanism(s) that promote MDM4 expression in human tumors are not fully understood but are of great interest as potential therapeutic targets. One such mech- anism is gene amplification, occurring, for instance, in a small fraction of breast cancers (9). We recently demonstrated that MDM4 protein, but not mRNA, levels are elevated in approxi- mately 65% of cutaneous melanomas (13). This observation indi- cates that posttranscriptional mechanisms can also contribute to increased MDM4 expression in a subset of cancers. Importantly, it also raises the possibility that we have thus far underestimated the frequency of MDM4-expressing cancers, as most studies have focused on reporting MDM4 gene copy number variations and total mRNA levels. Our recent study established a causative link between MDM4 overexpression and melanoma formation in vivo and, impor- MDM4 is a promising target for cancer therapy, as it is undetectable in most normal adult tissues but often upregulated in cancer cells to dampen p53 tumor-suppressor function. The mechanisms that underlie MDM4 upregulation in cancer cells are largely unknown. Here, we have shown that this key oncogenic event mainly depends on a specific alternative splicing switch. We determined that while a nonsense-mediated, decay-targeted isoform of MDM4 (MDM4-S) is produced in normal adult tissues as a result of exon 6 skipping, enhanced exon 6 inclusion leads to expression of full-length MDM4 in a large number of human cancers. Although this alternative splicing event is likely regulated by multiple splicing factors, we identified the SRSF3 oncoprotein as a key enhancer of exon 6 inclusion. In multiple human melanoma cell lines and in melanoma patient– derived xenograft (PDX) mouse models, antisense oligonucleotide–mediated (ASO-mediated) skipping of exon 6 decreased MDM4 abundance, inhibited melanoma growth, and enhanced sensitivity to MAPK-targeting therapeutics. Additionally, ASO-based MDM4 targeting reduced diffuse large B cell lymphoma PDX growth. As full-length MDM4 is enhanced in multiple human tumors, our data indicate that this strategy is applicable to a wide range of tumor types. We conclude that enhanced MDM4 exon 6 inclusion is a common oncogenic event and has potential as a clinically compatible therapeutic target. Antisense oligonucleotide–mediated MDM4 exon 6 skipping impairs tumor growth Michael Dewaele, 1,2 Tommaso Tabaglio, 3,4 Karen Willekens, 1,2 Marco Bezzi, 3,4 Shun Xie Teo, 3 Diana H.P. Low, 3 Cheryl M. Koh, 3 Florian Rambow, 1,2 Mark Fiers, 2 Aljosja Rogiers, 1,2 Enrico Radaelli, 5 Muthafar Al-Haddawi, 6 Soo Yong Tan, 6,7 Els Hermans, 8 Frederic Amant, 8,9 Hualong Yan, 10 Manikandan Lakshmanan, 11 Ratnacaram Chandrahas Koumar, 11 Soon Thye Lim, 12 Frederick A. Derheimer, 13 Robert M. Campbell, 13 Zahid Bonday, 13 Vinay Tergaonkar, 11 Mark Shackleton, 14 Christine Blattner, 10 Jean-Christophe Marine, 1,2 and Ernesto Guccione 3,4 1 Laboratory for Molecular Cancer Biology, VIB Center for the Biology of Disease, KU Leuven, Leuven, Belgium. 2 Laboratory for Molecular Cancer Biology, Department of Human Genetics, KU Leuven, Leuven, Belgium. 3 Division of Cancer Genetics and Therapeutics, Laboratory of Methyltransferases in Development and Disease, Institute of Molecular and Cell Biology (IMCB), A*STAR (Agency for Science, Technology and Research), Singapore. 4 Department of Biochemistry, Yong Loo Lin School of Medicine, National University of Singapore, Singapore. 5 Mouse Histopathology Core Facility, VIB Center for the Biology of Disease, KU Leuven, Leuven, Belgium. 6 Advanced Molecular Pathology Laboratory, IMCB, Singapore. 7 Department of Pathology, Singapore General Hospital, Singapore. 8 Gynaecologische Oncologie, UZ Leuven, Leuven, Belgium. 9 Centre for Gynecologic Oncology Amsterdam (CGOA), Antoni Van Leeuwenhoek – Netherlands Cancer Institute, Amsterdam, Netherlands. 10 Karlsruhe Institute of Technology, Institute of Toxicology and Genetics, Karlsruhe, Germany. 11 Mouse Models of Human Cancer Unit, IMCB, Proteos, Singapore. 12 Department of Medical Oncology, National Cancer Centre Singapore, Singapore. 13 Lilly Research Laboratories, Eli Lilly and Company, Indianapolis, Indiana, USA. 14 Melanoma Research Laboratory, Peter MacCallum Cancer Centre, East Melbourne, Australia. Authorship note: Michael Dewaele, Tommaso Tabaglio, Karen Willekens, and Marco Bezzi are co–first authors and contributed equally to this work. Jean-Christophe Marine and Ernesto Guccione are co–senior authors and contributed equally to this work. Conflict of interest: The authors have declared that no conflict of interest exists. Submitted: April 28, 2015; Accepted: October 9, 2015. Reference information: J Clin Invest. 2016;126(1):68–84. doi:10.1172/JCI82534. Downloaded from http://www.jci.org on September 20, 2016. http://dx.doi.org/10.1172/JCI82534
Transcript of Antisense oligonucleotide–mediated MDM4 exon 6 … Rambow, 1,2 Mark Fiers,2 Aljosja Rogiers,...

The Journal of Clinical Investigation R e s e a R c h a R t i c l e
6 8 jci.org Volume 126 Number 1 January 2016
IntroductionThe MDM2-related protein MDM4 contributes to p53 inactiva-tion during embryonic development (1). In contrast to MDM2, however, MDM4 is only expressed at low or undetectable levels in most adult tissues (2) and is largely dispensable for adult tissue homeostasis (3–6). Therefore, whereas MDM2 functions in both proliferating and terminally differentiated cells, MDM4 assists MDM2 in suppressing p53 only in highly proliferating cells such as those found during embryonic development or in the prolifer-ative compartment of the intestinal epithelium (7). Consistently, MDM4 is expressed in the highly proliferating murine embryonic stem cells (mESCs), and its expression decreases upon retinoic acid–induced (RA-induced) differentiation (8).
MDM4 expression is often increased in cancer cells as one mechanism to inhibit p53-mediated tumor suppression. MDM4 mRNA expression is elevated in a substantial fraction of human tumors such as stomach and small intestine cancers (43%), glioblastomas (8%), colorectal cancers (20%), and breast can-cers (20%) (9–12). The mechanism(s) that promote MDM4 expression in human tumors are not fully understood but are of great interest as potential therapeutic targets. One such mech-anism is gene amplification, occurring, for instance, in a small fraction of breast cancers (9). We recently demonstrated that MDM4 protein, but not mRNA, levels are elevated in approxi-mately 65% of cutaneous melanomas (13). This observation indi-cates that posttranscriptional mechanisms can also contribute to increased MDM4 expression in a subset of cancers. Importantly, it also raises the possibility that we have thus far underestimated the frequency of MDM4-expressing cancers, as most studies have focused on reporting MDM4 gene copy number variations and total mRNA levels.
Our recent study established a causative link between MDM4 overexpression and melanoma formation in vivo and, impor-
MDM4 is a promising target for cancer therapy, as it is undetectable in most normal adult tissues but often upregulated in cancer cells to dampen p53 tumor-suppressor function. The mechanisms that underlie MDM4 upregulation in cancer cells are largely unknown. Here, we have shown that this key oncogenic event mainly depends on a specific alternative splicing switch. We determined that while a nonsense-mediated, decay-targeted isoform of MDM4 (MDM4-S) is produced in normal adult tissues as a result of exon 6 skipping, enhanced exon 6 inclusion leads to expression of full-length MDM4 in a large number of human cancers. Although this alternative splicing event is likely regulated by multiple splicing factors, we identified the SRSF3 oncoprotein as a key enhancer of exon 6 inclusion. In multiple human melanoma cell lines and in melanoma patient–derived xenograft (PDX) mouse models, antisense oligonucleotide–mediated (ASO-mediated) skipping of exon 6 decreased MDM4 abundance, inhibited melanoma growth, and enhanced sensitivity to MAPK-targeting therapeutics. Additionally, ASO-based MDM4 targeting reduced diffuse large B cell lymphoma PDX growth. As full-length MDM4 is enhanced in multiple human tumors, our data indicate that this strategy is applicable to a wide range of tumor types. We conclude that enhanced MDM4 exon 6 inclusion is a common oncogenic event and has potential as a clinically compatible therapeutic target.
Antisense oligonucleotide–mediated MDM4 exon 6 skipping impairs tumor growthMichael Dewaele,1,2 Tommaso Tabaglio,3,4 Karen Willekens,1,2 Marco Bezzi,3,4 Shun Xie Teo,3 Diana H.P. Low,3 Cheryl M. Koh,3 Florian Rambow,1,2 Mark Fiers,2 Aljosja Rogiers,1,2 Enrico Radaelli,5 Muthafar Al-Haddawi,6 Soo Yong Tan,6,7 Els Hermans,8 Frederic Amant,8,9 Hualong Yan,10 Manikandan Lakshmanan,11 Ratnacaram Chandrahas Koumar,11 Soon Thye Lim,12 Frederick A. Derheimer,13 Robert M. Campbell,13 Zahid Bonday,13 Vinay Tergaonkar,11 Mark Shackleton,14 Christine Blattner,10 Jean-Christophe Marine,1,2 and Ernesto Guccione3,4
1Laboratory for Molecular Cancer Biology, VIB Center for the Biology of Disease, KU Leuven, Leuven, Belgium. 2Laboratory for Molecular Cancer Biology, Department of Human Genetics, KU Leuven,
Leuven, Belgium. 3Division of Cancer Genetics and Therapeutics, Laboratory of Methyltransferases in Development and Disease, Institute of Molecular and Cell Biology (IMCB), A*STAR (Agency for Science,
Technology and Research), Singapore. 4Department of Biochemistry, Yong Loo Lin School of Medicine, National University of Singapore, Singapore. 5Mouse Histopathology Core Facility, VIB Center
for the Biology of Disease, KU Leuven, Leuven, Belgium. 6Advanced Molecular Pathology Laboratory, IMCB, Singapore. 7Department of Pathology, Singapore General Hospital, Singapore. 8Gynaecologische Oncologie, UZ Leuven, Leuven, Belgium. 9Centre for Gynecologic Oncology Amsterdam (CGOA), Antoni Van Leeuwenhoek – Netherlands Cancer Institute, Amsterdam, Netherlands. 10Karlsruhe Institute of Technology, Institute of Toxicology and Genetics, Karlsruhe, Germany. 11Mouse Models of Human Cancer Unit, IMCB, Proteos, Singapore. 12Department of Medical Oncology,
National Cancer Centre Singapore, Singapore. 13Lilly Research Laboratories, Eli Lilly and Company, Indianapolis, Indiana, USA. 14Melanoma Research Laboratory,
Peter MacCallum Cancer Centre, East Melbourne, Australia.
Authorship note: Michael Dewaele, Tommaso Tabaglio, Karen Willekens, and Marco Bezzi are co–first authors and contributed equally to this work. Jean-Christophe Marine and Ernesto Guccione are co–senior authors and contributed equally to this work.Conflict of interest: The authors have declared that no conflict of interest exists.Submitted: April 28, 2015; Accepted: October 9, 2015.Reference information: J Clin Invest. 2016;126(1):68–84. doi:10.1172/JCI82534.
Downloaded from http://www.jci.org on September 20, 2016. http://dx.doi.org/10.1172/JCI82534

The Journal of Clinical Investigation R e s e a R c h a R t i c l e
6 9jci.org Volume 126 Number 1 January 2016
resents a unique therapeutic opportunity to reactivate suppressed p53 function in the context of antimelanoma combination therapy.
Unfortunately, small molecules that selectively and efficiently disrupt the MDM4-p53 complexes have so far not been identified or introduced into the clinic. Moreover, an increasing body of evi-dence has shown that MDM4 possesses p53-independent onco-genic functions (2, 18–21). Consistently, in addition to inducing p53-dependent apoptosis, MDM4 silencing in melanoma cells also caused cell-cycle arrest that could not be rescued upon concomi-tant inactivation of p53 (13). Inhibition of melanoma growth upon MDM4 knockdown (KD) was more prominent than that seen upon inhibition of the MDM4-p53 interaction and could also be observed in some mutant p53 melanoma cells. These data point to p53-inde-pendent mechanisms of MDM4 oncogenicity in melanoma, in addition to the well-known ability of MDM4 to suppress p53.
Alternative splicing (AS) is one mechanism that modulates gene expression by adding or removing protein domains, affect-ing protein activity, or altering the stability of the mRNA tran-scripts (22, 23). Interestingly, the abundance of MDM4 protein in ESCs decreases upon exposure to DNA-damaging agents, and
tantly, underlined the addiction of melanoma cells to high levels of MDM4. MDM4 silencing decreased melanoma growth, and this was at least partly a consequence of increased p53-dependent apoptosis. Consistently, targeting the physical interaction between MDM4 and p53 using SAH-p53-8, a small cell–penetrating stapled α-helical peptide, was sufficient to induce p53-dependent apopto-sis in melanoma cells (13).
Although targeted therapy with BRAF-selective inhibitors such as vemurafenib has recently yielded impressive antitumor responses in melanoma patients carrying BRAFV600E mutations (14, 15), drug resistance is typically acquired within 12 months (16). Relapses can be postponed, but usually not avoided, when vemu-rafenib is combined with a selective MEK1/MEK2 inhibitor such as cobimetinib (17). Overcoming resistance to targeted therapies is likely to require targeting of multiple oncogenic mechanisms. Importantly, SAH-p53-8 sensitized melanoma cells to conven-tional chemotherapeutics and to inhibition of BRAFV600E by vemurafenib and inhibited growth of BRAFV600E-mutant mela-noma cells that acquired resistance to BRAFV600E inhibitors (13). These data indicate that targeting the MDM4-p53 interaction rep-
Figure 1. Unproductive splicing of Mdm4 leads to reduced protein abundance in most normal adult tissues and differen-tiated ESCs. (A and B) qPCR analyses of Mdm4-FL and Mdm4-S isoforms in mouse embryonic (E14.5) and adult tissues (A) and in mESCs exposed to RA (B). Quan-tification of the PSI index using a SYBR Green–based qPCR in the various samples is shown in the top panels. Immunoblot analysis of MDM4 expression levels in the same samples is shown in the lower panels. Anti-GAPDH immunoblotting was used as a loading control. (C) Correlation plot between the PSI index (defined as the percentage of full-length Mdm4 mRNA (Mdm4-FL), which includes exon 7, over the total of all isoforms [Mdm4-FL/(Mdm4-FL + Mdm4-S)] and MDM4 protein abundance, normalized for the protein loading control in mESCs upon RA-induced differentiation.
Downloaded from http://www.jci.org on September 20, 2016. http://dx.doi.org/10.1172/JCI82534

The Journal of Clinical Investigation R e s e a R c h a R t i c l e
7 0 jci.org Volume 126 Number 1 January 2016
promoting agent RA (8). The mechanism underlying this decrease has not been elucidated. Interestingly, we found that, whereas total Mdm4 mRNA levels remained by and large unaffected, the PSI index paralleled the decrease in MDM4 protein levels induced by the RA treatment (Figure 1, B and C, and data not shown). These data indicate that MDM4 protein levels are also under the control of a switch in exon 7 splicing under these experimental conditions.
Enhanced exon 6 inclusion leads to MDM4 expression in human melanoma. We next reasoned that high levels of MDM4 protein expression in cancer cells may be due, at least in part, to their ability to revert the balance between skipping and inclusion of exon 6. Consistently, in silico analysis of RNA-sequencing (RNA-seq) data from skin cutaneous melanoma (SKCM) samples (from The Cancer Genome Atlas [TCGA]) provides evidence that the full-length, protein-coding transcript is produced in the major-ity of these samples. Two additional MDM4 isoforms were also detected, among which MDM4-S is by far the most abundant (Figure 2A). Previous data indicate that approximately 65% of cutaneous melanomas express high MDM4 protein levels (13). Given that 65% of TCGA melanoma cohort (for which RNA-seq data are available) exhibit a PSI index above 0.4, we set this value as the cut point, dividing samples into MDM4 expressers and nonexpressers (Figure 2B). Notably, the frequency of p53-inacti-vating missense mutations (28) was lower in samples predicted to express MDM4 (4.6%) than in the nonexpresser samples (9.3%). This is consistent with previous observations that a low PSI index is associated with inactivating p53 mutations or MDM2 overex-pression (29). However, this also indicates the presence in some cancers of p53-inactivating mutations in MDM4-expressing sam-ples, an observation that is consistent with the p53-independent oncogenic functions of MDM4.
We next measured the extent of exon 6 inclusion in several human melanoma cell lines (Figure 2C). In agreement with our prediction, melanoma cell lines (n = 10) with a PSI index below 0.4 expressed very low to undetectable levels of MDM4 (Figure 2C). As expected, no correlation between total MDM4 mRNA levels and protein abundance was observed, while a striking correlation was observed between the PSI index and MDM4 protein abun-dance (Figure 2, C and D). To further substantiate the above find-ings, we quantified the PSI index and protein abundance in short-term melanoma cultures and freshly isolated melanoma clinical samples (n = 20; Figure 2, E and F). Again, we observed a clear cor-relation between the PSI index and MDM4 protein levels (Supple-mental Figure 2, A and B). Moreover, in agreement with the above prediction, samples with a PSI index below 0.4 expressed very low to undetectable levels of MDM4 (Figure 2, E and F).
Taken together, these data indicate that regulation of exon 6 inclusion is a critical determinant of mammalian MDM4 protein abundance in both normal tissues and tumor cells. This raises the intriguing possibility that alternative splicing is one key mecha-nism through which MDM4 is upregulated to buffer p53 in highly proliferative embryonic tissues and cancer cells. The data also indicate that the PSI index is a good predictor of MDM4 protein abundance in melanoma.
SRSF3 is required for efficient inclusion of MDM4 exon 6. In order to identify regulators of MDM4 exon 6 splicing, we mined available RNA high-throughput sequencing data isolated by cross-linking
this downregulation is at least partly due to AS. For example, a decrease in the rate of splicing of two “detained” introns flank-ing exon 6 and subsequent nuclear retention of the unspliced transcript was shown to downregulate MDM4 (24). In addition, we previously demonstrated that defects in constitutive splicing efficiency decrease Mdm4 exon 6 inclusion, leading to the pro-duction of an unstable transcript known as Mdm4-S (lacking exon 6 in humans or exon 7 in mice), which contains a premature ter-mination codon (25) and is targeted for nonsense-mediated decay (NMD) (26). Finally, homozygous mouse embryos engineered to skip Mdm4 exon 7 die in utero, just like Mdm4-null embryos, as a result of ectopic p53 activation (27). These data raise the pos-sibility that human MDM4 exon 6/mouse exon 7 functions as an “NMD switch” exon (24) and that regulation of this splicing event may directly impact MDM4 protein expression levels.
Accordingly, we demonstrate herein that AS of exon 6 is the main posttranscriptional regulator of MDM4 protein abundance in both physiological conditions and cancer. Moreover, we pro-pose an alternative therapeutic approach to MDM4 targeting that is based on the use of antisense oligonucleotides (ASOs) that reduce MDM4 protein abundance rather than its ability to interact with p53. We provide evidence that this clinically compatible strat-egy has robust antitumor effects and is applicable to a wide range of human tumors.
ResultsMdm4 is unproductively spliced in most normal adult tissues and in differentiated ESCs. To test whether AS contributes to the regula-tion of MDM4 protein abundance in physiological conditions, we measured the extent of exon 7 inclusion (corresponding to exon 6 in humans) in embryonic and various normal mouse adult tissues. In order to accurately do this, we developed quantitative PCR–based (qPCR-based) methods, which are illustrated in Supplemental Fig-ure 1, A and B; supplemental material available online with this article; doi:10.1172/JCI82534DS1. As expected, whereas MDM4 protein was detectable in embryonic tissues, it was undetectable in most adult tissues, except brain, thymus, and colon (2). Remark-ably, this decrease in MDM4 protein expression was accompanied by a reduced percentage spliced in (PSI), defined as the percentage of full-length Mdm4 mRNA (Mdm4-FL) over the total of all iso-forms [Mdm4-FL/(Mdm4-FL + Mdm4-S)] (Figure 1A and Supple-mental Figure 1C). Thus, compared with embryonic tissues, there was a clear decrease in MDM4 protein levels in most normal adult tissues, and this decrease was, by and large, associated with a con-comitant increase in Mdm4-S expression. These data indicate that low levels of MDM4 expression in most adult tissues are a conse-quence of inefficient exon 7 inclusion. Note that this correlation is not perfect; indeed, although the PSI index was relatively high in liver, MDM4 protein was not detectable. This observation indicates that, in a minority of cases, other posttranscriptional (mRNA sta-bility, export, or translation rates) or posttranslational events may also contribute to the regulation of MDM4 protein abundance. In addition, the predictive value of the PSI index is especially lim-ited in normal tissues because of the extensive degradation of the Mdm4-S isoform by the NMD machinery (26).
MDM4 protein is highly expressed in mESCs, and its expres-sion drastically declines upon exposure to the differentiation-
Downloaded from http://www.jci.org on September 20, 2016. http://dx.doi.org/10.1172/JCI82534

The Journal of Clinical Investigation R e s e a R c h a R t i c l e
7 1jci.org Volume 126 Number 1 January 2016
Figure 2. Enhanced exon 6 inclusion leads to MDM4 expression in human melanoma. (A) Arches represent the relative exon-exon junction usage that was averaged among TCGA-SKCM melanoma samples and inferred from RNA-seq data. Among all previously identified MDM4 isoforms (NCBI’s RefSeq database), MDM4-FL in blue and MDM4-S in red were by far the most abundant. MDM4-A (lacking exon 9, NM_001204171) in green was also detected, but in negligible amounts. The other NCBI-annotated isoforms were not detectable. Chr., chromosome. (B) The PSI index for all TCGA SKCM tumor samples were calculated, sorted, and plotted. A cutoff at the top 65% fraction shows a PSI MDM4 value of 0.4. Red triangles indicate samples with a confirmed p53- inactivating mutation according to Kato et al. (28). (C, E, and F) Semi-quantitative and SYBR Green–based qPCR analyses of total MDM4, MDM4-FL, and MDM4-S isoforms in cultured melanoma cells (C), in a series of short-term melanoma cultures (E), and in melanoma clinical samples (F). GAPDH levels were used as a loading control. Quantification of the PSI index is shown in the top panels. Immunoblot analysis of MDM4 expression levels is shown in the lower panels. Anti-tubulin and anti-actin immunoblotting were used as loading controls. *, denotes TP53-mutant melanoma lesions. (D) Correlation plot between the PSI index and MDM4 protein abundance, normalized to the protein loading control, in melanoma cell lines.
Downloaded from http://www.jci.org on September 20, 2016. http://dx.doi.org/10.1172/JCI82534

The Journal of Clinical Investigation R e s e a R c h a R t i c l e
7 2 jci.org Volume 126 Number 1 January 2016
activation of p53. This was consistently accompanied by a decrease in melanoma growth and survival. However, since SRSF3 targets multiple pro-oncogenic splicing events (36), this effect is unlikely to be caused solely by a decrease in MDM4 exon 6 inclusion.
ASO-mediated exon 6 skipping efficiently decreases MDM4 abundance and melanoma growth. In order to more specifically target exon 6 inclusion, we designed a splice-switching morpho-lino ASO flanking the exon-intron boundaries of exon 6 (ASO MDM4) and overlapping with one of the SRSF3-binding sites (Fig-ure 3B). Transfection of a series of MDM4-expressing melanoma cell lines and short-term cultures with ASO MDM4, but not with a nontargeting/scrambled ASO control, led to efficient exon 6 skipping and a subsequent decrease in MDM4 protein abundance (Figure 4, A and B). Notably, the exon-skipping event was stable up to 8 days after transfection (Supplemental Figure 4A). ASO- induced exon 6 skipping unleashed p53 activity, as evidenced by an increase in expression of its well-established target genes p21 and MDM2 (Figure 4A). Accordingly, ASO MDM4 decreased the ability of TP53 WT melanoma cultures to grow in vitro (Figure 4B and Supplemental Figure 4B). Interestingly, the TP53 L194R- mutant melanoma line MM087 also exhibited reduced colony for-mation upon exposure to ASO MDM4. This result is in line with the recent notion that MDM4 may possess, at least in some spe-cific context, p53-independent oncogenic activities.
Although we selected a morpholino backbone for our in vitro and subsequent in vivo studies, we also tested an alternative back-bone chemistry, given the recent successes of phosphorothioate backbone ASOs in the clinic (39). As previously demonstrated for other targets (40), the induction of MDM4 exon 6 skipping is not dependent on the chemistry of the ASO, but rather on the position of its targeting sequence, as the most efficient 2-OMe/phosphoro-thioate backbone ASOs target the 5′-donor site and overlap with an SRSF3-binding site, similarly to what was observed with the morpholino ASO MDM4 (Supplemental Figure 4C).
An increasing body of evidence has shown that MDM4 also possesses p53-independent oncogenic functions (2, 18–21). Since ASO-mediated exon 6 skipping directly affects MDM4 abun-dance, and not its ability to interact with p53, this approach is expected to also have an impact on the growth of MDM4-express-ing, TP53-mutant melanoma cells. Accordingly, growth of the short-term melanoma cultures from patient sample MM087 was substantially reduced when exposed to the exon 6–targeting ASO (Figure 4B and Supplemental Figure 4B).
ASO-mediated MDM4 exon 6 skipping decreases melanoma growth in vivo. Together, the above data indicate that ASO-medi-ated exon 6 skipping is a promising anti-melanoma therapeu-tic strategy. To test the in vivo applicability of this approach, we established patient-derived xenograft (PDX) models of melanoma and selected three of these models (MEL002, MEL010, and MEL006) for further experiments on the basis of their detectable levels of MDM4 protein expression (data not shown and Figure 5B); additional clinical data regarding these patients are provided in Supplemental Table 1. When tumors reached an average vol-ume of 150 to 200 mm3, the MEL002 cohorts were treated with the MDM4 ASO (or scrambled control) that was covalently linked to a delivery moiety composed of an octa-guanidine dendrimer (“vivo morpholino”) by intratumoral (i.t.) injections every 2 days.
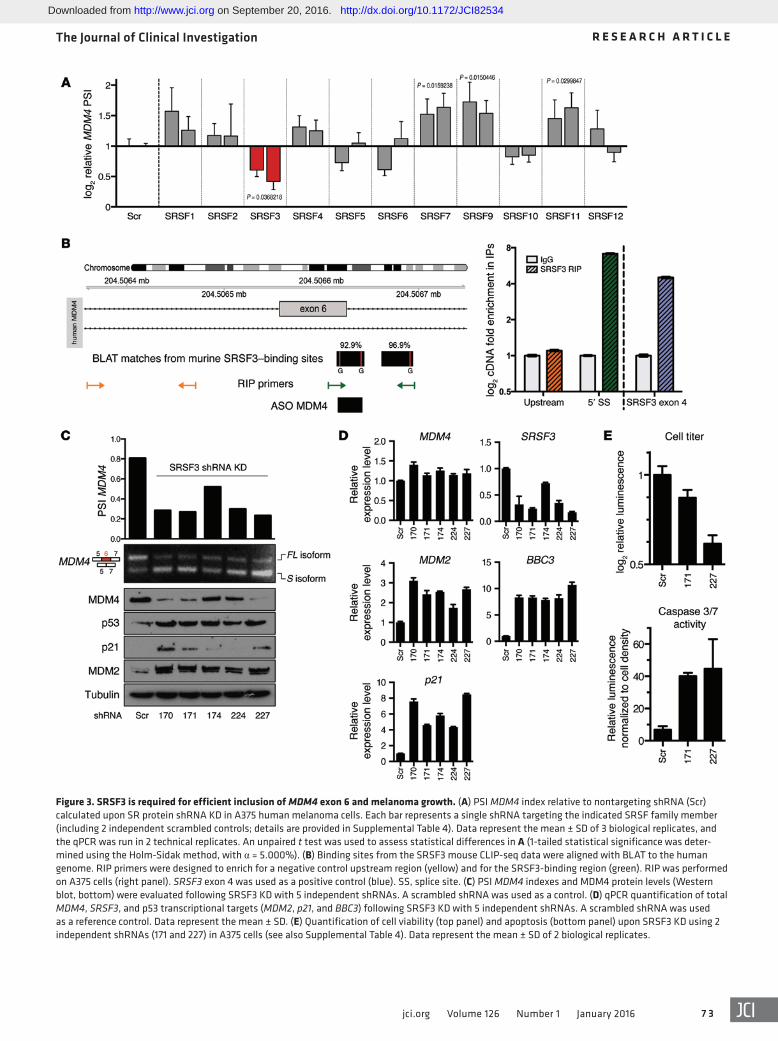
immunoprecipitation (HITS- and PAR-CLIP) data sets (30–35). Four members of the SR family were identified as putative reg-ulators of this splicing event in mouse cells (Supplemental Fig-ure 3A). Since the genomic region surrounding human exon 6 is highly conserved in vertebrates (see the phyloP conservation plot in Supplemental Figure 3A), we set out to test whether this family of splicing factors modulates exon 6 inclusion in human cells. We depleted SRSF1–12 individually with shRNAs in A375 melanoma cells and quantified the PSI index (Figure 3A). Strikingly, depletion of SRSF3 robustly induced MDM4 exon 6 skipping. In contrast, KD of SRSF7, SRSF9, and SRSF11 unexpectedly increased the inclusion of exon 6. These data indicate that alternative splicing of MDM4 is highly regulated by multiple splicing factors, which we predict allow integration of multiple upstream regulatory signals.
Consistent with its putative ability to promote MDM4 exon 6 inclusion, SRSF3 is a well-established oncogene (36). SRSF3 also autoregulates its expression by modulating the inclusion of its own exon 4 (30). As described above, a striking correlation between the PSI index and MDM4 protein abundance was observed in a series of short-term melanoma cultures (Figure 2E). In keeping with SRSF3 being a modulator of MDM4 AS, high SRSF3 activ-ity, determined by the extent of autoregulatory inclusion of exon 4, correlated with high MDM4 protein expression levels in these samples (Supplemental Figure 3B).
We further validated the direct binding of human SRSF3 to MDM4 by RNA immunoprecipitation (RIP) (ref. 30 and Figure 3B) and critically demonstrated that SRSF3 silencing, using 5 indepen-dent shRNA hairpins, led to a significant decrease in exon 6 inclu-sion and a concomitant decrease in MDM4 protein levels (Figure 3C). The MDM4 downregulation we observed upon SRSF3 KD was accompanied by a robust activation of the p53 pathway, as evi-denced by an increase in expression of some of its well-established target genes, including p21, MDM2 and BBC3 (or PUMA), at the mRNA and/or protein levels (Figure 3, C and D). We also observed a robust decrease in the growth and induction of apoptotic cell death in the SRSF3-KD cells (Figure 3E)
Notably, overexpression of SRSF3 alone was not sufficient to increase inclusion of exon 6 significantly (Supplemental Figure 3C). Additional splicing enhancers may therefore also contribute to and/or assist SRSF3 in promoting inclusion of this exon.
Nevertheless, the observation that SRSF3 silencing caused a decrease in exon 6 inclusion is consistent with our previous find-ings that inhibition of the CLK SR protein kinases by the small molecule TG003 (37) resulted in a similar decrease in MDM4 pro-tein abundance in both mouse neural stem cells and progenitors and in several other human cancer cell lines (26). In keeping with these findings, TG003 led to similar effects in melanoma cell lines (Supplemental Figure 3D) and reduced their survival rates (Supple-mental Figure 3E). Interestingly, TG003 sensitized BRAFV600E- mutant melanoma cells to the BRAFV600E inhibitor vemurafenib (PLX4032) (Supplemental Figure 3F). Moreover, while TG003 reduced the PSI index (Supplemental Figure 3G) and cell survival (Supplemental Figure 3H), it concomitantly induced p53 tran-scriptional activity (Supplemental Figure 3I) in both vemurafenib- sensitive (M249) and -resistant (M249R) cell lines (38).
In aggregate, pharmacological and genetic inactivation of SRSF3 compromised MDM4 exon 6 inclusion, thereby leading to
Downloaded from http://www.jci.org on September 20, 2016. http://dx.doi.org/10.1172/JCI82534
The Journal of Clinical Investigation R e s e a R c h a R t i c l e
7 3jci.org Volume 126 Number 1 January 2016
Figure 3. SRSF3 is required for efficient inclusion of MDM4 exon 6 and melanoma growth. (A) PSI MDM4 index relative to nontargeting shRNA (Scr) calculated upon SR protein shRNA KD in A375 human melanoma cells. Each bar represents a single shRNA targeting the indicated SRSF family member (including 2 independent scrambled controls; details are provided in Supplemental Table 4). Data represent the mean ± SD of 3 biological replicates, and the qPCR was run in 2 technical replicates. An unpaired t test was used to assess statistical differences in A (1-tailed statistical significance was deter-mined using the Holm-Sidak method, with α = 5.000%). (B) Binding sites from the SRSF3 mouse CLIP-seq data were aligned with BLAT to the human genome. RIP primers were designed to enrich for a negative control upstream region (yellow) and for the SRSF3-binding region (green). RIP was performed on A375 cells (right panel). SRSF3 exon 4 was used as a positive control (blue). SS, splice site. (C) PSI MDM4 indexes and MDM4 protein levels (Western blot, bottom) were evaluated following SRSF3 KD with 5 independent shRNAs. A scrambled shRNA was used as a control. (D) qPCR quantification of total MDM4, SRSF3, and p53 transcriptional targets (MDM2, p21, and BBC3) following SRSF3 KD with 5 independent shRNAs. A scrambled shRNA was used as a reference control. Data represent the mean ± SD. (E) Quantification of cell viability (top panel) and apoptosis (bottom panel) upon SRSF3 KD using 2 independent shRNAs (171 and 227) in A375 cells (see also Supplemental Table 4). Data represent the mean ± SD of 2 biological replicates.
Downloaded from http://www.jci.org on September 20, 2016. http://dx.doi.org/10.1172/JCI82534

The Journal of Clinical Investigation R e s e a R c h a R t i c l e
7 4 jci.org Volume 126 Number 1 January 2016
Tumor development was monitored in both cohorts for a period of 16 days. At the end of the experiments, tumors were dissected and processed for histological and biochemical analyses.
We observed a significant reduction in tumor growth in mela-noma samples exposed to the exon 6–targeting ASO (Figure 5A). Strikingly, whereas expression of the protein-coding isoform was predominant in all lesions exposed to the scrambled ASO, we observed a dramatic switch toward expression of the MDM4-S isoform in all melanoma samples exposed to the exon 6–targeting ASO (Figure 4D). This switch led to a robust decrease in MDM4 protein expression (Figure 5, A–D). Histological examination and IHC analyses attributed this effect on tumor growth to a significant decrease in cell proliferation, as evidenced by a striking decrease in Ki67-positive cells that was accompanied by an increase in apop-totic cell death (Figure 5, C and D). Concomitantly, loss of MDM4 protein with MDM4 ASO treatment stimulated p53-signaling with the upregulation of p53-activated genes like MDM2 and p21 and downregulation of p53-repressed genes like KIF23, CENPF, and MAD2L1 (Supplemental Figure 4D).
Furthermore, delivery of the MDM4 ASO by i.v. injections every 2 days also decreased tumor growth in yet another melanoma PDX model (MEL010; Figure 5E). In close proximity to blood ves-sels, this decrease was also accompanied by a measurable reduction in MDM4 protein expression levels, reduced cell proliferation, and an increase in apoptotic cell death (Figure 5, E and F).
Collectively, these data highlight the in vivo pharmacologic potential of this approach for the treatment of melanoma.
ASO-mediated MDM4 exon 6 skipping sensitizes melanoma to BRAFV600E inhibition. The management of intrinsic resistance to MAPK-targeting inhibitors is likely to be achieved through therapeutic modalities that simultaneously target multiple path-ways. Importantly, as targeting the MDM4-p53 interaction using a stapled peptide sensitizes melanoma cells to BRAFV600E inhi-bition (13), ASO-mediated exon 6 skipping increased the sensi-
tivity of cultured BRAFV600E-mutant melanoma cells to the BRAFV600E inhibitor vemurafenib (Figure 6A).
We extended this analysis by cotreating cohorts of MEL006, a BRAFV600E-mutant melanoma PDX model (Supplemental Table 1), with the BRAFV600E inhibitor dabrafenib daily and an i.t. injection of the MDM4 morpholino every other day for 14 days. Importantly, whereas tumor growth was only inhibited fol-lowing exposure to the BRAFV600E inhibitor dabrafenib alone, robust tumor regression was observed in the MEL006 PDX cohort treated with dabrafenib and the MDM4 ASO (Figure 6B), and this was at least partly due to a measurable increase in apoptotic cell death (Figure 6, C and D). Even more interesting, whereas mice acquired resistance to the BRAFV600E inhibitor within 20 days of exposure, 2 of 2 mice treated with the combination of dabrafenib and MDM4 ASO did not (Figure 6E). These observations raise the exciting possibility that ASO-mediated targeting of MDM4 might be a valid strategy to significantly delay — and/or possibly sup-press — acquisition of resistance to treatments with BRAFV600E inhibitors alone. Notably, dabrafenib-MDM4 ASO–treated mice did not suffer from weight loss during the course of the experi-ment in contrast to mice treated with a combination of dabrafenib and the MEK inhibitor trametinib (data not shown). Moreover, complete histopathological examination of mice exposed to the dabrafenib-MDM4 ASO combination did not reveal any relevant adverse events. In contrast, we observed that mice treated with the dabrafenib-trametinib combination suffered from the well-documented adverse events associated with this treatment in humans including severe renal lesions (41).
ASO-mediated MDM4 targeting is a therapeutic strategy appli-cable to several tumor types. Our estimation of the proportion of human tumors expressing MDM4 protein is primarily based on measurements performed at the total mRNA level (10, 11). In order to revise these numbers, and since we found that the PSI index is a much more reliable predictor of MDM4 protein levels
Figure 4. ASO-mediated exon 6 skipping decreases MDM4 protein abundance and melanoma growth in vitro. (A) Semi-qPCR analysis of total MDM4-FL and MDM4-S isoforms (with GAPDH as a control) in the A375 melanoma cells transfected with MDM4-targeting (ASO MDM4) and scrambled control ASOs. Lower panels show immunoblot analysis of expression levels of MDM4, p53, and the 2 well-established p53 targets MDM2 and p21. Anti-tubulin immu-noblotting was used to detect differences in sample loading. (B) Short-term cultures were transfected with MDM4-targeting and scrambled control ASOs, and colony formation was evaluated using low-density colony formation assays 10 days after seeding. For quantification of the colony formation assays, the data represent the mean percentage of area occupancy of 2 biological replicates (mean ± SD). Lower panel shows immunoblot analysis of MDM4 expression levels. Anti-actin immunoblotting was used to detect differences in sample loading. Right panel shows SYBR Green–based qPCR analysis of the PSI MDM4 index after transfection with ASOs. *, TP53-mutant melanoma lesions.
Downloaded from http://www.jci.org on September 20, 2016. http://dx.doi.org/10.1172/JCI82534

The Journal of Clinical Investigation R e s e a R c h a R t i c l e
7 5jci.org Volume 126 Number 1 January 2016
Figure 5. ASO-mediated exon 6 skipping decreases MDM4 protein abundance and melanoma growth in vivo. (A–F) Cohorts of PDX models of melanoma (MEL002 and MEL010) were established. When tumors reached an average volume of 100 mm3 (MEL002) or 150 mm2 (MEL010), cohorts were treated with the vivo MDM4 morpholino (or scrambled control) upon i.t. injections every 2 days (MEL002 i.t.) or i.v. tail vein injections every 2 days (MEL010 i.v.). Tumor development of MEL002 (A) and MEL010 (E) was monitored by caliper measurement for the indicated period. Data represent the mean ± SEM of the different biological replicates. A 2-way ANOVA was used to determine statistical significance in A and E. (B) ASO-mediated exon 6 skipping decreased MDM4 protein abundance in MEL002 lesions. Semi-quantitative analysis of MDM4-FL and MDM4-S isoforms in 12 dissected melanoma lesions exposed to the MDM4-targeting or scrambled control ASOs. Top panel shows SYBR Green–based qPCR of the PSI index in the various samples. Lower panel shows immunoblot analysis of MDM4 expression levels. Anti-actin immunoblotting was used to detect differences in sample loading. A reduction of MDM4 protein levels was confirmed by IHC staining on lesions exposed to the MDM4-targeting and scrambled control ASOs for MEL002 (C) and MEL010 (F). IHC was also performed for the apoptotic marker cleaved caspase 3 and the proliferative marker Ki67 in melanoma lesions exposed to the MDM4-targeting and scrambled control ASOs for MEL002 (C) and MEL010 (F). Scale bars: 100 μm. (D) Quantification (mean ± SD) of the IHC for the images shown in C. Three images from 2 different tumors were analyzed for each cohort.
Downloaded from http://www.jci.org on September 20, 2016. http://dx.doi.org/10.1172/JCI82534

The Journal of Clinical Investigation R e s e a R c h a R t i c l e
7 6 jci.org Volume 126 Number 1 January 2016
Downloaded from http://www.jci.org on September 20, 2016. http://dx.doi.org/10.1172/JCI82534

The Journal of Clinical Investigation R e s e a R c h a R t i c l e
7 7jci.org Volume 126 Number 1 January 2016
consistently observed a reduction in PSI indexes and MDM4 pro-tein levels in lesions exposed to ASO MDM4 (Figure 8C). This was accompanied by a significant decrease in cell proliferation (reduc-tion in KI67-positive cells) and an increase in apoptotic cell death (increase cleaved caspase 3 staining) (Figure 8D). Together, these data demonstrate that the MDM4-targeting, ASO-based therapeu-tic strategy is not only applicable to melanoma but may be a valid clinical approach to treat a wide range of tumor types.
DiscussionIdentification of mechanisms that promote expression of the MDM4 oncoprotein will accelerate the development of anti-MDM4–targeted therapies, which are predicted to be active against a wide range of human cancers. We describe herein an unanticipated and widespread role for an AS-based mechanism in driving MDM4 overexpression. We show that MDM4 exon 6 is an “NMD switch” exon that is skipped in most normal adult tis-sues, resulting in the production of a transcript that is degraded by NMD. In contrast, the coding splice isoform is produced in melanoma (and other cancer) cells as a result of enhanced exon 6 inclusion (Figure 9).
In nontransformed cells, the MDM4-S isoform is rapidly degraded (26). In cancer cells, however, the efficiency of the NMD pathway is often compromised (43, 44). Consistently, we found that MDM4-S was readily detectable in melanoma, and inhibition of NMD by cyclohexamide did not lead to a consistent increase in MDM4-S levels (data not shown). Importantly, previous evidence indicates that MDM4-S is inefficiently translated (26) and that the MDM4-S peptide is highly unstable (26, 27, 45). Together, these observations provide a rational explanation for our inability to detect the MDM4-S protein in melanoma or other cancers (data not shown and ref. 45).
Mechanistically, we show that, although several SR proteins (46) may participate in the regulation of MDM4 AS, SRSF3 is one key enhancer of exon 6 inclusion in melanoma cells. Consistent with this idea, SRSF3 is a well-established oncogene (36, 47). It is directly regulated at the transcriptional level by Wnt signaling (48), a pathway often upregulated in cancer (49). In turn, SRSF3 pro-motes several oncogenic AS events, such as exon 10 inclusion in the pyruvate kinase M gene, generating the PKM2 isoform, which promotes aerobic glycolysis in cancer cells (50). Our data there-fore identify what we believe to be a novel mechanism underlying SRSF3 oncogenic function, namely the regulation of MDM4 AS and, in turn, the suppression of p53 activity. Interestingly, SRSF3 may also directly affect p53 AS to suppress expression of the p53β isoform that promotes p53-mediated senescence (51).
Importantly, we observed a striking correlation between the PSI index and MDM4 protein abundance in the majority of the melanoma samples analyzed, indicating that the MDM4-splicing switch is one of the key mechanisms that accounts for the frequent overexpression of MDM4 in melanoma. Of note, the correlation between the PSI index and MDM4 protein abundance was not strict, as we identified few normal tissues (i.e., liver) and mela-noma samples (i.e., MM099) in which this correlation could not be established. This indicates that other mechanisms, either post-transcriptional or posttranslational, may also contribute to the reg-ulation of MDM4 expression in a small proportion of cases.
than total MDM4 mRNA in melanoma, we determined this ratio in hundreds of human tumors of different types using publicly available RNA-seq data sets (Figure 7A and Supplemental Fig-ure 5). Strikingly, we found that the PSI index was higher than 0.4 in 85% of the breast carcinoma (BRCA) samples (Figure 7A). The prediction from this analysis is that roughly 85% of human BRCA expresses MDM4 protein, which is in sharp contrast with the 20% deduced from mRNA measurements and in agreement with the broad MDM4 protein overexpression observed in breast cancer cell lines (42). A similar analysis predicts that MDM4 is expressed, for instance, in 57%, 62%, and 72% of ovarian serous cystadenocarcinomas (OV), head and neck squamous cell car-cinomas (HNSC), and colon adenomas (COAD), respectively (Figure 7A and Supplemental Figure 5). Importantly, the growth of non-melanoma MDM4–expressing TP53 WT cancer cell lines, such as the breast cancer cell line MCF7, the neuroblastoma cell line SK-N-SH, and the ovarian cancer cell line Tov21G, was strongly inhibited upon exposure to the MDM4 ASO (Figure 7B and Supplemental Figure 6).
To test whether ASO-mediated MDM4 targeting is a thera-peutic approach that is applicable to tumors other than melanoma in an in vivo context, we established a PDX model of diffuse, large B cell lymphoma (DLBCL; BCL13). Clinical data on the patients from whom the model was derived are provided in Supplemental Table 1. We first cultured primary DLBCL cells from this model and established that ASO MDM4 reduced the viability of the DLBCL cells in vitro (Figure 8A). When tumors reached an average volume of 150 to 200 mm3, we injected ASO MDM4 (or scrambled con-trol) i.t. every 2 days, and tumor development was monitored for a period of 20 days. At the end of the experiments, tumors were dis-sected and processed for histological and biochemical analyses.
We observed a significant reduction in tumor growth in DLBCL-bearing mice exposed to ASO MDM4 (Figure 8B), and we
Figure 6. ASO-mediated exon 6 skipping sensitizes melanoma cells to BRAFV600E inhibitors in vitro and in vivo. (A) A BRAFV600E-positive short-term culture (MM034) was transfected with MDM4-targeting and scrambled control ASOs, and colony formation was evaluated using low-density colony formation assays 10 days after seeding and exposure to 25 nM of the BRAFV600E inhibitor PLX4032. Right panel shows the quantification of the colony formation assays. Data are presented as the percentage of area occupied. (B–D) Cohorts of the PDX model of melanoma (MEL006) were established. When tumors reached an average volume of 200 mm3, they were subdivided into cohorts for various combinato-rial treatments. The mice were gavaged with dabrafenib or vehicle every day and injected i.t. with scrambled ASO or MDM4 ASO every other day. (B) Tumor development was monitored by caliper measurement for the indicated period. Data represent the mean ± SEM of the indicated biological replicates. A 2-way ANOVA was used to determine statistical significance in B. Red dotted line indicates the average starting volume of the tumors in the MDM4 ASO plus BRAFi cohort. (C) IHC for MDM4, the apoptotic marker cleaved caspase 3, and the proliferative marker Ki67 in melanoma lesions exposed to the combination treatment of ASO-based exon 6 skipping with BRAFi. Scale bar: 100 μm. (D) Quantification (mean ± SD) of the IHC for which representative images are shown in C. For each tumor, 3 slides were stained and counted. Both cohorts contained 4 different tumors each (n = 12 counted slides). (E) The PDX model MEL006 was treated with BRAFi alone (n = 1), BRAFi plus scrambled ASO (n = 1), or BRAFi plus MDM4 ASO (n = 2). Data represent the mean ± SD.
Downloaded from http://www.jci.org on September 20, 2016. http://dx.doi.org/10.1172/JCI82534

The Journal of Clinical Investigation R e s e a R c h a R t i c l e
7 8 jci.org Volume 126 Number 1 January 2016
Moreover, because this therapeutic approach targets MDM4 protein abundance rather than its interaction with p53, this approach can, in principle, also be used to target the recently described p53-independent oncogenic activities of MDM4 (Fig-ure 9). Accordingly, we show herein that targeting exon 6 inclusion decreases the growth of a TP53-mutant melanoma cell line that expresses detectable levels of MDM4 protein. Note, however, that cutaneous melanomas harboring mutant TP53 and expressing sig-nificant levels of the MDM4 protein are extremely rare (<3% of cases). The clinical relevance of this observation for patients with melanoma is therefore limited. However, our findings provide proof-of-concept evidence that, in theory, the therapeutic strategy described herein may be applicable to a broad spectrum of human tumors including those harboring p53 mutations.
Our current understanding of the proportion of human tumors expressing elevated MDM4 protein levels is primarily based on total mRNA quantification (10, 11). This approach has led, for instance, to the conclusion that MDM4 is expressed in approximately 20% of BRCAs (9). Our previous observation
Identification of this mechanism regulating MDM4 protein levels in cancer has important therapeutic implications. Restora-tion of the WT p53 tumor–suppressor function is an attractive and promising, yet extremely challenging, anticancer strategy. We and others had previously demonstrated that targeting the MDM4-p53 interaction represents a unique and safe therapeutic opportunity to reactivate suppressed WT p53 function. Unfortunately, small molecules (or stapled peptides) that selectively and efficiently dis-rupt the MDM4-p53 complexes have so far not been adequately developed for clinical testing. The strategy to target MDM4 AS described herein allows specific manipulation of MDM4 abun-dance rather than interactions with MDM4 partner proteins (Fig-ure 9). We show that this approach reactivated p53 function in TP53 WT melanoma cells and efficiently suppressed their growth in vitro and in vivo. Importantly, the MDM4 AS–targeting strategy is, in theory, not only applicable to melanoma but to any cancer that overexpresses MDM4. Accordingly, we show that the growth of cell lines of diverse origins (breast cancer, neuroblastoma, ovarian, and DLBCL) is strongly inhibited upon exposure to the ASO MDM4.
Figure 7. The ASO-mediated MDM4 therapeutic strategy is applicable to several tumor types. (A) The PSI MDM4 index was calculated, similarly to what is described in Figure 2B, for BRCA, OV, and DLBCL. For each tumor type, all values were sorted and plotted. Red area indicates the tumor specimens with a PSI MDM4 of greater than 0.4. The total percentage of tumor samples in this area is indicated in the top left corner. (B) ASO-mediated exon 6 skipping reduced in vitro colony formation of various cancer types. MCF7 breast cancer, SK-N-SH neuroblastoma, and Tov21G ovarian cancer cell lines were transfected with MDM4-targeting and scrambled control ASOs, and colony formation was evaluated using low-density colony formation assays 10 days after seeding. Graphs show quantification of the colony formation assays. Data are presented as the mean percentage of area occupied for 2 biological rep-licates (± SD). Immunoblot analysis of MDM4 protein expression levels is shown below.
Downloaded from http://www.jci.org on September 20, 2016. http://dx.doi.org/10.1172/JCI82534

The Journal of Clinical Investigation R e s e a R c h a R t i c l e
7 9jci.org Volume 126 Number 1 January 2016
Methods
Cell cultureThe human cell lines HEK293T, Phoenix-Eco/Ampho, A375, MCF7, and SK-N-SH were obtained from the American Type Culture Collec-tion (ATCC) and propagated according to the provider’s instructions. UACC-62 (NCI-60) and Tov21G (CRL-117) cells were provided by Igor Kurochkin (Bioinformatics Institute, Singapore) and Ruby Yun-Ju Huang (Cancer Science Institute, Singapore), respectively. Melanoma cell lines (MM lines) were cultured in F-10 medium (catalog 11550-043; Gibco, Thermo Fisher Scientific), 10% FBS (Invitrogen), and 1% penicillin/streptomycin (Sigma-Aldrich) and 12 ml L-alanyl-glutamine (from 200 mM stock; catalog 30-2115; ATCC)/500 ml total medium.
mESCs were cultured in DMEM (Life Technologies),15% FBS, 1× nonessential amino acids, 0.1 mM β-mercaptoethanol, 1% penicillin/streptomycin, and 1,000 U/ml leukemia inhibitor factor (LIF). Irradi-ated (6.3 Gy) mouse embryonic fibroblasts were used as feeders. For differentiation, cells were cultured on dishes coated with 0.1% gelatin in DMEM, 10% FBS, 1× nonessential amino acids, 0.1 mM β-mercapto-ethanol, 1% penicillin/streptomycin, and 1 μM alltrans-RA for the dura-tions indicated in the figures.
that MDM4 protein, but not mRNA, levels are elevated in 65% of human melanoma samples has raised the possibility that total mRNA measurements have dramatically underestimated the frequency of MDM4-expressing cancers. Our analysis of TCGA public RNA-seq data sets, using the PSI index as a guide to predict the proportion of MDM4-expressing samples, indeed supports this conclusion. The reevaluation of these large data sets underpins the possibility that a very large number of can-cer patients may benefit from an MDM4-targeting, ASO-based therapeutic strategy.
Together, our data indicate that a wide range of cancer cells promote an otherwise embryonic-specific splicing event (26) to promote expression of the oncoprotein MDM4 (Figure 9). ASO-mediated exon-skipping therapy targets the abundance of MDM4 rather than its interaction with p53 and therefore inhibits, in prin-ciple, both the p53-dependent and -independent oncogenic func-tions of MDM4 (Figure 9). Given that the potential therapeutic benefit of a series of ASOs is being investigated in various clinical trials (39) and that one of these ASOs, mipomersen, has recently been approved by the FDA (52), this therapeutic approach may be rapidly and widely applied to the clinic.
Figure 8. MDM4 ASO–mediated exon 6 skipping reduces growth of DLBCL in vivo and in vitro. (A) Left panel: cell titer analysis of a clinical sample of DLBCL (BCL13) 3 days after transfection with MDM4-targeting and scrambled ASOs. Right panel: semi-qPCR analysis of MDM4 splicing. Data represent the mean ± SD of 2 replicates (B–D) Cohorts of the PDX model of DLBCL (BCL13) were established. When tumors reached an average volume of 150 to 250 mm3 (BCL13), the cohorts were treated with the vivo MDM4 ASO (or scrambled control) upon i.t. injections of BCL13 every 2 days. BCL13 tumor size was assessed at 20 days. Data represent the mean ± SEM of 5 biological replicates for each cohort. A 2-tailed unpaired t test was used to assess statistical differences in B–D. (C) ASO-mediated exon 6 skipping decreased the PSI MDM4 index and MDM4 protein abundance in BCL13 tumors. Semi-quantitative analysis of MDM4-FL and MDM4-S isoforms in 10 dissected DLBCL tumors exposed to the MDM4-targeting or scrambled control ASOs. Lower panel show immunoblot analysis of MDM4 expression levels. Anti-actin immuno blotting was used to detect differences in sample loading. (D) IHC for the apoptotic marker cleaved caspase 3 and the proliferative marker Ki67 in DLBCL lesions exposed to the MDM4-targeting and scrambled control ASOs. Right panels show quantifica-tion of the IHC images shown in D. Three different slides from 3 different tumors (n = 3) were analyzed for each cohort, and the results are presented as mean ± SD. Scale bar: 100 μm.
Downloaded from http://www.jci.org on September 20, 2016. http://dx.doi.org/10.1172/JCI82534

The Journal of Clinical Investigation R e s e a R c h a R t i c l e
8 0 jci.org Volume 126 Number 1 January 2016
with a Precellys homogenizer in QIAzol. RNA was quantified using a NanoDrop 1000 (Thermo Scientific) and 500–2,000 ng was reverse transcribed with a High-Capacity cDNA Reverse Transcription Kit (Life Technologies). qPCRs were run using Fast SYBR Green Master Mix and a Roche LightCycler 384 (both from Life Technologies). Data processing with qbase+ 2.6 software (Biogazelle) relies on normaliza-tion with a minimum of 2 reference genes, indicated as RefGen below. RT-qPCR primers are listed in Supplemental Table 3.
MDM4 and Mdm4 alternative splicing was visualized by semi-qPCR. The forward primer binds in exon 4 (exon 5 in mouse), and the reverse primer binds in exon 7 (exon 8 in mouse), generating 2 ampli-cons: MDM4-FL (250 nt) and MDM4-S (182 nt) (Mdm4-FL; 227 nt and Mdm4-S; 159 nt in mouse). PCR was performed for 27 cycles (45 s at 95°C; 30 s at 58°C; 40 s at 72°C) using a ~34-ng cDNA template. GAPDH or Gapdh was used as a loading control. Products were visu-alized on a 2% agarose gel. The semi-qPCR primers used are listed in Supplemental Table 3.
TaqMan assayThe primers (Supplemental Table 6), annealing to exons 5 and 7, amplified both FL and S MDM4 isoforms simultaneously (Sup-plemental Figure 1B, Step1). The PCR product was loaded onto a 2% agarose gel, and the 2 bands (Supplemental Figure 1B, step 2) were purified using a QIAquick Gel Extraction Kit (catalog 28706; QIAGEN). The amount of purified DNA was measured using a NanoDrop 1000 (Thermo Scientific), and the concentration of the amplicons’ copy number was derived on the basis of the length of the amplicons (FL: 162 bp, S: 94 bp). Serial dilutions of the purified DNA (Supplemental Figure 1B, Step 3) were used to identify a stan-dard curve and to relate the Ct value to the copy number of each iso-form. The same primers in step 1 were used for the TaqMan reaction, together with a probe overlapping the exon 6–exon 7 junction conju-gated with TET (PrimeTime 5′ TET/ZEN/3′ IBFQ, IDT, Supplemen-tal Table 6) and a second probe overlapping the exon 5–exon 7 junc-tion conjugated with FAM (PrimeTime 5′ 6-FAM/ZEN/3′ IBFQ, IDT, Supplemental Table 6 and Supplemental Figure 1B, Step 4). TaqMan Fast Universal PCR MasterMix (catalog 4352042; Applied Biosys-tems) was used as a 2X master mix, and the reaction was loaded on a 7900HT Fast Real-Time PCR System (Thermo Fisher Scientific) to plot the Ct values for the respective dilutions of both FL and S iso-forms (Supplemental Figure 1B, Step 5). We derived the copy number of the 2 isoforms using the standard curve.
Vectors and infectionspLKO-1 MISSION lentiviral vectors (Sigma-Aldrich) were used for SRSF protein KD in human cell lines (Supplemental Table 4). A scram-bled shRNA was used as a control. HEK293T cells were transfected with pLKO vector, together with packaging vectors. Cells were incu-bated for 18 hours, then fresh medium was added to the cells. After 24 hours, the medium containing the viral particles was collected, filtered using a 0.22-μm filter unit, and added onto the target cells. Forty-eight hours after the last infection, the medium was replaced with fresh growth medium containing puromycin (catalog 540411; EMD Milli-pore). Cells were selected for 2 days before harvesting.
SRSF3 and Myc-tagged SRSF3 were cloned into a pMX vector (Addgene). Phoenix-Ampho cells were transfected together with pack-aging vector to produce the retroviral particles carrying pMX empty,
ChemicalsThe following chemicals were used: TG003 (catalog T5575) and RA (catalog R2625) (both from Sigma-Aldrich) and PLX4032 (catalog S1267; Selleckchem).
Western blot analysisHarvested cell culture pellets were resuspended in protein lysis buf-fer (25 mM HEPES, pH 7.5, 0.3 M NaCl, 1.5 mM MgCl2, 2 mM EDTA, 2 mM EGTA, 1 mM DTT, 1% Triton X-100, 10% glycerol, phos-phatase/protease inhibitor cocktail) incubated on ice for 15 minutes and centrifuged for 15 minutes in 4°C at 20,000 g. Tissue samples were additionally homogenized with Precellys homogenizer (Bertin Technologies) in protein lysis buffer prior to incubation on ice. Equal amounts of protein (Bradford quantification) were run on 4% to 12% NuPAGE Novex Bis-Tris Gels (Thermo Fisher Scientific) and transferred to a nitrocellulose membrane with an iBlot Dry Blot Sys-tem (Thermo Fisher Scientific). Membrane blocking (5% milk/TBS 0.2%Tween-20) was followed by incubation with the appropriate pri-mary Abs and HRP-conjugated secondary Ab (Cell Signaling Technol-ogy). Proteins were detected by ECL and Western blotting (Thermo Scientific). The Abs used are listed in Supplemental Table 2.
PCR and qPCRHarvested pellets were resuspended in QIAzol using an mRNeasy Kit and processed according to the manufacturer’s instructions (QIAGEN). Prior to processing, tissue samples were homogenized
Figure 9. Targeting MDM4 splicing in cancer therapy. Whereas MDM4 is unproductively spliced in most normal adult tissues, MDM4 protein is highly expressed in embryonic tissues and in cancers as a result of enhanced exon 6 inclusion. SRSF3, among other SRSF family members, is the only one that promotes exon 6 inclusion. TG003 is a CLK inhibitor that affects the phosphorylation of multiple SR proteins. Inducing MDM4 exon 6 skipping via ASO is a very specific, efficient, and clinically compatible approach to inhibiting p53-dependent MDM4 oncogenic functions.
Downloaded from http://www.jci.org on September 20, 2016. http://dx.doi.org/10.1172/JCI82534

The Journal of Clinical Investigation R e s e a R c h a R t i c l e
8 1jci.org Volume 126 Number 1 January 2016
in Matrigel (Matrigel Basement Membrane Matrix; BD Bioscience) for serial transplantation into another group of NOG mice. This process was repeated to produce subsequent generations of PDX models (F2, F3, F4, etc.). To evaluate the maintenance of the morphology and the main characteristics of the tumor of origin, formalin-fixed, paraffin-embed-ded (FFPE) tissue sections from patient tumor samples and xenografts of all established PDX models were stained with H&E and individually observed and reviewed by a human and veterinary pathologist.
Treatment with morpholinos was started when the tumor volume in mice reached 100–200 mm3. Cohorts were treated i.t. or i.v. with 0.12 mg scrambled or exon 6–targeting Vivo-Morpholinos (Gene-Tools LLC) dissolved in 70 μl PBS, every 2 days for the duration of the experiment. The BRAF inhibitor (BRAFi) dabrafenib was prepared by dissolving a capsule of Tafinlar (dabrafenib) in DMSO concentrated at 30 mg/ml, then aliquoted and stored at –20°C. Aliquots were thawed and diluted 1:10 in PBS prior to gavaging. Treated mice were given a capped dose of 0.6 mg in 200 μl total volume. Control mice were gav-aged with 10% DMSO in a total volume of 200 μl PBS.
Tumor growth was monitored with a caliper, and the volume was calculated using the following formula: V = a × b2 × 0.5, where a is the largest and b the smallest diameter of the tumor. Tumors were dis-sected at the end of the treatment and used for further processing for RNA, protein, and histological analyses.
Electroporation of morpholinos in DLBCL cellsMorpholinos were electroporated into DLBCL cells using the Neon Transfection System (Invitrogen), with the following parameters: 1,200 V × 20 ms × 2 pulses. Two microliters of a 1-mM stock solution was diluted in a final volume of 2 ml media for electroporation in a single well of a 6-well plate.
Cell titer Glo (Promega) and Caspase-Glo 3/7 (Promega) assays were performed 48 hours after electroporation as further described below.
DLBCL PDXThe tumor sample used for constructing the DLBCL xenograft was obtained from a 53-year-old man with a past history of stage I DLBCL 10 years earlier and who was treated with CHOP (cyclophosphamide, doxorubicin, vincristine, prednisolone) chemotherapy with complete remission. He presented with relapsed disease in the BM, leptomenin-ges, and pleural effusions. He was treated with 2 courses of RICE (ritux-imab, ifosfamide, carboplatin, etoposide) and intrathecal methotrexate/cytarabine, then 4 courses of DHAP (dexamethasone, cytarabine, cis-platin) and intrathecal methotrexate, but the disease continued to prog-ress, and the patient died 1 year after the disease relapse. Cytological examination of the pleural fluid showed a discohesive lymphomatous population featuring large cells with vesicular chromatin and conspic-uous nucleoli. Neoplastic cells expressed pan-B markers (PAX5, CD20, CD22, CD79a), with aberrant expression of CD5, strong expression of BCL2, and a high proliferation fraction of 70% to 80%. Neoplas-tic lymphocytes displayed a nongerminal center phenotype (CD10–
BCL6+MUM1+FOXP1+), but staining for c-Myc was low, at 20%. Inter-phase fluorescence ISH showed gains of BCL2 and rearrangements of BCL6 and IGH genes, whereas normal patterns were seen for c-Myc.
Xenograft construction and treatmentThe pleural fluid was collected in cold, sterile 20% RPMI 1640 medium. Neoplastic cells in the pleural fluid were isolated with Ficoll-Paque PLUS
pMX-SRSF3, and pMX-SRSF3-Myc-tag. The same protocol was used for viral particle collection, filtering, and infection and for collection of UACC-62 cells.
Morpholino transfectionThe scrambled morpholinos and MDM4 exon 6–targeting morpholi-nos (sequences are indicated in Supplemental Table 5) were obtained from Gene Tools. The lyophilized oligonucleotides were resuspended at a stock concentration of 1 mM. Since a morpholino’s backbone is nonpolar, it has to be partially annealed with a normal DNA oligonu-cleotide in order to be transfected with Lipofectamine reagent (Lip-ofectamine 3000; Life Technologies). The scrambled oligo sequence was: AAAAAAAAAAACACTAGAGAATGATA, and the exon 6 oligo sequence was: AAAAAAAAAACAACTGAAGGTAAAAT. Transfec-tions were performed in 6-well plates when the cells were approxi-mately 60% confluent. For each well, a mix was prepared with 21.85 μl DNA primer (from 100 μM stock), 2.78 μl morpholino (from 1 mM stock), 125 μl Opti-MEM (catalog 31985070; Gibco, Thermo Fisher Scientific), and 5 μl P3000 reagent (from the Lipofectamine 3000 kit). This mixture was added to a solution containing 7.5 μl Lipofect-amine 3000 and 125 μl Opti-MEM (Thermo Fisher Scientific). After a 5-minute incubation, the solution was added drop-wise to the cells.
Colony formation assayAll cancer cell lines were transfected with morpholinos as described above. Twenty-four hours after transfection, cells were trypsinized, counted, and replated onto 6-well plates at a density of 5 × 10³ cells. After 10 days, colonies were fixed and stained in a solution of 1% crystal violet in 35% methanol for 15 minutes at room temperature and washed in PBS and tap water. Whole-well images were made and automatically processed with ImageJ software (NIH) to determine the percentage of area occupied and colony numbers.
Melanoma PDXImmediately after surgery, fresh tumor tissue was collected in transport medium consisting of RPMI 1640 medium supplemented with penicil-lin/streptomycin (100 U/ml; 100 μg/ml), fungizone (1 μg/ml), and gen-tamicin (50 μg/ml) (all from Life Technologies). One representative part was fixed in 10% neutral buffered formalin (NBF) and used for routine histopathological diagnosis. A second portion immediately adjacent to the one selected for histopathology was used for xenotransplantation. To ensure that melanoma was adequately represented in this latter spec-imen, histopathology was performed on thin tissue slices obtained from the sample for xenotransplantation. The remainder of the biopsy was snap frozen in liquid nitrogen–cooled isopentane and stored at –80°C or gradually cooled in FBS (Perbio Science Sterile DMSO Uvasol; Merck Millipore) and 10% DMSO and stored at –180°C for retransplantation later on. Tumor tissue was implanted in mice within 4 hours after sam-pling. Before implantation, tumor tissue was rinsed in PBS (Life Tech-nologies) supplemented with penicillin/streptomycin and fungizone, minced into pieces measuring 8–10 mm3, and implanted into the inter-scapular region of anesthetized 6-week-old female NOG mice (NOD.Cg-Prkdcscid Il2rgtm1Sug/JicTac; Taconic) to generate the first-genera-tion (F1) PDX mice. When the tumors reached a tumor volume of 1,500 mm3, the mice were sacrificed, the tumors were harvested, and general necropsy was performed. Xenograft tumors were immediately fresh frozen, formalin fixed, and stored in FBS and 10% DMSO or placed
Downloaded from http://www.jci.org on September 20, 2016. http://dx.doi.org/10.1172/JCI82534

The Journal of Clinical Investigation R e s e a R c h a R t i c l e
8 2 jci.org Volume 126 Number 1 January 2016
Micromount Diapath). Tween-20 and TBS solution (0.1%) were used as washing buffer in between steps.
To assess proliferative and apoptotic indexes, Ki67- or cleaved caspase 3–positive and –negative nuclei were counted in 3 microscopic fields randomly selected from different regions of each tumor section by applying a digital image analysis algorithm created on the ImageJ software platform. Proliferative and apoptotic indexes were then expressed as the ratio between positive and total numbers of nuclei.
Viability and apoptosis assaysCellTiter-Glo or CellTiter 96 AQueous One Solution Cell Prolifer-ation Assay (Promega) was used as a cell viability assay. Cells were trypsinized, counted, and seeded (5,000 cells/well) in clear, flat- bottomed 96-well plates (Corning). After 48 or 72 hours, cells were incubated with CellTiter-Glo or CellTiter 96 AQueous One Solution and after 1 hour, the luminescence and absorbance were scored using a Tecan Safire2 microplate reader.
Caspase-Glo 3/7 Assay kit (Promega) was used as an apopto-sis assay. Cells were trypsinized, counted, and seeded (5,000 cells/well) in opaque, flat-bottomed 96-well plates (Corning). After 48 or 72 hours, cells were incubated with Caspase-Glo 3/7 Assay according to the manufacturer’s protocol. After 1 hour, luminescence and absor-bance were read with a Tecan Safire2 microplate reader.
BioinformaticsCalculation of relative exon usage. From the table with raw exon-exon junction counts of MDM4 (ENST00000367182.3) (= j), the total junction expression value per sample (sum of all junctions) (= JG) was calculated. All samples with a JG of less than (0.05 × Max[JG]) were discarded. The remaining samples were normalized (j ≤ j/JG) (total junction count per gene = 1), and the mean of each junction over all samples was calculated and normalized to the most abundant exon-exon junction (exon 10–exon 11 junction). From the 375 original sam-ples downloaded from TCGA using Firehose (http://gdac.broadinsti-tute.org/), 90 samples had no count for the exon 5–exon 6 junction or the exon 5–exon 7 junction and were excluded from the analysis.
Calculation of the PSI index in cancer tissue samples. Junction count data and gene mutation status information were downloaded from TCGA using Firehose (http://gdac.broadinstitute.org/) for the differ-ent tumor types from the 2014_09_02 data freeze. For each sample, the PSI index was calculated on the basis of the Firehose-quantified junction counts. Samples in which both the short- and long-form junc-tions fell in the lowest 10% quantile for each junction were excluded. The PSI of the MDM4-FL junction counts (from chr1:204501374:+ to chr1:204506558:+) and the MDM4-S junction (from chr1:204501374:+ to chr1:204507337:+) were calculated, sorted, and plotted.
Analysis of RNA-binding sites near MDM4 in mouse. Processed reads from cross-linking IP sequencing (CLIP-seq) were downloaded from starBase, v2.0 (http://starbase.sysu.edu.cn). Raw reads for SRSF3/4 were downloaded from the ArrayExpress database (http://www.ebi.ac.uk/arrayexpress/) under the accession number E-MTAB-747 and mapped to the mm9 genome using Bowtie (http://bowtie-bio.sourceforge.net/index.shtml). The mm9 genomic region surround-ing exons 7 and 8 of MDM4 was visualized using the R environment (http://cran.r-project.org/).
RIP. The A375 cell pellet was washed twice in ice-cold PBS and resuspended in lysis buffer (Tris buffer containing 50 mM, pH 8,
(GE Healthcare) and subsequently resuspended in RPMI 160 medium (Life Technologies) with 20% FBS (Life Technologies). A representa-tive portion of the tumor sample was fixed in 10% NBF, and the other portion was used for xenotransplantation. The cell suspension was then implanted s.c. into to 4- to 6-week-old NOD/SCID mice. The tumors were monitored periodically and allowed to establish and grow to a maximum size of 1,000 mm3. The mice were then sacrificed, tumors were harvested, and general necropsy was performed. Xenograft tumors were immediately fresh frozen, formalin fixed, stored in 90%FBS and 10% DMSO, or placed in RPMI 160 medium. This process was repeated to produce subsequent generations of PDX models (P2, P3, P4, etc.). To evaluate the maintenance of the morphology and main characteristics of the tumor of origin, FFPE tissues sections from patient tumor sam-ples and xenografts of all established PDX models were stained with H&E. In addition, these sections were immunostained to determine the expression of various markers. All of these slides were individually examined and reviewed by a clinical pathologist.
For the current study, tumor fragments (approximately 50 mg, P4) were implanted s.c. onto the flank of 4- to 6-week-old female NOD/SCID mice. Tumors were allowed to reach about 150 to 250 mm3 in size. The animals were randomized into the following 2 groups (n = 5): group 1: scrambled Vivo-Morpholinos (dose: 0.13 mg in 70 μl PBS, i.t.), and group 2: exon 6–targeting Vivo-Morpholinos (dose: 0.13 mg in 70 μl PBS, i.t.).
Animals were monitored regularly, and BW was measured every day during the treatment period. At the end of the treatment period, all animals were sacrificed and tumors were removed, weighed, and observed for gross pathology. Each tumor piece was then divided into 2 parts. One piece of the tumor was fixed in 10% NBF for 24 hours at room temperature and was then paraffin embedded. The other piece was snap frozen for RNA and protein analysis.
IHCFor immunohistochemical analysis, tumors were dissected, fixed for 48 hours in 4% paraformaldehyde (PFA), and processed for paraffin embedding (Thermo Scientific Excelsior AS Tissue Processor and HistoStar Embedding Workstation). Samples were then sectioned at 5 μm, mounted on Superfrost Plus Adhesion Slides (Thermo Scien-tific), and immunostained for MDM4 (1:1,250; IHC-00108, rabbit polyclonal; Bethyl Laboratories), Ki67 (1:200; RM-9106-S, clone SP6, rabbit monoclonal; Thermo Scientific), and cleaved caspase 3 (1:300; rabbit polyclonal Asp175; Cell Signaling Technology), as briefly detailed below. Slides for IHC were deparaffinized in xylene and then rehydrated in series of ethanol baths (100%, 95%, and 70%) and distilled H2O. Inhibition of endogenous peroxidase was achieved by incubating the slides in 3% H2O2 for 15 minutes at room temperature. Epitope retrieval was performed in citrate buffer (pH 6) using a 2100 Retriever (Electron Microscopy Sciences). Sections were blocked in 1% BSA for 40 minutes at room temperature and then incubated overnight at 4°C with the primary Ab. For both primary Abs raised in rabbit, EnVision+ HRP reagent (catalog K400311; Dako) was then applied on sections for 45 minutes at room temperature. Immunoreac-tivity was finally revealed via diaminobenzidinechromogen reaction (DAB Peroxidase Substrate Kit, SK-4100; Vector Laboratories). Next, slides were counterstained in hematoxylin (catalog C0302; Diapath), dehydrated in a series of ethanol baths, cleared in xylene, and perma-nently mounted with a resinous mounting medium (catalog 60200;
Downloaded from http://www.jci.org on September 20, 2016. http://dx.doi.org/10.1172/JCI82534

The Journal of Clinical Investigation R e s e a R c h a R t i c l e
8 3jci.org Volume 126 Number 1 January 2016
eral Hospital. Written informed consent was obtained for use of these samples for the specific research purpose only.
The experimental protocol was approved by the IACUC of the Bio-logical Resource Center, A*STAR, and the animals were maintained under compliance with A*STAR’s institutional guidelines.
Author contributionsMD, TT, KW, and MB conducted experiments and acquired and analyzed data. FR, MF, and DHPL performed biostatistical analysis. AR conducted experiments on the melanoma PDX. SXT provided technical assistance. CMK conducted DLBCL experiments. FAD, RMC, and ZB conducted experiments on melanoma cell lines. ER and MAH performed mouse pathological and IHC analyses. EH and FA managed the melanoma PDX facility. SYT, STL, ML, RCK, and VT managed the DLBCL PDX facility. HY and CB provided reagents for mESCs. MS read and edited the manuscript. JCM and EG designed the research studies and wrote the manuscript.
AcknowledgmentsWe thank P. Kaldis, D. Messerschmidt, G. Gargiulo, and M. Serresi for their helpful discussions and for critically reading the manu-script. We thank the Biological Resource Center (BRC) Shared facilities for technical support. Mark Shackleton was supported by the Australian National Health and Medical Research Coun-cil (NHMRC), Pfizer Australia, and the Victorian Endowment for Science, Knowledge and Innovation. J.-C. Marine acknowledges support from the NHMRC (grant 1058897); the Fonds Weten-schappelijk Onderzoek Vlaanderen (FWO, grant G.0646.14N); the Interuniversitaire Attractiepolen (IUAP, grant P7/03); and the Foundation Against Cancer (Stiching tegen Kanker, grant STK 2014-126). This work was also supported by an AGA-SINGA (SIN-gapore Graduate Award) fellowship to M. Bezzi and T. Tabaglio; and by the IMCB, A*STAR. E. Guccione acknowledges support from A*STAR Joint Council grants 1134c001 and 11/03/FG/07/04.
Address correspondence to: Jean-Christophe Marine, Laboratory for Molecular Cancer Biology, Center for the Biology of Disease, VIB, Herestraat 49, building O&N4, box 602, 3000 Leuven, Belgium. Phone: 3216330368; E-mail: [email protected]. Or to: Ernesto Guccione, Division of Can-cer Genetics and Therapeutics, Laboratory of Methyltransferases in Development and Disease, Institute of Molecular and Cell Biology (IMCB), A*STAR (Agency for Science, Technology and Research), 61 Biopolis Drive, Proteos, Singapore 138673. Phone: 6565869844; E-mail: [email protected].
NaCl 150 mM, 0.5% NP40, 0.5% sodium deoxycholate, 0.005% SDS, freshly added SUPERase In RNase Inhibitor [1:200; Ambion, Thermo Fisher Scientific] and protease inhibitor cocktail [1:1,000, catalog 539134; Calbiochem]). The lysate was placed on ice for 20 minutes, followed by sonication in a Diagenode BioRuptor UCD-200 (three 30-s strokes on/off). The lysates were cleared by centrifugation (10 min/20,800 g at 4°C), and protein content was determined (Bradford; Thermo Scientific). Ten percent input was saved, and the remaining lysate was precleared with protein A Dynabeads (Invitrogen) at 4°C for 1 hour with rotation. The beads were always washed 3 times in wash-ing buffer prior to use (200 mM Tris-HCl buffer, pH 8; 100 mM NaCl; 0.5% NP40; freshly added SUPERase In RNase Inhibitor, 1:200; and protease inhibitor cocktail, 1:1,000). The lysate was separated from the beads and added to 60 μl washed Dynabeads (50% slurry) pre-incubated with 5 μg SRSF3 Ab for 1 hour at room temperature. After a 3-hour rotation at 4°C, the Ab-bound beads were washed 3 times with washing buffer. The RNA was extracted with 1 ml TRIzol, adding 0.35 μl GlycoBlue Coprecipitant (catalog AM9516; Thermo Fisher Sci-entific). RNA restrotranscription was performed using a SuperScript VILO cDNA Synthesis Kit (catalog 11754050; Thermo Fisher Scien-tific). The MDM4 exon 6–splicing regulatory element was detected in the immunoprecipitated RNA by qPCR using the primers indicated in Supplemental Table 7.
StatisticsAn unpaired t test was used to assess statistical differences in Figure 3A (1-tailed statistical significance was determined using the Holm- Sidak method, with α = 5.000%) and Figure 8, B–D (2-tailed). A 2-tailed paired t test was used to assess statistical differences in Supplemental Figure 3F. Two-tailed P values of less than 0.05 were considered statis-tically significant. A 2-way ANOVA was used to determine statistical significance in Figure 5, A and E, and Figure 6B.
Study approvalMelanoma PDX. Original human tumor biopsies from primary and meta-static melanomas were obtained fresh from the operating theater, and all patients gave written informed consent for use of their biopsy samples.
All procedures involving human samples were approved by the UZ Leuven/KU Leuven medical ethics committee (Commissie Medische Ethiek, approval number ML8713/S54185). All procedures involving animals were performed in accordance with the guidelines of the IACUC of KU Leuven and approved in project applications P147/2012 (PDX platform setup) and P038/2015 (ASO experiments).
DLBCL PDX. All procedures were approved by and performed in accordance with the ethics principles of the IRB of Singapore Gen-
1. Marine JC, Jochemsen AG. Mdmx as an essential regulator of p53 activity. Biochem Biophys Res Commun. 2005;331(3):750–760.
2. De Clercq S, et al. Widespread overexpression of epitope-tagged Mdm4 does not acceler-ate tumor formation in vivo. Mol Cell Biol. 2010;30(22):5394–5405.
3. Maetens M, et al. Distinct roles of Mdm2 and Mdm4 in red cell production. Blood. 2007;109(6):2630–2633.
4. Boesten LS, et al. Mdm2, but not Mdm4, protects terminally differentiated smooth muscle cells
from p53-mediated caspase-3-independent cell death. Cell Death Differ. 2006;13(12):2089–2098.
5. Xiong S, Van Pelt CS, Elizondo-Fraire AC, Liu G, Lozano G. Synergistic roles of Mdm2 and Mdm4 for p53 inhibition in central nervous system development. Proc Natl Acad Sci U S A. 2006;103(9):3226–3231.
6. Garcia D, Warr MR, Martins CP, Brown Swigart L, Passegue E, Evan GI. Validation of MdmX as a therapeutic target for reactivating p53 in tumors. Genes Dev. 2011;25(16):1746–1757.
7. Valentin-Vega YA, Box N, Terzian T, Lozano G.
Mdm4 loss in the intestinal epithelium leads to compartmentalized cell death but no tissue abnor-malities. Differentiation. 2009;77(5):442–449.
8. Yan H, et al. p53 is active in murine stem cells and alters the transcriptome in a manner that is reminiscent of mutant p53. Cell Death Dis. 2015;6:e1662.
9. Danovi D, et al. Amplification of Mdmx (or Mdm4) directly contributes to tumor formation by inhibiting p53 tumor suppressor activity. Mol Cell Biol. 2004;24(13):5835–5843.
10. Toledo F, Wahl GM. Regulating the p53 pathway:
Downloaded from http://www.jci.org on September 20, 2016. http://dx.doi.org/10.1172/JCI82534

The Journal of Clinical Investigation R e s e a R c h a R t i c l e
8 4 jci.org Volume 126 Number 1 January 2016
in vitro hypotheses, in vivo veritas. Cancer. 2006;6(12):909–923.
11. Wade M, Li YC, Wahl GM. MDM2, MDMX and p53 in oncogenesis and cancer therapy. Nat Rev Cancer. 2013;13(2):83–96.
12. Marine JC. MDM2 and MDMX in cancer and development. Curr Top Dev Biol. 2011;94:45–75.
13. Gembarska A, et al. MDM4 is a key therapeu-tic target in cutaneous melanoma. Nat Med. 2012;18(8):1239–1247.
14. Flaherty KT, et al. Inhibition of mutated, acti-vated BRAF in metastatic melanoma. N Engl J Med. 2010;363(9):809–819.
15. Chapman PB, et al. Improved survival with vemu-rafenib in melanoma with BRAF V600E muta-tion. N Engl J Med. 2011;364(26):2507–2516.
16. Nazarian R, et al. Melanomas acquire resistance to B-RAF(V600E) inhibition by RTK or N-RAS upregulation. Nature. 2010;468(7326):973–977.
17. Azijli K, Stelloo E, Peters GJ, Van den Eertwegh AJ. New developments in the treatment of metastatic melanoma: immune checkpoint inhibitors and targeted therapies. Anticancer Res. 2014;34(4):1493–1505.
18. Carrillo AM, Bouska A, Arrate MP, Eischen CM. Mdmx promotes genomic instability independent of p53 and Mdm2. Oncogene. 2015;34(7):846–856.
19. Matijasevic Z, Krzywicka-Racka A, Sluder G, Jones SN. MdmX regulates transformation and chromosomal stability in p53-deficient cells. Cell Cycle. 2008;7(19):2967–2973.
20. Matijasevic Z, Steinman HA, Hoover K, Jones SN. MdmX promotes bipolar mitosis to suppress trans-formation and tumorigenesis in p53-deficient cells and mice. Mol Cell Biol. 2008;28(4):1265–1273.
21. de Lange J, et al. High levels of Hdmx promote cell growth in a subset of uveal melanomas. Am J Cancer Res. 2012;2(5):492–507.
22. Kornblihtt AR, Schor IE, Allo M, Dujardin G, Petrillo E, Munoz MJ. Alternative splicing: a piv-otal step between eukaryotic transcription and translation. Mol Cell Biol. 2013;14(3):153–165.
23. Perez-Ortin JE, Alepuz P, Chavez S, Choder M. Eukaryotic mRNA decay: methodologies, path-ways, and links to other stages of gene expres-sion. J Mol Biol. 2013;425(20):3750–3775.
24. Boutz PL, Bhutkar A, Sharp PA. Detained introns are a novel, widespread class of post-transcription-ally spliced introns. Genes Dev. 2015;29(1):63–80.
25. Rallapalli R, Strachan G, Cho B, Mercer WE, Hall DJ. A novel MDMX transcript expressed in a vari-ety of transformed cell lines encodes a truncated
protein with potent p53 repressive activity. J Biol Chem. 1999;274(12):8299–8308.
26. Bezzi M, et al. Regulation of constitutive and alternative splicing by PRMT5 reveals a role for Mdm4 pre-mRNA in sensing defects in the spliceosomal machinery. Genes Dev. 2013;27(17):1903–1916.
27. Bardot B, et al. Mice engineered for an obligatory Mdm4 exon skipping express higher levels of the Mdm4-S isoform but exhibit increased p53 activ-ity. Oncogene. 2015;34(22):2943–2948.
28. Kato S, et al. Understanding the function-struc-ture and function-mutation relationships of p53 tumor suppressor protein by high-resolution mis-sense mutation analysis. Proc Natl Acad Sci U S A. 2003;100(14):8424–8429.
29. Lenos K, et al. Alternate splicing of the p53 inhibitor HDMX offers a superior prognostic biomarker than p53 mutation in human cancer. Cancer Res. 2012;72(16):4074–4084.
30. Anko ML, et al. The RNA-binding landscapes of two SR proteins reveal unique functions and binding to diverse RNA classes. Genome Biol. 2012;13(3):R17.
31. Pandit S, et al. Genome-wide analysis reveals SR protein cooperation and competition in regulated splicing. Mol Cell. 2013;50(2):223–235.
32. Charizanis K, et al. Muscleblind-like 2-mediated alternative splicing in the developing brain and dysregulation in myotonic dystrophy. Neuron. 2012;75(3):437–450.
33. Liu Y, et al. Cold-induced RNA-binding pro-teins regulate circadian gene expression by controlling alternative polyadenylation. Sci Rep. 2013;3:2054.
34. Wang ET, et al. Transcriptome-wide regulation of pre-mRNA splicing and mRNA localization by muscleblind proteins. Cell. 2012;150(4):710–724.
35. Zhang C, Darnell RB. Mapping in vivo pro-tein-RNA interactions at single-nucleotide resolution from HITS-CLIP data. Nat Biotechnol. 2011;29(7):607–614.
36. Corbo C, Orru S, Salvatore F. SRp20: an overview of its role in human diseases. Biochem Biophys Res Commun. 2013;436(1):1–5.
37. Muraki M, et al. Manipulation of alternative splic-ing by a newly developed inhibitor of Clks. J Biol Chem. 2004;279(23):24246–24254.
38. Yadav V, et al. Reactivation of mitogen-activated protein kinase (MAPK) pathway by FGF receptor 3 (FGFR3)/Ras mediates resistance to vemu-rafenib in human B-RAF V600E mutant mela-noma. J Biol Chem. 2012;287(33):28087–28098.
39. Raal FJ, et al. Mipomersen, an apolipoprotein B synthesis inhibitor, for lowering of LDL choles-terol concentrations in patients with homozygous familial hypercholesterolaemia: a randomised, double-blind, placebo-controlled trial. Lancet. 2010;375(9719):998–1006.
40. Heemskerk HA, et al. In vivo comparison of 2′-O-methyl phosphorothioate and morpho-lino antisense oligonucleotides for Duchenne muscular dystrophy exon skipping. J Gene Med. 2009;11(3):257–266.
41. Livingstone E, Zimmer L, Vaubel J, Schadendorf D. BRAF, MEK and KIT inhibitors for melanoma: adverse events and their management. Chin Clin Oncol. 2014;3(3):29.
42. Lam S, Lodder K, Teunisse AF, Rabelink MJ, Schutte M, Jochemsen AG. Role of Mdm4 in drug sensitivity of breast cancer cells. Oncogene. 2010;29(16):2415–2426.
43. Shi M, et al. Biological and clinical significance of epigenetic silencing of MARVELD1 gene in lung cancer. Sci Rep. 2014;4:7545.
44. Wang D, Wengrod J, Gardner LB. Overexpression of the c-myc oncogene inhibits nonsense- mediated RNA decay in B lymphocytes. J Biol Chem. 2011;286(46):40038–40043.
45. Lenos K, Jochemsen AG. Functions of MDMX in the modulation of the p53-response. J Biomed Biotechnol. 2011;2011:876173.
46. Zhou Z, Fu XD. Regulation of splicing by SR pro-teins and SR protein-specific kinases. Chromo-soma. 2013;122(3):191–207.
47. Jia R, Li C, McCoy JP, Deng CX, Zheng ZM. SRp20 is a proto-oncogene critical for cell prolif-eration and tumor induction and maintenance. Int J Biol Sci. 2010;6(7):806–826.
48. Goncalves V, Matos P, Jordan P. The β-catenin/TCF4 pathway modifies alternative splicing through modulation of SRp20 expression. RNA. 2008;14(12):2538–2549.
49. Coombs GS, Covey TM, Virshup DM. Wnt sig-naling in development, disease and translational medicine. Curr Drug Targets. 2008;9(7):513–531.
50. Wang Z, et al. Exon-centric regulation of pyru-vate kinase M alternative splicing via mutually exclusive exons. J Mol Cell Biol. 2012;4(2):79–87.
51. Tang Y, et al. Downregulation of splicing factor SRSF3 induces p53beta, an alternatively spliced isoform of p53 that promotes cellular senes-cence. Oncogene. 2013;32(22):2792–2798.
52. Hair P, Cameron F, McKeage K. Mipom-ersen sodium: first global approval. Drugs. 2013;73(5):487–493.
Downloaded from http://www.jci.org on September 20, 2016. http://dx.doi.org/10.1172/JCI82534