anohana(west)_case3.pptx
10
TEAM Anohana, sIMS SUBMITTED BY: DHRUV DUGGAL dhruv.duggal2017@si ms.edu +918872014850 AMAN KUMAR SINGH aman.singh2017@sims .edu +917066253854 AMIT KIRAN SINGH amit.singh2017@sims .edu +919051260193
-
Upload
dhruv-duggal -
Category
Documents
-
view
214 -
download
1
Transcript of anohana(west)_case3.pptx

TEAM Anohana, sIMSSUBMITTED BY:
DHRUV DUGGAL [email protected] +918872014850
AMAN KUMAR SINGH [email protected] +917066253854
AMIT KIRAN SINGH [email protected] +919051260193

INDEXTOPIC SLIDE NUMBER
EXECUTIVE SUMMARY 3
PROFITABLE REGION 4
PROFITABILITY 5
COST EFFECTIVE COMMUNICATION CHANNEL
6
COMPARATIVE ANALYSIS 7
SOCIAL MEDIA ADOPTION CHANNELS 8
RISK ASSOCIATED WITH E COMMERCE TO GAMEIN CORP 9

EXECUTIVE SUMMARY
PROFITABLE REGION
PROFITABILITYCOST EFFECTIVE COMMUNICATION CHANNEL
COMPARATIVE ANALYSIS
SOCIAL MEDIA ADOPTION CHANNELS
ANALYSIS
OBJECTIVE
INSIGHTS
Analyze the profit margins of various products for various regions.
Determine the profitability for football, cricket, golf for quarter 3 in 2018
Determine the cost effective communication channel for East.
Comparative analysis for GameIn Corp, Competitor 1 and Competitor 2.
Analyze the potential social media channel
Determine the profitable region for football, cricket, golf in 2017
Projection of quarter 3 sales for cricket, football and golf
Determination of cost per ad per audience for various channels
Analyze the sales breakup of various products for competitor 1, competitor 2 and GameIn Corp.
Determine the competitor with most robust social media practice and viable channel
Cricket=NorthFootball=NorthGolf= West
Golf is the most profitable followed by football and then cricket
The most cost effective communication channel is TV
Football= Competitor 1Cricket=GameIn CorpOthers= Competitor 2
Competitor 4 has the most robust social media practice and viable channel

PROFITABLE REGION PROFITABILITY
COST EFFECTIVE COMMUNICATION CHANNEL
COMPARATIVE ANALYSIS
SOCIAL MEDIA ADOPTION CHANNELS
CRICKET
FOOTBALL
GOLF
0 5 10 15 20 25 30
PROJECTED PROFIT AS % SPLIT BY REGION IN 2017
SOUTH NORTH EASTWEST
PROFIT %
SPO
RT
•Most profitable region for Cricket is North.
•Most profitable region for Football is North.
•Most profitable region for Golf is West.
WEST EAST NORTH SOUTH
CRICKET 20.37 25.3 27.7 26.54
FOOTBALL 26.41 21.4 27.95 24.1
GOLF 28.08 26.81 23.31 24.7

PROFITABLE REGION PROFITABILITY
COST EFFECTIVE COMMUNICATION CHANNEL
COMPARATIVE ANALYSIS
SOCIAL MEDIA ADOPTION CHANNELS
CRICKET
FOOTBALL
GOLF
0 10 20 30 40 50 60 70 80 90 100
PROFITABILITY IN 2018
PROFITABILITY
•Profitability for Cricket= 29.3%
•Profitability for Football= 77%
•Profitability for Golf= 86%
Q3 IN 2015 Q3 IN 2018
CRICKET 32 41.4
FOOTBALL 20 35.4
GOLF 26 48.38
5
15
25
35
45
55
Q3 SALES COMPARISON
SALE
S IN
%AG
E

PROFITABLE REGION
PROFITABILITYCOST EFFECTIVE COMMUNICATION CHANNEL
COMPARATIVE ANALYSIS
SOCIAL MEDIA ADOPTION CHANNELS
5%
21%
5%
69%
COST/AD/AUDIENCEPRINT SOCIAL MEDIA TV SPONSORSHIP
•TV is the most cost effective communication channel.As cost per add per audience is least
•The presence of cricket and football in the Eastern region is high, leading to selection of TV over print.
30%
35%
15%
17% 3%
POPULARITY IN EASTCRICKET FOOTBALL MERCHANDISEGOLF OTHERS
COST/AD/AUDIENCE
PRINT 0.020516816
SOCIAL MEDIA 0.083528978
TV 0.020630214
SPONSORSHIP 0.27432505
PROFITABLE REGION
PROFITABILITYCOST EFFECTIVE COMMUNICATION CHANNEL
COMPARATIVE ANALYSIS
SOCIAL MEDIA ADOPTION CHANNELS
CRICKET
FOOTBALL
MERCHANDISE
GOLF
OTHERS
0 0.1 0.2 0.3 0.4 0.5 0.6
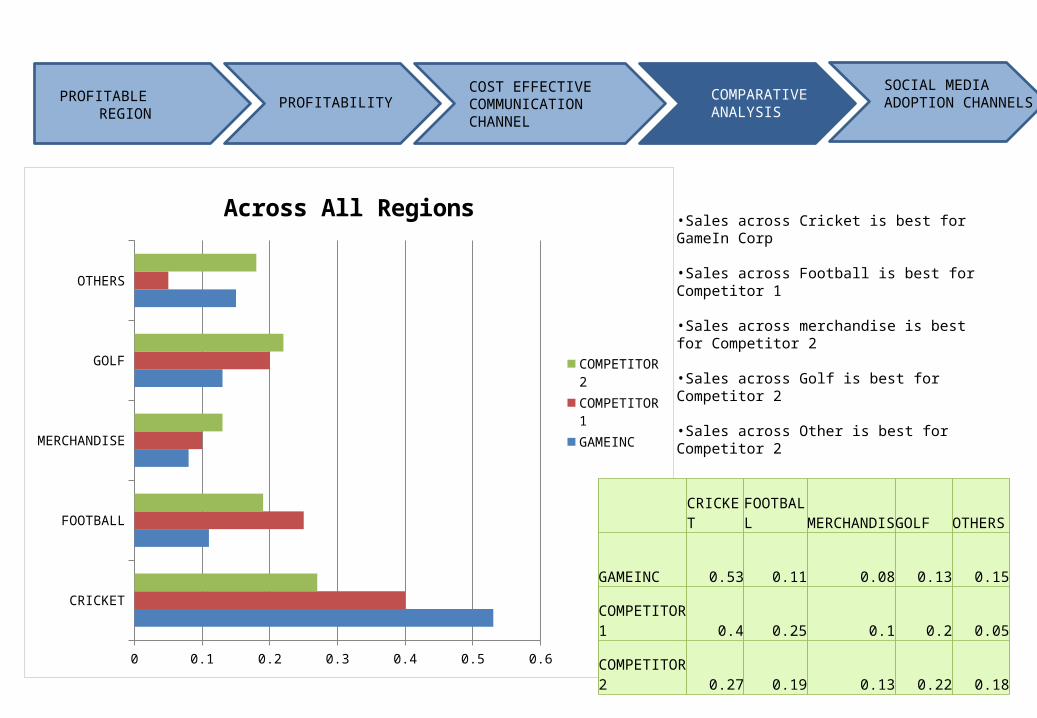
Across All Regions
COMPETITOR 2
COMPETITOR 1
GAMEINC
•Sales across Cricket is best for GameIn Corp
•Sales across Football is best for Competitor 1
•Sales across merchandise is best for Competitor 2
•Sales across Golf is best for Competitor 2
•Sales across Other is best for Competitor 2
CRICKET FOOTBALL MERCHANDIS GOLF OTHERS
GAMEINC 0.53 0.11 0.08 0.13 0.15
COMPETITOR 1 0.4 0.25 0.1 0.2 0.05
COMPETITOR 2 0.27 0.19 0.13 0.22 0.18

PROFITABLE REGION
PROFITABILITY
COST EFFECTIVE COMMUNICATION CHANNEL
COMPARATIVE ANALYSIS
SOCIAL MEDIA ADOPTION CHANNELS
•Social media channel 1 is best to target age groups 18-39.
•The most profitable medium of communication and awareness for GameIn Corp is Social Media Channel 1.
Competitor 19%
Competitor 231%
Competitor 31%
Competitor 454%
Competitor 51%
Competitor 60%
Competitor 73%
Competitor 80%
ENGAGEMENT/HOURS
•The competitor 4 has the most robust social media practice.As it has the highest engagement in one hour.
SELLING PRICE
COST PRICE PROFIT
SOCIAL MEDIA 1 43400 6400 37000
SOCIAL MEDIA 2 11800 8130 3670
SOCIAL MEDIA 3 4000 1000 3000
SOCIAL MEDIA 4 4000 4000 0

RISK ASSOCIATED WITH E COMMERCE TO GAMEIN CORP• Supply chain and procurement issues.• Issues with online transactions.• Issues with phishing and hacking.• Delay in transferring cash(especially pertaining to Cash On Delivery option).
SOURCE: https://www.blendspace.com/lessons/b0yIsegCfUzXWw/issues-in-e-commerce

![Fundamentos de investigación1.pptx [Autoguardado].pptx](https://static.fdocuments.net/doc/165x107/56d6bd6c1a28ab30168deddb/fundamentos-de-investigacion1pptx-autoguardadopptx.jpg)


![钱币.pptx [Autosaved].pptx](https://static.fdocuments.net/doc/165x107/55cf91bf550346f57b905058/pptx-autosavedpptx.jpg)


![[MS-PPTX]: PowerPoint (.pptx) Extensions to the Office ...MS-PPTX].pdfPowerPoint (.pptx) Extensions to the Office Open XML File FormatFile Size: 4MBPage Count: 145](https://static.fdocuments.net/doc/165x107/5ed5954ddb0f8b20f04b0446/ms-pptx-powerpoint-pptx-extensions-to-the-office-ms-pptxpdf-powerpoint.jpg)