Annual Review 2010 - Furusato
32
Published on August 19, 2011 Annual Review 2010 Year Ended March 31, 2011 Furusato Industries, Ltd.
Transcript of Annual Review 2010 - Furusato

Published on August 19, 2011
Annual Review 2010
Year Ended March 31, 2011
Furusato Industries, Ltd.
1
■■■■Contents
02 Message from the President
03 Consolidated Financial Highlights
05 Management Policy
06 Furusato Group Overview by Company
07 Business Outline and Strategy by Segment
Equipment and Tools Business
Machine and Facility Business
Construction and Piping Products Business
11 Overview of Operations in Fiscal 2010 and Forecasts in Fiscal 2011
Consolidated Results
Equipment and Tools Business
Machine and Facility Business
Construction and Piping Products Business
Consolidated Forecasts in Fiscal 2011
18 Financial Section
Consolidated Balance Sheets
Consolidated Statements of Income
Consolidated Statements of Changes in Shareholders’ Equity
Consolidated Statements of Cash Flows
23 Corporate Governance
Corporate Governance Framework
Risk Factors
28 Stock Information
30 The History of Furusato Group
31 Corporate Data Forward-looking Statements
The forecasts involve our management’s assumptions, prospects and plans based on the information currently available. Actual results
may differ materially from the expectations depending on various factors.

2
■■■■Message from the President
Furusato Industries, Ltd. would like to extend our deepest sympathies to all those affected by the
Great East Japan Earthquake and pray for the earliest possible restoration of the affected regions.
In Furusato Group, none of our employees has been
missed or injured. The damages to our sales offices in
the affected region were relatively small. Now, we place
utmost priority on supporting our customers affected and
the restoration of affected region by the earthquake.
The Japanese economy showed a moderate recovery
in fiscal 2010 after it had plunged following Lehman's fall
in 2008. However, the Great East Japan Earthquake
drastically heightened the uncertainty over the future
economic conditions. It is thus difficult to predict pros-
pective trends in the Furusato Group’s operating envi-
ronment, reflecting sluggish economic activities mainly in
the affected region by the earthquake, volume and timing
of construction of temporary housing and the restoration
of building and facilities, shrinking consumer spending and
short of electric power supplies.
Even under unclear circumstances, Furusato Industries
is manufacturing turnbuckle braces for temporary housing
in the affected region at full capacity. After that, we will
prioritize providing supplies for new housing construction
and building renovation. In addition, G-net and Gifu Shoji
support to replace facilities and machines of the affected
manufacturers and suggest energy-saving machines and
equipments. We all will work hard for the reconstruction
of the affected region as Furusato Group.
Moreover, we continue to foster the Piping Products
Business, expand the business through the synergy gen-
erated by a combination of G-net and Gifu Shoji and
create added value leveraging engineering functions.
Besides that, we strive to prepare for the changes to come
in the near future.
Furusato Group makes every effort to satisfy the needs
of the society and our shareholders by conducting what
we are supposed to do even under unclear circums-
tances.
We look forward to your continued understanding and
support in the years ahead.
Ryohei Furusato
President and Representative Director

3
■■■■Consolidated Financial Highlights (Japan GAAP) Operating ResultsOperating ResultsOperating ResultsOperating ResultsFiscal year 2006 2007 2008 2009 2010Net sales Millions of yen 90,378 92,064 83,103 53,776 64,45464,45464,45464,454Gross profit Millions of yen 13,334 13,198 13,132 7,674 9,0469,0469,0469,046Operating income (loss) Millions of yen 5,097 4,317 3,791 (780) 767767767767Ordinary income (loss) Millions of yen 5,518 4,732 4,193 (520) 1,0741,0741,0741,074Net income (loss) Millions of yen 3,154 2,590 1,732 (1,407) 569569569569Capital investment Millions of yen 534 1,586 419 39 116116116116Depreciation & amortization Millions of yen 360 549 758 629 341341341341Ratio of Profits to Net SalesRatio of Profits to Net SalesRatio of Profits to Net SalesRatio of Profits to Net SalesFiscal year 2006 2007 2008 2009 2010Gross profit margin % 14.8 14.3 15.8 14.3 14.014.014.014.0Ratio of operating income (loss)to net sales % 5.6 4.7 4.6 (1.5) 1.21.21.21.2Ratio of ordinary income (loss)to net sales % 6.1 5.1 5.0 (1.0) 1.71.71.71.7Ratio of net income (loss)to net sales % 3.5 2.8 2.1 (2.6) 0.90.90.90.9Financial PositionFinancial PositionFinancial PositionFinancial PositionFiscal year 2006 2007 2008 2009 2010Net assets Millions of yen 27,496 28,860 29,987 28,429 28,31528,31528,31528,315Total assets Millions of yen 50,715 54,025 47,171 42,187 44,53644,53644,53644,536Net assets to total assets % 54.2 53.4 63.6 67.4 63.663.663.663.6Per Share DataPer Share DataPer Share DataPer Share DataFiscal year 2006 2007 2008 2009 2010Earnings per share Yen 199.86 163.92 109.64 (89.58) 37.5537.5537.5537.55Book-value per share Yen 1,739.63 1,826.06 1,897.58 1,838.27 1,892.901,892.901,892.901,892.90Dividend per share (Annual) Yen 40 41 27.5 10 10101010Profit IndicatorsProfit IndicatorsProfit IndicatorsProfit IndicatorsFiscal year 2006 2007 2008 2009 2010Return on equity % 12.3 9.2 5.9 (4.8) 2.02.02.02.0Return on assets % 11.5 9.0 8.3 (1.2) 2.52.52.52.5Dividend payout ratio % 20.0 25.0 25.1 - 26.626.626.626.6

4
■■■■Consolidated Financial Highlights (Japan GAAP) Net Sales020,00040,00060,00080,000100,000
2006 2007 2008 2009 2010(Mil lions ofYen) Profit
-2,00002,0004,0006,0002006 2007 2008 2009 2010
(Millions ofYen)Operating income (loss) Ordinary income (loss)Net income (loss)Capital Investment
05001000150020002006 2007 2008 2009 2010
(Millions ofYen)
Per Share Data-100-50050100150200250300
2006 2007 2008 2009 2010(Yen)
1,2001,3001,4001,5001,6001,7001,8001,9002,000(Yen)Earnings per share (EPS: Left scale)Book-value per share (BPS: Right scale)
Financial Position010,00020,00030,00040,00050,00060,000
2006 2007 2008 2009 2010(Millions ofYen)
40455055606570(%)
Net assets (Left Scale)Total assets (Left scale)Net assets to total assets (Right scale) Profit Indicators-6.0-3.00.03.06.09.012.015.0
2006 2007 2008 2009 2010(Yen)
Return on equi ty Return on assets
Depreciation & Amortization02004006008001000
2006 2007 2008 2009 2010(Millions ofYen)
Dividends0102030405060
2006 2007 2008 2009 2010(Yen)
051015202530(%)
Dividend per share(Year-end: Left scale)Dividend per share(Interim: Left scale)Dividend payout ratio(Right scale)40 41
27.5
10 10

5
■■■■Management Policy 1. Management policy 〈Management objective〉
Furusato Group sets our management objective as
“business continuity” to consistently fulfill our responsibili-
ties to our stakeholders including shareholders, customers,
business partners, employees, etc. We will identify our
core competencies and exercise our unique competitive
advantages. Then, we will be an indispensable corporate
group for the society and secure sustainable profit structure.
As a result, we believe that we can realize to become the
“sustainable corporate group”. 〈Basic management principle and code of conduct〉
The basic management principle of Furusato Group is
“customer first”, the origin of thoughts and conduct of all
officers and employees. Based on this principle, we deal
with anything our customers, the steel fabricators, need.
Furthermore, Furusato provides customers anything they
need, in the amounts, in the timing, and to the place as
requested. This is our code of conduct.
With the aim of execution of the code of conduct, we take
steady actions to improve infrastructures by efficient allo-
cation of human resources, an increase in inventory items
and a review of distribution network. In addition, we up-
grade systems for order-taking, reporting and settlement
management and foster a mindset of employees in order to
respond to customers’ immediate needs. This is the basic
management policy of Furusato Group.
2. Target management indicator
Furusato Group sets returns on equity (ROE) as our
target management indicator. We strive to improve our
corporate value and the returns of profits to shareholders
with the aim of achieving the ROE of more than 10%.
3. Medium- to long-term corporate management
strategy
Furusato Group sets the Equipment and Tools Business,
the Machine and Facility Business and the Construction
and Piping Products Business as our core businesses.
We will set up appropriate strategies for each segment,
execute them steadily and build sustainable growth track
based on the concept of the “customer first”.
(1) Maintaining and enhancing stable profit structure
In the Construction and Piping Products Business, which
enjoys high market share, we strive to develop and stabilize
sales base to maintain solid profit structure and to increase
sales volume by marketing new supplies and services.
We aim to secure core fields as stable sources of income
for Furusato Group through these measures.
(2) Increasing market share by proactive investment
In the Equipment and Tools Business, the Machine and
Facility Business and the Piping Products Business, which
have high growth potential, we aim to increase market
share by reinforcing purchasing power through expansion
of supplier base; by improving customer service with ex-
tension of inventory items and restructuring of distribution
network and by proactively investing management re-
sources in development of marketing methods and tools.
(3) Fostering the new business
In order to diversify risks arising from concentration on a
specific business and realize well-balanced profit structure
and growth as Furusato Group, we consistently screen a
new business field that can develop efficiently like the
business related to the existing businesses.
(4) Improving corporate value by organizational reform and
proactive use of human resources
We work hard to improve social value and shareholder
value as Furusato Group by enhancing the corporate go-
vernance; by getting rid of dishonesty and antisocial activ-
ism through reinforcement of compliance and by improving
operational efficiency based on the proactive use of man-
agement resources.
4. Tasks ahead
Unexpected events may happen amid a process of rapid
change as business environment is getting harsh. Under
the circumstances, challenging issues to be solved is rein-
forcement of compliance. As one of our top priorities, we
will work hard to establish the framework to obey regula-
tions as a corporate citizen and to get rid of dishonesty and
anti-social activism.

6
■■■■Furusato Group Overview by Company
Furusato Group
Furusato Group consists of three companies: Furusato
Industries, Ltd., the parent company, and its
wholly-owned subsidiaries including G-net Corporation
and Gifu Shoji Co., Ltd. Furusato Industries, Ltd.
Furusato, listing on the First Section of Tokyo Stock
Exchange and Osaka Securities Exchange, engaged in
the Steel Frame Building Supplies Business and the
Piping Products Business. Both businesses directly
provide users with our supplies from our 45 sales offices
nationwide. Basically, we purchase the supplies directly
from manufacturers. Meanwhile, in the Steel Frame
Construction Supplies Business, in-house products
account for approximately 25% of total sales.
Of total net sales of ¥19.7 billion in fiscal 2010, the
Steel Frame Construction Supplies Business made up
approx. 81% and the Piping Product Business approx.
19%. G-net Corporation
G-net is a wholly-owned subsidiary of Furusato, an
unlisted company. The major business of G-net is the
Industrial Equipment Business, offering various machines
and tools at wholesale, which sells them to manufacturers
in Japan through machine and industrial tools sales
dealers. This business makes up approx. 64% of total net
sales. As another earning pillar, the Machine Tool
Business, accounting for approx. 18% of total sales,
specializes in machine tools that make parts of machines
and sells them at wholesale from Tokyo, Nagoya and
Osaka.
Besides that, G-net operates the Factory Automation
Business, directly offering machines and facilities to some
users, the Housing Equipment Business, offering housing
equipments to builders at wholesale, the Overseas
Business, importing and exporting mainly machines and
industrial tools.
, Gifu Shoji Co., Ltd.
Gifu Shoji is also a wholly-owned subsidiary of
Furusato, an unlisted company. It directly purchases
primarily industrial tools from manufacturers and sells
them to automotive and automotive parts manufacturers
based in Tokai Area, mainly headquarters in Gifu and
Nagoya, Kariya and Hamamatsu sales offices. ※Wakaba Lease was dissolved on March 31, 2011 and is
in the course of liquidation. ○Classification of businesses of Furusato Group by Company and Segment
Steel Frame
Building
Supplies
Piping
Products
Machine
Tool
Factory
Automation
Industrial
Equipment
Housing
Equipment Overseas Other
Machine and
Tools for
Automotive
Furusato Group-Net Sales by Company-
Furusato Industries G-net Gifu Shoji
Construction and Piping
Products Machine and Facility Equipment and Tools
Steel Frame Building
Supplies Business
Piping Products Business
Industrial Equipment
Business
Machine and Tools for Automotive Business
Housing Equipment
Business
Machine Tool Business
Factory Automation Business
Overseas Business
Other Business
※Pie chart inside indicates non-consolidated
results of group companies.
G-net \41.5B
Furusato \19.7B Gifu Shoji \3.9B

7
■■■■Business Outline and Strategy by Segment
■Industrial Tools Business 【Business outline】
In the Industrial Tools Business, we purchase machines, industrial tools, components, consumable supplies and other
related supplies, used for production activities in the manufacturing sector, directly from Japan and overseas and sell
them through machines and industrial tools dealers nationwide. We establish our sales network that is composed of
distribution centers in Tokyo, Nagoya and Osaka and 30 sales offices from Miyagi to Kumamoto. We define the “Metal
working tools field” and the “Industrial built-in equipment field” as our core competencies (our own strength) and aim to
foster this business by focusing on expanding the product diversity and establishing sales methods in the core fields. 【Major products】 ・Metal working tools: cutting tools, toolings, vises and chucks ・Industrial built-in equipments: motors, reduction gear, pneumatic and oil-hydraulic devices, industrial robots ・Other: Environmental equipments, facility equipments, general tools, measuring equipments, material handling 【Major market】
Domestic manufacturers 【Major suppliers】
SMC, SANDVIK, BIG DAISHOWA SEIKI, NITTO KOHKI and other domestic and overseas machines and industrial tools
manufacturers 【Related business environment】
Factory operating ratio of the domestic manufacturing sector 【Basic strategy】
With the aim of differentiating us from other machines and industrial tools trading companies, we define “the Metal
working tools field” consisting of holding devices such as cutting tools, toolings, chucks and vises and measuring
equipments, used for machining process by machine tools, and “the Industrial built-in equipments field” including indus-
trial robots, pneumatic and oil-hydraulic devices and motor reducers as our core fields and execute various measures
leveraging those advances. Besides that, we establish organized proposal methods that identify users’ potential needs
and develop a new market. ■Machine and Tools for Automotive 【Business outline】
The Machine and Tools for Automotive Business retails machine and industrial tools to the automotive sector in Tokai
area. We have the sales system specialized in hard metal tools mainly to serve major automotive parts manufacturers
in Mikawa area. With regard to purchasing, the major product lines are procured directly from manufacturers while
machine tools are sourced from machines and industrial tools trading companies. 【Major products】
Hard metal tools, measuring equipments, machine tools 【Major market】
Domestic automotive industry 【Major suppliers】
OSG, Hitachi Tool Engineering, Tungaloy, G-net, etc.
Net Sales
010,00020,00030,00040,00050,0002009 2010
(Millionsof yen)The Equipment and Tools Business consists of
the Industrial Tools Business as the major
business, offering machines and tools at
wholesale, the Machine and Tools for Automo-
tive, the Housing Equipment business, the
Overseas Business and the Other Business.
Equipment and Tools Business % of Total Sales
Industrial Tools 40.5%
Housing Equipment
5.8%
Other 1.3% Machine and Tools for Automotive 6.2%

8
■■■■Business Outline and Strategy by Segment
【Related business environment】
Factory operating ratio of the automotive sector 【Basic strategy】
In the Machine and Tools for Automotive Business, we define the expansion of the business leveraging sale channels to
good customers in the automotive sector as the basic strategy and increase sales volume based on the expansion of the
breath of product lines as our major policy. In order to achieve it, the FA system division of G-net was transferred to
Gifu Shoji, operating this business, and then we pursue the policy by leveraging their know-how. ■Housing Equipment Business 【Business outline】
The Housing Equipment Business purchases system kitchens, bath units, toilets and other related products directly from
manufacturers and sells them to builders, constructors, remodeling companies and others at wholesale mainly in Osaka
and Nagoya. . 【Major products】
System kitchen, toilets, unit baths, vanity units, and other related products 【Major market】
Domestic new housing market and remodeling market 【Major suppliers】 INAX(LIXIL), Rinnai, Noritz 【Related business environment】
New housing demand and housing remodeling demand 【Basic strategy】
As a business to generate stable earnings, we strive to develop the sales policy for new housing and remodeling de-
mand. ■Overseas Business 【Business outline】
The major part of the Overseas Business is import of machine tools, equipments and tools. We support the Industrial
Equipment Business to establish private label brands and import products. ■Other Business Sale of shop-lifting prevention security systems, propose, design, building and maintenance of production lines and fa-
cilities

9
■■■■Business Outline and Strategy by Segment ■Machine Tools Business 【Business outline】
In the Machine Tools Business, we have agency licenses of machine tools manufacturers in Japan. We select models
of machine tools to meet users‘ needs and sell them through machine dealers. 【Major products】
Machine tools, large machines 【Major market】
Domestic manufacturing sector 【Major suppliers】
Yamazaki Mazak, Mori Seiki, Okuma and other machine tools manufacturers 【Related business environment】
Domestic orders received for machine tools 【Basic strategy】
In the Machine Tools Business, we promote the policies, one of which hold exhibitions to enable users to compare ma-
chine tools among various manufacturers and models and select the best one to satisfy their needs. Moreover, we dif-
ferentiate us from competitors by providing original added values such as proposals for the installation of CAD/CAM to
improve the efficiency of machining and the improvement of production lines. ■Factory Automation Business 【Business outline】
The Factory Automation Business sells machines, facilities and other related products directly to some users, mainly our machine and industrial tools suppliers. 【Major products】
Machine tools, big machines, industrial robots and other related products 【Major market】
Domestic manufacturing sector 【Major suppliers】
Machine tools manufacturers, machines manufacturer, industrial tools manufacturers 【Related business environment】
Domestic orders received for machine tools 【Basic strategy】
The Factory Automation Business offers total proposal including grasping conditions of users’ facilities, installing, re-
placing and maintaining machines and exchanging their components. In addition, we feedback the knowledge,
know-how and needs that accumulated by direct sales to the Industrial Tools Business and the Machine Tools Business ,
which results in enhancing the contents of proposals to users.
Net Sales
02,0004,0006,0008,00010,00012,0002009 2010
(Millionsof yen)The Machine and Facility Business consists of
the Machine Tools Business, offering machine
tools at wholesale and the Factory Automation
Business, offering machines and facilities
directly to some users.
Machine and Facility Business % of Total Sales
Machine Tools 11.4%
Factory Automation 4.2%

10
■■■■Business Outline and Strategy by Segment ■Steel Frame Building Supplies Business 【Business outline】
The Steel Frame Building Supplies Business retails structural members, building supplies, consumable supplies, ma-
chines and tools to the steel fabricators who assemble steel frames of steel and steel reinforced concrete structure
(SRC structure) from our 45 sales offices located from Hokkaido to Kagoshima. Our supplies are purchased from
manufacturers in Japan and overseas and manufactured at our own factories. 【Major products】
In-house products: Braces, foundation bolts, other products
Procured supplies: High strength bolts, fastening products, welding supplies, coating materials, tools 【Major market】
Domestic steel frame building market 【Related business environment】
Demand for new steel frame building 【Basic strategy】
In the Steel Frame Building Supplies Business, we strive to enhance the satisfaction of users by improving users’ con-
venience with almost all items that steel fabricators buy(※)
and establish inventory and distribution systems for prompt
delivery. In order to maintain a certain level of a high share in the small and shrinking market, we strive to ensure stable
growth and profitability through advanced customer management and improvement in efficiency of sales based on the
basic measures above. ※Excluding steel materials, the main parts of steel frame. ■Piping Products Business 【Business outline】
In the Piping Products Business, we retail supplies, equipments and tools to plumbing engineers who install, repair and
maintain piping facilities primarily in factories and manufacturing plants through the sales network as the same as the
Steel Frame Building Supplies Business. In addition, we use the distribution network of the Steel Frame Building Sup-
plies Business to deliver supplies purchased from manufacturers and wholesalers in Japan and overseas. 【Major products】
Pipe & fittings, valve, flange, pipe, fastening products, welding supplies, tools 【Major market】
Domestic plant piping market 【Related business environment】
Demand for new building and repair of factories 【Basic strategy】
The basic strategy of the Piping Products Business is to expand the business as a driver of growth of Furusato. We
aim to increase our market share by leveraging the competitive strength of low break-even point, contributed by sharing
the infrastructure including the sales offices and the logistics network with the Steel Frame Building Supplies Business.
Net Sales
05,00010,00015,00020,00025,0002009 2010
(Millionsof yen)Construction and Piping
Products Business
The Construction and Piping Products Business
consists of the Steel Frame Building Supplies
Business, retailing supplies, machine and tools
to steel fabricators and the Piping Products
Business, retailing supplies and equipments to
pluming engineers.
% of Total Sales
Steel Frame Building Supplies 24.7% Piping
Products 5.9%

11
Consolidated Results
Increase sales and profits, led by a pickup in business
environment
During the year ended March 31, 2011, under this
business environment, Furusato group strived to intensively
market competitive overseas supplies and private label
brand supplies, promote energy-saving proposals, hold
original exhibitions and fairs like the Osaka Machines and
Tools Fair, and develop new business fields and our
customer base.
Consequently, net sales in fiscal 2010 increased by
19.9% to ¥64,454 million compared with the previous fiscal
year. Along with increased sales, gross profit increased
by 17.9% year over year to ¥9,046 million while gross profit
margin dropped by 0.3% due to a significant increase in
sales of the Machine and Facility Business with low
profitability. Selling, general and administrative expenses
decreased by 2.1% year over year to ¥8,278 million. That
was due primarily to recording no equal amortization of
goodwill from this fiscal year, resulting from one-time
amortization of goodwill of Gifu Shoji in the previous fiscal
year despite sales increase and increased allowance for
doubtful accounts affected by the earthquake disaster.
Operating income was ¥767 million (in fiscal 2009,
operating loss ¥ 780 million). Ordinary income totaled
¥1,074 million (in fiscal 2009, ordinary loss ¥ 520 million).
Extraordinary income including insurance premiums
refunded cancellation and gain on transfer of insurance
agency business of our subsidiary was ¥116 million.
Extraordinary loss including loss on sale of investment
securities and loss on disaster was ¥128 million.
Accordingly, net income was ¥569 million (in fiscal 2009,
net loss ¥ 1,407 million).
For the details of operating results by segment, please
refer to the overview of operation by segment from the next
page. Quarterly sales and operating income (loss)
■■■■Overview of Operations in Fiscal 2010 and Forecasts in Fiscal 2011 F isca l y ear Am ount % o f sa les Am ount % o f sales Am oun t %Millions of yenMillions of yenMillions of yenMillions of yenMillions of yenMillions of yen 0 .9%0 .9%0 .9%0 .9% 1,977 ----Net incom e (los s) ( 1,407 ) (2 .6% ) 569569569569 ----Ord inary incom e ( loss) ( 520 ) (1 .0% ) 1 ,0741 ,0741 ,0741 ,074 1 .7%1 .7%1 .7%1 .7% 1,595 ----Opera ting incom e (los s) ( 780 ) (1 .5% ) 767767767767 14 .0%14 .0%14 .0%14 .0% 1,37114.3% 9 ,0469 ,0469 ,0469 ,046 1 .2%1 .2%1 .2%1 .2% 1,547 17 .9%SG&A expenses 8 ,455 15.7% 8 ,2788 ,2788 ,2788 ,278 12 .8%12 .8%12 .8%12 .8% (176) ( 2 .1%)Gross profi t 7 ,6742 009 20 10 Change Net sa les 53 ,776 - 64 ,45464 ,45464 ,45464 ,454 ---- 10,678 19 .9%
Q ua rterly sale sF is ca l y ear 1 Q 2Q 3Q 4 Q T ota l20 0 9 Mill io ns o f yen 1 2 ,3 32 1 3 ,4 5 4 13 ,2 1 4 14 ,7 7 4 5 3,77 620 1 0 Mill io ns o f yen 1 3 ,8 69 1 6 ,2 4 7 16 ,7 8 8 17 ,5 4 9 6 4,45 4Q ua rterly o p erat in g in co m e ( lo ss)F is ca l y ear 1 Q 2Q 3Q 4 Q T ota l20 0 9 Mill io ns o f yen ( 41 6 ) ( 24 4 ) (1 94 ) 61 (7 8 0)20 1 0 Mill io ns o f yen ( 20 7 ) 28 9 2 88 3 96 7 6 7
05,00010,00015,00020,00025,00030,000FY09 1Q 2Q 3Q 4Q FY10 1Q 2Q 3Q 4Q
(Millions of yen)-1,000-750-500-2500250500(Millions of yen)
Net salaes (left Scale) Operating income (right scale)

12
05,00010,00015,00020,0001Q 2Q 3Q 4Q
(Millions of yen)-500-2500250500(Millions of yen)
Net sales (left scale) Operating income (right scale)
Increase in sales and profit due to improved factory
operating ratio of the manufacturing sector
The indices of industrial production closely related to the
Equipment and Tools Business showed an upward trend
throughout the year compared with fiscal 2009. Especially,
the general machinery recorded steady growth while motor
vehicle parts, which had rebounded at a high pace, showed
a slowdown in growth.
In the Equipment and Tools Business, net sales
increased by 24.0% year over year to ¥34,652 million.
According to the sales breakdown, the Industrial Equipment
Business, associated with an operating ratio of
manufacturing facilities, increased by 25.2% year over year
to ¥26,051 million, and the Machine and Tools for
Automotive Business was up 45.5% year over year to
¥3,995 million. Meanwhile, the Housing Equipment
Business slightly decreased by 1.2% year over year to
¥3,759 million. As a result, operating income was ¥468
million (in fiscal 2009, operating loss ¥467 million).
Equipment and Tools Business Equipm ent and Tools Business
F isca l y ear Am oun t % of sales Am oun t % of sales Am ount % o f sale s
Mi llions o f ye n
Mi lli ons o f ye n
Mi lli ons o f ye n
Net sales by busine ss
Mi llions o f ye n
Mi lli ons o f ye n
Mi lli ons o f ye n
Mi lli ons o f ye n
Mi lli ons o f ye n
G ro ss prof it 3 ,244 11.6% 4 ,0774 ,0774 ,0774 ,077 11 .8%11 .8%11 .8%11 .8% 83318 .4%O vers eas 79
O ther 494 1.8% 585585585585 1 .7%1 .7%1 .7%1 .7% 90(44)13.6% 3 ,7593 ,7593 ,7593 ,759 0 .8%0 .8%0 .8%0 .8% 181 228 .9%2 ,745 9.8% 3 ,9953 ,9953 ,9953 ,9950.3% 261261261261 10 .8%10 .8%10 .8%10 .8% 25 .2%O perating inc ome ( loss ) ( 467 )(1 .2%)Hous in g Eq uip men t 3 ,803 11 .5%11 .5%11 .5%11 .5% 1 ,250 45 .5%M ac hine and Tools for Autom ot ive
Indu strial E quipm ent 20 ,815 74.5% 26 ,05126 ,05126 ,05126 ,051 75 .2%75 .2%75 .2%75 .2% 5 ,235Chang e27 ,938 6 ,714 24 .0%(1 .7% ) 468468468468 1 .4%1 .4%1 .4%1 .4% 936 -25 .7%Net sales
2009 2010- 34 ,65234 ,65234 ,65234 ,652 ----
Equ ipmen t an d Too ls Quart erly T ren dEqu ipmen t an d Too ls Quart erly T ren dEqu ipmen t an d Too ls Quart erly T ren dEqu ipmen t an d Too ls Quart erly T ren dF is ca l y ear 1Q 2 Q 3 Q 4Q T ot a l
N et s ales M il lio n s of ye n 7, 74 9 8 ,8 22 8 ,7 09 9 ,3 7 0 34 ,6 5 2O perating inc om e ( los s ) M il lio n s of ye n (2 6) 1 52 1 01 2 4 2 4 6 8
Quarterly sales and operating income (loss)

13
[Industrial Equipment]
[Machine and Tools for Automotive]
The Equipment and Tools Business is impacted by the
factory operating ratio of the manufacturing industry, our
end-users of this business.
According to the Indices of Industrial Production, the
production of general machinery, showing the factory
operating ratio of most of the end users, steadily recovered.
Meanwhile, the inventory ratio of general machinery
remained nearly flat after a significant drop in fiscal 2009.
Amid this improving demand environment, we focused on
our core product fields and proactively developed private
label brand products. Besides that, we conducted
energy-saving diagnosis at end-users’ factories and
proposed high-efficiency facilities and equipments to solve
problems identified by the diagnosis. Consequently, net
sales increased by 25.2% year over year to ¥26,051 million.
The Machine and Tools for Automotive Business reflects
mainly a status of the production and inventory of
automotive parts manufacturers.
The production of motor vehicle parts was on the
downward trend in fiscal 2010 following a rapid recovery in
fiscal 2009. Meanwhile, the inventory ratio gradually rose
in line with the trend of production.
Despite a slowdown in the recovery of the demand, net
sales significantly increased by 45.5% year over year to
¥3,995 million, due partly to a rebound from a substantial
drop in sales after Lehman fall.
[Housing Equipment]
The Housing Equipment Business is affected by the
number of new construction starts, extension and
remodeling of houses.
The new housing starts shows demand for newly-built
housing. According to this statistics, the new housing
starts in 2010 (calendar base) stayed at the bottom,
approximately 810,000 units. The severe situation has
continued since 2009, recording below 800,000 units for
the first time in 45 years.
Under the sluggish demand for new construction and
remodeling of housing, we focused on increasing sales
volume of environment-friendly facilities and equipments
like heat pump. Consequently, net sales decreased by
1.2% to ¥3,759 million.
Equipment and Tools Business
05,00010,00015,00020,00009.1Q09.2Q09.3Q09.4Q10.1Q10.2Q10.3Q10.4Q
(Millions of yen)(FY)
-1000100200300(Year 2005=100)Net sales of Industrial Equipment BusinessProduction of general machinery (right scale)Inventory ratio of general machinery (right scale)
05001,0001,5002,00009.1Q 09.2Q 09.3Q 09.4Q10.1Q 10.2Q 10.3Q 10.4Q
(Millions of yen)-1000100200300(Thousand units)
Net sales of Housing Equipment BusinessNew Housing Starts (right scale)
01,0002,0003,00009.1Q 09.2Q 09.3Q 09.4Q 10.1Q 10.2Q 10.3Q 10.4Q
(Millions of yen)(FY)050
100150(Year 2005=100)Net sales of Machine and Tools for AutomotiveProduction of motor vehicle parts (right scale)Inventory ratio of motor vehicle parts (right scale)
*(Note) Net sales: Fiscal year (1Q=Apr. to Jun.)
*(Note) New Housing Starts:
Calendar year (1Q=Jan. to Mar.)

14
02,0004,0006,0008,00009.1Q09.2Q09.3Q09.4Q10.1Q10.2Q10.3Q10.4Q
(Millions of yen)-2,000-1,00001,0002,000(Domestic order: Billions of yen)
Net sales of Factory Automation Business
Net sales of Machine Tool Business
Domestic Orders Received for Machine Tools (right scale)
02,0004,0006,0008,0001Q 2Q 3Q 4Q
(Millions of yen)-100-50050100(Millions of yen)
Net sales (left scale) Operating income(right scale)
Increase in sales and profits, led by improved domestic
orders received for machine tools
The domestic orders received for machine tools, closely
related to the Machine and Facility Business, increased by
87.1% compared with the previous fiscal year with quarterly
year-over-year growth.
In the Machine and Facility Business, net sales increased
by 40.3% year over year to ¥10,054 million. According to
the sales breakdown, the Machine Tool Business, selling
machine tools at wholesale, was up 40.4% year over year
to ¥7,359 million, and the Factory Automation Business,
directly selling machines and facility equipments to users,
increased by 40.2% year over year to ¥2,695 million.
Consequently, operating income was ¥56 million (in fiscal
2009, operating loss ¥205 million).
[Machine Tool・Factory Automation Business]
The Machine Tool Business and the Factory Automation
Business are affected by the trend in capital investment.
According to the statistics of orders received for machine
tools, domestic demand showed a gradual recovery in
fiscal 2010. Especially, demand in the fourth quarter was
up approximately 80% year over year, but still has reached
approximately a half of the level attained prior to the
Lehman fall.
Under the gradual recovery of demand, in the Machine
Tool Business, we held our original exhibitions and fairs like
the Osaka Machines and Tools Fair and made proposals to
and took orders from users.
Accordingly, net sales of the Machine Tool Business
increased by 40.4% to ¥7,359 million with increased orders,
reflecting a steady growth in our orders received but low
remaining capacity of manufacturers.
Meanwhile, in the Factory Automation Business, net
sales increased by 40.2% to ¥2,695 million.
Machine and Facility Business Ma chine and Fac ility
F isca l year Am oun t % of sales Am oun t % of sales Am ount % o f sale s
Mi llion s o f yen
Mi lli on s o f yen
Mi lli on s o f yen
Net sal es by busine ss
Mi llion s o f yen
Mi lli on s o f yen 26 .8%26 .8%26 .8%26 .8% 773 40 .2 %Fac tory A utom ation 1 ,921 26.8% 2 ,6952 ,6952 ,6952 ,695 -Machine To ol 5 ,243 73.2% 7 ,3597 ,3597 ,3597 ,359 73 .2%73 .2%73 .2%73 .2% 2 ,116 40 .4 %O perating income ( loss ) (205 ) (2 .9 % ) 56565656 0 .6%0 .6%0 .6%0 .6% 2618 .4%8 .4%8 .4%8 .4% 2322009 2010- 10 ,05410 ,05410 ,05410 ,054 ---- Chang e7 ,165 2 ,889 40 .3 %37 .9 %G ro ss prof it 613 8.6% 846846846846Net sales
M a ch in e an d F ac ility B u sin e ssF is ca l y ear 1Q 2Q 3Q 4Q To talN et s ales Mi lli on s o f ye n 1 ,8 0 2 2 ,3 2 7 2 ,6 2 4 3, 30 0 1 0,05 4O perating inc om e ( los s ) Mi lli on s o f ye n (5 0 ) 1 1 2 1 7 3 5 6
Quarterly sales and operating income (loss)
*(Note) Net sales: Fiscal year (1Q=Apr. to Jun.)
*(Note) Domestic orders received for machine tools:
Calendar year (1Q=Jan. to Mar.)

15
02,0004,0006,0008,0001Q 2Q 3Q 4Q
(Millions of yen)-750-500-2500250(Millions of yen)
Net sales (left scale) Operating income (right scale)
Slight increase in sales due to stagnant business
environment
According to the statistics of the amount of steel frame
used, closely related to the Construction and Piping
Products Business, it totaled 4.2 million ton, up 2.3% year
over year, the second consecutive year of the 4 million
ton level.
In the Construction and Piping Products Business, net
sales increased by 5.8% year over year to ¥19,726 million.
According to the sales breakdown, the Steel Frame
Building Supplies Business was ¥15,951 million, up 5.0%
year over year, and the Piping Products Business was
¥3,774 million, up 9.4% year over year. Accordingly,
operating income totaled ¥130 million (in fiscal 2009,
operating loss ¥222 million).
Construction and Piping Products Business
Quarterly sales and operating income (loss)
Construction and P ip ing Products
F isca l year Am oun t % of sales Am oun t % of sales Am ount % o f sale s
Mi llions o f ye n
Mi lli ons o f ye n
Mi lli ons o f ye n
Net sales by busine ss
Mi llions o f ye n
Mi lli ons o f ye n 9 .4%Stee l F ram e Bu il d ing S upp lies 15 ,192Pipin g Prod uct s 3 ,449 18.5% 3 ,7743 ,7743 ,7743 ,774 19 .1%19 .1%19 .1%19 .1% 32515 ,95115 ,95115 ,95115 ,951 80 .9%80 .9%80 .9%80 .9% 759 5 .0%-O perating income ( loss ) ( 222 ) (1 .2% ) 130130130130 0 .7%0 .7%0 .7%0 .7% 353G ro ss prof it 3 ,794 20.4% 4 ,1064 ,1064 ,1064 ,106Net sales
81.5%- 19 ,72619 ,72619 ,72619 ,726 311Chang e18 ,641 1 ,084 5 .8%8 .2%2009 2010 ----20 .8%20 .8%20 .8%20 .8%
C o n stru ct io n an d P ip in g Pr od u cts Q u arter ly T re n dF is ca l y ear 1Q 2Q 3Q 4Q T ota l
N et s ales Mi lli on s o f ye n 4 ,3 1 1 5 ,0 9 2 5 ,4 4 7 4, 87 4 1 9,72 6O perating inc om e ( los s ) Mi lli on s o f ye n ( 15 9 ) 9 8 1 4 0 5 1 13 0

16
[Steel Frame Building Supplies Business]
The Steel Frame Building Supplies Business is greatly
impacted by demand for steel frame buildings.
The volume of steel frame used for building increased
by 2.3% to 4.2 million ton, the second straight year of the
lowest level since 1967. The demand dropped by over
30% compared with the demand level falling between 6
million ton and less than 7.5 million ton since 2001.
Meanwhile, the steel product prices, which affects our
selling prices, increased by approximately 15% from the
fiscal 2009 when it had dropped by nearly 40% year over
year.
Under this sluggish demand environment, we provided
supplies for seismic strengthening works, conducted
marketing campaigns and held original exhibitions and
fairs like “the Warehouse Market.” Meanwhile, we tried
to pass on increase in the cost of steel products to our
selling prices, but we could not complete it due to fierce
competition caused by the sluggish demand.
Consequently, net sales were up 5.0% to ¥15,951 million.
[Piping Products Business]
The Plumbing Business was affected by demand for
building, repair and maintenance of the plumbing
facilities.
The floor area of new construction starts of factories,
showing construction demand for factories, had remained
at a low level, but showed a gradual recovery from the
third quarter.
Although net sales had significantly declined due to
constraint of capital investment after Lehman’s fall
regardless of our new business, net sales in fiscal 2010
increased by 9.4% to ¥3,774 million by intensively
expanding customer base and marketing new supplies
using original sales leaflets.
Construction and Piping Products Business
02,0004,0006,0008,00009.1Q09.2Q09.3Q09.4Q10.1Q10.2Q10.3Q10.4Q
(Millions of yen)-50005001,0001,500(Amounts: Kt)
Net sales of Steel Frame Building Supplies Business (left)
Volume of Steel Frame Used for Building Starts (right)
05001,0001,5002,00009.1Q09.2Q 09.3Q 09.4Q10.1Q 10.2Q 10.3Q10.4Q
(Millions of yen)-1,00001,0002,0003,000(K㎡)
Net sales of Plumbing Business (left scale)Construction Starts of Factories (Floor area: right scale)
*(Note) Net sales: Fiscal year (1Q=Apr. to Jun.)
*(Note) Volume of Steel Frame Used for Building Starts:
Calendar year (1Q=Jan. to Mar.)
*(Note) Net sales: Fiscal year (1Q=Apr. to Jun.)
*(Note) Construction Starts of Factories (1Q=Jan. to Mar.)

17
Note: Forecasts announced on June 16, 2011.
Although the forecasts for the year ending March 31, 2012 had not determined due to the difficulty in making the rational
calculation, impacted by the Great East Japan Earthquake occurred on March 11, 2011, we decided the forecasts based on
the information and prospects available on June16, 2011.
Consolidated Forecasts in Fiscal 2011
Change Fisca l year Am oun t % o f sales Amount % o f sa les %M illions of yenM illions of yenM illions of yenM illions of yenM illions of yenM illions of yen2.4%2010 Actua l 2011 Fo recastsNet sa les 64 ,4 54 - 66 ,00066 ,00066 ,00066 ,000 -SG &A expenses 8 ,2 78 12 .8 % 8 ,3298 ,3298 ,3298 ,329Gross profi t 9 ,0 46 14 .0 % 9 ,2449 ,2449 ,2449 ,244 14 .6%14 .6%14 .6%14 .6% 2.2%12 .6%12 .6%12 .6%12 .6% 0.6%1 .4%1 .4%1 .4%1 .4% 19.3%1 .8%1 .8%1 .8%1 .8% 8.9%Opera ting incom e 767Ord inary incom e 1 ,0 74 1 .7 % 1 ,1701 ,1701 ,1701 ,1701 .2 % 915915915915 0 .9%0 .9%0 .9%0 .9% 4.5%Net incom e 569 0 .9 % 595595595595

18
Financial Section
Consolidated Balance Sheets Consolidated Statements of Income Consolidated Statements of Changes in Shareholders’ Equity Consolidated Statements of Cash Flows ******************************************************
Please refer to “Fact Book 2010” for market data,
management indicators and stock-related data.
http://english.furusato.co.jp/ir/factbook.html

19
(Millions of yen)
Fiscal year 2006 2007 2008 2009 2010Assets
Current assets: 37,229 37,583 31,972 27,900 30,88730,88730,88730,887 Cash and deposits 4,516 3,608 6,624 6,905 6,8616,8616,8616,861 Notes and accounts receivable-trade 28,053 28,554 20,255 16,891 20,00320,00320,00320,003 Inventories 4,141 4,698 4,576 3,265 3,4993,4993,4993,499 Deferred tax assets 318 337 278 279 309309309309 Other 318 483 286 597 257257257257 Allowance for doubtful accounts (119) (99) (49) (39) (42)(42)(42)(42)Noncurrent assets: 13,485 16,441 15,198 14,287 13,64813,64813,64813,648 Property, plant and equipment: 8,758 10,395 10,325 9,992 9,7959,7959,7959,795 Buildings and structures, net 2,351 2,856 2,911 2,735 2,5732,5732,5732,573 Land 5,705 6,808 6,801 6,801 6,8686,8686,8686,868 Other, net 700 730 612 454 353353353353 Intangible assets: 105 1,517 1,230 115 83838383 Goodwill 2 1,398 1,087 - - - - - Other 102 119 142 115 83838383 Investments and other assets: 4,621 4,528 3,643 4,179 3,7693,7693,7693,769 Investment securities 3,160 3,122 2,437 3,054 2,5402,5402,5402,540 Prepaid pension cost - - 138 60 71717171 Deferred tax assets 385 379 372 398 187187187187 Other 1,197 1,131 809 772 1,1401,1401,1401,140 Allowance for doubtful accounts (121) (105) (115) (106) (170)(170)(170)(170)Total assets 50,715 54,025 47,171 42,187 44,53644,53644,53644,536
Liabilities
Current liabilities: 21,125 21,844 14,615 12,170 14,96114,96114,96114,961 Notes and accounts payable-trade 18,048 18,764 12,809 11,106 13,45613,45613,45613,456 Short-term loans payable 500 915 310 - - - - - Income taxes payable 1,283 902 325 48 347347347347 Provision for bonuses - 520 494 409 464464464464 Provision for directors' bonuses 23 29 15 5 13131313 Other 1,270 711 661 600 679679679679Noncurrent liabilities: 2,093 3,320 2,568 1,588 1,2581,2581,2581,258 Long-term loans payable - 1,200 900 - - - - - Provision for retirement benefits 1,157 1,107 903 521 453453453453 Provision for directors' retirement benefits 623 708 51 57 - - - - Other 312 304 713 1,008 805805805805Total liabilities 23,218 25,165 17,183 13,758 16,22016,22016,22016,220
Net Assets
Shareholders' equity: 26,312 28,268 29,352 27,414 27,56227,56227,56227,562 Capital stock 5,232 5,232 5,232 5,232 5,2325,2325,2325,232 Capital surplus 6,446 6,446 6,446 6,135 6,1356,1356,1356,135 Retained earnings 14,816 16,775 17,860 16,097 16,51316,51316,51316,513 Treasury stock (183) (185) (187) (50) (318)(318)(318)(318)Valuation and translation adjustments: 1,183 591 635 1,014 752752752752 Valuation difference on available-for-sale securities 1,183 591 635 1,014 752752752752Minority interests - 0 - - - - - -Total net assets 27,496 28,860 29,987 28,429 28,31528,31528,31528,315Total liabilities and net assets 50,715 54,025 47,171 42,187 44,53644,53644,53644,536
■■■■Consolidated Balance Sheets

20
(Millions of yen) Fiscal yearNet sales 90,378 100.0% 92,064 100.0% 83,103 100.0% 53,776 100.0% 64,45464,45464,45464,454 100.0%100.0%100.0%100.0%Cost of sales 77,043 85.2% 78,866 85.7% 69,971 84.2% 46,101 85.7% 55,40855,40855,40855,408 86.0%86.0%86.0%86.0%Gross profit 13,334 14.8% 13,198 14.3% 13,132 15.8% 7,674 14.3% 9,0469,0469,0469,046 14.0%14.0%14.0%14.0%Selling, general and administrative expenses 8,237 9.1% 8,880 9.6% 9,340 11.2% 8,455 15.7% 8,2788,2788,2788,278 12.8%12.8%12.8%12.8%Operating income (loss) 5,097 5.6% 4,317 4.7% 3,791 4.6% (780) (1.5%) 767767767767 1.2%1.2%1.2%1.2%Non-operating income 688 0.8% 693 0.8% 668 0.8% 446 0.8% 520520520520 0.8%0.8%0.8%0.8% Interest and dividends income 42 57 64 39 48484848 Purchase discounts 567 558 514 322 407407407407 Rent income 55 54 56 55 30303030 Other 23 21 33 28 33333333Non-operating expenses 267 0.3% 278 0.3% 266 0.3% 187 0.3% 212212212212 0.3%0.3%0.3%0.3% Interest expenses 5 15 19 6 0000 Loss on sale of notes payable 8 12 11 2 ---- Sales discounts 223 227 217 155 201201201201 Cost of lease revenue 13 12 12 16 4444 Other 17 10 5 6 6666Ordinary income (loss) 5,518 6.1% 4,732 5.1% 4,193 5.0% (520) (1.0%) 1,0741,0741,0741,074 1.7%1.7%1.7%1.7%Extraordinary income 144 0.2% 19 0.0% 29 0.0% 13 0.0% 116116116116 0.2%0.2%0.2%0.2%Extraordinary loss 66 0.1% 66 0.1% 938 1.1% 855 1.6% 128128128128 0.2%0.2%0.2%0.2%Income (loss) before income taxes and minority interests 5,597 6.2% 4,685 5.1% 3,284 4.0% (1,363) (2.5%) 1,0621,0621,0621,062 1.6%1.6%1.6%1.6%Income taxes-current 2,319 2,029 1,352 84 324324324324Income taxes-deferred 123 65 199 (40) 168168168168Minority interests - 0 - - ----Net income (loss) 3,154 3.5% 2,590 2.8% 1,732 2.1% (1,407) (2.6%) 569569569569 0.9%0.9%0.9%0.9%
2006 2007 2008 2009 2010■■■■Consolidated Statements of Income

21
(Millions of yen) Fiscal 2010 (from April 1, 2010 to March 31, 2011)Capital stock Capital surplus Retainedearnings Treasury stock Total Valuationdifference onavailable-for-sale securities Total valuationand translationadjustmentsBalance at March 31, 2010 5,232 6,135 16,097 (50) 27,414 1,014 1,014 28,429Changes during the period Dividends (152) (152) (152) Net lncome 569 569 569 Purchases of treasury stock (268) (268) (268) Net changes of items other than shareholders' equity, net (262) (262) (262)Total changes of itemsduring the period - - 416 (268) 148 (262) (262) (113)Balance at March 31, 2011 5,232 6,135 16,513 (318) 27,562 752 752 28,315
Shareholders' equity Total netassetsValuation andtranslation adjustments■■■■Consolidated Statements of Changes in Shareholders’ Equity

22
(Millions of yen)
Fiscal year 2006 2007 2008 2009 2010Ⅰ. Cash flows from operating activities:
Income (loss) before income taxes 5,597 4,685 3,284 (1,363) 1,0621,0621,0621,062 Depreciation and amortization 349 392 447 395 341341341341 Amortization of goodwill 10 157 310 1,087 - - - - Impairment loss 55 - - - - - - - Increase (decrease) in provision for directors' bonuses 23 0 (14) (9) 7777 Decrease in provision for retirement benefits (92) (104) (203) (381) (68)(68)(68)(68) Decrease (increase) in prepaid pension costs - - (138) 78 (10)(10)(10)(10) Increase (decrease) in provision for directors' retirement benefits 41 44 (657) 6 (57)(57)(57)(57) Increase (decrease) in provision for bonuses - 474 (26) (84) 54545454 Increase (decrease) in allowance for doubtful accounts (75) (72) (39) (19) 67676767 Interest and dividends income (42) (57) (64) (39) (48)(48)(48)(48) Interest expenses - - 19 6 0000 Interest expenses and loss on sales of notes receivable-trade 13 27 - - - - - - Loss (gain) on sales of investment securities (25) - - - 76767676 Loss on revaluation of investment securities - - 799 - - - - - Gain from prior period adjustment (24) - - - - - - - Gain on sales of noncurrent assets (72) - - - - - - - Gain on transfer of business - - - - (30)(30)(30)(30) Decrease (increase) in notes and accounts receivable-trade (3,930) 1,763 8,253 3,343 (3 ,107)(3 ,107)(3 ,107)(3 ,107) Decrease (increase) in inventories (376) (317) 121 1,310 (233)(233)(233)(233) Decrease in accounts receivable-other 612 - - - - - - - Increase (decrease) in notes and accounts payable-trade 1,432 (986) (5,766) (1,559) 2,2322,2322,2322,232 Increase (decrease) in accrued expenses - (470) (0) (6) 10101010 Increase (decrease) in long-term accounts payable-other - - 200 101 (52)(52)(52)(52) Directors' bonuses (23) - - - - - - - Other 97 (56) 69 (57) 128128128128 Subtotal 3,569 5,479 6,594 2,810 371371371371 Interest and dividends income received 44 58 64 40 48484848 Interest expenses paid - - (20) (13) (0)(0)(0)(0) Interest expenses and loss on sales of notes receivable-trade (13) (19) - - - - - - Income taxes paid (2,276) (2,483) (1,925) (737) (46)(46)(46)(46) Income taxes refund - - - - 393393393393 Net cash provided by (used in) operating activities 1,323 3,034 4,712 2,099 766766766766Ⅱ. Cash flows from investing activities:
Payments into time deposits (350) (66) (85) (129) (420)(420)(420)(420) Proceeds from withdrawal of time deposits - 150 366 85 176176176176 Purchases of property, plant and equipment (498) (1,524) (403) (36) (109)(109)(109)(109) Proceeds from sales of property, plant and equipment 268 2 10 0 - - - - Purchase of investment securities (201) (8) (12) (20) (11)(11)(11)(11) Proceeds from sales of investment securities 32 - 20 - 36363636 Proceeds from transfer of business - - - - 30303030 Purchase of investments in subsidiaries - (3,032) (0) - - - - - Payments of loans receivable (12) (12) (12) (16) (22)(22)(22)(22) Collection of loans receivable 15 12 12 15 16161616 Other (63) (69) (56) (20) (30)(30)(30)(30) Net cash provided by (used in) investing activities (811) (4,550) (162) (122) (334)(334)(334)(334)Ⅲ. Cash flows from financing activities: Net decrease in short-term loans payable (230) (275) (605) (10) - - - - Proceeds from long-term loans payable - 1,500 - - - - - - Repayment of long-term loans payable - - (300) (1,200) - - - - Purchase of treasury stock (3) (2) (1) (174) (268)(268)(268)(268) Proceeds from disposal of treasury stock 699 - - - - - - - Cash Dividends paid (574) (631) (646) (355) (152)(152)(152)(152) Net cash provided by (used in) financing activities (109) 591 (1,552) (1,740) (420)(420)(420)(420)Ⅳ. Effect of exchange rate changes on cash and cash equivalents 0 - - - - - - -Ⅴ. Net increase (decrease) in cash and cash equivalents 403 (923) 2,997 236 11111111Ⅵ. Cash and cash equivalents at beginning of period 4,062 4,465 3,541 6,539 6,7756,7756,7756,775Ⅶ. Cash and cash equivalents at end of period 4,465 3,541 6,539 6,775 6,7876,7876,7876,787
■■■■Consolidated Statements of Cash Flows

23
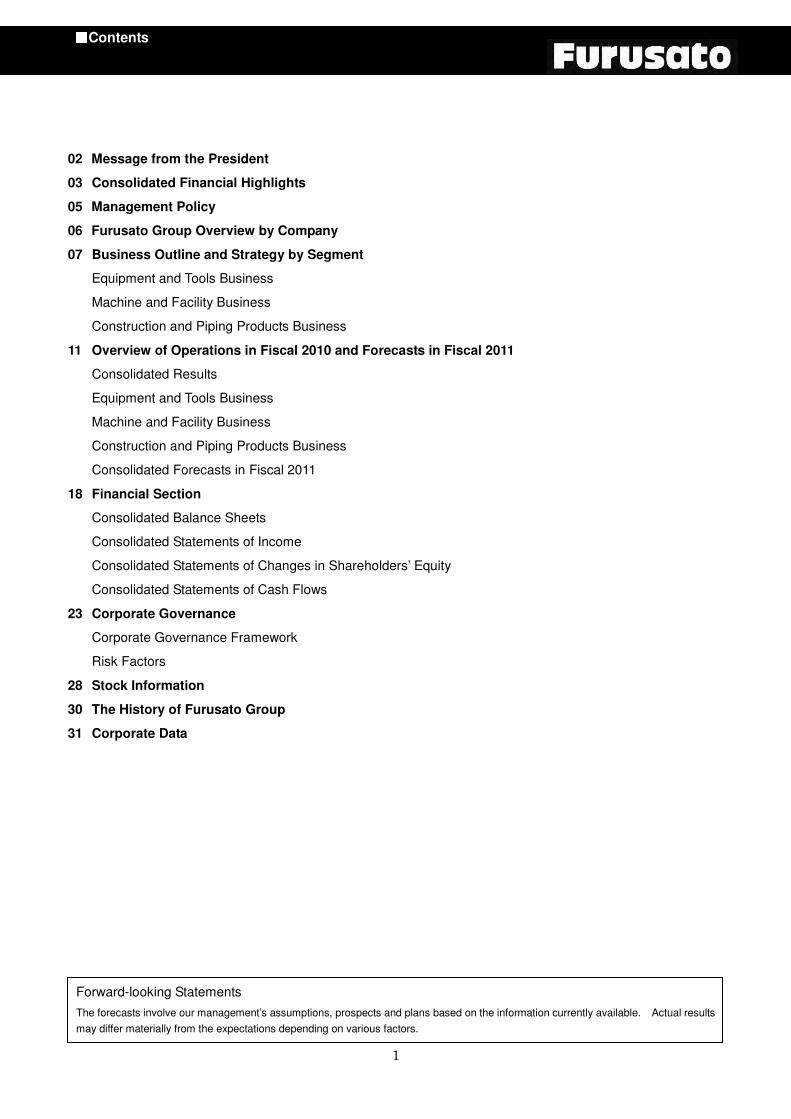
■■■■Corporate Governance
Basic stance on corporate governance framework
To achieve “sustainable corporate group”, Furusato re-
gards the corporate governance as one of the critical issues
and strives to enhance the corporate governance system.
The principal measures are the following three items: ①Reforming management structure and systems
We will discuss to reform the management structure and
systems in order to make quick decisions and streamline
business operations. ②Improving transparency of corporate activities
In order to fulfill the accountability to shareholders and
investors, we will enhance the disclosure system to dis-
close information in a timely and accurate manner with high quality. ③Establishing the compliance system
In order to reinforce the compliance, we will set up our
principles and deliberate the systems and mechanism to
manage the compliance system. Status of implementation of corporate governance
framework ①Overview of corporate governance framework
Furusato is a company with the Corporate Auditors.
The Board of Corporate Auditors consists of three
members, two Outside Corporate Auditors and one
Full-time Corporate Auditor. The Corporate Auditors at-
tend meetings of the Board of Directors, through which they
audit the legality and appropriateness of the performance of
the Directors’ duties, business operations and financial
conditions of the Company. The Corporate Auditors reg-
ularly exchange opinions with the Representative Director
and review and monitor management documents and other
important reports.
The Board of Directors decides the important manage-
ment matters. The Directors, in principal, meet monthly,
with extraordinary meetings as necessary. The Board
consists of four Directors in order to make appropriate and
quick decisions based on sufficient discussion, which de-
cides items defined by laws and regulations and important
issues concerning the management. In addition, it deli-
berates the status of achievement of management goals
and considers appropriate measures to respond to the
ongoing and potential problems.
②Reasons for adopting corporate governance framework
Furusato appointed two Outside Corporate Auditors as
independent auditors to supervise the business execution
functions separately from the Board of Directors. They
attend the meetings of the Board of the Directors and other
important business meetings in order to enhance the effec-
tiveness of management oversight. We maintain our cur-
rent corporate governance framework that can monitor the
status of execution of duties of each Director by the Outside
Corporate Auditors in an independent and fair manner.
The Outside Corporate Auditors have no personal, capi-
tal, business relationships with and no particular vested
interest in the Company. ③Status of implementation of internal control framework 《Basic stance on internal control framework》
Furusato makes efforts to ensure the legality and effi-
ciency of any business operations and control risks. In
addition, we believe it is essential to review, improve and
fulfill the internal control framework as socioeconomic cir-
cumstances and other business environment change. 《Status of implementation of internal control framework》
a) In accordance with the basic policy to set up the internal
control system resolved at the meeting of the Board of
Directors in May 2006, Furusato is working on estab-
lishing the framework. b) As one of the systems to ensure the Directors and em-
ployees perform their duties in accordance with the laws
and the Articles of Incorporation, we compiled and dis-
tributed a handbook including Corporate Philosophy,
Code of Conduct, Corporate Action Guideline, Corporate
Ethics and Whistleblower System to all officers and em-
ployees of Furusato and its group companies. It con-
tributes to educate individual members and to raise
awareness of the internal control.
c) With regard to the information relating to the perfor-
mance of duties by the Directors and employees, we run
a system to appropriately store and manage the minutes
of important meetings, approval documents and con-
tracts by the relevant divisions according to a type of the
information.
d) With regard to the management of risks that could result
in losses, we are working on identifying any risks inhe-
rent in the Company and creating the system to take
appropriate measures on the significant risks.
e) To ensure that the Directors perform their duties, the
Board of Directors holds a regular meeting once a month.
Corporate Governance Framework

24
■■■■Corporate Governance
In the meeting, the Directors discuss the issues stipulated
by the Board of Directors Rule and the issues applicable
to its deliberation standard and make decisions on the
important matters.
f) The Corporate Auditors and the Internal Auditing Division
ensure the effectiveness of and improve the efficiency of
the audits by exchanging opinions when they review the
auditing reports. In addition, the Corporate Auditor en-
sures a system for efficient and effective audits by pe-
riodical dialogue with the Accounting Auditors. ④Status of implementation of risk management framework
Furusato regards the reinforcement of the compliance as
one of the critical issues. We compiled and distributed the
in-house Compliance Manual to all board members and
employees of Furusato and its group companies. We
raise awareness of the compliance among them through
in-house trainings, etc. In order to enhance the risk
management framework, we regularly hold the Risk Man-
agement Committee, chaired by the Director and General
Manager of the Headquarters of the Administrative Division.
The Committee evaluates and analyzes the risks which
could affect operations of the Furusato Group and formu-
lates appropriate measures to respond to them.
Status of internal audits and audits by Corporate Au-
ditors ①Internal Auditing Division The Internal Auditing Division with two Internal Corporate
Auditors consistently implements on-site audits in order to
penetrate the internal control systems into Furusato Group
overall, to make operating processes appropriate, to
comply with laws and rules, and to fairly execute opera-
tional procedures. ②Corporate Auditors, Board of Corporate Auditors
Furusato is a company with the Corporate Auditors. The
Board of Corporate Auditors consists of three members,
two Outside Corporate Auditors and one Full-time Corpo-
rate Auditor. The Corporate Auditors attend meetings of
the Board of Directors, through which they audit the legality
and appropriateness of the performance of the Directors’
duties, business operations and financial conditions of the
Company. The Corporate Auditors regularly exchange
opinions with the Representative Director and review and
monitor management documents and other important re-
ports.
All of the three Corporate Auditors have their profound
knowledge in financial and accounting fields, respectively
as follows:
a) Yoshitsugu Takata, the Full-time Corporate Auditor, has
his long experience in the financial institution and exper-
tise mainly in finance.
b) Tomio Kawaguchi, the Outside Corporate Auditor, has
his long expertise and experience as a judge and lawyer.
c) Yoshiharu Senoue, the Outside Corporate Auditor, with
his long experience in the financial institution, was for-
merly the Full-time Corporate Auditor at Astellas Pharma
Inc. 《Communication among Internal Auditing Division, Corpo-
rate Auditors and Accounting Auditors, and Relation be-
tween their audits and internal control section》
The Corporate Auditors ensure that the audits are con-
ducted effectively and efficiently by exchanging opinions
when the auditing plan is compiled at the start of each fiscal
year and when the regular internal audits reports and fol-
low-up audit reports are reviewed, as well as by hearing
internal audit policies, action plans and audit results from
the Internal Auditing Division. Besides, the Corporate
Auditors ensure that the audits are conducted effectively by
hearing audit plans, quarterly review reports and audit re-
ports compiled by the Accounting Auditors, by attending
inventory audits conducted by the Accounting Auditors and
by exchanging opinions whenever necessary.
The Internal Auditing Division collaborates with the Ac-
counting Auditors by sharing the auditing results and other
information through the exchange of opinions and the dis-
cussions in a timely and appropriate manner as well as by
attending the inventory audits conducted by the Accounting
Auditors.
The Internal Control Section receives reports on over-
views of audits from the Internal Auditing Division, the
Corporate Auditors and the Accounting Auditors. In the
event that the Internal Control Section finds items where
improvement is deemed necessary, it establishes the
framework to improve them.
Outside Directors and Outside Corporate Auditors
Furusato appointed two Outside Corporate Auditors.
The Outside Corporate Auditors, Tomio Kawaguchi and
Yoshiharu Senoue, have no personal, capital, business
relationships with and no particular vested interest in the
Company.
Furusato appointed the Outside Corporate Auditors from
25
■■■■Corporate Governance
the outside of the Company, who are independent from the
Board of Directors. We believe that the oversight of ex-
ecution of management activities by the Outside Corporate
Auditors in an independent and fair manner contributes to
enhancing the effectiveness of management oversight.
In regard to the election of the Outside Corporate Audi-
tors, both of them are appointed as an independent board
member. They fully fulfill audit functions by asking ques-
tions and stating their opinions in an independent and fair
manner at the meeting of the Board of Directors.
The Outside Corporate Auditors ensure that the audits
are conducted effectively and efficiently by exchanging
opinions when the auditing plan is compiled at the start of
each fiscal year and when the regular internal and follow-up
audit reports are reviewed, as well as by hearing internal
audit policies, action plans and interim and year-end audit
results from the manager of the Internal Auditing Division at
the meetings of the Board of Corporate Auditors. Ac-
cording to the audit policy defined at the Board of Corporate
Auditors, the Corporate Auditors mainly review important
documents and investigate subsidiaries at the meetings of
the Board of the Directors and others. Before attending at
the meeting of the Board of Directors, the Outside Corpo-
rate Auditors receive explanations on the agenda in ad-
vance from the Full-time Corporate Auditor whenever ne-
cessary.
Furusato does not appoint the Outside Directors. We
appointed two Outside Corporate Auditors out of three
Corporate Auditors, which contributes to strengthening the
oversight of execution of management activities. As for
the corporate governance, we believe that the management
oversight function in an objective and neutral point of view
from outside of the company is vital. Thus, we adopted
the current framework which enables sufficient oversight of
management from the outside of the company through the
audit by the two Outside Corporate Auditors. Remuneration for Directors and Auditors ①Total remuneration for Directors and Corporate Auditors with a breakdown by type
Classification
Total amounts
paid (Thousand yen)
Total amounts paid by type of remuneration (Thousand yen) No. of
Directors and
Auditors Base
salary
Stock
option Bonuses
Retirement
benefits
Directors (Exc. Outside
Directors)
66,180 60,755 - 5,425 - 5 Corporate Auditors (Exc. Outside Corporate
Auditors)
13,650 13,500 - 150 - 1 Outside Directors
and Outside Cor-
porate Auditors
12,350 12,300 - 50 - 2
Furusato Group Corporate Governance Framework
Election/ Dismissal
Audit Accounting Audit
Election/ Dismissal Election/ Dismissal
Report/ Collaboration
Dismissal/ Supervision
General Meeting of Shareholders
Management
Council
President and Representative Director
Divisions, Group Company
Board of Auditors
3 Auditors Accounting Auditors
Audit
Report
Election
Board of Directors
4 Directors
Internal Audit Division
Report/ Collaboration

26
■■■■Corporate Governance
Note: Total amount of remuneration paid to Directors does not include the remuneration for services rendered in any capacity other than
as a director. ②Total amount of annual remuneration paid to Director and Corporate Auditor on a consolidated basis
Omitted because there is no Director or Corporate Auditor who receives more than ¥100 million. ③Method of determining remuneration policies
The aggregate maximum amounts of annual remuneration to pay to Directors and Corporate Auditors were approved
respectively at the Ordinary General Meeting of Shareholders.
The amounts of annual remuneration to pay to Directors were allocated at the meeting of the Board of Directors while the
amounts of annual remuneration to pay to Corporate Auditors were allocated at the meeting of the Board of Corporate Au-
ditors.
The aggregate maximum amounts of annual remuneration to pay to Directors and Corporate Auditors were approved
¥200 million (excluding the remuneration for services rendered in any capacity other than as a director) and ¥50 million,
respectively at the 50th Ordinary General Meeting of Shareholders held on June 27, 2008.
Shares Holding ①Total number of companies and amounts on the balance sheet for shares holding for reasons other than pure investment
12 stocks, 1,281,811 thousand yen②Stock name, number of shares, balance sheet amounts and purpose of holding for shares holding that are not for pure
investment.
Stock name No. of shares
hold (Shares)
Balance sheet
amounts
(Thousand yen)
Purpose of holding
Seiwa Chuo Holdings Corporation 60,000 642,000 Developing and maintaining
a business relationship
Mory Industries Inc. 440,000 180,400 Developing and maintaining
a business relationship
Hoshiden Corporation 140,000 118,300 Developing and maintaining
a business relationship
Mori Seiki Co., Ltd. 100,000 99,300 Developing and maintaining
a business relationship
SHINSHO Corporation 393,904 83,901 Developing and maintaining
a business relationship
Mitsubishi UFJ Financial Group, Inc. 122,000 46,848 Developing and maintaining
a business relationship
HANWA Co., Ltd. 117,809 43,353 Developing and maintaining
a business relationship
MS&AD Insurance Group Holdings, Inc. 10,800 20,455 Developing and maintaining
a business relationship
Daiwa House Industries, Co., Ltd. 20,000 20,440 Developing and maintaining
a business relationship
Maeda Metal Industries, Ltd. 100,000 17,000 Developing and maintaining
a business relationship
Resona Holdings, Inc. 15,500 6,138 Developing and maintaining
a business relationship
Daishin Chemical Co., Ltd. 5,000 3,675 Developing and maintaining
a business relationship

27
■■■■Corporate Governance
The following risks may influence the Furusato Group’s
operating results, stock price and financial condition.
The information concerning the future presented herein
are forecasts as of May 6, 2011, including but not limited to
the items presented herein.
1. Trends in capital investment
Furusato Group consists of Furusato Industries (Con-
struction and Piping Products Business) and its subsidiar-
ies, G-net Corporation (Equipment and Tools Business,
Machine and Facility Business), Gifu Shoji Co., Ltd.
(Equipment and Tools Business) and Wakaba Lease (Other
Business). Wakaba Lease was dissolved on March 31,
2011 and is in the course of liquidation.
Furusato, closely related to steel frame building industry,
offers procured and in-house steel frame construction sup-
plies excluding steel products to steel fabricators. G-net,
closely associated with machine tools industry, offers a
wide range of machines and industrial tools to machines
and industrial tools dealers. Gifu Shoji Co., Ltd., closely
related to the automotive industry, offers the automotive
manufacturers and their group companies mainly cutting
tools.
As for Furusato, procured construction supplies such as
high strength bolts and in-house construction supplies such
as braces are mainly used for non-dwellings including fac-
tories, warehouses and stores. Therefore, the results of
operations tend to be impacted by the trends in private
capital investment. Accordingly, there is a risk that profit-
ability may deteriorate depending on sluggish demand for
private capital investment due to the fierce competition.
G-net is a primary wholesaler to mainly offer the machine
tools and industrial tools. The Machine and Facility Busi-
ness tends to be volatile, reflecting demand for the capital
investment in the manufacturing sector and the number of
the orders received for the machine tools. Therefore,
there is a risk that the profitability may deteriorate due to
sluggish orders received depending on the trends in the
capital investment in the manufacturing sector.
Gifu Shoji offers primarily cutting tools to the automotive
manufacturers and their group companies. Gifu Shoji is
not impacted significantly by the capital investment trend
like G-net, but affected by the factory operating ratio in the
automotive industry because the machine tools business
accounts for a small portion of its total sales.
The trends in the capital investment could adversely
affect our results of operation and financial condition.
2. Risk arising from bad debts
Furusato is a retailer to offer the procured and in-house
steel frame construction supplies directly to approximately
8,000 steel fabricators nationwide. Therefore, the risk
arising from bad debts is diversified because our business
does not depend on single or a limited number of suppliers.
However, the bad debts may increase, negatively im-
pacted by the operating results of building constructors
under continued severe business environment in the con-
struction industry.
Meanwhile, G-net serves approximately 4,200 machines
and industrial tools dealers nationwide. The trade re-
ceivable per customer is relatively high so that G-net mainly
controls credit lines by each customer. G-net makes every
effort to minimize the risk of the bad debts by diversifying its
sales volume through expansion of the customer base.
The bad debts may increase depending on the operating
results of machines and industrial tools dealers.
The market trend could have an impact on the Furusato
Group’s operating results and financial condition. 3. Risks arising from natural disasters and others
In the event of social turmoil occurred by natural disas-
ters including earthquakes and floods, accidents like fires,
epidemics, terrorism, wars and other factors, the Furusato
Group may suspend its business activities or lose business
opportunities. In addition, significant expenses for the
restoration of the damaged facilities may be incurred.
Therefore, these impacts triggered by the disasters could
affect the Furusato Group’s operating results and financial
condition.
Risk Factors

28
■■■■Stock Information
Furusato regards our dividend policy as one of the critical
management issues and adopts the following policy:
1. In order to increase the returns of profits to shareholders
over the long term, we strive to reinforce our profit structure.
To realize it, we put our priority on securing retained earn-
ings for active investment in our growing businesses.
2. The target annual dividend payout ratio is approximately
25% of consolidated net income. In case that the annual
dividend per share based on the above dividend payout
ratio is less than ¥10, we aim to continue the stable divi-
dend returns to pay at least ¥10 per share.
Note: Amount is rounded up by¥0.5.
¥0.01 - ¥0.49; ¥0.5
¥0.51 - ¥0.99; ¥1.0 In fiscal 2010, annual dividend is ¥10 per share includ-
ing the interim dividend of ¥5 per share based on the
above basic policy.
The annual dividend for fiscal 2011, ending March 31,
2012 is expected to be ¥10 per share (the forecast an-
nounced on June 16, 2011).
Basic Policy for Returns to Shareholders
Dividends for Fiscal 2010 and Dividends Fore-
cast for Fiscal 2011
Principal ShareholdersPr incipal ShareholdersPr incipal ShareholdersPr incipal Shareholders Shares %FRT, Ltd. 2,168,361 14.50%The Bank of Tokyo-Mitsubishi UFJ, Ltd. 707,840 4.73%Ryoichi Furusato 585,500 3.91%Nippon L ife Insurance Company 496,640 3.32%Japan Trustee Services Bank, Ltd. (Trust account) 476,500 3.19%Ryohei Furusato 401,500 2.68%SHIN SHO Corpora tion 386,800 2.59%HANWA Co., L td. 344,000 2.30%※ The ratio of investment in Furusato is calculated after deduction of the number of treasury stock (615,569 shares). Investment in Furusato
Furusato Stock Price, Trading VolumeFurusato Stock Price, Trading VolumeFurusato Stock Price, Trading VolumeFurusato Stock Price, Trading VolumeFiscal year 2006 2007 2008 2009 2010Common stock price (High) Yen 2,630 1,950 1,175 812 775775775775Common stock price (Low) Yen 1,436 906 652 473 384384384384Common stock price (Close) Yen 1,934 1,000 797 658 748748748748Nikkei Stock Average (Close) Yen 17,287.65 12,525.54 8,109.53 11,089.94 9,755.109,755.109,755.109,755.10TOPIX (Close) Yen 1,713.61 1,212.96 773.66 978.81 869.38869.38869.38869.38Trading volume Shares 4,999,700 5,753,000 2,468,500 2,754,900 3,175,5003,175,5003,175,5003,175,500【Reference】Trading volume (Tokyo Stock Exchange) Shares 560,200 500,500 266,200 217,000 246,300246,300246,300246,300Note: Stock price and trading volume are quoted from those on the First Section of Osaka Securities Exchange. Ownership BreakdownOwnership BreakdownOwnership BreakdownOwnership Breakdown((((As of March As of March As of March As of March 31313131, , , , 2011201120112011))))Government& LocalGovernment0.01%SecuritiesCompanies0.19% OtherCompanies32.12%ForeignCompanies3.79% FinancialInstitutions19.16%TreasuryStock3.95% Individuals &Others40.78%
Trading Volume02,000,0004,000,0006,000,000
2006 2007 2008 2009 2010(Shares)Furusato Stock Price
05001,0001,5002,0002,5002006 2007 2008 2009 2010
(Yen)05,00010,00015,00020,000(Yen)
Common stock price (Close: Left scale)Nikkei Stock Average (Right scale)

29
■■■■Stock Information
①Total of shares purchased in accordance with the resolutions at the meeting of the Board of Directors
Detail No. of shares holds (shares)
Total amount (yen)
Resolution at the meeting of the Board of Directors on November
4, 2009 500,000 300,000,000
Treasury stock purchased in fiscal 2010 152,300 89,177,700
Total number and total amount of remaining shares resolved 10,500 36,520,100
% of the non-executed shares at the end of fiscal 2010(%) 2.1 12.2
Detail No. of shares holds (shares)
Total amount (yen)
Resolution at the meeting of the Board of Directors on June 8,
2010 200,000 120,000,000
Treasury stock purchased in fiscal 2010 66,400 36,420,100
Total number and total amount of remaining shares resolved 133,600 83,579,900
% of the non-executed shares at the end of fiscal 2010(%) 66.8 69.6
Detail No. of shares holds (shares)
Total amount (yen)
Resolution at the meeting of the Board of Directors on July 9,
2010 500,000 300,000,000
Treasury stock purchased in fiscal 2010 287,400 142,390,500
Total number and total amount of remaining shares resolved 212,600 157,609,500
% of the non-executed shares at the end of fiscal 2010(%) 42.5 52.5
Note: Furusato resolved the change of period of purchase from July 12, 2010 to June 20, 2011 at the meeting of the Board of Directors held on March 31, 2011 as follows:
Revised period of purchase: from July 12, 2010 to March 31, 2011
② The number of treasury shares retired and held
Detail No. of shares
(shares)
The number of treasury shares held (As of March 31, 2011) 615,569
Purchase of Treasury Shares

30
■■■■The History of Furusato Group [1946]
Construction hardware manufacturing
business commenced.
[1959]
Furusato Tekkosho Ltd. founded.
[1963]
Shiga Plant established. Braces
manufactured.
[1973]
Renamed to Furusato Industries, Ltd.
[1986]
Furusato stocks listed on the New
Second Section of Osaka Securities
Exchange.
Shiga Plant acquired a JIS mark
certificate.
[1988]
Issued convertible bonds worth 30
million Swiss Francs.
[1991]
Issued convertible bonds worth 70
million Swiss Francs.
[1993]
Furusato stocks listed on the Second
Section of Osaka Securities Exchange.
[1909]
Gomiya Shoten founded.
[1947]
Gomiya Kikou Co., Ltd. established.
[1949]
Renamed to Gomiya Kikou Shoukai Co.,
Ltd.
[1960]
Renamed to Gomiya Co., Ltd.
Tokyo branch established.
[1964]
G-net stocks listed on the Second
Section of Osaka Securities Exchange.
[1983]
Nobuo Tsumuro named President and
Representative Director.
[1987]
Hiroshi Takehana named President and
Representative Director.
[1991]
Renamed to G-net Corporation, one of
CI (Corporate Identity) program
introduced.
[1999]
Announced a mid-term business plan "Vision for 21st Century”.
[1934]
Kayo Nenryo Co., Ltd.
Established.
[1941]
Renamed to Gifu Shoji Co., Ltd.
[1947]
Nagoya branch opened.
[1962]
Hamamatsu branch opened.
[1974]
Kariya branch opened.
[1995]
Joined Tokai Group.
[2006]
Kita-kyusyu subbranch office
opened.
Feb. 2000 Announced investment in G-net.
Aug. 2000 Accepted a third party allocation of new stocks of G-net Corporation, making G-net a subsidiary.
(Investment ratio: 51%)
Aug. 2002 G-net became a wholly-owned subsidiary of Furusato by a share exchange.
Sep. 2003 Headquarters of Furusato and Headquarters and Osaka branch of G-net relocated to Chuo-ku, Osaka .
(currently headquarters of Furusato Group)
Jun. 2004 Ryoichi Furusato named Chairman and Representative Director, and Ryohei Furusato named President and
Representative Director of both Furusato and G-net.
Nov. 2004 Furusato stocks listed on the Second Section of Tokyo Stock Exchange.
Mar. 2006 Furusato stocks listed on the First Section of Tokyo Stock Exchange and Osaka Securities Exchange.
Oct. 2007 Gifu Shoji became a subsidiary of Furusato by its share acquisition.
Oct. 2009 Nagoya FA System division of G-net transferred to Gifu Shoji.
Furusato Group
Furusato Industries, Ltd. G-net Corporation Gifu Shoji Co., Ltd.
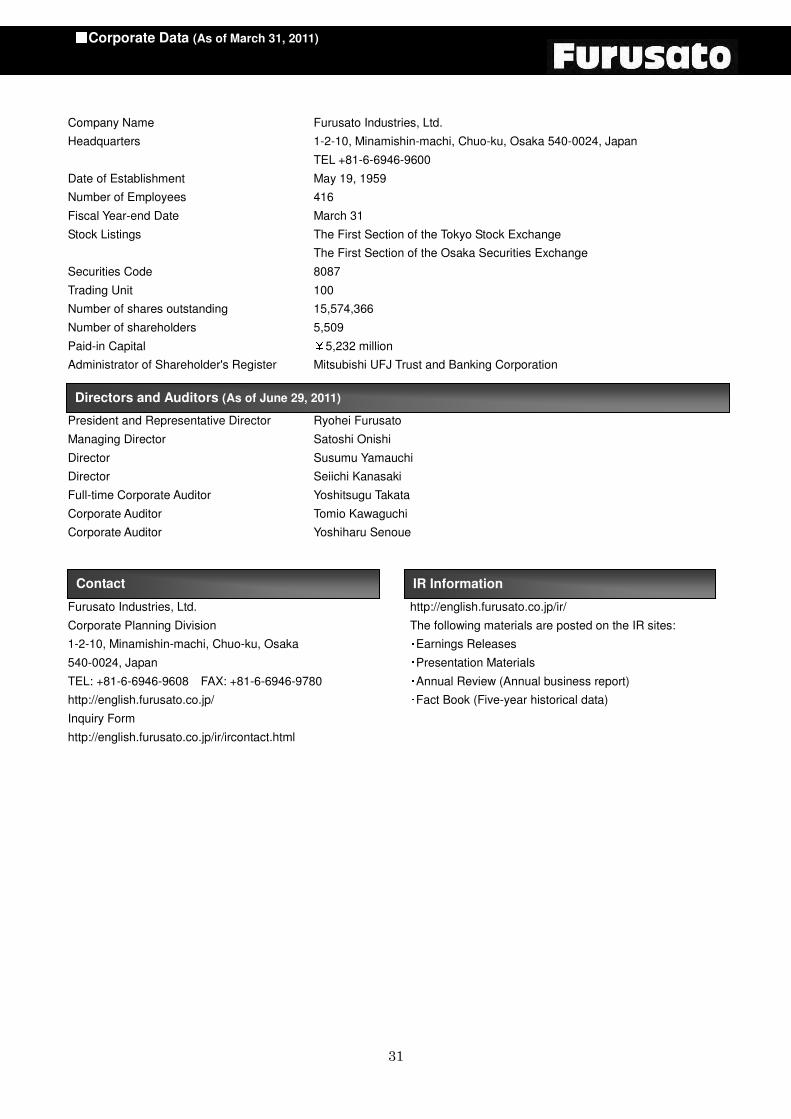
31
■■■■Corporate Data (As of March 31, 2011) Company Name Furusato Industries, Ltd.
Headquarters 1-2-10, Minamishin-machi, Chuo-ku, Osaka 540-0024, Japan
TEL +81-6-6946-9600
Date of Establishment May 19, 1959
Number of Employees 416
Fiscal Year-end Date March 31
Stock Listings The First Section of the Tokyo Stock Exchange
The First Section of the Osaka Securities Exchange
Securities Code 8087
Trading Unit 100
Number of shares outstanding 15,574,366
Number of shareholders 5,509
Paid-in Capital ¥5,232 million
Administrator of Shareholder's Register Mitsubishi UFJ Trust and Banking Corporation President and Representative Director Ryohei Furusato
Managing Director Satoshi Onishi
Director Susumu Yamauchi
Director Seiichi Kanasaki
Full-time Corporate Auditor Yoshitsugu Takata
Corporate Auditor Tomio Kawaguchi
Corporate Auditor Yoshiharu Senoue
Furusato Industries, Ltd.
Corporate Planning Division
1-2-10, Minamishin-machi, Chuo-ku, Osaka
540-0024, Japan
TEL: +81-6-6946-9608 FAX: +81-6-6946-9780
http://english.furusato.co.jp/
Inquiry Form
http://english.furusato.co.jp/ir/ircontact.html
http://english.furusato.co.jp/ir/
The following materials are posted on the IR sites: ・Earnings Releases ・Presentation Materials ・Annual Review (Annual business report) ・Fact Book (Five-year historical data)
Directors and Auditors (As of June 29, 2011)
Contact IR Information