Annual Report - assets.winton.com · “Investment Management” section of this report. During...
48
Annual Report For the year ended 31 December 2017 WINTON GROUP LIMITED Company Registration No. 08719455 (England and Wales)
Transcript of Annual Report - assets.winton.com · “Investment Management” section of this report. During...

Annual Repor tFor the year ended 31 December 2017
WINTON GROUP LIMITED
Company Registration No. 08719455 (England and Wales)

WINTON GROUP LIMITEDAnnual Report for the year ended 31 December 2017
2
A h i g h - p e r fo r m i n g q u a n t i ta t i ve i nve s t m e n t a n d d a ta s c i e n c e f i r mApplying the Scientific Method to Financial Market InvestingWinton Group has a strong investment track record established over 20 years of using statistics and advanced computational techniques to identify subtle patterns in financial markets.
Multi–Strategy Cumulative Returns Since Inception
Consistent, Systematic Approach Across a Focused Product RangeWinton believes more reliable investment decisions can be made by using statistical inference from empirical evidence rather than deductive reasoning from economic axioms.
Group Assets Under Advisement (AuA) by Strategy
y We pursue ambitious investment in research, data and technology to develop strategies that can profit from predictable market behaviour
y Our products range from long-only equities to diversified multi-asset offerings, but are all underpinned by the same investment philosophy
y We help institutions and individuals meet their investing goals by building intelligent, long-term investment systems that evolve as markets change
y We take pride in the trust that our clients around the world place in us
Extensive International NetworkWinton has nine offices worldwide, providing global research and client advisory capabilities.
Winton Group at a glance
Pensions/Institutions 31%
Wealth Management/Family Office 31%
Sovereign Wealth Funds 16%
Third-Party Distributors 14%
Corporate/Insurance 5%
Other 3%
Multi Strategy 58%
Diverse Futures and Forwards 37%
Other, including Long-Only Equities 5%US$28 .5bn
Highly Diversified Client BaseWinton manages assets for a broad range of investors including some of the world’s largest pension and sovereign wealth funds.
Group Assets Under Advisement (AuA) by Investor
LO N D O N
OX F O R D
N E W YO R KS A N F R A N C I S C O
Z U R I C H
H O N G KO N G
S H A N G H A ITO K YO
S Y D N E Y
0 . 5
1
2
4
8
1 9 9 7 1 9 9 9 2 0 0 1 2 0 0 3 2 0 0 5 2 0 0 7 2 0 0 9 2 0 1 1 2 0 1 3 2 0 1 5 2 0 1 7
Gro
wth
of
$1
W i n t o n M u l t i S t r a t e g y J P M U S A g g r e g a t e B o n d I n d e x M S C I W o r l d I n d e x

WINTON GROUP LIMITEDAnnual Report for the year ended 31 December 2017
3
Ta b l e of c o n te n t s
Group St ra teg ic Repor t
Group Per formance . . . . . . . . . . . . . . . . . . . . . . . . . . . . . . . . . . . . . . . . . . . . . . . . . . . . . . . . . . . . . . . . . . . . . . . . . . . . . . . . . . . . 4
Per formance Rev iew . . . . . . . . . . . . . . . . . . . . . . . . . . . . . . . . . . . . . . . . . . . . . . . . . . . . . . . . . . . . . . . . . . . . . . . . . . . . . . . . . . . 5
CEO’s Repor t . . . . . . . . . . . . . . . . . . . . . . . . . . . . . . . . . . . . . . . . . . . . . . . . . . . . . . . . . . . . . . . . . . . . . . . . . . . . . . . . . . . . . . . . . . . . . . . . 6
Investment Management . . . . . . . . . . . . . . . . . . . . . . . . . . . . . . . . . . . . . . . . . . . . . . . . . . . . . . . . . . . . . . . . . . . . . . . . . . 8
Research & Deve lopment . . . . . . . . . . . . . . . . . . . . . . . . . . . . . . . . . . . . . . . . . . . . . . . . . . . . . . . . . . . . . . . . . . . . . . . . . 10
Ventures . . . . . . . . . . . . . . . . . . . . . . . . . . . . . . . . . . . . . . . . . . . . . . . . . . . . . . . . . . . . . . . . . . . . . . . . . . . . . . . . . . . . . . . . . . . . . . . . . . . . . . . . . . . . 12
Winton Ph i lan throp ies . . . . . . . . . . . . . . . . . . . . . . . . . . . . . . . . . . . . . . . . . . . . . . . . . . . . . . . . . . . . . . . . . . . . . . . . . . . . . . . . 14
Corporate Governance . . . . . . . . . . . . . . . . . . . . . . . . . . . . . . . . . . . . . . . . . . . . . . . . . . . . . . . . . . . . . . . . . . . . . . . . . . . . 15
R i sk Management . . . . . . . . . . . . . . . . . . . . . . . . . . . . . . . . . . . . . . . . . . . . . . . . . . . . . . . . . . . . . . . . . . . . . . . . . . . . . . . . . . . . . . . . 18
D i rec tors ’ Repor t . . . . . . . . . . . . . . . . . . . . . . . . . . . . . . . . . . . . . . . . . . . . . . . . . . . . . . . . . . . . . . . . . . . . . . . . . . . . . . . . . . . . . . . . . . . . . . . . . . . . . 20
Independent Aud i tor ’ s Repor t . . . . . . . . . . . . . . . . . . . . . . . . . . . . . . . . . . . . . . . . . . . . . . . . . . . . . . . . . . . . . . . . . . . . . . . . . . 23
Conso l idated F inanc ia l Sta tements . . . . . . . . . . . . . . . . . . . . . . . . . . . . . . . . . . . . . . . . . . . . . . . . . . . . . . . . . . . . . . . . 25
Notes to the Conso l idated F inanc ia l Sta tements . . . . . . . . . . . . . . . . . . . . . . . . . . . . . . . . . . . . 30
WINTON GROUP LIMITEDAnnual Report for the year ended 31 December 2017
4
Group Per fo rmance
Year-end AuA ($ ’bn ) Prof i t before Tax (£ ’m)
13.3
32.128.5
33.728.4
25.325.6
28 17.2
12.52008200920102011201220132014201520162017
289
107125
227487
22179
221184
602008200920102011201220132014201520162017
Div idend per A share (£ )Gross Revenue £m
395102
265267
398635
326193
351282
2008200920102011201220132014201520162017
79
6923
15973
4422
57 25
422008200920102011201220132014201520162017
Year end employeesTota l Tax Cont r ibu t ion (£ ’m)
117
6850
107153
8453
101 73
292008200920102011201220132014201520162017
193
470412
453363
284276
235 200
1922008200920102011201220132014201520162017
WINTON GROUP LIMITEDAnnual Report for the year ended 31 December 2017
5
Per fo rmance Rev iewThe directors are pleased with the results for the year and the financial position at the year–end. The key financial highlights are set out in the audited financial statements and are incorporated in the Group Performance data on page 4.
Winton earns management fees based on its Assets under Advisement (“AuA”) and performance fees based on the net performance in excess of a high watermark of the investment strategies described in the “Investment Management” section of this report. During 2017, the Group’s AuA decreased from $32.1bn to $28.5bn, reflecting net investor redemptions over the year. The impact of the net investor redemptions was, however, mitigated by the effect of positive overall performance of Winton’s investment strategies. Gross revenue in 2017 was broadly comparable to 2016, decreasing £2m from £267m in 2016 to £265m in 2017. However, the composition of revenue differed, with the Group generating fewer management fees in 2017 due to the decrease in the Group’s AuA combined with the effect of reduced fee rates that were introduced during the year. Performance fees increased in 2017 driven primarily by positive performance from the investment strategies in the final quarter of the year.
Operating costs decreased from £154m to £143m in the year, largely reflecting a decrease in employment costs (see note 24), itself a result of the relatively high proportion of variable compensation.
The Group redeemed a number of seed investments throughout 2017 and as at 31 December 2017 the market value of these seed investments was £44.6m (2016: £71.6m) with the profit and loss account including net losses on seed investments of £7.1m (2016: gain of £13.0m). During 2017, the Group renegotiated the loan facility which was entered into in early 2016, reducing the facility to £40m with £30m drawn down as at 31 December 2017 (see note 17). The full outstanding balance of the loan was repaid in March 2018 and the facility cancelled.
The Group has maintained its long-term strategy of investing for growth and has continued to:
y Invest heavily in its research and technology capabilities to seek to deliver attractive risk-adjusted returns in its investment products
y Develop new products to meet client demand y Pursue opportunities in new markets, including investing the firm’s capital to test new strategies, and
leveraging Winton’s successful Chinese investment consulting and research business y Back a portfolio of promising start-up companies in the field of data science
The Group entered 2018 with shareholders’ funds of £228m and cash balances of £110m making it well positioned to implement its strategy as described in this report.

WINTON GROUP LIMITEDAnnual Report for the year ended 31 December 2017
6
C E O ’ s Re p o r tWinton’s performance in 2017 was very satisfactory, buoyed by good returns across its range of investment strategies. These in turn were sustained by the continued strong uptrends in financial asset markets, which once again reached record highs during the year. By year–end, however, it had become apparent that the US Federal Reserve had, after 10 years of near–zero interest rates and the policy of quantitative easing, commenced upon a tightening cycle, which may bode less well for financial asset returns in the years ahead.
Winton’s investment systems are – at least in theory, and sometimes in practice – able to return profits during bear as well as bull markets. But in the face of generally muted or negative returns to financial assets, high returns are unlikely to be easy to come by. Winton, therefore, is continuing to fix the roof while the sun is shining, by taking strict cost control measures and tightening its control and governance frameworks. This is evidenced by the reduction in the average remuneration per employee from £219,000 in 2016 to £206,000 in 2017, and even more so in the decline in directors’ aggregate remuneration from £4.9m in 2016 to £2.6m in 2017. We expect to take further cost–controlling measures in the year ahead.
Cost control has not come at the expense of investment. Major investment during the year included enlarging our New York office space and opening new data centres in East London and New Jersey. Together with the rapid expansion of our cloud computing capability, these technology investments will enable us to monitor and trade a greatly augmented number of equities worldwide using increasingly high-resolution data. Despite our taking a relatively long-term approach to investment, high-resolution data can be valuable for risk management purposes.
6

WINTON GROUP LIMITEDAnnual Report for the year ended 31 December 2017
7
Further investment has been made in a variety of internal business initiatives, which bring together the themes of data science, computing and financial markets. As detailed later in this report, these range from data processing venture Hivemind to our fledgling data-based music rights project (see page 13). We have also continued to invest in similar external ventures and venture funds with a data science focus.
Winton’s investment management business has twin objectives: first, to produce the very best investment returns we can; second, to provide our institutional clients with investments that address the specific requirements of their portfolios. Continuing to meet these twin objectives is likely to require the further evolution and broadening of our product offering in the year ahead.
Mentions of AI and Big Data on Quarterly Earnings Calls of US Companies
Source: CB Insights
Big data AI
0
200
2008 2009 2010 2011 2012 2013 2014 2015 2016 2017
400
600
800
Over the course of 2017, there was a continuation of general advances in and excitement about the fields of data science and machine learning. It is my opinion that this excitement is a little overdone in the short term (see chart opposite), but the longer term progress of hardware and software technology remains immensely impressive and creates fertile soil for new commercial opportunities. The flipside is that the very dynamism of the field makes sustainable commercial advantage hard to attain, even if it is very profitable to operate in a truly global market for those who achieve it.
In the field of investment management there is heightened interest in quantitative, algorithmic approaches to investing, which bode well for Winton’s business given its long expertise in this area.
D W Harding
Founder, CEO & Co-CIO

WINTON GROUP LIMITEDAnnual Report for the year ended 31 December 2017
8
Winton Group posted a strong 17% rise in profit before tax to £125.4 million in 2017. The proportion of group revenue that came from performance fees was significantly higher than in the previous year, as Winton’s range of systematic strategies delivered absolute returns for its clients. That improvement in incentive fees kept overall revenue steady year-on-year, despite a cut in management and performance fee terms introduced to benefit our clients.
The performance of our investment management division was driven by strong gains across most of Winton’s strategies, which were positioned to profit from the long and sustained rally in global equity markets. All the major stock indices rose over the year as the S&P 500 notched 14 consecutive monthly gains for the first time in its history. Equity markets aside, Winton’s strategies were also able to gain from movements in global currency markets. Performance from commodities markets trading through the year was largely flat, with profits in base metals and crops offset by losses in precious metals and energies. In fixed income trading, there were modest losses for the year as a whole, but much ground was regained over the last four months as the US yield curve continued to flatten amid the Federal Reserve’s unwinding of its hitherto easy monetary policy.
In another development intended to enhance our offering and respond to client demand, we launched two new products under Europe’s UCITS regulatory framework: the Winton Absolute Return Futures Fund, which has been designed to appeal to UK wealth managers and defined contribution pension schemes; and
I nve s t m e n t M a n a g e m e n t
Investment Management
Finance Human Capital Risk Corporate Services ComplianceLegalExecutive Office
Research
Data
Technology
Ventures
The firm is organised around its Investment Management business, complemented by distinct technical divisions: Winton Data, Winton Research and Winton Technology. This framework enables dedicated teams to work on large-scale, collaborative projects over extended timeframes.
The technical divisions, including Ventures (page 12), sit alongside firm-wide corporate functions, including Risk, Compliance, Legal, Human Capital, Finance, the Executive Office and Corporate Services. The structure helps to clarify the human capital committed to the evolution of our business.
WINTON GROUP LIMITEDAnnual Report for the year ended 31 December 2017
9
the Winton Diversified Fund (UCITS), a UCITS-compliant version of our longstanding diversified investment strategy. These innovations exemplify our desire to meet the needs of our clients, with whom we work collaboratively to develop bespoke solutions. During 2017, we established a number of new relationships with major asset allocators, across both different regions and client types.
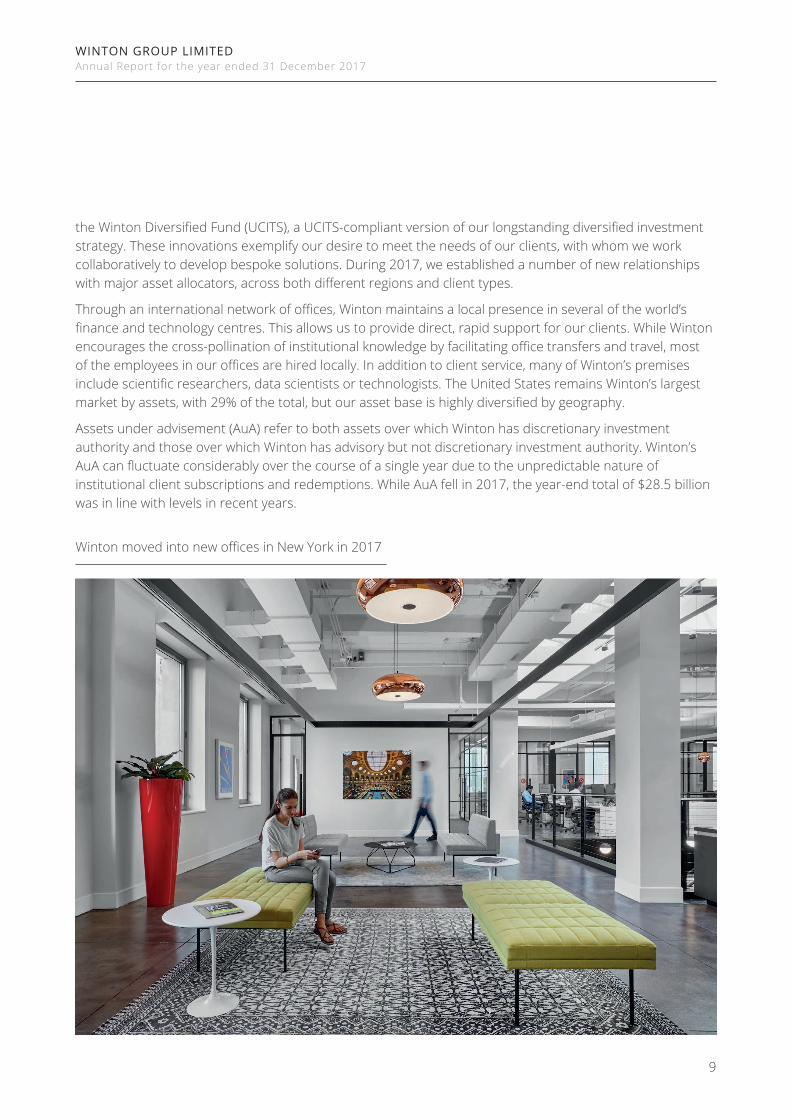
Through an international network of offices, Winton maintains a local presence in several of the world’s finance and technology centres. This allows us to provide direct, rapid support for our clients. While Winton encourages the cross-pollination of institutional knowledge by facilitating office transfers and travel, most of the employees in our offices are hired locally. In addition to client service, many of Winton’s premises include scientific researchers, data scientists or technologists. The United States remains Winton’s largest market by assets, with 29% of the total, but our asset base is highly diversified by geography.
Assets under advisement (AuA) refer to both assets over which Winton has discretionary investment authority and those over which Winton has advisory but not discretionary investment authority. Winton’s AuA can fluctuate considerably over the course of a single year due to the unpredictable nature of institutional client subscriptions and redemptions. While AuA fell in 2017, the year-end total of $28.5 billion was in line with levels in recent years.
Winton moved into new offices in New York in 2017
WINTON GROUP LIMITEDAnnual Report for the year ended 31 December 2017
10
The success of Winton’s business is rooted in its singular focus on scientific research and the proficient application of the scientific method. This requires significant and sustained investment in technology, data, and personnel. In 2017, our level of spending on non-payroll research and development was broadly flat at £4.0 million. While overall headcount fell from 470 to 412 over the year, most departures came in our non-research areas. The proportion of our average monthly number of employees that work in data, technology and research marginally increased to 45% of the company over the year, up from 43%.
Some of the new research that Winton engaged in included advanced applications of machine learning – a term describing algorithms that evolve when exposed to new data, and it is a discipline that draws on computer science and statistics. While machine learning has recently captured the imagination of the public, it is a discipline that Winton has been deeply involved in throughout our 20 years of existence as a systematic, algorithmic firm. Just as we have always actively recruited from the field, we continued to do so in 2017.
As a general rule, the efficacy of machine learning improves with the availability of high-quality data. Contrary to some assumptions, however, financial markets offer up less data for this purpose than some other domains. This is one reason that we created a business unit called Systematic Data Collection in 2014 to collect and clean data and to create bespoke proprietary datasets. This unit was turned into a wholly owned subsidiary and renamed Hivemind Technologies during 2017 (see page 13). Meanwhile, improvements in computing processing speed, memory capacity and sensors have brought so-called “big data” into the mainstream in recent years.
Re s e a rc h & D eve l o p m e n t
10

WINTON GROUP LIMITEDAnnual Report for the year ended 31 December 2017
11
At Winton, we have embraced these developments by investing in the people and infrastructure necessary to stay in the vanguard of the data science revolution. Rather than siloing our operations, we have increasingly brought our data scientists and researchers closer, such that any difference between the work each conducts is often indistinguishable. Our Winton Data division devises novel methods for data capture, cleaning and storage, and acts as a source of ideas and innovation. Furthermore, Winton’s San Francisco data science centre expanded in 2017 with several new recruits.
The nature of much of Winton’s R&D is both computationally intensive and unpredictable, and our increased adoption of cloud computing during 2017 has significantly enhanced our research flexibility. For example, we were able to spin up Graphics Processing Units for specific short-term machine learning research projects in 2017 that would otherwise have been prohibitively costly to buy and install. Our client websites and portals make use of the global nature of the cloud, allowing us to service our clients around the world more efficiently. Our greater use of the cloud may ultimately have an impact on Winton’s financial accounts, since pay-as-you-go cloud computing is more of an operating expense than an investment in infrastructure.
Concurrently, Winton continued to invest in its data centres over the course of 2017. In the UK, we opened a large, dedicated data centre in East London that complemented our existing data centre in Slough and allowed us to close a smaller, secondary back-up site at our Oxford office. We also opened a US data centre in New Jersey. These new data centres have given us improved capacity, reliability and robustness to failure, and have strengthened the data security related to our core regulated business activities.
11

WINTON GROUP LIMITEDAnnual Report for the year ended 31 December 2017
12
I nvestmentsOur venture investments focus primarily on three sectors whose characteristics have strategic relevance for the Group: cybersecurity; energy and environment; and data science-driven healthcare.
During 2017 there were initial investments in three companies, taking the total of companies in which Winton holds a direct stake to 15. In cybersecurity, there were new investments in BlueVoyant and Exonar, as well as follow-on investments in Panaseer and Tessian. In energy and environment, Winton made a new investment in Tokamak, a nuclear fusion company applying world-leading scientific expertise to build an innovative compact fusion reactor.
Ripjar, one of Winton’s largest investments, appointed current Winton vice-chairman Anthony Daniell as its chairman, and launched two products in compliance and security. Another of Winton’s investments, Oxford PV, received an award as one of the top 50 innovative companies in the world from the German edition of MIT Technology Review.
Additionally, Winton has indirect investments in close to 100 other start-ups through the funds of six venture capital firms with corresponding sectoral interests: Amadeus, SignalFire, Oxford Technology, Cambridge Innovation Capital, Kindred Capital, and Hetz Ventures.
The total value of direct investments made during 2017, included committed funds, was £10.9m, see note 1.16.
Ve n t u re sThe scope of Winton’s ventures activities includes data science initiatives that have been spun out of the company’s core investment management expertise, and investments in external companies.
WINTON GROUP LIMITEDAnnual Report for the year ended 31 December 2017
13
Hivemind TechnologiesHivemind Technologies was established in 2017, and its services are now being offered to internal teams, our clients and other outside parties.
Formerly known as Systematic Data Collection, the business unit was first formed as a strategic capability to facilitate Winton’s large-scale proprietary dataset origination. Hivemind was created following extensive software re- engineering that transformed it into a scalable and secure cloud-based infrastructure capable of supporting multiple clients.
Hivemind is employed daily by Winton’s data scientists, who use it to create proprietary datasets, to quality-assure data and for many other data-driven projects.
It also enables clients to collect, clean, and enrich bespoke datasets using micro-tasks distributed to large numbers of human contributors. External client projects have included creating machine learning training data for cybersecurity, and crowdsourcing workers for an image annotations task.
Winton Climate Prediction MarketThe Winton Climate Prediction Market is a concept that was tested in 2017 through an internal company competition, during which employees played a trial version using pretend money. Winton spent the latter half of 2017 organising a separate competition to predict monthly UK temperatures and precipitation.
Prediction markets are markets specifically designed to reveal information about expectations of future events, where there is a wide range of possible outcomes – as is clearly the case with global climate several decades into the future.
The idea was borne out of a workshop that Winton convened in late 2016, attended by a mixture of economists, market infrastructure and climate specialists. We intend to launch a fully public prediction market for global climate, and other applications – for example, markets in global sea level, extreme weather events, and pollution – potentially with the help of co-sponsors and other organisations.
The Music FundAdvances in technology and data science are finally making it possible for the long tail of up-and-coming musicians to pursue their ambitions. Using methods honed in Winton’s investment management business, The Music Fund aims to apply machine learning and statistical techniques to develop a broader and fairer market for music royalties.
The Music Fund intends to use algorithms to value back catalogues by analysing streaming-site and other data. By doing that, it would make artists a fair offer for part of the royalties those tracks will generate. The Music Fund is collaborating with industry partners to further develop its business.
Winton-Or ig inated Ventures
A WINTON COMPANY
P r e d i c t i o n M a r k e t
WINTON GROUP LIMITEDAnnual Report for the year ended 31 December 2017
14
W i n to n P h i l a n t h ro p i e s
14
WINTON GROUP LIMITEDAnnual Report for the year ended 31 December 2017
In 2017 Winton Capital Management Limited donated £500,000 to Winton Philanthropies, a separate charity, that also received substantial donations from David Harding.
Winton Philanthropies’ activities centre on funding bold and experimental scientific research and improving the communication of scientific ideas. Donations in 2017 included gifts of £2,000,000 to the Winton Centre for Risk and Evidence Communication; £284,584 to the Harding Center at the Max Planck Society; and £150,000 to the Winton Research Programme in High Temperature Superconductors at the University of Cambridge.
Winton Philanthropies also gave £250,000 as a founding donor of Now Teach, an educational programme linked to UK academy schools that trains businesspeople to become teachers.
As in previous years, Winton Philanthropies made a series of donations to the communities of our respective international offices. In London, gifts that were made included to Westminster Abbey Foundation, the London Library, the Resurgo Trust Spear Programme for employment of young people, and the Lyric Theatre.
Winton Philanthropies also launched the Winton Exoplanet Fellowship Programme – a new initiative
to provide an opportunity for exceptional recent doctoral scientists to conduct novel theoretical and observational research into planetary astronomy. The fellowship programme supports postdoctoral fellows working on the detection and characterisation of exoplanets, with the goal of advancing our fundamental understanding of their formation, structure, and potential habitability.
The programme sponsors an annual planetary astronomy symposium to increase and facilitate the exchange of information and ideas in the field through the networking of students, postdoctoral researchers, young faculty members, and established researchers.
The exciting possibilities in this rapidly-evolving field of research were evident in June 2017, with announcement of the inaugural winner of the Winton Award for Outstanding PhD Student in Physics at Warwick University. The recipient was a planetary astronomer studying the atmospheres of exoplanets, who has used the technique of transmission spectroscopy to analyse chemicals present in a planet’s atmosphere.
Over the course of the year, Winton donated £200,000 in respect of the employee donation matching programme.

WINTON GROUP LIMITEDAnnual Report for the year ended 31 December 2017
15
C o r p o ra te G ove r n a n c eWinton’s corporate governance structure includes the Winton Group Board (the “Board”) and its committees, the boards of the divisions and subsidiaries and Winton’s other decision-making committees.
The boards are responsible for supervising the management of the relevant company or division to ensure that Winton conducts its business appropriately, with integrity, and with due regard for the interests of all stakeholders.
Role of the BoardThe Board is collectively responsible for the long-term success of the Group. Its responsibilities include approving the Group’s strategic aims and risk appetite – that is, the degree of risk that the Board is willing to accept in Winton’s day-to-day operations and in the pursuit of Winton’s strategic objectives; supervising the management of the business including monitoring management’s performance in delivering against the strategy and ensuring that risk management measures and internal controls put in place by management are appropriate and effective; responding to the needs of shareholders, regulators, clients, employees and other stakeholders with transparent reporting and active engagement; promoting high standards of professional and ethical conduct amongst employees; and ensuring compliance by the Company with its memorandum and articles of association and relevant legal, regulatory and governance requirements.
The Board’s role is to be distinguished from the day-to-day operational management of the Company and its subsidiaries by the Chief Executive Officer and relevant full-time executives and subsidiary boards.
Role of the Remuneration CommitteeThe Remuneration Committee, a sub-committee of the Board, meets at appropriate intervals to coincide with the Board meetings and otherwise as required. The objective of the Committee is to set remuneration levels which ensure that employees are fairly and responsibly rewarded, in a manner that is appropriately linked to their performance.
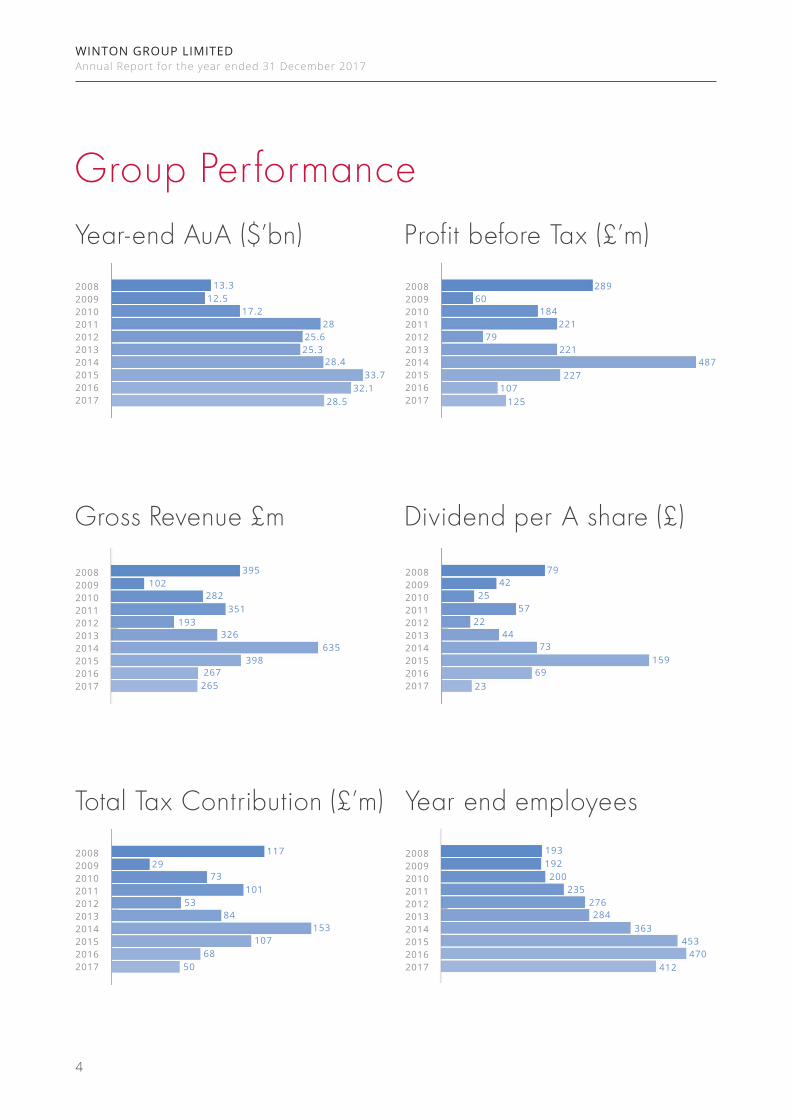
Operating Committee
CDPExco
Investment Board
Technology Board
Research Management
Board
Risk Committee
Winton Group Board
Remuneration Committee
Audit Committee
3rd L
ine
1st L
ine
2nd L
ine

WINTON GROUP LIMITEDAnnual Report for the year ended 31 December 2017
16
Role of the Audit Committee The Audit Committee, a sub-committee of the Board, meets at appropriate intervals to coincide with the Board meetings and Winton’s annual statutory audit. The Audit Committee is responsible for overseeing Winton’s internal controls, financial statements and external and internal audit.
Role of the Operating Committee The Operating Committee is chaired by the CEO, and its other members are the Co-Chief Operating Officers and the General Counsel. The Committee meets approximately fortnightly. Winton’s Operating Committee is responsible for overseeing the day-to-day management of Winton, including the implementation of strategy and operational plans.
Role of the Risk CommitteeThe Risk Committee is chaired by Winton’s Chief Risk Officer and has a membership of senior management and other executive members of the Board. The Risk Committee meets at least four times a year and meetings are typically held more frequently. The Risk Committee oversees the identification, assessment, management and monitoring of risks to which Winton is exposed, including investment risk, counterparty risk, IT and security risks and regulatory risks. The Risk Committee also has oversight of Winton’s key internal policies, including the error policy, business continuity policy, compliance manual and IT security policies.
Winton’s governance and risk management framework follows the ‘three lines of defence’ model:
First Line of Defence: The Business Departments are responsible for ensuring that a risk and control environment is established as part of day-to-day operations. Heads of Departments assign the roles of control champion, control owners and control operators in the department. Line managers oversee and escalate issues to relevant committees.
Second Line of Defence: Oversight Functions The Compliance department and the Risk functions, including the Chief Compliance Officer, Chief Risk Officer and the Risk Committee, are the second line of defence. These functions have the responsibility of independently overseeing the risk management activities of the first line of defence.
Third Line of Defence: The Board, Audit Function and Audit CommitteeThe third line of defence is conducted by the Board, assisted by external auditors who report independently to the Audit Committee and provide independent assurance over the first and second lines of defence. External audits include the annual statutory financial statements audit and the International Standard on Assurance Engagements (ISAE 3402) audit. The internal audit function is also part of the third line of defence.

WINTON GROUP LIMITEDAnnual Report for the year ended 31 December 2017
17
The Group includes five 100%–owned subsidiary companies that perform regulated activities:
Winton Capital Management Limited (“WCM”), a company incorporated in England and Wales, is authorised and regulated by the UK Financial Conduct Authority (“FCA”) as an Alternative Investment Fund Manager. It is also registered with the US Commodity Futures Trading Commission (“CFTC”) as a commodity pool operator and commodity trading adviser and with the US Securities and Exchange Commission (“SEC”) as an investment adviser under the Investment Advisers Act of 1940. WCM is also a member of the US National Futures Association (“NFA”).
Winton Fund Management Limited (“WFM”), a company incorporated in England and Wales, is authorised and regulated by the FCA as an Alternative Investment Fund Manager. WFM currently acts as the investment manager to most of the Winton titled Alternative Investment Funds, and delegates portfolio manager of such funds to WCM. WFM is registered as an Exempt Reporting Adviser with the SEC, is registered with the CFTC as a commodity pool operator and is a Member of the NFA.
Winton Capital Asia Limited (“WCA), a company incorporated in Hong Kong, is licensed by the Hong Kong Securities and Futures Commission. It conducts scientific research into Asian markets, promotes Winton’s advisory services in Asia, and services Winton’s Asian investors. It has a 100%–owned subsidiary, Winton Investment Management (Shanghai) Limited, a company incorporated in the People’s Republic of China, which provides investment consulting and research services to clients.
Winton Capital US LLC (“WCUS”), a company incorporated in Delaware, US is registered with the CFTC as a commodity pool operator and commodity trading adviser and with the SEC as an investment adviser under the Investment Advisers Act of 1940. WCUS is also a member of the NFA.
Winton Capital Japan Co.Ltd., a company incorporated in Japan, is regulated by the Financial Services Agency of Japan as a financial instruments dealer (investment management business for qualified investors and investment advisory and agency business). It is a member of the Japan Investment Advisers Association.
WINTON GROUP BOARD Risk Appetite
Risk Committee
Compliance
2nd Line
Audit
Board
3rd Line
Control Operator
Control Owner
Control Champion
Dept. Head
1st Line
Operating Committee
The Business

WINTON GROUP LIMITEDAnnual Report for the year ended 31 December 2017
18
R i s k M a n a g e m e n t
Principal risks and uncertainties, including use of financial instrumentsThe Group has identified the key business risks set out below, each of which, if not appropriately mitigated, could lead to a substantial decline in assets under advisement (AuA) due to significant redemptions or sustained poor performance, which in turn would lead to a decline in fee income for the Group, or could result in a direct risk to the assets and liabilities on the Group’s balance sheet.
Investment riskThe most significant risk facing the Group is investment risk. This comprises both market event risk, which is the possibility that an unforeseen event such as a terrorist strike or natural disaster could cause sudden and extreme trading losses; and systemic risk, the risk of overcrowding in particular markets or trades which could lead to temporary market distortions that prove unprofitable for our investment portfolios.
Key strategies to mitigate these risks include operating our investment portfolios with low levels of leverage, diversifying our holdings across many liquid markets, and designing our investment systems such that they do not require rapid portfolio rebalancing in extreme market conditions.
Non-investment risks
Mis-selling and misrepresentation risk
This is the risk of Winton’s employees mis-selling to, or misleading, an investor about the characteristics of a product or service, and also includes the risk of being misrepresented by a third-party
distributor. Winton’s vulnerability is centred on the material Winton provides for the promotion of the funds it advises. Winton is not liable for the way in which third-party funds have been promoted beyond its provision of such materials. Mitigants include controls over the production, review and dissemination of marketing materials; clear policies on client interactions and meetings; and regular communication with investors.
Regulatory and conduct risk
This is the risk that a change in laws and regulations will directly affect Winton’s trading, or that the retrospective reinterpretation of existing regulations or inappropriate employee behaviour leads to regulatory fines. Examples of regulatory interventions that could have a negative impact on Winton’s business include transaction taxes, short sale restrictions, restrictions on commodity futures trading, and foreign exchange controls.
While it is not possible to mitigate all such risks, Winton’s Compliance function monitors proposed and actual regulatory changes. A strong governance culture exists throughout the Group with the highest priority placed on understanding new regulations to assess their applicability and act accordingly rather than treating regulation as a “box-ticking exercise”.
Conduct risk is mitigated by a rigorous employee vetting process; a culture of ethical and thoughtful behaviours throughout all of Winton’s activities; ongoing compliance training and appropriate regulatory registrations; and compliance policies applicable to all employees.
Technology and cyber security risk
This is the risk relating to the unauthorised use of Winton’s IT systems, either maliciously or accidentally, by internal or external parties. This

WINTON GROUP LIMITEDAnnual Report for the year ended 31 December 2017
19
might result in the loss of Winton’s ability to access markets, funds or information from third parties; personal customer or employee information; intellectual property; and ultimately a disruption of Winton’s ability to operate. Risk mitigants include a dedicated information security team; user access controls; ongoing cyber security training for all staff; and the enforcement of information security and acceptable use policies.
It also includes the risks relating to the failure or loss of corporate or public IT infrastructure, such as the destruction of a data centre or communication links; destruction or inaccessibility of premises; or a cyber-attack. Risk mitigants include multiple data centres with ability to switch IT operations between them; and a disaster recovery plan that lays out the governance procedure to be pursued in the event of a serious threat to physical or virtual security.
Fraud risk
In a financial services business involving large sums of money, the risk of a fraud costing a few basis points of AuA but amounting to millions of pounds must be borne in mind. It is reduced in Winton’s case by the fact that Winton does not, and is not permitted to, hold money for its clients. Nevertheless Winton advises on and initiates billions of dollars of transactions which must introduce risk. Another type of fraud risk relates to external counterparties, for example fraud committed by a third party service provider or counterparty in relation to assets held that belong to Winton or Winton’s investors (e.g. custodians, clearing brokers).
Fraud risk is mitigated by a robust control framework including daily reconciliations of holdings and valuations between Winton’s records and those of the institutions holding the accounts; strict signatory controls and regular reconciliation procedures over Winton’s own cash resources;
appropriate segregation of duties; thorough review of contractual agreements by Winton’s vendor management and legal teams; and ongoing third-party oversight processes including regular due diligence visits.
Overseas offices
The Group has a network of offices in six countries outside the UK. The potential additional fraud risk is mitigated by close controls over subsidiary finances by UK head office. The Group does not believe that international expansion has led to significant additional regulatory risk as Winton has had a global client base for many years and has therefore been subject to regulation by overseas regulators. The mis-selling and misrepresentation risk associated with staff in non-UK offices is mitigated by the controls described above.
On behalf of the Board
D W Harding
Founder, CEO & Co-CIO

WINTON GROUP LIMITEDAnnual Report for the year ended 31 December 2017
20
The directors of the Company present their annual report and financial statements for the year ended 31 December 2017.
Directors
The following directors have held office since 1 January 2017 unless otherwise stated:
Chairman:
Sir D A Walker
Executive:
D W Harding
B Rentoul
M D Beddall (resigned 24 August 2017)
Non-executive:
A H Daniell (Vice Chairman)
M J Hunt
A Murgian
I N Sharp*
S J N Dawson* (resigned 2 June 2017)
P D Sullivan* (resigned 2 June 2017)
* Independent
Principal activities
The Company’s business is that of a group holding company. Details of its subsidiary undertakings are shown in note 11. The Company’s income consists primarily of dividend income received from its subsidiary undertakings, and its expenses comprise holding company management expenses. The principal activities of the Group are covered in the Group Strategic Report.
Review of business and future developments
This is covered in the Group Strategic Report.
Results and dividends
The consolidated profit and loss account for the year is set out on page 25.
During the year the Company paid dividends of £58.3 million as set out in note 9.
The Company’s practice has been to distribute the Group’s profit after tax to its shareholders, subject to there being a sufficient level of distributable reserves, and taking into account cash resources and any amounts that the Board determines should be set aside for regulatory capital or other short-term and long-term Group investment requirements (see Group Strategic Report). This means that distributions for any period may not resemble profits for that period and distributions may not be paid every quarter. In order to generate such profits at the Company level and to enable the Company to fund such distributions, dividend income is received from its subsidiary undertakings.
Directors ’ Repor t
WINTON GROUP LIMITEDAnnual Report for the year ended 31 December 2017
21
Post balance sheet events
Dividends totalling £24.1million in relation to the ordinary shares were paid in January 2018 and April 2018.
The Company repaid the full outstanding loan balance of £30.0m and cancelled the loan facility in March 2018.
Employee engagement
Equal opportunities
Winton is committed to providing equal opportunities in employment and to avoiding unlawful discrimination. Winton’s policy is to treat everyone fairly regardless of their age, gender, race, sexual orientation, disability, educational background, religion or beliefs.
Winton gives full and fair consideration to all applications for employment, including applications from disabled persons, having regard to particular aptitudes and abilities. If employees become disabled, appropriate support is provided and employment continues wherever possible, with retraining given if necessary. For the purposes of training, career development and progression, all employees are treated equally.
Employee involvement
Employees receive regular updates on developments in Winton’s business via company meetings, which are attended by all employees globally, either in person or via video-link, and via regular postings on Winton’s intranet. Each employee also has a formal annual review during which they discuss their own personal performance, and that of their team as well as developments in the business that affect them.
Where local regulations permit, all employees are eligible to participate in the Group’s share purchase scheme, whereby employees and shareholders can apply to purchase or sell shares in the Group on a quarterly basis at a market price determined by an independent valuer. All shares rank for receipt of dividends when, taking into account regulatory and Group investment statutory requirements, the directors decide that profits are available for distribution.
Employee training, health and safety
Education and training is provided to employees to seek to ensure regulatory requirements are met and to encourage employees to recognise and value corporate social responsibilities. High standards of health and safety at work are promoted and there is a health and safety policy incorporated into the staff handbook that highlights the commitment to ensuring employees are provided with a safe and healthy working environment.
Research and development
This is covered in the Group Strategic Report.
Auditor
The Group’s auditor, KPMG LLP, has indicated its willingness to continue in office.
Directors ’ Repor t
WINTON GROUP LIMITEDAnnual Report for the year ended 31 December 2017
22
Statement of directors’ responsibilities
The directors are responsible for preparing the Strategic Report, the Directors’ Report and the financial statements in accordance with applicable law and regulations.
Company law requires the directors to prepare financial statements for each financial year. Under that law they have elected to prepare the financial statements in accordance with UK accounting standards and applicable law (UK Generally Accepted Accounting Practice), including FRS 102 The Financial Reporting Standard applicable in the UK and Republic of Ireland.
Under company law the directors must not approve the financial statements unless they are satisfied that they give a true and fair view of the state of affairs of the company and of the profit or loss of the company for that period. In preparing these financial statements, the directors are required to:
y select suitable accounting policies and then apply them consistently; y make judgements and estimates that are reasonable and prudent; y assess the company’s ability to continue as a going concern, disclosing, as applicable, matters related to
going concern; and y use the going concern basis of accounting unless they either intend to liquidate the company or to cease
operations, or have no realistic alternative but to do so.
The directors are responsible for keeping adequate accounting records that are sufficient to show and explain the company’s transactions and disclose with reasonable accuracy at any time the financial position of the company and enable them to ensure that the financial statements comply with the Companies Act 2006. They are responsible for such internal control as they determine is necessary to enable the preparation of financial statements that are free from material misstatement, whether due to fraud or error, and have general responsibility for taking such steps as are reasonably open to them to safeguard the assets of the company and to prevent and detect fraud and other irregularities.
Statement of disclosure to auditor
So far as the directors are aware, there is no relevant audit information of which the Group’s auditor is unaware. Additionally, the directors have taken all the necessary steps that they ought to have taken as directors in order to make themselves aware of all relevant audit information and to establish that the Group’s auditor is aware of that information.
On behalf of the Board
D W Harding Director
1 May 2018
Registered address: 16 Old Bailey London, EC4M 7EG
Directors ’ Repor t

WINTON GROUP LIMITEDAnnual Report for the year ended 31 December 2017
23
We have audited the financial statements of Winton Group Limited (“the company”) for the year ended 31 December 2017 which comprise the Group and Company Balance sheets, the Consolidated profit and loss account, the Group and Company Statement of changes in equity, the Consolidated cash flow statement and related notes, including the accounting policies in note 1.
In our opinion the financial statements:
y give a true and fair view of the state of the group’s and of the parent company’s affairs as at 31 December 2017 and of the group’s profit for the year then ended;
y have been properly prepared in accordance with UK accounting standards, including FRS 102 The Financial Reporting Standard applicable in the UK and Republic of Ireland; and
y have been prepared in accordance with the requirements of the Companies Act 2006.
Basis for opinion
We conducted our audit in accordance with International Standards on Auditing (UK) (“ISAs (UK)”) and applicable law. Our responsibilities are described below. We have fulfilled our ethical responsibilities under, and are independent of the group in accordance with, UK ethical requirements including the FRC Ethical Standard. We believe that the audit evidence we have obtained is a sufficient and appropriate basis for our opinion.
Going concern
We are required to report to you if we have concluded that the use of the going concern basis of accounting is inappropriate or there is an undisclosed material uncertainty that may cast significant doubt over the use of that basis for a period of at least twelve months from the date of approval of the financial statements. We have nothing to report in these respects.
Strategic report and directors’ report
The directors are responsible for the strategic report and the directors’ report. Our opinion on the financial statements does not cover those reports and we do not express an audit opinion thereon.
Our responsibility is to read the strategic report and the directors’ report and, in doing so, consider whether, based on our financial statements audit work, the information therein is materially misstated or inconsistent with the financial statements or our audit knowledge. Based solely on that work:
y we have not identified material misstatements in the strategic report and the directors’ report; y in our opinion the information given in those reports for the financial year is consistent with the financial
statements; and y in our opinion those reports have been prepared in accordance with the Companies Act 2006.
Matters on which we are required to report by exception
Under the Companies Act 2006, we are required to report to you if, in our opinion:
y adequate accounting records have not been kept by the parent company, or returns adequate for our audit have not been received from branches not visited by us; or
y the parent company financial statements are not in agreement with the accounting records and returns; or
y certain disclosures of directors’ remuneration specified by law are not made; or y we have not received all the information and explanations we require for our audit.
We have nothing to report in these respects.
I ndependent Aud i tor ’ s Repor t
WINTON GROUP LIMITEDAnnual Report for the year ended 31 December 2017
24
Directors’ responsibilities
As explained more fully in their statement set out on page 21, the directors are responsible for: the preparation of the financial statements and for being satisfied that they give a true and fair view; such internal control as they determine is necessary to enable the preparation of financial statements that are free from material misstatement, whether due to fraud or error; assessing the group and parent company’s ability to continue as a going concern, disclosing, as applicable, matters related to going concern; and using the going concern basis of accounting unless they either intend to liquidate the group or the parent company or to cease operations, or have no realistic alternative but to do so.
Auditor’s responsibilities
Our objectives are to obtain reasonable assurance about whether the financial statements as a whole are free from material misstatement, whether due to fraud or error, and to issue our opinion in an auditor’s report. Reasonable assurance is a high level of assurance, but does not guarantee that an audit conducted in accordance with ISAs (UK) will always detect a material misstatement when it exists. Misstatements can arise from fraud or error and are considered material if, individually or in aggregate, they could reasonably be expected to influence the economic decisions of users taken on the basis of the financial statements.
A fuller description of our responsibilities is provided on the FRC’s website at
www.frc.org.uk/auditorsresponsibilities.
The purpose of our audit work and to whom we owe our responsibilities
This report is made solely to the company’s members, as a body, in accordance with Chapter 3 of Part 16 of the Companies Act 2006. Our audit work has been undertaken so that we might state to the company’s members those matters we are required to state to them in an auditor’s report and for no other purpose. To the fullest extent permitted by law, we do not accept or assume responsibility to anyone other than the company and the company’s members, as a body, for our audit work, for this report, or for the opinions we have formed.
Jonathan Mills (Senior Statutory Auditor) for and on behalf of KPMG LLP, Statutory Auditor
Chartered Accountants 15 Canada Square London E14 5GL
1 May 2018
I ndependent Aud i tor ’ s Repor t

WINTON GROUP LIMITEDAnnual Report for the year ended 31 December 2017
25
Notes2017£’000
2016£’000
Revenue 2 264,888 267,178
Distribution costs (3,347) (4,918)
Net revenue 261,541 262,260
Administrative expenses (142,732) (153,679)
Operating profit 3 118,809 108,581
Group’s share of loss from joint venture 12 (163) -
Interest receivable and similar income 4 825 601
Investment and foreign exchange gains and losses 5 8,139 (589)
Interest payable and similar expenses 6 (2,259) (1,245)
Profit on ordinary activities before taxation 125,352 107,348
Tax on profit on ordinary activities 7 (24,755) (24,211)
Profit on ordinary activities after taxation 100,597 83,137
No other comprehensive income was recognised during the year except for the foreign currency translation differences shown in the Statement of Changes in Equity on page 28.
The profit and loss account has been prepared on the basis that all operations are continuing operations.
The notes on pages 30 to 47 are an integral part of the financial statements.
Conso l idated Prof i t and Loss Account

WINTON GROUP LIMITEDAnnual Report for the year ended 31 December 2017
26
Notes
Group2017£’000
Group2016£’000
Company2017£’000
Company2016£’000
Fixed assets
Tangible assets 10 12,006 6,237 - -
Investments 11 36,384 24,916 56,405 49,655
Investment in joint venture 12 837 - - -
49,227 31,153 56,405 49,655
Current assets
Debtors 14 110,890 65,117 2,382 38
Investments 16 44,406 72,152 22,226 29,079
Cash at bank and in hand 110,145 106,086 6,974 8,926
265,441 243,355 31,581 38,043
Creditors: amounts falling due within one year 17 (83,262) (86,547) (20,374) (20,860)
Net current assets 182,179 156,808 11,207 17,183
Total assets less current liabilities 231,406 187,961 67,611 66,838
Creditors: amounts falling due after more than one year 18 (2,987) (5,701) - -
Net assets 228,419 182,260 67,611 66,838
Capital and reserves
Called up share capital 20 2,400 2,400 2,400 2,400
Share premium account 1,567 1,481 1,567 1,481
Other reserves 7,493 3,479 - -
Merger reserve 9,816 9,816 - -
Profit and loss account 207,143 165,084 63,644 62,957
Shareholders’ funds 228,419 182,260 67,611 66,838
Approved by the Board of Directors and signed on its behalf by:
D W Harding Director 1 May 2018
Company Registration No. 08719455
The notes on pages 30-47 are an integral part of the financial statements.
Balance Sheets
WINTON GROUP LIMITEDAnnual Report for the year ended 31 December 2017
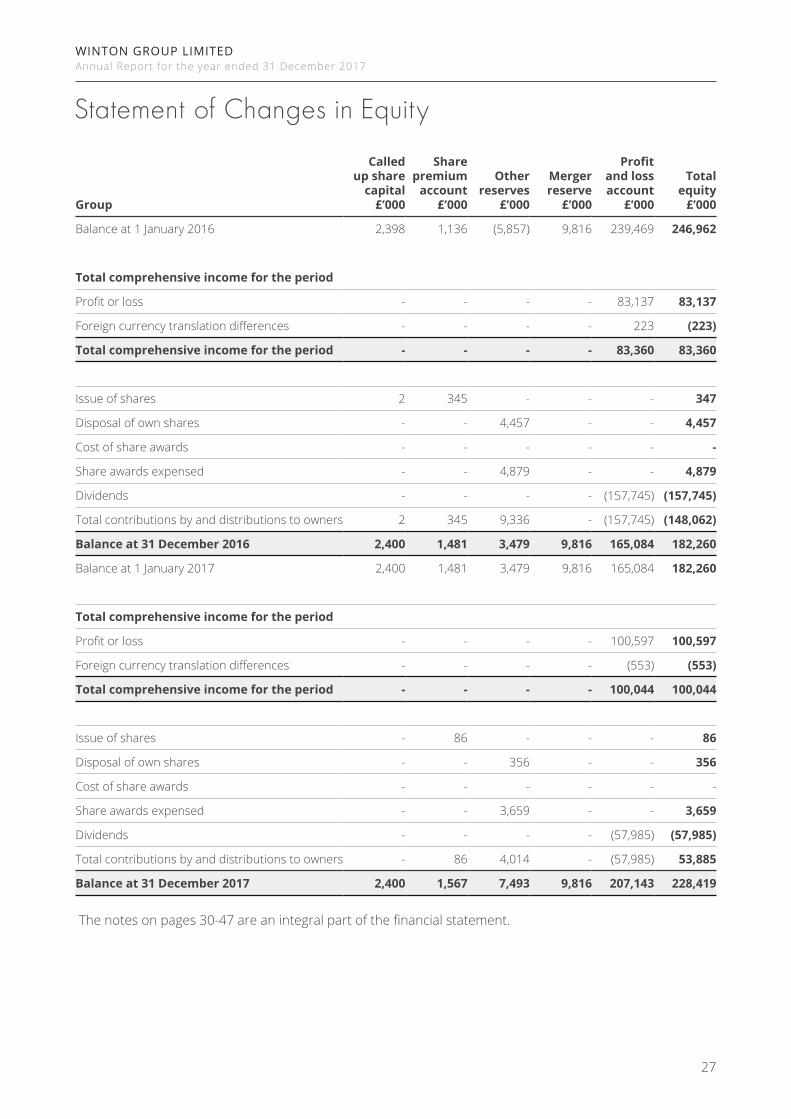
27
Group
Called up share
capital£’000
Share premium
account£’000
Other reserves
£’000
Merger reserve
£’000
Profit and loss account
£’000
Total equity
£’000
Balance at 1 January 2016 2,398 1,136 (5,857) 9,816 239,469 246,962
Total comprehensive income for the period
Profit or loss - - - - 83,137 83,137
Foreign currency translation differences - - - - 223 (223)
Total comprehensive income for the period - - - - 83,360 83,360
Issue of shares 2 345 - - - 347
Disposal of own shares - - 4,457 - - 4,457
Cost of share awards - - - - - -
Share awards expensed - - 4,879 - - 4,879
Dividends - - - - (157,745) (157,745)
Total contributions by and distributions to owners 2 345 9,336 - (157,745) (148,062)
Balance at 31 December 2016 2,400 1,481 3,479 9,816 165,084 182,260
Balance at 1 January 2017 2,400 1,481 3,479 9,816 165,084 182,260
Total comprehensive income for the period
Profit or loss - - - - 100,597 100,597
Foreign currency translation differences - - - - (553) (553)
Total comprehensive income for the period - - - - 100,044 100,044
Issue of shares - 86 - - - 86
Disposal of own shares - - 356 - - 356
Cost of share awards - - - - - -
Share awards expensed - - 3,659 - - 3,659
Dividends - - - - (57,985) (57,985)
Total contributions by and distributions to owners - 86 4,014 - (57,985) 53,885
Balance at 31 December 2017 2,400 1,567 7,493 9,816 207,143 228,419
The notes on pages 30-47 are an integral part of the financial statement.
Statement of Changes in Equ i ty

WINTON GROUP LIMITEDAnnual Report for the year ended 31 December 2017
28
Company
Called up share
capital£’000
Share premium
account£’000
Profit and loss account
£’000
Total equity
£’000
Balance at 1 January 2016 2,398 1,136 42,452 45,986
Total comprehensive income for the period
Profit or loss - - 178,250 178,250
Total comprehensive income for the period - - 178,250 178,250
Issue of shares 2 345 - 347
Dividends - - (157,745) (157,745)
Total contributions by and distributions to owners 2 345 (157,745) (157,398)
Balance at 31 December 2016 2,400 1,481 62,957 66,838
Company
Balance at 1 January 2017 2,400 1,481 62,957 66,838
Total comprehensive income for the period
Profit or loss - - 58,672 58,672
Total comprehensive income for the period - - 58,672 58,672
Issue of shares - 86 - 86
Dividends - - (57,985) (57,985)
Total contributions by and distributions to owners 86 (57,985) (57,899)
Balance at 31 December 2017 2,400 1,567 63,644 67,611
The notes on pages 30-47 are an integral part of the financial statements.
Statement of Changes in Equ i ty
WINTON GROUP LIMITEDAnnual Report for the year ended 31 December 2017
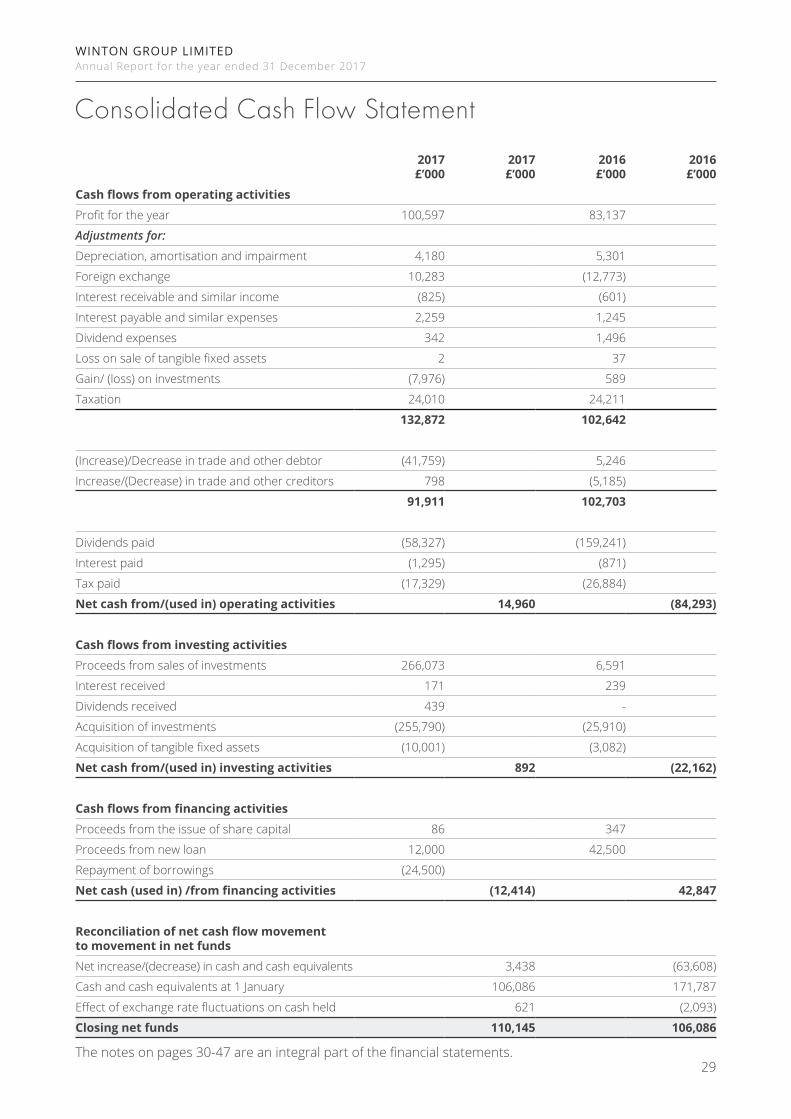
29
2017£’000
2017£’000
2016£’000
2016£’000
Cash flows from operating activities
Profit for the year 100,597 83,137
Adjustments for:
Depreciation, amortisation and impairment 4,180 5,301
Foreign exchange 10,283 (12,773)
Interest receivable and similar income (825) (601)
Interest payable and similar expenses 2,259 1,245
Dividend expenses 342 1,496
Loss on sale of tangible fixed assets 2 37
Gain/ (loss) on investments (7,976) 589
Taxation 24,010 24,211
132,872 102,642
(Increase)/Decrease in trade and other debtor (41,759) 5,246
Increase/(Decrease) in trade and other creditors 798 (5,185)
91,911 102,703
Dividends paid (58,327) (159,241)
Interest paid (1,295) (871)
Tax paid (17,329) (26,884)
Net cash from/(used in) operating activities 14,960 (84,293)
Cash flows from investing activities
Proceeds from sales of investments 266,073 6,591
Interest received 171 239
Dividends received 439 -
Acquisition of investments (255,790) (25,910)
Acquisition of tangible fixed assets (10,001) (3,082)
Net cash from/(used in) investing activities 892 (22,162)
Cash flows from financing activities
Proceeds from the issue of share capital 86 347
Proceeds from new loan 12,000 42,500
Repayment of borrowings (24,500)
Net cash (used in) /from financing activities (12,414) 42,847
Reconciliation of net cash flow movement to movement in net funds
Net increase/(decrease) in cash and cash equivalents 3,438 (63,608)
Cash and cash equivalents at 1 January 106,086 171,787
Effect of exchange rate fluctuations on cash held 621 (2,093)
Closing net funds 110,145 106,086
The notes on pages 30-47 are an integral part of the financial statements.
Conso l idated Cash F low Statement

WINTON GROUP LIMITEDAnnual Report for the year ended 31 December 2017
30
1 Accounting policies
The Company is a private company, limited by shares and incorporated and domiciled in the UK. Set out below is a summary of the principal accounting policies, all of which have been applied consistently throughout the year and the preceding year.
1.1 Basis of preparation
These financial statements have been prepared in accordance with applicable UK accounting standards, including ‘Financial Reporting Standard 102 - The Financial Reporting Standard applicable in the UK and Republic of Ireland’, and with the Companies Act 2006.
The Group’s business activities, together with the factors likely to affect its future development, its financial position, risk management, details of its key performance and financial metrics and corporate governance are described in the Strategic Report on pages 4 to 19. As a consequence, the directors believe that the group is well placed to manage its business risks successfully. After making enquiries, the Directors have a reasonable expectation that the company and the group have adequate resources to continue in operational existence for the foreseeable future, covering twelve months from the reporting date. Accordingly, they continue to adopt the going concern basis in preparing the annual report and accounts.
These financial statements are prepared under the historical cost convention except for the modification to a fair value basis for certain financial instruments as specified in the accounting policies below. The financial statements are denominated in pounds sterling as this is the principal currency in which the Group’s activities are conducted.
1.2 Basis of consolidation
The consolidated profit and loss account and balance sheet include the financial statements of the Company and all of its subsidiary undertakings made up to 31 December 2017. The results of subsidiaries sold or acquired are included in the profit and loss account up to, or from, the date control passes. All intra-group transactions, balances, income and expenses are eliminated in full on consolidation.
A subsidiary of the Group acts as the general partner to certain investment partnerships, which may constitute subsidiary undertakings under the provisions of the Companies Act 2006. These investment partnerships are not consolidated as the limited partnership agreements contain severe long-term restrictions which substantially hinder the exercise of the rights of the general partner over the assets and management of the investment partnerships.
From time to time, the Group invests seed capital into funds where a Group subsidiary is the investment manager or investment adviser and the seed capital amount may comprise greater than 50% of the assets of the relevant fund. Seed capital is held exclusively with a view to subsequent resale and therefore the relevant fund is excluded from consolidation. The Group’s seed investment is measured at fair value with changes in value recognised in the profit and loss account.
Assets and liabilities are translated at the rates of exchange ruling at the year-end under the closing rate method.
Differences on exchange arising from the translation of the opening net assets of foreign subsidiaries denominated in foreign currency are taken to reserves together with differences between profit and loss accounts translated at average rates and rates ruling at the year-end. Other exchange differences are taken to the profit and loss account when they arise.
Joint Ventures are accounted for in the consolidated financial statements under the equity method where there is a contractually agreed sharing of control. The Group’s share of the profits / (losses) of jointly
Notes to the Conso l idated F inanc ia l Sta tements

WINTON GROUP LIMITEDAnnual Report for the year ended 31 December 2017
31
Notes to the Conso l idated F inanc ia l Sta tements
controlled entities is included in the consolidated profit and loss account and its interest in their net assets is recorded on the balance sheet using the equity method.
1.3 Critical accounting estimates
In determining and applying accounting policies, judgement is often required in respect of items where the choice of specific policy, accounting estimate or assumption to be followed could materially affect the reported results or the net asset position. The Directors consider that certain accounting estimates and assumptions relating to the valuation of fixed asset investments are critical accounting estimates.
1.4 Revenue
Revenue represents fees receivable (excluding value added tax) during the period for discretionary investment management and advisory services. Management fees and performance fees are recognised in the period earned. Performance fees, which are based on the investment performance achieved for certain clients relative to predefined benchmarks, are recognised as revenue at the end of the period over which the performance is measured or upon early redemption by a client.
1.5 Foreign currency
Transactions in foreign currencies are translated to the Group’s functional currency at the foreign exchange rate ruling at the date of the transaction. Monetary assets and liabilities denominated in foreign currencies at the balance sheet date are retranslated to the functional currency at the foreign exchange rate ruling at that date. Non-monetary assets and liabilities that are measured in terms of historical cost in a foreign currency are translated using the exchange rate at the date of the transaction.
Non-monetary assets and liabilities denominated in foreign currencies that are stated at fair value are retranslated to the functional currency at foreign exchange rates ruling at the dates the fair value was determined. Foreign exchange differences arising on translation are recognised in the profit and loss account. Foreign exchange gains and losses on financial fixed asset and current asset investments, other net foreign exchange gains and the net foreign exchange hedging loss are grouped together in note 5 as the directors believe that this presentation more fairly reflects the effect of the change in the USD/GBP exchange rate during the year on the profit of the Group.
1.6 Research and development
Research and development expenditure is written off to the profit and loss account in the year in which it is incurred.
1.7 Deferred discretionary retention awards
Staff costs include amounts in respect of deferred discretionary retention awards which have been granted to certain senior staff. The amounts payable under the awards are recognised in staff costs over the vesting period. Amounts payable under the awards are indexed to the performance of the principal funds to which a subsidiary of the Group acts as investment adviser and the accrual is adjusted for changes in the expected amounts payable.
1.8 Pensions
The Group contributes to individual employees’ pension plans. Contributions payable are charged to the profit and loss account when they fall due.

WINTON GROUP LIMITEDAnnual Report for the year ended 31 December 2017
32
1.9 Tangible fixed assets and depreciation
Tangible fixed assets are stated at cost less accumulated depreciation. Depreciation is provided at rates calculated to write off the cost less estimated residual value of each asset over its expected useful life, as follows:
Leasehold land and buildings - improvements 3 years straight line
Plant and machinery 3-5 years straight line
Fixtures, fittings & equipment 3 years straight line
1.10 Operating leases
Rentals payable under operating leases are charged against income on a straight line basis over the lease term.
1.11 Taxation
Tax on the profit or loss for the year comprises current and deferred corporation tax. Tax is recognised in the profit and loss account except to the extent that it relates to items recognised directly in equity or other comprehensive income, in which case it is recognised directly in equity or other comprehensive income. Current tax is the expected tax payable or receivable on the taxable income or loss for the year, using tax rates enacted or substantively enacted at the balance sheet date, and any adjustment to tax payable in respect of previous years.
1.12 Deferred taxation
Deferred taxation is provided in full in respect of taxation deferred by timing differences between the treatment of certain items for taxation and accounting purposes at the rate expected to be in force at the time of the reversal. Deferred tax assets are recognised to the extent that it is regarded as more likely than not that they will be recovered. Deferred tax assets and liabilities are not discounted.
1.13 Share based payments
The Group reflects the economic cost of awarding shares and share options to employees by recording an expense in the profit and loss account equal to the fair value of the benefit awarded less consideration payable, fair value being determined by reference to option pricing models. The expense is recognised in the profit and loss account over the vesting period of the award.
As part of an incentivisation scheme, certain senior staff received an award of shares in the Company. Under the terms of the award, although the shares rank immediately for dividends, ownership of the shares vests over five years and the Company has the right to require recipients to forfeit any unvested shares should recipients cease to be employees of the Group. The cost of the share awards is recognised in staff costs over the vesting period and dividends paid on unvested shares are recognised in the profit and loss account as a dividend expense. The cost of unvested shares is included in other reserves in the balance sheet.
1.14 Dividends
Dividends are accounted for when declared and legally payable.
1.15 Employee Share Ownership Plans
The Group operates ESOP trusts over which it has de facto control of the assets held by the trusts and bears their benefits and risk. It therefore records the assets and liabilities, the results and the cash flows of the trusts as its own. Any profit or loss realised from the sale and purchase of the Company’s shares
Notes to the Conso l idated F inanc ia l Sta tements
WINTON GROUP LIMITEDAnnual Report for the year ended 31 December 2017
33
through the ESOP is recorded as a movement in non-distributable reserves. The cost of the Company’s own shares held by the trusts is deducted in arriving at shareholders’ funds until the shares vest unconditionally with employees.
1.16 Basic financial instruments
Trade and other debtors; trade and other creditors
These items are recognised initially at transaction price less attributable transaction costs. Subsequent to initial recognition they are measured at amortised cost using the effective interest method, less any impairment losses. If the arrangement constitutes a financing transaction, for example if payment is deferred beyond normal business terms, then it is measured at the present value of future payments discounted at a market rate of instrument for a similar debt instrument.
Investments in funds
Investments in funds are classified as current asset investments and are held at fair value, being the market price at the reporting date at net asset value per share. Changes to fair value and realised gains and losses on disposal are taken to the profit and loss account.
Other unlisted investments
Fixed and current asset unlisted investments are held at fair value where a reliable measure of fair value is available, otherwise they are held at cost less impairment. Changes to fair value and realised gains and losses on disposal are taken to the profit and loss account.
Winton Ventures investment portfolio
The unlisted investments held by the wholly owned subsidiaries Winton Ventures Limited and Winton Ventures Acquisitions Limited (together “WV”) are classified as fixed asset investments.
The investments are measured at fair value through profit or loss which is typically the transaction price until a more reliable measure of fair value becomes available. Unrealised and realised gains and losses are disclosed as ‘Investment gains and losses’ and recognised in profit or loss.
Investments are fair valued in accordance with the International Private Equity and Venture Capital Valuation (“IPEV”) guidelines, as updated in December 2015. The methodology applied takes account of the nature, facts and circumstances of the individual investments and uses reasonable data, market inputs, assumptions and estimates in order to ascertain fair value.
Given the nature of the Group’s investments in seed, start-up or early-stage companies, where there are no current and no short-term future earnings or positive cash flows, it can be difficult to gauge the probability and financial impact of the success or failure of development or research activities and to make reliable cash flow forecasts. Consequently, the most appropriate approach to determine fair value is a methodology that is based on market data, that being the price of recent external investment. The Company considers that fair value estimates that are based on observable market data will be of greater reliability than those based on assumptions and accordingly where there has been any recent investment by third parties, the price of that investment will generally provide a basis of the valuation.
Fund interests held by WV will be valued by reference to the reported net asset value or capital account balance of the underlying fund or partnership respectively.
An impairment review is performed to assess the carrying value of investments at each reporting date.
Investments held by WVL which comprise 20% or more of the nominal value of any class of share issued by that entity are considered to be “related undertakings” and relevant details required by the Companies Act
Notes to the Conso l idated F inanc ia l Sta tements
WINTON GROUP LIMITEDAnnual Report for the year ended 31 December 2017
34
2006 are disclosed in note 11. The Group accounts for these investments at fair value through profit or loss because they are held for resale.
Cash and cash equivalents
Cash and cash equivalents comprise cash balances and call deposits.
Loan commitments
Loan commitments are held at amortised cost in accordance with paragraph 11.14 of FRS 102.
Test strategies accounts
The test strategies accounts are external brokerage accounts set up for the purpose of testing the performance of new strategies. The trading positions are held directly on the balance sheet of the Company.
The test portfolio positions are disclosed in accordance with paragraph 12 of FRS 102, ‘Other Financial Instrument Issues’, at fair value through profit or loss. Under paragraph 12.25B, the strategies are presented on a net basis given that under the broker agreement WGL has a legally enforceable right to off-set the amounts and intends either to settle on a net basis or to realise the asset and settle the liability simultaneously.
Investments in subsidiary entities
Investments in subsidiary entities are held at cost less impairment. Changes to impairments and realised gains and losses on disposal are taken to the profit and loss account.
1.17 Other financial instruments
Other financial instruments, not meeting the definition of Basic Financial Instruments, are recognised initially at fair value, which is normally the transaction price. Subsequent to initial recognition, other financial instruments are measured at fair value with changes recognised in profit or loss. Other financial instruments held by the Group during the year were exchange-traded derivative financial instruments held for hedging purposes (see note 16).
2 Revenue
The total revenue of the Group for the year has been derived from its principal activities undertaken in the UK, Switzerland, the US, Hong Kong, Japan, Australia and China, and provided to investors and investment vehicles located primarily outside the UK.
Notes to the Conso l idated F inanc ia l Sta tements
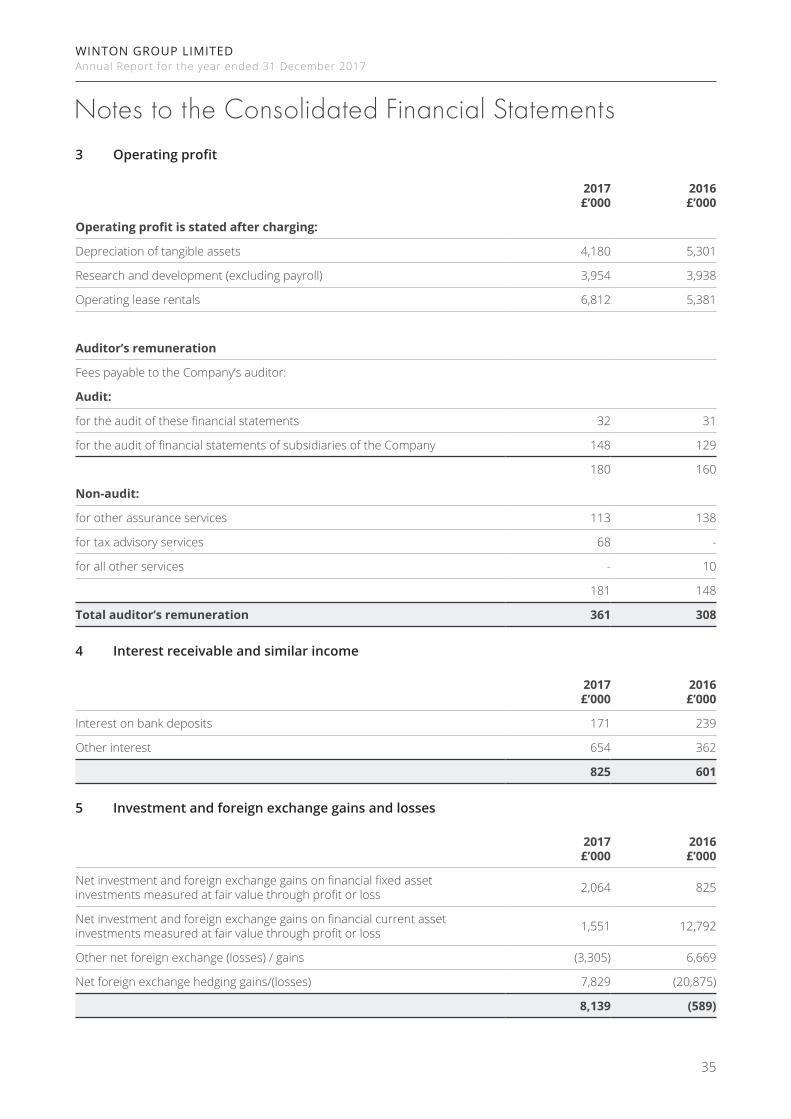
WINTON GROUP LIMITEDAnnual Report for the year ended 31 December 2017
35
3 Operating profit
2017£’000
2016£’000
Operating profit is stated after charging:
Depreciation of tangible assets 4,180 5,301
Research and development (excluding payroll) 3,954 3,938
Operating lease rentals 6,812 5,381
Auditor’s remuneration
Fees payable to the Company’s auditor:
Audit:
for the audit of these financial statements 32 31
for the audit of financial statements of subsidiaries of the Company 148 129
180 160
Non-audit:
for other assurance services 113 138
for tax advisory services 68 -
for all other services - 10
181 148
Total auditor’s remuneration 361 308
4 Interest receivable and similar income
2017£’000
2016£’000
Interest on bank deposits 171 239
Other interest 654 362
825 601
5 Investment and foreign exchange gains and losses
2017£’000
2016£’000
Net investment and foreign exchange gains on financial fixed asset investments measured at fair value through profit or loss 2,064 825
Net investment and foreign exchange gains on financial current asset investments measured at fair value through profit or loss 1,551 12,792
Other net foreign exchange (losses) / gains (3,305) 6,669
Net foreign exchange hedging gains/(losses) 7,829 (20,875)
8,139 (589)
Notes to the Conso l idated F inanc ia l Sta tements

WINTON GROUP LIMITEDAnnual Report for the year ended 31 December 2017
36
The Group hedged its exposure to movements in the USD/GBP exchange rate during the year given that a large proportion of revenue is denominated in USD. This was done using exchange-traded futures giving rise to a gain of £7,829,000 in the year (2016: loss of £20,875,000).
6 Interest payable and similar expenses
2017£’000
2016£’000
Other interest 947 161
Interest payable on financial instruments held at amortised cost (bank loans) 1,312 1,084
2,259 1,245
7 Taxation
Domestic current year tax2017£’000
2016£’000
UK corporation tax 21,695 17,758
Adjustment for prior years (785) 5,603
20,910 23,361
Foreign current year tax
Foreign corporation tax 3,100 4,164
Current tax charge for the year 24,010 27,525
Deferred tax (see note 15)
Deferred tax charge current year 804 396
Adjustment for prior years (59) (3,710)
Total tax charge for the year 24,755 24,211
The effective tax rate for the year differs from the standard rate of corporation tax in the UK, which was reduced to 19% in 2017 from 20% in 2016. The reasons for the difference are explained below:
Factors affecting the tax charge for the year
Profit on ordinary activities before taxation 125,352 107,348
Profit on ordinary activities before taxation multiplied by the average standard rate of UK corporation tax of 19.25% (2016 – 20%). 24,130 21,470
Effects of:
Non deductible expenses (48) 1,892
Tax credits 86 (510)
Prior year adjustments (844) 399
Other permanent differences 776 (21)
Different tax rates charged in overseas subsidiaries 655 981
625 2,741
Total tax charge for the year 24,755 24,211
Notes to the Conso l idated F inanc ia l Sta tements

WINTON GROUP LIMITEDAnnual Report for the year ended 31 December 2017
37
Total tax contribution
During 2017, the Group incurred taxes of £23.8 million and collected taxes on behalf of the relevant tax authorities of an estimated £26.2 million, as shown below:
Taxes borne2017£’000
2016£’000
Employer’s social security paid in year 9,371 10,074
Corporation tax (current tax) 14,393 29,804
23,764 39,878
Taxes collected and paid on behalf of employees
Tax paid in year 23,475 25,481
Social security paid in year 2,727 2,708
26,202 28,189
Total taxes borne and collected 49,966 68,067
As in prior years, most of the Group’s services continue to be provided to investors and investment vehicles located outside the UK, making the Company a significant exporter of services from the UK.
8 Profit for the financial year
As permitted by section 408 of the Companies Act 2006, the Company’s profit and loss account has not been included in these financial statements. The profit for the financial year is as follows:
2017£’000
2016£’000
Company’s profit for the financial year 58,672 178,250
9 Dividends
2017£’000
2016£’000
Dividends included in the Statement of Changes in Equity 57,985 157,745
Dividends expensed through Profit & Loss 342 1,496
Ordinary interim dividends paid 58,327 159,241
Notes to the Conso l idated F inanc ia l Sta tements
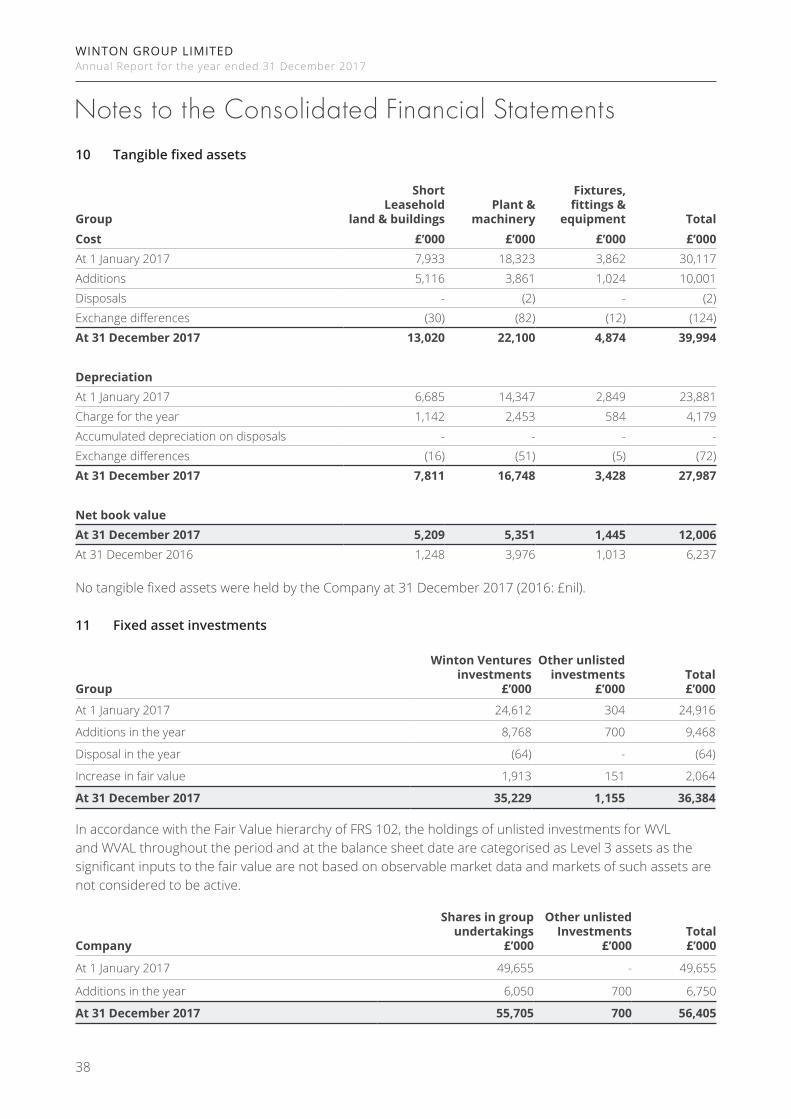
WINTON GROUP LIMITEDAnnual Report for the year ended 31 December 2017
38
10 Tangible fixed assets
Group
Short Leasehold
land & buildingsPlant &
machinery
Fixtures,fittings &
equipment TotalCost £’000 £’000 £’000 £’000At 1 January 2017 7,933 18,323 3,862 30,117
Additions 5,116 3,861 1,024 10,001
Disposals - (2) - (2)
Exchange differences (30) (82) (12) (124)
At 31 December 2017 13,020 22,100 4,874 39,994
DepreciationAt 1 January 2017 6,685 14,347 2,849 23,881
Charge for the year 1,142 2,453 584 4,179
Accumulated depreciation on disposals - - - -
Exchange differences (16) (51) (5) (72)
At 31 December 2017 7,811 16,748 3,428 27,987
Net book valueAt 31 December 2017 5,209 5,351 1,445 12,006At 31 December 2016 1,248 3,976 1,013 6,237
No tangible fixed assets were held by the Company at 31 December 2017 (2016: £nil).
11 Fixed asset investments
Group
Winton Ventures investments
£’000
Other unlisted investments
£’000Total£’000
At 1 January 2017 24,612 304 24,916
Additions in the year 8,768 700 9,468
Disposal in the year (64) - (64)
Increase in fair value 1,913 151 2,064
At 31 December 2017 35,229 1,155 36,384
In accordance with the Fair Value hierarchy of FRS 102, the holdings of unlisted investments for WVL and WVAL throughout the period and at the balance sheet date are categorised as Level 3 assets as the significant inputs to the fair value are not based on observable market data and markets of such assets are not considered to be active.
Company
Shares in group undertakings
£’000
Other unlisted Investments
£’000Total£’000
At 1 January 2017 49,655 - 49,655
Additions in the year 6,050 700 6,750
At 31 December 2017 55,705 700 56,405
Notes to the Conso l idated F inanc ia l Sta tements

WINTON GROUP LIMITEDAnnual Report for the year ended 31 December 2017
39
Subsidiary undertakings Registered office Percentage held
Winton Capital Management Limited 16 Old Bailey, London, UK, EC4M 7EG 100%
Winton Fund Management Limited 16 Old Bailey, London, UK, EC4M 7EG 100%
Winton Ventures Limited 16 Old Bailey, London, UK, EC4M 7EG 100%
Winton Ventures Acquisitions Limited * 16 Old Bailey, London, UK, EC4M 7EG 100%
Winton Exergy Limited 16 Old Bailey, London, UK, EC4M 7EG 100%
Hivemind Technologies Limited# 16 Old Bailey, London, UK, EC4M 7EG 100%
Redshift Zero Limited# * 16 Old Bailey, London, UK, EC4M 7EG 100%
Winton Prediction Markets Limited# 16 Old Bailey, London, UK, EC4M 7EG 100%
Winton Capital Australia Pty Limited Level 29, Grosvenor Place, 225 George Street, Sydney NSW 2000, Australia 100%
Winton Capital Asia Limited 63/F, 6305-06 The Center 99 Queen’s Road Central Hong Kong 100%
Winton Investment Fund Management (Shanghai) Limited**
2013-14, 20/F, Tower Two, International Finance Center, 8 Century Avenue, Pudong, Shanghai 200120, China
100%
Winton Capital (Cayman) Limited Maples Corporate Services Limited, PO Box 309, Ugland House, Grand Cayman 100%
Winton Capital Japan Co., Limited Level 7, Yusen Building, 2-3-2 Marunouchi, Chiyoda-ku, Tokyo 1000005, Japan 100%
Winton Capital Switzerland AG 6th Floor, Selnaustrasse 32, 8001 Zurich, Switzerland 100%
Winton Capital US LLC 313 Park Avenue South, New York, NY 10010, USA 100%
Winton Investment Advisers India LLP Level 7, Mfar Green Heart, Manyata Tech Park, Hebbal Outer Ring Road, Bangalore KA 560045, India 100%
Joint Venture Registered Office Percentage held
Exergy Capital Management LLP 16 Old Bailey, London, UK, EC4M 7EG 50%
Related undertakings*** Registered Office Percentage held
Ripjar Limited Suite 404, Eagle Tower Montpellier Drive, Cheltenham, Gloucestershire, GL50 1TA
43% (Ordinary shares and Preference shares)
L Marks Limited 20 Broad Lane, Hale, Altrincham, Cheshire, WA15 0DF 20%
All shareholdings are ordinary shares unless otherwise stated.
#Dormant
* Indirectly held by Winton Ventures Limited
** Indirectly held by Winton Capital Asia Limited
***Held by Winton Ventures Limited as part of the investment portfolio – see note 1.16.
Notes to the Conso l idated F inanc ia l Sta tements
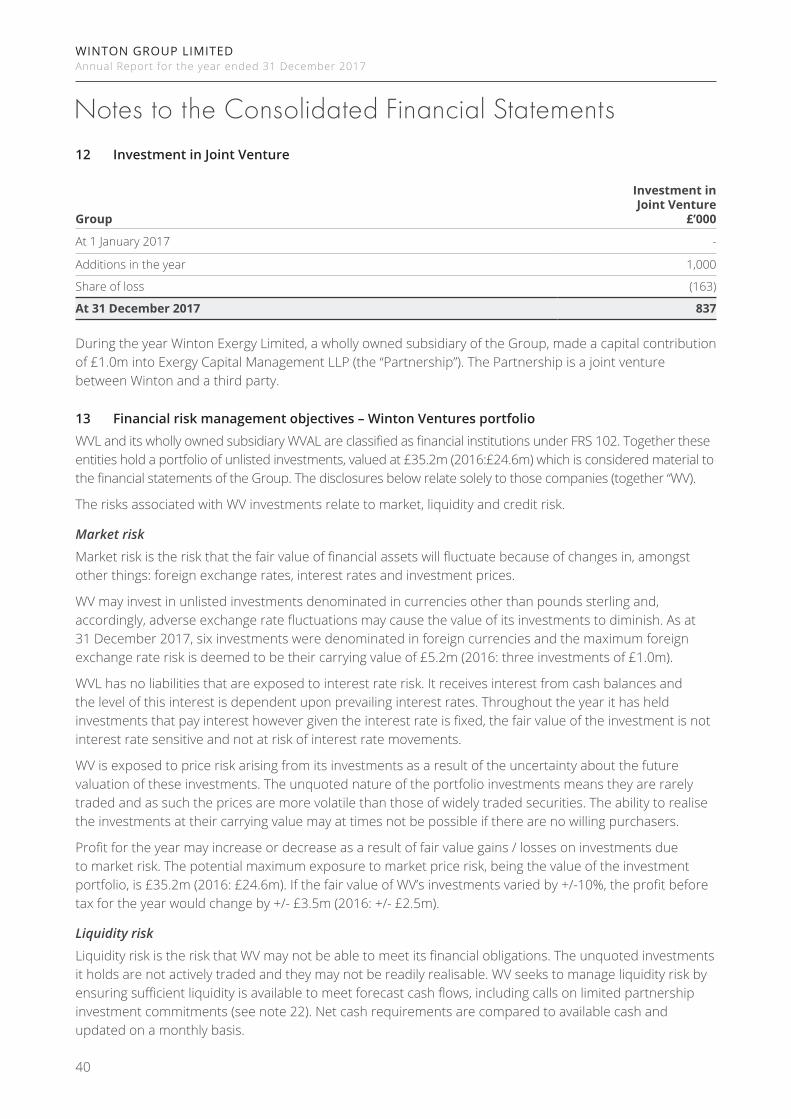
WINTON GROUP LIMITEDAnnual Report for the year ended 31 December 2017
40
12 Investment in Joint Venture
Group
Investment in Joint Venture
£’000
At 1 January 2017 -
Additions in the year 1,000
Share of loss (163)
At 31 December 2017 837
During the year Winton Exergy Limited, a wholly owned subsidiary of the Group, made a capital contribution of £1.0m into Exergy Capital Management LLP (the “Partnership”). The Partnership is a joint venture between Winton and a third party.
13 Financial risk management objectives – Winton Ventures portfolio
WVL and its wholly owned subsidiary WVAL are classified as financial institutions under FRS 102. Together these entities hold a portfolio of unlisted investments, valued at £35.2m (2016:£24.6m) which is considered material to the financial statements of the Group. The disclosures below relate solely to those companies (together “WV).
The risks associated with WV investments relate to market, liquidity and credit risk.
Market risk
Market risk is the risk that the fair value of financial assets will fluctuate because of changes in, amongst other things: foreign exchange rates, interest rates and investment prices.
WV may invest in unlisted investments denominated in currencies other than pounds sterling and, accordingly, adverse exchange rate fluctuations may cause the value of its investments to diminish. As at 31 December 2017, six investments were denominated in foreign currencies and the maximum foreign exchange rate risk is deemed to be their carrying value of £5.2m (2016: three investments of £1.0m).
WVL has no liabilities that are exposed to interest rate risk. It receives interest from cash balances and the level of this interest is dependent upon prevailing interest rates. Throughout the year it has held investments that pay interest however given the interest rate is fixed, the fair value of the investment is not interest rate sensitive and not at risk of interest rate movements.
WV is exposed to price risk arising from its investments as a result of the uncertainty about the future valuation of these investments. The unquoted nature of the portfolio investments means they are rarely traded and as such the prices are more volatile than those of widely traded securities. The ability to realise the investments at their carrying value may at times not be possible if there are no willing purchasers.
Profit for the year may increase or decrease as a result of fair value gains / losses on investments due to market risk. The potential maximum exposure to market price risk, being the value of the investment portfolio, is £35.2m (2016: £24.6m). If the fair value of WV’s investments varied by +/-10%, the profit before tax for the year would change by +/- £3.5m (2016: +/- £2.5m).
Liquidity risk
Liquidity risk is the risk that WV may not be able to meet its financial obligations. The unquoted investments it holds are not actively traded and they may not be readily realisable. WV seeks to manage liquidity risk by ensuring sufficient liquidity is available to meet forecast cash flows, including calls on limited partnership investment commitments (see note 22). Net cash requirements are compared to available cash and updated on a monthly basis.
Notes to the Conso l idated F inanc ia l Sta tements
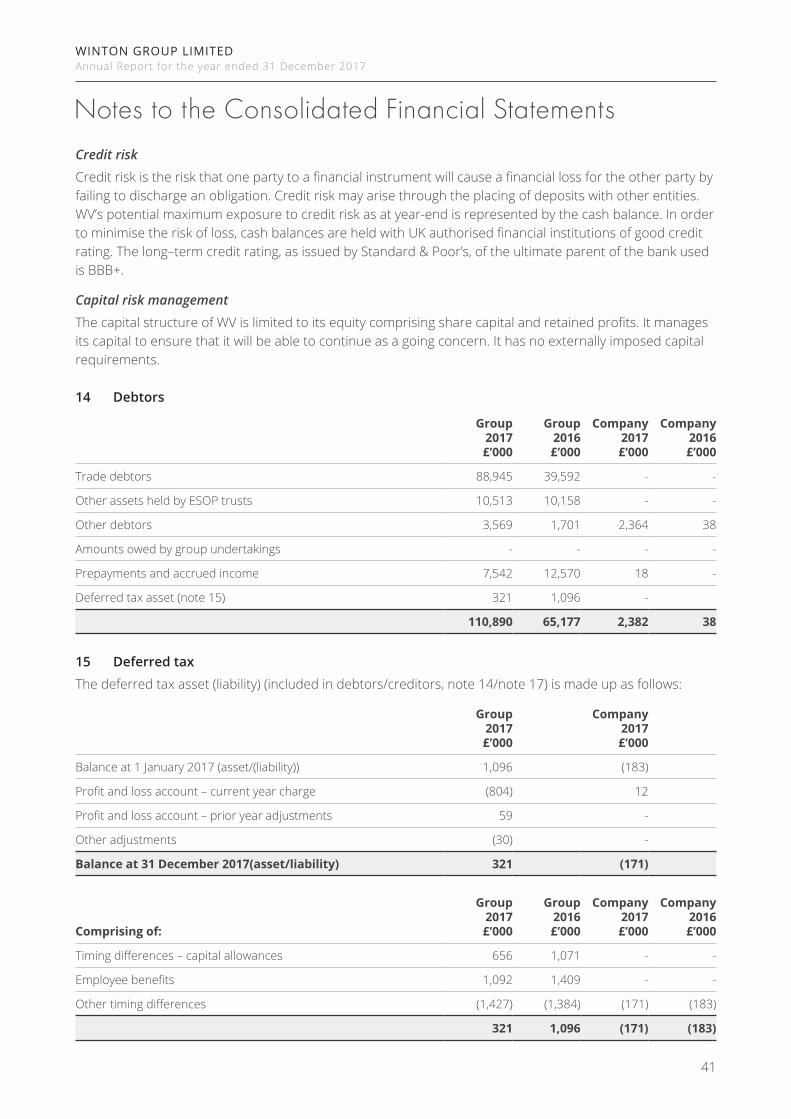
WINTON GROUP LIMITEDAnnual Report for the year ended 31 December 2017
41
Credit risk
Credit risk is the risk that one party to a financial instrument will cause a financial loss for the other party by failing to discharge an obligation. Credit risk may arise through the placing of deposits with other entities. WV’s potential maximum exposure to credit risk as at year-end is represented by the cash balance. In order to minimise the risk of loss, cash balances are held with UK authorised financial institutions of good credit rating. The long–term credit rating, as issued by Standard & Poor’s, of the ultimate parent of the bank used is BBB+.
Capital risk management
The capital structure of WV is limited to its equity comprising share capital and retained profits. It manages its capital to ensure that it will be able to continue as a going concern. It has no externally imposed capital requirements.
14 Debtors
Group2017£’000
Group2016£’000
Company2017£’000
Company2016£’000
Trade debtors 88,945 39,592 - -
Other assets held by ESOP trusts 10,513 10,158 - -
Other debtors 3,569 1,701 2,364 38
Amounts owed by group undertakings - - - -
Prepayments and accrued income 7,542 12,570 18 -
Deferred tax asset (note 15) 321 1,096 -
110,890 65,177 2,382 38
15 Deferred tax
The deferred tax asset (liability) (included in debtors/creditors, note 14/note 17) is made up as follows:
Group2017£’000
Company2017£’000
Balance at 1 January 2017 (asset/(liability)) 1,096 (183)
Profit and loss account – current year charge (804) 12
Profit and loss account – prior year adjustments 59 -
Other adjustments (30) -
Balance at 31 December 2017(asset/liability) 321 (171)
Comprising of:
Group2017£’000
Group2016£’000
Company2017£’000
Company2016£’000
Timing differences – capital allowances 656 1,071 - -
Employee benefits 1,092 1,409 - -
Other timing differences (1,427) (1,384) (171) (183)
321 1,096 (171) (183)
Notes to the Conso l idated F inanc ia l Sta tements
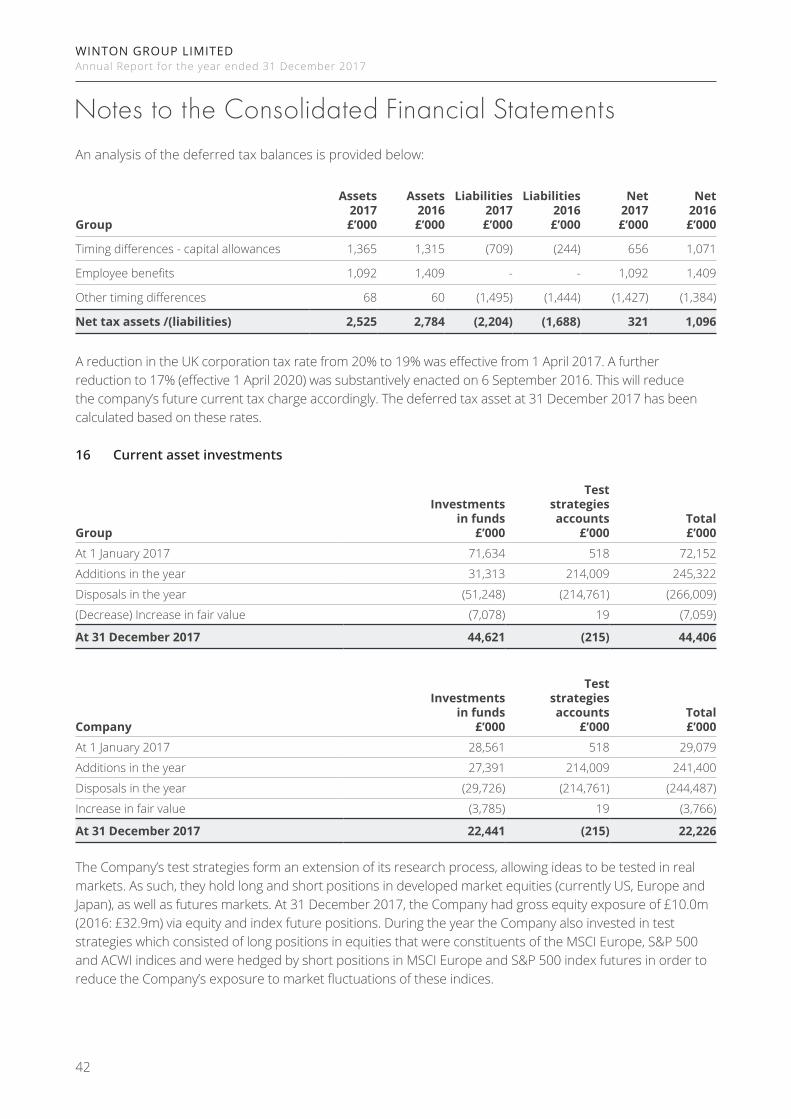
WINTON GROUP LIMITEDAnnual Report for the year ended 31 December 2017
42
An analysis of the deferred tax balances is provided below:
Group
Assets2017£’000
Assets2016£’000
Liabilities2017£’000
Liabilities2016£’000
Net2017£’000
Net2016£’000
Timing differences - capital allowances 1,365 1,315 (709) (244) 656 1,071
Employee benefits 1,092 1,409 - - 1,092 1,409
Other timing differences 68 60 (1,495) (1,444) (1,427) (1,384)
Net tax assets /(liabilities) 2,525 2,784 (2,204) (1,688) 321 1,096
A reduction in the UK corporation tax rate from 20% to 19% was effective from 1 April 2017. A further reduction to 17% (effective 1 April 2020) was substantively enacted on 6 September 2016. This will reduce the company’s future current tax charge accordingly. The deferred tax asset at 31 December 2017 has been calculated based on these rates.
16 Current asset investments
Group
Investments in funds
£’000
Test strategies accounts
£’000Total£’000
At 1 January 2017 71,634 518 72,152
Additions in the year 31,313 214,009 245,322
Disposals in the year (51,248) (214,761) (266,009)
(Decrease) Increase in fair value (7,078) 19 (7,059)
At 31 December 2017 44,621 (215) 44,406
Company
Investments in funds
£’000
Test strategies accounts
£’000Total£’000
At 1 January 2017 28,561 518 29,079
Additions in the year 27,391 214,009 241,400
Disposals in the year (29,726) (214,761) (244,487)
Increase in fair value (3,785) 19 (3,766)
At 31 December 2017 22,441 (215) 22,226
The Company’s test strategies form an extension of its research process, allowing ideas to be tested in real markets. As such, they hold long and short positions in developed market equities (currently US, Europe and Japan), as well as futures markets. At 31 December 2017, the Company had gross equity exposure of £10.0m (2016: £32.9m) via equity and index future positions. During the year the Company also invested in test strategies which consisted of long positions in equities that were constituents of the MSCI Europe, S&P 500 and ACWI indices and were hedged by short positions in MSCI Europe and S&P 500 index futures in order to reduce the Company’s exposure to market fluctuations of these indices.
Notes to the Conso l idated F inanc ia l Sta tements

WINTON GROUP LIMITEDAnnual Report for the year ended 31 December 2017
43
Company2017£’000
2016£’000
Gains on fair value hedged item 2,399 523
Losses on fair value hedge instrument (1,790) (572)
17 Creditors: amounts falling due within one year
Group2017£’000
Group2016£’000
Company2017£’000
Company2016£’000
Trade creditors 1,157 1,543 - -
Corporation tax 18,398 11,717 - 365
Taxes and social security costs 2,069 3,724 - -
Other creditors 477 3,570 19,987 -
Deferred tax liability (note 15) - - 171 183
Amounts owed to group undertakings - - - 20,280
Bank loans repayable within 5 years 30,000 42,500 -
Group accruals and deferred income 31,161 23,493 216 32
83,262 86,547 20,374 20,860
Bank loans wholly repayable within five years consist of the amount drawn by the Company against a £40 million multicurrency revolving loan facility held with a major banking group. The facility was reduced from £60m to £40m during the year. The loan commenced on 23 March 2016 and is a three–year agreement with interest accrued daily on the drawn account at LIBOR plus 2.35% pa, plus 0.94% pa on the undrawn facility. The facility matures and can be rolled over every three months up to its three-year anniversary. During the year, the maximum amount drawn against the facility was £54.5 million. Refer to note 27 for further information.
18 Creditors: amounts falling due after more than one year
Group2017£’000
2016£’000
Accruals and deferred income 2,987 5,701
The Company had no creditors falling due after more than one year (2016: £nil).
19 Financial Instruments
The carrying amounts of the financial assets and liabilities include:2017£’000
2016£’000
Financial assets measured at fair value through profit or loss 110,383 106,906
Financial assets measured at cost less impairment 204,912 167,601
Financial liabilities measured at amortised costs (30,000) (42,500)
Financial liabilities measured at fair value through profit or loss - (3,088)
Financial liabilities measured at cost less impairment (56,249) (46,772)
Notes to the Conso l idated F inanc ia l Sta tements
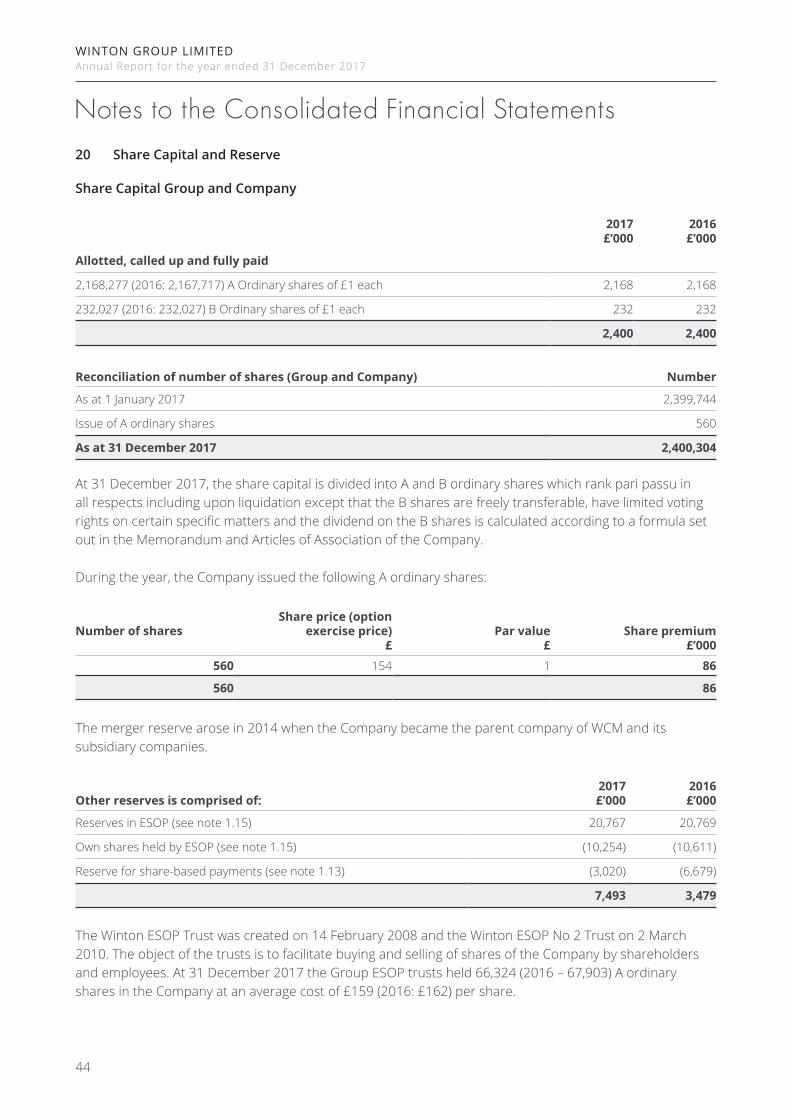
WINTON GROUP LIMITEDAnnual Report for the year ended 31 December 2017
44
20 Share Capital and Reserve
Share Capital Group and Company
2017£’000
2016£’000
Allotted, called up and fully paid
2,168,277 (2016: 2,167,717) A Ordinary shares of £1 each 2,168 2,168
232,027 (2016: 232,027) B Ordinary shares of £1 each 232 232
2,400 2,400
Reconciliation of number of shares (Group and Company) Number
As at 1 January 2017 2,399,744
Issue of A ordinary shares 560
As at 31 December 2017 2,400,304
At 31 December 2017, the share capital is divided into A and B ordinary shares which rank pari passu in all respects including upon liquidation except that the B shares are freely transferable, have limited voting rights on certain specific matters and the dividend on the B shares is calculated according to a formula set out in the Memorandum and Articles of Association of the Company.
During the year, the Company issued the following A ordinary shares:
Number of sharesShare price (option
exercise price)£
Par value£
Share premium£’000
560 154 1 86
560 86
The merger reserve arose in 2014 when the Company became the parent company of WCM and its subsidiary companies.
Other reserves is comprised of:2017£’000
2016£’000
Reserves in ESOP (see note 1.15) 20,767 20,769
Own shares held by ESOP (see note 1.15) (10,254) (10,611)
Reserve for share-based payments (see note 1.13) (3,020) (6,679)
7,493 3,479
The Winton ESOP Trust was created on 14 February 2008 and the Winton ESOP No 2 Trust on 2 March 2010. The object of the trusts is to facilitate buying and selling of shares of the Company by shareholders and employees. At 31 December 2017 the Group ESOP trusts held 66,324 (2016 – 67,903) A ordinary shares in the Company at an average cost of £159 (2016: £162) per share.
Notes to the Conso l idated F inanc ia l Sta tements

WINTON GROUP LIMITEDAnnual Report for the year ended 31 December 2017
45
21 Financial commitments
At 31 December 2017, the Group had total commitments under non-cancellable operating leases payable as follows:
Land and buildings
2017£’000
Land and buildings
2016£’000
Other2017£’000
Other2016£’000
No later than one year 7,392 8,859 4,298 3,631
Later than one year and no later than five years 23,226 23,622 1,407 1,488
Later than five years 10,399 16,956 - -
41,017 49,437 5,705 5,119
22 Capital commitments
The Company had no capital commitments at 31 December 2017.
WVL and WVAL have entered into six (2016: three) limited partnership agreements (“LPAs”) under which they have a total commitment of £8.6 million (2016: £4.5 million) for subsequent investing activities which may be drawn down at short notice by the manager until the end of the investment period as defined in the individual LPAs.
As at 31 December 2017, the total capital contributed to the partnerships was £2.8 million (2016: £1.1 million) with outstanding capital commitments of £5.8 million (2016: £3.4 million).
23 Directors’ remuneration
2017£’000
2016£’000
Directors’ emoluments 2,584 4,893
Company contributions to directors’ personal pension plans - 15
Compensation for loss of office - 1,709
2,584 6,617
Remuneration disclosed above include the following amounts paid to the highest paid director:
Remuneration for qualifying services 1,103 3,568
No directors exercised share options during the year (2016: nil).
Notes to the Conso l idated F inanc ia l Sta tements

WINTON GROUP LIMITEDAnnual Report for the year ended 31 December 2017
46
24 Employees
Number of employees
The average monthly number of employees (including directors) for each division during the year was:
2017Number
2016Number
Board of Directors 8 11
Research and Data (including Hivemind Technologies) 114 93
Investment Management 117 130
Technology 92 101
Corporate 122 120
453 455
The average monthly number of employees (including directors) for each location during the year was:
2017Number
2016Number
UK 373 382
US 37 34
Switzerland 15 16
Hong Kong 10 12
China 10 5
Japan 4 3
Australia 4 3
453 455
Employment costs2017£’000
2016£’000
Wages and salaries 80,207 86,437
Social security costs 9,371 10,074
Other pension costs 3,572 2,977
93,150 99,488
Personal pension plans
The Company contributes to individual employees’ personal pension plans. The assets of the plans are held separately from those of the Group in independently administered funds.
Notes to the Conso l idated F inanc ia l Sta tements

WINTON GROUP LIMITEDAnnual Report for the year ended 31 December 2017
47
25 Related party transactions
During the year the Company paid dividends of £32.9m million (2016: £99.3 million) to the directors, or in one case a family trust in which the director has a beneficial interest, on their ordinary shareholdings in the Company.
During the year the Group made donations to Winton Philanthropies in which D W Harding and M J Hunt are Trustees, amounting to £700k (2016: £738k).
Transactions with key management personnel
Total compensation of key management personnel (including the directors) in the year amounted to £9.5 million (2016: £13.8 million).
During the year, the Company had related party transactions with key management personnel in relation to services provided amounting to £15k (2016: £14k).
26 Share based payments
Employees have been granted options under an Enterprise Management Incentive Scheme and an Unapproved Options Scheme that entitle the holders to purchase ordinary A shares in the Company at a future date at a specified price.
There is no expense recognised for 2017 (2016: £nil) as no options were granted in the current or prior year.
The following table shows the movements of share options during the year:
2017Number
2016Number
Outstanding at the beginning of the year 8,534 11,177
Options exercised during the year (560) (1,613)
Lapsed during the year (400) (1,030)
7,574 8,534
The range of exercise prices for options outstanding at the year-end was £154 - £300 (2016: £154 - £300).
27 Post balance sheet events
Dividends in relation to the ordinary shares totalling £13.9m and £10.2m were paid in January 2018 and April 2018 respectively.
The Company repaid the full outstanding loan balance of £30.0m and cancelled the loan facility on 29 March 2018.
Notes to the Conso l idated F inanc ia l Sta tements

winton .com