
Webinar: Dyn + DataStax - helping companies deliver exceptional end-user experience

MaxiTRANS Industries Limited ACN 006 797 173
HELPING DELIVER THE NEEDS OF THE NATION
Annual Report 2020
MaxiTR
ANS Industries
|A
NN
UA
L REP
OR
T 2020

352
340
340
409
318
1916 17 18 2020
4.8
8.8
10.7
10.1
0.5
1916 17 18 2020
03
3.5
3.5 0
1916 17 18 2020
ContentsCompany Overview 2Chairman’s Report 4Managing Director’s Review 5MaxiPARTS – Positioned for Future 7Customer Focused 8Operational Summary 10
Board of Directors 12Executive Leadership Team 13Report of the Directors and Financial Report 14Corporate Directory IBCCorporate Governance Statement IBC
Revenue ($m)
Underlying net profit after tax ($m)
Ordinary dividends declared per share (cents)
2020 Financial Highlights

� One of the largest suppliers of truck and trailer parts to the road transport industry in Australia through the MaxiPARTS wholesale and retail network.
� A major player in the New Zealand road transport trailer industry.
� Australia’s largest supplier of locally manufactured, high quality engineered road transport trailer solutions including trailer repairs, service and rental.
Dealer Expansion
Delivering trailing and transport solutions for customers in every corner of Australia and New Zealand.
ANNUAL REPORT 2020 1

COMPANY OVERVIEW
Capabilities Statement
MaxiTRANS provides a range of innovative solutions and services for the road transportation sector. Our brands are well known within the industry in serving a reputation for being a leader in supporting the entire value chain and life cycle of road, bulk and refrigerated transportation. Our diversity enables us to be at the forefront for innovation, design, and aftersales support. As loyal servants to many transport operators including established multinational providers, MaxiTRANS’ iconic brands are relied upon to continue to deliver the needs of the nation daily.
With an extensive network conveniently situated across major transportation hubs throughout Australia and New Zealand, MaxiTRANS continues to support customers day after day, while our capabilities cover every aspect of our customers’ requirements. We also provide on‑going support wherever and whenever it is needed. MaxiTRANS has been operating for almost 75 years, and throughout the duration, we continue to progress with the ongoing commitment to our customers, employees, and the transport industry to deliver safer, more efficient, and reliable transport solutions. This is what keeps MaxiTRANS ahead of the game.
DELIVERING QUALITY
SOLUTIONS AND BEST IN CLASS
CUSTOMER SUPPORT
Why MaxiTRANS?
2 MAxITRANS INDUSTRIES

To provide customers with a driven focus on efficiencies in design, quality and customer engagement whilst offering the best coverage for after sales support.
Value proposition
Be honest, forthright and ethical in our dealings
Send all our people home safely
Encourage collaboration and deep seated accountability
A balanced focus on customers and results
Become better every day in all that we do
Enable and empower people to achieve results
ANNUAL REPORT 2020 3
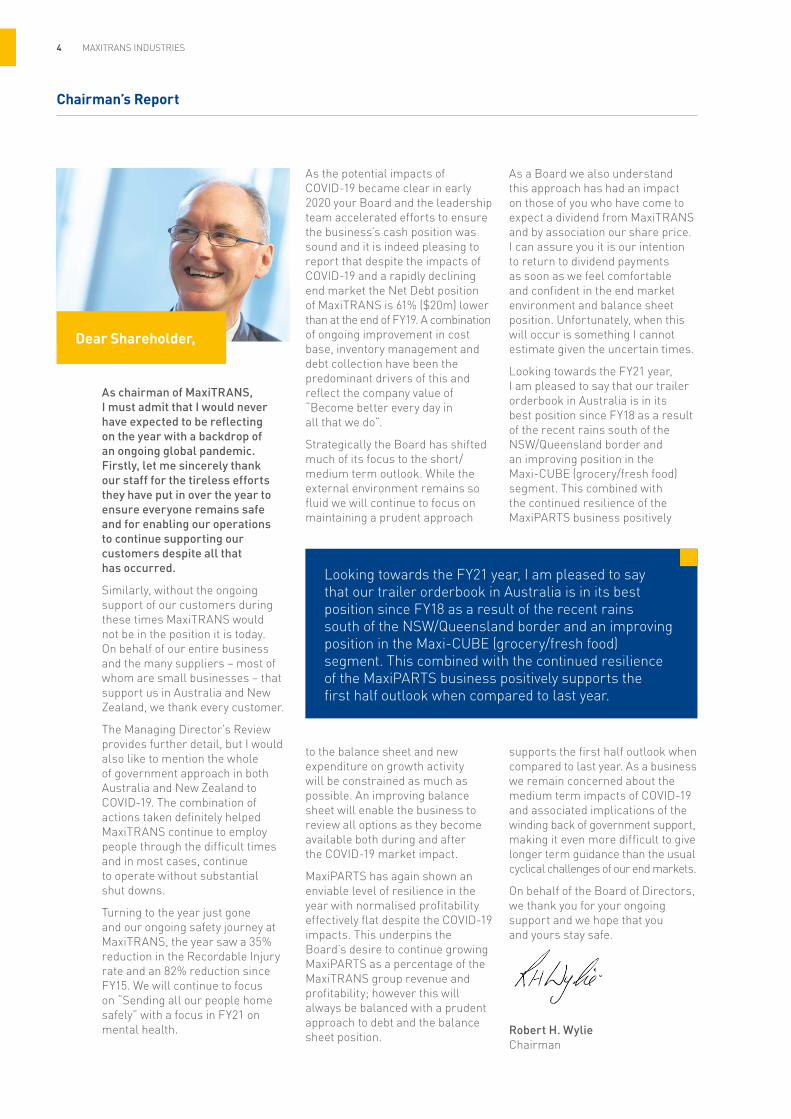
As chairman of MaxiTRANS, I must admit that I would never have expected to be reflecting on the year with a backdrop of an ongoing global pandemic. Firstly, let me sincerely thank our staff for the tireless efforts they have put in over the year to ensure everyone remains safe and for enabling our operations to continue supporting our customers despite all that has occurred.
Similarly, without the ongoing support of our customers during these times MaxiTRANS would not be in the position it is today. On behalf of our entire business and the many suppliers – most of whom are small businesses – that support us in Australia and New Zealand, we thank every customer.
The Managing Director’s Review provides further detail, but I would also like to mention the whole of government approach in both Australia and New Zealand to COVID‑19. The combination of actions taken definitely helped MaxiTRANS continue to employ people through the difficult times and in most cases, continue to operate without substantial shut downs.
Turning to the year just gone and our ongoing safety journey at MaxiTRANS, the year saw a 35% reduction in the Recordable Injury rate and an 82% reduction since FY15. We will continue to focus on “Sending all our people home safely” with a focus in FY21 on mental health.
As the potential impacts of COVID‑19 became clear in early 2020 your Board and the leadership team accelerated efforts to ensure the business’s cash position was sound and it is indeed pleasing to report that despite the impacts of COVID‑19 and a rapidly declining end market the Net Debt position of MaxiTRANS is 61% ($20m) lower than at the end of FY19. A combination of ongoing improvement in cost base, inventory management and debt collection have been the predominant drivers of this and reflect the company value of “Become better every day in all that we do”.
Strategically the Board has shifted much of its focus to the short/medium term outlook. While the external environment remains so fluid we will continue to focus on maintaining a prudent approach
to the balance sheet and new expenditure on growth activity will be constrained as much as possible. An improving balance sheet will enable the business to review all options as they become available both during and after the COVID‑19 market impact.
MaxiPARTS has again shown an enviable level of resilience in the year with normalised profitability effectively flat despite the COVID‑19 impacts. This underpins the Board’s desire to continue growing MaxiPARTS as a percentage of the MaxiTRANS group revenue and profitability; however this will always be balanced with a prudent approach to debt and the balance sheet position.
As a Board we also understand this approach has had an impact on those of you who have come to expect a dividend from MaxiTRANS and by association our share price. I can assure you it is our intention to return to dividend payments as soon as we feel comfortable and confident in the end market environment and balance sheet position. Unfortunately, when this will occur is something I cannot estimate given the uncertain times.
Looking towards the FY21 year, I am pleased to say that our trailer orderbook in Australia is in its best position since FY18 as a result of the recent rains south of the NSW/Queensland border and an improving position in the Maxi‑CUBE (grocery/fresh food) segment. This combined with the continued resilience of the MaxiPARTS business positively
supports the first half outlook when compared to last year. As a business we remain concerned about the medium term impacts of COVID‑19 and associated implications of the winding back of government support, making it even more difficult to give longer term guidance than the usual cyclical challenges of our end markets.
On behalf of the Board of Directors, we thank you for your ongoing support and we hope that you and yours stay safe.
Robert H. Wylie Chairman
Looking towards the FY21 year, I am pleased to say that our trailer orderbook in Australia is in its best position since FY18 as a result of the recent rains south of the NSW/Queensland border and an improving position in the Maxi‑CUBE (grocery/fresh food) segment. This combined with the continued resilience of the MaxiPARTS business positively supports the first half outlook when compared to last year.
Chairman’s Report
Dear Shareholder,
4 MAxITRANS INDUSTRIES

Before starting the detailed MD report, I would like to reiterate the comments of our Chairman and recognise the efforts of our customers through COVID‑19. As Ben Maguire (outgoing Chief Executive of the Australian Trucking Association) has said regularly over 2020, “the importance to Australian society of the Trucking and Logistics sector has become more apparent in recent times than anyone could imagine”. The same sentiment applies equally in New Zealand.
Similarly, to our staff and their families, thanks so much for the hard work and effort you have put in to support our customers and by association the Australian community.
FY20 has again seen declining end markets which led the business to dramatically reduce costs through the year and focus on cash generation. This resulted in $8.4m of realised savings in the year with another $1.6m to be realised in the FY21 year. As the potential impacts of COVID‑19 became clearer in early 2020, MaxiTRANS remained firmly focused on cash generation and maintaining balance sheet stability. This resulted in Net Debt of $12.1m at June 30, a $40.2m reduction over the last 18 months. MaxiTRANS achieved an operating cash inflow of $31.4m, of which $4.5m related to early customer receipts for the Trailer Solutions business and $8.7m of lease payments (AASB‑16 reporting related). The remainder of $18.2m was predominantly due to inventory and debtor reductions.
As disclosed in the H1 FY20 results, the Group initiated substantive cost reductions over calendar year 2019. The annualised target of $10m remains on track with 84% being delivered in FY20 and late FY19.
The Group has worked with our debt holders to develop a revised suite of debt covenants with effect from 1 July 2020.
MaxiPARTS
Despite the impacts of COVID‑19, MaxiPARTS external revenue grew by 1.5% over PCP. Underlying EBITDA before corporate allocations on a like‑for‑like basis adjusted for AASB16 Lease accounting was in line with PCP at $8.4m.
As was the case with the entire business, efficient use of capital remained a focus through the year with stock turns improving by 11% in the year.
Organic growth initiatives continued to support the MaxiPARTS business and largely offset the end market challenges over FY20. Sales to fleet customers looking to take advantage of MaxiPARTS integrated offering grew by 24.5% while the programs aimed at expanding the portfolio further into truck and bus markets which had an 8% growth.
Trailer Solutions
Revenue in the year declined 15.4% over PCP driven by a continued decline in the external trailer market.
Throughout the year operating efficiencies continued to be achieved predominantly in the main plant in Ballarat – with efficiency and manufacturing quality measures well ahead of FY19.
Managing Director’s Review
Dear Shareholder,
5ANNUAL REPORT 2020
Overhead cost reduction targets remained on track. Despite these measures delivering a $10.1m benefit, which weren’t significant enough to offset the decline in volume, mix and manufacturing overhead recoveries of $17.1m.
The efficiency improvements introduced by the manufacturing team should be extended into the Queensland operations over the next 2 years with benefits of the ERP (Enterprise Resource Planning) system and new site coming together. The new Brisbane site becomes operational in Q2 FY21 with benefits expected to start accruing in H2 FY21 and FY22.
COVID‑19
In H2 FY20 some sections of the business were eligible for government assistance packages (JobKeeper in Australia and Wage Subsidy Scheme in New Zealand).
As a result of this, MaxiTRANS was able to retain total employment at similar levels throughout the March‑June period, with a relatively small number of forced shut down days.
Government assistance in the period totalled $5.2m, with the Instant Asset write off program
also assisting Trailer Sales volumes in May and June.
MaxiTRANS does not anticipate being eligible for any additional funding post 30 September 2020.
Outlook
While the ongoing impacts of COVID‑19 remain uncertain in both the near and medium term, MaxiTRANS will remain focused on efficient use of capital and shorter term financial controls. Investment in any new growth programs will be constrained for the foreseeable future.
MaxiPARTS continues to perform well in these challenging times and remains well positioned to be an active part of the Commercial Vehicle Aftermarket Parts segment consolidation after COVID‑19. This remains MaxiTRANS’ strategic growth platform into the future.
After a rapid reduction in revenue early in the COVID‑19 pandemic, MaxiPARTS revenue grew consistently to finish the year at volumes which were comparable to pre‑COVID‑19 levels.
As infection rates fluctuate in the Australian community MaxiTRANS expects a level of short‑term volatility, although
the experience of H2 FY20 supports return to trend performance quite quickly.
In the Trailer Solutions business, recent rains support what is likely to be one of the better South East Australian grain crops in recent years with an associated increase in MaxiTRANS bulk tipper segment. Recent quotation levels have been higher than the last 12 months, and when combined with a sustained conversion rate this has resulted in an improved order‑book position heading into FY21. COVID‑19 presents a potential risk to delivery of these orders if there is any supply chain disruption or further lock‑downs interrupting production.
Counter to this the New Zealand order book remains low as customers defer ordering due to economic concerns.
The COVID‑19 virus and associated economic impacts remains a risk to the Group.
Dean Jenkins Managing Director & CEO
Managing Director’s Review (Cont.)
Whilst maintaining consistent pathways of strategy the scope has been refined to ensure we underpin continued focus on balance sheet prudence:
� Operational excellence – Ensure the Group’s systems and processes deliver high quality, cost effective products and services, with a focus on margin over chasing market share.
� Growth – Leverage market leading position to optimise opportunities in MaxiPARTS.
� People – Continue investing in Inclusion and Diversity programs, supported by continuation of our front line and senior leaders’ development program.
� Return on Assets – Actively review the most efficient use of the Group’s assets to deliver the best return on our shareholders’ investment.
� Safety – Continued focus on improving our safety performance to not only ensure we send our people home safely but that MaxiTRANS’ products design also sends our customer’s people home safely.
Strategic activity to focus on near term
6 MAxITRANS INDUSTRIES

Business Resilience
MaxiPARTS has been able to produce another strong result for FY20 despite all the headwinds from the second half.
Throughout the duration of the year, the business proactively implemented a range of cost reduction programs including
personnel restructure, discretionary cost controls and rental support that saw year on year profitability continue to impress.
MaxiPARTS – POSITIONED FOR FUTURE
Impacts of COVID‑19
Pleasingly, after the market shock in March 2020 when COVID‑19 first started to impact Australia, MaxiPARTS’ activity progressively recovered with trading returning to pre‑COVID levels by Q4. This, combined with strong inventory management processes and active communication with the supplier base, means MaxiPARTS did not experience any material impact on stock availability.
The specific organic growth projects implemented over the past few years around both customers and products has led to MaxiPARTS becoming a more diverse business and better able to produce consistent results through various market cycles.
Organic growth programs continue to deliver results
Key fleet growth
20% YoY
Engine program growth
13% YoY
Euro Truck and bus program
7% YoY
Sustaining Strong Operations
With the volatility of the Australian dollar and a slowing market, MaxiPARTS did observe an impact on margin that resulted in a decline by 1% YoY. However, with local increases being passed on to customers, along with price inflation on imported products implemented on 1 June 2020, MaxiPARTS saw a recovery in the last quarter.
Furthermore, to maintain profitability in this abnormal period, the business implemented a range of working capital improvement projects that saw both inventory and debtor days finish the
year at exceptionally good levels which contributed to the overall Group’s cash generation. These programs were sustainable and have not impacted the strong operating fundamentals or service levels within MaxiPARTS.
7ANNUAL REPORT 2020

MaxiTRANS has shifted focus over the course of the past year to become further engaged with our customers. As we continue to grow customer cadence, our focus allows MaxiTRANS to invest a greater emphasis in delivering a more responsive dealer network. We’ve continued to expand our network which includes new partnerships in Western Australia (Roadwest Transport Equipment, G&A Lombardi) and Victoria (GTM Shepparton).
The year ahead we will continue to expand our partnerships to focus on uptime for our customers by ensuring they have greater access to parts and service support.
Partnering for success
MaxiTRANS believes in partnering with its customers to establish long‑term relationships, building on our commitment to offer complete support throughout the life of our products and beyond.
One example is Boral Logistics which recently decided to replace its aged fleet of side tippers, turning to MaxiTRANS to help find the ideal solution to distribute its quarry products throughout Western Queensland.
Segment growth
While the overall trailer market declined through FY20, Freighter and Maxi‑CUBE continued to hold market position within the general freight and grocery segments, in a challenging market.
MaxiTRANS’ bulk segment brands continue to perform in line with market movement as declining civil works, infrastructure projects and drought impact market growth.
Coming into FY21 MaxiTRANS has already seen a positive uplift in demand for bulk product, driven by positive outlook within the agriculture sector.
The business has established a need for additional resources to meet this demand and support this growth through recruitment drives at both Victorian and Queensland manufacturing facilities.
Customer Loyalty
Our customers’ loyalty is only possible because of the continued investment in the evolution of our brands, as well as our dedication to securing long term relationships with our stakeholders. Uniquely, our customer success model reflects both legacy in almost 75 years of service and converting customers of the future.
Many clients we partner with are in their third generation supporting MaxiTRANS as their partner of choice.
CUSTOMER FOCUSED
“The team at MaxiTRANS were terrific. They listened and worked with us to deliver to our requirements. The added convenience of being locally manufactured in Brisbane enabled Boral to be closely involved in the whole build process, in turn fostering a fantastic partnership with MaxiTRANS.”
Cementing relationships
8 MAxITRANS INDUSTRIES

Proud OEM
MaxiTRANS is a proud Australian manufacturer.
To help showcase this, the company embarked on the journey to become accredited to use the Australian made logo. The use of the highly recognisable logo demonstrates MaxiTRANS’ commitment to Australian manufacturing and Australian jobs, while providing our customers with peace of mind that they are supporting Australian made products.
Supporting Industry
During the past twelve months, MaxiTRANS has actively increased its participation and voice in key industry associations at a national level. MaxiTRANS has positioned itself as a driving voice for a more efficient and safer road network through industry involvement with the ATA (Australian Trucking Association) and HVIA (Heavy Vehicle Industry Association Australia).
As we closed the book on another successful year of providing customers with transport solutions, we celebrated a key milestone for the Hamelex White portfolio. 2020 marked 25 years for this iconic Australian tipper brand which is a testament to the support from our loyal customers over the journey.
As we press ahead into the new year, MaxiTRANS will continue to celebrate milestones and key achievements. Most notably will see Freighter, Australia’s leading general freight brand, celebrate 75 years. Additionally, our manufacturing facilities will mark the production of the 100,000th unit.
Supporting Community
MaxiTRANS continues to grow from strength to strength in supporting initiatives that better our communities. Throughout the year MaxiTRANS raised over $19,000 in support for ‘RUOK? Day’. In its third year, we continue to enhance the awareness of mental health and are proud to have been able to donate almost $45,000 since MaxiTRANS first partnered with RUOK.
Drought, Bushfires, and hardship attracted a lot of media attention throughout 2019 and into the beginning of 2020, and again, MaxiTRANS united and assisted in many initiatives, including drought and bushfire relief programs, as well as loaning our equipment to donate supplies to affected communities. This included donating in excess of 22 pallets of food, water and gifts to a drought stricken NSW outback town in Trundle in time for Christmas. In all instances, our community participation is something MaxiTRANS employees value.
Supporting Industry
FY21 will see an expansion in manufacturing capacity for MaxiTRANS as plans to open a new purpose built facility in Carole Park, Queensland are realised.
9ANNUAL REPORT 2020

OPERATIONAL SUMMARY
High Performance Culture
Operational Excellence
Despite FY20 volumes being lower than FY19 driving the need to reduce our fixed costs, MaxiTRANS continued to make progress with operational excellence. This was achieved through consolidating the efforts into a smaller number of strategic projects focussed on core disciplines of MxPS
(MaxiTRANS Production System) and Engineering and Supply Chain.
We also continued with the evolution of our Queensland manufacturing footprint. Each of these projects delivered very positive results. Efficiency across manufacturing improved by $3.9m and on‑time delivery has improved YoY.
Manufacturing Capability
The Queensland Manufacturing project has absorbed a substantial amount of resources in FY20 and will culminate in Q2 2020 with the launch of the new Carole Park facility.
It will also have the ability to manufacture Freighter product, allowing us to diversify our manufacturing capability.
MAxITRANS INDUSTRIES10

From a safety perspective, our KPIs improved in all areas, led by the reduction in our Total Injury Frequency Rate (TIFR) which was down by an impressive 35% compared to FY19.
We have also seen a reduction in First Aid reported injuries of 33% compared to FY19. Through our early intervention program we have had over 80 employees participate, reducing the number and costs of claims submitted while making the experience of recovery from minor injury more seamless for our people.
Manufacturing again made significant progress in safety in FY20. The real highlight for this year was at Richlands manufacturing facility running the last 9 months of the year without suffering a recordable injury. Ballarat reduced injury frequency rate by more than 50%.
35%
33%SIGNIFICANT
PROGRESS IN SAFETY
Safety Performance
The Carole Park facility will provide greater safety, flexibility, efficiency and quality outcomes for our business and our customers.
Designed to match the equipment levels and standard processes available at Ballarat, Carole Park will provide greater capacity to the MaxiTRANS Group and will serve us well, in addition to covering any total market growth.
Building Diversity
It has been another big year for MaxiTRANS on the people front. FY19 was about building foundations while moving into FY20 our goal was to embed the critical processes that enable people growth. To date, we’ve invested in more than 100 employees undertaking a leadership program, which equips participants with tools to help drive a high performance culture.
MaxiTRANS conducted in‑depth research to get a better understanding of the barriers to creating a diverse culture. Focus on driving inclusion was identified as necessary if we want to successfully build diversity. Positively, we have more than doubled our female promotion rate from 10.5% last year to 27.6% this year.
ANNUAL REPORT 2020 11

A
C
E
B
D
F
Robert Wylie (A) – Chairman, Non‑Executive Director James Curtis (B) – Deputy Chairman, Non‑Executive Director Dean Jenkins (C) – Managing Director and CEO Samantha Hogg (D) – Non‑Executive Director Joseph Rizzo (E) – Non‑Executive DirectorMary Verschuer (F) – Non‑Executive Director
Board of Directors
12 MAxITRANS INDUSTRIES

A
C
E
B
D
Tim Bradfield (A) – Chief Financial Officer Trevor Negus (B) – Group GM Manufacturing Angelique Zammit (C) – GM Safety, People and Projects Peter Loimaranta (D) – GM MaxiPARTS and New Zealand Jerry Cade (E) – Head of IT & Group Supply Manager
Executive Leadership Team
13ANNUAL REPORT 2020

MaxiTRaNS iNduSTRieS14
Contents
Financial Summary 15
Report of the directors 16
Lead auditor’s independence declaration under Section 307C of the Corporations Act 2001 33
directors’ declaration 34
Consolidated Statement of Profit or Loss and Consolidated Statement of Comprehensive income 35
Consolidated Statement of Financial Position 36
Consolidated Statement of Changes in equity 37
Consolidated Statement of Cash Flows 39
Notes to the Consolidated Financial Statements 40
independent auditor’s Report 81
australian Stock exchange additional information 86
Report of the directors and Financial ReportFor the year ended 30 June 2020
MaxiTRANS Industries Limited
aCN 006 797 173 and Controlled entities

ANNUAL REPORT 2020 15
Financial Summary
F2016 F2017 F2018 F2019 * F2020
Revenue $’000 340,179 340,072 409,312 352,537 317,599
eBiTda (excluding significant items) (1)(7) $’000 19,219 21,439 20,931 14,157 14,681
eBiT (excluding significant items) (1)(7) $’000 14,199 16,836 16,133 8,378 3,797
NPBT (excluding significant items) (1) $’000 11,840 14,520 13,659 5,687 (741)
NPaT (excluding significant items) (1)(2) $’000 8,752 10,695 10,077 4,809 486
Significant items (net of tax) (4)(5)(6) $’000 (3,517) – – (31,850) (35,977)
NPaT – attributable to equity holders $’000 5,235 10,695 10,077 (27,040) (35,492)
Basic ePS (3) cents 2.83 5.78 5.44 (14.61) (19.18)
Ordinary dividends/share declared cents 3 3.5 3.5 0.0 0.0
depreciation (7) $’000 3,583 3,541 3,713 3,116 9,271
amortisation – leased assets (7) $’000 662 562 586 212 199
amortisation – intangibles $’000 775 500 499 2,205 1,414
Capex additions $’000 9,530 8,354 14,486 7,383 3,095
Operating cash flow $’000 21,196 4,445 19,767 (6,098) 31,387
NTa $’000 86,278 91,210 98,801 77,544 56,516
Net assets $’000 123,337 128,727 135,819 112,505 78,081
interest bearing liabilities $’000 43,152 47,697 50,661 43,925 37,647
Finance costs (7) $’000 2,359 2,316 2,474 2,643 4,550
Total bank debt $’000 41,465 46,214 49,500 43,500 37,500
Net debt/equity % 26% 32% 30% 28% 16%
interest cover (excluding significant items) (7) times 5.75 7.27 8.62 5.36 3.20
(*) F2019 results have been re‑stated with the inclusion of impairment of Goodwill for $9.34m. Refer to Note 27 Restatement for further detail on the FY19 restated results.
(1) eBiT, eBiTda, NPBT and NPaT excluding significant items are non‑aaSB financial measures, which have not been subject to review or audit by the Group’s external auditors. These measures are presented to enable understanding of the underlying performance of the Group by users.
(2) also referred to as underlying net profit after tax attributable to MaxiTRaNS equity holders.
(3) includes both earnings from continued and discontinued operations.
(4) F2016 significant items relate to the impairment loss on Lusty eMS and Hamelex White intangible assets of $4.398m pre‑tax and the closure cost of the Bundaberg facility of $0.626m pre‑tax (disclosed above net of tax).
(5) F2019 significant items relate to impairment loss on TRaNSform eRP system of $18.82m, impairment of Goodwill $9.34m, MTC loss on sale of business $1.56m, eRP system implementation expenses $1.30m pre‑tax, acquisition and disposal costs $0.53m and restructuring (redundancy) costs $0.30m.
(6) F2020 significant items relate to impairment of Trailers CGu Other non‑financial assets $39.55m, impairment of Goodwill $4.92m, $2.68m acquisition, disposal, Transaction and Litigation costs and $1.24m of redundancies.
(7) F2020 eBiTda, eBiT, depreciation, amortisation – lease assets, Finance costs and interest cover includes the impact ($9.38m) of the change in standard for aaSB16 Leases. The impact of ($9.38m) is split into Lease depreciation of ($6.91m) and Lease interest ($2.47m).

MaxiTRaNS iNduSTRieS16
Report of the DirectorsFor the year ended 30 June 2020
Your directors submit their report together with the consolidated financial report of MaxiTRaNS industries Limited aCN 006 797 173 (“the Company”) and its subsidiaries (together referred to as the “Group”), and the Group’s interest in associates for the year ended 30 June 2020 and the auditor’s report thereon.
DirectorsThe names of directors in office at any time during or since the end of the financial year are:
Mr Robert H. Wylie (director since September 2008 – Chairman since 30 June 2016)
Mr James R. Curtis (director since 1987 – deputy Chairman since October 1994)
Mr Joseph Rizzo (director since June 2014)
Ms Samantha Hogg (director since april 2016)
Mr Dean Jenkins (Managing director since 1 March 2017)
Ms Mary Verschuer (director since January 2019)
Principal ActivitiesThe principal activities of the Group during the year consisted of the design, manufacture, sale, service and repair of transport equipment and related components and spare parts. There were no changes in the nature of the Group’s principal activities during the financial year.
DividendsNil dividends were declared at half year and full year.
State of AffairsThere were no significant changes in the state of affairs of the Group which occurred during the financial year.
Events Subsequent to Balance DateThere were no material events subsequent to balance date impacting on the financial statements.
Environmental RegulationThe Group’s environmental obligations are regulated under Local, State and Federal Law. all environmental performance obligations are internally monitored and subjected to regular government agency audit and site inspections. The Group has a policy of complying with its environmental performance obligations. No breach of any environmental regulation or law has been notified to the Group during or since the year ended 30 June 2020.
Operating & Financial Review
REVIEW OF OPERATIONS
The Group operates two types of businesses: the Trailer Solutions business comprising the design, manufacture, sale and servicing of trailers in australia and New Zealand; and the Parts business, MaxiPaRTS, a trailer and truck parts business in australia.
The Group continued its focus on cash generation and debt reduction throughout FY20 with operating cash inflows of $31.4 million. When adjusted for the change in aaSB16 Leases, this would be $22.7 million (FY19: $6.1 million outflow), allowing the Group to repay a further $6.0 million in debt and reduce its Net debt to $12.1 million (FY19: $32.0 million) at 30 June 2020. Since February 2020, the Group, along with the rest of the australian and New Zealand economies, has been affected by COVid‑19. Government assistance in the period totalled $5.2m, with $4.9 million in JobKeeper support from the australian government and $0.3 million in Wage Subsidy from the New Zealand government. The instant asset write off program also assisted Trailer Sales volumes in May and June.
Parts Business – MaxiPARTS
The Parts business sells commercial vehicle parts at both a wholesale and trade level in australia.
The trade business sells parts to road transport operators as well as commercial vehicle service and repair providers in australia under the MaxiPaRTS brand.
The wholesale business operates in Victoria, Queensland, New South Wales and Western australia. Wholesale customers are typically part resellers and trailer manufacturers. at the end of FY20, MaxiPaRTS operated 20 wholesale sites and retail stores.
The MaxiPaRTS business experienced a 1.5% growth in external revenue and maintained a consistent year on year profit despite the effect of COVid‑19 in the second half. This revenue growth reflects the continued success of the specific organic growth projects implemented over the past few years around both customers and products leading to MaxiPaRTS becoming a more diverse business and better able to produce consistent results through various market cycles.
MaxiPaRTS continues to operate as a key supplier to our manufacturing and service facilities, thus ensuring parts and component procurement is leveraging the Group’s full scale, procurement and logistics capability.
ANNUAL REPORT 2020 17
Report of the Directors (Cont.)For the year ended 30 June 2020
Trailer Solutions Business
The Trailer Solutions business has a diverse portfolio of trailers with market leading brands and a reputation for high quality with customers. Sales of products through our dealer network, comprising both owned dealerships and licensed dealerships provides a full solution including after sales service and parts to customers.
Australia
Trailer Solutions revenue in the year declined 15.4% over the PCP driven by a continued decline in the external trailer market. Leading to Revenue in the first half of FY20 declining 19.9% over the prior corresponding period (“PCP”). Order intake from our customers for both new and used trailers significantly improved on the introduction of the australian Federal government incentive to increase the instant asset write off threshold from $30,000 to $150,000 on the 12 March 2020, enabling the australian Trailers division to increase revenues in the May and June period.
Trailer solutions continues to focus on operating efficiencies with efficiency and manufacturing quality measures well ahead of FY19 and cost reductions remaining on track. Overhead cost reduction targets remain on track. despite these measures delivering a $10.1m benefit, these weren’t significant enough to offset the decline in volume, mix and manufacturing overhead recoveries of $17.1m.
New Zealand
Revenue from our New Zealand business was in line with the prior year. Margins were lower in the second half due to the impact of COVid‑19 affecting the Company’s supply chain out of China and staff availability.
FINANCIAL REVIEW
Sales
Total revenue decreased by 9.9% for the year to $317.6 million.
The Parts business recorded a 1.5% external revenue increase to finish FY20 with revenue of $114.4 million and the Trailer business decreased external revenue by 15% to finish FY20 at $203.2 million.
Profit
underlying eBiTda was $14.7 million. From 1 July 2019, the new accounting standard aaSB16 Leases came into effect, moving $9.4 million of rent costs to interest and amortisation. adjusting for the effect of aaSB16 Leases, underlying eBiTda would have been $5.3 million (FY19: $14.2 million).
With the decline in revenue for the year and the non‑cash impairment of the assets of $44.5 million pre‑tax (refer below), net loss after tax attributable to MaxiTRaNS equity holders was $35.5 million in FY20.
The Group reported impairment of $44.5m during the year: impairment of Goodwill $4.9m; and impairment of Other non‑financial assets for the Trailers division of $39.6m. The impairment was a result of the current and forecast end customer market conditions for the Trailers division.
Legal proceedings in relation to the Transform eRP commenced in late FY19 and the Group has incurred $2.0 million on the litigation to 30 June 2020.
Cash Generation & Capital Management
Operating cash flow was positive $31.4 million in FY20. When adjusted for the change in aaSB16 Leases, this would be $22.7 million which represents an increase of $28.8 million from the cash generated in FY19 (FY19: Cash outflow $6.1 million).
The Group’s focus on cash generation has delivered significant improvements to working capital during FY20 resulting from reductions in inventory ($0.9 million), debtors ($15.8 million) and increased deferred revenue (i.e. customer deposits received in advance) ($1.4 million) with an offset through a decrease in creditors ($3.5 million). added to this was an income tax inflow of $3.8 million.
during FY20, the Group completed a sale and leaseback of the rental trailer fleet of $4.9 million enabling the rental fleet to grow by approximately 50 trailers during the year. Capital expenditure continued to be a key focus with a 60% reduction year on year.
Net debt at 30 June 2020 was reduced to $12.1m from $32.0m at 30 June 2019. This resulted in the Net debt to equity ratio at 30 June 2020 being reduced to 16%, down from 28% in FY19.
External Financing Facilities
during FY20, the Group reduced the available facility to $43.75m. This facility is sufficient to support the business in its current form. The facility is currently drawn to $37.5 million with a Net debt at 30 June 2020 of $12.1 million.

MaxiTRaNS iNduSTRieS18
Report of the Directors (Cont.)For the year ended 30 June 2020
RISKMaxiTRaNS recognises that risk is inherent in its business and that effective risk management is essential to protecting the business value and delivering the ongoing performance of the business.
The MaxiTRaNS audit & Risk Management Committee, a sub‑committee of the Board, governs the framework and process for the identification and mitigation of material business risks.
Operational Risks
during FY20, the Group continued to deliver its risk management maturity roadmap to address the latest requirements of global risk management standard iSO31000:2009.
The Group identifies risk based on likelihood and materiality. By understanding and mitigating key risks, we can:
• increase the likelihood of achieving our strategic goals and objectives;
• improve our decision making and capital allocation; and
• enhance corporate governance and regulatory compliance.
The key operational risks identified are as follows:
• COVid‑19 effect on the Group’s operations, customers, suppliers, and the global economy;
• Health and Safety of our people;
• Manufacturing process efficiency, iT systems, quality and delivery schedule;
• Trailer sales pipeline management, pricing and retention of key customers;
• MaxiPaRTS key customer retention and competitiveness; and
• Finance and governance; management of working capital; an appropriate funding model; internal policies and procedures; changing regulatory environment and maintenance of proper licences to operate the business.
Management report to the audit & Risk Management Committee on the ongoing status of activities in place to mitigate each of these risks.
Foreign Exchange & Commodities Risk
The Group has exposure to movements in the australian dollar against the united States dollar, the euro and the Chinese Yuan.
The Trailer Solutions business has exposures to these currencies arising from the purchase of raw materials and components consumed in the manufacture of trailers. The Trailer business also has significant exposure to commodity price fluctuations for steel and aluminium used in the manufacturing process. Similarly, the Parts business also has exposure to these currencies as a result of importing parts for sale.
The Group has a policy of only hedging foreign currency cash flow risk utilising forward contracts to protect against movements in short term committed expenditure.
The Group does not hedge against currency risk arising from the translation of foreign operations.
depreciation of the australian dollar may:
• adversely affect the operating cost base and therefore margins. The Group currently hedges short term committed foreign currency purchases. Some or all of this risk may be further mitigated by price management and efficiency improvement, however;
• also benefit the Group insofar as it also acts as a potential barrier to entry for imports that may be uncompetitive in price against locally produced products.
Conversely, an appreciating australian dollar against major currencies increases the risk of import competition. The specialised and customised nature of the trailer industry, together with demand for short delivery times, reduces this risk.
HEALTH & SAFETYMaxiTRaNS has continued to see outstanding results within Health Safety environment (“HSe”) and wellbeing, with an all‑time low total injury frequency rate of 14. This is a massive 35% decrease compared to last year and continues the trend of reductions in injuries since FY15. it is a commendable achievement and is helping achieve our core value of ‘Send all our people home safely’.
The Board continues to see the safety of our people as a priority and currently monitors, and will continue to monitor, the Group’s health and safety performance on a monthly basis.

ANNUAL REPORT 2020 19
Report of the Directors (Cont.)For the year ended 30 June 2020
STRATEGYGiven the uncertain times in which MaxiTRaNS is operating, the Board has decided to reduce strategic activity in scale, scope and to focus on nearer term benefit.
Whilst maintaining consistent pathways of strategy the scope has been refined to ensure they underpin continued focus on balance sheet prudence:
• Operational excellence that will ensure the Group’s systems and processes deliver high quality, cost effective products and services. With a focus on margin over chasing market share;
• Leveraging its market leading position to optimise organic growth opportunities in the MaxiPaRTS markets;
• Continue investing in inclusion and diversity programs, supported by continuation of our front line and senior leaders development program; and
• actively review the most efficient use of the groups assets to deliver the best return on our shareholders investment.
• underlying this will be a continued focus on improving our safety performance to not only ensure we send our people home safely but that MaxiTRaNS’ products are designed to also send our customer’s people home safely.
OUTLOOKit is expected market conditions in the australian trailer market will continue to be slow as the impact of COVid‑19 is compounding the already low levels of consumer confidence and other macro‑economic drivers remain soft while operators continue to age their fleets. This has the potential to affect performance in both the MaxiPaRTS business as well as the australian Trailer business.
MaxiPaRTS has shown strong resilience through the COVid‑19 period to date and whilst growth may be slower, the underlying business is expected to remain strong.
The australian Trailer business has been supported in offsetting this risk through the australian Federal government incentive to increase the instant asset write off threshold from $30,000 to $150,000 (through to 31 december 2020) combined with the 15 month investment incentive (through to 30 June 2021) and is expected to continue to benefit the Trailer Solutions business during this period. Rains in South eastern australia should also support a higher production rate of Bulk Tipper trailers during the grain season in H1 FY21.
in the short term, order intake is improving, in food and grocery, general freight and tipper sectors, benefiting the Group’s Maxi‑CuBe, Freighter, Hamelex White and Lusty products. These product lines are directly affected by the broader economic conditions, the crop outlook and the timing of commencement of new housing and infrastructure projects.
MaxiTRaNS iNduSTRieS20
Report of the Directors (Cont.)For the year ended 30 June 2020
Information of Directors
Mr. Robert H. Wylie Chairman, independent Non‑executive, (appointed 30 June 2016), age 70 director (appointed 2 September 2008)
Qualifications & experience: Fellow of the institute of Chartered accountants in australia, a member of the institute of Chartered accountants of Scotland and a Fellow of the australian institute of Company directors. appointed director in September 2008.
Currently a director of The Walter + eliza Hall institute of Medical Research, Mr. Wylie has wide ranging experience in professional service in a variety of management roles with deloitte. He has previously held senior positions with deloitte Touche uSa LLP. Prior to this, he was deputy Managing Partner asia Pacific. This followed a long career with deloitte australia, including eight years as National Chairman. Mr. Wylie also served on the Global Board of directors and the Governance Committee of deloitte Touche Tohmatsu and the Global Board of directors of deloitte Consulting. Mr Wylie is also a former National President of the institute of Chartered accountants in australia. Formerly a director of elders Limited from November 2009 to august 2012 and director of both Centro Properties Limited and CPT Manager Limited from October 2008 to december 2011.
Special Responsibilities: Chairman of the Nomination Committee. Member of the audit & Risk Management Committee and Remuneration & Human Resources Committee.
interest in Shares: 250,491 ordinary shares beneficially held.
Options over Ordinary Shares: Nil
Mr. Dean S Jenkins Managing director, executive, age 48
Qualifications & experience: Managing director since 1 March 2017.
Bachelor of engineering (aero) Honours and a Graduate of the australian institute of Company directors.
Most recently Chief Operating Officer & executive director of the Weir Group PLC, one of the world’s leading engineering businesses. Prior to the Weir Group, Mr Jenkins was CeO of uGL Rail from 2008 to 2010, australia’s largest supplier and maintainer of rolling stock. He also spent 11 years in senior leadership roles with QaNTaS, culminating in the role of Group General Manager – engineering, Material and Logistics.
interest in Shares: 457,000 ordinary shares beneficially held.
Options over Ordinary Shares: Nil
Mr James R. Curtis deputy Chairman, Non‑executive, age 85
Qualifications & experience: appointed deputy Chairman in 1994.
Mr. Curtis was one of the founders of the Group in 1972. He has over 50 years’ experience in the transport equipment industry and is a pioneer of fibreglass road transport equipment in australia.
Special Responsibilities: Member of audit & Risk Management Committee, Remuneration & Human Resources Committee and Nomination Committee.
interest in Shares: 25,930,222 ordinary shares beneficially held.
Options over Ordinary Shares: Nil

ANNUAL REPORT 2020 21
Report of the Directors (Cont.)For the year ended 30 June 2020
Mr. Joseph Rizzo independent Non‑executive director, age 64
Qualifications & experience: Bachelor of economics (Monash university), executive Program (university of Michigan), Graduate of the australian institute of Company directors (GaiCd). appointed Non‑executive director June 2014.
Formerly Managing director of PaCCaR australia Pty Ltd with 35 years’ experience in the road transport equipment manufacturing industry. Mr. Rizzo has a wide knowledge of the industry generally along with strong manufacturing, sales and marketing experience in a directly related field. Former Vice President of the Truck industry Council, and was formerly a non‑executive director of aMe Systems (ViC) Pty Ltd.
Special Responsibilities: Chairman of the Remuneration & Human Resources Committee and Member of the audit & Risk Management Committee and Nomination Committee.
interest in Shares: 180,711 ordinary shares beneficially held.
Options over Ordinary Shares: Nil
Ms. Samantha Hogg independent Non‑executive director, age 53
Qualifications & experience: Bachelor of Commerce (Melbourne university) and a Graduate of the australian institute of Company directors. appointed non‑executive director april 2016.
Currently a director of Hydro Tasmania, infrastructure australia and Cleanaway Waste Management Limited. Ms Hogg is also a Commissioner at NCCC (The National COVid‑19 Commission advisory Board) and a member of the Premier’s economic and Social Recovery Council for Tasmania. Ms Hogg has previously held senior executive finance roles at the Transurban Group, Vale inco and WMC Resources.
Special Responsibilities: Chairperson of the audit and Risk Management Committee and Member of the Remuneration & Human Resources Committee and Nomination Committee.
interest in Shares: Nil ordinary shares beneficially held.
Options over Ordinary Shares: Nil
Ms. Mary Verschuer independent Non‑executive director, age 59
Qualifications & experience: Master of Business administration (Macquarie university), Bachelor of applied Science (Chemistry) (uTS) and a Fellow of the australian institute of Company directors. appointed non‑executive director January 2019.
Currently the President of The infants’ Home, a provider of integrated early childhood education, family day care, early intervention and health services, and a Member of the advisory Board of TaFe NSW (Sydney Region). Ms Verschuer was previously a non‑executive director of THC Global Group Limited and Nuplex industries Limited (now part of the allnex group), Ms Verschuer has over 25 years of global senior management experience across a range of industries, including leading the Minerals and Metals business for Schenck Process and the asian business for Finnish listed packaging business Huhtamaki. in those roles, Ms Verschuer had responsibility for manufacturing, supply chain and sales operations in diverse geographies and cultures.
Special Responsibilities: Member of the audit and Risk Management Committee, Remuneration & Human Resources Committee and Nomination Committee.
interest in Shares: 63,000 ordinary shares beneficially held.
Options over Ordinary Shares: Nil
MaxiTRaNS iNduSTRieS22
Report of the Directors (Cont.)For the year ended 30 June 2020
Company Secretary
Ms. Amanda Jones LLB.(Hons), B.a, FGia, GaiCd
appointed to the position of Company Secretary on 21 June 2019.
details of attendances by directors at Board and committee meetings during the year are as follows:
Directors’ Meetings
Audit & Risk Management Committee
Remuneration & Human Resources Committee
Nomination Committee
Number eligible to
attendNumber
attended
Number eligible to
attendNumber
attended
Number eligible to
attendNumber
attended
Number eligible to
attendNumber
attended
Robert Wylie 17 17 6 6 4 4 – –
James Curtis 17 17 6 6 4 4 – –
Joseph Rizzo 17 17 6 6 4 4 – –
Samantha Hogg 17 17 6 6 4 4 – –
Mary Verschuer 17 17 6 6 4 4 – –
dean Jenkins 17 17 6 6 4 4 – –

ANNUAL REPORT 2020 23
Report of the Directors (Cont.)For the year ended 30 June 2020
Remuneration Report
Dear Shareholders,
On behalf of the Board, i am pleased to present the FY20 Remuneration Report. This report sets out the remuneration information for our Non‑executive directors and Key Management Personnel (“KMP”) and describes our approach to remuneration. Our remuneration approach has been set to align with our broader business strategy to grow the business and deliver shareholder value. Through short and long‑term variable reward programmes, it aims to reward executives for delivering target financial outcomes and improved shareholder value.
We have made a number of changes to our remuneration structure during FY19 and FY20. to better align the remuneration of our executives with the interests of our shareholders. The main changes included:
• linking the short term incentive to four Company Priorities (annual Financial results, People, Safety, Strategy) with individual weightings varying year on year depending on the needs of the Company;
• requiring an employee to remain employed by the Group on the date of payment of the short term incentive in order to receive that payment; and
• a profit gate to the short term incentive program whereby executives will only ordinarily be eligible for a payment if the Group achieves 100% of the target net profit after tax (NPaT), subject to board discretion for exceptional circumstance.
i would like to acknowledge the stakeholders who have shared their feedback with us over the past year. We are committed to ensuring the needs of our shareholders are front and centre in the development of our remuneration approach.
Joseph RizzoChair, Remuneration & Human Resources Committee
1. Approach to remunerationMaxiTRaNS’ remuneration approach is set in line with the business and talent strategy in order to ensure MaxiTRaNS attracts and retains the right talent to drive the business forward. The executive package is based on 3 remuneration components, that make up the Total Remuneration Package (details of each component are explained in the table below). Our approach is reviewed every year to ensure that it is still relevant and competitive.
Remuneration Component Description Objectives Priorities & Conditions
Fixed includes fixed pay and superannuation
intended to be market competitive to attract and retain talented executives
Based on skills and experience. Recognises level of the executive’s contribution based on the size of the organisation
Short Term incentive (STi)
a variable, at‑risk cash incentive calculated by reference to current year performance
designed to drive performance across Company priorities year on year
4 Key Priorities with annual Financial Results being the highest priority and Strategy, People, and Safety carrying different weightings depending on the nature of the role. This program is subject to the Group meeting its budgeted net profit before tax (“NPaT”) before any incentive is payable
Long Term incentive (LTi)
an annual grant of Performance Rights which, if they vest on the achievement of specific long‑term performance hurdles, give the right to be issued a number of ordinary shares in the Company
designed to incentivise executives to manage the business in a way that drives sustainable long‑term growth in shareholder value
a % Return On invested Capital (“ROiC”) increase over the 3 year period from date of grant

MaxiTRaNS iNduSTRieS24
Report of the Directors (Cont.)For the year ended 30 June 2020
2. Alignment of FY20 variable remuneration outcomes to performance
Rem Component & Conditions Link to Company Performance
STi – drives annual Company performance against 4 priorities – Strategy deployment, People, Safety and annual Financial Results
The net profit after tax hurdle was not achieved, so no other performance targets were considered
LTi – a yearly % ROiC increase drives executives to manage the business in a way that creates long term shareholder value
The performance rights issued in 2017 were due to vest this year. The target ROiC for those performance rights was 7.95%. The actual ROiC was 1.67%. Therefore, those performance rights did not vest
3. Long Term Incentive Program (LTI Program)
(a) Who participates?
at the discretion of the Board, senior managers and executive directors of the Company are invited to participate in the LTi Program.
(b) What type of awards are granted?
Performance rights are granted to participants. each performance right will, on its exercise, entitle the holder to receive one fully paid ordinary share in the Company, which will rank equally with all other existing fully paid ordinary shares. The exercise of a performance right is subject to certain performance hurdles being met.
(c) How is the size of the award calculated?
an award of performance rights is calculated by reference to a participant’s remuneration package. in FY20 the Managing director received performance rights equal to 25% of his total remuneration package. For other participating executives, the value of their performance rights was 20% of their total remuneration package.
(d) How is the number of rights to be awarded calculated?
The number of performance rights a participant receives is calculated on a “face value” basis by dividing the participant’s performance right entitlement by the Company’s share price. The share price is determined using the volume weighted average price (VWaP) over the first month of the financial year in which the rights are granted (ie, for rights granted in 2020 with a FY20 base, the July 2020 VWaP is used). This is on the basis that the start of the financial year is the starting point for measuring the achievement of the ROiC target.
(e) What is the performance period?
Performance rights are tested over a three year period. awards made in FY20 will be tested over the period 1 July 2019 to 30 June 2022.
(f) What is the performance hurdle?
The performance rights will vest and be exercisable only if the performance hurdle attached to the performance rights is satisfied.
The performance hurdle for all performance rights on issue is return on invested capital (“ROiC”). ROiC is calculated by taking a company’s net operating profit less adjusted taxes (“NOPLaT”) and dividing it by the invested capital. ROiC is seen as the most appropriate measurement of management’s performance to focus the right attention on the efficient use of capital within the business.
The performance hurdle for all performance rights currently on issue is to achieve the target average ROiC over a period of 3 years. a sliding scale will apply for partial attainment of the performance hurdle. The minimum target is 67% of the targeted improvement in ROiC, which must be achieved before any of the performance rights vest, at which point 50% of the performance rights will vest. 100% of the performance rights will vest if the target ROiC is fully achieved or exceeded.

ANNUAL REPORT 2020 25
Report of the Directors (Cont.)For the year ended 30 June 2020
any unvested performance rights will lapse. For the Performance Rights proposed to be granted in FY21, the performance hurdle is consistent with the previous year’s grant and requires a ROiC of 6.95% as at 30 June 2023. The ROiC targets for LTis that have been granted but have not yet vested are:
Vesting date (if target met) ROIC target % increase in Base ROIC required
30 June 2021 8.32% 43.9%
30 June 2022 6.95% 62.0%
30 June 2023 6.95% 316.3%
(g) Other key features
The Board has discretion to determine award outcomes for participants in certain circumstances, such as when an executive retires.
as at the date of the report there are 5,448,821 performance rights on issue under the Performance Rights Plan. These include 3,033,099 performance rights granted to eligible executives in the FY20 and which remain on issue.
4. FY20 LTI OutcomesPerformance rights granted in 2017 were tested against the ROiC performance hurdle over the period 1 July 2017 to 30 June 2020 with a ROiC target in FY20 of 7.95%. The ROiC for FY20 was 1.67%. Therefore, the Performance Rights granted in 2017 will not vest.
5. Managing Director Remuneration mixThe Managing director’s total available remuneration (“TaR”) consists of:
• Fixed component of $800,000 inclusive of superannuation and allowances, comprising 60% of TaR;
• STi component, comprising 15% of TaR; and
• LTi component, comprising 25% of TaR.
6. FY20 Managing Director STI OutcomesThe Managing director’s STi for FY2020 are summarised below:
Objective Measure STI Weighting Performance
Overall hurdle: deliver budgeted NPaT for the Group
Hurdle Not met
Strategy: deliver FY20 Strategic Milestones to at least 75% of plan
deliver the Group Strategic Plan
15% implementation of the Strategic Plan was delayed due to COVid‑19 but was on track
People: enable and empower people to achieve results resulting in an overall increase in engagement to 60%
engagement Score of 60%
15% Not Met
Annual Results: deliver the operating metrics as per the FY20 annual Operating Plan
NPaT
Cashflow
55% Not Met
Met
Safety: develop and deliver the Business HSeQ improvement plan
25% reduction in TRiFR
15% Met
FY20 STI Outcome
No STi was awarded to any KMP in relation to their performance during the FY20 period, because the NPaT hurdle was not achieved.

MaxiTRaNS iNduSTRieS26
Report of the Directors (Cont.)For the year ended 30 June 2020
7. Response to high no vote on Remuneration Report in 2019at the 2019 aGM, 23.89% of shareholders, either in person or by proxy, voted against the Company’s Remuneration Report. While the Company avoided a ‘first strike’, the size of the no vote was the cause of great concern to the Board. Following the aGM the Board engaged with shareholders to understand the reasons for the high no vote. The main feedback provided by shareholders was that more information should be disclosed about the Company’s Long Term incentive Program and the performance hurdles required to be met in order for performance rights to vest. Section 3 above sets out in detail how the Company’s LTi Program operates, including the ROiC performance hurdle.
8. Relationship between remuneration and Company performanceThe following table sets out Company performance and the average STi payments (as a % of the maximum payment) made to KMP over the last 4 years.
FY20 FY19 FY18 FY17
Reported NPaT ($’000) ($35,491) ($27,040) $10,077 $10,695
NPaT (excluding significant items ($’000)) $486 $4,809 $10,077 $10,695
STi awarded to KMP (other than Md) Nil 20.7% 18.8% 49.7%
STi awarded to current Md Nil Nil Nil Nil
9. Non‑executive directorsTotal remuneration for all Non‑executive directors, last voted upon by shareholders at the 2012 aGM, is not to exceed $600,000 per annum and directors’ fees are set based on advice from external advisors with reference to fees paid to Non‑executive directors of comparable companies.
directors’ base fees (inclusive of superannuation) for the year were unchanged from the previous financial year at $75,000 per annum for Non‑executive directors (other than the Chairman) and $140,000 for the Chairman.
Given the effect of COVid‑19 on the underlying MaxiTRaNS business, the Board and Management focused on optimising cash generation and conservation over the closing months of FY20. as the Board announced on 3 april 2020, the Board determined that for a 4 month period commencing on 1 april 2020, the Non‑executive directors would take a 20% reduction in directors’ fees. This resulted in total fees paid for the year of $65,069 for Non‑executive directors and $121,461 for the Chairman.
Non‑executive directors do not receive performance related remuneration and are not entitled to participate in the STi or LTi programs. directors’ fees cover all main board activities and membership or chairing of all committees. Non‑executive directors are not entitled to any retirement benefits.
10. Details of remuneration and service contractsit is the Group’s policy that employment agreements for executive directors and senior executives be unlimited in term but capable of termination on up to six months’ notice, and that the Group retains the right to terminate the contract immediately, by making payment of up to six months’ pay in lieu of notice.
The Group has entered into employment agreements with each executive director and senior executive that entitle those executives to receive, on termination of employment, their statutory entitlements of accrued annual and long service leave, together with any superannuation benefits.
The employment contract outlines the components of remuneration paid to the executive director and senior executives but does not prescribe how remuneration levels are modified year to year. Remuneration levels are reviewed each year and take into account cost‑of‑living changes, any change in the scope of the role performed by the senior executive and any changes required to meet the principles of the Group’s executive Remuneration Policy including performance related objectives if applicable.

ANNUAL REPORT 2020 27
Report of the Directors (Cont.)For the year ended 30 June 2020
Mr dean Jenkins, Managing director, has a contract of employment with the Company dated 1 March 2017. The contract specifies the duties and obligations to be fulfilled by the Managing director and provides that the Board and Managing director will, early in each financial year, consult and agree objectives for achievement during that year. The employment agreement can be terminated either by the Company or Mr Jenkins providing six months’ notice. The Company may make a payment in lieu of notice of six months, equal to base salary, motor vehicle allowance and superannuation. This payment represents general market practice. The Managing director has no entitlement to a termination payment, other than those minimal entitlements required by law (including any leave entitlements and superannuation) in the event of removal for misconduct or breach of any material terms of his contract of employment.
Mr Tim Bradfield, Chief Financial Officer, has a contract of employment with the Company dated 6 March 2019. The contract can be terminated either by the Company or Mr Bradfield providing six months’ notice. The Company may make a payment in lieu of notice of six months, equal to base salary and superannuation.
Given the effect of COVid‑19 on the underlying MaxiTRaNS business, the Board and Management focused on optimising cash generation and conservation over the closing months of FY20. as the Board announced on 3 april 2020, the Board determined that for a 4 month period commencing on 1 april 2020, the following changes took place for all Key Management Personnel:
1. 25% reduction in Managing director’s cash payments made up of 20% deferral and 5% salary reduction; and
2. 20% salary deferral for other key management personnel.
11. Amounts of remunerationdetails of the nature and amount of each major element of remuneration for each director of the Company and other Key Management Personnel of the Group:
Primary Post Equity Other Total Proportion of rem
performance related
%
Value of PRs as
proportion of rem
%Year
Salary & fees
$STI (i)
$
Non‑cash benefits
$Super
$PRs (ii)
$ $ $
Directors
Non‑executive
Mr R Wylie 2020 121,461 – – 11,539 – – 133,000 0.0% 0.0%
Chairman 2019 127,854 – – 12,146 – – 140,000 0.0% 0.0%
Mr J Curtis 2020 65,069 6,182 71,250 0.0% 0.0%
2019 68,493 – – 6,507 – – 75,000 0.0% 0.0%
Mr J Rizzo 2020 65,069 6,182 71,250 0.0% 0.0%
2019 68,493 – – 6,507 – – 75,000 0.0% 0.0%
Ms S Hogg 2020 65,069 6,182 71,250 0.0% 0.0%
2019 68,493 – – 6,507 – – 75,000 0.0% 0.0%
Ms M Verschuer 2020 65,069 6,182 71,250 0.0% 0.0%
(iii) 2019 30,119 – – 2,861 – – 32,981 0.0% 0.0%
Executive
Mr D Jenkins 2020 647,431 – 409 65,306 66,187 40,000 819,333 8.1% 8.1%
Managing director 2019 690,594 – 678 69,406 (3,862) 40,000 796,816 –0.5% –0.5%

MaxiTRaNS iNduSTRieS28
Report of the Directors (Cont.)For the year ended 30 June 2020
Primary Post Equity Other Total Proportion of rem
performance related
%
Value of PRs as
proportion of rem
%Year
Salary & fees
$STI (i)
$
Non‑cash benefits
$Super
$PRs (ii)
$ $ $
EXECUTIVES
Mr T Bradfield 2020 332,500 – – 31,587 9,198 – 373,285 2.5% 2.5%
Chief Financial Officer (iv) 2019 113,974 – – 10,828 – – 124,802 0.0% 0.0%
Mr P Loimaranta 2020 308,243 21,970 758 33,774 23,692 25,305 413,743 11.0% 5.7%
General Manager – MaxiPaRTS and New Zealand 2019 288,554 20,414 203 31,756 (38,755) 25,305 327,477 –5.6% –11.8%
Mr T Negus 2020 353,972 18,630 – 35,397 27,009 – 435,009 10.5% 6.2%
General Manager – Manufacturing 2019 372,603 73,059 – 42,338 13,302 – 501,302 17.2% 2.7%
Mr C Richards 2020 – – – – – – – 0.0% 0.0%
Former CFO and Company Secretary (v) 2019 165,333 33,987 – 27,169 (38,449) 148,366 336,405 –1.3% –11.4%
Ms J De Martino 2020 – – – – – – – 0.0% 0.0%
Former Chief Financial Officer (vi) 2019 138,930 – 1,468 13,198 – 2,074 155,670 0.0% 0.0%
Mr A McKenzie (vii) 2020 144,218 20,648 – 32,140 – 288,840 485,847 4.2% 0.0%
Group General Manager – Sales and Marketing 2019 304,027 37,291 – 34,515 (40,023) 22,000 357,811 –0.8% –11.2%
Mr J O’Brien (viii) 2020 21,715 13,041 – 5,521 – 32,167 72,444 18.0% 0.0%
General Manager – MaxiParts 2019 238,557 46,880 – 32,880 (6,660) 60,667 372,323 10.8% –1.8%
(i) STi entitlement is 15% of total remuneration for each of the individuals listed above. The short‑term cash incentives disclosed above are for performance for the 30 June 2019 financial year using the criteria set out in the Remuneration Report. The amounts were determined after performance reviews were completed.
(ii) Performance rights (PRs) grants are calculated by using a face value allocation methodology, i.e. by reference to the volume weighted average MaxiTRaNS share price (“VWaP”) and allocated to each reporting period evenly over the period from grant date to vesting date, adjusted for any changes in the probability of performance and service targets being achieved. The value disclosed is the portion of the fair value recognised in this reporting period. Further details in respect of PRs are contained in section 3 of the Remuneration Report. details of PRs vested during the period are contained in Note 15 – Share Based Payments.
(iii) Ms M Verschuer was appointed on the 24 January 2019.
(iv) Mr T Bradfield was appointed on the 6 March 2019.
(v) Mr C Richards resigned effective 21 december 2018. all PRs held by Mr Richards at that time were cancelled.
(vi) Ms J de Martino was appointed on the 8 October 2019 and resigned effective 15 March 2019. all PRs held by Ms de Martino at that time were cancelled.
(vii) Mr a McKenzie’s position was made redundant effective 20 december 2019. all PR’s held by Mr McKenzie at that time were cancelled.
(viii) Mr J O’Brien resigned effective 2 august 2019 (resignation accepted prior to 30 June 2019). all PR’s held by Mr O’Brien at 30 June 2019 were cancelled by 30 June 2019.
ANNUAL REPORT 2020 29
Report of the Directors (Cont.)For the year ended 30 June 2020
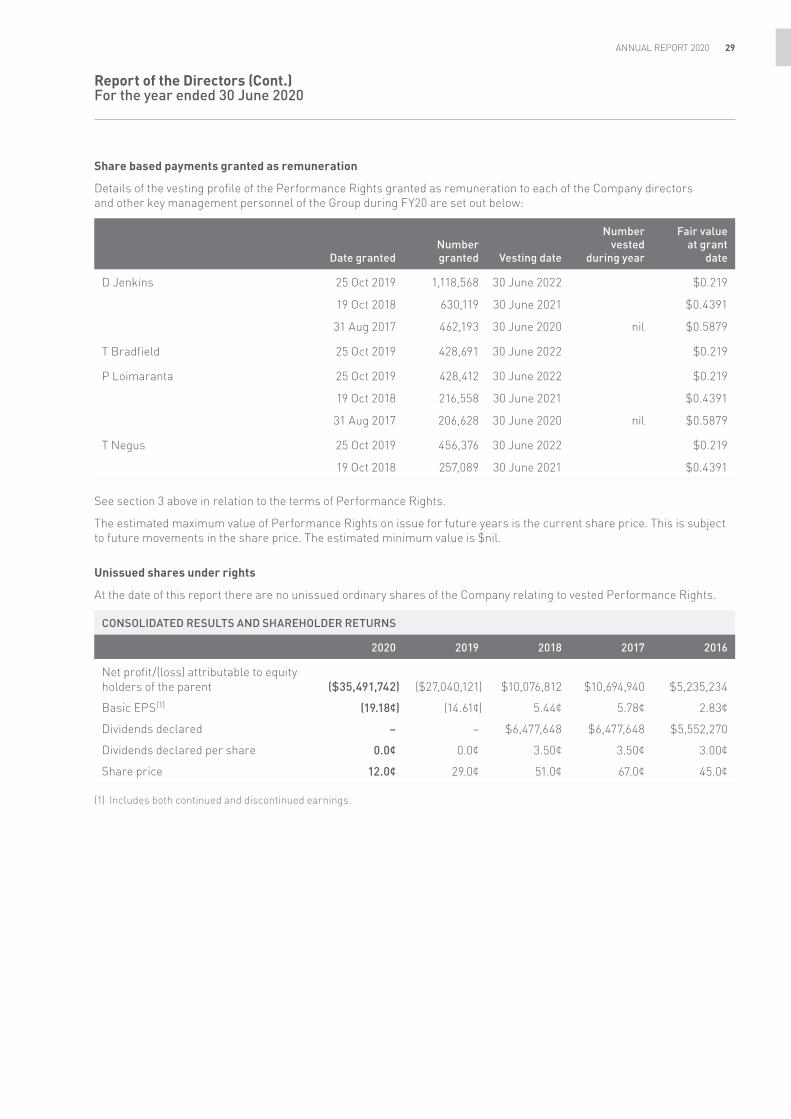
Share based payments granted as remuneration
details of the vesting profile of the Performance Rights granted as remuneration to each of the Company directors and other key management personnel of the Group during FY20 are set out below:
Date grantedNumber granted Vesting date
Number vested
during year
Fair value at grant
date
d Jenkins 25 Oct 2019
19 Oct 2018
31 aug 2017
1,118,568
630,119
462,193
30 June 2022
30 June 2021
30 June 2020 nil
$0.219
$0.4391
$0.5879
T Bradfield 25 Oct 2019 428,691 30 June 2022 $0.219
P Loimaranta 25 Oct 2019
19 Oct 2018
31 aug 2017
428,412
216,558
206,628
30 June 2022
30 June 2021
30 June 2020 nil
$0.219
$0.4391
$0.5879
T Negus 25 Oct 2019
19 Oct 2018
456,376
257,089
30 June 2022
30 June 2021
$0.219
$0.4391
See section 3 above in relation to the terms of Performance Rights.
The estimated maximum value of Performance Rights on issue for future years is the current share price. This is subject to future movements in the share price. The estimated minimum value is $nil.
Unissued shares under rights
at the date of this report there are no unissued ordinary shares of the Company relating to vested Performance Rights.
CONSOLIDATED RESULTS AND SHAREHOLDER RETURNS
2020 2019 2018 2017 2016
Net profit/(loss) attributable to equity holders of the parent ($35,491,742) ($27,040,121) $10,076,812 $10,694,940 $5,235,234
Basic ePS(1) (19.18¢) (14.61¢) 5.44¢ 5.78¢ 2.83¢
dividends declared – – $6,477,648 $6,477,648 $5,552,270
dividends declared per share 0.0¢ 0.0¢ 3.50¢ 3.50¢ 3.00¢
Share price 12.0¢ 29.0¢ 51.0¢ 67.0¢ 45.0¢
(1) includes both continued and discontinued earnings.
MaxiTRaNS iNduSTRieS30
Report of the Directors (Cont.)For the year ended 30 June 2020
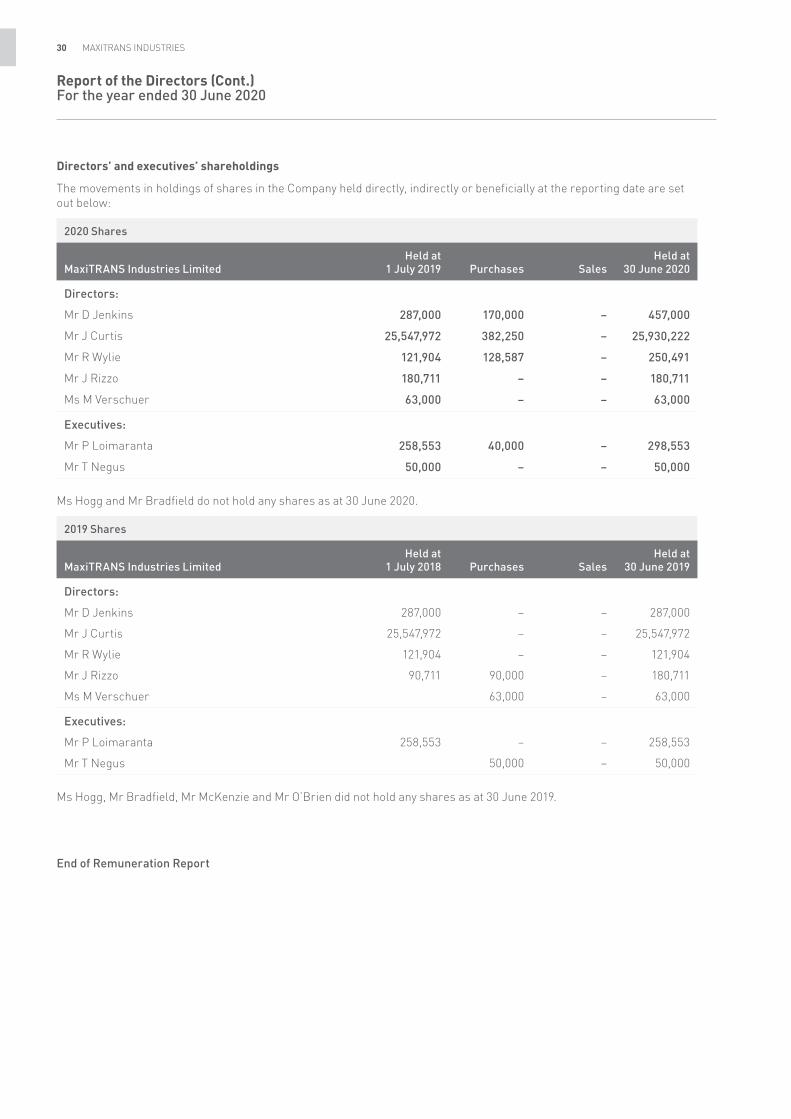
Directors’ and executives’ shareholdings
The movements in holdings of shares in the Company held directly, indirectly or beneficially at the reporting date are set out below:
2020 Shares
MaxiTRANS Industries LimitedHeld at
1 July 2019 Purchases SalesHeld at
30 June 2020
Directors:
Mr d Jenkins 287,000 170,000 – 457,000
Mr J Curtis 25,547,972 382,250 – 25,930,222
Mr R Wylie 121,904 128,587 – 250,491
Mr J Rizzo 180,711 – – 180,711
Ms M Verschuer 63,000 – – 63,000
Executives:
Mr P Loimaranta 258,553 40,000 – 298,553
Mr T Negus 50,000 – – 50,000
Ms Hogg and Mr Bradfield do not hold any shares as at 30 June 2020.
2019 Shares
MaxiTRANS Industries LimitedHeld at
1 July 2018 Purchases SalesHeld at
30 June 2019
Directors:
Mr d Jenkins 287,000 – – 287,000
Mr J Curtis 25,547,972 – – 25,547,972
Mr R Wylie 121,904 – – 121,904
Mr J Rizzo 90,711 90,000 – 180,711
Ms M Verschuer 63,000 – 63,000
Executives:
Mr P Loimaranta 258,553 – – 258,553
Mr T Negus 50,000 – 50,000
Ms Hogg, Mr Bradfield, Mr McKenzie and Mr O’Brien did not hold any shares as at 30 June 2019.
End of Remuneration Report

ANNUAL REPORT 2020 31
Report of the Directors (Cont.)For the year ended 30 June 2020
Audit and Risk Management Committeeas at the date of this report, the Company had an audit and Risk Management Committee of the Board of directors that met six times during the year. The details of the functions and memberships of the committees of the Board are presented in the Corporate Governance Statement.
IndemnityWith the exception of the matters noted below, the Company has not, during or since the end of the financial year, in respect of any person who is or has been an officer or auditor of the Company or a related body corporate:
(i) indemnified or made any relevant agreement for indemnifying against a liability incurred as an officer, including costs and expenses in successfully defending legal proceedings; or
(ii) Paid or agreed to pay a premium in respect of a contract insuring against a liability incurred as an officer for the costs or expenses to defend legal proceedings.
The Group has entered into a contract of insurance in relation to the indemnity of the Group’s directors and officers. The insurance policy relates to claims for damages, judgements, settlements or costs in respect of wrongful acts committed by directors or officers in their capacity as directors or officers but excluding wilful, dishonest, fraudulent, criminal or malicious acts or omissions by any director or officer. The directors indemnified are those existing at the date of this report. The officers indemnified include each full‑time executive officer and secretary.
during the financial year, the Group paid premiums of $94,500 (2019: $49,500) in respect of directors’ and officers’ liability insurance contracts.
Clause 101 of the Company’s constitution contains indemnities for officers of the Company. The Company has entered into a deed of protection with each of the directors to:
(i) indemnify the director to ensure that the director will have the benefit of the indemnities after the director ceases being a director of any group company;
(ii) insure the director against certain liabilities after the director ceases to be a director of any group company; and
(iii) Provide the director with access to the books of group companies.
Share OptionsNo options were granted to any of the directors or key management personnel of the Company or Group as part of their remuneration during or since the end of the financial year.
Shares Issued on the Exercise of OptionsNo options were exercised during the financial year.
Further details on the Group’s Performance Rights Plan are detailed in Note 15 to the consolidated financial statements and in the Remuneration Report.
Non‑Audit Servicesduring the year, KPMG, the Company’s auditor, performed certain other services in addition to their statutory duties.
The Board has considered the non‑audit services provided during the year by the auditor and in accordance with written advice provided by resolution of the audit and Risk Management Committee, is satisfied that the provision of those non‑audit services during the year by the auditor is compatible with, and did not compromise, the auditor independence requirements of the Corporations Act 2001 for the following reasons:
• all non‑audit services were subject to the corporate governance procedures adopted by the Group and have been reviewed by the audit and Risk Management Committee to ensure they do not impact the integrity and objectivity of the auditor; and
• The non‑audit services provided do not undermine the general principles relating to auditor independence as set out in APES 110 Code of Ethics for Professional Accountants, as they did not involve reviewing or auditing the auditor’s own work, acting in a management or decision making capacity for the Group, acting as an advocate for the Group or jointly sharing risks and rewards.
a copy of the auditor’s independence declaration as required under Section 307C of the Corporations act is included in, and forms part of this Report of the directors on page 33.

MaxiTRaNS iNduSTRieS32
Report of the Directors (Cont.)For the year ended 30 June 2020
details of the amounts paid to the auditor of the Company, KPMG, for audit and non‑audit services provided during the year are set out below:
Consolidated
Remuneration of auditor2020
$2019
$
KPMG Australia:
– auditing and reviewing the financial statements 467,827 456,212
– other services (taxation and advisory) 136,070 18,836
603,897 475,048
Overseas KPMG Firms:
– auditing and reviewing financial statements 42,084 53,940
– other services (taxation and advisory) 10,625 10,015
52,709 63,955
Total auditor remuneration 656,606 539,003
Proceedings on Behalf of CompanyNo person has applied for leave of Court to bring proceedings on behalf of the Company or intervene in any proceedings to which the Company is a party for the purpose of taking responsibility on behalf of the Company for all or any part of those proceedings. The Company was not a party to any such proceedings during the year.
Rounding of AccountsThe parent entity has applied the relief available to it in aSiC Corporations (Rounding in Financial/directors Reports) instruments 2016/191 and, accordingly, amounts in the financial statements and Report of the directors have been rounded to the nearest thousand dollars unless specifically stated to be otherwise.
This report has been made in accordance with a resolution of the Board of directors.
Mr. Robert H Wylie, Director Mr. Dean Stuart Jenkins, Director
dated this 21st day of august 2020
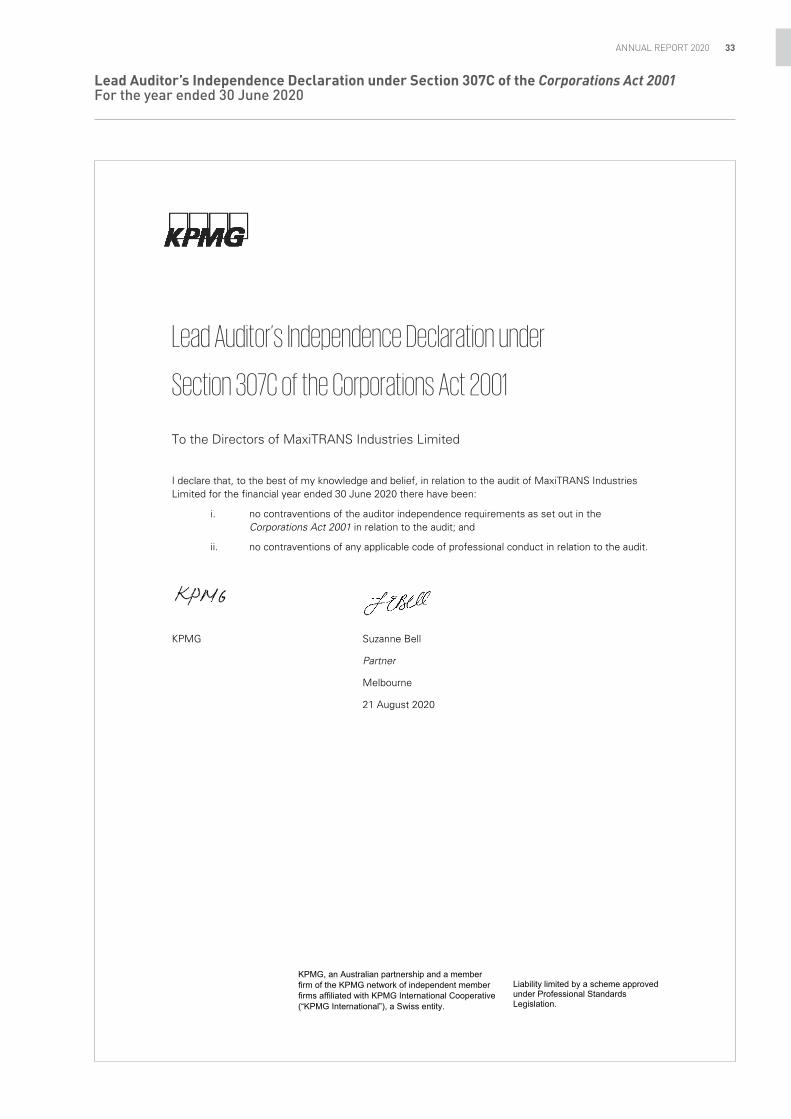
ANNUAL REPORT 2020 33
Liability limited by a scheme approved under Professional Standards Legislation.
KPMG, an Australian partnership and a member firm of the KPMG network of independent member firms affiliated with KPMG International Cooperative (“KPMG International”), a Swiss entity.
Lead Auditor’s Independence Declaration under
Section 307C of the Corporations Act 2001
To the Directors of MaxiTRANS Industries Limited
I declare that, to the best of my knowledge and belief, in relation to the audit of MaxiTRANS Industries Limited for the financial year ended 30 June 2020 there have been:
i. no contraventions of the auditor independence requirements as set out in the Corporations Act 2001 in relation to the audit; and
ii. no contraventions of any applicable code of professional conduct in relation to the audit.
KPMG Suzanne Bell
Partner
Melbourne
21 August 2020
Lead Auditor’s Independence Declaration under Section 307C of the Corporations Act 2001For the year ended 30 June 2020
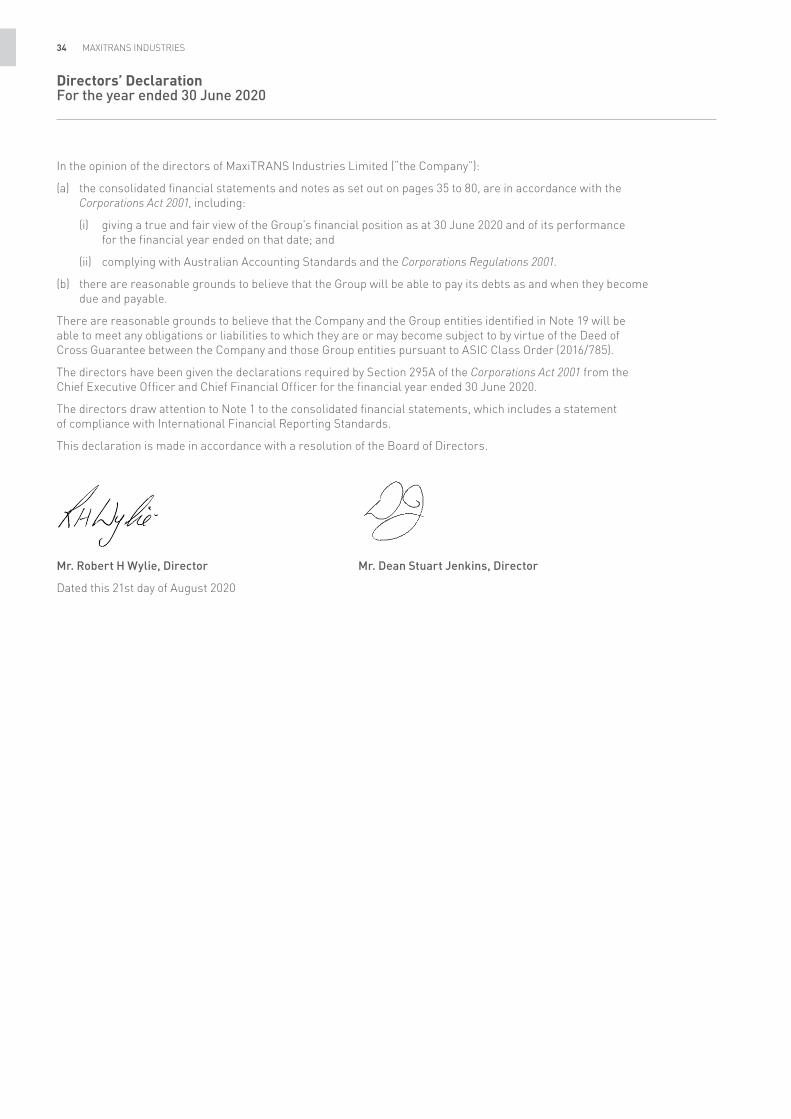
MaxiTRaNS iNduSTRieS34
Directors’ DeclarationFor the year ended 30 June 2020
in the opinion of the directors of MaxiTRaNS industries Limited (“the Company”):
(a) the consolidated financial statements and notes as set out on pages 35 to 80, are in accordance with the Corporations Act 2001, including:
(i) giving a true and fair view of the Group’s financial position as at 30 June 2020 and of its performance for the financial year ended on that date; and
(ii) complying with australian accounting Standards and the Corporations Regulations 2001.
(b) there are reasonable grounds to believe that the Group will be able to pay its debts as and when they become due and payable.
There are reasonable grounds to believe that the Company and the Group entities identified in Note 19 will be able to meet any obligations or liabilities to which they are or may become subject to by virtue of the deed of Cross Guarantee between the Company and those Group entities pursuant to aSiC Class Order (2016/785).
The directors have been given the declarations required by Section 295a of the Corporations Act 2001 from the Chief executive Officer and Chief Financial Officer for the financial year ended 30 June 2020.
The directors draw attention to Note 1 to the consolidated financial statements, which includes a statement of compliance with international Financial Reporting Standards.
This declaration is made in accordance with a resolution of the Board of directors.
Mr. Robert H Wylie, Director Mr. Dean Stuart Jenkins, Director
dated this 21st day of august 2020

ANNUAL REPORT 2020 35
Consolidated Statement of Profit or Loss and Consolidated Statement of Comprehensive IncomeFor the year ended 30 June 2020
CONSOLIDATED STATEMENT OF PROFIT OR LOSS AND CONSOLIDATED STATEMENT OF COMPREHENSIVE INCOME
Restated **
Note2020
$’0002019
$’000
Continued OperationsSale of goods 2(a) 306,062 329,915Rendering of services 2(a) 11,537 17,187Changes in inventories of finished goods and work in progress 2,656 5,616Raw materials and consumables used (202,702) (211,206)interest income 44 48Other income 2(d) 5,303 202employee and contract labour expenses 2(b) (84,535) (98,168)Warranty expenses 10 (4,488) (3,014)depreciation and amortisation expenses 2(c) (10,884) (5,533)Finance costs 2(c) (4,581) (2,643)Other expenses 2(c) (25,892) (31,806)impairment loss – Goodwill 7 (4,923) (9,336)impairment loss – other non‑financial assets 7 (39,553) (26,882)Share of net profits of associates accounted for using the equity method 20 2,042 2,058(Loss)/Profit before income tax (49,914) (33,562)income tax benefit 3(a) 14,422 8,092(Loss)/Profit from continued operations (35,492) (25,470)Discontinued OperationProfit from discontinued operation, net of tax 26 – (2)Profit on disposal of subsidiary, net of tax 26 – (1,568)(Loss)/Profit for the year (35,492) (27,040)(Loss) attributable to:equity holders of the Company (35,492) (27,040)CONSOLIDATED STATEMENT OF COMPREHENSIVE INCOME(Loss)/Profit for the year (35,492) (27,040)Other comprehensive incomeItems that may subsequently be re‑classified to profit or loss:Net exchange difference on translation of financial statements of foreign operations (140) 917Cashflow hedge reserve 28 (342)Items that will never be re‑classified to profit or loss:Revaluation of land and buildings 1,476 12,690Related income tax (443) (3,807)Other comprehensive income for the year, net of tax 921 9,458Total comprehensive income for the year (34,571) (17,582)Total comprehensive income attributable to: equity holders of the Company (34,571) (17,569)Non‑controlling interests – (13)Earnings/(Loss) per share for profit attributable to the ordinary equity holders of the Company:Basic earnings per share (cents per share) (19.18) (14.61)diluted earnings per share (cents per share) (19.18) (14.61)Earnings/(Loss) per share from continued operations:Basic earnings per share (cents per share) (19.18) (13.76)diluted earnings per share (cents per share) (19.18) (13.76)
** Refer Note 27 Restatement for further detail on FY19 restated results.
The consolidated statement of profit or loss and consolidated statement of comprehensive income is to be read in conjunction with the accompanying notes to the consolidated financial statements.

MaxiTRaNS iNduSTRieS36
Consolidated Statement of Financial PositionAs at 30 June 2020
CONSOLIDATED STATEMENT OF FINANCIAL POSITION
AS AT 30 JUNE 2020 Restated **
Note2020
$’0002019
$’000
Current Assets
Cash and cash equivalents 25,523 11,925
Trade and other receivables 4 26,545 42,381
inventories 5 58,361 59,267
Current tax assets 3(c) 1,954 768
Other 1,898 3,779
Total Current Assets 114,281 118,120
Non‑Current Assets
investment in associates and Joint Ventures 20 11,154 11,356
Property, plant and equipment 6 29,465 41,680
intangible assets 7 21,565 34,961
Right of use asset 22 25,231 –
deferred tax assets 3(b) 19,846 10,858
Total Non‑Current Assets 107,261 98,855
Total Assets 221,542 216,975
Current Liabilities
Trade and other payables 8 41,154 44,635
Other Liabilities 4,490 3,133
interest bearing loans and borrowings 9 147 255
Provisions 10 12,113 11,743
Lease liability 22 7,362 –
Total Current Liabilities 65,266 59,766
Non‑Current Liabilities
interest bearing loans and borrowings 9 37,500 43,670
Provisions 10 1,007 1,034
Lease liability 22 39,688 –
Total Non‑Current Liabilities 78,195 44,704
Total Liabilities 143,461 104,470
Net Assets 78,081 112,505
Equity
issued capital 11 56,386 56,386
Other reserves 16,348 15,278
accumulated Loss (45,631) –
Profits Reserve 50,978 40,841
Equity attributable to equity holders of the Company 78,081 112,505
** Refer Note 27 Restatement for further detail on FY19 restated results.
The consolidated statement of financial position is to be read in conjunction with the notes to the consolidated financial statements.

ANNUAL REPORT 2020 37
Consolidated Statement of Changes in EquityFor the year ended 30 June 2020
CONSOLIDATED STATEMENT OF CHANGES IN EQUITY
Note
Issued capital
$’000
Asset revalu‑
ation reserve1
$’000
Accu‑mulated
loss $’000
Profits reserve*
$’000
Non‑con‑trolling interest
$’000
Other reserves2
$’000Total
$’000
Balance at 1 July 2019 (Restated **) 56,386 12,964 – 40,841 – 2,314 112,505
Comprehensive income for the year
Loss for the year – – (45,631) 10,137 – – (35,494)
Other comprehensive income – – – – – – –
Net exchange differences on translation of financial statements of foreign operations – – – – – (140) (140)
Revaluation of land and buildings (net of tax) – 1,033 – – – – 1,033
Cashflow hedge reserve (net of tax) – – – – – 28 28
Total comprehensive income for the year – 1,033 (45,631) 10,137 – (112) (34,573)
Transactions with owners recorded directly in equity
dividends to equity holders – – – – – – –
Total transactions with owners – – – – – – –
Share‑based payment transactions 15 – – – – – 149 149
Balance at 30 June 2020 56,386 13,997 (45,631) 50,978 – 2,351 78,081
* The profits reserve represents the profits of entities within the Group transferred to a separate reserve to preserve their profit character.
** Refer Note 27 Restatement for further detail on FY19 restated results.
1. asset revaluation reserve
The asset revaluation reserve includes the revaluation increments arising from the revaluation of land and buildings.
2. Other reserves
Other reserves comprise the foreign currency translation reserve, share based payment reserve and hedging reserve.
The consolidated statement of changes in equity is to be read in conjunction with the notes to the consolidated financial statements.

MaxiTRaNS iNduSTRieS38
Consolidated Statement of Changes in Equity (Cont.)For the year ended 30 June 2020
CONSOLIDATED STATEMENT OF CHANGES IN EQUITY
Note
Issued capital
$’000
Asset revalu‑
ation reserve1
$’000
Accu‑mulated
loss $’000
Profits reserve*
$’000
Non‑con‑trolling interest
$’000
Other reserves2
$’000Total
$’000
Balance at 1 July 2018 56,386 17,886 – 57,097 1,338 3,112 135,819
Comprehensive income for the year
Loss for the year – – – (27,040) – – (27,040)
Other comprehensive income – – – – – – –
Net exchange differences on translation of financial statements of foreign operations – – – – (13) 930 917
Revaluation of land and buildings (net of tax) – 8,883 – – – – 8,883
Cashflow hedge reserve (net of tax) – – – – – (342) (342)
Total comprehensive income for the year – 8,883 – (27,040) (13) 588 (17,582)
Transactions with owners recorded directly in equity
dividends to equity holders – – – (2,776) – – (2,776)
de‑recognition of subsidiary – – – – (1,325) (1,124) (2,449)
Total transactions with owners – – – (2,776) (1,325) (1,124) (5,225)
Transfer to retained earnings on disposal of property – (13,805) – 13,805 – – –
Share‑based payment transactions 15 – – – – – (262) (262)
Other – – – (245) – – (245)
Balance at 30 June 2019 (Restated **) 56,386 12,964 – 40,841 – 2,314 112,505
* The profits reserve represents the profits of entities within the Group transferred to a separate reserve to preserve their profit character.
** Refer Note 27 Restatement for further detail on FY19 restated results.
1. asset revaluation reserve
The asset revaluation reserve includes the net revaluation increments arising from the revaluation of land and buildings.
2. Other reserves
Other reserves comprise the foreign currency translation reserve, share based payment reserve and hedging reserve.
The consolidated statement of changes in equity is to be read in conjunction with the notes to the consolidated financial statements.

ANNUAL REPORT 2020 39
Consolidated Statement of Cash FlowsFor the year ended 30 June 2020
CONSOLIDATED STATEMENT OF CASH FLOWS
Note2020
$’0002019
$’000
Cash flows from operating activities
Receipts from customers 412,232 409,839
Payments to suppliers and employees (382,546) (411,384)
interest received 44 48
interest and other costs of finance paid (2,106) (2,594)
Net income tax refund/(paid) 3,763 (2,007)
Net cash provided by/(used in) operating activities 21 31,387 (6,098)
Cash flows from investing activities
Payments for property, plant and equipment (3,094) (7,867)
Payments for intangibles (2,260) (5,858)
dividends received 2,244 1,408
Proceeds from disposal of subsidiary (net of cash and costs) – 6,141
acquisition of investment in associate – (5,880)
Proceeds from sale of property, plant and equipment 59 29,835
Net cash (used in)/provided by investing activities (3,051) 17,779
Cash flows from financing activities
Repayment of borrowings (12,660) (7,719)
Proceeds from borrowings 6,660 1,709
Payment of rent * (8,738) (662)
dividends paid – (2,776)
Net cash used in financing activities (14,738) (9,448)
Net increase in cash 13,598 2,233
Cash and cash equivalents at beginning of year 11,925 9,692
Cash and cash equivalents at end of year 25,523 11,925
* The Group has initially applied aaSB 16 at 1 July 2019 using the modified retrospective approach. under this approach, payments for operating leases that have previously been classified under Payments to suppliers and employees are now classified in Payment of rent.
The consolidated statement of cash flows is to be read in conjunction with the notes to the consolidated financial statements.

MaxiTRaNS iNduSTRieS40
Notes to the Consolidated Financial StatementsFor the year ended 30 June 2020
1. STATEMENT OF SIGNIFICANT ACCOUNTING POLICIES
MaxiTRaNS industries Limited (the ‘Company’) is a company domiciled in australia and its registered office is 346 Boundary Road, derrimut, Victoria. The consolidated financial statements of MaxiTRaNS industries Limited as at and for the year ended 30 June 2020 comprise the Company and its subsidiaries (together referred to as the ‘Group’) and the Group’s interest in joint ventures and jointly controlled entities. The Group is a for‑profit entity.
Basis of preparation
The financial report is a general purpose financial report which has been prepared in accordance with australian accounting Standards (‘aaSBs’) adopted by the australian accounting Standards Board (‘aaSB’) and the Corporations Act 2001. The financial report also complies with international Financial Reporting Standards (‘iFRSs’) adopted by the international accounting Standards Board (‘iaSB’).
The financial report has been prepared on an accruals basis and is based on historical costs and does not take into account changing money values or, except where stated, current valuations of non‑current assets. Cost is based on the fair values of the consideration given in exchange for assets. These accounting policies have been consistently applied to all periods presented in the consolidated financial report by each entity in the Group and are consistent with those of the previous year. The financial report contains comparative information that has been adjusted to align with the presentation of the current period, where necessary.
These consolidated financial statements are presented in australian dollars, which is the Company’s functional currency.
The Group has applied the relief available to it in aSiC Corporations (Rounding in Financial/directors Reports) instruments 2016/191 and, accordingly, amounts in the financial statements and Report of the directors have been rounded to the nearest thousand dollars unless specifically stated to be otherwise.
The financial report was approved by the board of directors on 21 august 2020.
The relevant australian accounting Standards and interpretations that became effective and that were early adopted by the Group since 30 June 2019 were:
• aaSB 112 Income Taxes. The amendments clarify that the income tax consequences of dividends are linked more directly to past transactions or events that generated distributable profits than to distributions to owners. Therefore, an entity recognises the income tax consequences of where the entity originally recognised those past transactions or events. The amendment did not affect the Group’s consolidated financial statements.
• aaSB 123 Borrowing Costs. The amendments clarify that an entity treats as part of general borrowings any borrowing originally made to develop a qualifying asset when substantially all the activities necessary to prepare that asset for its intended use or sale are complete. The amendments did not affect the Groups consolidated financial statements.
• aaSB 16 Leases. Mandatory for years beginning on or after 1 January 2019. This standard replaces aaSB 117 Leases. Leases are accounted for as described in accounting policy (ac).
Going Concern
The consolidated financial statements have been prepared on a going concern basis, which assumes that the Group will be able to pay its debts as and when they become due and payable.
For the year ended 30 June 2020:
• The Group recorded a net loss after tax of $35,492 thousand including an impairment of $44,476 thousand (30 June 2019: loss of $27,040 thousand including an impairment of $36,218 thousand).
• The Group had a net debt balance of $12,124 thousand (30 June 2019: $32,000 thousand).
• Working capital, being current assets less current liabilities, amounted to a surplus of $49,015 thousand (30 June 2019: $58,354 thousand).
• Net cash inflows from operating activities were $31,387 thousand (30 June 2019: $6,098 thousand outflow).
• To enable the Group and the debt holders to work through a debt restructure, the Company and the debt holders had agreed covenants up to 31 March 2020. The group was in breach of certain debt covenants at 30 September 2019 and 31 March 2020. The debt holders provided waivers to both of these covenant breaches. There were no covenant requirements at 30 June 2020.
On 30 June 2020, the debt holders agreed to amendments to the Syndicated Facility agreement (“SFa”), including:
• New simplified debt covenants based on the Group’s forecast profitability and liquidity up to 30 June 2021; and
• The extension of the working capital facility (Facility C) to 31 July 2021.
if the Group does not meet its obligations under this amendment, this would constitute an event of default under the SFa. as is consistent with prior arrangements with the debt holders, an event of default would result in the loan facility falling due and payable on demand ($37,500 thousand drawn at 30 June 2020).
ANNUAL REPORT 2020 41
Notes to the Consolidated Financial Statements (Cont.)For the year ended 30 June 2020
The ongoing COVid‑19 pandemic has increased the estimation uncertainty in the preparation of budgets, generally, due to the impact of the following factors:
• the extent and duration of actions by governments, businesses and consumers to contain the spread of the virus;
• the extent and duration of the expected economic downturn. This includes the disruption to capital markets, deteriorating credit, higher unemployment, and changes in consumer discretionary spending behaviours; and
• the effectiveness of government measures that have and will be put in place to support businesses and consumers through this disruption and economic downturn.
Management is targeting various initiatives to improve both the underlying business results and cash flows. This includes, but is not limited to the sale of assets, alternative financing arrangements and working capital improvements.
While the directors are cautious in the current COVid‑19 environment, recent quotation levels have been higher than the last 12 months, when combined with a sustained conversion rate this has resulted in an improved order‑book position heading into FY21.
added to this, recent rains support what is likely to be one of the better South east australian grain crops in recent years with an associated increase in the MaxiTRaNS bulk tipper segment.
The directors believe that the Group has the support of its debt holders and it will continue to meet the ongoing compliance requirements of the SFa (as disclosed in Note 24) and its amendments. The directors anticipate that the initiatives outlined above combined with the net debt position at 30 June 2020, will be appropriate to address the underlying business results and cash flow requirements, which will ensure that the Group will comply with its revised covenants.
The directors acknowledge that uncertainty remains over the Group’s ability to meet its funding requirements and to refinance or repay its banking facilities if they fall due. if for any reason the Group is unable to continue as a going concern, then this could have an impact on the Group’s ability to realise assets at their recognised values, in particular goodwill and other intangible assets, and to extinguish liabilities in the normal course of business at the amounts stated in the consolidated financial statements.
Accounting policies
The following is a summary of the material accounting policies adopted by the Group in the preparation of the financial report.
(a) Principles of consolidation
The consolidated financial report comprises the financial statements of MaxiTRaNS industries Limited and all its subsidiaries. a subsidiary is any entity controlled by MaxiTRaNS industries Limited or any of its subsidiaries. Control exists where MaxiTRaNS industries Limited is exposed to, or has rights to, variable returns from its involvement with the entity and has the ability to affect those returns through its power over the entity. a list of subsidiaries is contained in Note 18 to the financial statements.
all inter‑company balances and transactions between entities in the Group, including any unrealised profits or losses, have been eliminated on consolidation.
Business combinations are accounted for using the acquisition method as at the acquisition date, which is the date on which control is transferred to the Group.
Costs related to the acquisition, other than those associated with the issue of debt or equity securities, that the Group incurs in connection with a business combination are expensed as incurred.
any contingent consideration payable is recognised at fair value at the acquisition date. if the contingent consideration is classified as equity, it is not remeasured, and settlement is accounted for within equity. Otherwise, subsequent changes to the fair value of the contingent consideration are recognised in profit or loss.
Where subsidiaries have entered or left the Group during the year, their operating results have been included from the date control was obtained or until the date control ceased. The accounting policies of subsidiaries have been changed when necessary to align them with the policies adopted by the Group.
NCi are measured at their proportionate share of the acquiree’s identifiable net assets at the date of acquisition. Changes in the Group’s interest in a subsidiary that do not result in a loss of control are accounted for as equity transactions.
The Group’s interests in equity‑accounted investees comprise interests in associates. associates are those entities in which the Group has significant influence, but not control or joint control, over the financial and operating policies.
interests in associates are accounted for using the equity method. They are initially recognised at cost, which includes transaction costs. Subsequent to initial recognition, the consolidated financial statements include the Group’s share of profit or loss and OCi of equity‑accounted investees and reduced by dividends received, until the date on which significant influence ceases.

MaxiTRaNS iNduSTRieS42
Notes to the Consolidated Financial Statements (Cont.)For the year ended 30 June 2020
When the Group’s share of losses exceeds its interest in an associate, the Group’s carrying amount is reduced to nil and recognition of further losses is discontinued except to the extent that the Group has incurred legal or constructive obligations or made payments on behalf of an associate.
unrealised gains arising from transactions with associates are eliminated to the extent of the Group’s interest in the associate.
(b) Foreign currency
(i) Foreign currency transactions
Transactions in foreign currencies are translated at the foreign exchange rate ruling at the date of the transaction. Monetary assets and liabilities denominated in foreign currencies at the reporting date are translated into australian dollars at the foreign exchange rate ruling at that date. Foreign exchange differences arising on translation are recognised in the consolidated statement of profit or loss. Non‑monetary assets and liabilities that are measured in terms of historical cost in a foreign currency are translated using the exchange rate at the date of the transaction. Non‑monetary assets and liabilities denominated in foreign currencies that are stated at fair value are translated into australian dollars at foreign exchange rates ruling at the dates the fair value was determined.
(ii) Financial statements of foreign operations
The assets and liabilities of foreign operations, including goodwill and fair value adjustments arising on consolidation, are translated into australian dollars at foreign exchange rates ruling at the reporting date. The revenues and expenses of foreign operations are translated into australian dollars at rates approximating the foreign exchange rates ruling at the dates of the transactions. Foreign exchange differences arising on translation are recognised directly in a separate component of equity.
(c) Inventories
inventories are valued at the lower of cost and net realisable value. Costs are assigned on a weighted average basis and include direct materials, direct labour and an appropriate proportion of variable and fixed factory overheads, based on the normal operating capacity of the production facilities. Net realisable value is determined on the basis of each inventory line’s normal selling price.
(d) Property, plant and equipment
(i) Owned assets Land and buildings
Property whose fair value can be measured reliably is carried at a revalued amount, being its fair value at the date of the revaluation less any subsequent accumulated depreciation and subsequent accumulated impairment losses. Fair value of land and buildings is assessed at each reporting period.
independent valuations were obtained during the financial year ending 30 June 2020 in relation to all land and buildings.
These were considered by the directors in establishing revaluation amounts.
if an asset’s carrying amount is increased as a result of a revaluation, the increase is credited directly to equity under the heading of asset Revaluation Reserve. However, the increase is recognised in profit or loss to the extent that it reverses a revaluation decrease of the same asset previously recognised in profit or loss. if an asset’s carrying amount is decreased as a result of a revaluation, the decrease is recognised in profit or loss. However, the decrease is debited directly to equity under the heading of asset Revaluation Reserve to the extent of any credit balance existing in the revaluation reserve in respect of that asset. Changes to an asset’s carrying amount are brought to account. On realisation of any amounts contained in the asset Realisation Reserve, the balance is transferred to retained earnings.
Plant and equipment
items of plant and equipment are stated at cost or deemed cost less accumulated depreciation and impairment losses (see accounting policy (i)). The cost of self‑constructed assets includes the cost of materials, direct labour, and an appropriate proportion of production overheads. The cost of self‑constructed assets and acquired assets includes (i) the initial estimate, at the time of installation and during the period of use, when relevant, of the costs of dismantling and removing the items and restoring the site on which they are located, and (ii) changes in the measurement of existing liabilities recognised for these costs resulting from changes in the timing or outflow of resources required to settle the obligation or from changes in the discount rate.
Where parts of an item of property, plant and equipment have different useful lives, they are accounted for as separate items of property, plant and equipment.
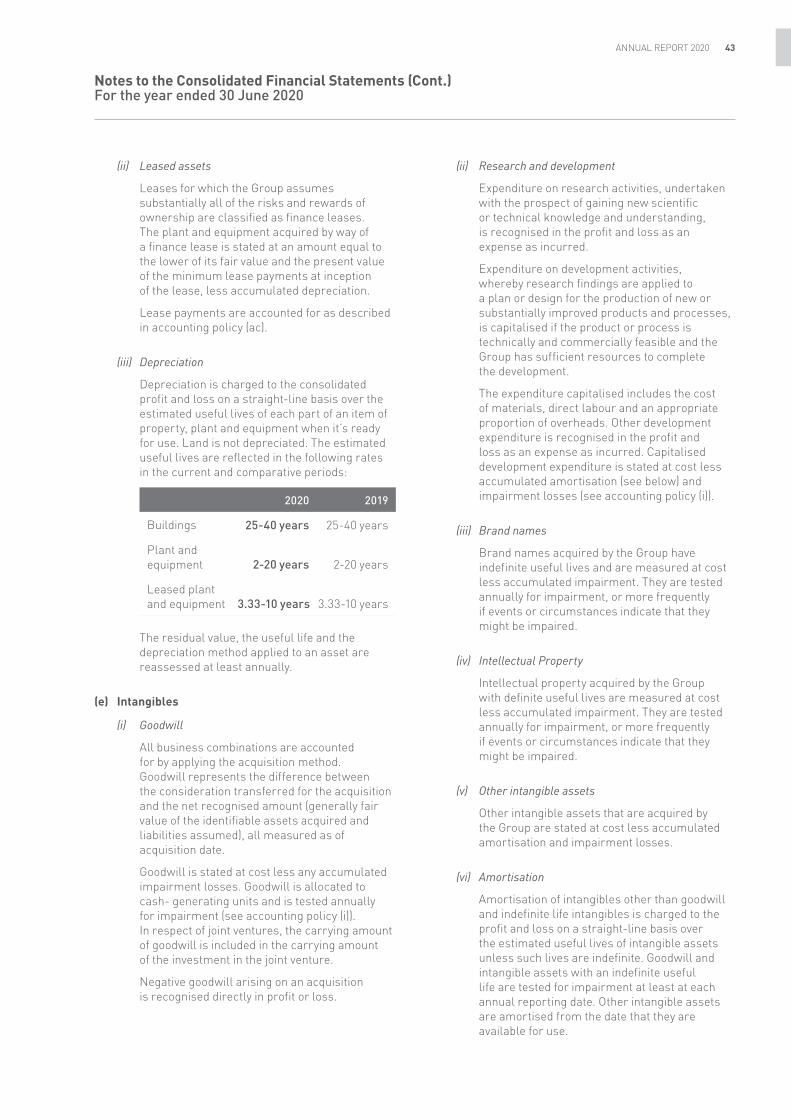
ANNUAL REPORT 2020 43
Notes to the Consolidated Financial Statements (Cont.)For the year ended 30 June 2020
(ii) Leased assets
Leases for which the Group assumes substantially all of the risks and rewards of ownership are classified as finance leases. The plant and equipment acquired by way of a finance lease is stated at an amount equal to the lower of its fair value and the present value of the minimum lease payments at inception of the lease, less accumulated depreciation.
Lease payments are accounted for as described in accounting policy (ac).
(iii) Depreciation
depreciation is charged to the consolidated profit and loss on a straight‑line basis over the estimated useful lives of each part of an item of property, plant and equipment when it’s ready for use. Land is not depreciated. The estimated useful lives are reflected in the following rates in the current and comparative periods:
2020 2019
Buildings 25‑40 years 25‑40 years
Plant and equipment 2‑20 years 2‑20 years
Leased plant and equipment 3.33‑10 years 3.33‑10 years
The residual value, the useful life and the depreciation method applied to an asset are reassessed at least annually.
(e) Intangibles
(i) Goodwill
all business combinations are accounted for by applying the acquisition method. Goodwill represents the difference between the consideration transferred for the acquisition and the net recognised amount (generally fair value of the identifiable assets acquired and liabilities assumed), all measured as of acquisition date.
Goodwill is stated at cost less any accumulated impairment losses. Goodwill is allocated to cash‑ generating units and is tested annually for impairment (see accounting policy (i)). in respect of joint ventures, the carrying amount of goodwill is included in the carrying amount of the investment in the joint venture.
Negative goodwill arising on an acquisition is recognised directly in profit or loss.
(ii) Research and development
expenditure on research activities, undertaken with the prospect of gaining new scientific or technical knowledge and understanding, is recognised in the profit and loss as an expense as incurred.
expenditure on development activities, whereby research findings are applied to a plan or design for the production of new or substantially improved products and processes, is capitalised if the product or process is technically and commercially feasible and the Group has sufficient resources to complete the development.
The expenditure capitalised includes the cost of materials, direct labour and an appropriate proportion of overheads. Other development expenditure is recognised in the profit and loss as an expense as incurred. Capitalised development expenditure is stated at cost less accumulated amortisation (see below) and impairment losses (see accounting policy (i)).
(iii) Brand names
Brand names acquired by the Group have indefinite useful lives and are measured at cost less accumulated impairment. They are tested annually for impairment, or more frequently if events or circumstances indicate that they might be impaired.
(iv) Intellectual Property
intellectual property acquired by the Group with definite useful lives are measured at cost less accumulated impairment. They are tested annually for impairment, or more frequently if events or circumstances indicate that they might be impaired.
(v) Other intangible assets
Other intangible assets that are acquired by the Group are stated at cost less accumulated amortisation and impairment losses.
(vi) Amortisation
amortisation of intangibles other than goodwill and indefinite life intangibles is charged to the profit and loss on a straight‑line basis over the estimated useful lives of intangible assets unless such lives are indefinite. Goodwill and intangible assets with an indefinite useful life are tested for impairment at least at each annual reporting date. Other intangible assets are amortised from the date that they are available for use.

MaxiTRaNS iNduSTRieS44
Notes to the Consolidated Financial Statements (Cont.)For the year ended 30 June 2020
The estimated useful lives are reflected in the following rates in the current and comparative periods:
2020 2019
intellectual property 0‑20 years 0‑20 years
Software 5‑10 years 5‑10 years
amortisation methods, useful lives and residual values are reviewed at each financial year end and adjusted if appropriate.
(f) Non‑current assets held for sale
Non‑current assets that are highly probable to be recovered primarily through sale or distribution rather than through continuing use, are classified as held for sale. immediately before classification, the assets are remeasured in accordance with the Group’s accounting policies. Thereafter, generally the assets are measured at the lower of their carrying amount and fair value less costs to sell. impairment losses on initial classification as held for sale and subsequent gains or losses on remeasurement are recognised in profit or loss. Gains are not recognised in excess of any cumulative impairment loss.
(g) Trade and other receivables
The Group measures trade and other receivables are stated at their amortised cost less impairment losses (see accounting policy (i)) if both of the following conditions are met:
• The financial asset is held within a business model with the objective to hold financial assets in order to collect contractual cash flows; and
• The contractual terms of the financial asset give rise on specified dates to cash flows that are solely payments of principal and interest on the principal amount outstanding.
(h) Cash and cash equivalents
Cash and cash equivalents comprise cash balances and call deposits with an original maturity of three months or less. Bank overdrafts that are repayable on demand and form an integral part of the Group’s cash management are included as a component of cash and cash equivalents for the purpose of the statement of cash flows.
(i) Impairment
The carrying amounts of the Group’s assets, other than inventories (see accounting policy (c)) and deferred tax assets (see accounting policy (p)), are reviewed at each reporting date to determine whether there is any indication of impairment.
if any such indication exists, the asset’s recoverable amount is estimated.
an impairment loss is recognised whenever the carrying amount of an asset or its cash generating unit exceeds its recoverable amount. impairment losses are recognised in the profit and loss unless the asset has previously been revalued, in which case the impairment loss is recognised as a reversal to the extent of that previous revaluation with any excess recognised through the profit and loss.
impairment losses recognised in respect of cash‑generating units are allocated first to reduce the carrying amount of any goodwill allocated to the cash‑generating unit (group of units) and then, to reduce the carrying amount of the other assets in the unit (group of units) on a pro‑rata basis.
For trade and other receivables, the Group applies a simplified approach in calculating expected credit losses. Therefore, the Group does not track changes in credit risk, but instead recognises a loss allowance at each reporting date, based on known issues on collectability of outstanding debt.
(j) Calculation of recoverable amount
The recoverable amount of the Group’s receivables carried at amortised cost is calculated as the present value of estimated future cash flows, discounted at the original effective interest rate (i.e. the effective interest rate computed at initial recognition of these financial assets). Receivables with a short duration (less than 12 months) are not discounted.
The recoverable amount of other assets is the greater of their fair value less costs to sell and value in use. in assessing value in use, the estimated future cash flows are discounted to their present value using a post‑tax nominal discount rate that reflects current market assessments of the time value of money and the risks specific to the asset. For an asset that does not generate largely independent cash inflows, the recoverable amount is determined for the cash‑generating unit to which the asset belongs.
(k) Reversals of impairment
an impairment loss in respect of receivables carried at amortised cost is reversed if the subsequent increase in recoverable amount can be related objectively to an event occurring after the impairment loss was recognised.
an impairment loss in respect of goodwill is not reversed.
in respect of other assets, an impairment loss is reversed if there has been a change in the estimates used to determine the recoverable amount.

ANNUAL REPORT 2020 45
Notes to the Consolidated Financial Statements (Cont.)For the year ended 30 June 2020
an impairment loss is reversed only to the extent that the asset’s carrying amount does not exceed the carrying amount that would have been determined, net of depreciation or amortisation, if no impairment loss had been recognised.
(l) Interest‑bearing borrowings
interest‑bearing borrowings are recognised initially at fair value less attributable transaction costs.
Subsequent to initial recognition, interest‑bearing borrowings are stated at amortised cost with any difference between cost and redemption value being recognised in the profit or loss over the period of the borrowings on an effective interest basis.
(m) Employee benefits
(i) Defined contribution superannuation funds
Obligations for contributions to defined contribution superannuation funds are recognised as an expense in the profit or loss as incurred.
(ii) Long‑term service benefits
The Group’s net obligation in respect of long‑term service benefits, other than pension plans, is the amount of future benefit that employees have earned in return for their service in the current and prior periods. The obligation is calculated using expected future increases in wage and salary rates including related on‑costs and expected settlement dates and is discounted using the rates attached to corporate bonds at the reporting date which have maturity dates approximating the terms of the Group’s obligations.
(iii) Share based payments transactions
MaxiTRaNS industries Limited grants performance rights from time to time to certain employees under the Performance Rights Plan.
The fair value of performance rights granted is recognised as an employee expense with a corresponding increase in equity recorded over the vesting period.
The fair value of the performance rights is calculated at the date of grant using a Monte Carlo simulation model and allocated to each reporting period over the period from grant date to vesting date. The value disclosed is the portion of the fair value of the performance rights allocated to this reporting period.
(iv) Wages, salaries, annual leave, sick leave and non‑monetary benefits
Liabilities for employee benefits for wages, salaries, annual leave and sick leave represent present obligations resulting from employees’ services provided to reporting date, calculated at undiscounted amounts based on remuneration wage and salary rates that the Group expects to pay as at reporting date including related on‑costs, such as workers compensation insurance and payroll tax. Non‑accumulating non‑monetary benefits, such as medical care, housing, cars and free or subsidised goods and services, are expensed based on the net marginal cost to the Group as the benefits are taken by the employees.
(n) Provisions
a provision is recognised in the consolidated statement of financial position when the Group has a present legal or constructive obligation as a result of a past event, and it is probable that an outflow of economic benefits will be required to settle the obligation. if the effect is material, provisions are determined by discounting the expected future cash flows at a pre‑tax rate that reflects current market assessments of the time value of money and, when appropriate, the risks specific to the liability.
(o) Warranties
a provision for warranties is recognised when the underlying products or services are sold. The provision is based on historical warranty data and known warranty claims.
(p) Income tax
income tax expense comprises current and deferred tax. income tax is recognised in the profit or loss except to the extent that it relates to items recognised directly in equity, in which case it is recognised in equity.
Current tax is the expected tax payable on the taxable income for the year, using tax rates enacted or substantially enacted at the reporting date, and any adjustment to tax payable in respect of previous years.
in determining the amount of current and deferred tax, the Group takes into account the impact of uncertain tax positions. The Group believes that its accruals for tax liabilities are adequate for all open tax years. This assessment relies on estimates and assumptions and may involve judgements about future events.

MaxiTRaNS iNduSTRieS46
Notes to the Consolidated Financial Statements (Cont.)For the year ended 30 June 2020
deferred tax is provided using the balance sheet liability method, providing for temporary differences between the carrying amounts of assets and liabilities for financial reporting purposes and the amounts used for taxation purposes. The following temporary differences are not provided for: goodwill, the initial recognition of assets or liabilities that affect neither accounting nor taxable profit, and differences relating to investments in subsidiaries to the extent that they will probably not reverse in the foreseeable future. The amount of deferred tax provided is based on the expected manner of realisation or settlement of the carrying amount of assets and liabilities, using tax rates enacted or substantially enacted at the reporting date.
a deferred tax asset is recognised only to the extent that it is probable that future taxable profits will be available against which the asset can be utilised.
deferred tax assets are reduced to the extent that it is no longer probable that the related tax benefit will be realised.
additional income taxes that arise from the distribution of dividends are recognised at the same time as the liability to pay the related dividend.
(q) Tax consolidation
The Company and its wholly owned australian resident entities have formed a tax‑consolidated group with effect from 1 July 2003 and are therefore taxed as a single entity from that date. The head entity within the tax consolidated group is MaxiTRaNS industries Limited.
due to the existence of a tax contribution agreement between the entities in the tax consolidated group, the parent entity recognises the tax effects of its own transactions and the current tax liabilities and the deferred tax assets arising from unused tax losses and unused tax credits assumed from the subsidiary entities.
Current tax income/expense, deferred tax liabilities and deferred tax assets arising from temporary differences of the members of the tax‑consolidated group are recognised in the separate financial statements of the members of the tax consolidated group using the ‘separate taxpayer within group’ approach by reference to the carrying amounts of assets and liabilities in the separate financial statements of each entity and the tax values applying under tax consolidation.
in accordance with the tax contribution agreement, the subsidiary entities are compensated/charged for the assets and liabilities assumed by the parent entity as intercompany receivables and payables and for amounts which equal the amounts initially recognised by the subsidiary entities.
(r) Earnings per share
Basic earnings per share (“ePS”) is calculated by dividing the net profit attributable to members of the parent entity for the reporting period, by the weighted average number of ordinary shares of the Company.
diluted ePS is calculated by dividing the basic earnings, adjusted by the after tax effect of financing costs associated with dilutive potential ordinary shares and the effect on revenues and expenses of conversion to ordinary shares associated with dilutive potential ordinary shares, by the weighted average number of ordinary shares and dilutive potential ordinary shares.
(s) Revenue
(i) Revenue from the sale of goods
Revenue from the sale of goods is recognised at a point in time upon satisfaction of the performance obligation by transferring control of the promised good to the customer.
(ii) Revenue from the rendering of services
Revenue from the rendering of services is recognised at a point in time as the services are completed.
(iii) Other income
interest income is recognised in the profit and loss as it accrues, using the effective interest method.
(iv) Dividend income
dividend revenue is recognised when the right to receive a dividend has been established.
(t) Goods and services tax
Revenues, expenses and assets are recognised net of the amount of goods and services tax (GST), except where the amount of GST incurred is not recoverable from the australian Tax Office (aTO). in these circumstances the GST is recognised as part of the cost of acquisition of the asset or as part of an item of the expense.
Receivables and payables are stated with the amount of GST included.
The net amount of GST recoverable from, or payable to, the aTO is included as a current asset or liability in the consolidated balance sheet.
Cash flows are included in the statements of cash flows on a gross basis. The GST components of cash flows arising from investing and financing activities which are recoverable from, or payable to, the aTO are classified as operating cash flows.

ANNUAL REPORT 2020 47
Notes to the Consolidated Financial Statements (Cont.)For the year ended 30 June 2020
(u) Trade and other payables
Liabilities are recognised for amounts to be paid in the future for goods or services received. Trade accounts payable are normally settled within 60 days.
(v) Expenses
(i) Finance costs
Finance costs comprise interest payable on borrowings calculated using the effective interest method, foreign exchange losses, and losses on hedging instruments that are recognised in the profit and loss. Borrowing costs that are directly attributable to the acquisition, construction or production of a qualifying asset are capitalised as part of the cost of the asset. all other borrowing costs are recognised in the profit and loss using the effective interest method.
(w) Derivative financial instruments
The Group from time to time uses derivative financial instruments to hedge its exposure to foreign exchange and interest rate risks arising from operational, financing and investment activities. The Group does not hold or issue derivative financial instruments for trading purposes. However, derivatives that do not qualify for hedge accounting are accounted for as trading instruments.
derivatives are initially recognised at fair value. Subsequent to initial recognition, derivative financial instruments are stated at fair value, and changes therein are recognised in profit or loss. However, where derivatives qualify for hedge accounting, recognition of any resultant gain or loss depends on the nature of the item being hedged.
When a derivative is designated as a cash flow hedging instrument, the effective portion of changes in the fair value of the derivative is recognised in OCi and accumulated in the hedging reserve. any ineffective portion of changes in the fair value of the derivative is recognised in the profit or loss.
The amount accumulated in equity is retained in OCi and reclassified to profit or loss in the same period or periods during which the hedged item affects profit or loss.
if the hedging instrument no longer meets the criteria for hedge accounting, expires or is sold, terminated or exercised, or the designation is revoked, then hedge accounting is discontinued prospectively. if the forecast transaction is no longer expected to occur, then the amount accumulated in equity is reclassified to profit or loss.
(x) Accounting estimates and judgements
Management discussed with the Board audit and Risk Management Committee the development, selection and disclosure of the Group’s critical accounting policies and estimates and the application of these policies and estimates. The estimates and judgements that have a significant risk of causing a material adjustment to the carrying amounts of assets and liabilities within the next financial year are discussed below.
(i) Impairment of goodwill and intangibles
The Group assesses whether goodwill and intangibles with indefinite useful lives are impaired at least annually in accordance with accounting policy (i).
These calculations involve an estimation of the recoverable amount of the cash‑generating units to which the goodwill and intangibles with indefinite useful lives are allocated.
COVID‑19
The ongoing COVid‑19 pandemic has increased the uncertainty of estimation in the preparation of budgets and therefore over the estimation of the recoverable amount. The Group has prepared the budget to represent its best understanding of COVid‑19 market and industry factors.
The budget has assumed the continuation of the JobKeeper payments through to 30 September 2020, the continuation of the instant asset write‑off program through to 31 december 2020, and that operations remain largely unaffected by restrictions with both the Trailer Solutions and Parts businesses continuing to be classified as an essential service.
(ii) Provisions
The calculation of the provisions for warranty claims and impairment provisions for inventory and receivables involves estimation and judgement surrounding future claims and potential losses and exposures based primarily on past experience, the likelihood of claims or losses and exposures arising in the future as well as management knowledge and experience together with a detailed examination of financial and non‑financial information and trends. Refer accounting policy (n) for details of the recognition and measurement criteria applied.

MaxiTRaNS iNduSTRieS48
Notes to the Consolidated Financial Statements (Cont.)For the year ended 30 June 2020
COVID‑19
The Group has assessed the estimation and judgements in light of the current COVid‑19 pandemic. To date the Group has not seen an impact on the estimation and judgements for warranty claims, provisions for inventory and receivables.
(y) Financial risk management
(i) Overview
The Group has exposure to credit, market and liquidity risks associated with the use of financial instruments.
The Board has delegated to the audit and Risk Management Committee responsibility for the establishment of policies on risk oversight and management.
Risk management policies are established to identify and analyse the risks faced by the Group, to set appropriate risk controls, and to monitor risks and adherence to limits.
The Group does not enter into or trade financial instruments, including derivative financial instruments, for speculative purposes.
The Group’s activities expose it primarily to the financial risks associated with changes in foreign currency exchange rates and interest rates. The carrying value of financial assets and financial liabilities recognised in the accounts approximate their fair value with the exception of borrowings which are recorded at amortised cost.
There have not been any changes to the objectives, policies and procedures for managing risk during the current year or in the prior year.
(ii) Capital management
The Board’s policy is to maintain a strong capital base so as to maintain investor, creditor and market confidence and to sustain future development of the business.
The Board monitors the earnings per share and the levels of dividends to ordinary shareholders together with the net debt/equity ratio, which at 30 June 2020 was 17% (2019: 28%). The dividend Reinvestment Plan was suspended on 21 June 2011. The Board seeks to maintain a balance between higher returns that might be possible with higher levels of borrowings and the advantages afforded by a sound capital position.
(z) Segment reporting
Operating segments are identified, and segment information disclosed on the basis of internal reports that are regularly provided to or reviewed by the Group’s chief operating decision maker which, for the Group, is the Managing director. in this regard, such information is provided using different measures to those used in preparing the consolidated statement of profit or loss and consolidated balance sheet.
Reconciliations of such management information to the statutory information contained in the financial report have been included.
(aa) Determination of fair values
a number of the Group’s accounting policies and disclosures require the determination of fair value, for both financial and non‑financial assets and liabilities. Fair values have been determined for measurement and/or disclosure purposes based on the following methods. When applicable, further information about the assumptions made in determining fair values is disclosed in the notes specific to that asset or liability.
(i) Land and buildings
The fair value of property is based on market values. The market value of property is the estimated amount for which a property could be exchanged on the date of valuation between a willing and knowledgeable buyer and seller in an arm’s length transaction after proper marketing.
(ii) Derivatives
The fair value of forward exchange contracts is based on their listed market price, if available. if a listed market price is not available, then fair value is estimated by discounting the difference between the contractual forward price and the current forward price for the residual maturity of the contract.
The fair value of interest rate swaps is based on independent valuations.
Fair values reflect the credit risk of the instrument and include adjustments to take account of the credit risk of the Group entity and counterparty when appropriate.

ANNUAL REPORT 2020 49
Notes to the Consolidated Financial Statements (Cont.)For the year ended 30 June 2020
(iii) Non‑derivative financial liabilities
Fair value, which is determined for disclosure purposes, is calculated based on the present value of future principal and interest cash flows, discounted at the market rate of interest at the reporting date. For finance leases the market rate of interest is determined by reference to similar lease agreements
(ab) Government grants
From time to time the Group becomes eligible for government grants. These grants, which are related to assets are accounted for in accordance with aaSB 120 Accounting for Government Grants and Disclosure of Government Assistance. The Group has elected to recognise government grants by reducing the carrying amount of the asset.
amounts received under Government COVid‑19‑related stimulus schemes are recognised as other income when confirmation that the payments will be made is received and the Group has satisfied its obligations under the respective scheme. all such amounts are recorded in the consolidated statement of profit or loss on a gross basis.
(ac) Leases
aaSB 16 introduces a single, on‑balance sheet lease accounting model for lessees. a lessee recognises a right‑of‑use asset representing its right to use the underlying asset and a lease liability representing its obligation to make lease payments. There are recognition exemptions for short‑term leases and leases of low‑value items. Lessor accounting remains similar to aaSB 117 – i.e. lessors continue to classify leases as finance or operating leases.
The Group has adopted aaSB 16 using the modified retrospective effect method, with the effect of initially applying this standard recognised at the date of initial application (i.e. 1 July 2019). Therefore, the cumulative effect of adopting aaSB 16 was recognised as an adjustment to the opening balance assets and liabilities at 1 July 2019, with no restatement of comparative information.
The Group recognises a right‑of‑use asset and a lease liability at the lease commencement date. The right‑of‑use asset is initially measured at cost, and subsequently at cost less any accumulated depreciation and impairment losses,and adjusted from certain remeasurements of the lease liability.
The lease liability is initially measured at the present value of the lease payments that are not paid at the commencement date, discounted using the interest rate implicit in the lease or, if that rate cannot be readily determined, the Group’s incremental borrowing rate. Generally, the Group uses its incremental borrowing rate as the discount rate.
The lease liability is subsequently increased by the interest cost on the lease liability and decreased by lease payments made. it is remeasured when there is a change in future lease payments arising from a change in index or rate, a change in the estimate of the amount expected to be payable under a residual value guarantee, or as appropriate, changes in the assessment of whether a purchase or extension option is reasonably certain to be exercised or a termination option is reasonably certain not to be exercised.
The Group has applied judgement to determine the lease term for some lease contracts in which it is a lessee that include renewal options. The Group is reasonably certain to exercise renewal options included in land and buildings leases, which significantly affects the amount of lease liabilities and right‑of use assets recognised at the date of initial application.
(i) Leases in which the Group is the lessee
Previously, the Group recognised operating lease expense on a straight‑line basis over the term of the lease, and recognised assets and liabilities only to the extent that there was a timing difference between actual lease payments and the expense.
The Group recognised new assets and liabilities for its operating leases of rental properties, motor vehicle fleet and other equipment lease agreements. The nature of expenses related to those leases has now changed because the Group recognised a depreciation charge for the right‑of‑use assets and interest expense on lease liabilities. in additional, the Group will no longer recognise provisions for operating leases that it assesses to be onerous. instead, the Group includes the payments due under the lease in its lease liability.
There was no significant impact on the Group’s finance leases. Minimum lease payments are apportioned between the finance charge and the reduction of the outstanding liability. The finance charge is allocated to each period during the lease term so as to produce a constant periodic rate of interest on the remaining balance of the liability.
(ii) Leases in which the Group is the lessor
The Group is not required to make any adjustments for leases in which it is a lessor.

MaxiTRaNS iNduSTRieS50
Notes to the Consolidated Financial Statements (Cont.)For the year ended 30 June 2020
(iii) Impact on transition
On transition to aaSB16, the Group recognised additional right‑of‑use‑assets and additional lease liabilities, recognising the difference in retained earnings. The impact of the transition is summarised below.
In thousands of dollars 1 July 2019
Right of use asset 42,665
deferred tax asset –
Lease liability 42,655
Retained earnings –
When measuring lease liabilities for leases that were classified as operating leases, the Group discounted lease payments using its incremental borrowing rate at 1 July 2019. The weighted average rate applied is 5.3%, with rates ranging from 3.68% to 5.72% based on tenure of lease as at adoption date.
2. NOTES TO THE STATEMENT OF PROFIT AND LOSS
2a. Revenue
in the following table, revenue from customers (excluding revenue related to discontinued operations) is classified by major products and services lines and primary geographical market for the Groups Reportable segments (see Note 14).
Segment Segment
Trailer Solutions MaxiPARTS
2020 Total
Trailer Solutions MaxiPARTS
2019 Total
Type of Good or Service
Trailer Sales 191,675 – 191,675 222,972 – 222,972
Trailer Repairs and other services 11,537 – 11,537 17,187 – 17,187
Sale of parts – 114,387 114,387 – 112,728 112,728
Total Group Revenue 203,212 114,387 317,599 240,159 112,728 352,887
Geographical Market
australia 186,766 114,387 301,153 223,909 112,728 336,637
New Zealand 16,446 – 16,446 16,250 – 16,250
Total Group Revenue 203,212 114,387 317,599 240,159 112,728 352,887
2b. Employee and Contract labour expenses
Consolidated
2020 $’000
2019 $’000
Employee and contract labour expenses:
employee expenses 78,799 86,405
Contract labour expenses 5,736 11,763
Total employee and contract labour expenses 84,535 98,168

ANNUAL REPORT 2020 51
Notes to the Consolidated Financial Statements (Cont.)For the year ended 30 June 2020
2c. Depreciation & Amortisation, Finance Costs and Other Expenses
The changes in P&L reporting classification due to the adoption of the aaSB16 Leases standard is outlined in the below table.
Consolidated
Note2020
$’0002019
$’000
Depreciation and Amortisation
depreciation 6 2,361 3,116
amortisation Leased assets 6 199 212
amortisation intangible assets 7 1,414 2,205
Lease depreciation 23 c) 6,910 –
Total Depreciation and Amortisation 10,884 5,533
Finance Costs
interest expenses 9 2,106 2,643
Lease interest 23 c) 2,475 –
Total Finance Costs 4,581 2,643
Other Expenses
Other expenses 25,646 24,822
Operating Leases 246 6,984
Total Other Expenses 25,892 31,806
AASB16 Leases Impact to Statement of Profit or Loss (pre‑tax)
Lease depreciation 6,910 –
Lease interest 2,475 –
Lease Payments (8,529) –
Total AASB16 Leases Impact to Statement of Profit or Loss (pre‑tax) 856 –
2d. Other Income
Consolidated
2020 $’000
2019 $’000
JobKeeper allowance 4,941 –
Other income 362 202
Total Other Income 5,303 202
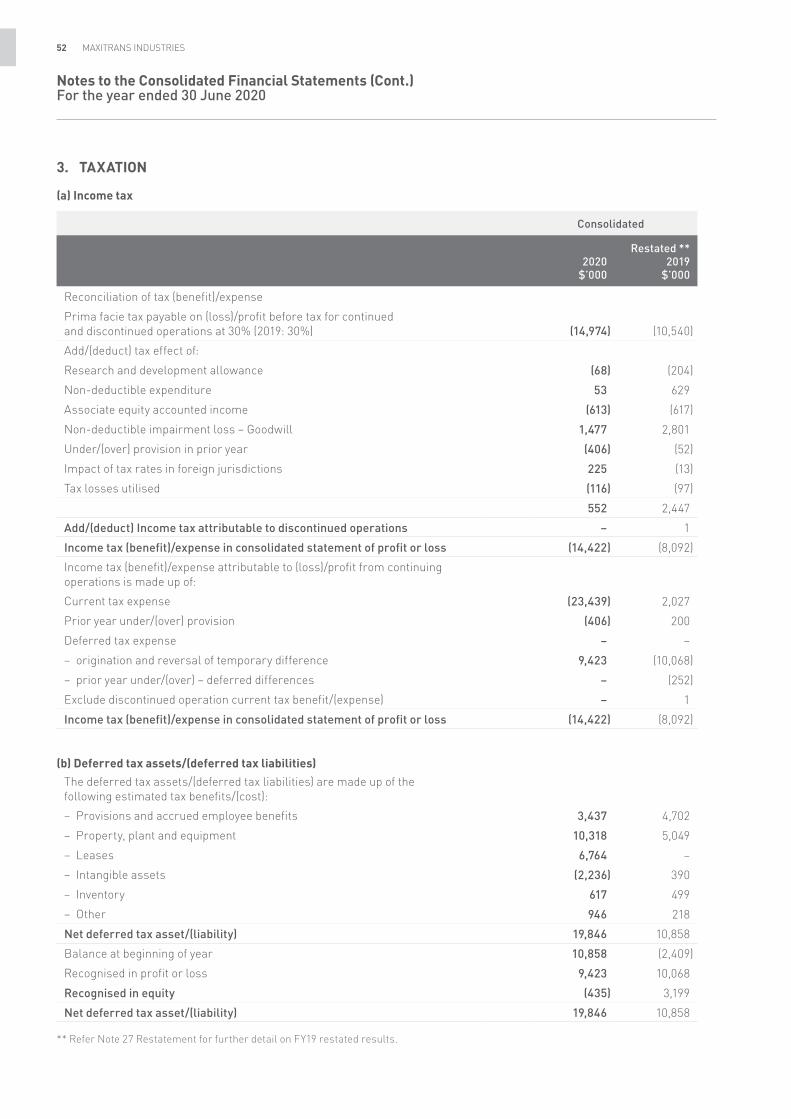
MaxiTRaNS iNduSTRieS52
Notes to the Consolidated Financial Statements (Cont.)For the year ended 30 June 2020
3. TAXATION
(a) Income tax
Consolidated
2020 $’000
Restated ** 2019
$’000
Reconciliation of tax (benefit)/expense
Prima facie tax payable on (loss)/profit before tax for continued and discontinued operations at 30% (2019: 30%) (14,974) (10,540)
add/(deduct) tax effect of:
Research and development allowance (68) (204)
Non‑deductible expenditure 53 629
associate equity accounted income (613) (617)
Non‑deductible impairment loss – Goodwill 1,477 2,801
under/(over) provision in prior year (406) (52)
impact of tax rates in foreign jurisdictions 225 (13)
Tax losses utilised (116) (97)
552 2,447
Add/(deduct) Income tax attributable to discontinued operations – 1
Income tax (benefit)/expense in consolidated statement of profit or loss (14,422) (8,092)
income tax (benefit)/expense attributable to (loss)/profit from continuing operations is made up of:
Current tax expense (23,439) 2,027
Prior year under/(over) provision (406) 200
deferred tax expense – –
– origination and reversal of temporary difference 9,423 (10,068)
– prior year under/(over) – deferred differences – (252)
exclude discontinued operation current tax benefit/(expense) – 1
Income tax (benefit)/expense in consolidated statement of profit or loss (14,422) (8,092)
(b) Deferred tax assets/(deferred tax liabilities)
The deferred tax assets/(deferred tax liabilities) are made up of the following estimated tax benefits/(cost):
– Provisions and accrued employee benefits 3,437 4,702
– Property, plant and equipment 10,318 5,049
– Leases 6,764 –
– intangible assets (2,236) 390
– inventory 617 499
– Other 946 218
Net deferred tax asset/(liability) 19,846 10,858
Balance at beginning of year 10,858 (2,409)
Recognised in profit or loss 9,423 10,068
Recognised in equity (435) 3,199
Net deferred tax asset/(liability) 19,846 10,858
** Refer Note 27 Restatement for further detail on FY19 restated results.

ANNUAL REPORT 2020 53
Notes to the Consolidated Financial Statements (Cont.)For the year ended 30 June 2020
(c) Current tax asset/(liability)
The Group’s current tax asset of $1,954,227 (2019: $768,032) and current tax liability of nil (2019: nil) represents the amount of income taxes receivable/(payable) in respect of current and prior financial periods.
4. TRADE AND OTHER RECEIVABLES
Consolidated 2020 Consolidated 2019
Gross $’000
Impairment $’000
Total $’000
Gross $’000
Impairment $’000
Total $’000
Trade debtors
Not past due 16,264 16,264 26,202 26,202
Past due 0 – 30 days 1,815 (1) 1,814 9,156 (10) 9,146
Past due 31 – 60 days 4,808 (3) 4,805 4,013 (12) 4,001
Past due over 61 days 2,294 (689) 1,605 3,299 (577) 2,722
Trade receivables 25,181 (693) 24,488 42,670 (599) 42,071
Other receivables 2,057 310
Total trade and other receivables 26,545 42,381
5. INVENTORIES
Consolidated
2020 $’000
2019 $’000
Second–hand units – at net realisable value 1,367 1,671
Finished goods – at cost 43,425 40,925
Work in progress – at cost 4,597 4,431
Raw materials – at cost 11,256 14,057
Less: provision for decrease to net realisable value (2,284) (1,817)
Total inventories 58,361 59,267

MaxiTRaNS iNduSTRieS54
Notes to the Consolidated Financial Statements (Cont.)For the year ended 30 June 2020
6. PROPERTY, PLANT AND EQUIPMENT
Consolidated
2020 $’000
2019 $’000
Land and buildings at fair value 25,700 24,300
Total land and buildings 25,700 24,300
Plant and Equipment
Plant and equipment at cost 31,705 43,644
accumulated depreciation and impairment losses (31,135) (30,067)
Subtotal plant and equipment 570 13,577
Office equipment at cost 9,635 11,022
accumulated depreciation and impairment losses (9,477) (8,935)
Subtotal office equipment 158 2,087
Leased property, plant and equipment 1,020 1,501
accumulated depreciation and impairment losses (986) (787)
Subtotal leased property, plant and equipment 34 714
Capital work in progress 3,003 1,002
Total plant and equipment 3,765 17,380
Total property, plant and equipment 29,465 41,680
independent valuations/market assessments were obtained as at 30 June 2020 in relation to all land and buildings held at that time, for use by the directors in assessing land and buildings at fair value. The independent valuations contained market uncertainty clauses given the impacts of COVid‑19. The valuations can be relied upon at 30 June 2020, however a higher level of valuation uncertainty than normal is assumed.
Refer to Note 24(e) for details of security over land and buildings.

ANNUAL REPORT 2020 55
Notes to the Consolidated Financial Statements (Cont.)For the year ended 30 June 2020
Reconciliations
Reconciliations of the carrying amounts for each class of property, plant and equipment are set out below:
2020 $’000
2019 $’000
Land and buildings
Carrying amount at the beginning of the financial year 24,300 46,205
additions – 163
Fair value revaluation 1,476 4,687
disposals – (27,012)
depreciation (76) (362)
Foreign currency movement – 619
Carrying amount at the end of the financial year 25,700 24,300
Plant and equipment
Carrying amount at the beginning of the financial year 13,577 11,021
additions 221 1,195
Transfer to inventories (4,845) (449)
Transfers from capital works in progress 526 5,189
disposals (24) (1,070)
depreciation (1,710) (2,196)
impairment (7,162) –
Foreign currency movement (13) (113)
Carrying amount at the end of the financial year 570 13,577
Office equipment
Carrying amount at the beginning of the financial year 2,087 1,658
additions 103 165
Transfers from capital works in progress 243 815
depreciation (575) (558)
impairment (1,699) –
Foreign currency movement (1) 7
Carrying amount at the end of the financial year 158 2,087
Leased property, plant and equipment
Carrying amount at the beginning of the financial year 714 926
additions – –
Other sundry movements – –
impairment (481) –
amortisation (199) (212)
Carrying amount at the end of the financial year 34 714
Capital works in progress
Carrying amount at the beginning of the financial year 1,002 33,923
additions 2,770 6,344
Transfers to software/intangibles – (33,261)
Transfers to property, plant and equipment (769) (6,004)
Carrying amount at the end of the financial year 3,003 1,002

MaxiTRaNS iNduSTRieS56
Notes to the Consolidated Financial Statements (Cont.)For the year ended 30 June 2020
7. INTANGIBLES
Consolidated
2020 $’000
Restated ** 2019
$’000
Software at cost 40,342 40,077
impairment losses (26,882) (26,882)
accumulated amortisation (1,070) (1,995)
12,390 11,200
Goodwill at cost 21,892 21,892
impairment losses (14,259) (9,336)
7,633 12,556
Brand names at cost 6,930 6,930
impairment losses (5,349) –
accumulated amortisation (691) (691)
890 6,239
intellectual property at cost 22,665 22,665
impairment losses (3,970)
accumulated amortisation (18,043) (17,699)
652 4,966
Patents and trademarks at cost 891 891
accumulated amortisation (891) (891)
Total intangibles 21,565 34,961
Reconciliations
Reconciliations of the carrying amounts for each class of intangible assets are set out below:
Software
Carrying amount at the beginning of the financial year 11,200 766
Transfers from capital work in progress – 33,261
additions 2,260 5,858
impairment losses – (26,882)
amortisation (1,070) (1,803)
Carrying amount at the end of the financial year 12,390 11,200
Goodwill
Carrying amount at the beginning of the financial year 12,556 21,892
impairment losses (4,923) (9,336)
Carrying amount at the end of the financial year 7,633 12,556

ANNUAL REPORT 2020 57
Notes to the Consolidated Financial Statements (Cont.)For the year ended 30 June 2020
Consolidated
2020 $’000
Restated ** 2019
$’000
Brand names
Carrying amount at the beginning of the financial year 6,239 6,239
impairment losses (5,349) –
Carrying amount at the end of the financial year 890 6,239
Intellectual property
Carrying amount at the beginning of the financial year 4,966 5,368
impairment losses (3,970) –
amortisation (344) (402)
Carrying amount at the end of the financial year 652 4,966
Impairment tests for Goodwill and Other Intangibles
as disclosed in the annual Report 2019 and half‑year ended 31 december 2019 accounts, impairment would result from any adverse movement in discount rate or a decline in the underlying business performance (eBiTda) potentially driven by a variety of factors including a softening of the end market for Trailer Solutions. FY20 has seen a decline in the end market for Trailer Solutions and has resulted in an impairment of $44,476 thousand for the year.
The carrying amount of the Trailer Solutions CGu was determined to be higher than its recoverable amount and an impairment loss of $40,747 thousand was recognised. Furthermore, the carrying amount of the group of CGus was determined to be higher than its recoverable amount and an additional impairment loss of $3,730 thousand was recognised.
The impairment loss was allocated as follows:
Impairment Loss ($’000)Trailer
Solutions Parts Corporate Total
Goodwill (1,193) (3,730) – (4,923)
Other Assets
Other intangibles (9,319) – – (9,319)
Property, Plant & equipment (9,341) – – (9,341)
Right of use asset (20,893) – – (20,893)
Total Impairment Loss (40,746) (3,730) – (44,476)
The recoverable amount was based on value in use. Value in use was determined by discounting the future cash flows expected to be generated from the continuing use of the assets. Value in use as at 30 June 2020 was determined similarly to the 30 June 2019 goodwill impairment test and was based on the following key assumptions:
• Most recent forecast projections by key management for FY21 and subsequently reviewed by the Board;
• Growth rates for year 2‑5 of 3.5%, 2.5%, 2.1% and 2.1% (annually) (30 June 2019: 2.1%);
• Terminal growth rate of 2.0% (30 June 2019: 2.0%); and
• Pre‑tax nominal discount rate of 12.3% (30 June 2019: 12.0%).
The values assigned to the key assumptions represent the Group’s assessment of future trends in the industry and are based on historical data from both external sources and internal sources.
Following the impairment loss in the Trailer Solutions CGu, the recoverable amount is equal to the carrying amount. an additional impairment would result from any adverse movement in discount rate or a decline in underlying business performance (eBiTda) potentially driven by a variety of factors including a softening of the end market.
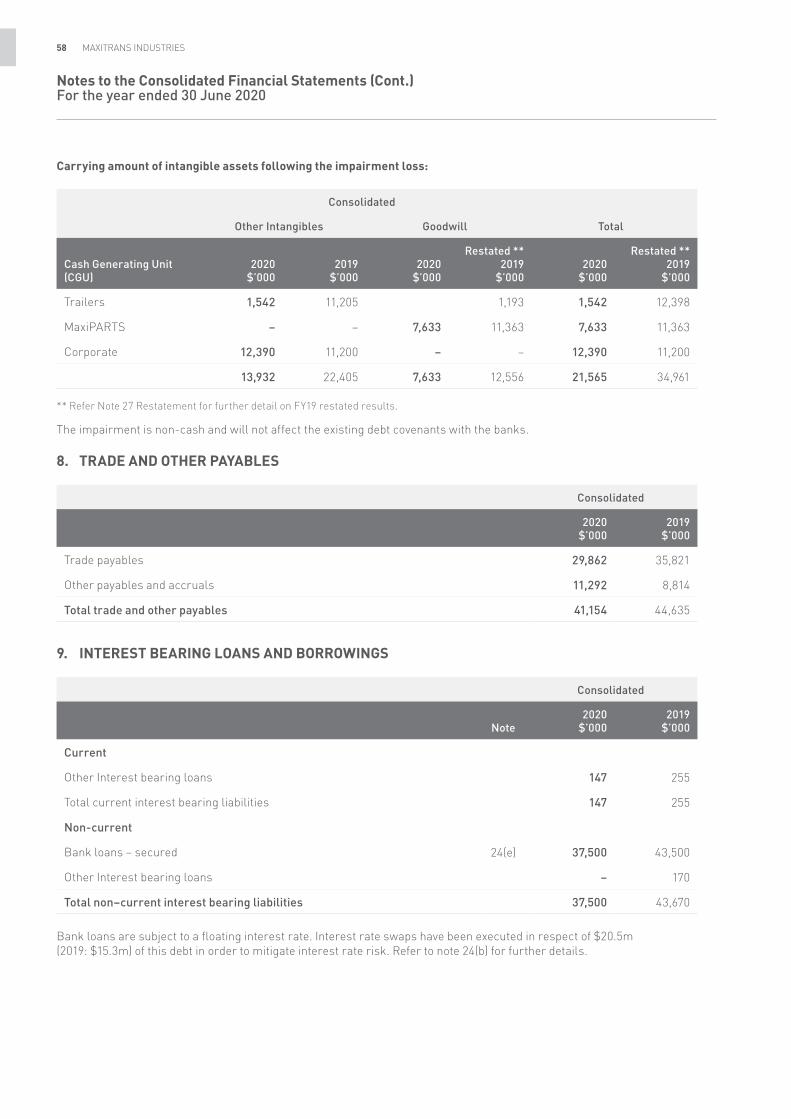
MaxiTRaNS iNduSTRieS58
Notes to the Consolidated Financial Statements (Cont.)For the year ended 30 June 2020
Carrying amount of intangible assets following the impairment loss:
Consolidated
Other Intangibles Goodwill Total
Cash Generating Unit (CGU)
2020 $’000
2019 $’000
2020 $’000
Restated ** 2019
$’0002020
$’000
Restated ** 2019
$’000
Trailers 1,542 11,205 1,193 1,542 12,398
MaxiPaRTS – – 7,633 11,363 7,633 11,363
Corporate 12,390 11,200 – – 12,390 11,200
13,932 22,405 7,633 12,556 21,565 34,961
** Refer Note 27 Restatement for further detail on FY19 restated results.
The impairment is non‑cash and will not affect the existing debt covenants with the banks.
8. TRADE AND OTHER PAYABLES
Consolidated
2020 $’000
2019 $’000
Trade payables 29,862 35,821
Other payables and accruals 11,292 8,814
Total trade and other payables 41,154 44,635
9. INTEREST BEARING LOANS AND BORROWINGS
Consolidated
Note2020
$’0002019
$’000
Current
Other interest bearing loans 147 255
Total current interest bearing liabilities 147 255
Non‑current
Bank loans – secured 24(e) 37,500 43,500
Other interest bearing loans – 170
Total non–current interest bearing liabilities 37,500 43,670
Bank loans are subject to a floating interest rate. interest rate swaps have been executed in respect of $20.5m (2019: $15.3m) of this debt in order to mitigate interest rate risk. Refer to note 24(b) for further details.

ANNUAL REPORT 2020 59
Notes to the Consolidated Financial Statements (Cont.)For the year ended 30 June 2020
Consolidated
2020 $’000
2019 $’000
Finance costs:
– interest on bank loans 2,090 2,565
– Finance lease charges 16 78
Total finance costs 2,106 2,643
10. PROVISIONS
Consolidated
2020 $’000
2019 $’000
Current
employee entitlements 9,425 8,630
Warranty 2,688 2,943
Other – 170
Total current provisions 12,113 11,743
Non‑current
employee entitlements 1,007 1,034
Other – –
Total non‑current provisions 1,007 1,034
Aggregate employee entitlements liability 10,432 9,664
Warranty and other provisions at 30 June 2020 are analysed as follows:
Warranty $’000
Other $’000
Carrying amount at 1 July 2019 2,943 170
Provisions made during the year 4,488 –
Provisions utilised/released during the year (4,734) (170)
Foreign Currency exchange differences (9) –
Carrying amount at 30 June 2020 2,688 –

MaxiTRaNS iNduSTRieS60
Notes to the Consolidated Financial Statements (Cont.)For the year ended 30 June 2020
11. ISSUED CAPITAL
Number of Ordinary
SharesShare Capital
$’000
Balance at 30 June 2019 185,075,653 56,386
Balance at 30 June 2020 185,075,653 56,386
Ordinary shares
Subject to the Constitution of the Company, holders of ordinary shares are entitled to vote as follows:
• every shareholder may vote;
• On a show of hands every shareholder has one vote; and
• On a poll every shareholder has one vote for each fully paid share.
The Company does not have authorised capital or par value in respect of its issued shares.
Subject to the Constitution of the Company, ordinary shares attract the right in a winding up to participate equally in the distribution of the assets of the Company (both capital and surplus), subject only to any amounts unpaid on shares.
12. EARNINGS PER SHARE
Basic earnings per share Consolidated
2020 $’000
2019 $’000
Earnings reconciliation
Net profit attributable to equity holders of the Company (35,492) (27,040)
Basic earnings (35,492) (27,040)
From continuing operations (35,492) (25,470)
From discontinued operations – (1,570)
(35,492) (27,040)
Diluted Earnings (35,492) (27,040)
From continuing operations (35,492) (25,470)
From discontinued operations – (1,570)
(35,492) (27,040)
2020 Number
2019 Number
Weighted average number of shares
Number of ordinary shares for basic earnings Per Share 185,075,653 185,075,653
Number of Ordinary Shares for Diluted earnings per share 185,075,653 185,075,653

ANNUAL REPORT 2020 61
Notes to the Consolidated Financial Statements (Cont.)For the year ended 30 June 2020
13. DIVIDENDSNo dividends were declared or paid during the year and in the prior year comparative.
The Company
Dividend franking account2020
$’0002019
$’000
Franking credits available to shareholders of MaxiTRaNS industries Limited for subsequent financial years 18,971 26,759
14. SEGMENT INFORMATIONit is the Group’s policy that inter–segment pricing is determined on an arm’s length basis. Segment results, assets and liabilities include items directly attributable to a segment as well as those that can be allocated on a reasonable basis. unallocated items mainly comprise interest–bearing loans, borrowings and corporate assets and expenses. Total finance costs of the Group are included in unallocated corporate costs.
The MaxiTrans Group reports on two Cash Generating units (CGu’s): Trailer Solutions and Parts. The Trailer Solutions business manufactures a diverse portfolio of trailers. The trailers are sold through our dealer network, comprising both owned dealerships and licensed dealerships, providing full solution including after sales service and parts to our customers. The Parts business sells trailer and truck parts at both a wholesale and retail level in australia.
Geographical segments
The Group’s external revenues are predominantly derived from customers located within australia. The customer base is sufficiently diverse to ensure the Group is not reliant on any particular customer. The Group’s assets and capital expenditure activities are predominantly located within australia.

MaxiTRaNS iNduSTRieS62
Notes to the Consolidated Financial Statements (Cont.)For the year ended 30 June 2020
Year Ended 30 June 2020
Business Segments
Trailer solutions
$’000MaxiPARTS
$’000
Corporate/eliminations
$’000
Total continuing
activities $’000
Discontinued operation
$’000Total
$’000
Revenue
external segment revenue 203,212 114,387 – 317,599 – 317,599
inter‑segment revenue 2,250 16,435 (18,685) – – –
Total segment revenue 205,462 130,822 (18,685) 317,599 – 317,599
Total Revenue 205,462 130,822 (18,685) 317,599 – 317,599
Segment Result
Segment (loss)/earnings pre associate, interest and significant items (2,074) 9,133 (5,305) 1,754 – 1,754
Share of net profit of equity accounted investments 2,042 – – 2,042 – 2,042
interest income – – 44 44 – 44
interest expense (1,307) (1,233) (2,041) (4,581) – (4,581)
Segment net (loss)/profit before tax (Excluding significant items) (1,339) 7,900 (7,302) (741) – (741)
Significant items, before tax
eRP system implementation expenses – – (50) (50) – (50)
impairment loss – Goodwill (1,193) (3,730) – (4,923) – (4,923)
impairment loss – Other non‑financial assets (39,553) – – (39,553) – (39,553)
Redundancy costs (1,536) (130) (102) (1,768) – (1,768)
acquisition/disposal/Transaction/Litigation costs (173) – (2,706) (2,879) – (2,879)
Segment net profit before tax (Including significant items) (43,794) 4,040 (10,160) (49,914) – (49,914)
income tax benefit – – 14,422 14,422 – 14,422
Net profit after tax (43,794) 4,040 4,262 (35,492) – (35,492)
depreciation and amortisation 5,505 4,048 1,331 10,884 – 10,884
Total Depreciation and amortisation 5,505 4,048 1,331 10,884 – 10,884
Assets
Segment assets 94,883 68,217 – 163,100 – 163,100
unallocated corporate assets – – 58,442 58,442 – 58,442
Consolidated total assets 94,883 68,217 58,442 221,542 – 221,542
Liabilities
Segment liabilities 64,428 33,497 – 97,925 – 97,925
unallocated corporate liabilities – – 45,536 45,536 – 45,536
Consolidated total liabilities 64,428 33,497 45,536 143,461 – 143,461
Capital expenditure 2,615 96 – 2,711 – 2,711
unallocated capital expenditure – – 384 384 – 384
Total capital expenditure 2,615 96 384 3,095 – 3,095
1. Trailer Solutions – Segment (loss)/earnings pre associate, interest and significant includes $4,941k in JobKeeper support from the australian government and $315k in Wage Subsidy from the New Zealand government

ANNUAL REPORT 2020 63
Notes to the Consolidated Financial Statements (Cont.)For the year ended 30 June 2020
Year Ended 30 June 2019 (Restated **)
Business Segments
Trailer solutions
$’000MaxiPARTS
$’000
Corporate/eliminations
$’000
Total continuing
activities $’000
Discontinued operation
$’000Total
$’000
Revenue
external segment revenue 240,159 112,728 – 352,887 5,435 358,322
inter‑segment revenue 344 20,746 (21,698) (608) 608 –
Total segment revenue 240,503 133,474 (21,698) 352,279 6,043 358,322
Total Revenue 240,503 133,474 (21,698) 352,279 6,043 358,322
Segment Result
Segment earnings pre associate, interest and significant items 3,937 7,953 (5,663) 6,227 (52) 6,175
Share of net profit of equity accounted investments 2,058 – – 2,058 – 2,058
interest income – – 48 48 – 48
interest expense – – (2,643) (2,643) 49 (2,594)
Segment net profit before tax (Excluding significant items) 5,995 7,953 (8,258) 5,690 (3) 5,687
Significant items, before tax
Gain/(loss) on disposal of subsidiary – – – – (1,568) (1,568)
eRP system implementation expenses* – – (1,860) (1,860) – (1,860)
impairment – Goodwill (4,000) (5,336) – (9,336) – (9,336)
impairment – intangible software – – (26,882) (26,882) – (26,882)
Redundancy costs (39) – (381) (420) – (420)
acquisition/disposal/Transaction costs (226) – (528) (754) – (754)
Segment net profit before tax (Excluding significant items) 1,730 2,617 (37,909) (33,562) (1,571) (35,133)
income tax expense – – 8,092 8,092 1 8,093
Net profit after tax 1,730 2,617 (29,817) (25,470) (1,570) (27,040)
depreciation and amortisation 2,870 700 1,963 5,533 245 5,778
Total Depreciation and amortisation 2,870 700 1,963 5,533 245 5,778
Assets
Segment assets 108,485 51,554 – 160,039 – 160,039
unallocated corporate assets – – 47,601 47,601 – 47,601
Consolidated total assets 108,485 51,554 47,601 207,640 – 207,640
Liabilities
Segment liabilities 32,568 16,595 – 49,163 – 49,163
unallocated corporate liabilities – – 55,307 55,307 – 55,307
Consolidated total liabilities 32,568 16,595 55,307 104,470 – 104,470
Capital expenditure 7,275 160 – 7,435 – 7,435
unallocated capital expenditure – – 432 432 – 432
Total capital expenditure 7,275 160 432 7,867 – 7,867
** Refer Note 27 Restatement for further detail on FY19 restated results.

MaxiTRaNS iNduSTRieS64
Notes to the Consolidated Financial Statements (Cont.)For the year ended 30 June 2020
15. SHARE BASED PAYMENTSOn 15 October 2010, the Group established the MaxiTRaNS Performance Rights Plan (‘PRP’) that entitles executive directors and senior management to receive a specified number of Performance Rights (‘PRs’) which upon vesting can be converted into a specified number of ordinary shares in the Company.
The terms and conditions relating to PRs currently on issue are as follows:
Period1 July 2019 – 30 June 2022
1 July 2018 – 30 June 2021
1 July 2017 – 30 June 2020
Grant date 25 Oct 2019 19 Oct 18 30 Sep 17
Total PRs issued 3,033,099 2,240,646 1,819,520
Total PRs forfeited – 807,413 1,819,520
Total PRs remaining on issue 3,033,099 1,433,233 –
Base Return on invested Capital (ROiC) 4.29% 5.69% 5.47%
Target ROiC 6.95% 8.32% 7.95%
Percentage increase in base ROiC required 62.0% 43.9% 45.3%
Minimum ROiC target that must be achieved for Performance Rights to vest 6.55% 7.68% 7.30%
Minimum service requirement 3 years from grant date
3 years from grant date
3 years from grant date
Details of PRs exercised1 July 2019 – 30 June 2022
1 July 2018 – 30 June 2021
1 July 2017 – 30 June 2020
Total PRs issued 3,033,099 2,240,646 1,819,520
Total PRs forfeited – 807,413 1,819,520
Total PRs exercised – – –
Measurement of fair value
The fair value of PRs is calculated at the date of grant by an independent external valuer, Grant Thornton, using the Monte Carlo simulation model and allocated to each reporting period evenly over the period from grant date to vesting date. expected volatility is estimated by considering historic average share price volatility.
PRs are granted under a service condition and, for grants to key management personnel, non–market performance conditions. Non–market performance conditions are not taken into account in the grant date fair value measurement of the services received.
The inputs used in the measurement of the fair values at grant date of the PRs on issue are as follows:
2020 2019 2018
Fair value at grant date 21.88¢ 43.91¢ 58.79¢
Share price at grant date 22.00¢ 52.00¢ 67.00¢
expected volatility 55.00% 40.00% 50.00%
expected dividend yield 0.00% 5.00% 6.50%
Risk–free rate of return 0.71% 2.06% 2.00%
Expense/(income) recognised in profit and loss2020
$’0002019
$’0002018
$’000
Share based payments expense recognised 168 255 352
Share based payments reversed (19) (517) (330)
Total share based payment expense/(income) recognised as employee costs 149 (262) 22

ANNUAL REPORT 2020 65
Notes to the Consolidated Financial Statements (Cont.)For the year ended 30 June 2020
16. RELATED PARTY DISCLOSURES
(a) Director and other key management personnel disclosures
Key management personnel have authority and responsibility for planning, directing and controlling the activities of the Group. Key management personnel comprise the directors of the Company and executives for the Group.
The following were key management personnel of the Group at any time during the reporting period and unless otherwise indicated were key management personnel for the entire period:
Non‑Executive Directors
– Mr J Curtis (deputy Chairman)
– Mr R Wylie (Chairman)
– Mr J Rizzo
– Ms S Hogg
– Ms M Verschuer
Executive directors
– Mr d Jenkins (Managing director)
Executives
– Mr T Bradfield (Chief Financial Officer) – appointed 6 March 2019
– Mr P Loimaranta (General Manager – MaxiPaRTS and New Zealand)
– Mr T Negus (General Manager – Manufacturing)
– Mr a McKenzie (Group General Manager – Sales and Marketing) – position made redundant 20 december 2019
– Mr J O’Brien (General Manager – MaxiParts) – resigned 2 august 2019
(b) Directors’ transactions in shares
directors and their related entities acquired 720,837 (2019: 203,000) existing ordinary shares in MaxiTRaNS industries Limited during the year.
(c) Director and other key management personnel transactions
apart from the details disclosed in this note, no key management personnel have entered into a material contract with the Company or the Group since the end of the previous financial year and there were no material contracts involving directors’ interests existing at year end.
(d) Transactions with associate
during the year the Group derived revenue from the associate of $28,510,370 (2019: $38,296,867) for the sale of new units, parts and the provisions of services. amounts receivable from the associate at year‑end total $597,605 (2019: $2,734,456).
during the year the Group paid for services and parts from the associate totalling $13,371,439 (2019: $2,422,069). amounts owing at year‑end total $646,507 (2019: $117,789).
all dealings were in the ordinary course of business and on normal commercial terms and conditions.
(e) Key management personnel remuneration
The key management personnel remuneration (see Remuneration Report) is as follows:
Consolidated
2020 2019
Short–term employee benefits 2,651,584 3,188,415
Post–employment benefits 239,991 296,618
Share based payment benefits/(expense) 126,086 (114,446)
3,017,661 3,370,587

MaxiTRaNS iNduSTRieS66
Notes to the Consolidated Financial Statements (Cont.)For the year ended 30 June 2020
17. PARENT ENTITYas at 30 June 2020 and throughout the financial year ending on that date, the parent company of the Group was MaxiTRaNS industries Limited.
Consolidated
2020 $’000
2019 $’000
Results of the parent company
Profit/(loss) for the year 976 (24,791)
Total comprehensive income 976 (24,791)
Financial position of the parent company
Current assets 17,843 38,445
Total assets 75,188 79,618
Current liabilities 1,845 1,400
Total liabilities 39,345 44,900
Net assets 35,843 34,718
Total equity of the parent company comprising of:
issued capital 56,385 56,385
Reserves 496 352
Retained earnings (21,038) (22,019)
Total equity 35,843 34,718
investments in subsidiaries and joint ventures are carried at historical cost in the parent company less, where applicable, any impairment charge.
Parent company contingencies
at any given point in time, the parent company may be engaged in defending legal actions brought against it. The directors are not aware of any such actions that would give rise to a material contingent liability to the parent company.

ANNUAL REPORT 2020 67
Notes to the Consolidated Financial Statements (Cont.)For the year ended 30 June 2020
18. CONTROLLED ENTITIES
Interest Held
MaxiTRANS Industries LimitedCountry
of IncorpClass
of Shares2020
%2019
%
Controlled entities of MaxiTRaNS industries Limited:
MaxiTRaNS australia Pty Ltd aust. Ord. 100 100
– Transport Connection Pty Ltd aust. Ord. 100 100
– MaxiTRaNS Services Pty Ltd aust. Ord. 100 100
Transtech Research Pty Ltd aust. Ord. 100 100
Trail Truck Parts Pty Ltd (i) aust. Ord. 100 100
MaxiTRaNS industries (N.Z.) Pty Ltd aust. Ord. 100 100
Peki Pty Ltd (i) aust. Ord. 100 100
ultraparts Pty Ltd (i) aust. Ord. 100 100
MaxiTRaNS Finance Pty Ltd (i) aust. Ord. 100 100
Lusty eMS Pty Ltd aust. Ord. 100 100
Hamelex White Pty Ltd (i) aust. Ord. 100 100
MaxiPaRTS Pty Ltd (formerly Colrain Pty Ltd) aust. Ord. 100 100
– Colrain Queensland Pty Ltd aust. Ord. 100 100
– Colrain (albury) Pty Ltd aust. Ord. 100 100
– Queensland diesel Spares Pty Ltd (formerly Colrain (Ballarat) Pty Ltd) (i) aust. Ord. 100 100
– Colrain Pty Ltd (formerly Colrain (Geelong) Pty Ltd) (i) aust. Ord. 100 100
– MaxiPaRTS (Qld) Pty Ltd (formerly Queensland diesel Spares Pty Ltd) aust. Ord. 100 100
MaxiTRaNS employee Share Plan Pty Ltd aust. Ord. 100 100
MaxiTRaNS (China) Limited (i) Hong Kong Ord. 100 100
(i) dormant entity
19. DEED OF CROSS GUARANTEEThe Company, together with its subsidiaries, MaxiTRaNS australia Pty Ltd, Transtech Research Pty Ltd, Lusty eMS Pty Ltd, Peki Pty Ltd, MaxiTRaNS industries (N.Z.) Pty Ltd, MaxiPaRTS Pty Ltd (effective 1 September 2008, previously ineligible) and Queensland diesel Spares Pty Ltd (effective 22 June 2012, previously ineligible) each of which are incorporated in australia, entered into a “deed of Cross Guarantee” so as to seek the benefit of the accounting and audit relief available under Class Order (2016/785) made by the australian Securities & investments Commission which was granted on 30 June 2006.

MaxiTRaNS iNduSTRieS68
Notes to the Consolidated Financial Statements (Cont.)For the year ended 30 June 2020
a consolidated statement of comprehensive income and consolidated balance sheet, comprising the Company and controlled entities which are party to the deed, after eliminating all transactions between parties to the deed of Cross Guarantee, for the year ended 30 June 2020 is set out as follows:
Consolidated statement of comprehensive income
2020 $’000
Restated ** 2019
$’000
Total revenue 294,373 325,137
Changes in inventories of finished goods and work in progress 2,793 6,270
Raw materials and consumables used (183,025) (193,104)
Other income 5,347 250
employee expenses (82,286) (96,063)
Warranty expenses (4,488) (3,015)
depreciation and amortisation expenses (10,721) (5,514)
Finance costs (4,550) (2,643)
Other expenses (25,573) (31,189)
impairment loss (43,014) (36,219)
Share of net profits of joint ventures accounted for using the equity method 2,042 2,058
(Loss)/Profit before income tax (49,102) (34,032)
income tax benefit 14,422 8,092
Loss for the year (34,680) (25,940)
Other comprehensive income
Items that may subsequently be re‑classified to profit or loss:
Net exchange difference on translation of financial statements of foreign operations (140) 973
Cashflow hedge reserve 28 (342)
Items that will never be reclassified to profit or loss:
Revaluation of land and buildings 1,476 12,690
Related tax (443) (3,807)
Other comprehensive income/(loss) for the year, net of tax 921 9,514
Total comprehensive income for the year (33,759) (16,426)
Profit attributable to:
equity holders of the Company (34,680) (25,940)
Total comprehensive income attributable to: equity holders of the Company (33,759) (16,426)
** Refer Note 27 Restatement for further detail on FY19 restated results.

ANNUAL REPORT 2020 69
Notes to the Consolidated Financial Statements (Cont.)For the year ended 30 June 2020
Consolidated statement of financial position
Consolidated
2020 $’000
Restated ** 2019
$’000
Current Assets
Cash and cash equivalents 25,523 11,925
Trade and other receivables 22,011 38,520
inventories 57,141 57,673
Current tax assets 1,954 768
Other 1,898 3,801
Total Current Assets 108,527 112,687
Non‑Current Assets
investment in joint venture 11,154 11,356
investments in controlled entities 2,903 2,903
Property, plant and equipment 29,441 41,523
intangible assets 21,565 33,383
Right of use asset 24,995 –
deferred tax assets 19,846 10,858
Total Non‑Current Assets 109,904 100,023
Total Assets 218,431 212,710
Current Liabilities
Trade and other payables 44,902 45,050
interest bearing loans and borrowings 147 255
Current tax liability – –
Provisions 11,842 11,558
Lease liability 5,833 –
Total Current Liabilities 62,724 56,863
Non‑Current Liabilities
interest bearing loans and borrowings 37,500 43,670
deferred tax liabilities – –
Provisions 1,007 1,034
Lease liability 39,670 –
Total Non‑Current Liabilities 78,177 44,704
Total Liabilities 140,901 101,567
Net Assets 77,530 111,143
Equity
issued capital 56,386 56,386
Reserves 16,348 15,278
Retained profits 4,796 39,479
Total Equity 77,530 111,143
** Refer Note 27 Restatement for further detail on FY19 restated results.

MaxiTRaNS iNduSTRieS70
Notes to the Consolidated Financial Statements (Cont.)For the year ended 30 June 2020
20. INVESTMENT IN ASSOCIATES AND JOINT VENTURES
Ownership
Name of Entity Principal Activity2020
%2019
%
Trailer Sales Pty Ltd Trailer retailer. Repairs and service provider. Sale of spare parts within australia, which is the country of incorporation.
investment in associate
36.67 36.67
australasian Machinery Sales Pty Ltd
Manufacturer and supplier of live bottom trailers.
Joint Venture80.00 80.00
$’000Revenues
(100%)
Net Profit after Tax
100%
Share of Associate
Profit Recognised Total Assets
Total Liabilities
Net Assets as Reported by
Associate
2020 80,838 4,434 2,042 27,470 13,851 13,619
2019 71,004 4,762 2,058 26,967 12,914 14,053
Trailer Sales Pty Ltd
$’000
Australasian Machinery
Sales Pty Ltd $’000
Total $’000
interest in associate at 1 July 2019 4,902 6,454 11,356
Share of associate profit recognised 1,241 801 2,042
dividends received (2,244) – (2,244)
Interest in associate at 30 June 2020 3,899 7,255 11,154
Commitments
The share of the associate’s capital commitments contracted but not provided for or payable within one year was $nil at 30 June 2020 (2019: $nil).

ANNUAL REPORT 2020 71
Notes to the Consolidated Financial Statements (Cont.)For the year ended 30 June 2020
21. NOTE TO THE CONSOLIDATED STATEMENT OF CASH FLOWS
Consolidated
2020 $’000
2019 $’000
(Loss)/Profit for the year (35,492) (27,040)
Non‑cash items in operating profit
depreciation and amortisation of assets 10,884 5,533
Gain on sale of property, plant and equipment (35) (1,748)
aaSB16 Lease interest 2,475 –
disposal of discontinued operation – 1,568
impairment loss on intangibles assets 44,476 36,218
Share of net profits of associates accounted for using the equity method (2,042) (2,058)
Share based payments expense 149 (262)
Change in assets and liabilities
(increase)/decrease in receivables 15,836 (2,725)
(increase)/decrease in other assets 1,883 (1,442)
(increase)/decrease in inventories 5,751 (1,034)
increase/(decrease) in trade payables and other liabilities (2,126) (3,915)
increase/(decrease) in current tax assets (1,186) 1,283
increase/(decrease) in deferred taxes (9,431) (9,120)
increase/(decrease) in provisions 245 (1,356)
Net cash (used in)/provided by operating activities 31,387 (6,098)
22. CAPITAL AND LEASING COMMITMENTS
(a) Right‑of‑use assets
Consolidated
Land and buildings
$’000Other assets
$’000Total
$’000
Balance at 1 July 2019 – – –
additions on transition 41,027 1,638 42,665
additions during the year 1,833 8,536 10,369
impairment (14,783) (6,110) (20,893)
depreciation charge for the year (5,232) (1,678) (6,910)
Total right‑of‑use assets 22,845 2,386 25,231

MaxiTRaNS iNduSTRieS72
Notes to the Consolidated Financial Statements (Cont.)For the year ended 30 June 2020
(b) Lease liabilities
Consolidated
Total $’000
Balance at 1 July 2019 –
additions on transition 42,665
additions during the year 10,439
interest expense 2,475
Payments (8,529)
Total lease liabilities 47,050
ReconciliationTotal
$’000
Operating lease commitments at 30 June 2019 36,827
Change in lease terms 22,546
items not previously considered as leases 1,703
Gross lease liability at 1 July 2019 61,076
Weighted average incremental borrowing rate at 1 July 2019 5.26%
discounting (18,411)
Lease liability at 1 July 2019 42,665
(c) Amounts recognised in profit or loss
Consolidated
2020 $’000
2019 $’000
depreciation expense of right‑of‑use assets 6,910 –
impairment of right‑of‑use assets 20,893 –
interest expense on lease liabilities 2,475 –
Rent expense – low value assets 30 –
COVid‑19 rent concessions (145) –
Total 30,164 –
(d) Operating lease commitments
Consolidated
2020 $’000
2019 $’000
Future operating lease rentals not provided for in the financial statements and payable:
– not later than 1 year – 6,232
– later than 1 year but not later than 5 years – 12,855
– later than 5 years – 17,740
Total operating lease commitments – 36,827

ANNUAL REPORT 2020 73
Notes to the Consolidated Financial Statements (Cont.)For the year ended 30 June 2020
(e) Capital expenditure commitments
Consolidated
2020 $’000
2019 $’000
Payable
– not later than 1 year 4,637 7,028
– later than 1 year but not later than 5 years – –
Total capital expenditure commitments 4,637 7,028
23. CONTINGENT LIABILITIESat any given point in time the Group may be engaged in defending legal actions brought against it. in the opinion of the directors such actions are not expected to have a material effect on the Group’s financial position.
24. FINANCIAL INSTRUMENTS
(a) Risk management framework/policies
The Group’s key activities include the design, manufacture, sale, service and repair of transport equipment and related component and spare parts. These activities expose the Group to a variety of financial risks, including liquidity risk, credit risk and market risk such as currency and interest rate risk.
The Group’s financial risk management program seeks to minimise the potential adverse effects of the unpredictability of financial markets on the financial performance of the Group by utilising derivative financial instruments for purchase of supplies and raw materials. The Group measures risk exposure through sensitivity analysis in the case of currency risk, cash flow forecasting and ageing analysis for credit risk.
(b) Interest rate risk
The Group is exposed to interest rate risk as it borrows at both fixed and floating interest rates. The risk is managed by the use of fixed interest rate contracts. Hedging activities are evaluated regularly to align with interest rate views and defined risk appetite, ensuring optimal hedging strategies are applied, by either positioning the statement of financial performance or protecting interest rate expense through different interest rate cycles.
as at reporting date the interest rate profile of the Group’s interest‑bearing financial instruments were:
Consolidated
2020 $’000
2019 $’000
Borrowings – fixed rate 13,897 15,255
Borrowings – floating rate 23,750 28,670
37,647 43,925
as at reporting date, if interest rates on borrowings had moved as illustrated in the table below, with all other variables held constant, post tax profit for the year would have been affected as follows:
2020 $’000
2019 $’000
100bp increase (166) (201)
100bp decrease 166 201

MaxiTRaNS iNduSTRieS74
Notes to the Consolidated Financial Statements (Cont.)For the year ended 30 June 2020
(c) Currency risk
The Group is exposed to foreign currency risk on purchases that are denominated in foreign currency, primarily united States dollars. derivative financial instruments (forward exchange contracts) are used by the Group to economically hedge exposure to exchange rate risk associated with foreign currency transactions.
Forward exchange contracts
The following table summarises the uS dollar forward exchange contracts outstanding as at the reporting date:
Average Exchange Rate Foreign Currency Contract Value Fair Value
2020 $’000
2019 $’000
2020 $’000
2019 $’000
2020 $’000
2019 $’000
2020 $’000
2019 $’000
Buy uSd dollar 0.6681 0.7020 4,958 5,038 7,420 7,177 (188) (12)
as at reporting date, if the australian dollar had moved against the uS dollar currency as illustrated in the table below, with all other variables held constant, post tax profit for the year would have been affected as follows:
Consolidated
2020 $’000
2019 $’000
uSd 10.0 cents increase (676) (626)
uSd 10.0 cents decrease 676 626
(d) Credit risk
Credit risk refers to the risk that a counterparty will default on its contractual obligations resulting in financial loss to the Group. The Group is exposed to credit risk from its operating activities, primarily from trade and other receivables and financing activities, including deposits with financial institutions. The carrying amount of these financial assets at year‑end represented the Group’s maximum exposure to credit risk. The Group has a policy of only dealing with credit worthy counterparties and obtaining sufficient security where appropriate, as a means of mitigating the risk of financial losses from defaults. The Group does not have any significant credit risk exposure to any single counter party. The majority of accounts receivable are due from entities within the transport industry.
Guarantees
Performance guarantees of $3,629,950 (2019: $2,625,945) are held by Commonwealth Bank of australia.
(e) Liquidity risk
Liquidity risk is the risk that the Group will not be able to meet its financial obligations as they fall due. The Group’s liquidity management policies include Board approval of all changes to debt facilities including the terms of fixed rate debt as well as robust management practices in short and long term cashflow management.
The Group has focused on reducing debt over the last financial year, which has seen a reduction in net debt (total borrowings less cash on hand) of $19,876k to a net debt position of $12,124k (2019: $32,000k). The net debt reduction has resulted from a combination of cost saving initiatives, working capital improvements and constrained CaPex capital expenditure.

ANNUAL REPORT 2020 75
Notes to the Consolidated Financial Statements (Cont.)For the year ended 30 June 2020
The following table summarises the maturities of the Group’s financial liabilities based on the remaining earliest contractual maturities, excluding net interest payable on borrowings:
30 June 2020 – Consolidated
Carrying Amount
$’000
6 months or Less
$’000
6–12 Months
$’000
1–2 Years $’000
2–5 Years $’000
5+ Years $’000
Trade and other payables and accruals (41,154) (41,154) – – – –
Borrowings (37,647) (147) – (37,500) – –
Lease Liability (47,050) (3,839) (3,522) (6,482) (15,002) (18,205)
Effect of derivative instruments
Forward exchange contracts
– inflow 7,779 7,779 – – – –
– outflow (7,589) (7,589) – – – –
(125,661) (44,950) (3,522) (43,982) (15,002) (18,205)
30 June 2019 – Consolidated
Carrying Amount
$’000
6 months or Less
$’000
6–12 Months
$’000
1–2 Years $’000
2–5 Years $’000
Trade and other payables and accruals (44,635) (44,635) – – –
Borrowings (43,925) (255) – (170) (43,500)
Effect of derivative instruments
Forward exchange contracts
– inflow 8,877 7,527 1,350 – –
– outflow (8,889) (7,515) (1,374) – –
(88,572) (44,878) (24) (170) (43,500)
Finance facilities
at year end, the Group had the following financing facilities in place with its bankers:
Facility Amount Utilised Available
Consolidated2020
$’0002019
$’0002020
$’0002019
$’0002020
$’0002019
$’000
Loan facility 43,750 51,750 37,500 43,500 6,250 8,250
Overdraft facility 4,500 5,000 – – 4,500 5,000
Multi‑option facility 5,500 5,000 3,630 2,626 1,870 2,374
53,750 61,750 41,130 46,126 12,620 15,624
On 29 June 2017, the Group refinanced its financing facilities. Commonwealth Bank of australia and HSBC Bank are the Group’s new banking partners.
The loan, overdraft and other facilities are fully secured by a registered mortgage over certain land and buildings of the controlled entities with a fair value of $25.70m as at 30 June 2020.
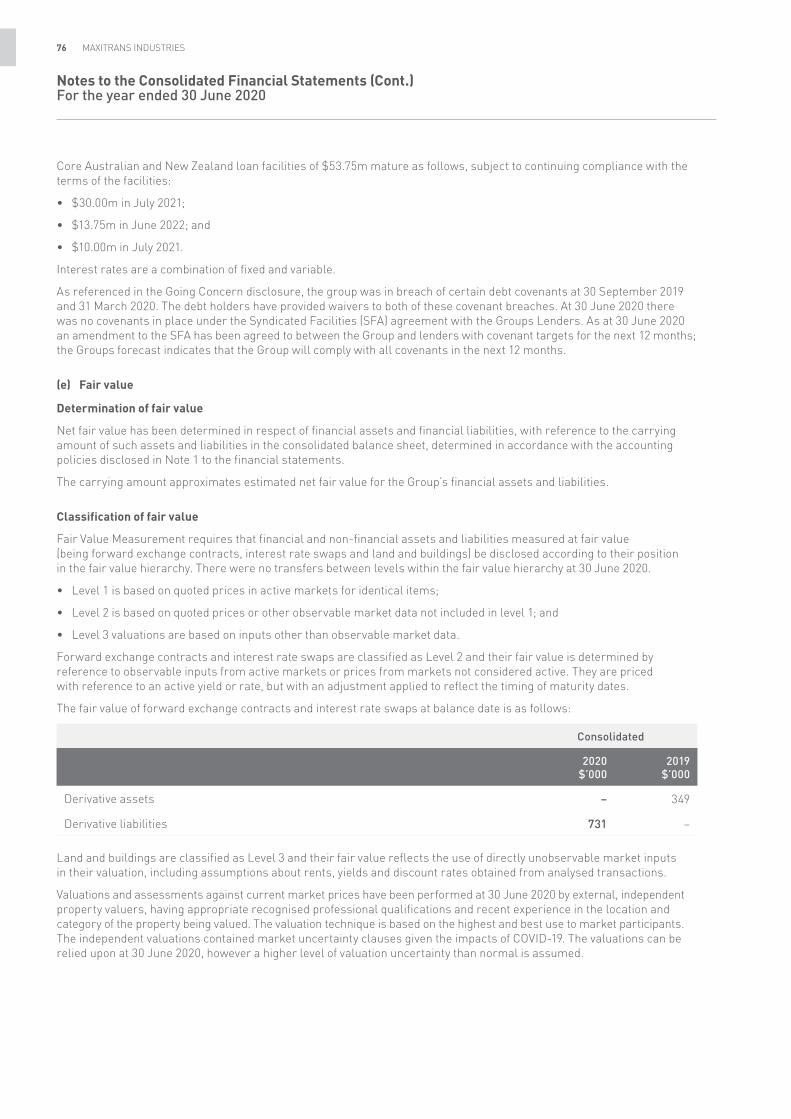
MaxiTRaNS iNduSTRieS76
Notes to the Consolidated Financial Statements (Cont.)For the year ended 30 June 2020
Core australian and New Zealand loan facilities of $53.75m mature as follows, subject to continuing compliance with the terms of the facilities:
• $30.00m in July 2021;
• $13.75m in June 2022; and
• $10.00m in July 2021.
interest rates are a combination of fixed and variable.
as referenced in the Going Concern disclosure, the group was in breach of certain debt covenants at 30 September 2019 and 31 March 2020. The debt holders have provided waivers to both of these covenant breaches. at 30 June 2020 there was no covenants in place under the Syndicated Facilities (SFa) agreement with the Groups Lenders. as at 30 June 2020 an amendment to the SFa has been agreed to between the Group and lenders with covenant targets for the next 12 months; the Groups forecast indicates that the Group will comply with all covenants in the next 12 months.
(e) Fair value
Determination of fair value
Net fair value has been determined in respect of financial assets and financial liabilities, with reference to the carrying amount of such assets and liabilities in the consolidated balance sheet, determined in accordance with the accounting policies disclosed in Note 1 to the financial statements.
The carrying amount approximates estimated net fair value for the Group’s financial assets and liabilities.
Classification of fair value
Fair Value Measurement requires that financial and non‑financial assets and liabilities measured at fair value (being forward exchange contracts, interest rate swaps and land and buildings) be disclosed according to their position in the fair value hierarchy. There were no transfers between levels within the fair value hierarchy at 30 June 2020.
• Level 1 is based on quoted prices in active markets for identical items;
• Level 2 is based on quoted prices or other observable market data not included in level 1; and
• Level 3 valuations are based on inputs other than observable market data.
Forward exchange contracts and interest rate swaps are classified as Level 2 and their fair value is determined by reference to observable inputs from active markets or prices from markets not considered active. They are priced with reference to an active yield or rate, but with an adjustment applied to reflect the timing of maturity dates.
The fair value of forward exchange contracts and interest rate swaps at balance date is as follows:
Consolidated
2020 $’000
2019 $’000
derivative assets – 349
derivative liabilities 731 –
Land and buildings are classified as Level 3 and their fair value reflects the use of directly unobservable market inputs in their valuation, including assumptions about rents, yields and discount rates obtained from analysed transactions.
Valuations and assessments against current market prices have been performed at 30 June 2020 by external, independent property valuers, having appropriate recognised professional qualifications and recent experience in the location and category of the property being valued. The valuation technique is based on the highest and best use to market participants. The independent valuations contained market uncertainty clauses given the impacts of COVid‑19. The valuations can be relied upon at 30 June 2020, however a higher level of valuation uncertainty than normal is assumed.

ANNUAL REPORT 2020 77
Notes to the Consolidated Financial Statements (Cont.)For the year ended 30 June 2020
The following table present changes in the fair value of land and buildings during FY20, including changes to the unobservable inputs:
Consolidated Land and Buildings
Opening balance as at 1 July 2019 24,300
Fair value revaluation 1,476
additions –
disposals –
depreciation recognised in the statement of profit and loss (76)
exchange rate variance –
Closing balance as at 30 June 2020 25,700
25. REMUNERATION OF AUDITOR
Consolidated
Remuneration of auditor2020
$2019
$
KPMG Australia:
– auditing and reviewing the financial statements 467,827 456,212
– other services (taxation and advisory) 136,070 18,836
603,897 475,048
Overseas KPMG Firms:
– auditing and reviewing financial statements 42,084 53,940
– other services (taxation and advisory) 10,625 10,015
52,709 63,955
Total auditor remuneration 656,606 539,003
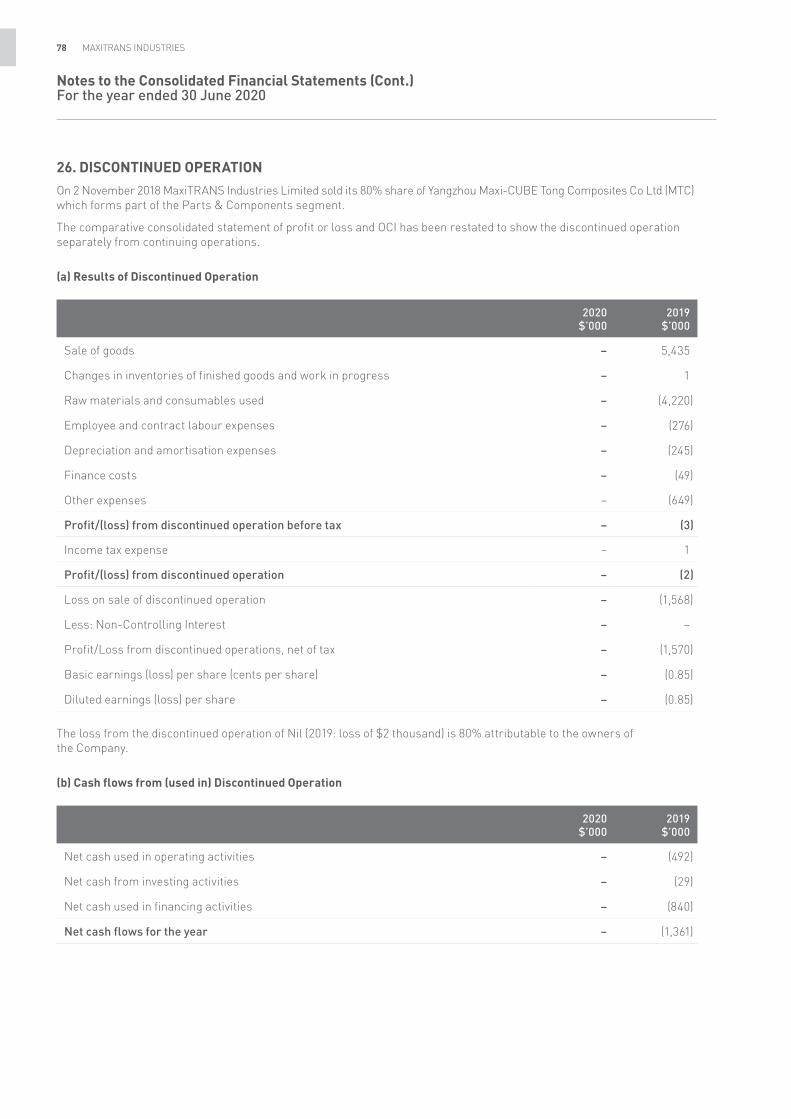
MaxiTRaNS iNduSTRieS78
Notes to the Consolidated Financial Statements (Cont.)For the year ended 30 June 2020
26. DISCONTINUED OPERATIONOn 2 November 2018 MaxiTRaNS industries Limited sold its 80% share of Yangzhou Maxi‑CuBe Tong Composites Co Ltd (MTC) which forms part of the Parts & Components segment.
The comparative consolidated statement of profit or loss and OCi has been restated to show the discontinued operation separately from continuing operations.
(a) Results of Discontinued Operation
2020 $’000
2019 $’000
Sale of goods – 5,435
Changes in inventories of finished goods and work in progress – 1
Raw materials and consumables used – (4,220)
employee and contract labour expenses – (276)
depreciation and amortisation expenses – (245)
Finance costs – (49)
Other expenses – (649)
Profit/(loss) from discontinued operation before tax – (3)
income tax expense – 1
Profit/(loss) from discontinued operation – (2)
Loss on sale of discontinued operation – (1,568)
Less: Non‑Controlling interest – –
Profit/Loss from discontinued operations, net of tax – (1,570)
Basic earnings (loss) per share (cents per share) – (0.85)
diluted earnings (loss) per share – (0.85)
The loss from the discontinued operation of Nil (2019: loss of $2 thousand) is 80% attributable to the owners of the Company.
(b) Cash flows from (used in) Discontinued Operation
2020 $’000
2019 $’000
Net cash used in operating activities – (492)
Net cash from investing activities – (29)
Net cash used in financing activities – (840)
Net cash flows for the year – (1,361)

ANNUAL REPORT 2020 79
Notes to the Consolidated Financial Statements (Cont.)For the year ended 30 June 2020
27. RESTATEMENTduring the preparation of the consolidated interim financial statements, the Group discovered in the impairment testing at 30 June 2019 of the Trailer Solutions CGu, the carrying amount of the CGu did not include all the assets related to the Trailer Solutions CGu. as a consequence, the impairment loss was understated and intangible assets were overstated. This impact has been adjusted by restating each of the affected financial statement line items for the prior period. The following tables summarises the impacts on the Group’s consolidated financial statements for the year ended 30 June 2019.
(i) Consolidated statement of profit or loss and consolidated statement of comprehensive income
Impact of restatement
30 Jun 19
As previously reported
$’000Adjustments
$’000As restated
$’000
intangible assets 44,297 (9,336) 34,961
Others 182,014 – 182,014
Total Assets 226,311 (9,336) 216,975
Total Liabilities 104,470 – 104,470
Retained earnings 50,177 (9,336) 40,841
Others 71,664 – 71,664
Total Equity 121,841 (9,336) 112,505
(ii) Earnings per share for profit attributable to the ordinary equity holders of the Company
For the year ended 30 June 2019 Impact of restatement
As previously reported
$’000Adjustments
$’000As restated
$’000
impairment loss on intangible assets (26,882) (9,336) (36,218)
Others 9,178 – 9,178
Loss for the year (17,704) (9,336) (27,040)
Total comprehensive income for the year (8,246) (9,336) (17,582)
(iii) Earnings per share for profit attributable to the ordinary equity holders of the Company
For the year ended 30 June 2019 Impact of restatement
As previously reported Adjustments As restated
Basic and diluted earnings per share (cents per share) – Total (9.57¢) (5.04¢) (14.61¢)
Basic and diluted earnings per share (cents per share) – Continuing operations (8.72¢) (5.04¢) (13.76¢)
There is no impact on total operating, investing or financing cash flows for the year ended 30 June 2019.
There was no impact on opening retained earnings at 1 July 2018.
MaxiTRaNS iNduSTRieS80
Notes to the Consolidated Financial Statements (Cont.)For the year ended 30 June 2020
28. STANDARDS ISSUED BUT NOT YET EFFECTIVE
a number of new standards are effective for annual reporting periods beginning after 1 July 2020 and earlier application is permitted; the Group has early adopted the following new or amended standards in preparing these consolidated financial statements.
(a) Amendments to AASB 16 Leases
The iaSB issued COVid‑19 Related Rent Concessions, which amended aaSB 16 Leases. The amendment permits lessees, as a practical expedient, not to assess whether particular rent concessions occurring as a direct consequence of the COVid‑19 pandemic are lease modifications and instead to account for those rent concessions as if they are not lease modifications.
The Group has elected to early adopt the amendment and the financial statement impact is disclosed in note 22.
The following amended standards and interpretations have not been early adopted by the Group are not expected to have a significant impact on the Group’s consolidated financial statements.
(b) Amendments to References to Conceptual Framework in AASB Standards.
The iaSB issued amendments to reference the revised conceptual framework published in March 2018.
(c) Definition of a business (Amendments AASB 3)
The amendments are changes to appendix a Defined terms, the application guidance, and the illustrative examples of aaSB 3 only.
(d) Definition of Material (Amendments AASB 101 and AASB 108)
The amendments clarify the definition of ‘material’ and align with definition used in the Conceptual Framework and the standards.
(e) AASB 17 Insurance Contracts
aaSB 17 requires insurance liabilities to be measured at a current fulfilment value and provides a more uniform measurement and presentation approach for all insurance contracts. These requirements are designed to achieve the goal of a consistent, principle‑based accounting for insurance contracts. aaSB 17 supersedes aaSB 4 Insurance Contracts as of 1 January 2021.
29. EVENTS SUBSEQUENT TO BALANCE DATEThere have been no events subsequent to the reporting date which would have a material effect on the Group’s financial statements for the year ended 30 June 2020.

ANNUAL REPORT 2020 81
Liability limited by a scheme approved under Professional Standards Legislation.
KPMG, an Australian partnership and a member firm of the KPMG network of independent member firms affiliated with KPMG International Cooperative (“KPMG International”), a Swiss entity.
Independent Auditor’s Report
To the shareholders of MaxiTRANS Industries Limited
Report on the audit of the Financial Report
Opinion
We have audited the Financial Report of MaxiTRANS Industries Limited (the Company).
In our opinion, the accompanying Financial Report of the Company is in accordance with the Corporations Act 2001, including:
• giving a true and fair view of the Group's financial position as at 30 June 2020 and of its financial performance for the year ended on that date; and
• complying with Australian Accounting Standards and the Corporations Regulations 2001.
The Financial Report comprises:
• Consolidated statement of financial position as at 30 June 2020
• Consolidated statement of profit or loss and consolidated statement of comprehensive income, Consolidated statement of changes in equity, and Consolidated statement of cash flows for the year then ended
• Notes including a summary of significant accounting policies
• Directors' Declaration.
The Group consists of MaxiTRANS Industries Limited (the Company) and the entities it controlled at the year end or from time to time during the financial year.
Basis for opinion
We conducted our audit in accordance with Australian Auditing Standards. We believe that the audit evidence we have obtained is sufficient and appropriate to provide a basis for our opinion.
Our responsibilities under those standards are further described in the Auditor’s responsibilities for the audit of the Financial Report section of our report.
We are independent of the Group in accordance with the Corporations Act 2001 and the ethical requirements of the Accounting Professional and Ethical Standards Board’s APES 110 Code of Ethics for Professional Accountants (including Independence Standards) (the Code) that are relevant to our audit of the Financial Report in Australia. We have fulfilled our other ethical responsibilities in accordance with the Code.
Independent Auditor’s ReportFor the year ended 30 June 2020

MaxiTRaNS iNduSTRieS82
Independent Auditor’s Report (Cont.)For the year ended 30 June 2020
Material uncertainty related to going concern
We draw attention to Note 1, “Going Concern” in the Financial Report. The conditions disclosed in Note 1, indicate a material uncertainty exists that may cast significant doubt on the Group’s ability to continue as a going concern and, therefore, whether it will realise its assets and discharge its liabilities in the normal course of business, and at the amounts stated in the Financial Report. Our opinion is not modified in respect of this matter.
In concluding there is a material uncertainty related to going concern we evaluated the extent of uncertainty regarding events or conditions casting significant doubt in the Group’s assessment of going concern, particularly those related to potential impacts and changes in management's plans from COVID-19. Our approach to this involved:
Assessing the Group’s cash flow forecasts for incorporation of the Group’s operations and plans to address going concern, in particular in light of the recent history of loss making operations and the potential further impacts resulting from business interruption from COVID-19;
Evaluating the feasibility, quantum and timing of the Group’s plans to manage liquidity and business performance, to address going concern;
Determining the completeness of the Group’s going concern disclosures for the principle matters casting significant doubt on the Group’s ability to continue as a going concern, the Group’s plans to address these matters, and the material uncertainty.
Restatement of comparative balances – Emphasis of mater
We draw attention to Note 27, “Restatement” in the Financial Report, which describes that the comparative information presented as at and for the year ended 30 June 2019 has been restated for the correction of an error. Our opinion is not modified in respect of this matter.
Key Audit Matters
Key Audit Matters are those matters that, in our professional judgement, were of most significance in our audit of the Financial Report of the current period. These matters were addressed in the context of our audit of the Financial Report as a whole, and in forming our opinion thereon, and we do not provide a separate opinion on these matters.
In addition to the matter described in the Material uncertainty related to going concern section, we have determined the matter described below to be the Key Audit Matter.
Impairment of goodwill and non-financial assets ($44.5m)
Refer to Note 7 to the Financial Report
The key audit matter How the matter was addressed in our audit
A key audit matter for us was the Group’s annual testing of goodwill
Our procedures included:
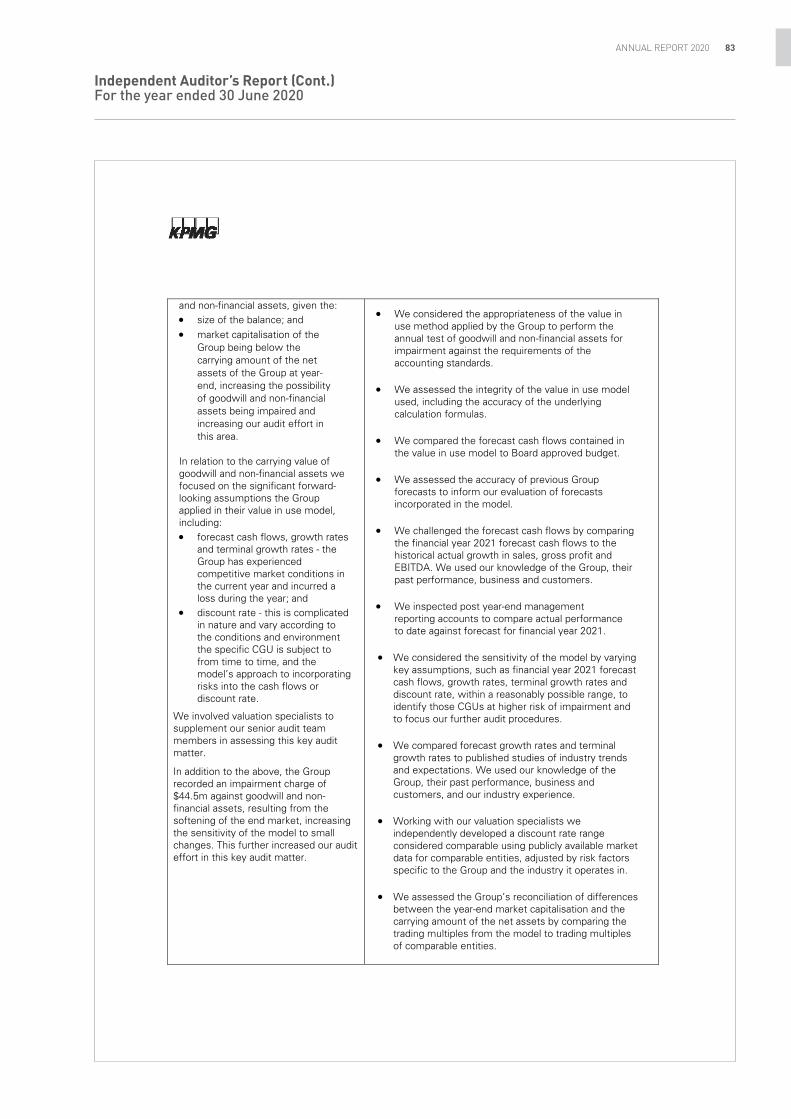
ANNUAL REPORT 2020 83
Independent Auditor’s Report (Cont.)For the year ended 30 June 2020
and non-financial assets, given the: size of the balance; and market capitalisation of the
Group being below the carrying amount of the net assets of the Group at year-end, increasing the possibility of goodwill and non-financial assets being impaired and increasing our audit effort in this area.
In relation to the carrying value of goodwill and non-financial assets we focused on the significant forward-looking assumptions the Group applied in their value in use model, including: forecast cash flows, growth rates
and terminal growth rates - the Group has experienced competitive market conditions in the current year and incurred a loss during the year; and
discount rate - this is complicated in nature and vary according to the conditions and environment the specific CGU is subject to from time to time, and the model’s approach to incorporating risks into the cash flows or discount rate.
We involved valuation specialists to supplement our senior audit team members in assessing this key audit matter.
In addition to the above, the Group recorded an impairment charge of $44.5m against goodwill and non-financial assets, resulting from the softening of the end market, increasing the sensitivity of the model to small changes. This further increased our audit effort in this key audit matter.
We considered the appropriateness of the value in use method applied by the Group to perform the annual test of goodwill and non-financial assets for impairment against the requirements of the accounting standards.
We assessed the integrity of the value in use model
used, including the accuracy of the underlying calculation formulas.
We compared the forecast cash flows contained in
the value in use model to Board approved budget. We assessed the accuracy of previous Group
forecasts to inform our evaluation of forecasts incorporated in the model.
We challenged the forecast cash flows by comparing
the financial year 2021 forecast cash flows to the historical actual growth in sales, gross profit and EBITDA. We used our knowledge of the Group, their past performance, business and customers.
We inspected post year-end management
reporting accounts to compare actual performance to date against forecast for financial year 2021.
We considered the sensitivity of the model by varying
key assumptions, such as financial year 2021 forecast cash flows, growth rates, terminal growth rates and discount rate, within a reasonably possible range, to identify those CGUs at higher risk of impairment and to focus our further audit procedures.
We compared forecast growth rates and terminal
growth rates to published studies of industry trends and expectations. We used our knowledge of the Group, their past performance, business and customers, and our industry experience.
Working with our valuation specialists we
independently developed a discount rate range considered comparable using publicly available market data for comparable entities, adjusted by risk factors specific to the Group and the industry it operates in.
We assessed the Group’s reconciliation of differences
between the year-end market capitalisation and the carrying amount of the net assets by comparing the trading multiples from the model to trading multiples of comparable entities.

MaxiTRaNS iNduSTRieS84
Independent Auditor’s Report (Cont.)For the year ended 30 June 2020
We recalculated the impairment charge for the intangibles and non-financial assets against the recorded amount disclosed.
We assessed the respective disclosures in the
financial report using our understanding obtained from our testing and against the requirements of the accounting standards.
Other Information
Other Information is financial and non-financial information in MaxiTRANS Industries Limited’s annual reporting which is provided in addition to the Financial Report and the Auditor’s Report. The Directors are responsible for the Other Information.
Our opinion on the Financial Report does not cover the Other Information and, accordingly, we do not express an audit opinion or any form of assurance conclusion thereon, with the exception of the Remuneration Report and our related assurance opinion.
In connection with our audit of the Financial Report, our responsibility is to read the Other Information. In doing so, we consider whether the Other Information is materially inconsistent with the Financial Report or our knowledge obtained in the audit, or otherwise appears to be materially misstated.
We are required to report if we conclude that there is a material misstatement of this Other Information, and based on the work we have performed on the Other Information that we obtained prior to the date of this Auditor’s Report we have nothing to report.
Responsibilities of the Directors for the Financial Report
The Directors are responsible for:
• preparing the Financial Report that gives a true and fair view in accordance with Australian Accounting Standards and the Corporations Act 2001
• implementing necessary internal control to enable the preparation of a Financial Report that gives a true and fair view and is free from material misstatement, whether due to fraud or error
• assessing the Group and Company's ability to continue as a going concern and whether the use of the going concern basis of accounting is appropriate. This includes disclosing, as applicable, matters related to going concern and using the going concern basis of accounting unless they either intend to liquidate the Group and Company or to cease operations, or have no realistic alternative but to do so.
Auditor’s responsibilities for the audit of the Financial Report
Our objective is:
• to obtain reasonable assurance about whether the Financial Report as a whole is free from material misstatement, whether due to fraud or error; and
• to issue an Auditor’s Report that includes our opinion.

ANNUAL REPORT 2020 85
Independent Auditor’s Report (Cont.)For the year ended 30 June 2020
Reasonable assurance is a high level of assurance, but is not a guarantee that an audit conducted in accordance with Australian Auditing Standards will always detect a material misstatement when it exists.
Misstatements can arise from fraud or error. They are considered material if, individually or in the aggregate, they could reasonably be expected to influence the economic decisions of users taken on the basis of the Financial Report.
A further description of our responsibilities for the audit of the Financial Report is located at the Auditing and Assurance Standards Board website at: https://www.auasb.gov.au/admin/file/content102/c3/ar1_2020.pdf. This description forms part of our Auditor’s Report.
Report on the Remuneration Report
Opinion
In our opinion, the Remuneration Report of MaxiTRANS Industries Limited for the year ended 30 June 2020, complies with Section 300A of the Corporations Act 2001.
Directors’ responsibilities
The Directors of the Company are responsible for the preparation and presentation of the Remuneration Report in accordance with Section 300A of the Corporations Act 2001.
Our responsibilities
We have audited the Remuneration Report included in pages 9 to 15 of the Directors’ report for the year ended 30 June 2020.
Our responsibility is to express an opinion on the Remuneration Report, based on our audit conducted in accordance with Australian Auditing Standards.
KPMG Suzanne Bell
Partner
Melbourne
21 August 2020

MaxiTRaNS iNduSTRieS86
Australian Stock Exchange Additional InformationFor the year ended 30 June 2020
additional information required by the australian Stock exchange Limited Listing Rules and not disclosed elsewhere in this report.
SHAREHOLDINGS
Substantial shareholders
The names of Company’s substantial shareholders and the number of shares in which each has a relevant interest, as disclosed in substantial holding notices received by the Company as at 31 July 2020 are:
Ordinary Shares
Transcap Pty Ltd and related parties 24,943,030
HGT investments Pty Ltd 20,250,000
Spheria asset Management 11,493,808
Pinnacle investment Management Group Limited and its subsidiaries 9,551,557
Greig & Harrison 9,356,501
Voting rightsas at 31 July 2020, there were 3,068 holders of ordinary shares of the Company.
Subject to the Constitution of the Company, holders of ordinary shares are entitled to vote as follows:
(a) every shareholder may vote;
(b) on a show of hands every shareholder has one vote;
(c) on a poll every shareholder has:
(i) one vote for each fully paid share; and
(ii) for each partly paid share held by the shareholder, a fraction of a vote equivalent to the proportion which the amount paid (not credited) is of the total amounts paid and payable (excluding amounts credited) on the share.
as at 31 July 2020, there were no unquoted options over unissued ordinary shares.
Distribution of shareholdersas at 31 July 2020
Category – No of SharesNo of
Shareholders Units% of issued
capital
1 – 1,000 388 192,208 0.10
1,001 – 5,000 757 2,289,160 1.24
5,001 – 10,000 532 4,327,776 2.34
10,001 – 100,000 1,182 40,859,157 22.08
100,001 and over 209 137,407,352 74.24
3,068 185,075,653 100.00
Shareholders with less than a marketable parcelas at 31 July 2020, there were 886 shareholders holding less than a marketable parcel of 3572 ordinary shares (based on the closing share price of $0.14 on 31 July 2020) in the Company totalling 109,241 ordinary shares.
On market buy‑backThere is no current on‑market buy‑back.

ANNUAL REPORT 2020 87
Australian Stock Exchange Additional Information (Cont.)For the year ended 30 June 2020
TWENTY LARGEST SHAREHOLDERS – ORDINARY SHARES AS AT 31 JULY 2020
Name Units % of Units
1. HGT investments Pty Ltd 21,000,000 11.35
2. Transcap Pty Ltd 14,940,739 8.07
3. J P Morgan Nominees australia Pty Limited 9,235,326 4.99
4. HSBC Custody Nominees (australia) Limited 7,377,873 3.99
5. Custodial Services Limited (Beneficiaries Holding a/C) 6,685,105 3.61
6. Toroa Pty Ltd 4,668,491 2.52
7 Citicorp Nominees Pty Limited 3,411,678 1.84
8. Transcap Pty Ltd 2,994,810 1.62
9. Mr Peter Zinn (Carol Zinn Family No2 a/C) 2,976,840 1.61
10. Horrie Pty Ltd (Horrie Superannuation a/C) 2,165,000 1.17
11. Luton Pty Ltd 1,839,614 0.99
12. aJT Holidings Pty Ltd 1,800,000 0.97
13. John e Gill Trading Pty Limited 1,571,933 0.85
14. Mr eric dean Ross (The Rosellinos S/Fund a/C) 1,406,540 0.76
15. John e Gill Operations Pty Ltd 1,391,657 0.75
16. James R Curtis 1,328,439 0.72
17. HillMorton Custodians Pty Ltd (The Lennox unit a/C) 1,311,000 0.71
18. Rain Capital Pty Ltd (Pullen Family a/C) 1,250,000 0.68
19. Mahata Pty Ltd 1,222,392 0.66
20. BNP Paribas Nominees Pty Ltd Hub24 Custodial Serv Ltd (dRP a/C) 1,182,654 0.64
Total ordinary fully paid shares – top 20 holders 89,760,091 48.50
Total remaining holders balance 95,315,562 51.50

MaxiTRaNS iNduSTRieS88
This page has been left blank intentionally.

www.colliercreative.com.au #MAx0058
Company SecretaryAmanda Jones
Registered Office346 Boundary Road Derrimut VIC 3026
Principal Place of Business346 Boundary Road Derrimut VIC 3026
Contact numbersTel +61 3 8368 1100 Fax +61 3 8368 1178
Share RegistryComputershare Investor Services Yarra Falls, 452 Johnston Street Abbotsford VIC 3067
Tel 1300 850 505 (within Australia) Tel +61 3 9415 4000
(outside Australia)
AuditorKPMG Tower Two Collins Square 727 Collins Street Melbourne VIC 3000
Stock ExchangeThe Company is listed on the Australian Securities Exchange.
Other InformationMaxiTRANS Industries Limited ACN 006 797 173
maxitrans.com
CORPORATE DIRECTORY
CORPORATE GOVERNANCE STATEMENT
The Corporate Governance Statement of the Directors and the accompanying Appendix 4G is separately lodged with ASx and forms part of this Director’s Report. It may also be found on the Company’s website at www.maxitrans.com.