
Annual Report 2018 - National Bank of Oman€¦ · Bank, one of India’s largest private sector...
137
Annual Report 2018
Transcript of Annual Report 2018 - National Bank of Oman€¦ · Bank, one of India’s largest private sector...
Annual Report 2018

His Majesty Sultan Qaboos bin Said

Contents
04Chairperson’s Report 2018
10Board Members’ Profiles
18Executive Management
20Our Vision
22Management Discussion and Analysis Report 2018
36Corporate Governance Report 2018
62Basel II and III - Pillar III Report 2018
92Statement of Financial Position as at 31 December 2018
186Muzn Islamic Banking
191Muzn Basel II and III – Pillar III Report 2018
217Muzn Financial Statement
266Branch Network

“Throughout 2018, we have strengthened our position as the “Bank of Choice” in Oman across all key banking segments, by delivering compelling solutions, innovative products, and world-class service.”
Rawan bint Ahmed Al SaidChairperson
04 | National Bank of Oman Annual Report 2018 | 05
Chairperson’s Report 2018 Chairperson’s Report 2018
We ended 2018 with the largest ever prizes in our revamped Al Kanz Mega Draw, which is proving to be a powerful tool to motivate customers to build their wealth through savings, while our “Tijarati” SME speaker series is helping to facilitate invaluable knowledge transfer and growth amount Oman’s budding entrepreneurs.
In a further demonstration of our support for Oman and all its citizens, our corporate social responsibility initiatives invested almost OMR 324,000 in numerous programs, making a difference to communities across the country.
Building powerful partnershipsWe also strengthened our long-lasting relationships with a number of private and public sector organizations. We partnered with Oman National Engineering & Investment Company to provide a simple, seamless way for businesses to make their monthly payments to the Public Authority for Social Insurance, and we enhanced our relationships with several blue-chip clients, including the Royal Opera House Muscat, Etihad Airways and Axis Bank, one of India’s largest private sector banks.
As the first Islamic banking platform in Oman, Muzn Islamic Banking achieved satisfactory growth in both assets and earnings and further enhanced its privileged banking services to meet the banking, investment and lifestyle needs of high income customers.
Net loans and advances as at December 2018 were OMR 2.8 billion, an increase of 5.9 per cent on last year, with most of the growth occurring at the end of Q4. Customer deposits as at December 2018 were OMR 2.45 billion, with a healthy cost-to-total-liabilities ratio of 59.5 per cent.
In September, we concluded a very successful EMTN issuance of US$500 million to European, Far East and Middle East investors. The issuance was over-subscribed by more than two times, clearly demonstrating the confidence investors have in our strategy, implementation and performance in this difficult market environment. The Board and the management team are greatly encouraged by this.
The capital adequacy ratio as at December 2018 stood at 16.3 per cent, against the regulatory requirement of 13.5 per cent, reflecting the Bank’s very robust capital position.
The Board has recommended dividends at levels commensurate with the strong capital ratios throughout the cycle. These are, of course, subject to regulatory approvals.
Oman’s preferred bankAs the first bank established in the Sultanate, we understand the great responsibility we have towards our customers, employees, shareholders, and the community we operate in. Throughout 2018, we have strengthened our position as the “Bank of Choice” in Oman across all key banking segments, by delivering compelling solutions, innovative products, and world-class service.
Time and time again, we have set new standards in the industry with our products, our services and our customer-first approach. Notable achievements in 2018 included the launch of the Badeel prepaid card, one of the first in Oman to incorporate “tap and go” contactless technology.
Our award-winning mobile app has improved further this year with more upgrades, new features and additional ways for customers to bank electronically. Similarly, upgrades to our online banking platform ensure it is easier and more convenient than ever for both corporate and personal customers to keep on top of their finances.
Dear Shareholder,On behalf of the Board of Directors of National Bank of Oman SAOG (NBO), I am pleased to announce the Bank’s full-year results for 2018.
Economic developmentsThe year started on a cautious note, given the persistently low oil prices. However, as oil prices recovered during the year, Oman’s economy began to pick up. Coupled with the Government’s continued focus on diversification, this resulted in a lower than budgeted deficit and the first signs of green shoots of recovery.
Most analysts predicted growth of 3 percent in 2019 and 2.5 per cent in 2020. Moody’s forecast expects Oman’s real GDP to grow between 2 to 3 per cent over the next three years. Even though oil prices averaged higher in 2018, some recent forecasts are less positive, with rating downgrades on the sovereign and the Bank.
Nevertheless, there is cautious optimism across numerous sectors of the economy. This is reflected in Oman’s national budget for 2019, which aims to allocate sufficient funds for key development projects and to increase the share of non-oil revenues in future. The budget also focuses on attracting investment through public private partnerships and helping more SMEs to win Government assignments. The Central Bank of Oman played a key role in stimulating the economy during the year through various regulatory measures primarily affecting liquidity, funding and capital ratios.
The banking sector, however, has continued to face a challenging market. The liquidity position has not eased to the desired extent and asset quality pressures persist, especially in the real estate sector. Credit growth in Oman in the first 10 months has been 5.7 per cent, while deposits growth was 4.4 per cent.
Operating performanceAgainst this backdrop, NBO reported 15 per cent growth in net profits compared to last year, primarily as a result of lower provisioning from the UAE. As reported in prior commentaries, the Bank has proactively exited most of its non-strategic UAE customers over the past 18 months, as we seek to concentrate on relationships emanating from Oman. The decline in UAE net loans in the last six quarters was OMR 93 million, leading to a significant decline in total operating income during 2018.
Now, with our UAE operations stabilized, we expect a gradual improvement from Q1 2019. Going forward, our focus will be on the substantial trade opportunities between Oman and UAE, and on strengthening our existing relationships. As a result, we expect the UAE drag to continue to diminish, contributing to a stronger performance for the Bank as a whole.
In Oman, where most of our operations lie, the performance was very satisfactory: a 3.6 per cent growth in operating profit and an impressive 14.80 per cent growth in net profit. This is due largely to a significant increase in fee income and better cost management. Funding costs have risen sharply from 1.97 per cent in 2017 to 2.32 per cent in 2018. Despite our strong franchise in Oman and therefore our ability to mobilize low cost deposits, net spreads reduced by 20 bps.
Prioritizing profitabilityOur short-to-medium term focus remains on growing our margins, with a modest growth in loan book size and continued fee income diversification. The latter in particular has gained momentum during 2018, while ongoing cost management initiatives have kept cost growth to a minimum. Cost management will continue to be a relentless focus in 2019, although there is ample investment approved for digitization and transformation initiatives.
Impairments on loans and advances for the year were at OMR 7.4 million. This is a reduction of 54.8 per cent over the same period last year, due largely to lower levels of provisioning in the UAE and higher recoveries. We continue to be vigilant in monitoring the loans portfolio for both Oman and the UAE.
IFRS 9 was also successfully implemented during 2018. The Bank is satisfied with the stringent staging criteria and the expected credit loss appears conservative compared to peers in Oman and elsewhere in the GCC.
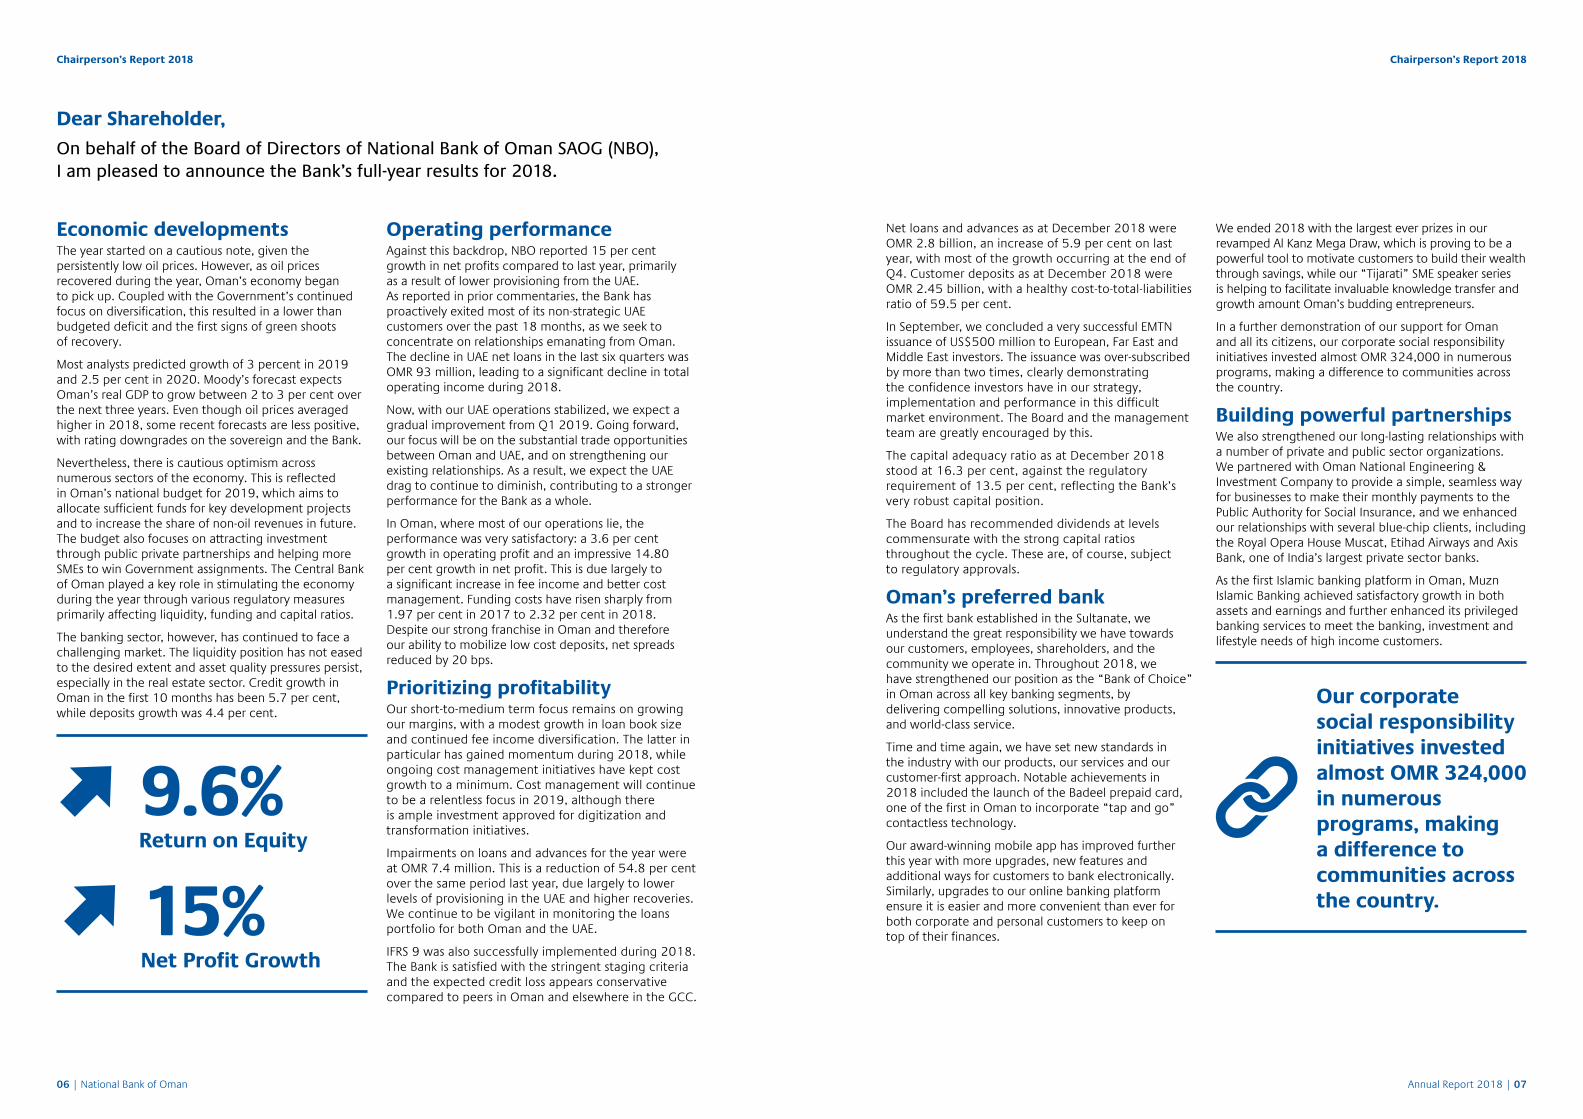
Our corporate social responsibility initiatives invested almost OMR 324,000 in numerous programs, making a difference to communities across the country.
9.6% Return on Equity
15% Net Profit Growth
Chairperson’s Report 2018 Chairperson’s Report 2018
06 | National Bank of Oman Annual Report 2018 | 07

We are committed to pushing the boundaries of innovation, finding inspiration in the most unexpected places, and providing all those who rely on us with the best we have to offer.
Looking aheadAs we look forward to 2019, we are committed to leading the market by consistently demonstrating our customer-first approach, superior service, innovative technology and diverse range of products and services.
Our goal is to be the best bank for our customers, employees, shareholders and community. I’d like to thank the more than 1,500 NBO team members who are a vital part of this journey. Together, we are building a better bank. I look forward to continuing our work together to ensure NBO achieves its full potential over the months and years ahead.
On behalf of the whole NBO team, we thank our customers, shareholders, regulators, partners and wider community for their continuing support throughout the year. Above all, we pay tribute to His Majesty, Sultan Qaboos bin Said, for his inspiring leadership, vision and wise guidance, which continues to propel Oman towards success.
NBO is committed to pushing the boundaries of innovation, finding inspiration in the most unexpected places, and providing all those who rely on us with the best we have to offer. It is my honor and privilege to be part of an institution that is helping to drive Oman’s growth and development.
We pay tribute to His Majesty, Sultan Qaboos bin Said, for his inspiring leadership, vision and wise guidance, which continues to propel Oman towards success.
Chairperson’s Report 2018 Chairperson’s Report 2018
Annual Report 2018 | 0908 | National Bank of Oman

Board Members’ Profiles

Sayyida Rawan Ahmed Al Said, ChairpersonMember of the Executive, Nomination and Remuneration Committee (ENRC)
Sayyida Dr. Rawan Ahmed Al Said is the CEO of Takaful Oman SAOG, Prior to joining Takaful Oman, she was the Managing Director and CEO of ONIC Holding Corporation. Before moving to the Private Sector, Rawan was the Deputy CEO-Investment for the State General Reserve Fund of Oman, leading the execution of many mega investments internationally. She has almost 30 years of experience in the financial industry, 20 of which are in the Public sector. Sayyida Rawan remains to be the First and the only Female who holds a CEO position in a public listed company in Oman.
She has been a member on the Board of a number of reputed Companies and Financial Institutions in Public and private sector in Oman and the GCC region. Chairperson in National Bank of Oman, Deputy Chairperson in Oman Oil Marketing Company, Board Member of Oman National Investments Development Company ONIDCO (Tanmia) and Chairperson of its equity and GCC funds committee. In the public sector, she was on the board of Oman Oil Company SOAC and its audit committee. She was on the Board Member of International General Insurance (IGI) Jordan, and National Finance House (NFH), Bahrain. Deputy Chairperson of Orix Finance, National Life & General Insurance Company SAOC (NLIG) and Al Ahlia Insurance.
Ms. Amal Suhail Bahwan, DirectorMember of the Executive, Nomination and Remuneration Committee (ENRC) and the Board Risk Committee (BRC)
Ms. Amal Suhail Bahwan is the Vice Chairperson of Suhail Bahwan Group Holding LLC. She has extensive experience in managing companies across the Bahwan Group.
She is also the Chairperson and Executive Committee member of Al Jazeera Steel Products Co. SAOG. and Director and Board Remuneration Committee member of Oman Oil Marketing Co. SAOG.
Ms. Amal has a Bachelor’s degree in Education and a Master’s degree in Administration from the Sultan Qaboos University.
H.E. Sheikh Abdulla Bin Ali Bin Jabor Al Thani, Deputy Chairman Member of the Executive, Nomination and Remuneration Committee (ENRC)
H.E. Sheikh Abdulla bin Ali bin Jabor Al Thani has been a Director of the Bank since July 2005 and serves as a member of the Board Executive, Nomination and Remuneration Committee (ENRC). His Excellency is the Chairman of The Commercial Bank (P.S.Q.C.) in Qatar, a member of the Board of Directors for United Arab Bank, P.J.S.C. in UAE and is the Owner of Vista Trading Company (Qatar), and a Partner in Integrated Intelligence Services Company (Qatar).
H.E. Sheikh Abdulla bin Ali bin Jabor Al Thani holds a Bachelor of Arts Degree in Social Science from Qatar University.
In 2016 she was honored with Honorary Doctorate Degree from Commonwealth University in UK and she was awarded as the Best Takaful CEO from Global Business Outlook, UK. Dr. Rawan ranked 3rd in Oman for Forbes the Top 100 most powerful Arab Businesswomen 2017. In 2017 and 2018 she won the best CEO-Oman award from International Finance UK and she won Oman Women of the year awards 2018 for the inspirational woman category.
She is also a Member on the Investment Committee of the Public Authority for Social Insurance, Board Member in Public Authority for the SME Development (Riyada). Chairperson of Al Kawther Fund (Islamic Compliant Fund) and a Member of the Investment Committee of Orphans & Incapacitated Funds in the Ministry of Justice. She has been recently appointed as a Board member of the Sultan Qaboos University Council.
Awards and Recognition
In 2011, She was bestowed the Business Professional (BizPro) Leader Award. In 2012, was ranked 14th in Forbes Middle East for the ‘Most Powerful Arab Business Women in Listed Companies’. In 2014, Rawan was named among the Best Chief Executives in the region by Trend in collaboration with INSEAD (The Business School for the World). Also she was Awarded Hall of Fame by MARA Excellence Awards. In 2015, she was honored with two prestigious Awards; Asian Women Leadership of the Year from World Leadership Congress and in MENA and Business Leader of the year from the Middle East Accountancy and Finance Excellency Awards 2015.
Sayyida Dr. Rawan, has an MSc in Economics & Finance from Loughborough University UK. She also holds a Post Graduate Diploma in Investment Analysis from Stirling University UK, and BA in Economics & Political Science from the American University in Cairo (AUC).
12 | National Bank of Oman Annual Report 2018 | 13
Board Members’ Profiles Board Members’ Profiles

Mr. Rahul Kar, DirectorChairperson of the Board Audit Committee (BAC)
Mr. Rahul Kar has been a Director of the Bank since April 2016. Mr. Kar is a Chartered Accountant and is currently working as the Financial Advisor to the Chairman of Suhail Bahwan Group Holding LLC.
Mr. Kar is also a Director and an Audit committee member of Al Jazeera Steel Products Co. SAOG. He is also a Director and Nomination & Remuneration committee member of Oman United Insurance Company SAOG.
Mr. Fahad Badar, DirectorMember of the Credit Committee of the Board (CCB and the Board Risk Committee of the Board (BRC)
Mr. Fahad Badar has been a Director of the Bank since May 2016. He is also a member of the Board for United Arab Bank, P.J.S.C. in UAE since July 2016.
Mr. Badar’s career at The Commercial Bank (P.S.Q.C.)in Qatar spans over 19 years. Prior to his current role as Executive General Manager, International Banking, he held a number of key roles in International Banking, the Government and Public Sector Relations and the Wholesale Banking Divisions.
Mr. Badar holds an MBA from Durham University, UK and a Bachelor of Arts Degree in Banking & Finance from the University of Wales.
Mr. Hamad Mohammad Hamood Al Wahaibi, DirectorChairperson of the Credit Committee of the Board (CCB) and member of the Board Executive, Nomination and Remuneration Committee (ENRC)
Mr. Hamad Mohammad Al Wahaibi has been a Director of the Bank since March 2014. He has 20 years of experience in the GCC. He has been a director of investment with the Ministry of Defense Pension Fund for the past six years. Mr. Al Wahaibi is also a member of the boards of Voltamp Energy Company and ACWA Power Company.
Mr. Al Wahaibi holds a Masters of Business Administration (MBA) degree, specializing in Finance, and he is a Chartered Financial Analyst (CFA) charter holder, Chartered Alternative Investment Analyst (CAIA) charter holder, as well as a Certificate in Investment Performance Measurement (CIPM) Certificant.
Mr. Mohammed Ismail Mandani Al Emadi, DirectorChairperson of the Board Risk Committee (BRC) and Member of the Board Audit Committee (BAC)
Mr. Mohammed Ismail Mandani Al Emadi has been a Director of the Bank since November 2014. He is also a member of the Board for The Commercial Bank (P.S.Q.C.) and a member of the Board of Alternatifbank A.S. (ABank), Turkey and has over 30 years of banking experience. Mr. Al Emadi has held a number of key roles at Commercial Bank until 2006, after which he served as Chief Executive Officer of Qatar Real Estate Investment Company Q.S.C. up to 2011, and also served as its Director from 2003 until 2005.
Mr. Al Emadi holds a Bachelor of Arts Degree in Business Administration and Economics from Holy Names University, California.
Board Members’ Profiles Board Members’ Profiles
14 | National Bank of Oman Annual Report 2018 | 15

Mr. Rashid Bin Saif Al-Saadi, DirectorMember of the Board Audit Committee (BAC) and a member of the Credit Committee of the Board (CCB)
Sheikh Rashid has been a member of the Board of Directors since August 2017, and is a renowned financial and investment banker, business executive, entrepreneur and philanthropist. Sheikh Rashid is also the CEO of TANMIA, a company that actively contributes to the Sultanate’s economic development.
Sheikh Rashid holds a B.Sc. in Business Administration from Rollins College, USA. His career is marked by many significant achievements and milestones; including a twelve year stint with the Diwan of Royal Court.
In 2000, Sheikh Rashid was appointed CEO of TANMIA, which was setting up its Investment Fund with the Muscat Securities Market at the time. Following his appointment, the Board of Directors decided to transfer the responsibilities of managing the fund to the company directly, and two new Funds were set up subsequently; a Private Equity Fund, the GCC Investment Fund, and the Shari’a Fund in 2013. In addition, Sheikh Rashid also drove direct investments into various industries, including and not limited to Real Estate Development; the company played an active role in the development of the Al Mouj Muscat Project, and in the Tourism sector, the company played a key role in setting up the Kempinski Hotel, Muscat. In the Industrial Sector the company contributed to the establishment of Octal Petrochemicals, also extending into the retail sector by partnering with Al Meera Group to set up its business in the Sultanate.
In addition to his executive responsibilities, Sheikh Rashid is the Chairman of Board of Directors of Takaful Oman SAOG and A’saffa Foods SAOG. He is also a Director on the Boards of Oman National Finance Co. SAOG, Minerals Development Company SAOC, Muscat National Development and Investment SAOC, Almouj Muscat & Oman Hospitality Company.
Mr. Joseph Abraham, DirectorMember of the Executive, Nomination and Remuneration Committee (ENRC)
Mr. Abraham was appointed as a Board Member of NBO in May 2018.
Mr. Abraham is the Group Chief Executive Officer of The Commercial Bank as well as Vice-Chairman of the Board of Directors of Alternatif Bank and a Board Director of the United Arab Bank, UAE. He has extensive banking experience across both developed and emerging markets. Before joining The Commercial Bank in June 2016, he was CEO of ANZ Indonesia (Australia and New Zealand Banking Group) based in Jakarta, a position he served in from 2008 to 2016. Mr. Abraham has an MBA from the Graduate School of Business, Stanford University, California and has worked in Indonesia, Singapore, Hong Kong, Ghana, UK and India in various country and regional banking roles with a successful track record covering general management, corporate banking, strategy, product management as well as acquisitions and integrations. Mr. Abraham was appointed as a Board Member of Alternatif Bank in December 2016.
Mrs. Najat Ali Al Lawatia, DirectorMember of Credit Committee of the Board (CCB)
Ms. Najat Ali Al Lawatia was elected as a Director of the Bank at the AGM in March 2017. She holds a Commerce Bachelor Degree in accounting and has attended various courses in diverse fields of financial management, audit, investments etc. She is working as the Deputy Director General for Support Services with Civil Service Employees Pension Fund and has more than 20 years of relevant experience.
Ms. Najat is also a Director and Chairperson of Audit Committee of Oman Cement Company SAOG.
Mr. Ghassan Khamis Al Hashar, DirectorMember of the Board Audit Committee (BAC) and the Board Risk Committee (BRC)
Mr. Al Hashar joined NBO Board as a representative of the Public Authority for Social Insurance (PASI) in March 2017. He is currently the Authority’s Director of Investments. He has over 20 years of experience in finance and investment management, and represents PASI on the boards of numerous public and private companies. He is also a Board Director at National Life & General Insurance Company SAOG and Oman National Investments Development Company SAOC (TANMIA).
Mr. Al Hashar holds a Master’s Degree in Finance and Investment Management.
Board Members’ Profiles Board Members’ Profiles
16 | National Bank of Oman Annual Report 2018 | 17

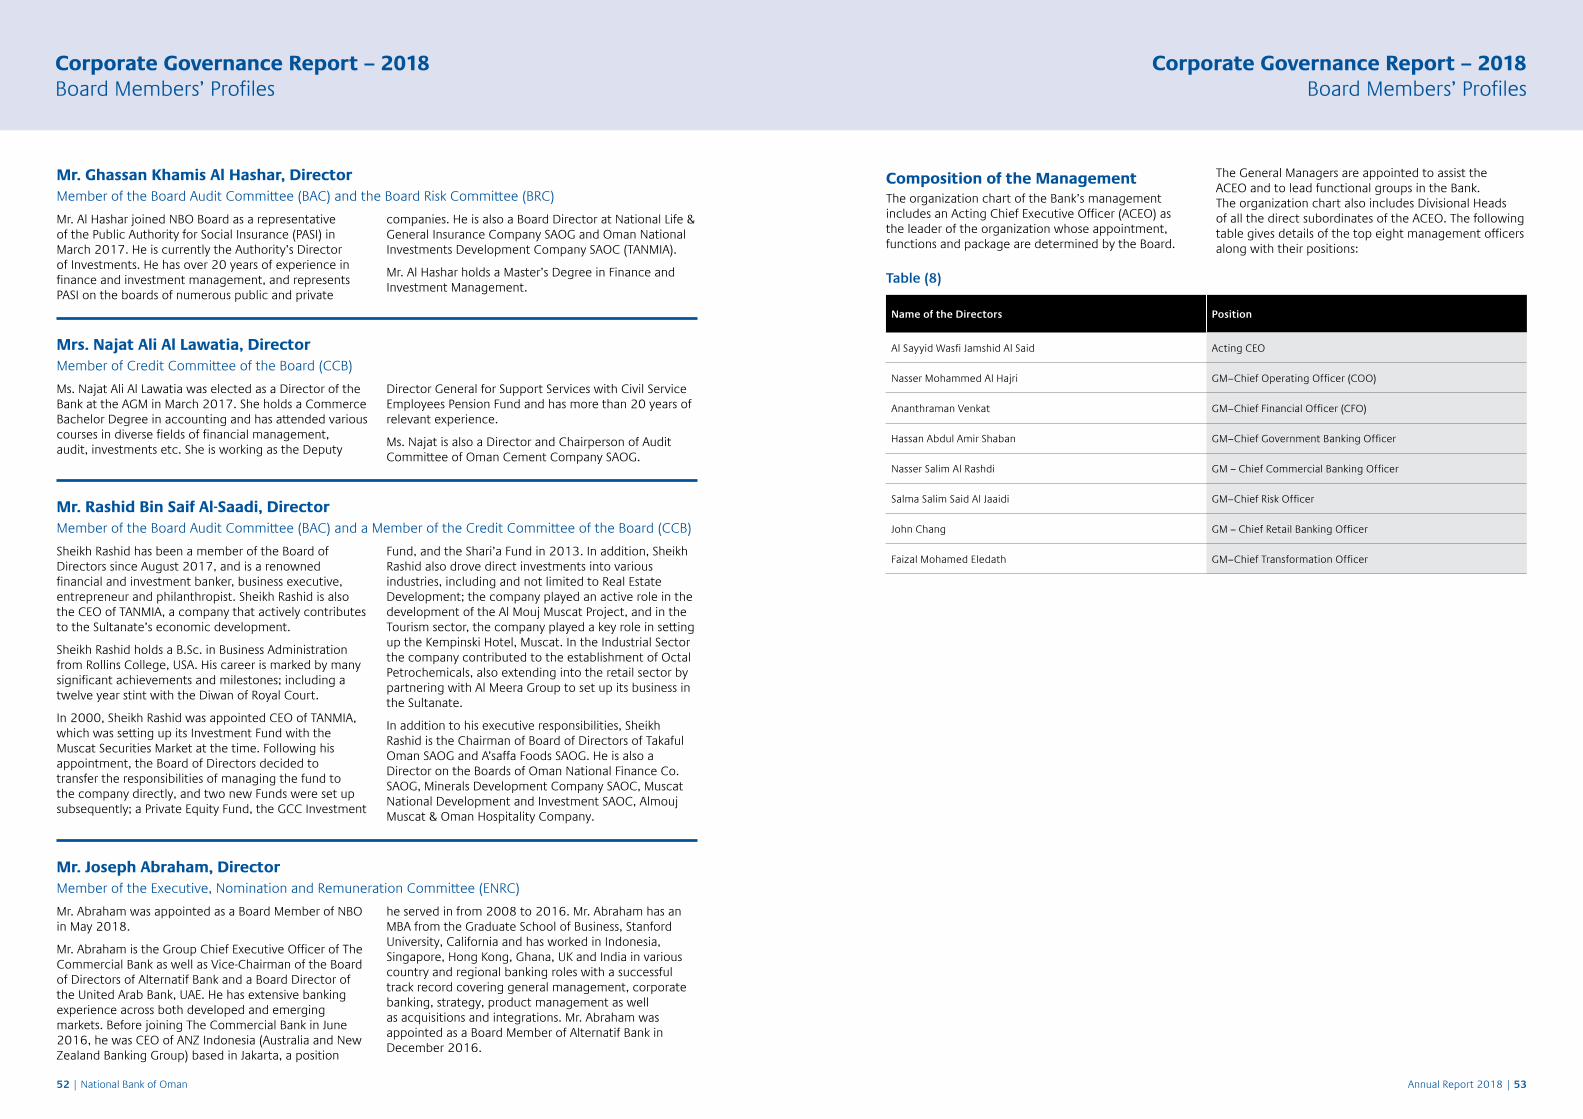
John Chang GM – Chief Retail Banking Officer
Faizal Mohamed Eledath GM - Chief Transformation Officer
Hassan Abdul Amir Shaban GM - Chief Government Banking Officer
Al Sayyid Wasfi Jamshid Al Said Acting Chief Executive Officer
Ananthraman Venkat GM - Chief Financial Officer
Nasser Mohammed Al Hajri GM - Chief Operating Officer
Nasser Salim Al Rashdi GM – Chief Commercial Banking Officer
Salma Salim Said Al Jaaidi GM - Chief Risk Officer
18 | National Bank of Oman Annual Report 2018 | 19
Executive Management Executive Management

Our Vision
To be The Bank of Choice
20 | National Bank of Oman Annual Report 2018 | 21
Our Vision Our Vision
Management Discussion and Analysis Report 2018
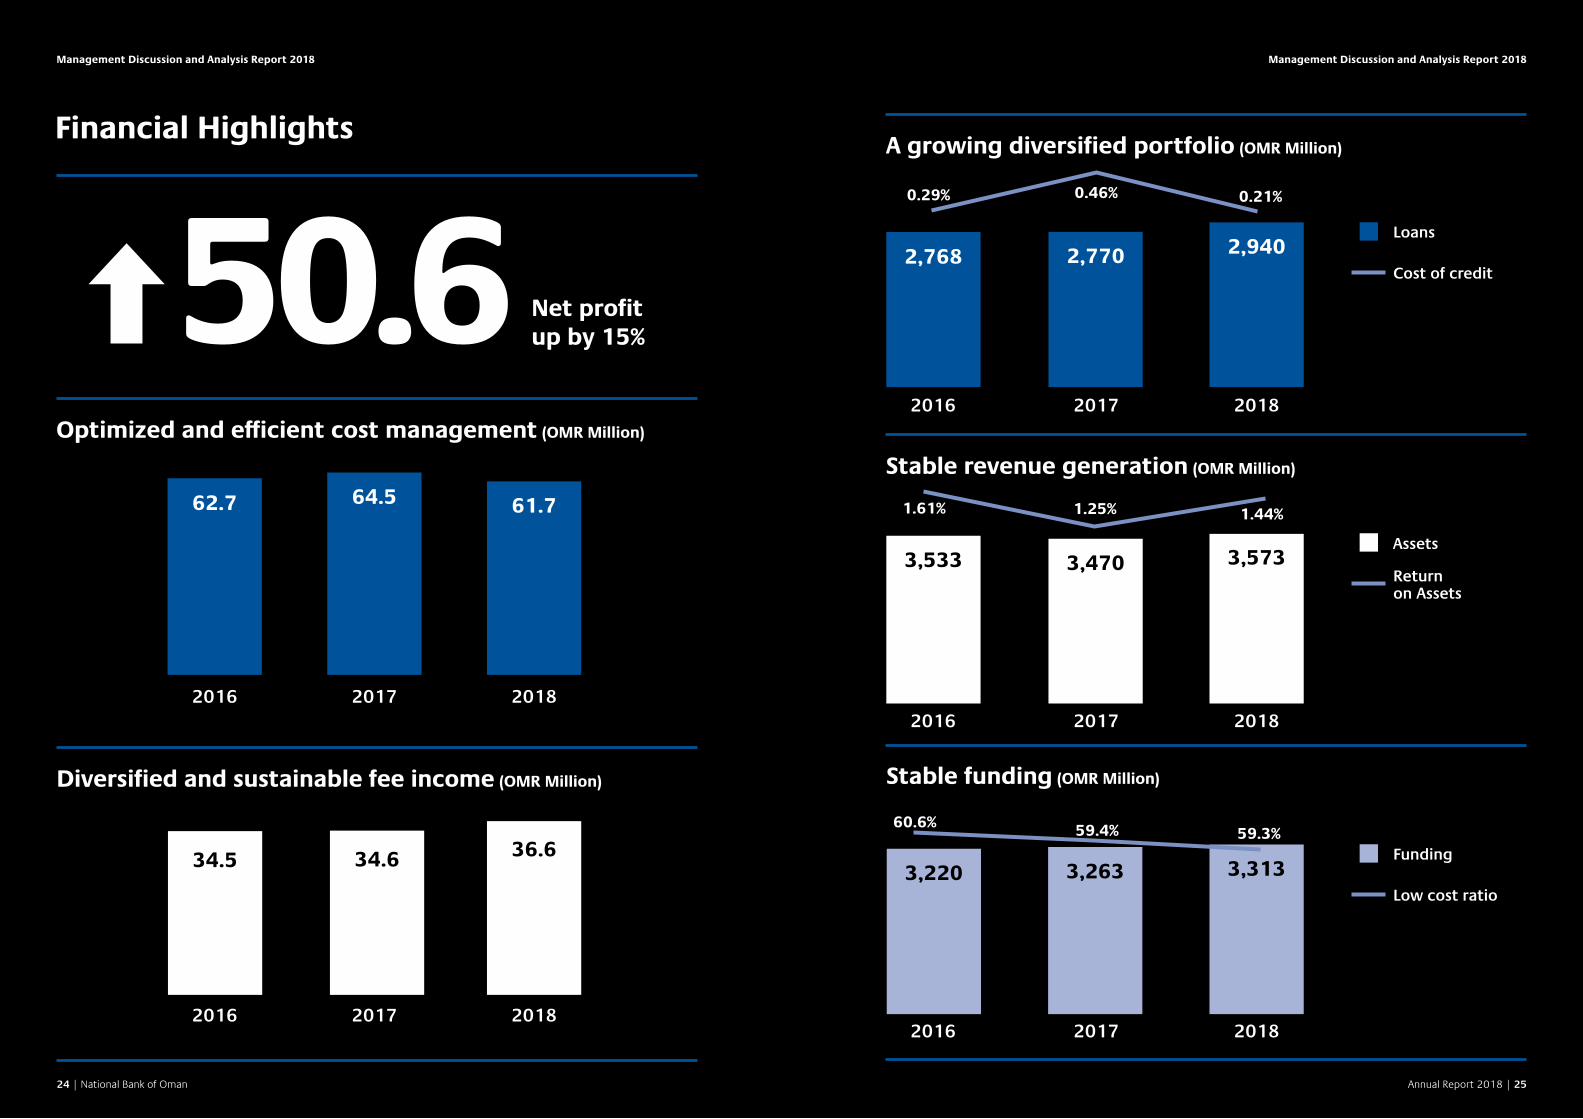
Optimized and efficient cost management (OMR Million)
A growing diversified portfolio (OMR Million)
Diversified and sustainable fee income (OMR Million)
2016 2017 20182016 2017 2018
50.6 Net profit up by 15%
34.6 36.6
Stable funding (OMR Million)
Stable revenue generation (OMR Million)
3,220 3,263 3,313
Loans
Funding
Cost of credit
Low cost ratio
Assets
Return on Assets
Management Discussion and Analysis Report 2018 Management Discussion and Analysis Report 2018
Financial Highlights
2016 2017 2018
62.7 64.5 61.7
34.5
2016 2017 2018
0.29% 0.46% 0.21%
2,770 2,9402,768
2016 2017 2018
3,533 3,470 3,573
1.61% 1.25% 1.44%
60.6% 59.4% 59.3%
24 | National Bank of Oman Annual Report 2018 | 25

Our strategy positions the Bank to provide customers a vastly superior experience and deliver sustained profitable returns
Al Sayyid Wasfi Jamshid Al SaidActing Chief Executive Officer
26 | National Bank of Oman Annual Report 2018 | 27
Management Discussion and Analysis Report 2018 Management Discussion and Analysis Report 2018
Income diversificationOur commitment to investing for the longer term is a fundamental pillar of our income diversification strategy. Rather than relying on fund based income, we made a strategic decision to strengthen other, less risky, revenue streams. The seeds we planted in the last couple of years to enhance our non-interest fee income have started to yield very positively in 2018.
In particular, we focused on areas like wealth management, significantly increasing the number of certified wealth advisors at the bank and successfully growing our investment income, while providing our clients with an enhanced return on their investments year-on-year. Through our revamped Sadara banking proposition, our top-tier clients can turn to us for the full range of investment advice, wealth management services, and private banking needs, taking advantage of our new partnership with a Swiss private bank.
We also further enhanced the privileged banking services of our Muzn Islamic Banking proposition, the first Islamic banking platform in Oman. This helped to deliver satisfactory growth in assets and earnings, as an increasing number of high income customers turn to Muzn for their Islamic banking, investment and lifestyle needs.
Our corporate banking business achieved outstanding growth in 2018. We achieved an 9.8 per cent increase in operating profit, including 12.8 per cent growth in assets.
At the start of the year we identified our priority targets – solid names and robust transactions - and we dedicated significant time and effort to securing them, with great success. We have been very successful in showing the market what we have to offer and why we are a good partner.
The team was busy all year working on the right kind of deals, developing these relationships and nurturing the opportunities. It was immensely satisfying to see many of them come to fruition in the last quarter, with decent pricing, good structuring and some high-quality names, including three large restructurings in syndication with other banks.
The structuring and advisory fee income has also increased significantly, as has our Financial Institutions Group, which achieved 9 per cent growth in profits,
Building a bank fit for the futureOur performance in 2018 was one that everyone at NBO can be justifiably proud of. NBO is now more profitable, more stable and more secure than it was in 2017. Our impressive financial results are a tangible demonstration that our forward-looking corporate strategy is leading us in the right direction. We have been agile in adapting to changes in the macro-economic environment and responding to regional challenges, and we have successfully repositioned NBO for its next wave of growth.
Financially, we demonstrated our strong recovery over the past 12 months, with the brightest results we have achieved for several years. We enjoyed a 15 per cent growth in net profits compared to 2017, reaching RO. 50.6 million, and our capitalization metrics are very solid.
Our network of more than 60 branches in key strategic locations, plus our award-winning landmark headquarters on a prime site in Muscat’s commercial district, ensure our footprint and our profile are stronger today than they have ever been. We are rightly regarded as the ‘national’ bank and our brand conveys a sense of stability, credibility and respect that none of our peers can match.
The recognition of NBO as a strong and stable bank was clearly demonstrated by our US$500 million note issuance in September 2018, which was over-subscribed by almost 2.5 times by institutions from the world’s leading financial centers. This helped us to broaden our base of investors and incorporate a wider and more diversified geographic reach than previous note issues. It was also a sign of our growing global reputation as a safe investment that is helping to further drive Oman’s development.
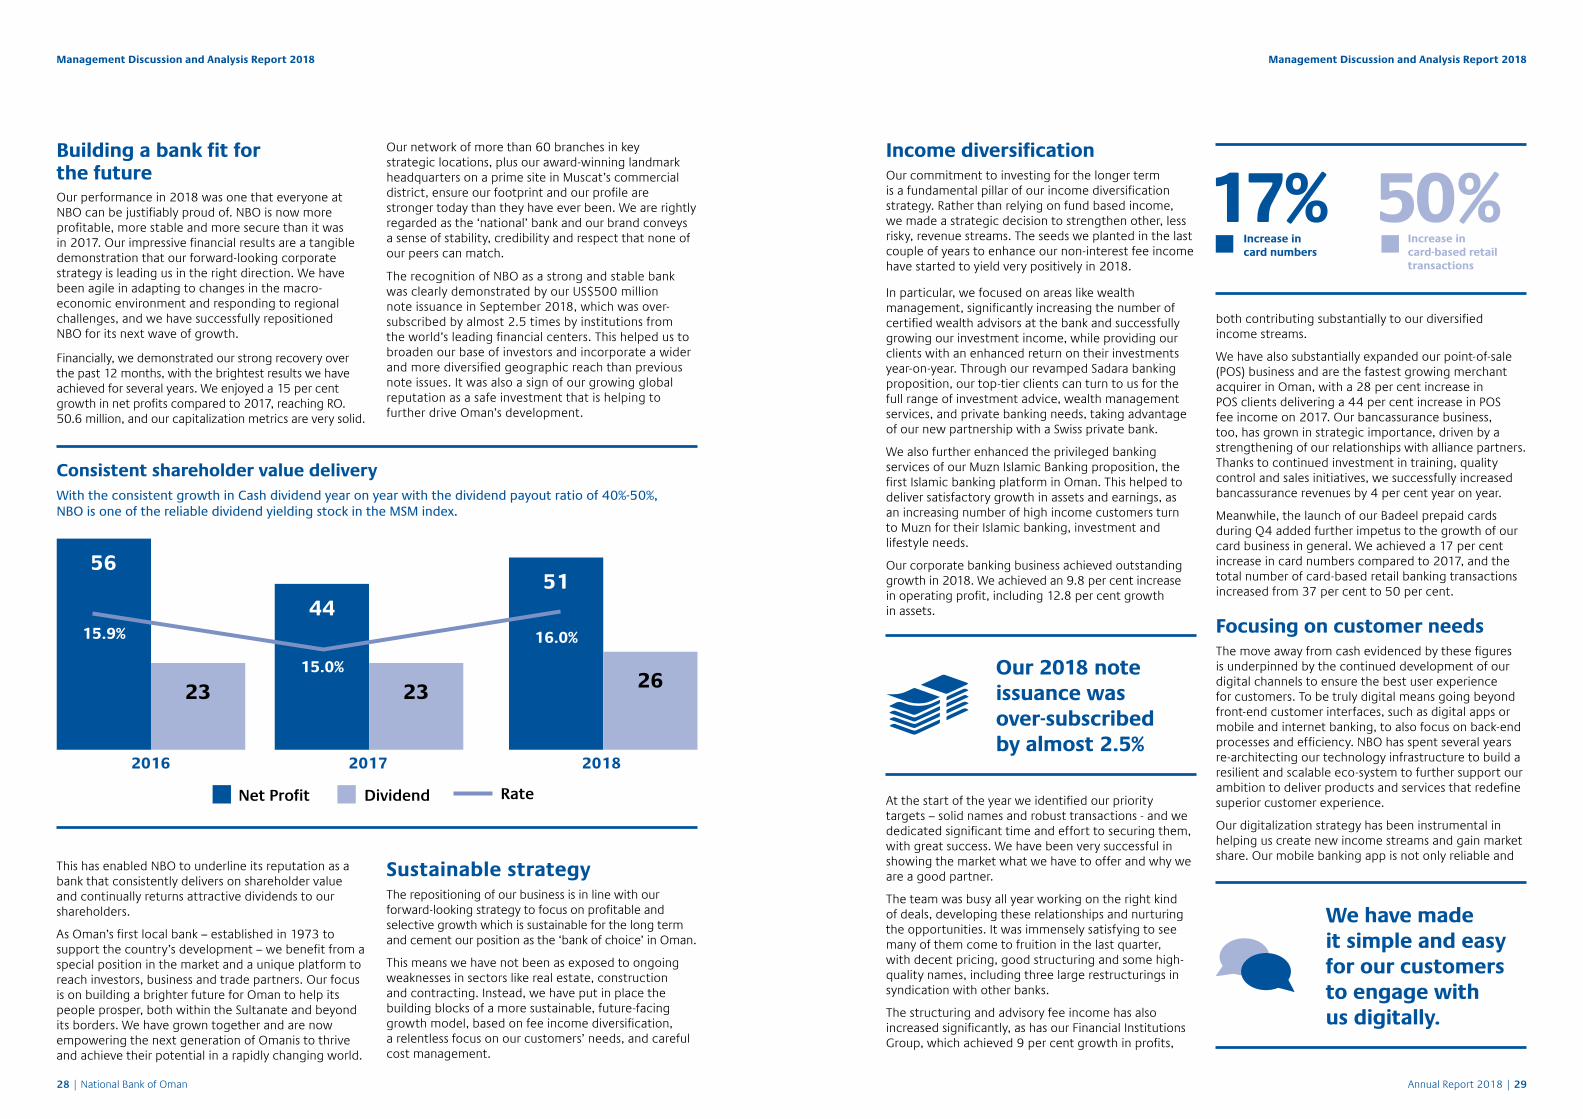
Consistent shareholder value deliveryWith the consistent growth in Cash dividend year on year with the dividend payout ratio of 40%-50%, NBO is one of the reliable dividend yielding stock in the MSM index.
Sustainable strategyThe repositioning of our business is in line with our forward-looking strategy to focus on profitable and selective growth which is sustainable for the long term and cement our position as the ‘bank of choice’ in Oman.
This means we have not been as exposed to ongoing weaknesses in sectors like real estate, construction and contracting. Instead, we have put in place the building blocks of a more sustainable, future-facing growth model, based on fee income diversification, a relentless focus on our customers’ needs, and careful cost management.
both contributing substantially to our diversified income streams.
We have also substantially expanded our point-of-sale (POS) business and are the fastest growing merchant acquirer in Oman, with a 28 per cent increase in POS clients delivering a 44 per cent increase in POS fee income on 2017. Our bancassurance business, too, has grown in strategic importance, driven by a strengthening of our relationships with alliance partners. Thanks to continued investment in training, quality control and sales initiatives, we successfully increased bancassurance revenues by 4 per cent year on year.
Meanwhile, the launch of our Badeel prepaid cards during Q4 added further impetus to the growth of our card business in general. We achieved a 17 per cent increase in card numbers compared to 2017, and the total number of card-based retail banking transactions increased from 37 per cent to 50 per cent.
Focusing on customer needsThe move away from cash evidenced by these figures is underpinned by the continued development of our digital channels to ensure the best user experience for customers. To be truly digital means going beyond front-end customer interfaces, such as digital apps or mobile and internet banking, to also focus on back-end processes and efficiency. NBO has spent several years re-architecting our technology infrastructure to build a resilient and scalable eco-system to further support our ambition to deliver products and services that redefine superior customer experience.
Our digitalization strategy has been instrumental in helping us create new income streams and gain market share. Our mobile banking app is not only reliable and
We have made it simple and easy for our customers to engage with us digitally.
This has enabled NBO to underline its reputation as a bank that consistently delivers on shareholder value and continually returns attractive dividends to our shareholders.
As Oman’s first local bank – established in 1973 to support the country’s development – we benefit from a special position in the market and a unique platform to reach investors, business and trade partners. Our focus is on building a brighter future for Oman to help its people prosper, both within the Sultanate and beyond its borders. We have grown together and are now empowering the next generation of Omanis to thrive and achieve their potential in a rapidly changing world.
17% 50%Increase in card numbers
Increase in card-based retail transactions
Net Profit Dividend Rate
2016
56
23
15.9%
2017
44
15.0%
2018
16.0%
Our 2018 note issuance was over-subscribed by almost 2.5%
23
51
26
28 | National Bank of Oman Annual Report 2018 | 29
Management Discussion and Analysis Report 2018 Management Discussion and Analysis Report 2018

secure, its usability and design are exceptional – as shown by the fact it now enjoys the market’s highest percentage of registered users as a proportion of the total active customer base. It is also one of the main reasons that we already have twice as many digital retail banking transactions per month as we do in branch. We make it simple and easy for customers to engage with us digitally. Coupled with our focus on agile methodologies and our understanding of the whole customer journey, we have been able to improve speed to market and elevate customer experience. This not only translates to more digitally-engaged customers, but also to higher returns per customer.
One example is our non-resident proposition, where we launched a one-click remittance facility in partnership with Axis Bank, one of India’s largest private sector
banks. The successful implementation of this facility is a direct result of our unwavering pursuit of, and commitment to, superior customer service and has significantly increased our fee income from non-resident remittances.
At the same time, by enhancing and developing our digital infrastructure and IT systems, we have been able to strengthen our B2B relationships with corporate and government clients, who now use our B2B payment platform to conduct more of their day-to-day banking work. In addition, our service offering of tailor-made financial solutions in project financing, investment advisory and digital payments have enabled us to attract new customers in the private and public sector, substantially increasing our transaction revenues in these areas.
Our values of customer first, one Bank, execution, quality and integrity were and continue to be our driving engine.
Management Discussion and Analysis Report 2018 Management Discussion and Analysis Report 2018
Power of personalizationThe success of our digitalization strategy is enabled by our innovative approach to IT. Our IT team operates with a high degree of autonomy, within the parameters of NBO’s defined vision, values and objectives. This autonomy, coupled with exceptional agility and committed management, enables the team to respond rapidly to customer needs and expectations. It enables us to not only create bespoke systems that precisely match our requirements, it allows us to continue to personalize and adapt our platforms as the needs of our customers change and evolve.
30 | National Bank of Oman Annual Report 2018 | 31

that more than 60 per cent of all our transactions are now conducted out of branch. This, in turn, frees up in-branch resources to focus on delivering more personalized, high quality services that exceed customer expectations.
International stabilizationAs well as being the first bank in Oman, we are also the only one with a banking license in the UAE, as well as a license in Egypt. However, in the past few years our UAE operations had, in common with other banks, suffered from the slow-down in the market, leading to some asset quality issues. Our relatively small size in the market meant that the impact in terms of our overall portfolio was higher, negatively affecting our profits in 2016 and 2017. So it is highly satisfying to report that this situation has been successfully addressed and our business in the UAE has been transformed.
By June 2018, after implementing a robust asset review and taking some tough decisions regarding our portfolio, we were fully-provided for all our bad assets in the UAE. We shrunk the portfolio to a level with
which we are comfortable, while focusing on more stable asset classes.
This led to some short-term pain, but we now have a good basis to grow cautiously in the UAE and focus on implementing our new strategy. This centers on supporting the trade corridor between Oman and the UAE, leveraging our unique position as the only bank with the ability to offer seamless transactions between the two jurisdictions. It puts us in an ideal situation to capitalize on the considerable opportunities this presents in 2019 and beyond.
Empowering our peopleOf course, we recognize that none of these achievements would be possible without the hard work, commitment and dedication of our people, at all levels of our organization.
We understand that the strongest team usually wins the game. Our success depends on us having the best players, in being the employer of choice as well as the bank of choice. It is expensive to acquire good people from other banks, so our strategy is to recruit the best and then do all we can to retain them. By guiding and supporting our employees to reach their full potential with us, helping them to identify and secure new roles and opportunities, we are building a solid base of talent to drive our future growth.
One of the ways we have done this in 2018 is to empower our people to develop their knowledge and skills, to develop their careers at NBO, and to benefit from opportunities they wouldn’t have elsewhere.
Our three core retail banking propositions – Sadara, Mazaya and non-residents – are personalized to the very different needs of these customer groups. Our strong growth in the Youth banking market reflects the success of our personalized proposition in this segment, too, driven by factors such as the ongoing investment in our youth marketing team and the popularity of our revamped Nuqati rewards scheme, which now enjoys the highest net redemption ratio in the market, at 63 per cent.
Our revamped Al Kanz low cost savings account, which includes regular draws for savers to win big cash prizes, is also proving to be a powerful tool to motivate customers to build their wealth through savings, in line with Government efforts in this area.
Careful cost managementThroughout our journey over the past 12 to 18 months, we have worked ceaselessly to keep our costs under control. We have reviewed our spending line by line and have identified efficiencies in many different places, keeping costs at a strategically acceptable level. Our Operations Group implemented a review of operational controls, identifying areas of automation and successfully increasing the efficiency of recovery teams to the extent that we significantly exceeded our target savings in this area.
At the same time, we have been very careful to ensure that our effective management of costs has not compromised our ability to generate revenues or implement our investment plans.
Part of this is about leveraging our strength as a national bank to make sure we are getting best value from our partners, such as landlords or suppliers. The other element is about investing in areas such as technology and innovation that enable us to create efficiencies elsewhere in our business.
Our continued investment in our mobile and online banking platforms, for example, to ensure they are as secure, reliable and user-friendly as possible, means
To drive our future growth, we empowered our people to develop knowledge and skills.
Highestloyalty redemption net ratio at 63%
Annual Report 2018 | 3332 | National Bank of Oman
Management Discussion and Analysis Report 2018 Management Discussion and Analysis Report 2018

Every individual has a clear sense of what is expected of them, what kind of opportunities are open to them, and what they need to do to prepare themselves to reach higher levels within the organization. Then we make sure they have all the resources and support to enable them to do that, and to contribute their ideas and creativity to the success of NBO.
Investing in innovationWe believe innovation is central to the future development of Oman and we are committed to supporting entrepreneurial businesses and the people behind them.
In the five years that we have been running our Ibtikar innovation program, in which teams of employees compete to win development funding for their ideas and prototypes, 32 ideas have come to fruition. One of the latest is called ‘Marketplace’, which enables our merchant customers to target relevant offers and deals to retail customers using their NBO cards. It is adding value at both ends of the transaction and epitomizes the combination of digitalization, innovation and personalization that has driven our performance over the past 18 months. It also empowers our people to appreciate how their ideas and innovations can make a tangible contribution to our business.
Last year, our Academy of Excellence organized 439 training courses and delivered more than 10,000 training days in total, at an average of seven training days per employee. We also hired several new graduates, contributing to a 93% Omanization rate.
The new hires support the Government’s pledge to create 25,000 jobs for Omani nationals that will further advance the economic and social development of Oman, in line with the Vision 2040 national development plan.
In a similar vein, our annual 24-hour ‘hackathon’ enjoyed a second successful year, with over 500 student developers, coders, programmers and designers challenged to find solutions that embrace the future of banking.
The hackathon is part of our commitment to encourage innovation and support Oman’s young and talented minds. As is our ‘Innovation in SME Award’, which aims to engage with local entrepreneurs and SMEs, to help them turn their next great business idea into a commercial reality. We also introduced our ‘Tijarati’ SME speaker series, bringing together business influencers and thought-leaders to encourage debate, connections and knowledge-sharing among the country’s small businesses and budding entrepreneurs.
Strategy for sustainable successWe appreciate the support and guidance of our industry regulator, the Central Bank of Oman, which holds all banks in the Sultanate to the highest standards of governance, and we thank the Central bank of UAE for its continued support. We engage closely with our stakeholders on corporate governance issues and our annual audit ensures we adhere to regulations and comply with all changes introduced to support banks in this challenging environment, including our successful implementation of IFRS 9.
There is, of course, always more work to do to ensure long term success in a rapidly changing world. But our relentless focus on delivering a superior customer experience, and of prioritizing profit over growth, provides a solid, stable platform for sustainable success.
Combined with our team of empowered, committed people, our forward-looking strategy means we are strongly positioned to drive NBO forward through its next phase of growth, to support the development of Oman and its people, and to build a bank fit for the future.
Combined with our team of empowered, committed people, our forward-looking strategy means we are strongly positioned to drive NBO forward through its next phase of growth, to support the development of Oman and its people, and to build a bank fit for the future.
We focus relentlessly on delivering a superior customer experience and prioritizing profit over growth.
32 430 10,000training days total throughout 2018
protoype ideas by employees come to fruition
training courses organized and completed
Annual Report 2018 | 3534 | National Bank of Oman
Management Discussion and Analysis Report 2018 Management Discussion and Analysis Report 2018

Corporate Governance Report 2018

38 | National Bank of Oman Annual Report 2018 | 39
Corporate governance deals with the way companies are managed and led, defines the roles of the Directors and formalizes the internal control process within the institution.
The Board of Directors of National Bank of Oman (the Bank) supports the fostering of a healthy governance culture at the Bank. Accordingly, the Board and its Committees continuously evaluate and improve their governance practices, policies and procedures and confirm that the Bank applies the principles set out in the Capital Market Authority (the “CMA”) Code of Corporate Governance (the “Code”) as amended for Muscat Securities Market (the “MSM”) Listed Companies and the regulations for Corporate Governance of Banking and Financial Institutions issued by the Central Bank of Oman (the “CBO”).
The Bank received the following awards and accolades during 2018:
• Oman Entrepreneurship Award 2018, “Best Financial Support” at the third edition of the Oman Entrepreneurship Awards.
• “Excellence in Mobile Banking” by Oman Banking & Finance Awards, powered by Oman Economic Review.
• “Best Commercial Project” for the Head Office Building by the Dossier Construction Infrastructure Awards and Summit (DCIAS).
• “Luxury 100 Award” by Signature Magazine, for its Luxurious Banking Services 2018.
• The STP Excellence Award by Citibank, for its US dollar (USD) fund transfer service.
In accordance with the directives of the Code promulgated by the CMA, the Bank continues to include a separate report on the Bank’s Corporate Governance which is duly certified by the statutory auditors within the Annual Report.
Board of DirectorsThe Board of Directors is responsible for the overall direction, supervision and control of the Bank. Specific responsibilities of the Board include approving the business objectives of the Bank, approving strategies and policies which need to be pursued in order to achieve these objectives, and reviewing on an on-going basis the performance of the Bank in relation to its stated objectives as well as adherence to policies.
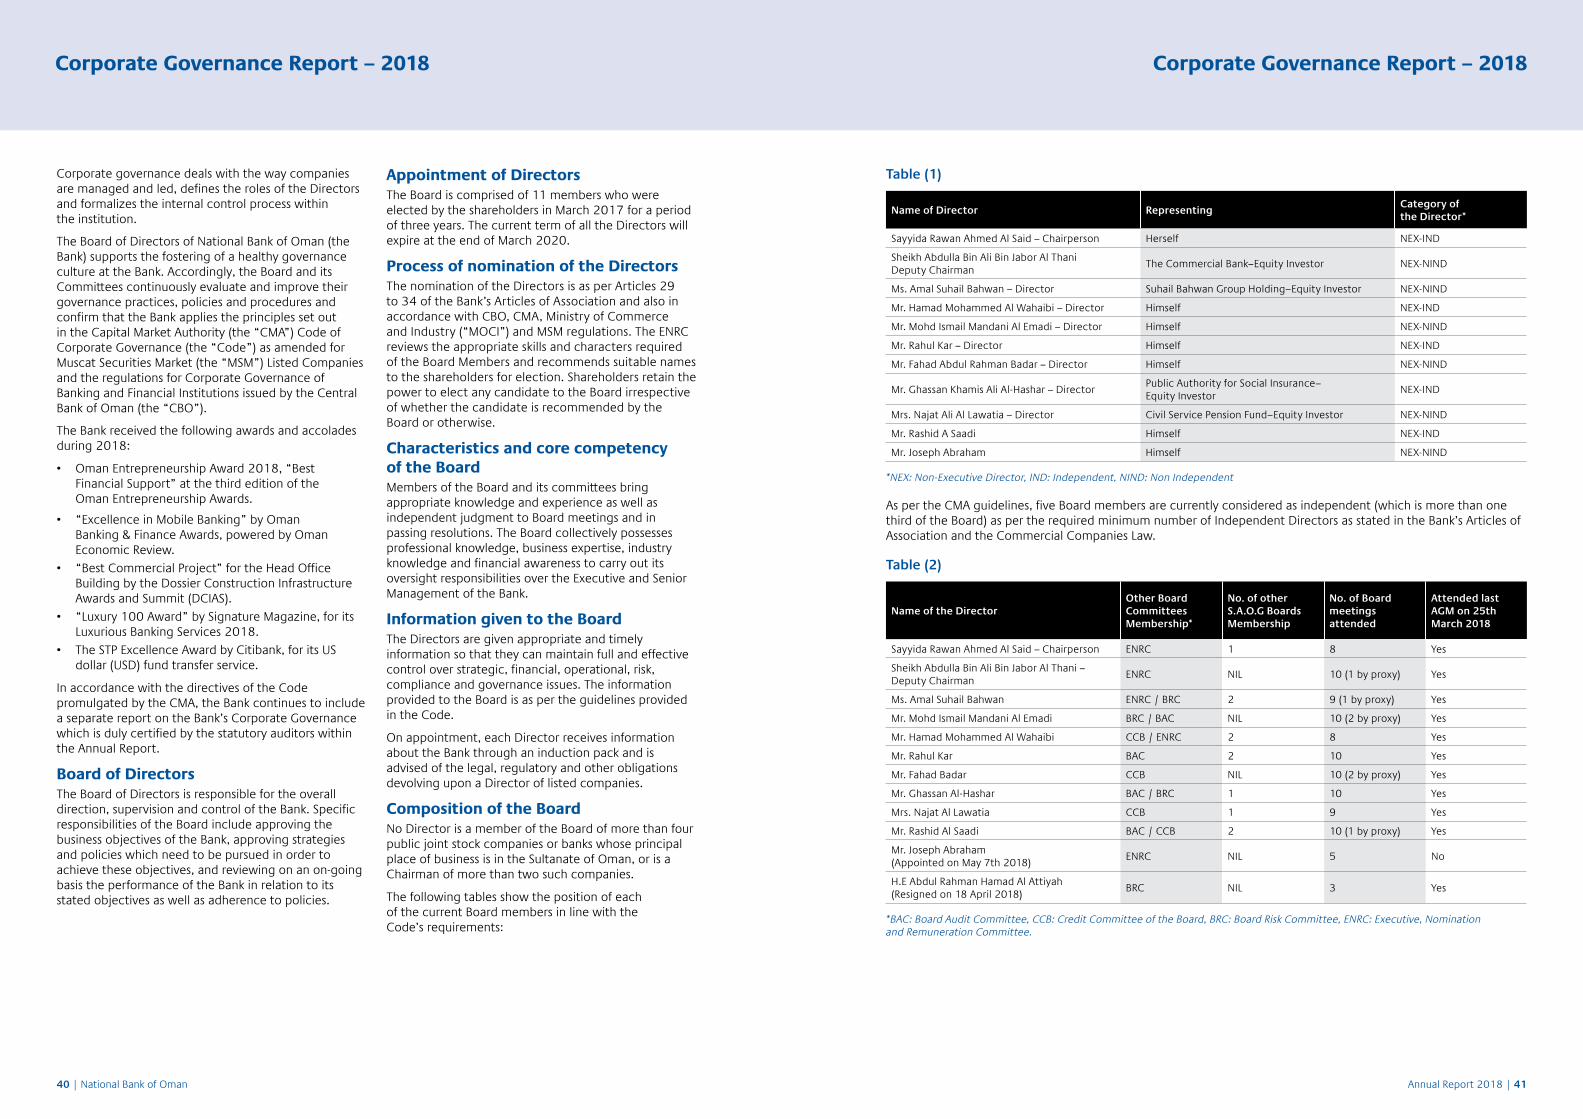
Appointment of DirectorsThe Board is comprised of 11 members who were elected by the shareholders in March 2017 for a period of three years. The current term of all the Directors will expire at the end of March 2020.
Process of nomination of the DirectorsThe nomination of the Directors is as per Articles 29 to 34 of the Bank’s Articles of Association and also in accordance with CBO, CMA, Ministry of Commerce and Industry (“MOCI”) and MSM regulations. The ENRC reviews the appropriate skills and characters required of the Board Members and recommends suitable names to the shareholders for election. Shareholders retain the power to elect any candidate to the Board irrespective of whether the candidate is recommended by the Board or otherwise.
Characteristics and core competency of the BoardMembers of the Board and its committees bring appropriate knowledge and experience as well as independent judgment to Board meetings and in passing resolutions. The Board collectively possesses professional knowledge, business expertise, industry knowledge and financial awareness to carry out its oversight responsibilities over the Executive and Senior Management of the Bank.
Information given to the BoardThe Directors are given appropriate and timely information so that they can maintain full and effective control over strategic, financial, operational, risk, compliance and governance issues. The information provided to the Board is as per the guidelines provided in the Code.
On appointment, each Director receives information about the Bank through an induction pack and is advised of the legal, regulatory and other obligations devolving upon a Director of listed companies.
Composition of the BoardNo Director is a member of the Board of more than four public joint stock companies or banks whose principal place of business is in the Sultanate of Oman, or is a Chairman of more than two such companies.
The following tables show the position of each of the current Board members in line with the Code’s requirements:
Table (2)
Name of Director RepresentingCategory of the Director*
Sayyida Rawan Ahmed Al Said – Chairperson Herself NEX-IND
Sheikh Abdulla Bin Ali Bin Jabor Al Thani Deputy Chairman
The Commercial Bank–Equity Investor NEX-NIND
Ms. Amal Suhail Bahwan – Director Suhail Bahwan Group Holding–Equity Investor NEX-NIND
Mr. Hamad Mohammed Al Wahaibi – Director Himself NEX-IND
Mr. Mohd Ismail Mandani Al Emadi – Director Himself NEX-NIND
Mr. Rahul Kar – Director Himself NEX-IND
Mr. Fahad Abdul Rahman Badar – Director Himself NEX-NIND
Mr. Ghassan Khamis Ali Al-Hashar – DirectorPublic Authority for Social Insurance– Equity Investor
NEX-IND
Mrs. Najat Ali Al Lawatia – Director Civil Service Pension Fund–Equity Investor NEX-NIND
Mr. Rashid A Saadi Himself NEX-IND
Mr. Joseph Abraham Himself NEX-NIND
Name of the DirectorOther Board Committees Membership*
No. of other S.A.O.G Boards Membership
No. of Board meetings attended
Attended last AGM on 25th March 2018
Sayyida Rawan Ahmed Al Said – Chairperson ENRC 1 8 Yes
Sheikh Abdulla Bin Ali Bin Jabor Al Thani – Deputy Chairman
ENRC NIL 10 (1 by proxy) Yes
Ms. Amal Suhail Bahwan ENRC / BRC 2 9 (1 by proxy) Yes
Mr. Mohd Ismail Mandani Al Emadi BRC / BAC NIL 10 (2 by proxy) Yes
Mr. Hamad Mohammed Al Wahaibi CCB / ENRC 2 8 Yes
Mr. Rahul Kar BAC 2 10 Yes
Mr. Fahad Badar CCB NIL 10 (2 by proxy) Yes
Mr. Ghassan Al-Hashar BAC / BRC 1 10 Yes
Mrs. Najat Al Lawatia CCB 1 9 Yes
Mr. Rashid Al Saadi BAC / CCB 2 10 (1 by proxy) Yes
Mr. Joseph Abraham (Appointed on May 7th 2018)
ENRC NIL 5 No
H.E Abdul Rahman Hamad Al Attiyah (Resigned on 18 April 2018)
BRC NIL 3 Yes
*NEX: Non-Executive Director, IND: Independent, NIND: Non Independent
*BAC: Board Audit Committee, CCB: Credit Committee of the Board, BRC: Board Risk Committee, ENRC: Executive, Nomination and Remuneration Committee.
As per the CMA guidelines, five Board members are currently considered as independent (which is more than one third of the Board) as per the required minimum number of Independent Directors as stated in the Bank’s Articles of Association and the Commercial Companies Law.
Table (1)
40 | National Bank of Oman Annual Report 2018 | 41
Corporate Governance Report – 2018Corporate Governance Report – 2018
Number and dates of Board meetingsNational Bank of Oman held ten Board meetings during 2018. They were on January 28th, February 21st, March 25th, April 29th, May 14th, July 29th, September 12th, October 29th, December 16th and December 20th 2018. The maximum interval between two meetings was 76 days. This is in compliance with the current regulations, which require meetings to be held within a maximum time gap of four months.
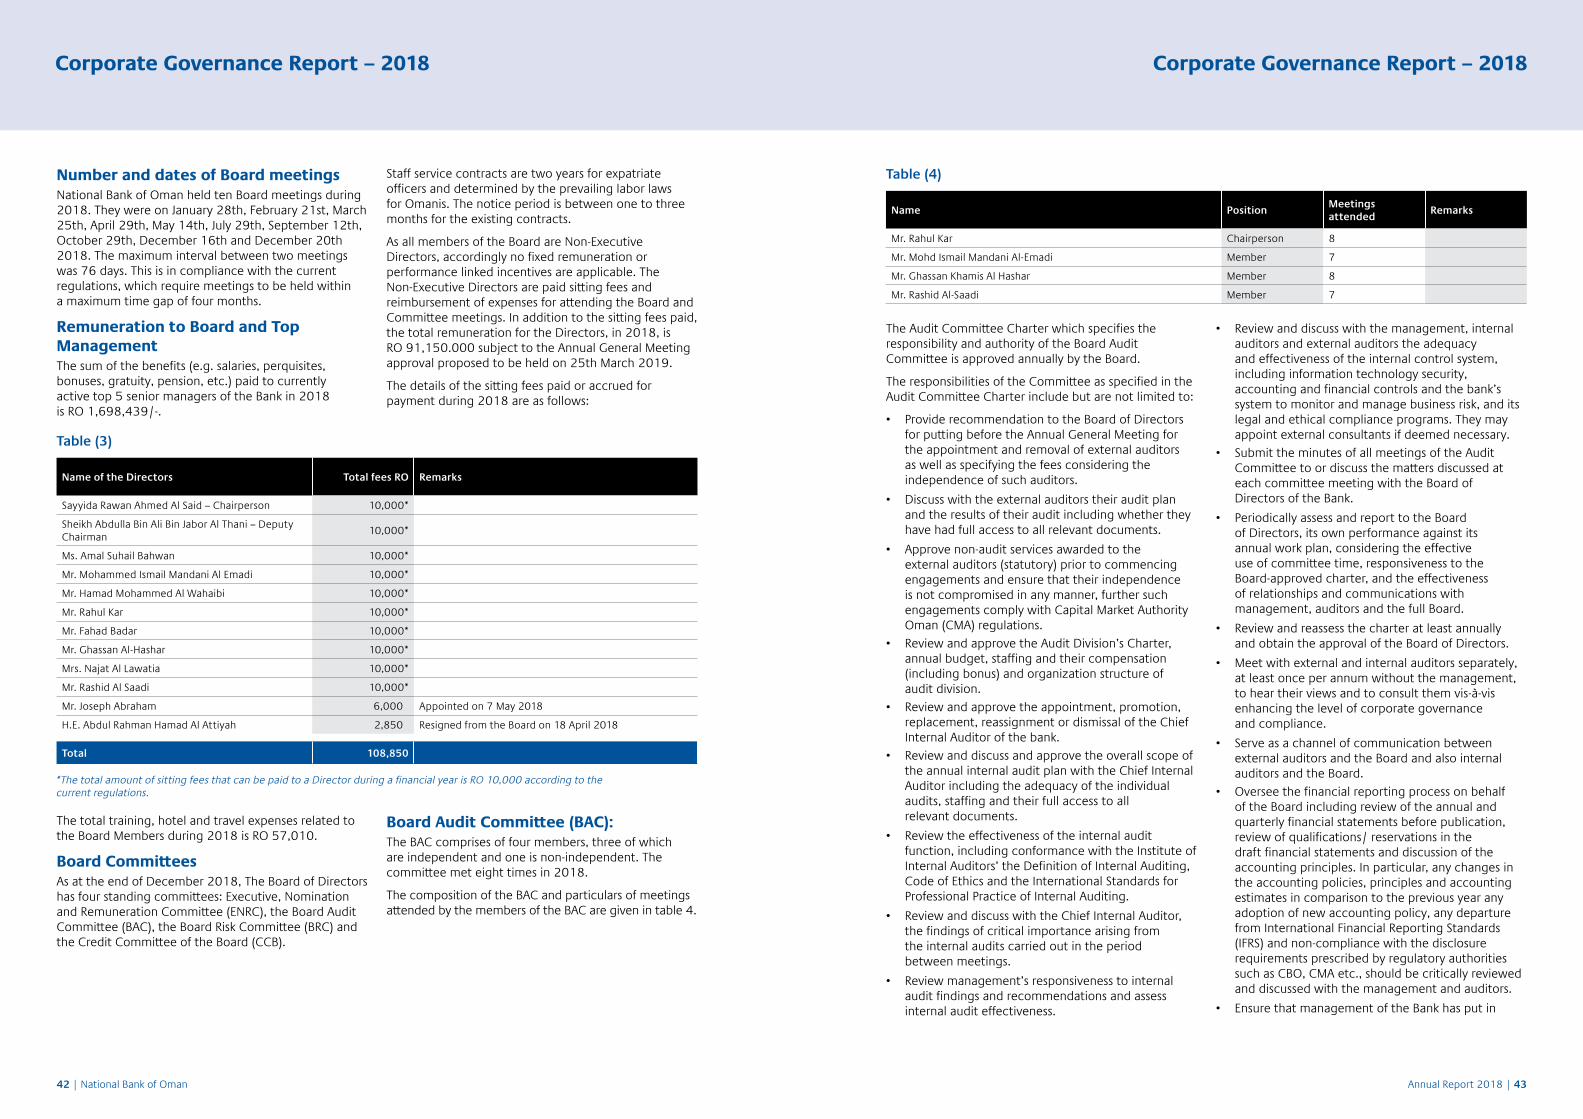
Remuneration to Board and Top ManagementThe sum of the benefits (e.g. salaries, perquisites, bonuses, gratuity, pension, etc.) paid to currently active top 5 senior managers of the Bank in 2018 is RO 1,698,439/-.
Staff service contracts are two years for expatriate officers and determined by the prevailing labor laws for Omanis. The notice period is between one to three months for the existing contracts.
As all members of the Board are Non-Executive Directors, accordingly no fixed remuneration or performance linked incentives are applicable. The Non-Executive Directors are paid sitting fees and reimbursement of expenses for attending the Board and Committee meetings. In addition to the sitting fees paid, the total remuneration for the Directors, in 2018, is RO 91,150.000 subject to the Annual General Meeting approval proposed to be held on 25th March 2019.
The details of the sitting fees paid or accrued for payment during 2018 are as follows:
Table (3)
Name of the Directors Total fees RO Remarks
Sayyida Rawan Ahmed Al Said – Chairperson 10,000*
Sheikh Abdulla Bin Ali Bin Jabor Al Thani – Deputy Chairman
10,000*
Ms. Amal Suhail Bahwan 10,000*
Mr. Mohammed Ismail Mandani Al Emadi 10,000*
Mr. Hamad Mohammed Al Wahaibi 10,000*
Mr. Rahul Kar 10,000*
Mr. Fahad Badar 10,000*
Mr. Ghassan Al-Hashar 10,000*
Mrs. Najat Al Lawatia 10,000*
Mr. Rashid Al Saadi 10,000*
Mr. Joseph Abraham 6,000 Appointed on 7 May 2018
H.E. Abdul Rahman Hamad Al Attiyah 2,850 Resigned from the Board on 18 April 2018
Total 108,850
*The total amount of sitting fees that can be paid to a Director during a financial year is RO 10,000 according to the current regulations.
The total training, hotel and travel expenses related to the Board Members during 2018 is RO 57,010.
Board CommitteesAs at the end of December 2018, The Board of Directors has four standing committees: Executive, Nomination and Remuneration Committee (ENRC), the Board Audit Committee (BAC), the Board Risk Committee (BRC) and the Credit Committee of the Board (CCB).
Board Audit Committee (BAC):The BAC comprises of four members, three of which are independent and one is non-independent. The committee met eight times in 2018.
The composition of the BAC and particulars of meetings attended by the members of the BAC are given in table 4.
Table (4)
Name PositionMeetings attended
Remarks
Mr. Rahul Kar Chairperson 8
Mr. Mohd Ismail Mandani Al-Emadi Member 7
Mr. Ghassan Khamis Al Hashar Member 8
Mr. Rashid Al-Saadi Member 7
The Audit Committee Charter which specifies the responsibility and authority of the Board Audit Committee is approved annually by the Board.
The responsibilities of the Committee as specified in the Audit Committee Charter include but are not limited to:
• Provide recommendation to the Board of Directors for putting before the Annual General Meeting for the appointment and removal of external auditors as well as specifying the fees considering the independence of such auditors.
• Discuss with the external auditors their audit plan and the results of their audit including whether they have had full access to all relevant documents.
• Approve non-audit services awarded to the external auditors (statutory) prior to commencing engagements and ensure that their independence is not compromised in any manner, further such engagements comply with Capital Market Authority Oman (CMA) regulations.
• Review and approve the Audit Division’s Charter, annual budget, staffing and their compensation (including bonus) and organization structure of audit division.
• Review and approve the appointment, promotion, replacement, reassignment or dismissal of the Chief Internal Auditor of the bank.
• Review and discuss and approve the overall scope of the annual internal audit plan with the Chief Internal Auditor including the adequacy of the individual audits, staffing and their full access to all relevant documents.
• Review the effectiveness of the internal audit function, including conformance with the Institute of Internal Auditors’ the Definition of Internal Auditing, Code of Ethics and the International Standards for Professional Practice of Internal Auditing.
• Review and discuss with the Chief Internal Auditor, the findings of critical importance arising from the internal audits carried out in the period between meetings.
• Review management’s responsiveness to internal audit findings and recommendations and assess internal audit effectiveness.
• Review and discuss with the management, internal auditors and external auditors the adequacy and effectiveness of the internal control system, including information technology security, accounting and financial controls and the bank’s system to monitor and manage business risk, and its legal and ethical compliance programs. They may appoint external consultants if deemed necessary.
• Submit the minutes of all meetings of the Audit Committee to or discuss the matters discussed at each committee meeting with the Board of Directors of the Bank.
• Periodically assess and report to the Board of Directors, its own performance against its annual work plan, considering the effective use of committee time, responsiveness to the Board-approved charter, and the effectiveness of relationships and communications with management, auditors and the full Board.
• Review and reassess the charter at least annually and obtain the approval of the Board of Directors.
• Meet with external and internal auditors separately, at least once per annum without the management, to hear their views and to consult them vis-à-vis enhancing the level of corporate governance and compliance.
• Serve as a channel of communication between external auditors and the Board and also internal auditors and the Board.
• Oversee the financial reporting process on behalf of the Board including review of the annual and quarterly financial statements before publication, review of qualifications/ reservations in the draft financial statements and discussion of the accounting principles. In particular, any changes in the accounting policies, principles and accounting estimates in comparison to the previous year any adoption of new accounting policy, any departure from International Financial Reporting Standards (IFRS) and non-compliance with the disclosure requirements prescribed by regulatory authorities such as CBO, CMA etc., should be critically reviewed and discussed with the management and auditors.
• Ensure that management of the Bank has put in
42 | National Bank of Oman Annual Report 2018 | 43
Corporate Governance Report – 2018Corporate Governance Report – 2018
place an appropriate system for the adoption of relevant accounting policies and principles leading to the true and fairness of the financial statements. Against this system, the committee should review the financial statements for any content of fictitious or fraudulent nature.
• Review the details of all proposed related party transactions in line with the Bank’s policy (complies with the CMA code of Corporate Governance) and provide appropriate recommendation to the Board.
• Periodically review internal audit findings on the
‘restructured’ loans upgraded to ‘regular’ category for information and provide appropriate directions thereon to the management.
• Review of details of fraud reports presented in line with CBO regulations.
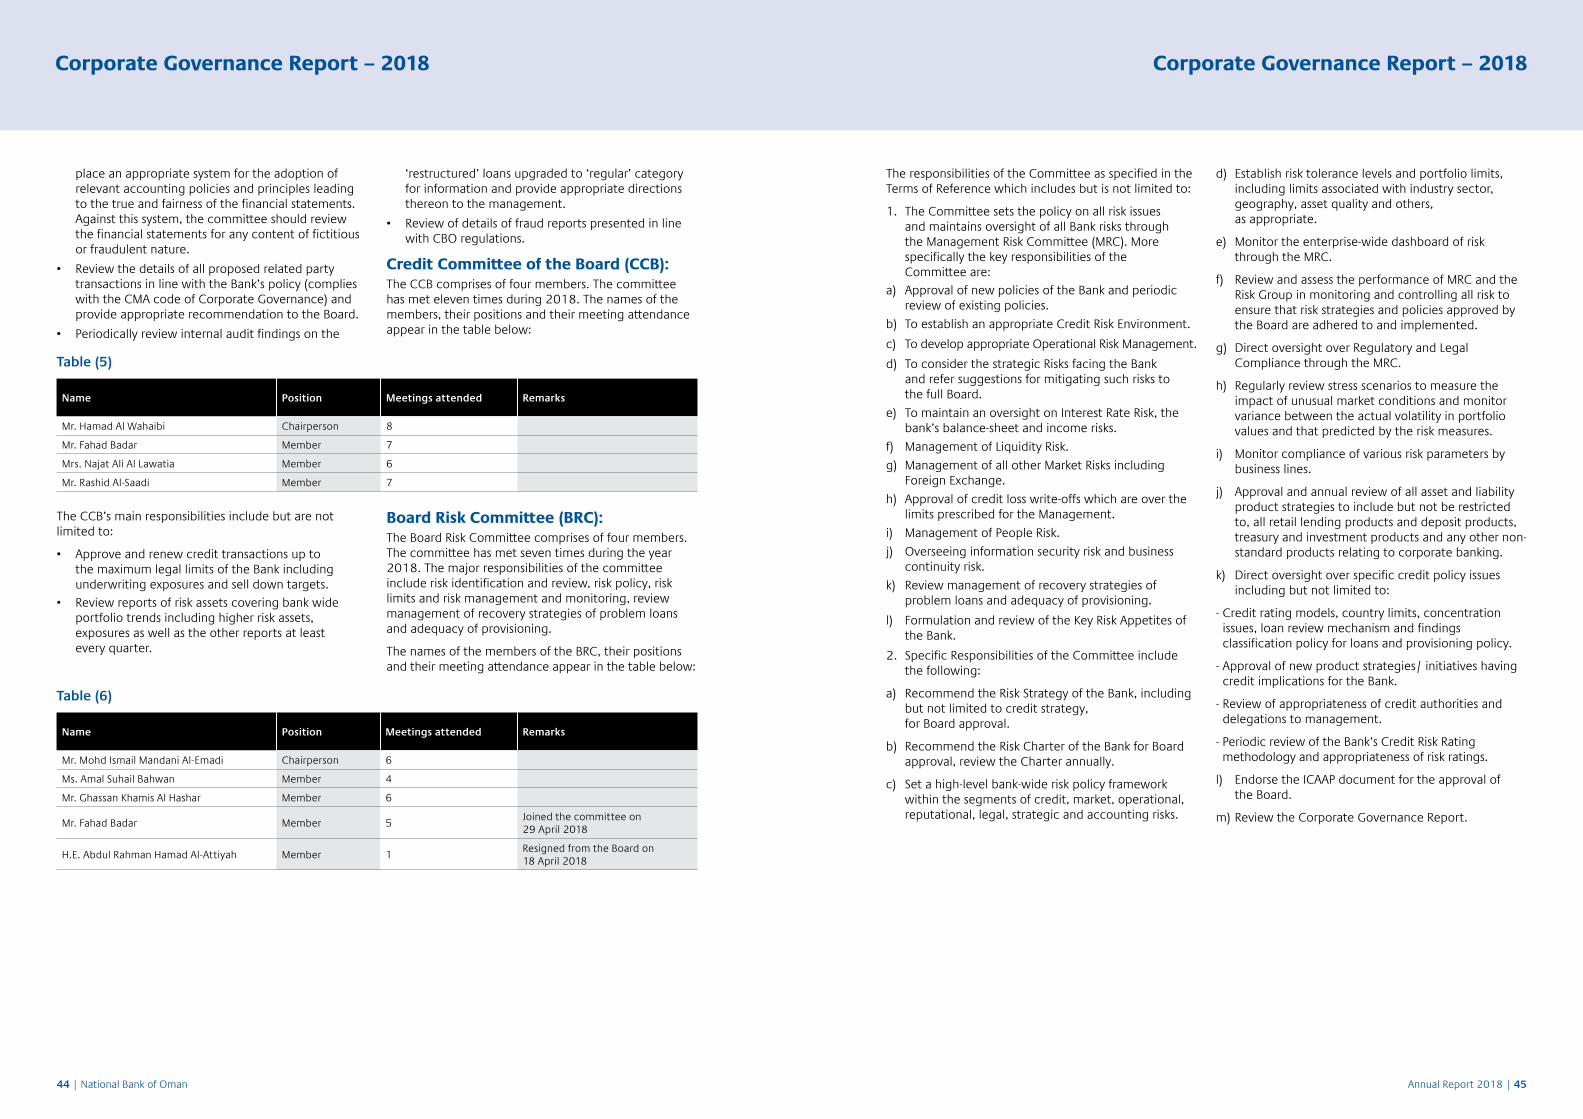
Credit Committee of the Board (CCB):The CCB comprises of four members. The committee has met eleven times during 2018. The names of the members, their positions and their meeting attendance appear in the table below:
Table (5)
Table (6)
Name Position Meetings attended Remarks
Mr. Hamad Al Wahaibi Chairperson 8
Mr. Fahad Badar Member 7
Mrs. Najat Ali Al Lawatia Member 6
Mr. Rashid Al-Saadi Member 7
Name Position Meetings attended Remarks
Mr. Mohd Ismail Mandani Al-Emadi Chairperson 6
Ms. Amal Suhail Bahwan Member 4
Mr. Ghassan Khamis Al Hashar Member 6
Mr. Fahad Badar Member 5Joined the committee on 29 April 2018
H.E. Abdul Rahman Hamad Al-Attiyah Member 1Resigned from the Board on 18 April 2018
The CCB’s main responsibilities include but are not limited to:
• Approve and renew credit transactions up to the maximum legal limits of the Bank including underwriting exposures and sell down targets.
• Review reports of risk assets covering bank wide portfolio trends including higher risk assets, exposures as well as the other reports at least every quarter.
Board Risk Committee (BRC):The Board Risk Committee comprises of four members. The committee has met seven times during the year 2018. The major responsibilities of the committee include risk identification and review, risk policy, risk limits and risk management and monitoring, review management of recovery strategies of problem loans and adequacy of provisioning.
The names of the members of the BRC, their positions and their meeting attendance appear in the table below:
The responsibilities of the Committee as specified in the Terms of Reference which includes but is not limited to:
1. The Committee sets the policy on all risk issues and maintains oversight of all Bank risks through the Management Risk Committee (MRC). More specifically the key responsibilities of the Committee are:
a) Approval of new policies of the Bank and periodic review of existing policies.
b) To establish an appropriate Credit Risk Environment.
c) To develop appropriate Operational Risk Management.
d) To consider the strategic Risks facing the Bank and refer suggestions for mitigating such risks to the full Board.
e) To maintain an oversight on Interest Rate Risk, the bank’s balance-sheet and income risks.
f) Management of Liquidity Risk.
g) Management of all other Market Risks including Foreign Exchange.
h) Approval of credit loss write-offs which are over the limits prescribed for the Management.
i) Management of People Risk.
j) Overseeing information security risk and business continuity risk.
k) Review management of recovery strategies of problem loans and adequacy of provisioning.
l) Formulation and review of the Key Risk Appetites of the Bank.
2. Specific Responsibilities of the Committee include the following:
a) Recommend the Risk Strategy of the Bank, including but not limited to credit strategy, for Board approval.
b) Recommend the Risk Charter of the Bank for Board approval, review the Charter annually.
c) Set a high-level bank-wide risk policy framework within the segments of credit, market, operational, reputational, legal, strategic and accounting risks.
d) Establish risk tolerance levels and portfolio limits, including limits associated with industry sector, geography, asset quality and others, as appropriate.
e) Monitor the enterprise-wide dashboard of risk through the MRC.
f) Review and assess the performance of MRC and the Risk Group in monitoring and controlling all risk to ensure that risk strategies and policies approved by the Board are adhered to and implemented.
g) Direct oversight over Regulatory and Legal Compliance through the MRC.
h) Regularly review stress scenarios to measure the impact of unusual market conditions and monitor variance between the actual volatility in portfolio values and that predicted by the risk measures.
i) Monitor compliance of various risk parameters by business lines.
j) Approval and annual review of all asset and liability product strategies to include but not be restricted to, all retail lending products and deposit products, treasury and investment products and any other non-standard products relating to corporate banking.
k) Direct oversight over specific credit policy issues including but not limited to:
- Credit rating models, country limits, concentration issues, loan review mechanism and findings classification policy for loans and provisioning policy.
- Approval of new product strategies/ initiatives having credit implications for the Bank.
- Review of appropriateness of credit authorities and delegations to management.
- Periodic review of the Bank’s Credit Risk Rating methodology and appropriateness of risk ratings.
l) Endorse the ICAAP document for the approval of the Board.
m) Review the Corporate Governance Report.
44 | National Bank of Oman Annual Report 2018 | 45
Corporate Governance Report – 2018Corporate Governance Report – 2018
The main responsibilities of the ENRC as specified in the Terms of Reference include but are not limited to:
• Develop the long term strategy of the Bank based on economic and market conditions and the Board’s vision and recommend it for Board approval.
• Review the Bank’s overall strategy and monitor implementation and execution.
• Review the performance of the Bank against approved strategy and budgets.
• Review and recommend for Board approval the Bank’s annual Budgets and Business Plans including all Operating and Capital Expenditure budgets of the Bank in line with the long term strategy and changes in economical, market and regulatory environments.
• Review reports and analysis of the Bank’s financial and operating performance, and evaluate key performance indicators against their accompanying strategies.
• Review the performance of the Investment Banking function including all investments reports.
• Review and recommend to the Board the Bank’s proposals for Capital Raising Plan.
• Review and approve the Banks Dividend Policy and recommend to the Board the proposed dividend payout.
• Review and approve NBO’s brand vision.• Review and approve the Bank’s Human Resources
Manual and Policy and the Bank’s Compensation Policy and Bonus Plan.
• Be responsible for setting the Bank’s remuneration
framework for management and staff as per the Bank’s Compensation Policy and Bonus Plan and ensure its proper implementation.
• Review prevailing compensation and benefits and ensure consistency with market trends as per the Bank’s Compensation Policy and Bonus Plan in accordance with regulatory guidelines.
• Review, approve and amend policies related to employee reward and performance related incentive plans and assume the function and responsibilities of the Remuneration Committee as specified in the Bank’s Compensation Policy as approved by the Board.
• Handle appointment and movement of key executives in the Bank from the reward level Assistant General Manager (AGM) and above.
• Review and approve major changes in the Bank’s organizational structure at the level of Divisional Heads and above.
• Have specific responsibility to recommend for Board approval, and to review and update as necessary, a general strategy and policies for the acquisition, ownership and development of the Bank’s properties.
• Approve the acquisition and sale of any property required for the business of the Bank.
• Approve the appointment of construction companies and consultants for the Bank’s Head Office, and agree the terms of any construction contract (including any variation order), consultancy or property or facilities management contract relating to any property owned by the Bank.
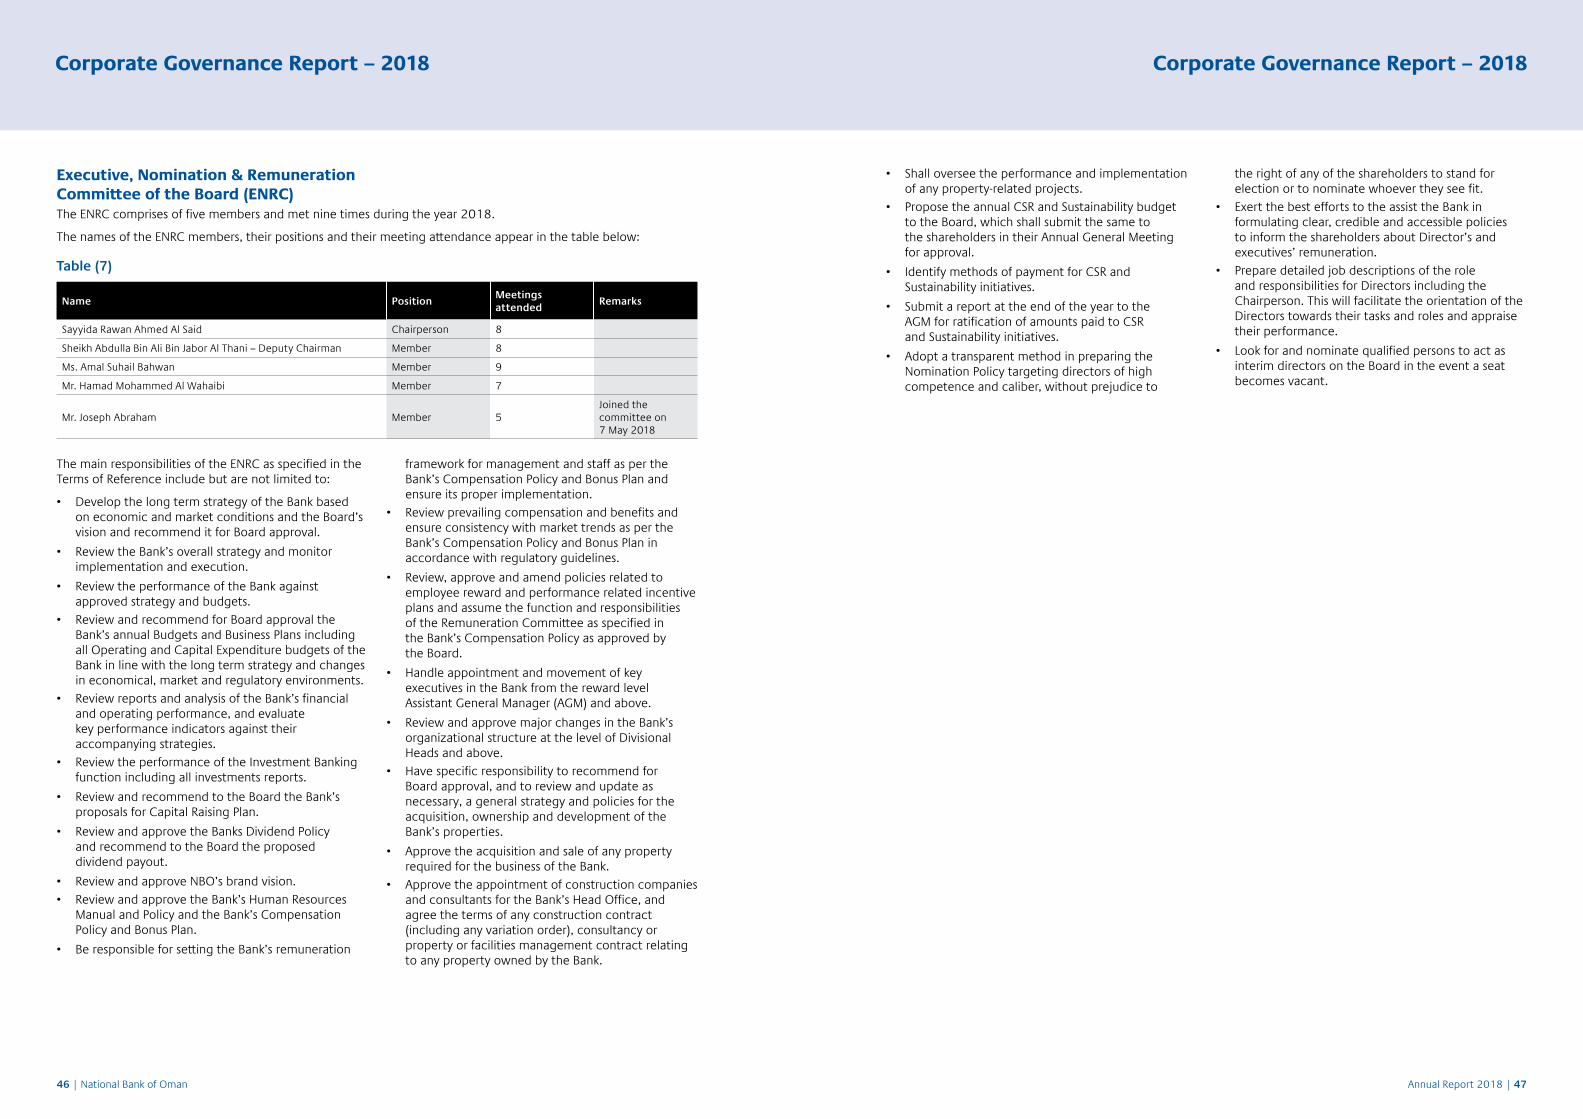
Table (7)
Name PositionMeetings attended
Remarks
Sayyida Rawan Ahmed Al Said Chairperson 8
Sheikh Abdulla Bin Ali Bin Jabor Al Thani – Deputy Chairman Member 8
Ms. Amal Suhail Bahwan Member 9
Mr. Hamad Mohammed Al Wahaibi Member 7
Mr. Joseph Abraham Member 5Joined the committee on 7 May 2018
Executive, Nomination & Remuneration Committee of the Board (ENRC)The ENRC comprises of five members and met nine times during the year 2018.
The names of the ENRC members, their positions and their meeting attendance appear in the table below:
• Shall oversee the performance and implementation of any property-related projects.
• Propose the annual CSR and Sustainability budget to the Board, which shall submit the same to the shareholders in their Annual General Meeting for approval.
• Identify methods of payment for CSR and Sustainability initiatives.
• Submit a report at the end of the year to the AGM for ratification of amounts paid to CSR and Sustainability initiatives.
• Adopt a transparent method in preparing the Nomination Policy targeting directors of high competence and caliber, without prejudice to
the right of any of the shareholders to stand for election or to nominate whoever they see fit.
• Exert the best efforts to the assist the Bank in formulating clear, credible and accessible policies to inform the shareholders about Director’s and executives’ remuneration.
• Prepare detailed job descriptions of the role and responsibilities for Directors including the Chairperson. This will facilitate the orientation of the Directors towards their tasks and roles and appraise their performance.
• Look for and nominate qualified persons to act as interim directors on the Board in the event a seat becomes vacant.
46 | National Bank of Oman Annual Report 2018 | 47
Corporate Governance Report – 2018Corporate Governance Report – 2018

Corporate Governance Report – 2018 Board Members Profiles
Corporate Governance Report – 2018 Board Members Profiles
48 | National Bank of Oman Annual Report 2018 | 49
Sayyida Rawan Ahmed Al Said, ChairpersonChairperson of the Executive, Nomination and Remuneration Committee (ENRC)
Sayyida Dr. Rawan Ahmed Al Said is the CEO of Takaful Oman SAOG, prior to joining Takaful Oman, she was the Managing Director and CEO of ONIC Holding Corporation. Before moving to the Private Sector, Rawan was the Deputy CEO-Investment for the State General Reserve Fund of Oman, leading the execution of many mega investments internationally. She has almost 30 years of experience in the financial industry, 20 of which are in the Public sector. Sayyida Rawan remains to be the First and the only Female who holds a CEO position in a public listed company in Oman.
She has been a member on the Board of a number of reputed Companies and Financial Institutions in Public and private sector in Oman and the GCC region. Chairperson in National Bank of Oman, Deputy Chairperson in Oman Oil Marketing Company, Board Member of Oman National Investments Development Company ONIDCO (Tanmia) and Chairperson of its equity and GCC funds committee. In the public sector, she was on the board of Oman Oil Company SOAC and its audit committee. She was on the Board Member of International General Insurance (IGI) Jordan, and National Finance House (NFH), Bahrain. Deputy Chairperson of Orix Finance, National Life & General Insurance Company SAOC (NLIG) and Al Ahlia Insurance.
She is also a Member on the Investment Committee of the Public Authority for Social Insurance, Board Member in Public Authority for the SME Development (Riyada). Chairperson of Al Kawther Fund (Islamic Compliant Fund) and a Member of the Investment Committee of
Orphans & Incapacitated Funds in the Ministry of Justice. She has been recently appointed as a Board member of the Sultan Qaboos University Council.
Awards and Recognition:
In 2011, she was bestowed the Business Professional (BizPro) Leader Award. In 2012, was ranked 14th in Forbes Middle East for the ‘Most Powerful Arab Business Women in Listed Companies’. In 2014, Rawan was named among the Best Chief Executives in the region by Trend in collaboration with INSEAD (The Business School for the World). Also she was Awarded Hall of Fame by MARA Excellence Awards. In 2015, she was honored with two prestigious Awards; Asian Women Leadership of the Year from World Leadership Congress and in MENA and Business Leader of the year from the Middle East Accountancy and Finance Excellency Awards 2015. In 2016 she was honored with Honorary Doctorate Degree from Commonwealth University in UK and she was awarded as the Best Takaful CEO from Global Business Outlook, UK. Dr. Rawan ranked 3rd in Oman for Forbes the Top 100 most powerful Arab Businesswomen 2017. In 2017 and 2018 she won the best CEO-Oman award from International Finance UK and she won Oman Women of the year awards 2018 for the inspirational woman category.
Sayyida Dr. Rawan, has an MSc in Economics & Finance from Loughborough University UK. She also holds a Post Graduate Diploma in Investment Analysis from Stirling University UK, and BA in Economics & Political Science from the American University in Cairo (AUC).
H.E. Sheikh Abdulla Bin Ali Bin Jabor Al Thani, Deputy Chairman Member of the Executive, Nomination and Remuneration Committee (ENRC)
H.E. Sheikh Abdulla bin Ali bin Jabor Al Thani has been a Director of the Bank since July 2005 and serves as a member of the Board Executive, Nomination and Remuneration Committee (ENRC). His Excellency is the Chairman of The Commercial Bank (P.S.Q.C.) in Qatar, a member of the Board of Directors for United
Arab Bank, P.J.S.C. in UAE and is the Owner of Vista Trading Company (Qatar), and a Partner in Integrated Intelligence Services Company (Qatar).
H.E. Sheikh Abdulla bin Ali bin Jabor Al Thani holds a Bachelor of Arts Degree in Social Science from Qatar University.
Corporate Governance Report – 2018 Board Members’ Profiles
Ms. Amal Suhail Bahwan, DirectorMember of the Executive, Nomination and Remuneration Committee (ENRC) and the Board Risk Committee (BRC)
Ms. Amal Suhail Bahwan is the Vice Chairperson of Suhail Bahwan Group Holding LLC. She has extensive experience in managing companies across the Bahwan Group.
She is also the Chairperson and Executive Committee member of Al Jazeera Steel Products Co. SAOG. and
Director and Board Remuneration Committee member of Oman Oil Marketing Co. SAOG.
Ms. Amal has a Bachelor’s degree in Education and a Master’s degree in Administration from the Sultan Qaboos University.
Mr. Hamad Mohammad Hamood Al Wahaibi, DirectorChairperson of the Credit Committee of the Board (CCB) and Member of the Board Executive, Nomination and Remuneration Committee (ENRC)
Mr. Hamad Mohammad Al Wahaibi has been a Director of the Bank since March 2014. He has 20 years of experience in the GCC. He has been a director of investment with the Ministry of Defense Pension Fund for the past six years. Mr. Al Wahaibi is also a member of the boards of Voltamp Energy Company and ACWA Power Company.
Mr. Al Wahaibi holds a Masters of Business Administration (MBA) degree, specializing in Finance, and he is a Chartered Financial Analyst (CFA) charter holder, Chartered Alternative Investment Analyst (CAIA) charter holder, as well as a Certificate in Investment Performance Measurement (CIPM) Certificant.
Mr. Mohammed Ismail Mandani Al Emadi, DirectorChairperson of the Board Risk Committee (BRC) and Member of the Board Audit Committee (BAC)
Mr. Mohammed Ismail Mandani Al Emadi has been a Director of the Bank since November 2014. He is also a member of the Board for The Commercial Bank (P.S.Q.C.) and a member of the Board of Alternatifbank A.S. (ABank), Turkey and has over 30 years of banking experience. Mr. Al Emadi has held a number of key roles at Commercial Bank until 2006, after which he
served as Chief Executive Officer of Qatar Real Estate Investment Company Q.S.C. up to 2011, and also served as its Director from 2003 until 2005.
Mr. Al Emadi holds a Bachelor of Arts Degree in Business Administration and Economics from Holy Names University, California.
Mr. Rahul Kar, DirectorChairperson of the Board Audit Committee (BAC)
Mr. Rahul Kar has been a Director of the Bank since April 2016. Mr. Kar is a Chartered Accountant and is currently working as the Financial Advisor to the Chairman of Suhail Bahwan Group Holding LLC.
Mr. Kar is also a Director and an Audit committee member of Al Jazeera Steel Products Co. SAOG. He is also a Director and Nomination & Remuneration committee member of Oman United Insurance Company SAOG.
Corporate Governance Report – 2018 Board Members’ Profiles
Mr. Fahad Badar, DirectorMember of the Credit Committee of the Board (CCB) and the Board Risk Committee of the Board (BRC)
Mr. Fahad Badar has been a Director of the Bank since May 2016. He is also a member of the Board for United Arab Bank, P.J.S.C. in UAE since July 2016.
Mr. Badar’s career at The Commercial Bank (P.S.Q.C.) in Qatar spans over 19 years. Prior to his current role as Executive General Manager, International Banking,
he held a number of key roles in International Banking, the Government and Public Sector Relations and the Wholesale Banking Divisions.
Mr. Badar holds an MBA from Durham University, UK and a Bachelor of Arts Degree in Banking & Finance from the University of Wales.
50 | National Bank of Oman Annual Report 2018 | 51
Mr. Rashid Bin Saif Al-Saadi, DirectorMember of the Board Audit Committee (BAC) and a Member of the Credit Committee of the Board (CCB)
Sheikh Rashid has been a member of the Board of Directors since August 2017, and is a renowned financial and investment banker, business executive, entrepreneur and philanthropist. Sheikh Rashid is also the CEO of TANMIA, a company that actively contributes to the Sultanate’s economic development.
Sheikh Rashid holds a B.Sc. in Business Administration from Rollins College, USA. His career is marked by many significant achievements and milestones; including a twelve year stint with the Diwan of Royal Court.
In 2000, Sheikh Rashid was appointed CEO of TANMIA, which was setting up its Investment Fund with the Muscat Securities Market at the time. Following his appointment, the Board of Directors decided to transfer the responsibilities of managing the fund to the company directly, and two new Funds were set up subsequently; a Private Equity Fund, the GCC Investment
Fund, and the Shari’a Fund in 2013. In addition, Sheikh Rashid also drove direct investments into various industries, including and not limited to Real Estate Development; the company played an active role in the development of the Al Mouj Muscat Project, and in the Tourism sector, the company played a key role in setting up the Kempinski Hotel, Muscat. In the Industrial Sector the company contributed to the establishment of Octal Petrochemicals, also extending into the retail sector by partnering with Al Meera Group to set up its business in the Sultanate.
In addition to his executive responsibilities, Sheikh Rashid is the Chairman of Board of Directors of Takaful Oman SAOG and A’saffa Foods SAOG. He is also a Director on the Boards of Oman National Finance Co. SAOG, Minerals Development Company SAOC, Muscat National Development and Investment SAOC, Almouj Muscat & Oman Hospitality Company.
Mr. Joseph Abraham, DirectorMember of the Executive, Nomination and Remuneration Committee (ENRC)
Mr. Abraham was appointed as a Board Member of NBO in May 2018.
Mr. Abraham is the Group Chief Executive Officer of The Commercial Bank as well as Vice-Chairman of the Board of Directors of Alternatif Bank and a Board Director of the United Arab Bank, UAE. He has extensive banking experience across both developed and emerging markets. Before joining The Commercial Bank in June 2016, he was CEO of ANZ Indonesia (Australia and New Zealand Banking Group) based in Jakarta, a position
he served in from 2008 to 2016. Mr. Abraham has an MBA from the Graduate School of Business, Stanford University, California and has worked in Indonesia, Singapore, Hong Kong, Ghana, UK and India in various country and regional banking roles with a successful track record covering general management, corporate banking, strategy, product management as well as acquisitions and integrations. Mr. Abraham was appointed as a Board Member of Alternatif Bank in December 2016.
Mr. Ghassan Khamis Al Hashar, DirectorMember of the Board Audit Committee (BAC) and the Board Risk Committee (BRC)
Mr. Al Hashar joined NBO Board as a representative of the Public Authority for Social Insurance (PASI) in March 2017. He is currently the Authority’s Director of Investments. He has over 20 years of experience in finance and investment management, and represents PASI on the boards of numerous public and private
companies. He is also a Board Director at National Life & General Insurance Company SAOG and Oman National Investments Development Company SAOC (TANMIA).
Mr. Al Hashar holds a Master’s Degree in Finance and Investment Management.
Mrs. Najat Ali Al Lawatia, DirectorMember of Credit Committee of the Board (CCB)
Ms. Najat Ali Al Lawatia was elected as a Director of the Bank at the AGM in March 2017. She holds a Commerce Bachelor Degree in accounting and has attended various courses in diverse fields of financial management, audit, investments etc. She is working as the Deputy
Director General for Support Services with Civil Service Employees Pension Fund and has more than 20 years of relevant experience.
Ms. Najat is also a Director and Chairperson of Audit Committee of Oman Cement Company SAOG.
Corporate Governance Report – 2018 Board Members’ Profiles
Corporate Governance Report – 2018 Board Members’ Profiles
Composition of the ManagementThe organization chart of the Bank’s management includes an Acting Chief Executive Officer (ACEO) as the leader of the organization whose appointment, functions and package are determined by the Board.
The General Managers are appointed to assist the ACEO and to lead functional groups in the Bank. The organization chart also includes Divisional Heads of all the direct subordinates of the ACEO. The following table gives details of the top eight management officers along with their positions:
Table (8)
Name of the Directors Position
Al Sayyid Wasfi Jamshid Al Said Acting CEO
Nasser Mohammed Al Hajri GM–Chief Operating Officer (COO)
Ananthraman Venkat GM–Chief Financial Officer (CFO)
Hassan Abdul Amir Shaban GM–Chief Government Banking Officer
Nasser Salim Al Rashdi GM – Chief Commercial Banking Officer
Salma Salim Said Al Jaaidi GM–Chief Risk Officer
John Chang GM – Chief Retail Banking Officer
Faizal Mohamed Eledath GM–Chief Transformation Officer
52 | National Bank of Oman Annual Report 2018 | 53
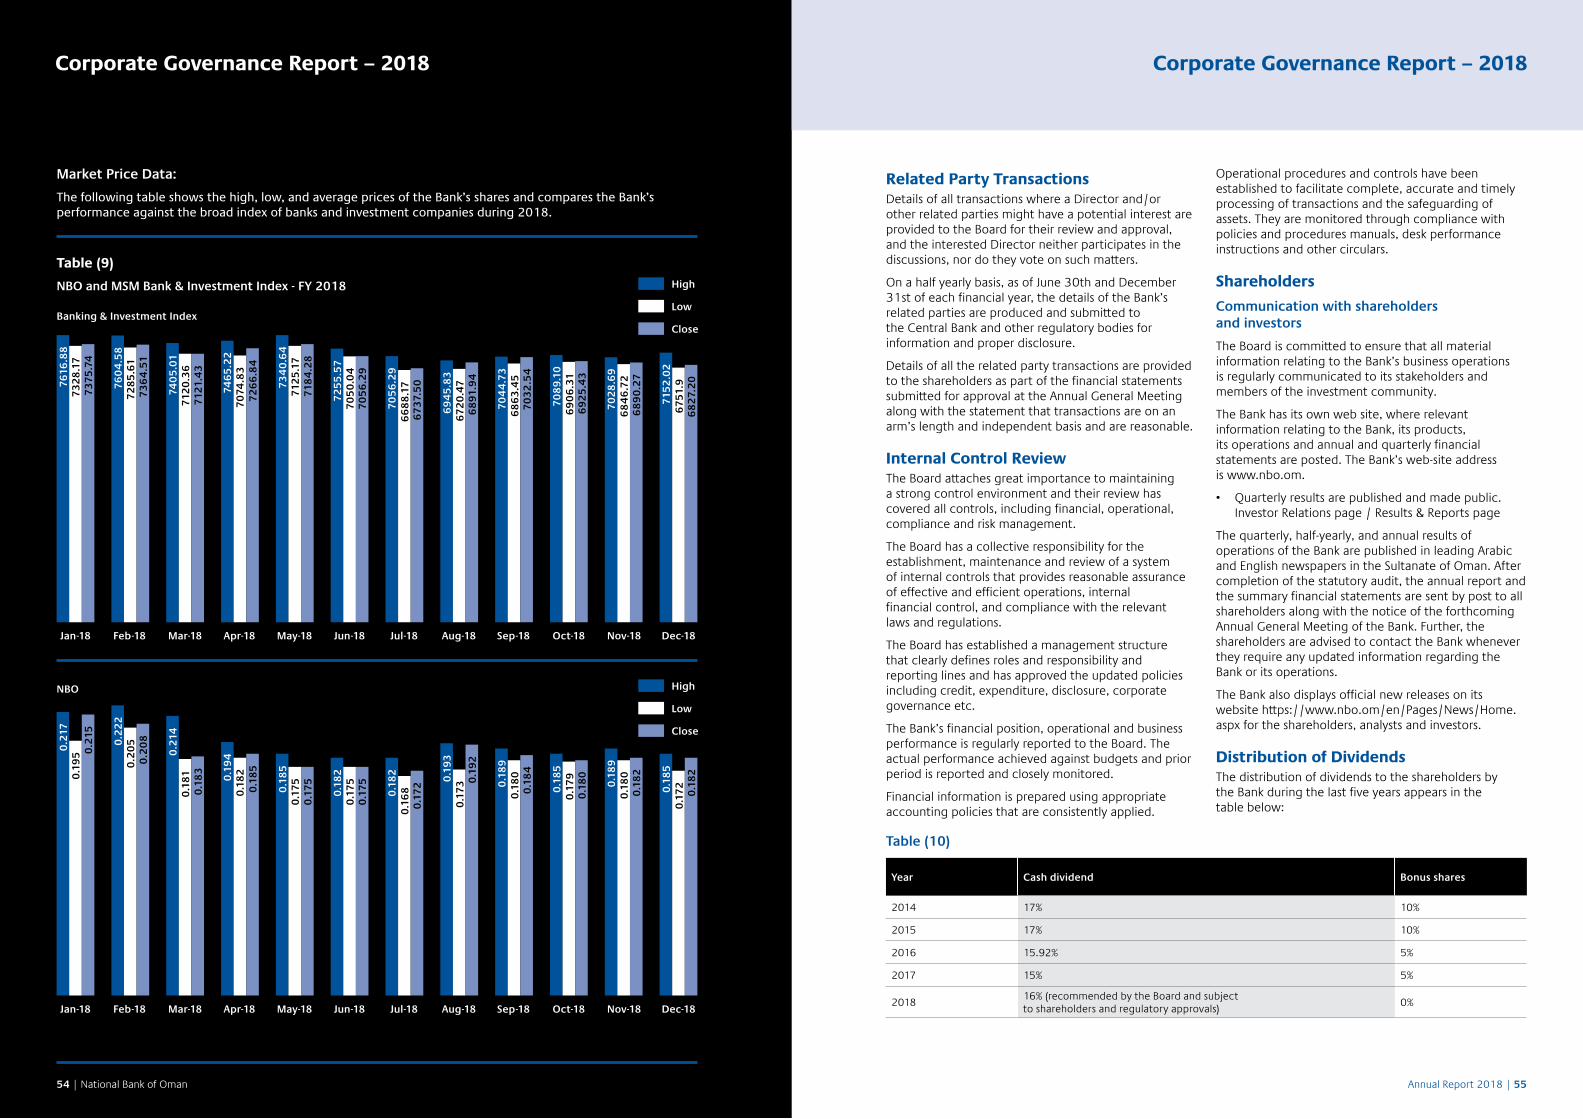
Market Price Data:
The following table shows the high, low, and average prices of the Bank’s shares and compares the Bank’s performance against the broad index of banks and investment companies during 2018.
Table (9)
NBO and MSM Bank & Investment Index - FY 2018
Jan-18
Jan-18
Feb-18
Feb-18
Mar-18
Mar-18
Apr-18
Apr-18
May-18
May-18
Jun-18
Jun-18
Jul-18
Jul-18
Aug-18
Aug-18
Sep-18
Sep-18
Oct-18
Oct-18
Nov-18
Nov-18
Dec-18
Dec-18
7616
.88
0.2
17
760
4.5
80
.22
2
740
5.0
10
.214
746
5.2
20
.19
4
73
40
.64
0.1
85
725
5.5
70
.18
2
705
6.2
90
.18
2
69
45
.83
0.1
93
704
4.7
30
.18
9
708
9.1
00
.18
5
702
8.6
90
.18
9
7152
.02
0.1
85
732
8.1
70
.19
5
728
5.6
10
.20
5
712
0.3
60
.181
7074
.83
0.1
82
712
5.1
70
.17
5
705
0.0
40
.17
5
66
88
.17
0.1
68
672
0.4
70
.17
3
68
63
.45
0.1
80
69
06
.31
0.1
79
68
46
.72
0.1
80
67
51.9
0.1
72
705
6.2
90
.17
5
67
37.5
00
.172
68
91.9
40
.192
7032
.54
0.1
84
692
5.4
30
.18
0
68
90
.27
0.1
82
68
27.
20
0.1
82
718
4.2
80
.17
5
726
6.8
40
.18
5
7121
.43
0.1
83
73
64
.51
0.2
08
737
5.7
40
.215
Banking & Investment Index
NBO
High
Low
Close
High
Low
Close
Related Party TransactionsDetails of all transactions where a Director and/or other related parties might have a potential interest are provided to the Board for their review and approval, and the interested Director neither participates in the discussions, nor do they vote on such matters.
On a half yearly basis, as of June 30th and December 31st of each financial year, the details of the Bank’s related parties are produced and submitted to the Central Bank and other regulatory bodies for information and proper disclosure.
Details of all the related party transactions are provided to the shareholders as part of the financial statements submitted for approval at the Annual General Meeting along with the statement that transactions are on an arm’s length and independent basis and are reasonable.
Internal Control ReviewThe Board attaches great importance to maintaining a strong control environment and their review has covered all controls, including financial, operational, compliance and risk management.
The Board has a collective responsibility for the establishment, maintenance and review of a system of internal controls that provides reasonable assurance of effective and efficient operations, internal financial control, and compliance with the relevant laws and regulations.
The Board has established a management structure that clearly defines roles and responsibility and reporting lines and has approved the updated policies including credit, expenditure, disclosure, corporate governance etc.
The Bank’s financial position, operational and business performance is regularly reported to the Board. The actual performance achieved against budgets and prior period is reported and closely monitored.
Financial information is prepared using appropriate accounting policies that are consistently applied.
Operational procedures and controls have been established to facilitate complete, accurate and timely processing of transactions and the safeguarding of assets. They are monitored through compliance with policies and procedures manuals, desk performance instructions and other circulars.
Shareholders
Communication with shareholders and investors
The Board is committed to ensure that all material information relating to the Bank’s business operations is regularly communicated to its stakeholders and members of the investment community.
The Bank has its own web site, where relevant information relating to the Bank, its products, its operations and annual and quarterly financial statements are posted. The Bank’s web-site address is www.nbo.om.
• Quarterly results are published and made public. Investor Relations page / Results & Reports page
The quarterly, half-yearly, and annual results of operations of the Bank are published in leading Arabic and English newspapers in the Sultanate of Oman. After completion of the statutory audit, the annual report and the summary financial statements are sent by post to all shareholders along with the notice of the forthcoming Annual General Meeting of the Bank. Further, the shareholders are advised to contact the Bank whenever they require any updated information regarding the Bank or its operations.
The Bank also displays official new releases on its website https://www.nbo.om/en/Pages/News/Home.aspx for the shareholders, analysts and investors.
Distribution of DividendsThe distribution of dividends to the shareholders by the Bank during the last five years appears in the table below:
Year Cash dividend Bonus shares
2014 17% 10%
2015 17% 10%
2016 15.92% 5%
2017 15% 5%
201816% (recommended by the Board and subject to shareholders and regulatory approvals)
0%
Table (10)
54 | National Bank of Oman
Corporate Governance Report – 2018
Annual Report 2018 | 55
Corporate Governance Report – 2018

During the year 2018, the Bank distributed donations to the charitable organizations and other non-profitable organizations and participated in CSR initiatives totaling RO 323,901.824 which is within the budget limit of RO. 324,500.000 approved by the Annual General Meeting held on 25th March 2018.
Details of NBO main donations and CSR initiatives during the year 2018:
1. Ministry of Social Development International Disabled DayThe Ministry of Social Development, planned a celebration for International Disabled Day. (Actual spent – OMR 3,000/-).
2. NBO’s 48th National Day CelebrationsWe marked Oman’s 48th National Day by organizing a special celebration at our Head Office and recording the entire event which was published on our social media pages. (Actual spent – OMR 5,503/-).
3. NBO’s Scholarships ProgramTo mark our 45th National Day Celebrations, NBO’s Chairman announced the launch of a unique scholarship programme, enabling 15 students from low-income families to complete their undergraduate degrees at the top Universities in the UK.
Two scholarships have been awarded in 2018 to scholars that have just graduated from the Sultan’s School (from low-income families). (Actual spent – OMR 159,245.462/-).
4. Shahr Al AttaaTo engage with the community and support low-income families ahead of the holy month of Ramadhan, NBO’s staff will distribute food hampers to over 1,200 families across the Sultanate. (Actual spent – OMR 24,311.465/-).
Corporate Governance Report – 2018 Corporate Social Responsibility (CSR)
5. NBO HackathonGiven the successful launch of the first of it’s kind Hackathon in the Sultanate in 2017, the second edition of NBO’s hackathon in 2018 saw even bigger success with over 450 registrations of students, professionals and innovators from across the Sultanate and Region. (Actual spent – OMR 37,950.222/-).
6. Women@NBOThe objective of the program is to inspire Women@NBO to achieve personal & professional fulfilment, and to empower them to unlock their full potential. The event was piloted internally and now has been extended to the public. (Actual spent – OMR 10,808.875/-).
7. TawaselThe series was created by young Omanis to address social challenges in a comedic and relatable way. The series first launched in February 2017, and was focused on social media related issues, and has gained massive popularity since then, it has had 2 million views on YouTube and over 200K views on Oman TV. This year the creators of the show focused on different social challenges, and have dedicated a full episode to encourage a funds saving culture and responsible banking. (Actual spent – OMR 12,000/-).
8. Oman Historical and International MapsThe exhibition showcased between 80 to 100 maps, and is aimed at spreading knowledge of Oman’s deep rooted history. (Actual spent – OMR 10,000/-).
9. MOHE Breast Cancer AwarenessThe Ministry of Higher Education, had a Breast Cancer Awareness event for High School students, to spread awareness on early detection and treatment. (Actual spent – OMR 2,000/-).
56 | National Bank of Oman
Corporate Governance Report – 2018 Corporate Social Responsibility (CSR)
Annual Report 2018 | 57
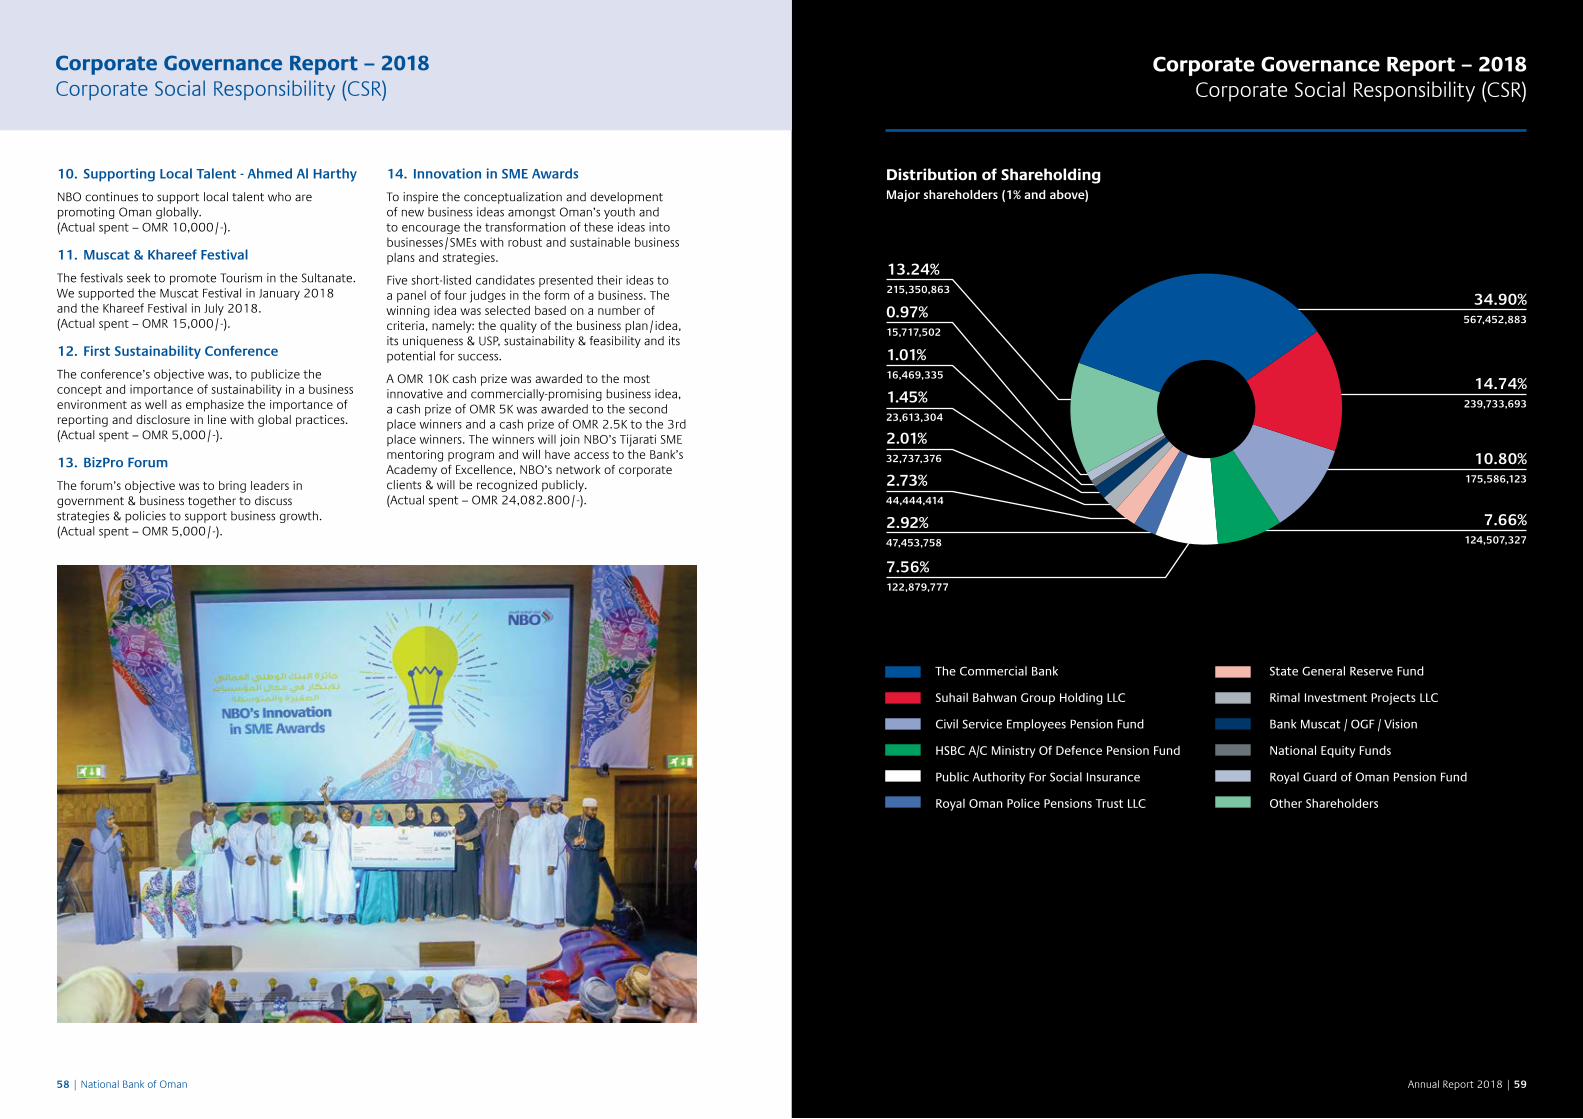
10. Supporting Local Talent - Ahmed Al Harthy
NBO continues to support local talent who are promoting Oman globally. (Actual spent – OMR 10,000/-).
11. Muscat & Khareef Festival
The festivals seek to promote Tourism in the Sultanate. We supported the Muscat Festival in January 2018 and the Khareef Festival in July 2018. (Actual spent – OMR 15,000/-).
12. First Sustainability Conference
The conference’s objective was, to publicize the concept and importance of sustainability in a business environment as well as emphasize the importance of reporting and disclosure in line with global practices.(Actual spent – OMR 5,000/-).
13. BizPro Forum
The forum’s objective was to bring leaders in government & business together to discuss strategies & policies to support business growth. (Actual spent – OMR 5,000/-).
14. Innovation in SME Awards
To inspire the conceptualization and development of new business ideas amongst Oman’s youth and to encourage the transformation of these ideas into businesses/SMEs with robust and sustainable business plans and strategies.
Five short-listed candidates presented their ideas to a panel of four judges in the form of a business. The winning idea was selected based on a number of criteria, namely: the quality of the business plan/idea, its uniqueness & USP, sustainability & feasibility and its potential for success.
A OMR 10K cash prize was awarded to the most innovative and commercially-promising business idea, a cash prize of OMR 5K was awarded to the second place winners and a cash prize of OMR 2.5K to the 3rd place winners. The winners will join NBO’s Tijarati SME mentoring program and will have access to the Bank’s Academy of Excellence, NBO’s network of corporate clients & will be recognized publicly. (Actual spent – OMR 24,082.800/-).
Distribution of ShareholdingMajor shareholders (1% and above)
34.90%567,452,883
10.80%175,586,123
7.56%122,879,777
13.24%215,350,863
2.92%47,453,758
7.66%124,507,327
14.74%239,733,693
2.73%44,444,414
2.01%32,737,376
1.45%23,613,304
1.01%16,469,335
0.97%15,717,502
The Commercial Bank
Suhail Bahwan Group Holding LLC
Civil Service Employees Pension Fund
HSBC A/C Ministry Of Defence Pension Fund
Public Authority For Social Insurance
Royal Oman Police Pensions Trust LLC
State General Reserve Fund
Rimal Investment Projects LLC
Bank Muscat / OGF / Vision
National Equity Funds
Royal Guard of Oman Pension Fund
Other Shareholders
Annual Report 2018 | 59
Corporate Governance Report – 2018 Corporate Social Responsibility (CSR)
58 | National Bank of Oman
Corporate Governance Report – 2018 Corporate Social Responsibility (CSR)
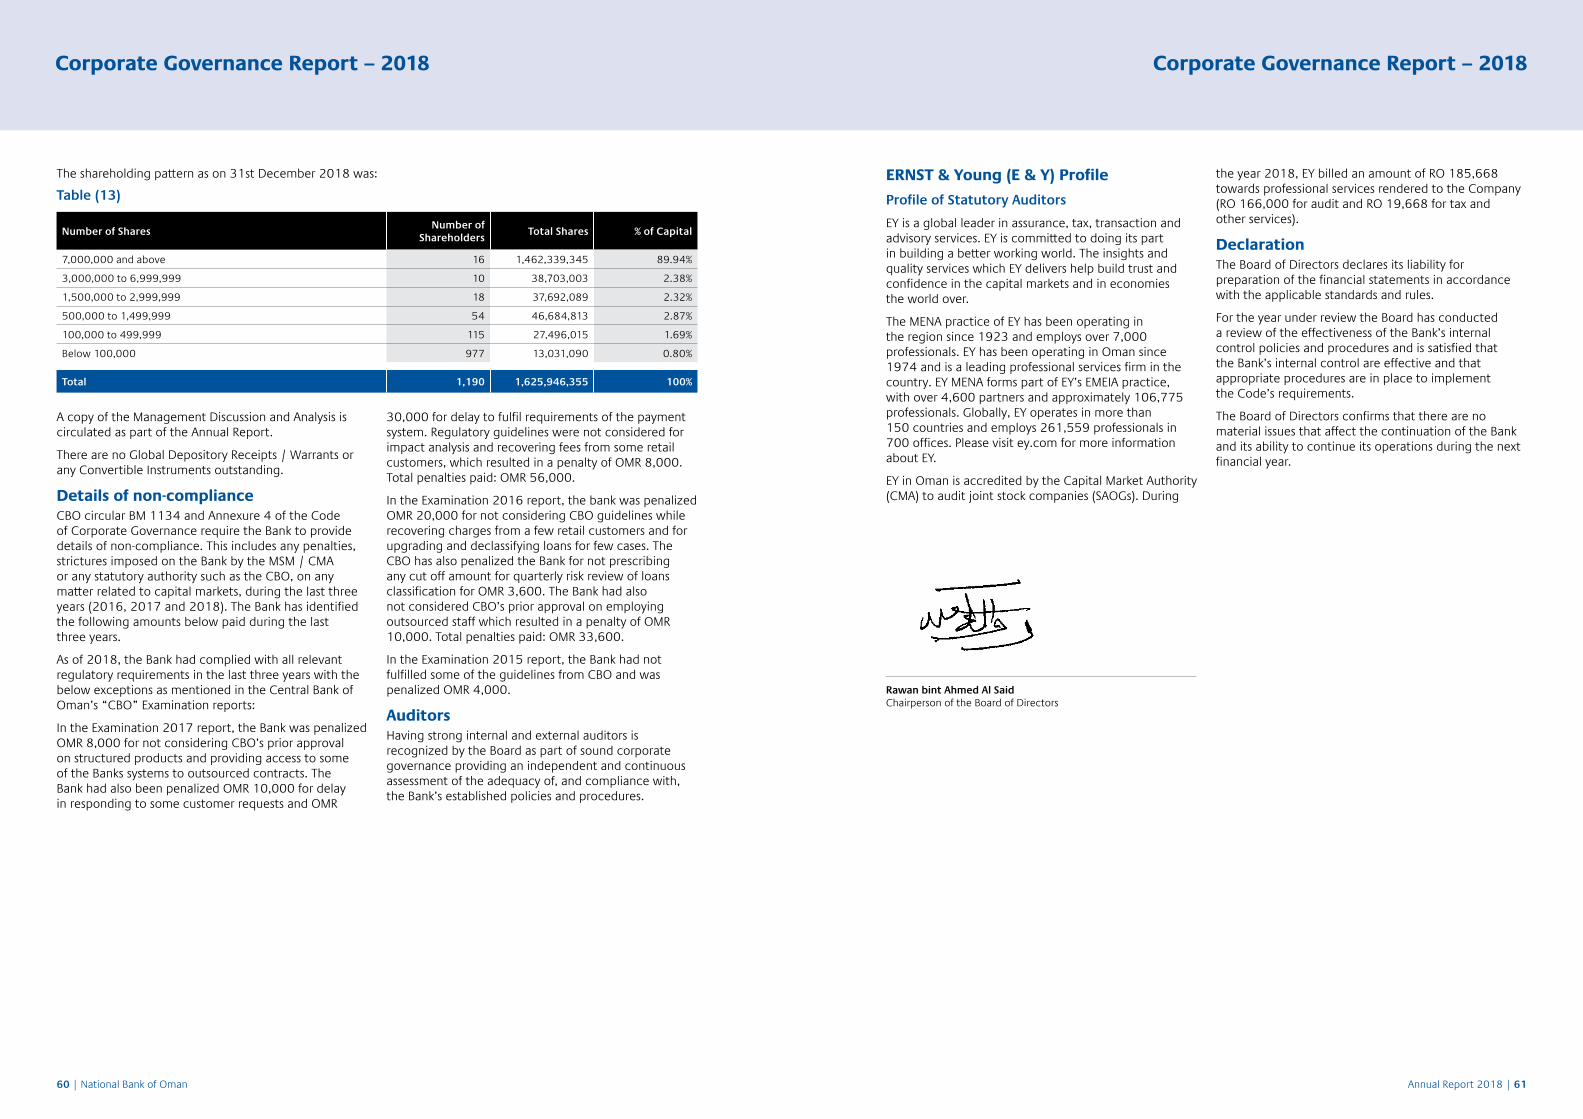
Table (13)
The shareholding pattern as on 31st December 2018 was:
A copy of the Management Discussion and Analysis is circulated as part of the Annual Report.
There are no Global Depository Receipts / Warrants or any Convertible Instruments outstanding.
Details of non-complianceCBO circular BM 1134 and Annexure 4 of the Code of Corporate Governance require the Bank to provide details of non-compliance. This includes any penalties, strictures imposed on the Bank by the MSM / CMA or any statutory authority such as the CBO, on any matter related to capital markets, during the last three years (2016, 2017 and 2018). The Bank has identified the following amounts below paid during the last three years.
As of 2018, the Bank had complied with all relevant regulatory requirements in the last three years with the below exceptions as mentioned in the Central Bank of Oman’s “CBO” Examination reports:
In the Examination 2017 report, the Bank was penalized OMR 8,000 for not considering CBO’s prior approval on structured products and providing access to some of the Banks systems to outsourced contracts. The Bank had also been penalized OMR 10,000 for delay in responding to some customer requests and OMR
30,000 for delay to fulfil requirements of the payment system. Regulatory guidelines were not considered for impact analysis and recovering fees from some retail customers, which resulted in a penalty of OMR 8,000. Total penalties paid: OMR 56,000.
In the Examination 2016 report, the bank was penalized OMR 20,000 for not considering CBO guidelines while recovering charges from a few retail customers and for upgrading and declassifying loans for few cases. The CBO has also penalized the Bank for not prescribing any cut off amount for quarterly risk review of loans classification for OMR 3,600. The Bank had also not considered CBO’s prior approval on employing outsourced staff which resulted in a penalty of OMR 10,000. Total penalties paid: OMR 33,600.
In the Examination 2015 report, the Bank had not fulfilled some of the guidelines from CBO and was penalized OMR 4,000.
AuditorsHaving strong internal and external auditors is recognized by the Board as part of sound corporate governance providing an independent and continuous assessment of the adequacy of, and compliance with, the Bank’s established policies and procedures.
Number of SharesNumber of
ShareholdersTotal Shares % of Capital
7,000,000 and above 16 1,462,339,345 89.94%
3,000,000 to 6,999,999 10 38,703,003 2.38%
1,500,000 to 2,999,999 18 37,692,089 2.32%
500,000 to 1,499,999 54 46,684,813 2.87%
100,000 to 499,999 115 27,496,015 1.69%
Below 100,000 977 13,031,090 0.80%
Total 1,190 1,625,946,355 100%
Rawan bint Ahmed Al SaidChairperson of the Board of Directors
ERNST & Young (E & Y) Profile
Profile of Statutory Auditors
EY is a global leader in assurance, tax, transaction and advisory services. EY is committed to doing its part in building a better working world. The insights and quality services which EY delivers help build trust and confidence in the capital markets and in economies the world over.
The MENA practice of EY has been operating in the region since 1923 and employs over 7,000 professionals. EY has been operating in Oman since 1974 and is a leading professional services firm in the country. EY MENA forms part of EY’s EMEIA practice, with over 4,600 partners and approximately 106,775 professionals. Globally, EY operates in more than 150 countries and employs 261,559 professionals in 700 offices. Please visit ey.com for more information about EY.
EY in Oman is accredited by the Capital Market Authority (CMA) to audit joint stock companies (SAOGs). During
the year 2018, EY billed an amount of RO 185,668 towards professional services rendered to the Company (RO 166,000 for audit and RO 19,668 for tax and other services).
DeclarationThe Board of Directors declares its liability for preparation of the financial statements in accordance with the applicable standards and rules.
For the year under review the Board has conducted a review of the effectiveness of the Bank’s internal control policies and procedures and is satisfied that the Bank’s internal control are effective and that appropriate procedures are in place to implement the Code’s requirements.
The Board of Directors confirms that there are no material issues that affect the continuation of the Bank and its ability to continue its operations during the next financial year.
60 | National Bank of Oman Annual Report 2018 | 61
Corporate Governance Report – 2018Corporate Governance Report – 2018

Basel II and III - Pillar III Report 2018

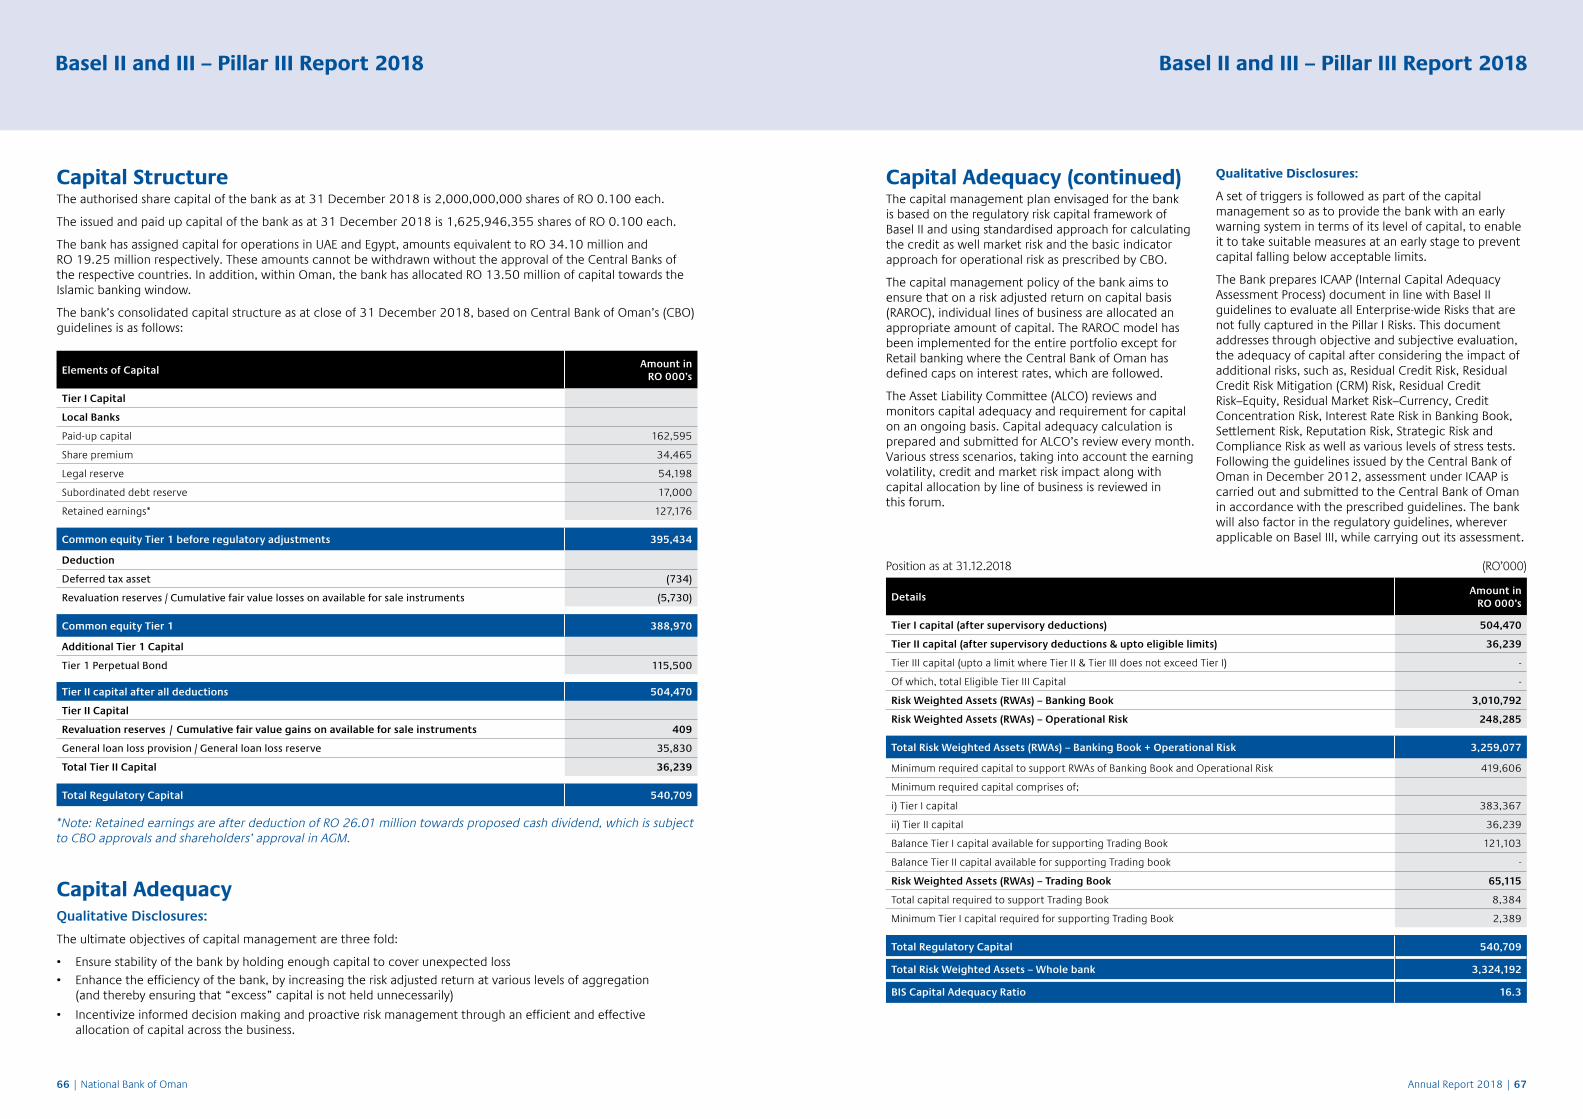
Capital StructureThe authorised share capital of the bank as at 31 December 2018 is 2,000,000,000 shares of RO 0.100 each.
The issued and paid up capital of the bank as at 31 December 2018 is 1,625,946,355 shares of RO 0.100 each.
The bank has assigned capital for operations in UAE and Egypt, amounts equivalent to RO 34.10 million and RO 19.25 million respectively. These amounts cannot be withdrawn without the approval of the Central Banks of the respective countries. In addition, within Oman, the bank has allocated RO 13.50 million of capital towards the Islamic banking window.
The bank’s consolidated capital structure as at close of 31 December 2018, based on Central Bank of Oman’s (CBO) guidelines is as follows:
Capital AdequacyQualitative Disclosures:
The ultimate objectives of capital management are three fold:
• Ensure stability of the bank by holding enough capital to cover unexpected loss• Enhance the efficiency of the bank, by increasing the risk adjusted return at various levels of aggregation
(and thereby ensuring that “excess” capital is not held unnecessarily)
• Incentivize informed decision making and proactive risk management through an efficient and effective allocation of capital across the business.
Elements of CapitalAmount in
RO 000’s
Tier I Capital
Local Banks
Paid-up capital 162,595
Share premium 34,465
Legal reserve 54,198
Subordinated debt reserve 17,000
Retained earnings* 127,176
Common equity Tier 1 before regulatory adjustments 395,434
Deduction
Deferred tax asset (734)
Revaluation reserves / Cumulative fair value losses on available for sale instruments (5,730)
Common equity Tier 1 388,970
Additional Tier 1 Capital
Tier 1 Perpetual Bond 115,500
Tier II capital after all deductions 504,470
Tier II Capital
Revaluation reserves / Cumulative fair value gains on available for sale instruments 409
General loan loss provision / General loan loss reserve 35,830
Total Tier II Capital 36,239
Total Regulatory Capital 540,709
*Note: Retained earnings are after deduction of RO 26.01 million towards proposed cash dividend, which is subject to CBO approvals and shareholders’ approval in AGM.
DetailsAmount in
RO 000’s
Tier I capital (after supervisory deductions) 504,470
Tier II capital (after supervisory deductions & upto eligible limits) 36,239
Tier III capital (upto a limit where Tier II & Tier III does not exceed Tier I) -
Of which, total Eligible Tier III Capital -
Risk Weighted Assets (RWAs) – Banking Book 3,010,792
Risk Weighted Assets (RWAs) – Operational Risk 248,285
Total Risk Weighted Assets (RWAs) – Banking Book + Operational Risk 3,259,077
Minimum required capital to support RWAs of Banking Book and Operational Risk 419,606
Minimum required capital comprises of;
i) Tier I capital 383,367
ii) Tier II capital 36,239
Balance Tier I capital available for supporting Trading Book 121,103
Balance Tier II capital available for supporting Trading book -
Risk Weighted Assets (RWAs) – Trading Book 65,115
Total capital required to support Trading Book 8,384
Minimum Tier I capital required for supporting Trading Book 2,389
Total Regulatory Capital 540,709
Total Risk Weighted Assets – Whole bank 3,324,192
BIS Capital Adequacy Ratio 16.3
Capital Adequacy (continued)The capital management plan envisaged for the bank is based on the regulatory risk capital framework of Basel II and using standardised approach for calculating the credit as well market risk and the basic indicator approach for operational risk as prescribed by CBO.
The capital management policy of the bank aims to ensure that on a risk adjusted return on capital basis (RAROC), individual lines of business are allocated an appropriate amount of capital. The RAROC model has been implemented for the entire portfolio except for Retail banking where the Central Bank of Oman has defined caps on interest rates, which are followed.
The Asset Liability Committee (ALCO) reviews and monitors capital adequacy and requirement for capital on an ongoing basis. Capital adequacy calculation is prepared and submitted for ALCO’s review every month. Various stress scenarios, taking into account the earning volatility, credit and market risk impact along with capital allocation by line of business is reviewed in this forum.
Qualitative Disclosures:
A set of triggers is followed as part of the capital management so as to provide the bank with an early warning system in terms of its level of capital, to enable it to take suitable measures at an early stage to prevent capital falling below acceptable limits.
The Bank prepares ICAAP (Internal Capital Adequacy Assessment Process) document in line with Basel II guidelines to evaluate all Enterprise-wide Risks that are not fully captured in the Pillar I Risks. This document addresses through objective and subjective evaluation, the adequacy of capital after considering the impact of additional risks, such as, Residual Credit Risk, Residual Credit Risk Mitigation (CRM) Risk, Residual Credit Risk–Equity, Residual Market Risk–Currency, Credit Concentration Risk, Interest Rate Risk in Banking Book, Settlement Risk, Reputation Risk, Strategic Risk and Compliance Risk as well as various levels of stress tests. Following the guidelines issued by the Central Bank of Oman in December 2012, assessment under ICAAP is carried out and submitted to the Central Bank of Oman in accordance with the prescribed guidelines. The bank will also factor in the regulatory guidelines, wherever applicable on Basel III, while carrying out its assessment.
Position as at 31.12.2018 (RO’000)
Basel II and III – Pillar III Report 2018Basel II and III – Pillar III Report 2018
66 | National Bank of Oman Annual Report 2018 | 67
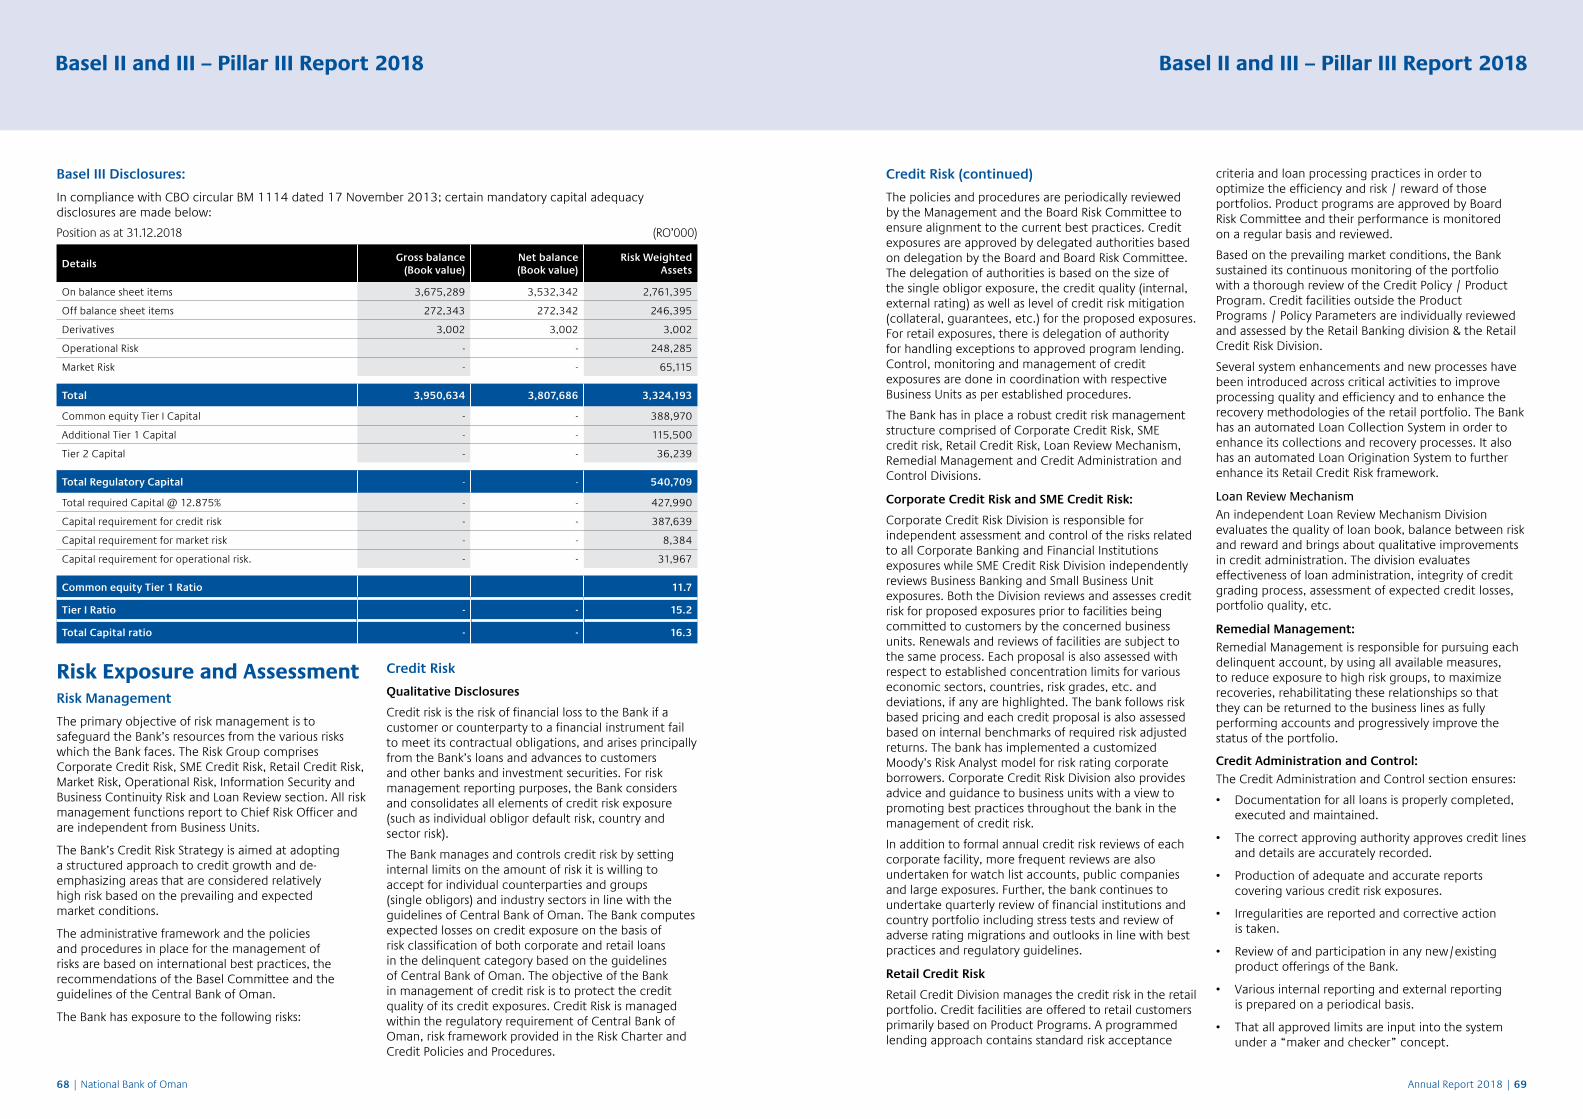
Basel III Disclosures:
In compliance with CBO circular BM 1114 dated 17 November 2013; certain mandatory capital adequacy disclosures are made below:
Position as at 31.12.2018 (RO’000)
DetailsGross balance
(Book value)Net balance (Book value)
Risk Weighted Assets
On balance sheet items 3,675,289 3,532,342 2,761,395
Off balance sheet items 272,343 272,342 246,395
Derivatives 3,002 3,002 3,002
Operational Risk - - 248,285
Market Risk - - 65,115
Total 3,950,634 3,807,686 3,324,193
Common equity Tier I Capital - - 388,970
Additional Tier 1 Capital - - 115,500
Tier 2 Capital - - 36,239
Total Regulatory Capital - - 540,709
Total required Capital @ 12.875% - - 427,990
Capital requirement for credit risk - - 387,639
Capital requirement for market risk - - 8,384
Capital requirement for operational risk. - - 31,967
Common equity Tier 1 Ratio 11.7
Tier I Ratio - - 15.2
Total Capital ratio - - 16.3
Risk Exposure and AssessmentRisk Management
The primary objective of risk management is to safeguard the Bank’s resources from the various risks which the Bank faces. The Risk Group comprises Corporate Credit Risk, SME Credit Risk, Retail Credit Risk, Market Risk, Operational Risk, Information Security and Business Continuity Risk and Loan Review section. All risk management functions report to Chief Risk Officer and are independent from Business Units.
The Bank’s Credit Risk Strategy is aimed at adopting a structured approach to credit growth and de-emphasizing areas that are considered relatively high risk based on the prevailing and expected market conditions.
The administrative framework and the policies and procedures in place for the management of risks are based on international best practices, the recommendations of the Basel Committee and the guidelines of the Central Bank of Oman.
The Bank has exposure to the following risks:
Credit Risk
Qualitative Disclosures
Credit risk is the risk of financial loss to the Bank if a customer or counterparty to a financial instrument fail to meet its contractual obligations, and arises principally from the Bank’s loans and advances to customers and other banks and investment securities. For risk management reporting purposes, the Bank considers and consolidates all elements of credit risk exposure (such as individual obligor default risk, country and sector risk).
The Bank manages and controls credit risk by setting internal limits on the amount of risk it is willing to accept for individual counterparties and groups (single obligors) and industry sectors in line with the guidelines of Central Bank of Oman. The Bank computes expected losses on credit exposure on the basis of risk classification of both corporate and retail loans in the delinquent category based on the guidelines of Central Bank of Oman. The objective of the Bank in management of credit risk is to protect the credit quality of its credit exposures. Credit Risk is managed within the regulatory requirement of Central Bank of Oman, risk framework provided in the Risk Charter and Credit Policies and Procedures.
Credit Risk (continued)
The policies and procedures are periodically reviewed by the Management and the Board Risk Committee to ensure alignment to the current best practices. Credit exposures are approved by delegated authorities based on delegation by the Board and Board Risk Committee. The delegation of authorities is based on the size of the single obligor exposure, the credit quality (internal, external rating) as well as level of credit risk mitigation (collateral, guarantees, etc.) for the proposed exposures. For retail exposures, there is delegation of authority for handling exceptions to approved program lending. Control, monitoring and management of credit exposures are done in coordination with respective Business Units as per established procedures.
The Bank has in place a robust credit risk management structure comprised of Corporate Credit Risk, SME credit risk, Retail Credit Risk, Loan Review Mechanism, Remedial Management and Credit Administration and Control Divisions.
Corporate Credit Risk and SME Credit Risk:
Corporate Credit Risk Division is responsible for independent assessment and control of the risks related to all Corporate Banking and Financial Institutions exposures while SME Credit Risk Division independently reviews Business Banking and Small Business Unit exposures. Both the Division reviews and assesses credit risk for proposed exposures prior to facilities being committed to customers by the concerned business units. Renewals and reviews of facilities are subject to the same process. Each proposal is also assessed with respect to established concentration limits for various economic sectors, countries, risk grades, etc. and deviations, if any are highlighted. The bank follows risk based pricing and each credit proposal is also assessed based on internal benchmarks of required risk adjusted returns. The bank has implemented a customized Moody’s Risk Analyst model for risk rating corporate borrowers. Corporate Credit Risk Division also provides advice and guidance to business units with a view to promoting best practices throughout the bank in the management of credit risk.
In addition to formal annual credit risk reviews of each corporate facility, more frequent reviews are also undertaken for watch list accounts, public companies and large exposures. Further, the bank continues to undertake quarterly review of financial institutions and country portfolio including stress tests and review of adverse rating migrations and outlooks in line with best practices and regulatory guidelines.
Retail Credit Risk
Retail Credit Division manages the credit risk in the retail portfolio. Credit facilities are offered to retail customers primarily based on Product Programs. A programmed lending approach contains standard risk acceptance
criteria and loan processing practices in order to optimize the efficiency and risk / reward of those portfolios. Product programs are approved by Board Risk Committee and their performance is monitored on a regular basis and reviewed.
Based on the prevailing market conditions, the Bank sustained its continuous monitoring of the portfolio with a thorough review of the Credit Policy / Product Program. Credit facilities outside the Product Programs / Policy Parameters are individually reviewed and assessed by the Retail Banking division & the Retail Credit Risk Division.
Several system enhancements and new processes have been introduced across critical activities to improve processing quality and efficiency and to enhance the recovery methodologies of the retail portfolio. The Bank has an automated Loan Collection System in order to enhance its collections and recovery processes. It also has an automated Loan Origination System to further enhance its Retail Credit Risk framework.
Loan Review MechanismAn independent Loan Review Mechanism Division evaluates the quality of loan book, balance between risk and reward and brings about qualitative improvements in credit administration. The division evaluates effectiveness of loan administration, integrity of credit grading process, assessment of expected credit losses, portfolio quality, etc.
Remedial Management:Remedial Management is responsible for pursuing each delinquent account, by using all available measures, to reduce exposure to high risk groups, to maximize recoveries, rehabilitating these relationships so that they can be returned to the business lines as fully performing accounts and progressively improve the status of the portfolio.
Credit Administration and Control:The Credit Administration and Control section ensures:
• Documentation for all loans is properly completed, executed and maintained.
• The correct approving authority approves credit lines and details are accurately recorded.
• Production of adequate and accurate reports covering various credit risk exposures.
• Irregularities are reported and corrective action is taken.
• Review of and participation in any new/existing product offerings of the Bank.
• Various internal reporting and external reporting is prepared on a periodical basis.
• That all approved limits are input into the system under a “maker and checker” concept.
Basel II and III – Pillar III Report 2018Basel II and III – Pillar III Report 2018
68 | National Bank of Oman Annual Report 2018 | 69
Credit Risk (continued)
• Disbursement of funds for all approved credit exposures is appropriately authorized.
Risk Reporting and Measurement Systems
The scope and nature of the risk reporting and/or measurement system are as follows:
Risk Reporting
A comprehensive review of the Corporate Credit Portfolio is conducted on a quarterly basis and provided to the Senior Management and the Risk Committee of the Board. Salient areas covered in the review include:
• Exposures downgraded/negatively migrated• Weighted average credit grade profile• Portfolio concentration/ performance
• Position of restructured exposures• Position of past due exposures• Exposures secured by equity
• Exposures to real estate and leasing sectors• Syndicated exposures• New relationships
• Exposures to senior members and non-resident borrowers
• Exposures to countries / financial institutions
In addition, the bank conducts industry studies in various sectors considered to have a bearing on the portfolio credit quality, such as, real estate, leasing, and sectors impacted by volatility in commodity prices. For FIG exposures the bank conducts stress tests and quarterly reviews of adverse rating migrations and outlooks in line with best practices and regulatory guidelines. These reports are reviewed periodically by the Management and Board Risk Committees.
A review of the Retail Credit Portfolio is conducted on a monthly basis and provided to the Management Risk Committee, and every quarter the latest report is presented to the Board Risk Committee. Salient areas covered in the review include:
• Portfolio review• Management summary, delinquency and default
trends (including product-wise delinquency analysis, vintage analysis, delinquencies across various credit criteria, etc.)
• Projects undertaken / fulfilled during the month• Recoveries
Measurement:
Impairment losses on loans and advances:
The bank reviews its individually significant loans and advances at each reporting date to assess whether an impairment loss should be recorded in the statement of comprehensive income. In particular, judgment
by management is required in the estimation of the amount and timing of future cash flows when determining the impairment loss. In estimating these cash flows, the bank makes judgments about the borrower’s financial situation and the net realisable value of collateral. These estimates are based on assumptions about a number of factors and actual results may differ, resulting in future changes to the allowance.
Loans and advances that have been assessed individually and found not to be impaired and all individually insignificant loans and advances are then assessed collectively, in groups of assets with similar risk characteristics, to determine whether provision should be made due to incurred loss events for which there is objective evidence but whose effects are not yet evident. The collective assessment takes account of data from the loan portfolio (such as credit quality, levels of arrears, credit utilisation, loan to collateral ratios etc.) and concentrations of risks.
Definition of default and cure
The Bank considers a financial instrument defaulted and therefore Stage 3 (credit-impaired) for ECL calculations in all cases when the borrower becomes 90 days past due on its contractual payments. The Bank considers treasury and interbank balances defaulted and takes immediate action when the required intraday payments are not settled by the close of business as outlined in the individual agreements.
As a part of a qualitative assessment of whether a customer is in default, the Bank also considers a variety of instances that may indicate unlikeliness to pay. When such events occur, the Bank carefully considers whether the event should result in treating the customer as defaulted and therefore assessed as Stage 3 for ECL calculations or whether Stage 2 is appropriate. Such events include:
• Internal rating of the borrower indicating default or near-default
• The borrower requesting emergency funding from the Bank
• The borrower having past due liabilities to public creditors or employees
• The borrower is deceased
• A material decrease in the underlying collateral value where the recovery of the loan is expected from the sale of the collateral
• A material decrease in the borrower’s turnover or the loss of a major customer
• A covenant breach not waived by the Bank• The debtor (or any legal entity within the debtor’s
group) filing for bankruptcy application/protection • Debtor’s listed debt or equity suspended at the primary exchange because of rumours or facts about financial difficulties
Credit Risk (continued)
It is the Bank’s policy to consider a financial instrument as ‘cured’ and therefore re-classified out of Stage 3 when none of the default criteria have been present for at least six consecutive months. The decision whether to classify an asset as Stage 2 or Stage 1 once cured depends on the updated credit grade, at the time of the cure, and whether this indicates there has been a significant increase in credit risk compared to initial recognition.
Incorporation of forward-looking information
The bank incorporates forward-looking information into both its assessment of whether the credit risk of an instrument has increased significantly since its initial recognition and its measurement of ECL. Based on consideration of a variety of external actual and forecast information, the bank formulates a fundamental view of the future direction of relevant economic variables as well as a reasonable range of possible scenarios.
Given the nature of the bank’s exposures and availability of historical statistically reliable information, the bank derives the point-in-time (PIT) probability of default (PD) using the through-the-cycle (TTC) PD data published by Moody’s for each rating category.
Economic variable assumptions
The method applied for determination of macroeconomic scenarios and their probabilities is a hybrid approach that combines deterministic forecast / modelling with analysis of stochastic distribution to get the alternative economic conditions and their probabilities.
The major assumptions and methodological choices can be summarised in a following set of steps:
1. Despite the fact that oil price was not chosen as an explanatory variable during statistical optimisation of variable selection, the business acumen as well as correlation analysis suggest that it is a major driving force in determination of GDP and real interest rate as defined by the World Bank (GDP deflator is highly affected by oil price as oil manufacturing is responsible for a vast portion of GDP volume in Oman)
2. The base scenario was created on the assumption of stabilisation of oil price at the level of 54 USD/barrel for Brent oil.
3. The alternative scenarios were constructed based on deviations from the base trajectory of oil price taking into account:
a. historical volatility of changes in oil prices (28% standard deviation of annual relative price changes),
b. size of the detachment equal to plus/minus 0,87 standard deviation from the base scenario as an approximate representation
of 33,33% probability of alternative (adverse and favourable) scenarios,
c. the time dynamics of the variable was based on assumption of normal distribution of annual changes of oil prices with some mean reverting characteristics and respective time scaling (standard deviation times square root of time) with the signs (-/+) in line with the character of the scenario (adverse / favourable).
4. GDP and real interest rate were forecasted deterministically based on their reciprocal dependencies and their relationship (with appropriate time lags) to oil price changes assuming mid-prices of Brent oil under given scenario as obtained through the process described in 3.
5. GDP per capita was predicted through regression to corresponding GDP changes as estimated for a given scenario and assumed lowering pace of population growth not dependent on the scenario in question.
Treasury, trading and interbank relationships
The Bank’s treasury, trading and interbank relationships and counterparties comprise financial services institutions, banks, broker-dealers, exchanges and clearing-houses. For these relationships, the Bank’s credit risk department analyses publicly available information such as financial information and other external data and assigns the internal rating.
Corporate and small business lending
For corporate and investment banking loans, the borrowers are assessed by specialised credit risk employees of the Bank. The credit risk assessment is based on a credit scoring model that takes into account various historical, current and forward-looking information such as:
- Historical financial information together with forecasts and budgets prepared by the client. This financial information includes realised and expected results, solvency ratios, liquidity ratios and any other relevant ratios to measure the client’s financial performance. Some of these indicators are captured in covenants with the clients and are, therefore, measured with greater attention.
- Any publicly available information on the clients from external parties. This includes external rating grades issued by rating agencies, independent analyst reports, publicly traded bond or CDS prices or press releases and articles.
- Any macro-economic or geopolitical information, e.g., GDP growth relevant for the specific industry and geographical segments where the client operates.
- Any other objectively supportable information on the quality and abilities of the client’s management relevant for the company’s performance.
Basel II and III – Pillar III Report 2018Basel II and III – Pillar III Report 2018
70 | National Bank of Oman Annual Report 2018 | 71
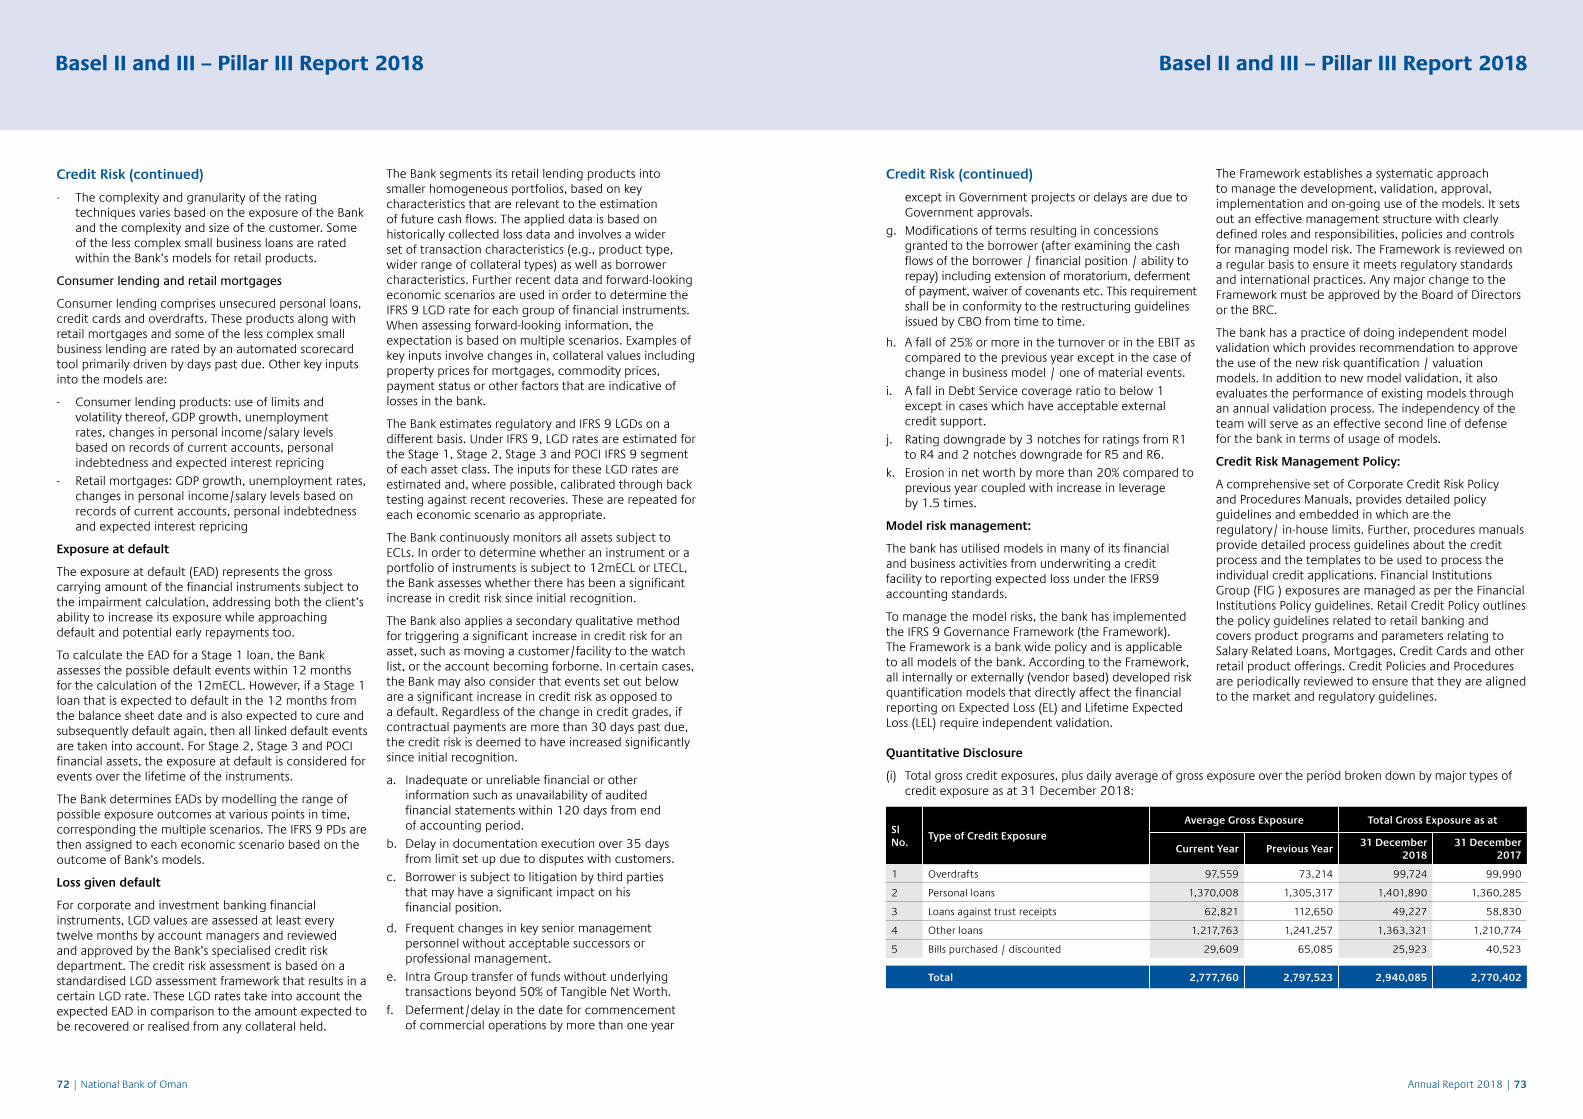
Credit Risk (continued)
- The complexity and granularity of the rating techniques varies based on the exposure of the Bank and the complexity and size of the customer. Some of the less complex small business loans are rated within the Bank’s models for retail products.
Consumer lending and retail mortgages
Consumer lending comprises unsecured personal loans, credit cards and overdrafts. These products along with retail mortgages and some of the less complex small business lending are rated by an automated scorecard tool primarily driven by days past due. Other key inputs into the models are:
- Consumer lending products: use of limits and volatility thereof, GDP growth, unemployment rates, changes in personal income/salary levels based on records of current accounts, personal indebtedness and expected interest repricing
- Retail mortgages: GDP growth, unemployment rates, changes in personal income/salary levels based on records of current accounts, personal indebtedness and expected interest repricing
Exposure at default
The exposure at default (EAD) represents the gross carrying amount of the financial instruments subject to the impairment calculation, addressing both the client’s ability to increase its exposure while approaching default and potential early repayments too.
To calculate the EAD for a Stage 1 loan, the Bank assesses the possible default events within 12 months for the calculation of the 12mECL. However, if a Stage 1 loan that is expected to default in the 12 months from the balance sheet date and is also expected to cure and subsequently default again, then all linked default events are taken into account. For Stage 2, Stage 3 and POCI financial assets, the exposure at default is considered for events over the lifetime of the instruments.
The Bank determines EADs by modelling the range of possible exposure outcomes at various points in time, corresponding the multiple scenarios. The IFRS 9 PDs are then assigned to each economic scenario based on the outcome of Bank’s models.
Loss given default
For corporate and investment banking financial instruments, LGD values are assessed at least every twelve months by account managers and reviewed and approved by the Bank’s specialised credit risk department. The credit risk assessment is based on a standardised LGD assessment framework that results in a certain LGD rate. These LGD rates take into account the expected EAD in comparison to the amount expected to be recovered or realised from any collateral held.
The Bank segments its retail lending products into smaller homogeneous portfolios, based on key characteristics that are relevant to the estimation of future cash flows. The applied data is based on historically collected loss data and involves a wider set of transaction characteristics (e.g., product type, wider range of collateral types) as well as borrower characteristics. Further recent data and forward-looking economic scenarios are used in order to determine the IFRS 9 LGD rate for each group of financial instruments. When assessing forward-looking information, the expectation is based on multiple scenarios. Examples of key inputs involve changes in, collateral values including property prices for mortgages, commodity prices, payment status or other factors that are indicative of losses in the bank.
The Bank estimates regulatory and IFRS 9 LGDs on a different basis. Under IFRS 9, LGD rates are estimated for the Stage 1, Stage 2, Stage 3 and POCI IFRS 9 segment of each asset class. The inputs for these LGD rates are estimated and, where possible, calibrated through back testing against recent recoveries. These are repeated for each economic scenario as appropriate.
The Bank continuously monitors all assets subject to ECLs. In order to determine whether an instrument or a portfolio of instruments is subject to 12mECL or LTECL, the Bank assesses whether there has been a significant increase in credit risk since initial recognition.
The Bank also applies a secondary qualitative method for triggering a significant increase in credit risk for an asset, such as moving a customer/facility to the watch list, or the account becoming forborne. In certain cases, the Bank may also consider that events set out below are a significant increase in credit risk as opposed to a default. Regardless of the change in credit grades, if contractual payments are more than 30 days past due, the credit risk is deemed to have increased significantly since initial recognition.
a. Inadequate or unreliable financial or other information such as unavailability of audited financial statements within 120 days from end of accounting period.
b. Delay in documentation execution over 35 days from limit set up due to disputes with customers.
c. Borrower is subject to litigation by third parties that may have a significant impact on his financial position.
d. Frequent changes in key senior management personnel without acceptable successors or professional management.
e. Intra Group transfer of funds without underlying transactions beyond 50% of Tangible Net Worth.
f. Deferment/delay in the date for commencement of commercial operations by more than one year
Credit Risk (continued)
except in Government projects or delays are due to Government approvals.
g. Modifications of terms resulting in concessions granted to the borrower (after examining the cash flows of the borrower / financial position / ability to repay) including extension of moratorium, deferment of payment, waiver of covenants etc. This requirement shall be in conformity to the restructuring guidelines issued by CBO from time to time.
h. A fall of 25% or more in the turnover or in the EBIT as compared to the previous year except in the case of change in business model / one of material events.
i. A fall in Debt Service coverage ratio to below 1 except in cases which have acceptable external credit support.
j. Rating downgrade by 3 notches for ratings from R1 to R4 and 2 notches downgrade for R5 and R6.
k. Erosion in net worth by more than 20% compared to previous year coupled with increase in leverage by 1.5 times.
Model risk management:
The bank has utilised models in many of its financial and business activities from underwriting a credit facility to reporting expected loss under the IFRS9 accounting standards.
To manage the model risks, the bank has implemented the IFRS 9 Governance Framework (the Framework). The Framework is a bank wide policy and is applicable to all models of the bank. According to the Framework, all internally or externally (vendor based) developed risk quantification models that directly affect the financial reporting on Expected Loss (EL) and Lifetime Expected Loss (LEL) require independent validation.
The Framework establishes a systematic approach to manage the development, validation, approval, implementation and on-going use of the models. It sets out an effective management structure with clearly defined roles and responsibilities, policies and controls for managing model risk. The Framework is reviewed on a regular basis to ensure it meets regulatory standards and international practices. Any major change to the Framework must be approved by the Board of Directors or the BRC.
The bank has a practice of doing independent model validation which provides recommendation to approve the use of the new risk quantification / valuation models. In addition to new model validation, it also evaluates the performance of existing models through an annual validation process. The independency of the team will serve as an effective second line of defense for the bank in terms of usage of models.
Credit Risk Management Policy:
A comprehensive set of Corporate Credit Risk Policy and Procedures Manuals, provides detailed policy guidelines and embedded in which are the regulatory/ in-house limits. Further, procedures manuals provide detailed process guidelines about the credit process and the templates to be used to process the individual credit applications. Financial Institutions Group (FIG ) exposures are managed as per the Financial Institutions Policy guidelines. Retail Credit Policy outlines the policy guidelines related to retail banking and covers product programs and parameters relating to Salary Related Loans, Mortgages, Credit Cards and other retail product offerings. Credit Policies and Procedures are periodically reviewed to ensure that they are aligned to the market and regulatory guidelines.
Quantitative Disclosure
(i) Total gross credit exposures, plus daily average of gross exposure over the period broken down by major types of credit exposure as at 31 December 2018:
Sl No.
Type of Credit Exposure
Average Gross Exposure Total Gross Exposure as at
Current Year Previous Year31 December
201831 December
2017
1 Overdrafts 97,559 73,214 99,724 99,990
2 Personal loans 1,370,008 1,305,317 1,401,890 1,360,285
3 Loans against trust receipts 62,821 112,650 49,227 58,830
4 Other loans 1,217,763 1,241,257 1,363,321 1,210,774
5 Bills purchased / discounted 29,609 65,085 25,923 40,523
Total 2,777,760 2,797,523 2,940,085 2,770,402
Basel II and III – Pillar III Report 2018Basel II and III – Pillar III Report 2018
72 | National Bank of Oman Annual Report 2018 | 73
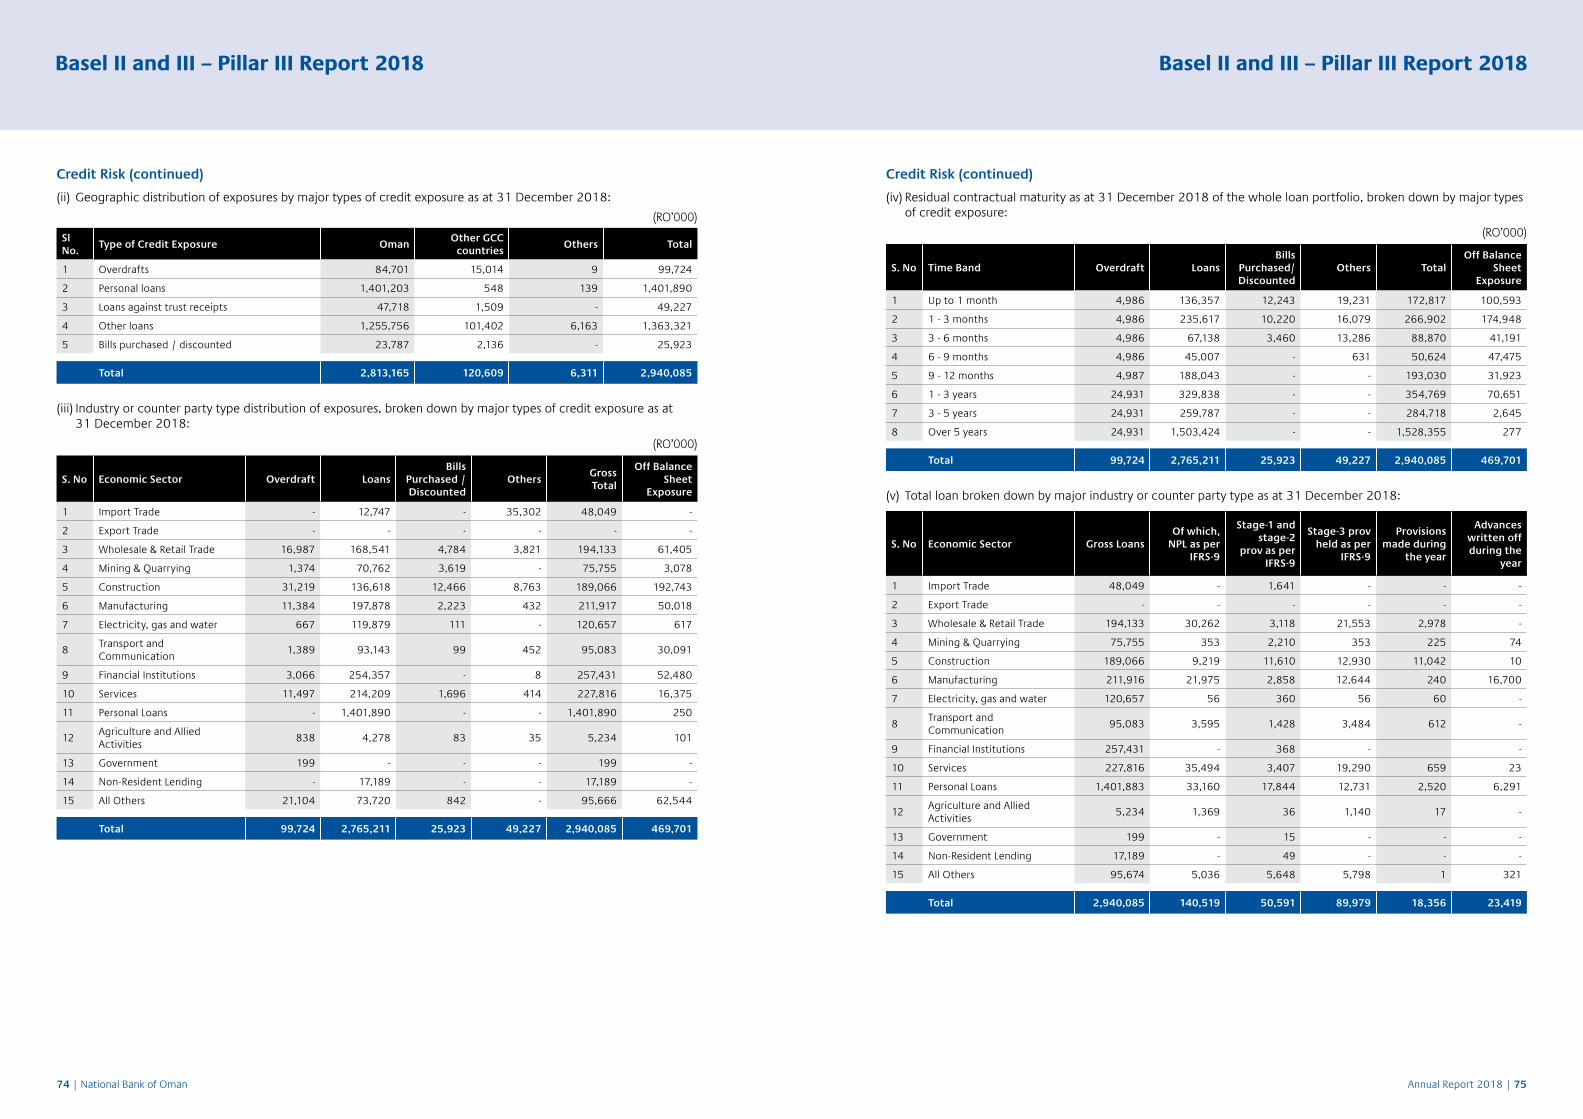
Credit Risk (continued)
(ii) Geographic distribution of exposures by major types of credit exposure as at 31 December 2018:
(iii) Industry or counter party type distribution of exposures, broken down by major types of credit exposure as at 31 December 2018:
Sl No.
Type of Credit Exposure OmanOther GCC
countriesOthers Total
1 Overdrafts 84,701 15,014 9 99,724
2 Personal loans 1,401,203 548 139 1,401,890
3 Loans against trust receipts 47,718 1,509 - 49,227
4 Other loans 1,255,756 101,402 6,163 1,363,321
5 Bills purchased / discounted 23,787 2,136 - 25,923
Total 2,813,165 120,609 6,311 2,940,085
S. No Economic Sector Overdraft LoansBills
Purchased / Discounted
OthersGross Total
Off Balance Sheet
Exposure
1 Import Trade - 12,747 - 35,302 48,049 -
2 Export Trade - - - - - -
3 Wholesale & Retail Trade 16,987 168,541 4,784 3,821 194,133 61,405
4 Mining & Quarrying 1,374 70,762 3,619 - 75,755 3,078
5 Construction 31,219 136,618 12,466 8,763 189,066 192,743
6 Manufacturing 11,384 197,878 2,223 432 211,917 50,018
7 Electricity, gas and water 667 119,879 111 - 120,657 617
8Transport and Communication
1,389 93,143 99 452 95,083 30,091
9 Financial Institutions 3,066 254,357 - 8 257,431 52,480
10 Services 11,497 214,209 1,696 414 227,816 16,375
11 Personal Loans - 1,401,890 - - 1,401,890 250
12Agriculture and Allied Activities
838 4,278 83 35 5,234 101
13 Government 199 - - - 199 -
14 Non-Resident Lending - 17,189 - - 17,189 -
15 All Others 21,104 73,720 842 - 95,666 62,544
Total 99,724 2,765,211 25,923 49,227 2,940,085 469,701
(RO’000)
(RO’000)
Credit Risk (continued)
(iv) Residual contractual maturity as at 31 December 2018 of the whole loan portfolio, broken down by major types of credit exposure:
(v) Total loan broken down by major industry or counter party type as at 31 December 2018:
S. No Economic Sector Gross LoansOf which,
NPL as per IFRS-9
Stage-1 and stage-2
prov as per IFRS-9
Stage-3 prov held as per
IFRS-9
Provisions made during
the year
Advances written off during the
year
1 Import Trade 48,049 - 1,641 - - -
2 Export Trade - - - - - -
3 Wholesale & Retail Trade 194,133 30,262 3,118 21,553 2,978 -
4 Mining & Quarrying 75,755 353 2,210 353 225 74
5 Construction 189,066 9,219 11,610 12,930 11,042 10
6 Manufacturing 211,916 21,975 2,858 12,644 240 16,700
7 Electricity, gas and water 120,657 56 360 56 60 -
8Transport and Communication
95,083 3,595 1,428 3,484 612 -
9 Financial Institutions 257,431 - 368 - -
10 Services 227,816 35,494 3,407 19,290 659 23
11 Personal Loans 1,401,883 33,160 17,844 12,731 2,520 6,291
12Agriculture and Allied Activities
5,234 1,369 36 1,140 17 -
13 Government 199 - 15 - - -
14 Non-Resident Lending 17,189 - 49 - - -
15 All Others 95,674 5,036 5,648 5,798 1 321
Total 2,940,085 140,519 50,591 89,979 18,356 23,419
S. No Time Band Overdraft LoansBills
Purchased/ Discounted
Others TotalOff Balance
Sheet Exposure
1 Up to 1 month 4,986 136,357 12,243 19,231 172,817 100,593
2 1 - 3 months 4,986 235,617 10,220 16,079 266,902 174,948
3 3 - 6 months 4,986 67,138 3,460 13,286 88,870 41,191
4 6 - 9 months 4,986 45,007 - 631 50,624 47,475
5 9 - 12 months 4,987 188,043 - - 193,030 31,923
6 1 - 3 years 24,931 329,838 - - 354,769 70,651
7 3 - 5 years 24,931 259,787 - - 284,718 2,645
8 Over 5 years 24,931 1,503,424 - - 1,528,355 277
Total 99,724 2,765,211 25,923 49,227 2,940,085 469,701
(RO’000)
Basel II and III – Pillar III Report 2018Basel II and III – Pillar III Report 2018
74 | National Bank of Oman Annual Report 2018 | 75
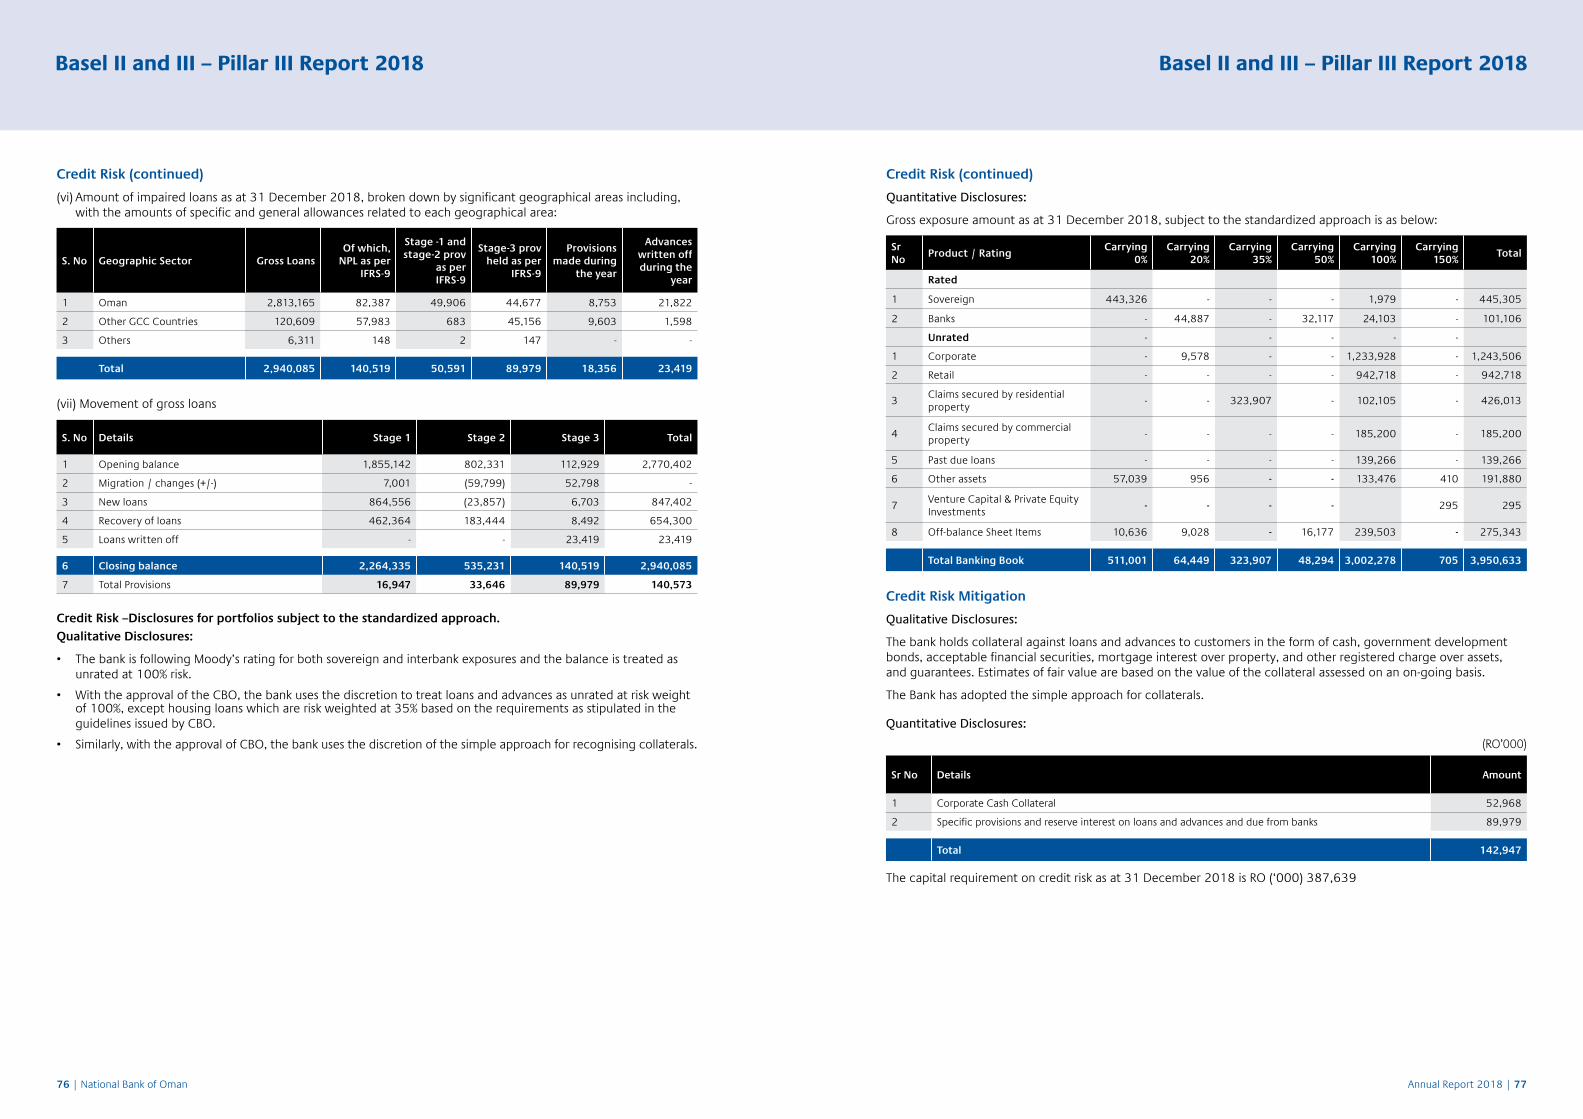
(vii) Movement of gross loans
S. No Geographic Sector Gross LoansOf which,
NPL as per IFRS-9
Stage -1 and stage-2 prov
as per IFRS-9
Stage-3 prov held as per
IFRS-9
Provisions made during
the year
Advances written off during the
year
1 Oman 2,813,165 82,387 49,906 44,677 8,753 21,822
2 Other GCC Countries 120,609 57,983 683 45,156 9,603 1,598
3 Others 6,311 148 2 147 - -
Total 2,940,085 140,519 50,591 89,979 18,356 23,419
S. No Details Stage 1 Stage 2 Stage 3 Total
1 Opening balance 1,855,142 802,331 112,929 2,770,402
2 Migration / changes (+/-) 7,001 (59,799) 52,798 -
3 New loans 864,556 (23,857) 6,703 847,402
4 Recovery of loans 462,364 183,444 8,492 654,300
5 Loans written off - - 23,419 23,419
6 Closing balance 2,264,335 535,231 140,519 2,940,085
7 Total Provisions 16,947 33,646 89,979 140,573
Credit Risk –Disclosures for portfolios subject to the standardized approach.Qualitative Disclosures:
• The bank is following Moody’s rating for both sovereign and interbank exposures and the balance is treated as unrated at 100% risk.
• With the approval of the CBO, the bank uses the discretion to treat loans and advances as unrated at risk weight of 100%, except housing loans which are risk weighted at 35% based on the requirements as stipulated in the guidelines issued by CBO.
• Similarly, with the approval of CBO, the bank uses the discretion of the simple approach for recognising collaterals.
Credit Risk (continued)
(vi) Amount of impaired loans as at 31 December 2018, broken down by significant geographical areas including, with the amounts of specific and general allowances related to each geographical area:
Sr No
Product / RatingCarrying
0%Carrying
20%Carrying
35%Carrying
50%Carrying
100%Carrying
150%Total
Rated
1 Sovereign 443,326 - - - 1,979 - 445,305
2 Banks - 44,887 - 32,117 24,103 - 101,106
Unrated - - - - -
1 Corporate - 9,578 - - 1,233,928 - 1,243,506
2 Retail - - - - 942,718 - 942,718
3Claims secured by residential property
- - 323,907 - 102,105 - 426,013
4Claims secured by commercial property
- - - - 185,200 - 185,200
5 Past due loans - - - - 139,266 - 139,266
6 Other assets 57,039 956 - - 133,476 410 191,880
7Venture Capital & Private Equity Investments
- - - - 295 295
8 Off-balance Sheet Items 10,636 9,028 - 16,177 239,503 - 275,343
Total Banking Book 511,001 64,449 323,907 48,294 3,002,278 705 3,950,633
Credit Risk (continued)
Quantitative Disclosures:
Gross exposure amount as at 31 December 2018, subject to the standardized approach is as below:
Credit Risk Mitigation
Qualitative Disclosures:
The bank holds collateral against loans and advances to customers in the form of cash, government development bonds, acceptable financial securities, mortgage interest over property, and other registered charge over assets, and guarantees. Estimates of fair value are based on the value of the collateral assessed on an on-going basis.
The Bank has adopted the simple approach for collaterals.
Quantitative Disclosures:
Sr No Details Amount
1 Corporate Cash Collateral 52,968
2 Specific provisions and reserve interest on loans and advances and due from banks 89,979
Total 142,947
The capital requirement on credit risk as at 31 December 2018 is RO (‘000) 387,639
(RO’000)
Basel II and III – Pillar III Report 2018Basel II and III – Pillar III Report 2018
76 | National Bank of Oman Annual Report 2018 | 77
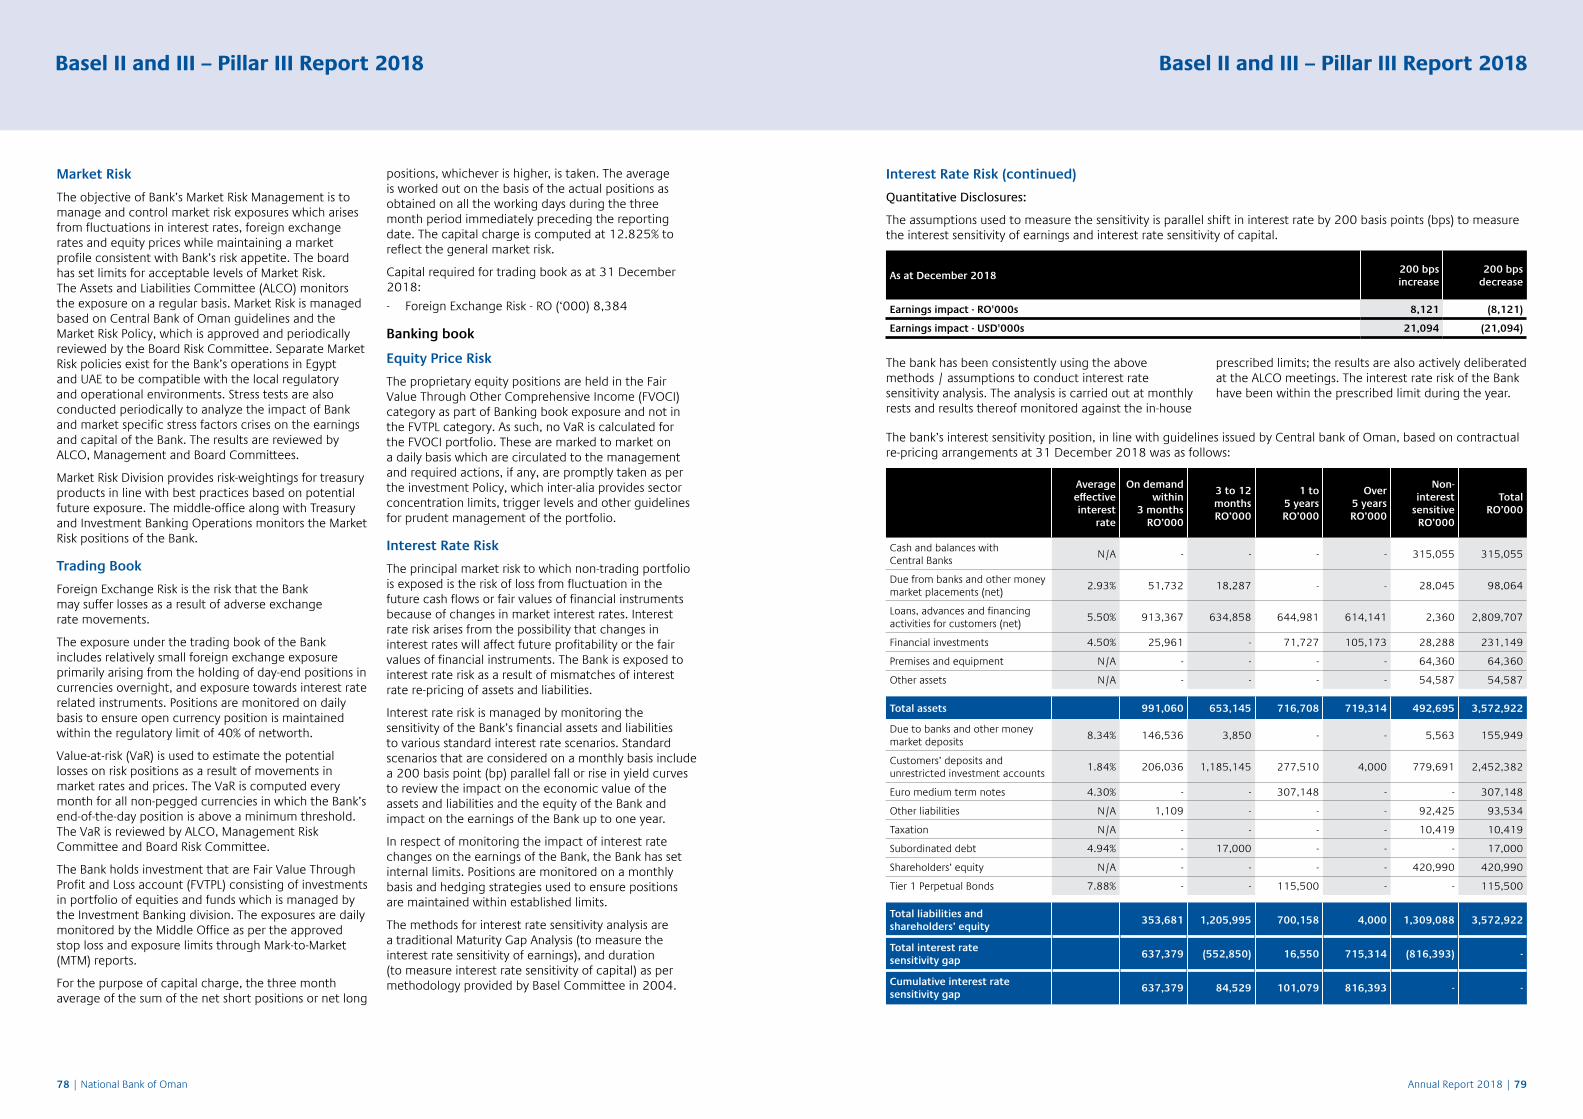
Market Risk
The objective of Bank’s Market Risk Management is to manage and control market risk exposures which arises from fluctuations in interest rates, foreign exchange rates and equity prices while maintaining a market profile consistent with Bank’s risk appetite. The board has set limits for acceptable levels of Market Risk. The Assets and Liabilities Committee (ALCO) monitors the exposure on a regular basis. Market Risk is managed based on Central Bank of Oman guidelines and the Market Risk Policy, which is approved and periodically reviewed by the Board Risk Committee. Separate Market Risk policies exist for the Bank’s operations in Egypt and UAE to be compatible with the local regulatory and operational environments. Stress tests are also conducted periodically to analyze the impact of Bank and market specific stress factors crises on the earnings and capital of the Bank. The results are reviewed by ALCO, Management and Board Committees.
Market Risk Division provides risk-weightings for treasury products in line with best practices based on potential future exposure. The middle-office along with Treasury and Investment Banking Operations monitors the Market Risk positions of the Bank.
Trading Book
Foreign Exchange Risk is the risk that the Bank may suffer losses as a result of adverse exchange rate movements.
The exposure under the trading book of the Bank includes relatively small foreign exchange exposure primarily arising from the holding of day-end positions in currencies overnight, and exposure towards interest rate related instruments. Positions are monitored on daily basis to ensure open currency position is maintained within the regulatory limit of 40% of networth.
Value-at-risk (VaR) is used to estimate the potential losses on risk positions as a result of movements in market rates and prices. The VaR is computed every month for all non-pegged currencies in which the Bank’s end-of-the-day position is above a minimum threshold. The VaR is reviewed by ALCO, Management Risk Committee and Board Risk Committee.
The Bank holds investment that are Fair Value Through Profit and Loss account (FVTPL) consisting of investments in portfolio of equities and funds which is managed by the Investment Banking division. The exposures are daily monitored by the Middle Office as per the approved stop loss and exposure limits through Mark-to-Market (MTM) reports.
For the purpose of capital charge, the three month average of the sum of the net short positions or net long
positions, whichever is higher, is taken. The average is worked out on the basis of the actual positions as obtained on all the working days during the three month period immediately preceding the reporting date. The capital charge is computed at 12.825% to reflect the general market risk.
Capital required for trading book as at 31 December 2018:
- Foreign Exchange Risk - RO (‘000) 8,384
Banking book
Equity Price Risk
The proprietary equity positions are held in the Fair Value Through Other Comprehensive Income (FVOCI) category as part of Banking book exposure and not in the FVTPL category. As such, no VaR is calculated for the FVOCI portfolio. These are marked to market on a daily basis which are circulated to the management and required actions, if any, are promptly taken as per the investment Policy, which inter-alia provides sector concentration limits, trigger levels and other guidelines for prudent management of the portfolio.
Interest Rate Risk
The principal market risk to which non-trading portfolio is exposed is the risk of loss from fluctuation in the future cash flows or fair values of financial instruments because of changes in market interest rates. Interest rate risk arises from the possibility that changes in interest rates will affect future profitability or the fair values of financial instruments. The Bank is exposed to interest rate risk as a result of mismatches of interest rate re-pricing of assets and liabilities.
Interest rate risk is managed by monitoring the sensitivity of the Bank’s financial assets and liabilities to various standard interest rate scenarios. Standard scenarios that are considered on a monthly basis include a 200 basis point (bp) parallel fall or rise in yield curves to review the impact on the economic value of the assets and liabilities and the equity of the Bank and impact on the earnings of the Bank up to one year.
In respect of monitoring the impact of interest rate changes on the earnings of the Bank, the Bank has set internal limits. Positions are monitored on a monthly basis and hedging strategies used to ensure positions are maintained within established limits.
The methods for interest rate sensitivity analysis are a traditional Maturity Gap Analysis (to measure the interest rate sensitivity of earnings), and duration (to measure interest rate sensitivity of capital) as per methodology provided by Basel Committee in 2004.
Interest Rate Risk (continued)
Quantitative Disclosures:
The assumptions used to measure the sensitivity is parallel shift in interest rate by 200 basis points (bps) to measure the interest sensitivity of earnings and interest rate sensitivity of capital.
The bank’s interest sensitivity position, in line with guidelines issued by Central bank of Oman, based on contractual re-pricing arrangements at 31 December 2018 was as follows:
The bank has been consistently using the above methods / assumptions to conduct interest rate sensitivity analysis. The analysis is carried out at monthly rests and results thereof monitored against the in-house
prescribed limits; the results are also actively deliberated at the ALCO meetings. The interest rate risk of the Bank have been within the prescribed limit during the year.
As at December 2018200 bps increase
200 bps decrease
Earnings impact - RO'000s 8,121 (8,121)
Earnings impact - USD'000s 21,094 (21,094)
Average effective interest
rate
On demand within
3 months RO’000
3 to 12 months RO’000
1 to 5 years RO’000
Over 5 years RO’000
Non-interest
sensitive RO’000
TotalRO’000
Cash and balances with Central Banks
N/A - - - - 315,055 315,055
Due from banks and other money market placements (net)
2.93% 51,732 18,287 - - 28,045 98,064
Loans, advances and financing activities for customers (net)
5.50% 913,367 634,858 644,981 614,141 2,360 2,809,707
Financial investments 4.50% 25,961 - 71,727 105,173 28,288 231,149
Premises and equipment N/A - - - - 64,360 64,360
Other assets N/A - - - - 54,587 54,587
Total assets 991,060 653,145 716,708 719,314 492,695 3,572,922
Due to banks and other money market deposits
8.34% 146,536 3,850 - - 5,563 155,949
Customers’ deposits and unrestricted investment accounts
1.84% 206,036 1,185,145 277,510 4,000 779,691 2,452,382
Euro medium term notes 4.30% - - 307,148 - - 307,148
Other liabilities N/A 1,109 - - - 92,425 93,534
Taxation N/A - - - - 10,419 10,419
Subordinated debt 4.94% - 17,000 - - - 17,000
Shareholders’ equity N/A - - - - 420,990 420,990
Tier 1 Perpetual Bonds 7.88% - - 115,500 - - 115,500
Total liabilities and shareholders’ equity
353,681 1,205,995 700,158 4,000 1,309,088 3,572,922
Total interest rate sensitivity gap
637,379 (552,850) 16,550 715,314 (816,393) -
Cumulative interest rate sensitivity gap
637,379 84,529 101,079 816,393 - -
Basel II and III – Pillar III Report 2018Basel II and III – Pillar III Report 2018
78 | National Bank of Oman Annual Report 2018 | 79
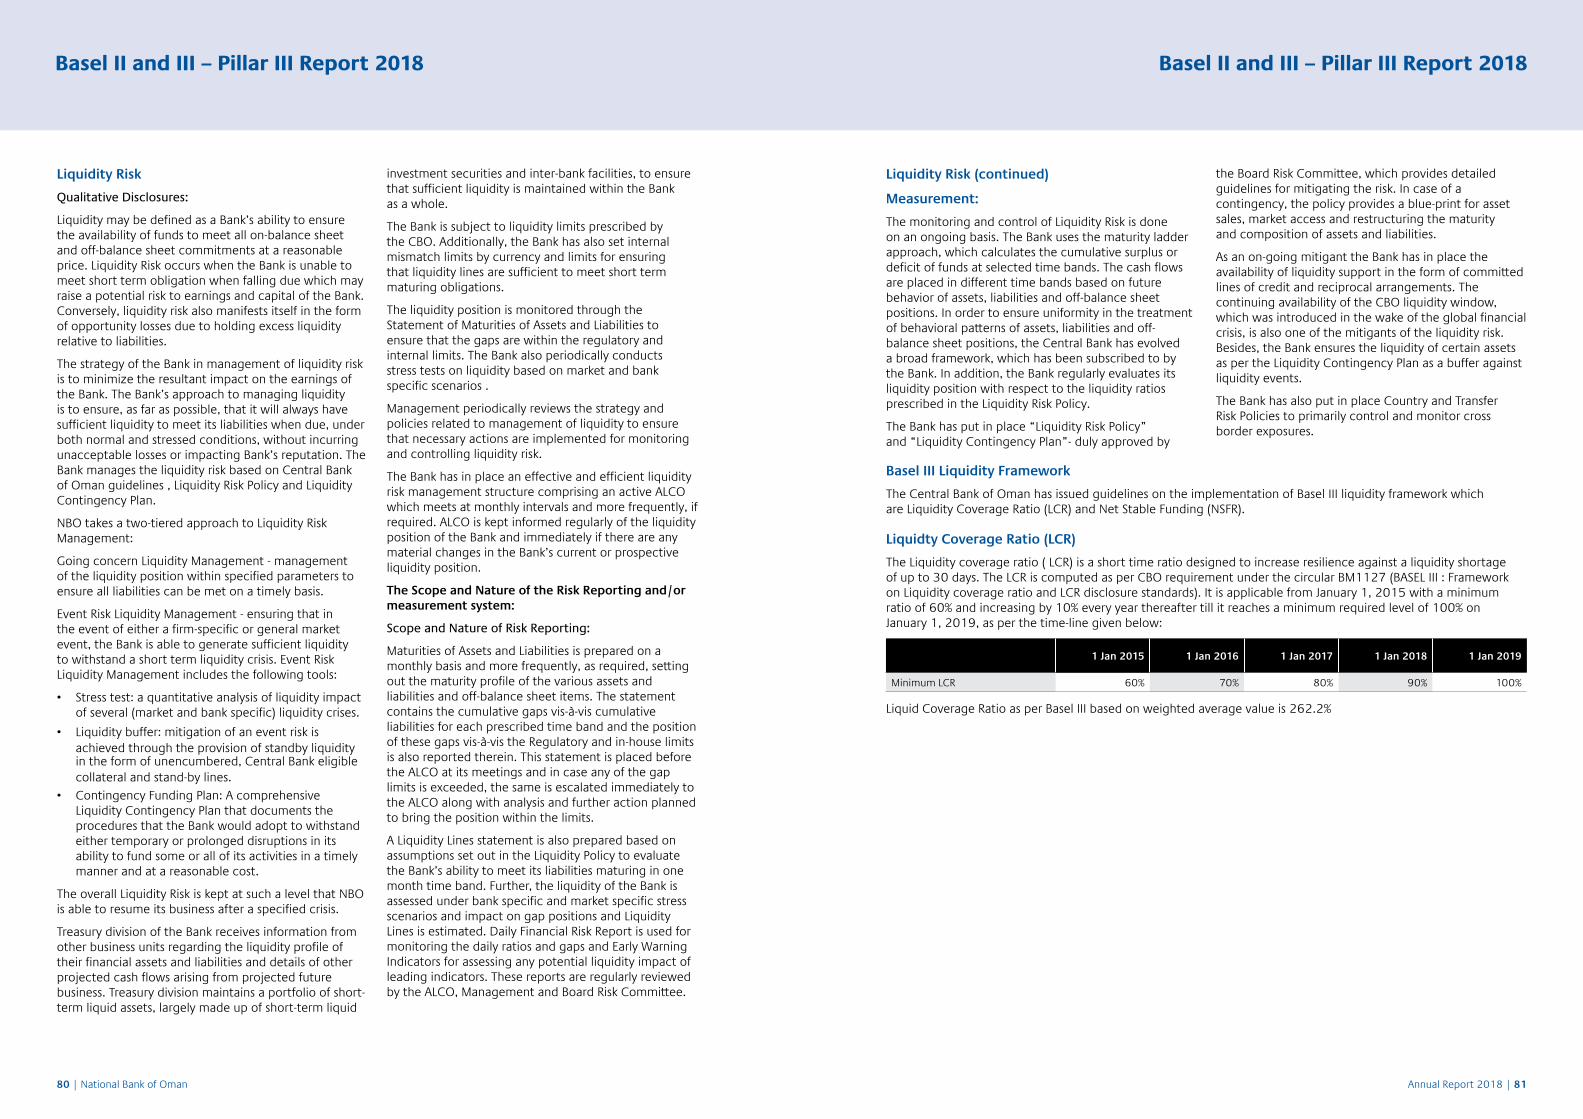
Liquidity Risk
Qualitative Disclosures:
Liquidity may be defined as a Bank’s ability to ensure the availability of funds to meet all on-balance sheet and off-balance sheet commitments at a reasonable price. Liquidity Risk occurs when the Bank is unable to meet short term obligation when falling due which may raise a potential risk to earnings and capital of the Bank. Conversely, liquidity risk also manifests itself in the form of opportunity losses due to holding excess liquidity relative to liabilities.
The strategy of the Bank in management of liquidity risk is to minimize the resultant impact on the earnings of the Bank. The Bank’s approach to managing liquidity is to ensure, as far as possible, that it will always have sufficient liquidity to meet its liabilities when due, under both normal and stressed conditions, without incurring unacceptable losses or impacting Bank’s reputation. The Bank manages the liquidity risk based on Central Bank of Oman guidelines , Liquidity Risk Policy and Liquidity Contingency Plan.
NBO takes a two-tiered approach to Liquidity Risk Management:
Going concern Liquidity Management - management of the liquidity position within specified parameters to ensure all liabilities can be met on a timely basis.
Event Risk Liquidity Management - ensuring that in the event of either a firm-specific or general market event, the Bank is able to generate sufficient liquidity to withstand a short term liquidity crisis. Event Risk Liquidity Management includes the following tools:
• Stress test: a quantitative analysis of liquidity impact of several (market and bank specific) liquidity crises.
• Liquidity buffer: mitigation of an event risk is achieved through the provision of standby liquidity in the form of unencumbered, Central Bank eligible collateral and stand-by lines.
• Contingency Funding Plan: A comprehensive Liquidity Contingency Plan that documents the procedures that the Bank would adopt to withstand either temporary or prolonged disruptions in its ability to fund some or all of its activities in a timely manner and at a reasonable cost.
The overall Liquidity Risk is kept at such a level that NBO is able to resume its business after a specified crisis.
Treasury division of the Bank receives information from other business units regarding the liquidity profile of their financial assets and liabilities and details of other projected cash flows arising from projected future business. Treasury division maintains a portfolio of short-term liquid assets, largely made up of short-term liquid
investment securities and inter-bank facilities, to ensure that sufficient liquidity is maintained within the Bank as a whole.
The Bank is subject to liquidity limits prescribed by the CBO. Additionally, the Bank has also set internal mismatch limits by currency and limits for ensuring that liquidity lines are sufficient to meet short term maturing obligations.
The liquidity position is monitored through the Statement of Maturities of Assets and Liabilities to ensure that the gaps are within the regulatory and internal limits. The Bank also periodically conducts stress tests on liquidity based on market and bank specific scenarios .
Management periodically reviews the strategy and policies related to management of liquidity to ensure that necessary actions are implemented for monitoring and controlling liquidity risk.
The Bank has in place an effective and efficient liquidity risk management structure comprising an active ALCO which meets at monthly intervals and more frequently, if required. ALCO is kept informed regularly of the liquidity position of the Bank and immediately if there are any material changes in the Bank’s current or prospective liquidity position.
The Scope and Nature of the Risk Reporting and/or measurement system:
Scope and Nature of Risk Reporting:
Maturities of Assets and Liabilities is prepared on a monthly basis and more frequently, as required, setting out the maturity profile of the various assets and liabilities and off-balance sheet items. The statement contains the cumulative gaps vis-à-vis cumulative liabilities for each prescribed time band and the position of these gaps vis-à-vis the Regulatory and in-house limits is also reported therein. This statement is placed before the ALCO at its meetings and in case any of the gap limits is exceeded, the same is escalated immediately to the ALCO along with analysis and further action planned to bring the position within the limits.
A Liquidity Lines statement is also prepared based on assumptions set out in the Liquidity Policy to evaluate the Bank’s ability to meet its liabilities maturing in one month time band. Further, the liquidity of the Bank is assessed under bank specific and market specific stress scenarios and impact on gap positions and Liquidity Lines is estimated. Daily Financial Risk Report is used for monitoring the daily ratios and gaps and Early Warning Indicators for assessing any potential liquidity impact of leading indicators. These reports are regularly reviewed by the ALCO, Management and Board Risk Committee.
Liquidity Risk (continued)
Measurement:
The monitoring and control of Liquidity Risk is done on an ongoing basis. The Bank uses the maturity ladder approach, which calculates the cumulative surplus or deficit of funds at selected time bands. The cash flows are placed in different time bands based on future behavior of assets, liabilities and off-balance sheet positions. In order to ensure uniformity in the treatment of behavioral patterns of assets, liabilities and off-balance sheet positions, the Central Bank has evolved a broad framework, which has been subscribed to by the Bank. In addition, the Bank regularly evaluates its liquidity position with respect to the liquidity ratios prescribed in the Liquidity Risk Policy.
The Bank has put in place “Liquidity Risk Policy” and “Liquidity Contingency Plan”- duly approved by
the Board Risk Committee, which provides detailed guidelines for mitigating the risk. In case of a contingency, the policy provides a blue-print for asset sales, market access and restructuring the maturity and composition of assets and liabilities.
As an on-going mitigant the Bank has in place the availability of liquidity support in the form of committed lines of credit and reciprocal arrangements. The continuing availability of the CBO liquidity window, which was introduced in the wake of the global financial crisis, is also one of the mitigants of the liquidity risk. Besides, the Bank ensures the liquidity of certain assets as per the Liquidity Contingency Plan as a buffer against liquidity events.
The Bank has also put in place Country and Transfer Risk Policies to primarily control and monitor cross border exposures.
Basel III Liquidity Framework
The Central Bank of Oman has issued guidelines on the implementation of Basel III liquidity framework which are Liquidity Coverage Ratio (LCR) and Net Stable Funding (NSFR).
Liquidty Coverage Ratio (LCR)
The Liquidity coverage ratio ( LCR) is a short time ratio designed to increase resilience against a liquidity shortage of up to 30 days. The LCR is computed as per CBO requirement under the circular BM1127 (BASEL III : Framework on Liquidity coverage ratio and LCR disclosure standards). It is applicable from January 1, 2015 with a minimum ratio of 60% and increasing by 10% every year thereafter till it reaches a minimum required level of 100% on January 1, 2019, as per the time-line given below:
1 Jan 2015 1 Jan 2016 1 Jan 2017 1 Jan 2018 1 Jan 2019
Minimum LCR 60% 70% 80% 90% 100%
Liquid Coverage Ratio as per Basel III based on weighted average value is 262.2%
Basel II and III – Pillar III Report 2018Basel II and III – Pillar III Report 2018
80 | National Bank of Oman Annual Report 2018 | 81
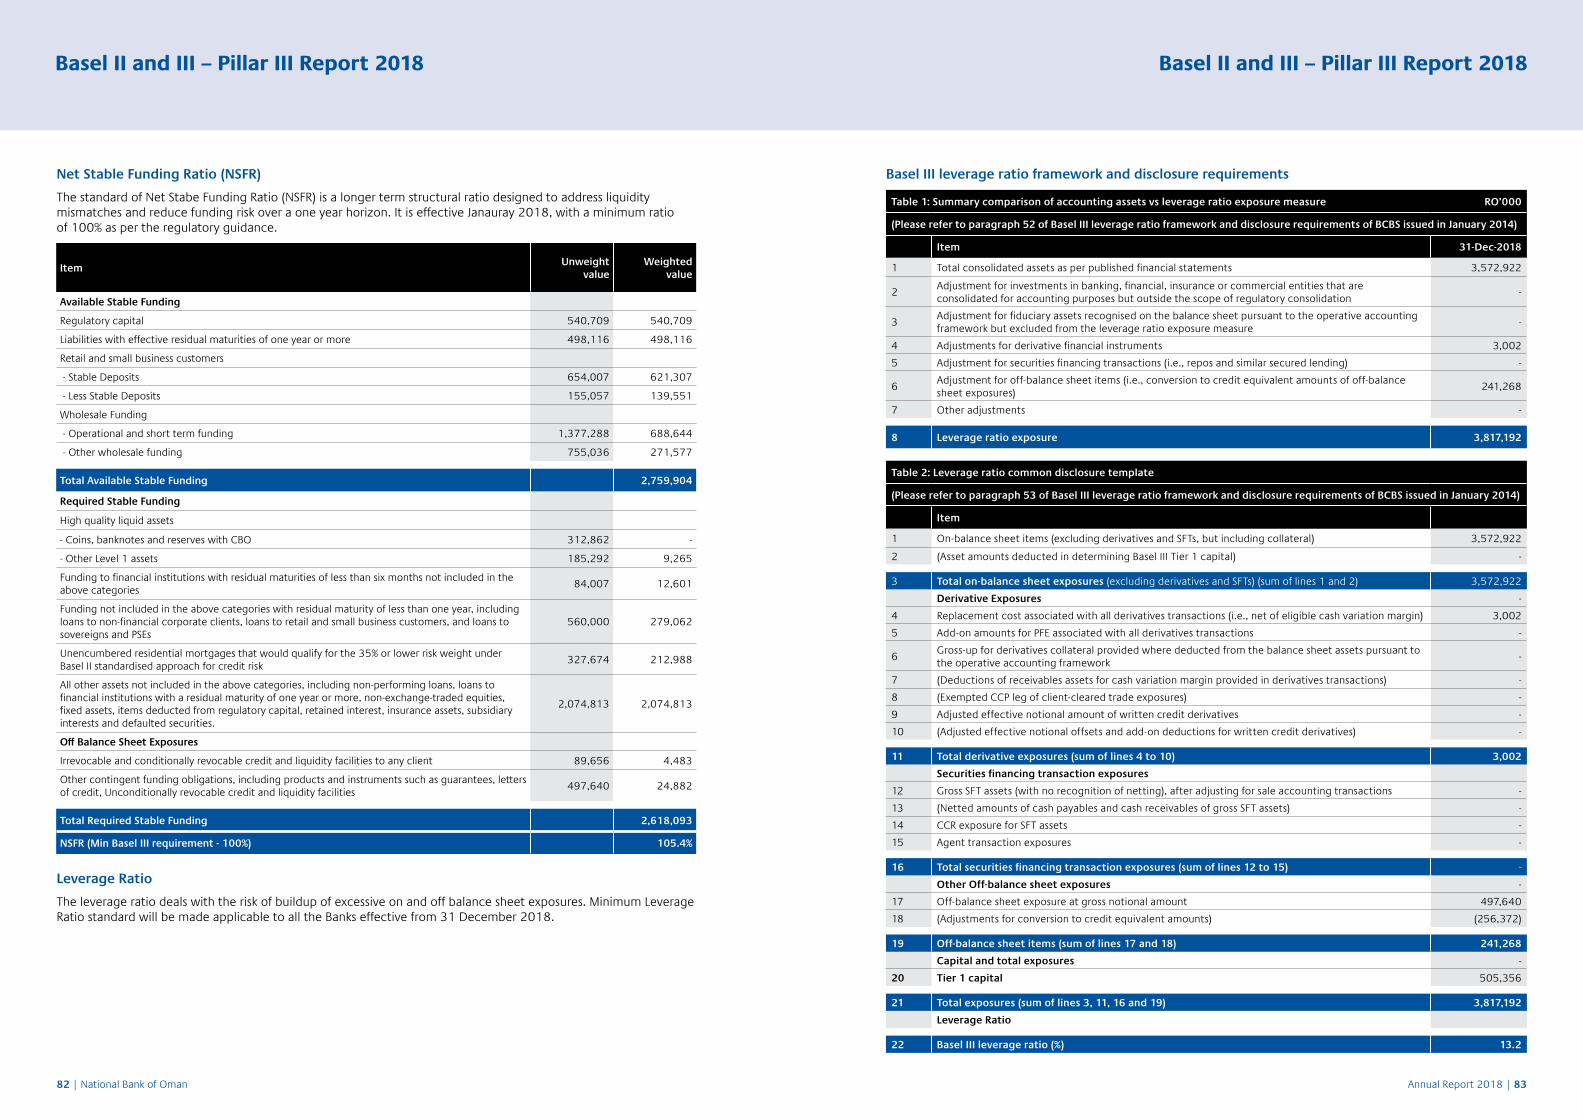
ItemUnweight
valueWeighted
value
Available Stable Funding
Regulatory capital 540,709 540,709
Liabilities with effective residual maturities of one year or more 498,116 498,116
Retail and small business customers
- Stable Deposits 654,007 621,307
- Less Stable Deposits 155,057 139,551
Wholesale Funding
- Operational and short term funding 1,377,288 688,644
- Other wholesale funding 755,036 271,577
Total Available Stable Funding 2,759,904
Required Stable Funding
High quality liquid assets
- Coins, banknotes and reserves with CBO 312,862 -
- Other Level 1 assets 185,292 9,265
Funding to financial institutions with residual maturities of less than six months not included in the above categories
84,007 12,601
Funding not included in the above categories with residual maturity of less than one year, including loans to non-financial corporate clients, loans to retail and small business customers, and loans to sovereigns and PSEs
560,000 279,062
Unencumbered residential mortgages that would qualify for the 35% or lower risk weight under Basel II standardised approach for credit risk
327,674 212,988
All other assets not included in the above categories, including non-performing loans, loans to financial institutions with a residual maturity of one year or more, non-exchange-traded equities, fixed assets, items deducted from regulatory capital, retained interest, insurance assets, subsidiary interests and defaulted securities.
2,074,813 2,074,813
Off Balance Sheet Exposures
Irrevocable and conditionally revocable credit and liquidity facilities to any client 89,656 4,483
Other contingent funding obligations, including products and instruments such as guarantees, letters of credit, Unconditionally revocable credit and liquidity facilities
497,640 24,882
Total Required Stable Funding 2,618,093
NSFR (Min Basel III requirement - 100%) 105.4%
Net Stable Funding Ratio (NSFR)
The standard of Net Stabe Funding Ratio (NSFR) is a longer term structural ratio designed to address liquidity mismatches and reduce funding risk over a one year horizon. It is effective Janauray 2018, with a minimum ratio of 100% as per the regulatory guidance.
Leverage Ratio
The leverage ratio deals with the risk of buildup of excessive on and off balance sheet exposures. Minimum Leverage Ratio standard will be made applicable to all the Banks effective from 31 December 2018.
Basel III leverage ratio framework and disclosure requirements
Table 1: Summary comparison of accounting assets vs leverage ratio exposure measure RO’000
(Please refer to paragraph 52 of Basel III leverage ratio framework and disclosure requirements of BCBS issued in January 2014)
Item 31-Dec-2018
1 Total consolidated assets as per published financial statements 3,572,922
2Adjustment for investments in banking, financial, insurance or commercial entities that are consolidated for accounting purposes but outside the scope of regulatory consolidation
-
3Adjustment for fiduciary assets recognised on the balance sheet pursuant to the operative accounting framework but excluded from the leverage ratio exposure measure
-
4 Adjustments for derivative financial instruments 3,002
5 Adjustment for securities financing transactions (i.e., repos and similar secured lending) -
6Adjustment for off-balance sheet items (i.e., conversion to credit equivalent amounts of off-balance sheet exposures)
241,268
7 Other adjustments -
8 Leverage ratio exposure 3,817,192
Table 2: Leverage ratio common disclosure template
(Please refer to paragraph 53 of Basel III leverage ratio framework and disclosure requirements of BCBS issued in January 2014)
Item
1 On-balance sheet items (excluding derivatives and SFTs, but including collateral) 3,572,922
2 (Asset amounts deducted in determining Basel III Tier 1 capital) -
3 Total on-balance sheet exposures (excluding derivatives and SFTs) (sum of lines 1 and 2) 3,572,922
Derivative Exposures -
4 Replacement cost associated with all derivatives transactions (i.e., net of eligible cash variation margin) 3,002
5 Add-on amounts for PFE associated with all derivatives transactions -
6Gross-up for derivatives collateral provided where deducted from the balance sheet assets pursuant to the operative accounting framework
-
7 (Deductions of receivables assets for cash variation margin provided in derivatives transactions) -
8 (Exempted CCP leg of client-cleared trade exposures) -
9 Adjusted effective notional amount of written credit derivatives -
10 (Adjusted effective notional offsets and add-on deductions for written credit derivatives) -
11 Total derivative exposures (sum of lines 4 to 10) 3,002
Securities financing transaction exposures
12 Gross SFT assets (with no recognition of netting), after adjusting for sale accounting transactions -
13 (Netted amounts of cash payables and cash receivables of gross SFT assets) -
14 CCR exposure for SFT assets -
15 Agent transaction exposures -
16 Total securities financing transaction exposures (sum of lines 12 to 15) -
Other Off-balance sheet exposures -
17 Off-balance sheet exposure at gross notional amount 497,640
18 (Adjustments for conversion to credit equivalent amounts) (256,372)
19 Off-balance sheet items (sum of lines 17 and 18) 241,268
Capital and total exposures -
20 Tier 1 capital 505,356
21 Total exposures (sum of lines 3, 11, 16 and 19) 3,817,192
Leverage Ratio
22 Basel III leverage ratio (%) 13.2
Basel II and III – Pillar III Report 2018Basel II and III – Pillar III Report 2018
82 | National Bank of Oman Annual Report 2018 | 83
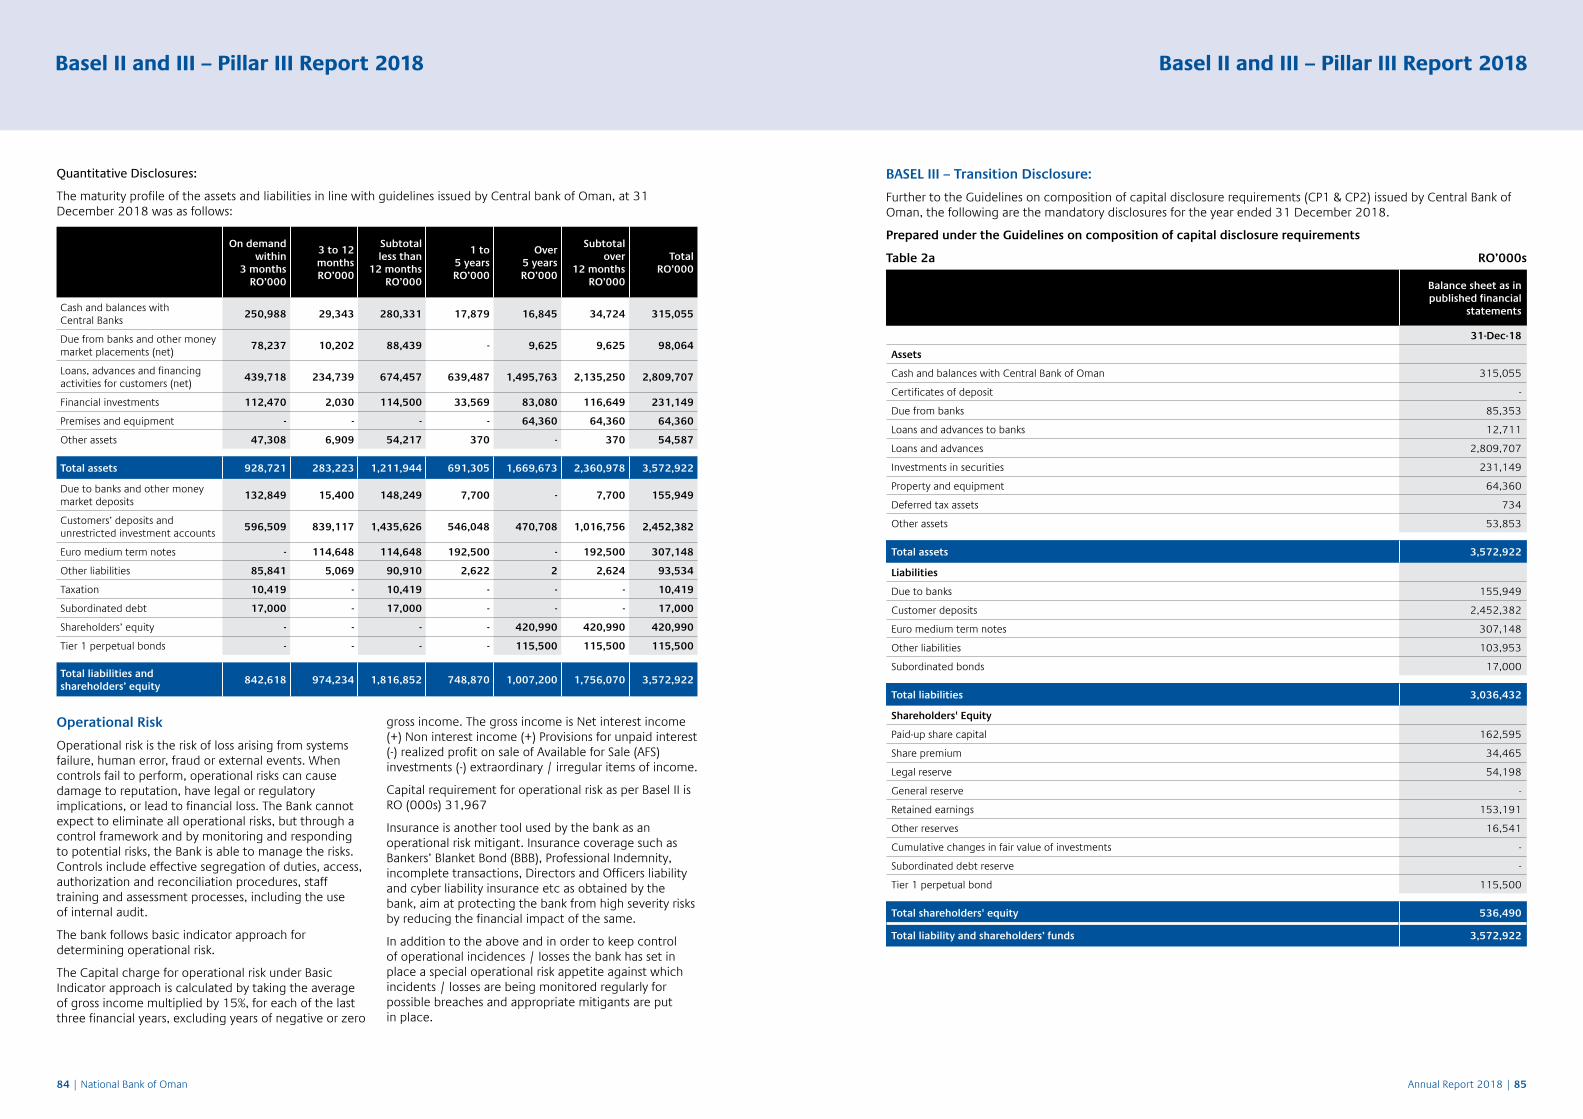
Quantitative Disclosures:
The maturity profile of the assets and liabilities in line with guidelines issued by Central bank of Oman, at 31 December 2018 was as follows:
On demand within
3 months RO’000
3 to 12 months RO’000
Subtotal less than
12 months RO’000
1 to 5 years RO’000
Over 5 years RO’000
Subtotal over
12 months RO’000
TotalRO’000
Cash and balances with Central Banks
250,988 29,343 280,331 17,879 16,845 34,724 315,055
Due from banks and other money market placements (net)
78,237 10,202 88,439 - 9,625 9,625 98,064
Loans, advances and financing activities for customers (net)
439,718 234,739 674,457 639,487 1,495,763 2,135,250 2,809,707
Financial investments 112,470 2,030 114,500 33,569 83,080 116,649 231,149
Premises and equipment - - - - 64,360 64,360 64,360
Other assets 47,308 6,909 54,217 370 - 370 54,587
Total assets 928,721 283,223 1,211,944 691,305 1,669,673 2,360,978 3,572,922
Due to banks and other money market deposits
132,849 15,400 148,249 7,700 - 7,700 155,949
Customers’ deposits and unrestricted investment accounts
596,509 839,117 1,435,626 546,048 470,708 1,016,756 2,452,382
Euro medium term notes - 114,648 114,648 192,500 - 192,500 307,148
Other liabilities 85,841 5,069 90,910 2,622 2 2,624 93,534
Taxation 10,419 - 10,419 - - - 10,419
Subordinated debt 17,000 - 17,000 - - - 17,000
Shareholders’ equity - - - - 420,990 420,990 420,990
Tier 1 perpetual bonds - - - - 115,500 115,500 115,500
Total liabilities and shareholders’ equity
842,618 974,234 1,816,852 748,870 1,007,200 1,756,070 3,572,922
Operational Risk
Operational risk is the risk of loss arising from systems failure, human error, fraud or external events. When controls fail to perform, operational risks can cause damage to reputation, have legal or regulatory implications, or lead to financial loss. The Bank cannot expect to eliminate all operational risks, but through a control framework and by monitoring and responding to potential risks, the Bank is able to manage the risks. Controls include effective segregation of duties, access, authorization and reconciliation procedures, staff training and assessment processes, including the use of internal audit.
The bank follows basic indicator approach for determining operational risk.
The Capital charge for operational risk under Basic Indicator approach is calculated by taking the average of gross income multiplied by 15%, for each of the last three financial years, excluding years of negative or zero
gross income. The gross income is Net interest income (+) Non interest income (+) Provisions for unpaid interest (-) realized profit on sale of Available for Sale (AFS) investments (-) extraordinary / irregular items of income.
Capital requirement for operational risk as per Basel II is RO (000s) 31,967
Insurance is another tool used by the bank as an operational risk mitigant. Insurance coverage such as Bankers’ Blanket Bond (BBB), Professional Indemnity, incomplete transactions, Directors and Officers liability and cyber liability insurance etc as obtained by the bank, aim at protecting the bank from high severity risks by reducing the financial impact of the same.
In addition to the above and in order to keep control of operational incidences / losses the bank has set in place a special operational risk appetite against which incidents / losses are being monitored regularly for possible breaches and appropriate mitigants are put in place.
Balance sheet as in published financial
statements
31-Dec-18
Assets
Cash and balances with Central Bank of Oman 315,055
Certificates of deposit -
Due from banks 85,353
Loans and advances to banks 12,711
Loans and advances 2,809,707
Investments in securities 231,149
Property and equipment 64,360
Deferred tax assets 734
Other assets 53,853
Total assets 3,572,922
Liabilities
Due to banks 155,949
Customer deposits 2,452,382
Euro medium term notes 307,148
Other liabilities 103,953
Subordinated bonds 17,000
Total liabilities 3,036,432
Shareholders' Equity
Paid-up share capital 162,595
Share premium 34,465
Legal reserve 54,198
General reserve -
Retained earnings 153,191
Other reserves 16,541
Cumulative changes in fair value of investments -
Subordinated debt reserve -
Tier 1 perpetual bond 115,500
Total shareholders' equity 536,490
Total liability and shareholders’ funds 3,572,922
BASEL III – Transition Disclosure:
Further to the Guidelines on composition of capital disclosure requirements (CP1 & CP2) issued by Central Bank of Oman, the following are the mandatory disclosures for the year ended 31 December 2018.
Prepared under the Guidelines on composition of capital disclosure requirements
Table 2a RO’000s
Basel II and III – Pillar III Report 2018Basel II and III – Pillar III Report 2018
84 | National Bank of Oman Annual Report 2018 | 85
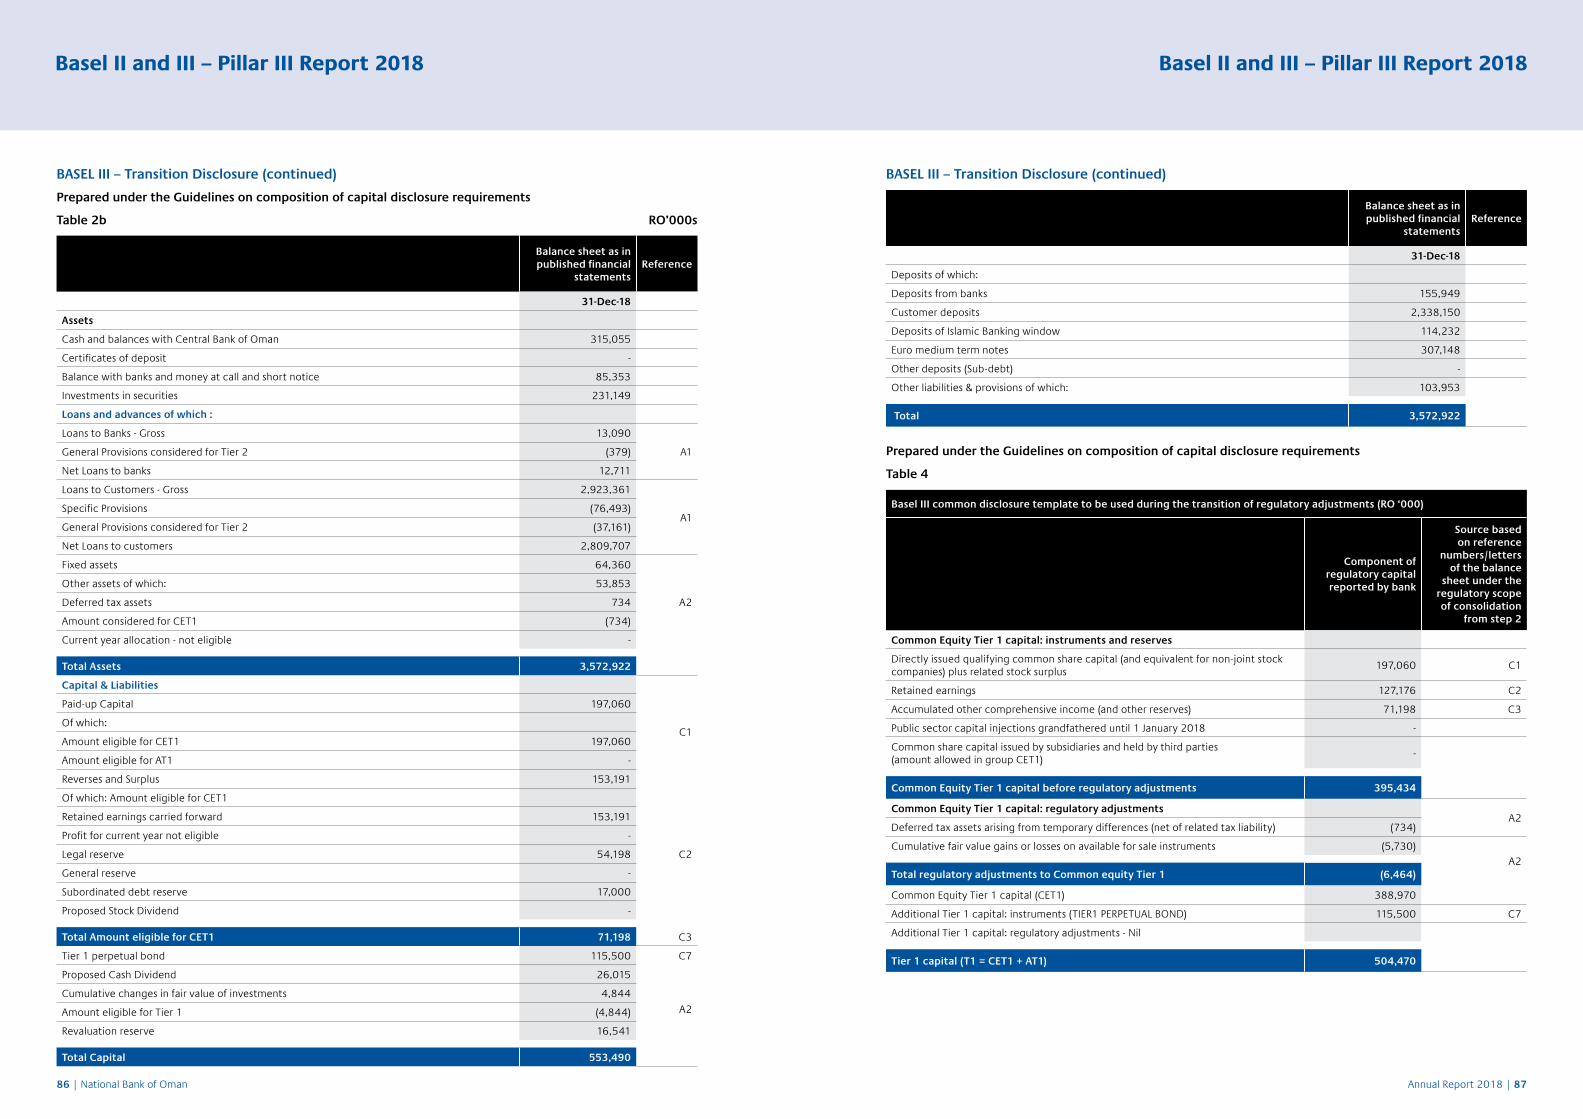
BASEL III – Transition Disclosure (continued)
Prepared under the Guidelines on composition of capital disclosure requirements
Table 2b RO’000s
Balance sheet as in published financial
statements Reference
31-Dec-18
Assets
Cash and balances with Central Bank of Oman 315,055
Certificates of deposit -
Balance with banks and money at call and short notice 85,353
Investments in securities 231,149
Loans and advances of which :
Loans to Banks - Gross 13,090 A1 General Provisions considered for Tier 2 (379)
Net Loans to banks 12,711
Loans to Customers - Gross 2,923,361
A1Specific Provisions (76,493)
General Provisions considered for Tier 2 (37,161)
Net Loans to customers 2,809,707
Fixed assets 64,360
A2
Other assets of which: 53,853
Deferred tax assets 734
Amount considered for CET1 (734)
Current year allocation - not eligible -
Total Assets 3,572,922
Capital & Liabilities
C1
Paid-up Capital 197,060
Of which:
Amount eligible for CET1 197,060
Amount eligible for AT1 -
Reverses and Surplus 153,191
Of which: Amount eligible for CET1
C2
Retained earnings carried forward 153,191
Profit for current year not eligible -
Legal reserve 54,198
General reserve -
Subordinated debt reserve 17,000
Proposed Stock Dividend -
Total Amount eligible for CET1 71,198 C3
Tier 1 perpetual bond 115,500 C7
Proposed Cash Dividend 26,015
A2
Cumulative changes in fair value of investments 4,844
Amount eligible for Tier 1 (4,844)
Revaluation reserve 16,541
Total Capital 553,490
Prepared under the Guidelines on composition of capital disclosure requirements
Table 4
Balance sheet as in published financial
statements Reference
31-Dec-18
Deposits of which:
Deposits from banks 155,949
Customer deposits 2,338,150
Deposits of Islamic Banking window 114,232
Euro medium term notes 307,148
Other deposits (Sub-debt) -
Other liabilities & provisions of which: 103,953
Total 3,572,922
Basel III common disclosure template to be used during the transition of regulatory adjustments (RO ‘000)
Component of regulatory capital reported by bank
Source based on reference
numbers/letters of the balance
sheet under the regulatory scope of consolidation
from step 2
Common Equity Tier 1 capital: instruments and reserves
Directly issued qualifying common share capital (and equivalent for non-joint stock companies) plus related stock surplus
197,060 C1
Retained earnings 127,176 C2
Accumulated other comprehensive income (and other reserves) 71,198 C3
Public sector capital injections grandfathered until 1 January 2018 -
Common share capital issued by subsidiaries and held by third parties (amount allowed in group CET1)
-
Common Equity Tier 1 capital before regulatory adjustments 395,434
Common Equity Tier 1 capital: regulatory adjustments A2
Deferred tax assets arising from temporary differences (net of related tax liability) (734)
Cumulative fair value gains or losses on available for sale instruments (5,730) A2
Total regulatory adjustments to Common equity Tier 1 (6,464)
Common Equity Tier 1 capital (CET1) 388,970
Additional Tier 1 capital: instruments (TIER1 PERPETUAL BOND) 115,500 C7
Additional Tier 1 capital: regulatory adjustments - Nil
Tier 1 capital (T1 = CET1 + AT1) 504,470
BASEL III – Transition Disclosure (continued)
Basel II and III – Pillar III Report 2018Basel II and III – Pillar III Report 2018
86 | National Bank of Oman Annual Report 2018 | 87
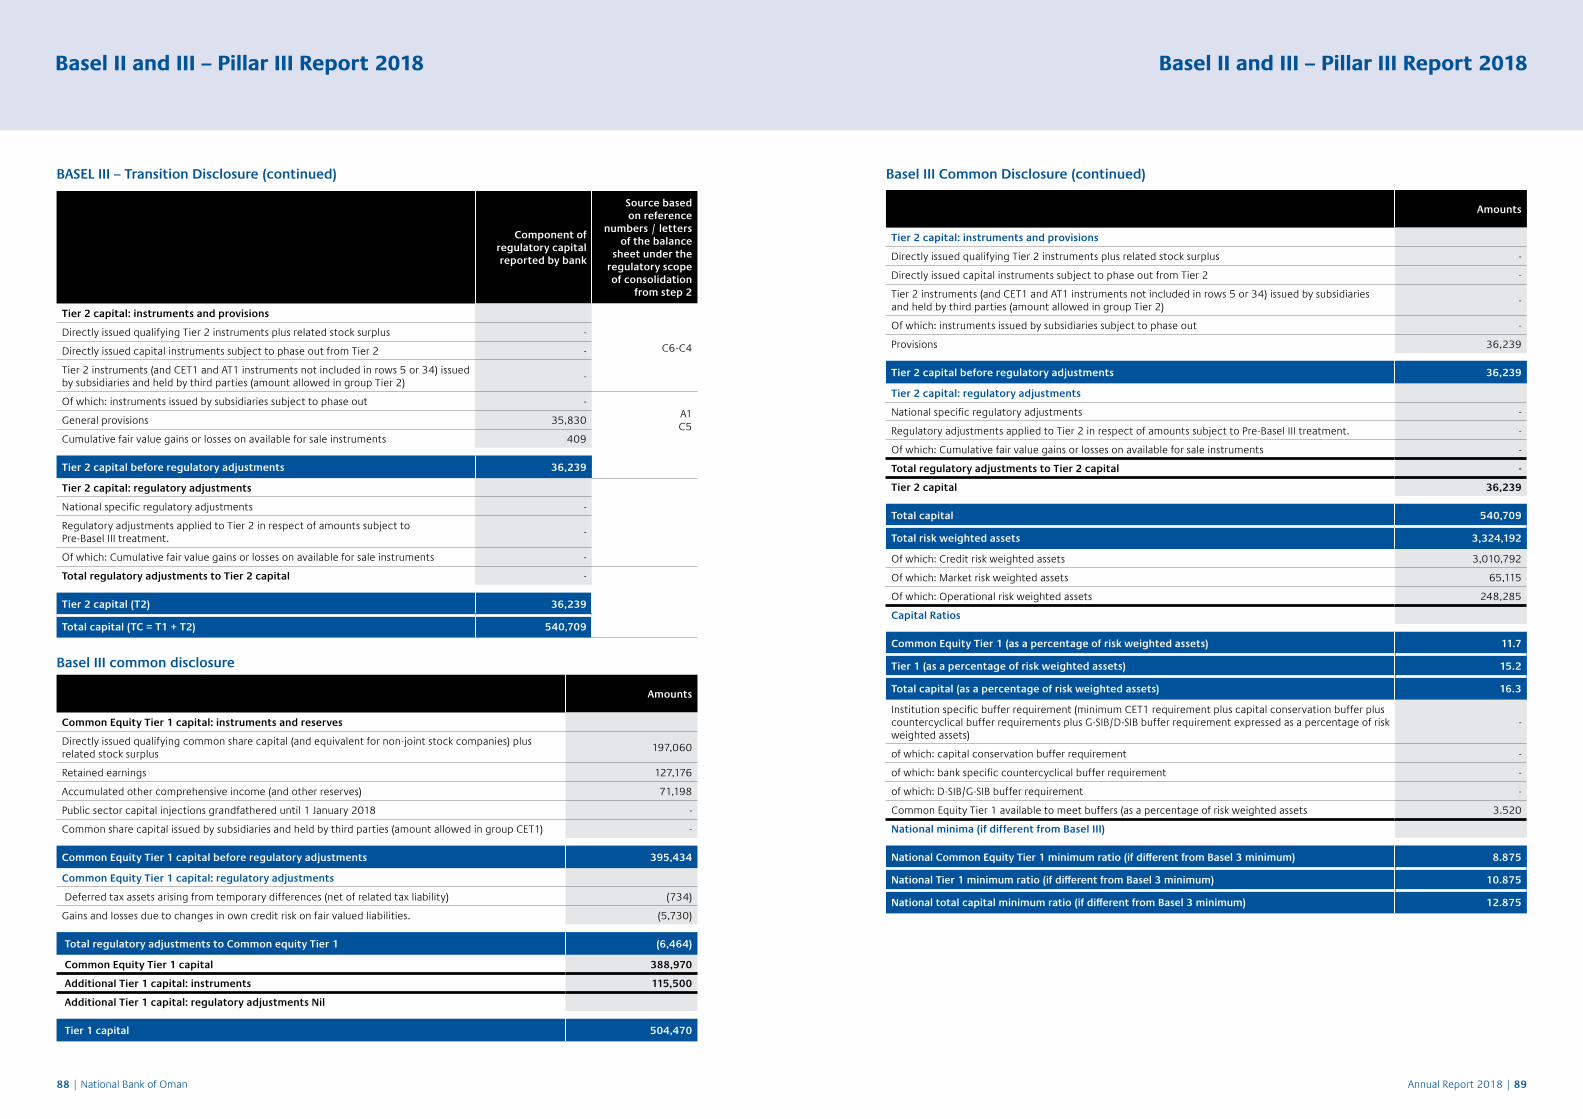
Component of regulatory capital reported by bank
Source based on reference
numbers / letters of the balance
sheet under the regulatory scope of consolidation
from step 2
Tier 2 capital: instruments and provisions
C6-C4
Directly issued qualifying Tier 2 instruments plus related stock surplus -
Directly issued capital instruments subject to phase out from Tier 2 -
Tier 2 instruments (and CET1 and AT1 instruments not included in rows 5 or 34) issued by subsidiaries and held by third parties (amount allowed in group Tier 2)
-
Of which: instruments issued by subsidiaries subject to phase out - A1C5
General provisions 35,830
Cumulative fair value gains or losses on available for sale instruments 409
Tier 2 capital before regulatory adjustments 36,239
Tier 2 capital: regulatory adjustments
National specific regulatory adjustments -
Regulatory adjustments applied to Tier 2 in respect of amounts subject to Pre-Basel III treatment.
-
Of which: Cumulative fair value gains or losses on available for sale instruments -
Total regulatory adjustments to Tier 2 capital -
Tier 2 capital (T2) 36,239
Total capital (TC = T1 + T2) 540,709
BASEL III – Transition Disclosure (continued)
Amounts
Common Equity Tier 1 capital: instruments and reserves
Directly issued qualifying common share capital (and equivalent for non-joint stock companies) plus related stock surplus
197,060
Retained earnings 127,176
Accumulated other comprehensive income (and other reserves) 71,198
Public sector capital injections grandfathered until 1 January 2018 -
Common share capital issued by subsidiaries and held by third parties (amount allowed in group CET1) -
Common Equity Tier 1 capital before regulatory adjustments 395,434
Common Equity Tier 1 capital: regulatory adjustments
Deferred tax assets arising from temporary differences (net of related tax liability) (734)
Gains and losses due to changes in own credit risk on fair valued liabilities. (5,730)
Total regulatory adjustments to Common equity Tier 1 (6,464)
Common Equity Tier 1 capital 388,970
Additional Tier 1 capital: instruments 115,500
Additional Tier 1 capital: regulatory adjustments Nil
Tier 1 capital 504,470
Basel III common disclosure
Basel III Common Disclosure (continued)
Amounts
Tier 2 capital: instruments and provisions
Directly issued qualifying Tier 2 instruments plus related stock surplus -
Directly issued capital instruments subject to phase out from Tier 2 -
Tier 2 instruments (and CET1 and AT1 instruments not included in rows 5 or 34) issued by subsidiaries and held by third parties (amount allowed in group Tier 2)
-
Of which: instruments issued by subsidiaries subject to phase out -
Provisions 36,239
Tier 2 capital before regulatory adjustments 36,239
Tier 2 capital: regulatory adjustments
National specific regulatory adjustments -
Regulatory adjustments applied to Tier 2 in respect of amounts subject to Pre-Basel III treatment. -
Of which: Cumulative fair value gains or losses on available for sale instruments -
Total regulatory adjustments to Tier 2 capital -
Tier 2 capital 36,239
Total capital 540,709
Total risk weighted assets 3,324,192
Of which: Credit risk weighted assets 3,010,792
Of which: Market risk weighted assets 65,115
Of which: Operational risk weighted assets 248,285
Capital Ratios
Common Equity Tier 1 (as a percentage of risk weighted assets) 11.7
Tier 1 (as a percentage of risk weighted assets) 15.2
Total capital (as a percentage of risk weighted assets) 16.3
Institution specific buffer requirement (minimum CET1 requirement plus capital conservation buffer plus countercyclical buffer requirements plus G-SIB/D-SIB buffer requirement expressed as a percentage of risk weighted assets)
-
of which: capital conservation buffer requirement -
of which: bank specific countercyclical buffer requirement -
of which: D-SIB/G-SIB buffer requirement -
Common Equity Tier 1 available to meet buffers (as a percentage of risk weighted assets 3.520
National minima (if different from Basel III)
National Common Equity Tier 1 minimum ratio (if different from Basel 3 minimum) 8.875
National Tier 1 minimum ratio (if different from Basel 3 minimum) 10.875
National total capital minimum ratio (if different from Basel 3 minimum) 12.875
Basel II and III – Pillar III Report 2018Basel II and III – Pillar III Report 2018
88 | National Bank of Oman Annual Report 2018 | 89

Disclosure template for main features of all regulatory capital instruments
1. Common Equity.
Common equity comprises of 1,625,946,355 equity shares of RO 0.100 each fully paid up, issued and governed under the laws of Sultanate of Oman.
2. All other regulatory capital instruments
1 Issuer - National Bank of Oman National Bank of Oman
2Unique identifier (eg CUSIP, ISIN or Bloomberg identifier for private placement)
- XS1321921899Private Placements comprises of 2 issues
3 Governing law(s) of the instrument - English Sultanate of Oman
4 Transitional Basel III rules - Additional Tier 1 Tier 2
5 Post-transitional Basel III rules - Eligible Ineligible
6 Eligible at solo/group/group & solo - Solo Solo
7 Instrument type - Additional Tier 1 Subordinated debts
8 Amount recognised in regulatory capital - RO 115.5 millionRO NIL million (Aggregate of 2 issues)
9 Par value of instrument - RO 115.5 millionRO 17.0 million (Aggregate of 2 issues)
10 Accounting classification - Equity Liability –amortised cost
11 Original date of issuance - 18-Nov-15Between Dec 2013 to Mar 2013
12 Perpetual or dated - Perpetual Dated
13 Original maturity date - Not applicable Dec 2018 to Mar 2019
14 Issuer call subject to prior supervisory approval - Yes Yes – 0 issue, No –2 issues
15Optional call date, contingent call dates and redemption amount
- 18-Nov-20 Not applicable
16 Subsequent call dates, if applicable - Every five years Not applicable
Coupons / dividends
17 Fixed or floating dividend/coupon - Fixed Fixed
18 Coupon rate and any related index - 7.875% 4.50% to 5.25%
19 Existence of a dividend stopper - Yes No
20Fully discretionary, partially discretionary or mandatory
- Fully discretionary Mandatory
21 Existence of step up or other incentive to redeem - No No
22 Noncumulative or cumulative - Non cumulative Not applicable
23 Convertible or non-convertible - Non convertible Non-convertible
24 If convertible, conversion trigger (s) - Not applicable Not applicable
25 If convertible, fully or partially - Not applicable Not applicable
26 If convertible, conversion rate - Not applicable Not applicable
27 If convertible, mandatory or optional conversion - Not applicable Not applicable
28If convertible, specify instrument type convertible into
- Not applicable Not applicable
29If convertible, specify issuer of instrument it converts into
- Not applicable Not applicable
30 Write-down feature - Yes No
31 If write-down, write-down trigger(s) - Non viability event No
32 If write-down, full or partial - Full (See note) No
33 If write-down, permanent or temporary - Permanent No
34If temporary write-down, description of write-up mechanism
- Not applicable No
35Position in subordination hierarchy in liquidation (specify instrument type immediately senior to instrument)
-Subordinated to Senior Liabilities and Tier 2 - Subordinted debts
Subordinated to Senior Liabilities
36 Non-compliant transitioned features - No No
37 If yes, specify non-compliant features - Not applicable Not applicable
Note: The Capital Securities can be cancelled (in the case of a write-down in whole) or written-down in part on a pro rata basis (in the case of a write-down in part) as determined by the Bank in conjunction with the Regulator in accordance with the Capital Regulations.
This report on Basel II & III disclosures was authorized for issue by the Board of Directors on 29 January 2019.
Rawan bint Ahmed Al SaidChairperson
Basel II and III – Pillar III Report 2018Basel II and III – Pillar III Report 2018
90 | National Bank of Oman Annual Report 2018 | 91

Statement of Financial Position as at 31 December 2018
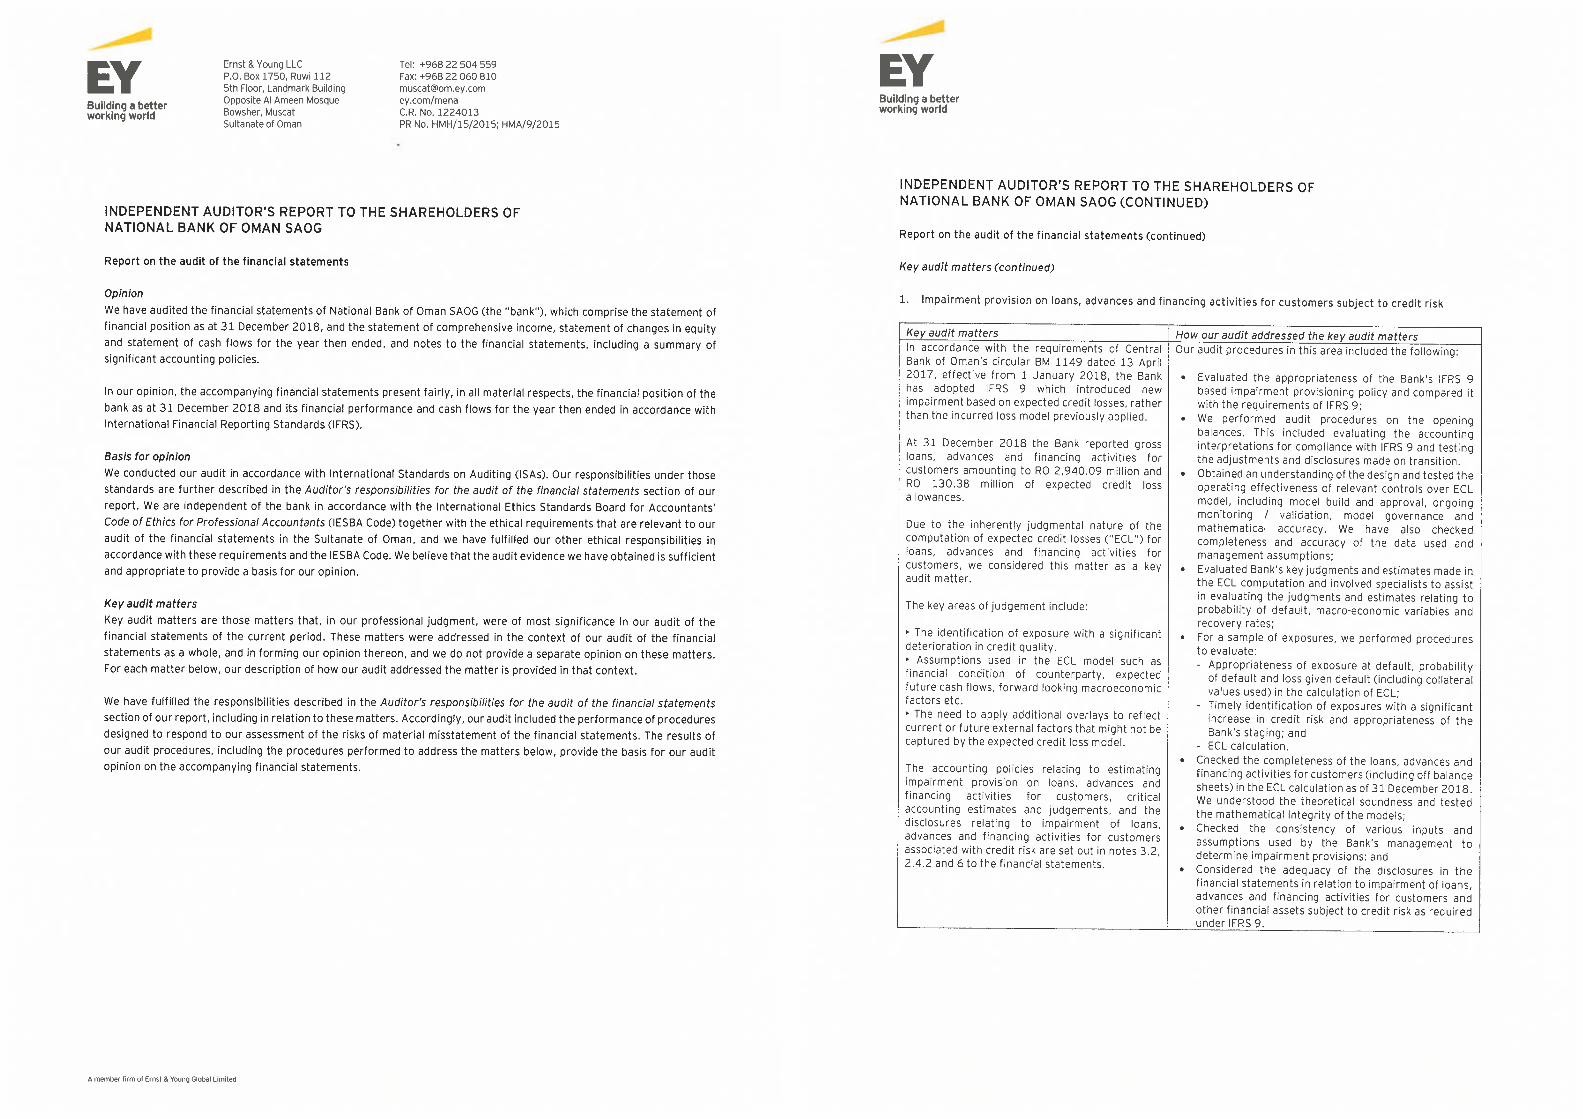
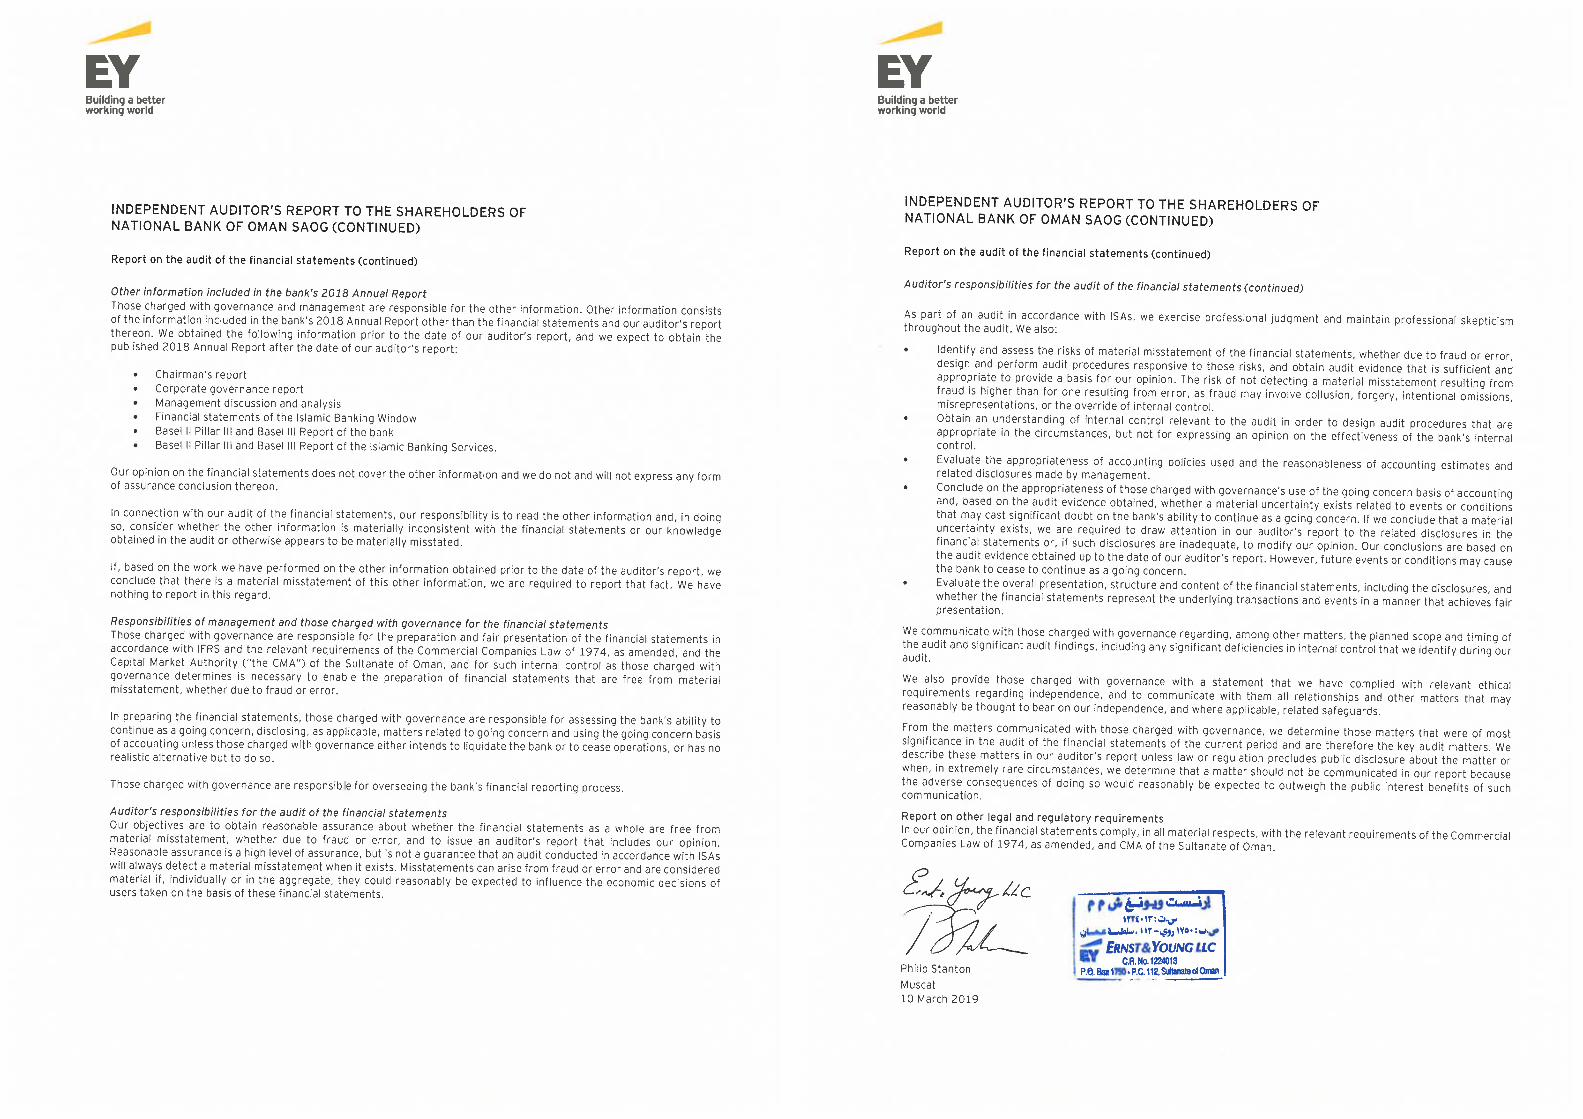
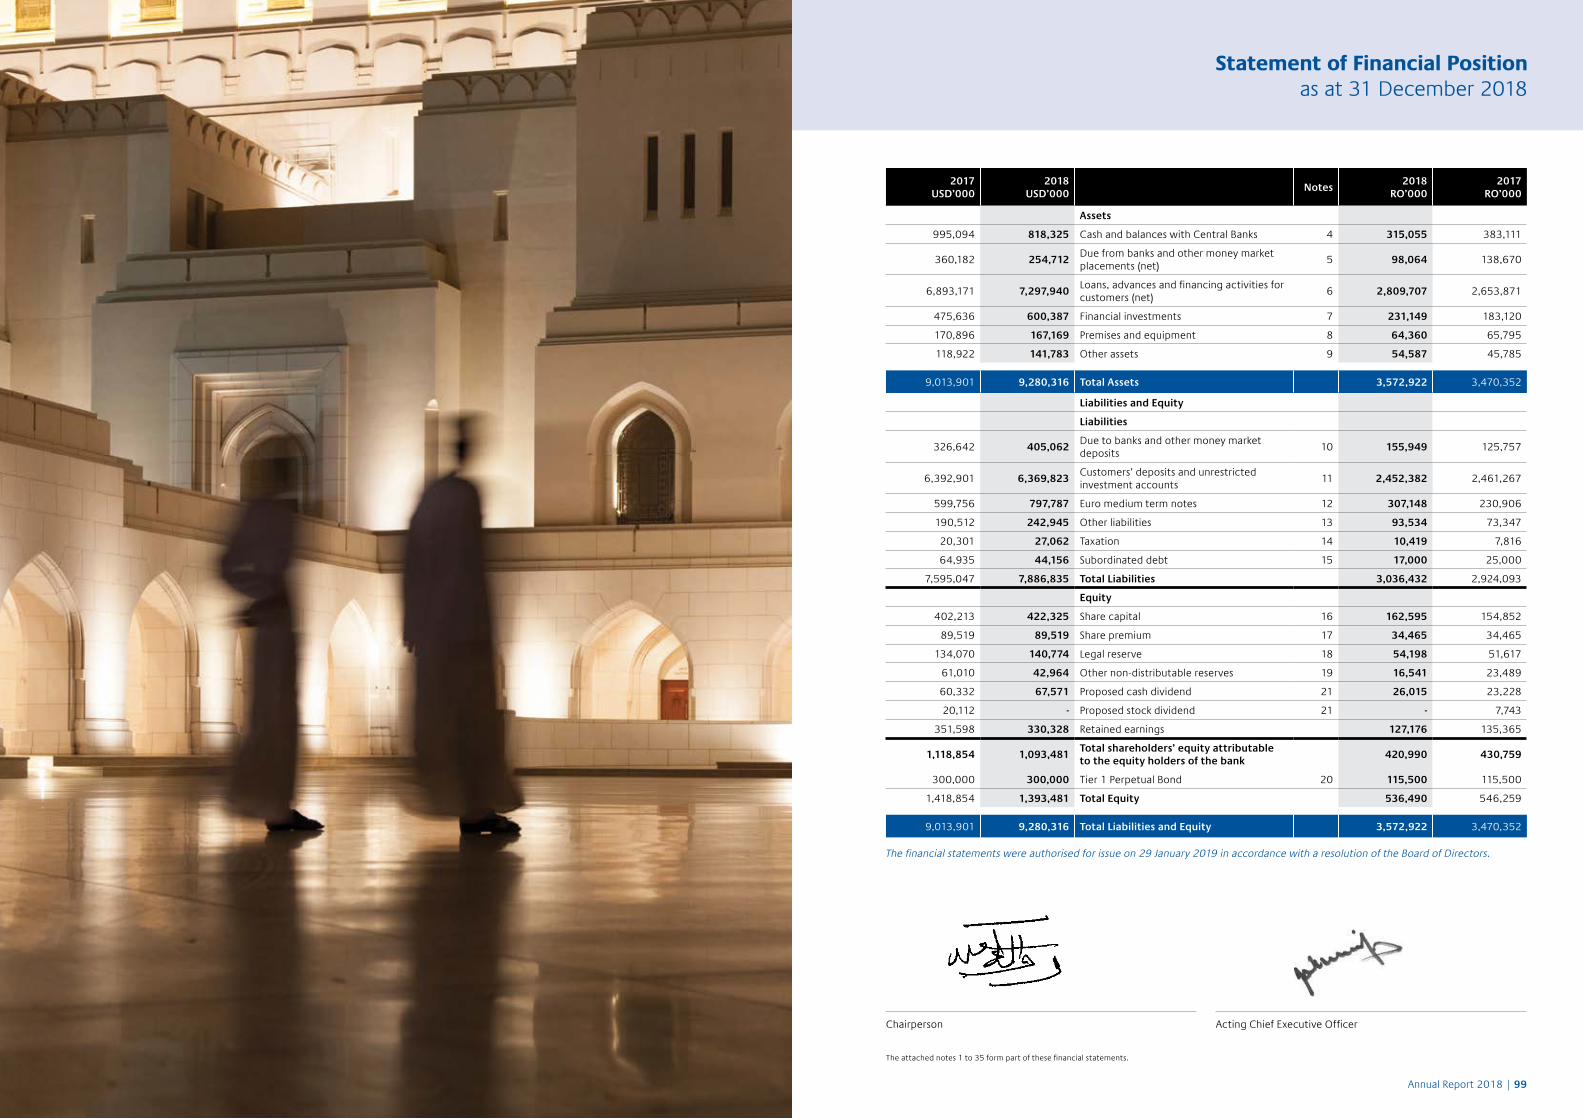
2017 USD’000
2018 USD’000
Notes2018
RO’0002017
RO’000
Assets
995,094 818,325 Cash and balances with Central Banks 4 315,055 383,111
360,182 254,712 Due from banks and other money market placements (net)
5 98,064 138,670
6,893,171 7,297,940 Loans, advances and financing activities for customers (net)
6 2,809,707 2,653,871
475,636 600,387 Financial investments 7 231,149 183,120
170,896 167,169 Premises and equipment 8 64,360 65,795
118,922 141,783 Other assets 9 54,587 45,785
9,013,901 9,280,316 Total Assets 3,572,922 3,470,352
Liabilities and Equity
Liabilities
326,642 405,062Due to banks and other money market deposits
10 155,949 125,757
6,392,901 6,369,823Customers’ deposits and unrestricted investment accounts
11 2,452,382 2,461,267
599,756 797,787 Euro medium term notes 12 307,148 230,906
190,512 242,945 Other liabilities 13 93,534 73,347
20,301 27,062 Taxation 14 10,419 7,816
64,935 44,156 Subordinated debt 15 17,000 25,000
7,595,047 7,886,835 Total Liabilities 3,036,432 2,924,093
Equity
402,213 422,325 Share capital 16 162,595 154,852
89,519 89,519 Share premium 17 34,465 34,465
134,070 140,774 Legal reserve 18 54,198 51,617
61,010 42,964 Other non-distributable reserves 19 16,541 23,489
60,332 67,571 Proposed cash dividend 21 26,015 23,228
20,112 - Proposed stock dividend 21 - 7,743
351,598 330,328 Retained earnings 127,176 135,365
1,118,854 1,093,481Total shareholders’ equity attributable to the equity holders of the bank
420,990 430,759
300,000 300,000 Tier 1 Perpetual Bond 20 115,500 115,500
1,418,854 1,393,481 Total Equity 536,490 546,259
9,013,901 9,280,316 Total Liabilities and Equity 3,572,922 3,470,352
The financial statements were authorised for issue on 29 January 2019 in accordance with a resolution of the Board of Directors.
The attached notes 1 to 35 form part of these financial statements.
Chairperson Acting Chief Executive Officer
Annual Report 2018 | 99
Statement of Financial Positionas at 31 December 2018
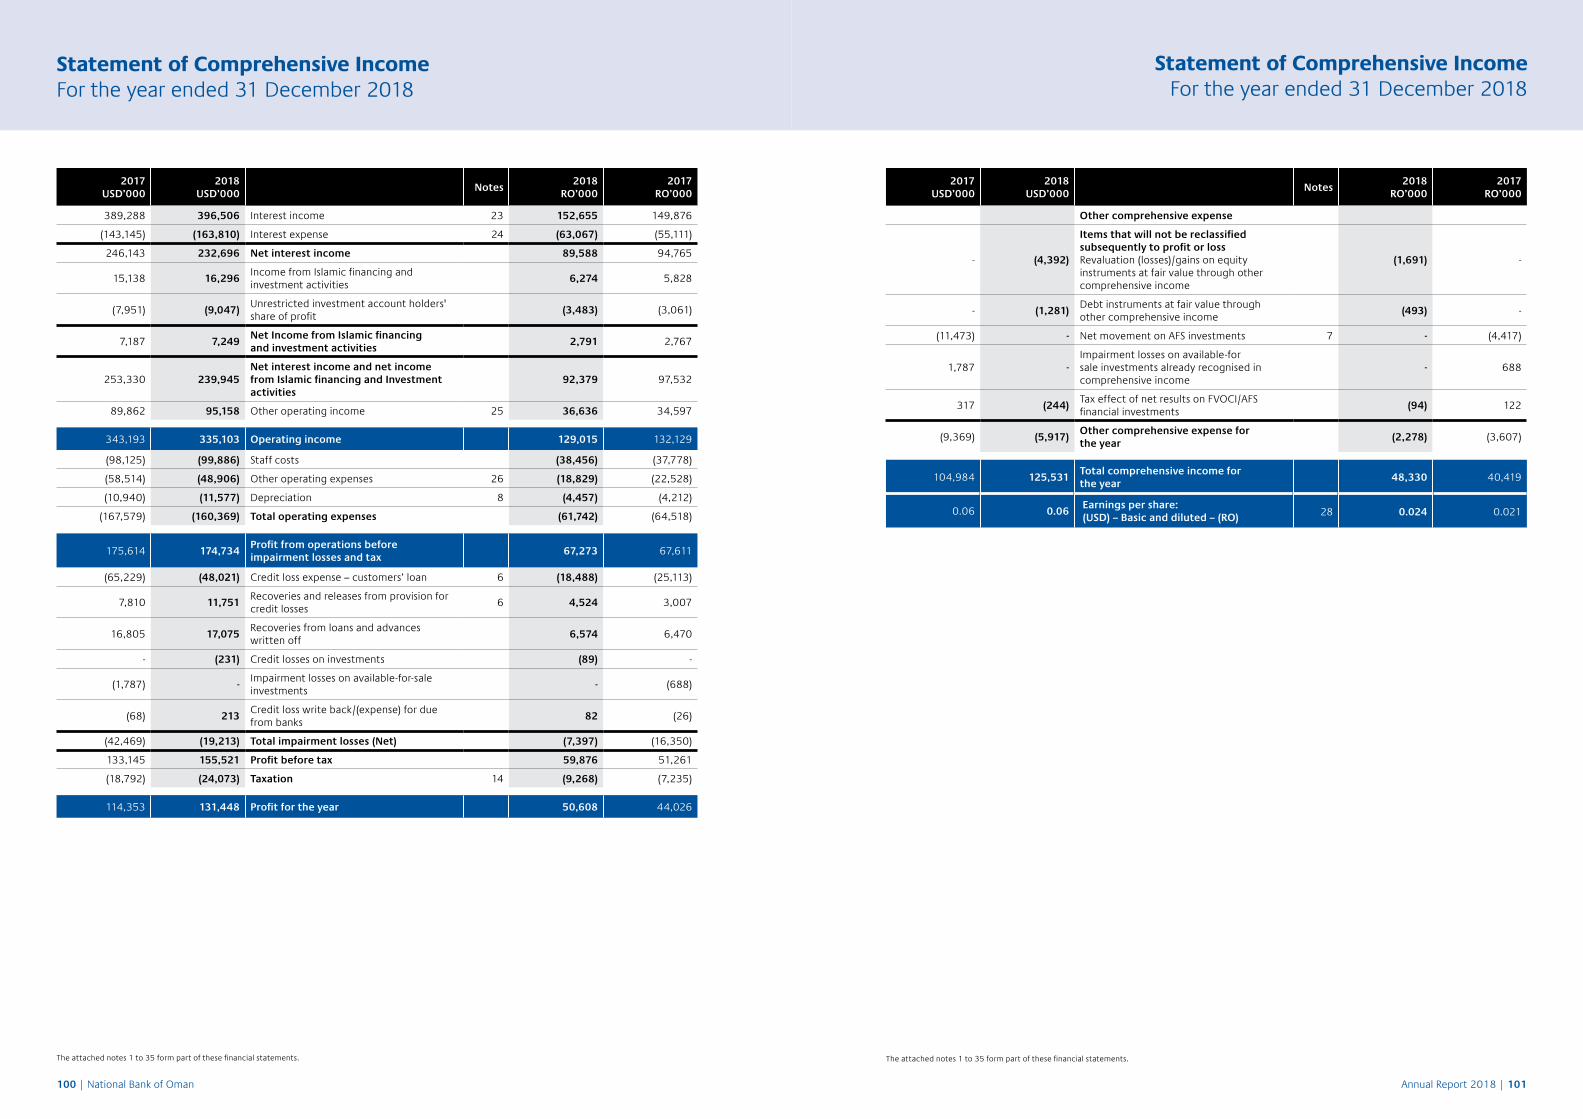
2017 USD’000
2018 USD’000
Notes2018
RO’0002017
RO’000
389,288 396,506 Interest income 23 152,655 149,876
(143,145) (163,810) Interest expense 24 (63,067) (55,111)
246,143 232,696 Net interest income 89,588 94,765
15,138 16,296 Income from Islamic financing and investment activities
6,274 5,828
(7,951) (9,047)Unrestricted investment account holders' share of profit
(3,483) (3,061)
7,187 7,249 Net Income from Islamic financing and investment activities
2,791 2,767
253,330 239,945Net interest income and net income from Islamic financing and Investment activities
92,379 97,532
89,862 95,158 Other operating income 25 36,636 34,597
343,193 335,103 Operating income 129,015 132,129
(98,125) (99,886) Staff costs (38,456) (37,778)
(58,514) (48,906) Other operating expenses 26 (18,829) (22,528)
(10,940) (11,577) Depreciation 8 (4,457) (4,212)
(167,579) (160,369) Total operating expenses (61,742) (64,518)
175,614 174,734Profit from operations before impairment losses and tax
67,273 67,611
(65,229) (48,021) Credit loss expense – customers’ loan 6 (18,488) (25,113)
7,810 11,751 Recoveries and releases from provision for credit losses
6 4,524 3,007
16,805 17,075 Recoveries from loans and advances written off
6,574 6,470
- (231) Credit losses on investments (89) -
(1,787) -Impairment losses on available-for-sale investments
- (688)
(68) 213Credit loss write back/(expense) for due from banks
82 (26)
(42,469) (19,213) Total impairment losses (Net) (7,397) (16,350)
133,145 155,521 Profit before tax 59,876 51,261
(18,792) (24,073) Taxation 14 (9,268) (7,235)
114,353 131,448 Profit for the year 50,608 44,026
The attached notes 1 to 35 form part of these financial statements. The attached notes 1 to 35 form part of these financial statements.
2017 USD’000
2018 USD’000
Notes2018
RO’0002017
RO’000
Other comprehensive expense
- (4,392)
Items that will not be reclassified subsequently to profit or lossRevaluation (losses)/gains on equity instruments at fair value through other comprehensive income
(1,691) -
- (1,281)Debt instruments at fair value through other comprehensive income
(493) -
(11,473) - Net movement on AFS investments 7 - (4,417)
1,787 -Impairment losses on available-for sale investments already recognised in comprehensive income
- 688
317 (244)Tax effect of net results on FVOCI/AFS financial investments
(94) 122
(9,369) (5,917)Other comprehensive expense for the year
(2,278) (3,607)
104,984 125,531Total comprehensive income for the year
48,330 40,419
0.06 0.06 Earnings per share: (USD) – Basic and diluted – (RO) 28 0.024 0.021
100 | National Bank of Oman Annual Report 2018 | 101
Statement of Comprehensive Income For the year ended 31 December 2018
Statement of Comprehensive Income For the year ended 31 December 2018
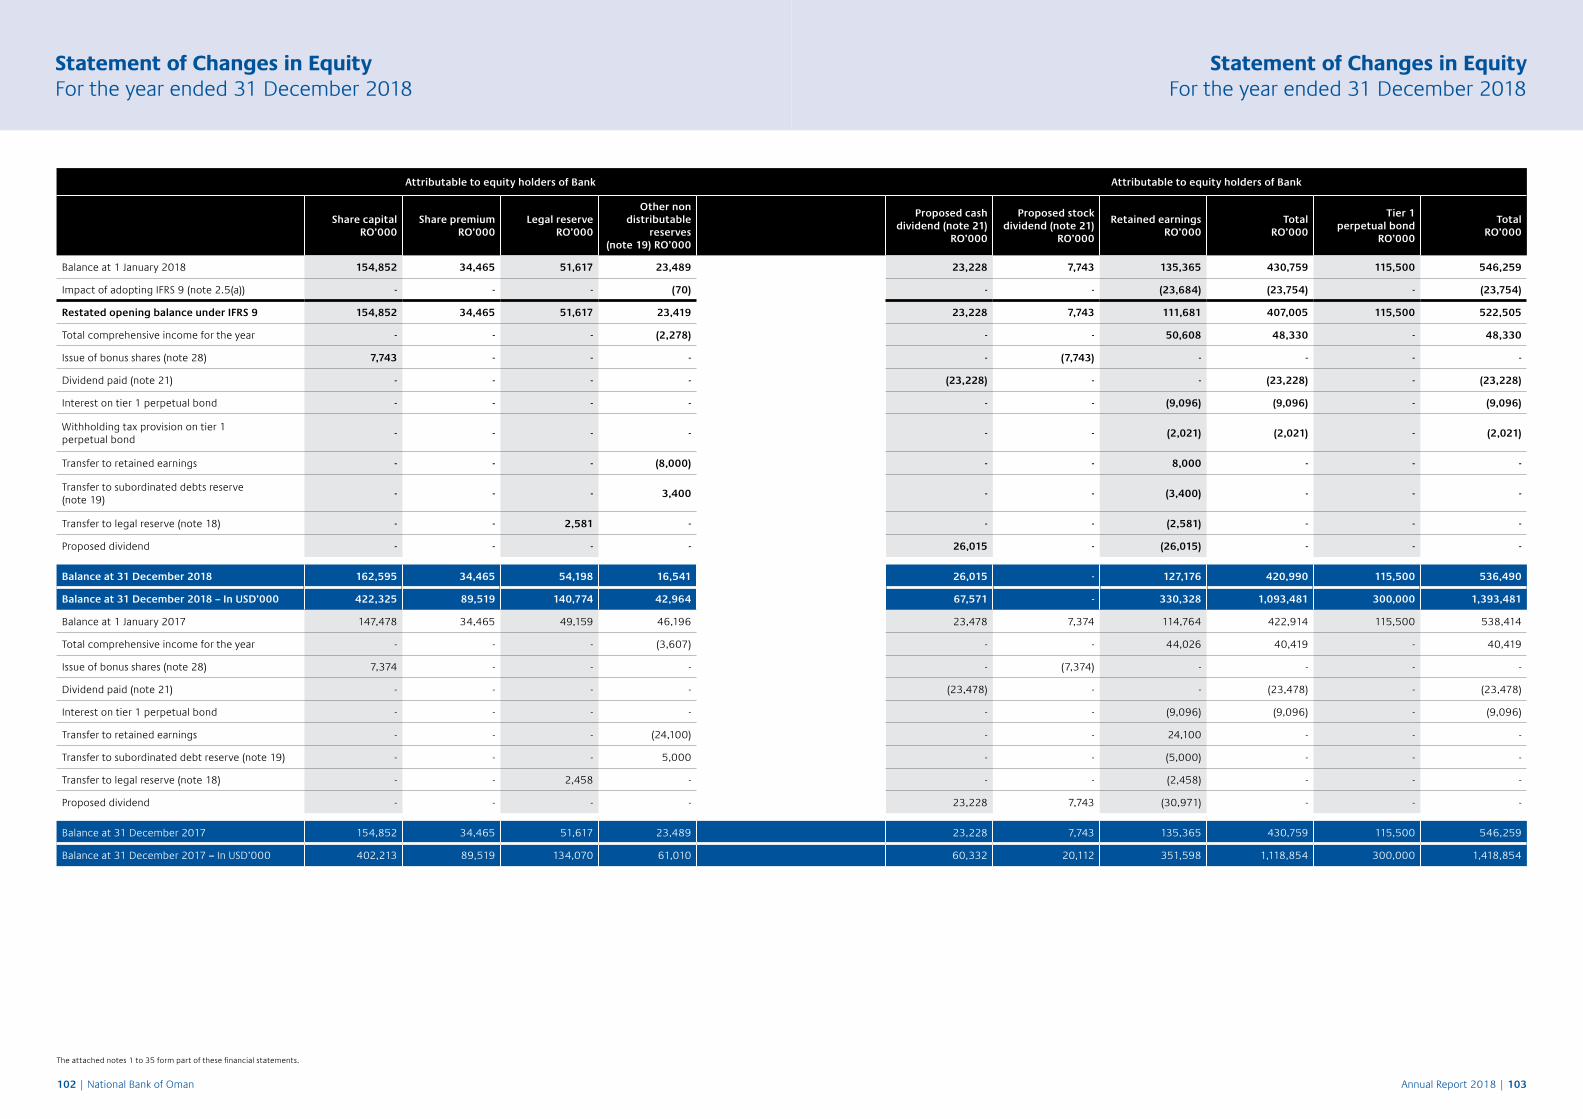
The attached notes 1 to 35 form part of these financial statements.
Attributable to equity holders of Bank Attributable to equity holders of Bank
Share capital RO’000
Share premium RO’000
Legal reserve RO’000
Other non distributable
reserves (note 19) RO’000
Proposed cash dividend (note 21)
RO’000
Proposed stock dividend (note 21)
RO’000
Retained earnings RO’000
Total RO’000
Tier 1 perpetual bond
RO’000
Total RO’000
Balance at 1 January 2018 154,852 34,465 51,617 23,489 23,228 7,743 135,365 430,759 115,500 546,259
Impact of adopting IFRS 9 (note 2.5(a)) - - - (70) - - (23,684) (23,754) - (23,754)
Restated opening balance under IFRS 9 154,852 34,465 51,617 23,419 23,228 7,743 111,681 407,005 115,500 522,505
Total comprehensive income for the year - - - (2,278) - - 50,608 48,330 - 48,330
Issue of bonus shares (note 28) 7,743 - - - - (7,743) - - - -
Dividend paid (note 21) - - - - (23,228) - - (23,228) - (23,228)
Interest on tier 1 perpetual bond - - - - - - (9,096) (9,096) - (9,096)
Withholding tax provision on tier 1 perpetual bond
- - - - - - (2,021) (2,021) - (2,021)
Transfer to retained earnings - - - (8,000) - - 8,000 - - -
Transfer to subordinated debts reserve (note 19)
- - - 3,400 - - (3,400) - - -
Transfer to legal reserve (note 18) - - 2,581 - - - (2,581) - - -
Proposed dividend - - - - 26,015 - (26,015) - - -
Balance at 31 December 2018 162,595 34,465 54,198 16,541 26,015 - 127,176 420,990 115,500 536,490
Balance at 31 December 2018 – In USD’000 422,325 89,519 140,774 42,964 67,571 - 330,328 1,093,481 300,000 1,393,481
Balance at 1 January 2017 147,478 34,465 49,159 46,196 23,478 7,374 114,764 422,914 115,500 538,414
Total comprehensive income for the year - - - (3,607) - - 44,026 40,419 - 40,419
Issue of bonus shares (note 28) 7,374 - - - - (7,374) - - - -
Dividend paid (note 21) - - - - (23,478) - - (23,478) - (23,478)
Interest on tier 1 perpetual bond - - - - - - (9,096) (9,096) - (9,096)
Transfer to retained earnings - - - (24,100) - - 24,100 - - -
Transfer to subordinated debt reserve (note 19) - - - 5,000 - - (5,000) - - -
Transfer to legal reserve (note 18) - - 2,458 - - - (2,458) - - -
Proposed dividend - - - - 23,228 7,743 (30,971) - - -
Balance at 31 December 2017 154,852 34,465 51,617 23,489 23,228 7,743 135,365 430,759 115,500 546,259
Balance at 31 December 2017 – In USD’000 402,213 89,519 134,070 61,010 60,332 20,112 351,598 1,118,854 300,000 1,418,854
102 | National Bank of Oman Annual Report 2018 | 103
Statement of Changes in Equity For the year ended 31 December 2018
Statement of Changes in Equity For the year ended 31 December 2018
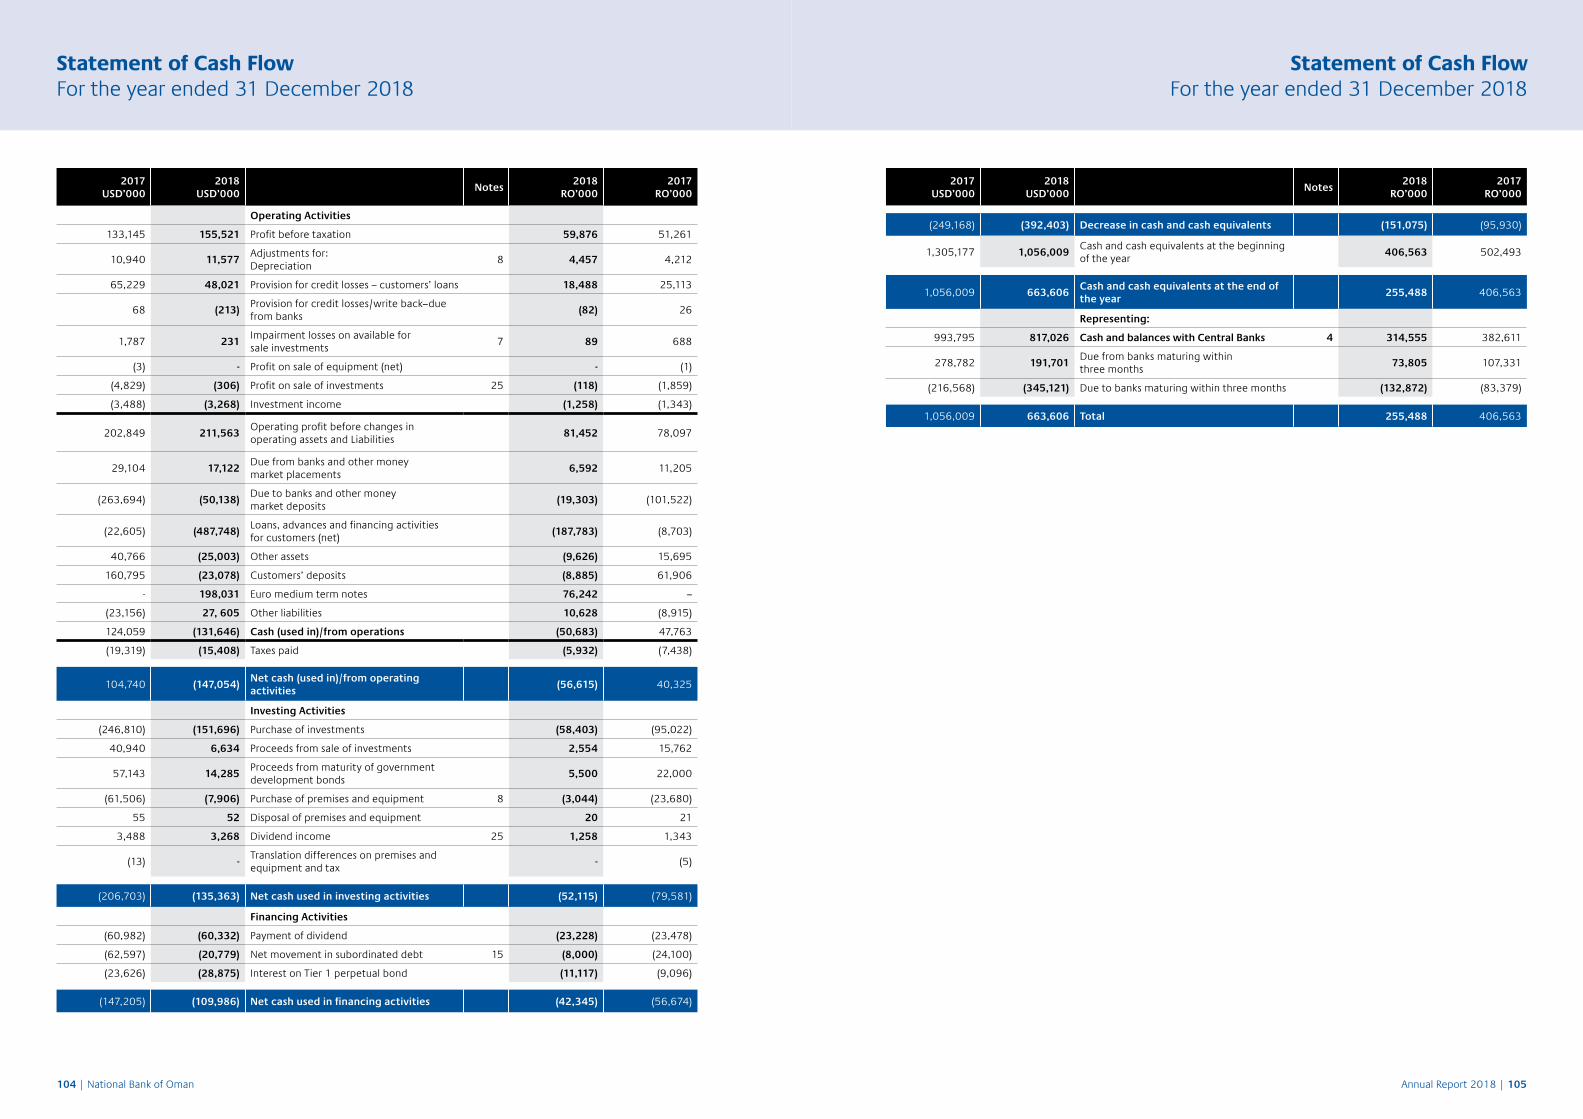
2017 USD’000
2018 USD’000
Notes2018
RO’0002017
RO’000
Operating Activities
133,145 155,521 Profit before taxation 59,876 51,261
10,940 11,577Adjustments for: Depreciation
8 4,457 4,212
65,229 48,021 Provision for credit losses – customers’ loans 18,488 25,113
68 (213)Provision for credit losses/write back–due from banks
(82) 26
1,787 231Impairment losses on available for sale investments
7 89 688
(3) - Profit on sale of equipment (net) - (1)
(4,829) (306) Profit on sale of investments 25 (118) (1,859)
(3,488) (3,268) Investment income (1,258) (1,343)
202,849 211,563Operating profit before changes in operating assets and Liabilities
81,452 78,097
29,104 17,122Due from banks and other money market placements
6,592 11,205
(263,694) (50,138)Due to banks and other money market deposits
(19,303) (101,522)
(22,605) (487,748)Loans, advances and financing activities for customers (net)
(187,783) (8,703)
40,766 (25,003) Other assets (9,626) 15,695
160,795 (23,078) Customers’ deposits (8,885) 61,906
- 198,031 Euro medium term notes 76,242 –
(23,156) 27, 605 Other liabilities 10,628 (8,915)
124,059 (131,646) Cash (used in)/from operations (50,683) 47,763
(19,319) (15,408) Taxes paid (5,932) (7,438)
104,740 (147,054)Net cash (used in)/from operating activities
(56,615) 40,325
Investing Activities
(246,810) (151,696) Purchase of investments (58,403) (95,022)
40,940 6,634 Proceeds from sale of investments 2,554 15,762
57,143 14,285Proceeds from maturity of government development bonds
5,500 22,000
(61,506) (7,906) Purchase of premises and equipment 8 (3,044) (23,680)
55 52 Disposal of premises and equipment 20 21
3,488 3,268 Dividend income 25 1,258 1,343
(13) -Translation differences on premises and equipment and tax
- (5)
(206,703) (135,363) Net cash used in investing activities (52,115) (79,581)
Financing Activities
(60,982) (60,332) Payment of dividend (23,228) (23,478)
(62,597) (20,779) Net movement in subordinated debt 15 (8,000) (24,100)
(23,626) (28,875) Interest on Tier 1 perpetual bond (11,117) (9,096)
(147,205) (109,986) Net cash used in financing activities (42,345) (56,674)
2017 USD’000
2018 USD’000
Notes2018
RO’0002017
RO’000
(249,168) (392,403) Decrease in cash and cash equivalents (151,075) (95,930)
1,305,177 1,056,009Cash and cash equivalents at the beginning of the year
406,563 502,493
1,056,009 663,606Cash and cash equivalents at the end of the year
255,488 406,563
Representing:
993,795 817,026 Cash and balances with Central Banks 4 314,555 382,611
278,782 191,701Due from banks maturing within three months
73,805 107,331
(216,568) (345,121) Due to banks maturing within three months (132,872) (83,379)
1,056,009 663,606 Total 255,488 406,563
104 | National Bank of Oman Annual Report 2018 | 105
Statement of Cash Flow For the year ended 31 December 2018
Statement of Cash Flow For the year ended 31 December 2018
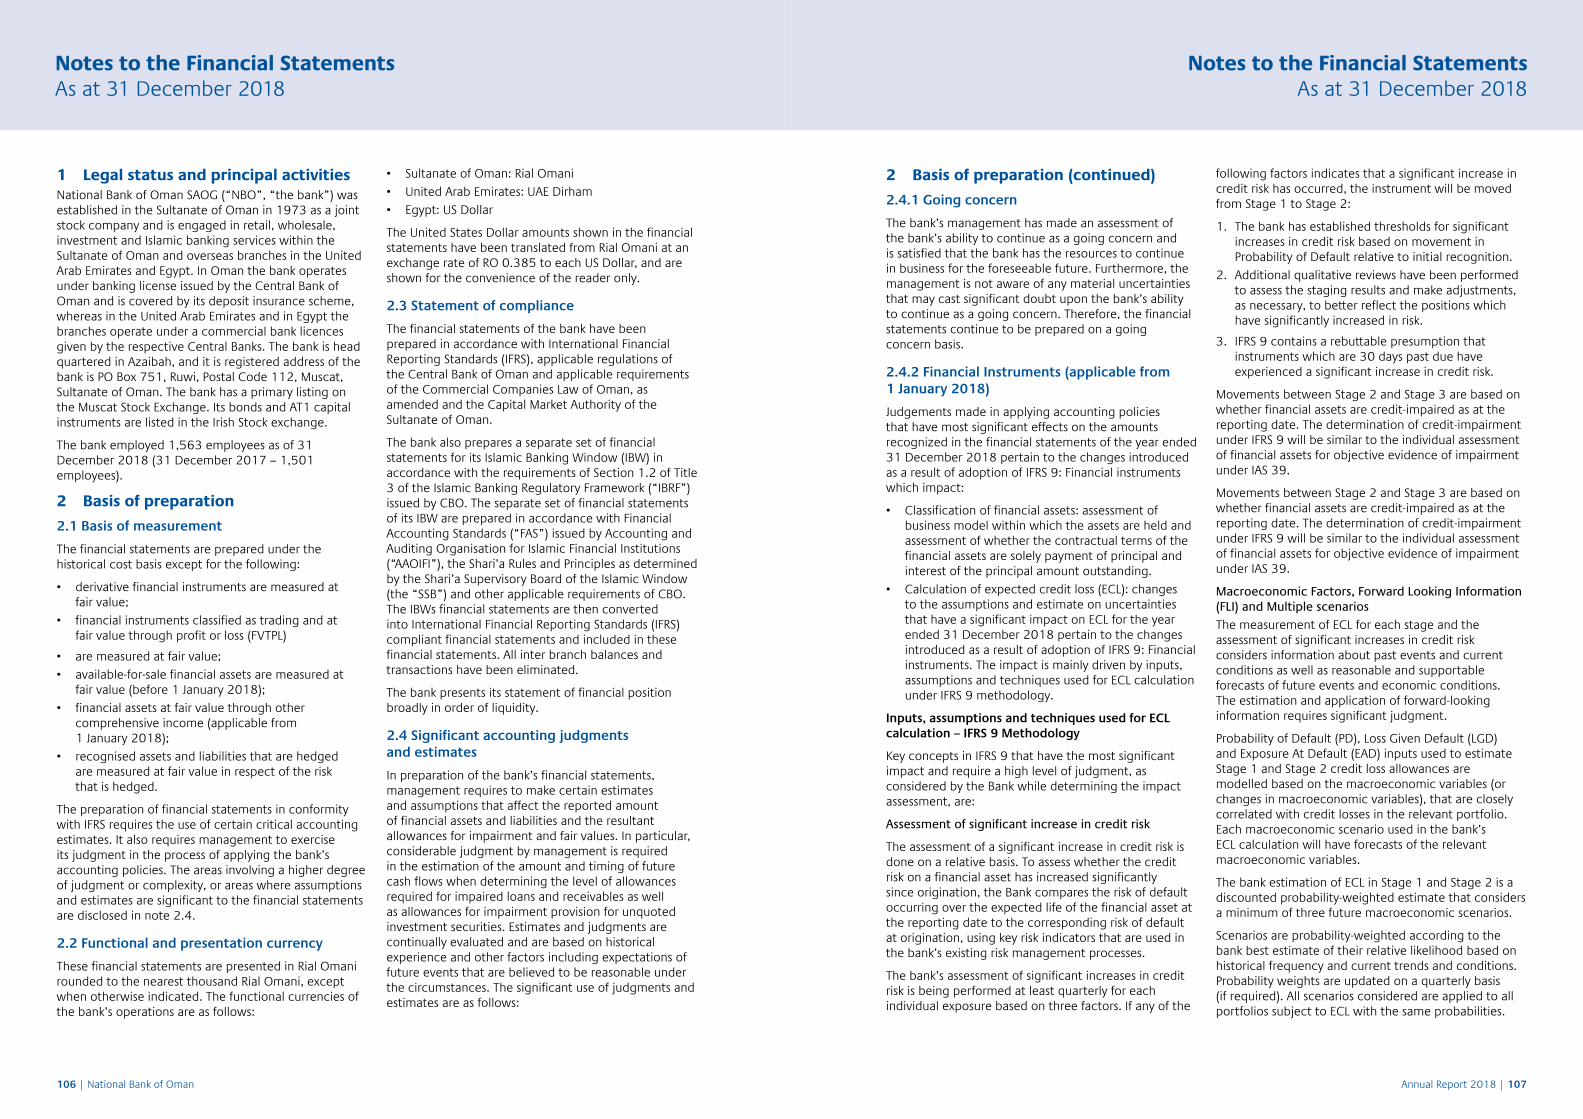
1 Legal status and principal activitiesNational Bank of Oman SAOG (“NBO”, “the bank”) was established in the Sultanate of Oman in 1973 as a joint stock company and is engaged in retail, wholesale, investment and Islamic banking services within the Sultanate of Oman and overseas branches in the United Arab Emirates and Egypt. In Oman the bank operates under banking license issued by the Central Bank of Oman and is covered by its deposit insurance scheme, whereas in the United Arab Emirates and in Egypt the branches operate under a commercial bank licences given by the respective Central Banks. The bank is head quartered in Azaibah, and it is registered address of the bank is PO Box 751, Ruwi, Postal Code 112, Muscat, Sultanate of Oman. The bank has a primary listing on the Muscat Stock Exchange. Its bonds and AT1 capital instruments are listed in the Irish Stock exchange.
The bank employed 1,563 employees as of 31 December 2018 (31 December 2017 – 1,501 employees).
2 Basis of preparation
2.1 Basis of measurement
The financial statements are prepared under the historical cost basis except for the following:
• derivative financial instruments are measured at fair value;
• financial instruments classified as trading and at fair value through profit or loss (FVTPL)
• are measured at fair value;• available-for-sale financial assets are measured at
fair value (before 1 January 2018);• financial assets at fair value through other
comprehensive income (applicable from 1 January 2018);
• recognised assets and liabilities that are hedged are measured at fair value in respect of the risk that is hedged.
The preparation of financial statements in conformity with IFRS requires the use of certain critical accounting estimates. It also requires management to exercise its judgment in the process of applying the bank’s accounting policies. The areas involving a higher degree of judgment or complexity, or areas where assumptions and estimates are significant to the financial statements are disclosed in note 2.4.
2.2 Functional and presentation currency
These financial statements are presented in Rial Omani rounded to the nearest thousand Rial Omani, except when otherwise indicated. The functional currencies of the bank’s operations are as follows:
• Sultanate of Oman: Rial Omani• United Arab Emirates: UAE Dirham• Egypt: US Dollar
The United States Dollar amounts shown in the financial statements have been translated from Rial Omani at an exchange rate of RO 0.385 to each US Dollar, and are shown for the convenience of the reader only.
2.3 Statement of compliance
The financial statements of the bank have been prepared in accordance with International Financial Reporting Standards (IFRS), applicable regulations of the Central Bank of Oman and applicable requirements of the Commercial Companies Law of Oman, as amended and the Capital Market Authority of the Sultanate of Oman.
The bank also prepares a separate set of financial statements for its Islamic Banking Window (IBW) in accordance with the requirements of Section 1.2 of Title 3 of the Islamic Banking Regulatory Framework (“IBRF”) issued by CBO. The separate set of financial statements of its IBW are prepared in accordance with Financial Accounting Standards (“FAS”) issued by Accounting and Auditing Organisation for Islamic Financial Institutions (“AAOIFI”), the Shari’a Rules and Principles as determined by the Shari’a Supervisory Board of the Islamic Window (the “SSB”) and other applicable requirements of CBO. The IBWs financial statements are then converted into International Financial Reporting Standards (IFRS) compliant financial statements and included in these financial statements. All inter branch balances and transactions have been eliminated.
The bank presents its statement of financial position broadly in order of liquidity.
2.4 Significant accounting judgments and estimates
In preparation of the bank’s financial statements, management requires to make certain estimates and assumptions that affect the reported amount of financial assets and liabilities and the resultant allowances for impairment and fair values. In particular, considerable judgment by management is required in the estimation of the amount and timing of future cash flows when determining the level of allowances required for impaired loans and receivables as well as allowances for impairment provision for unquoted investment securities. Estimates and judgments are continually evaluated and are based on historical experience and other factors including expectations of future events that are believed to be reasonable under the circumstances. The significant use of judgments and estimates are as follows:
2 Basis of preparation (continued)
2.4.1 Going concern
The bank’s management has made an assessment of the bank’s ability to continue as a going concern and is satisfied that the bank has the resources to continue in business for the foreseeable future. Furthermore, the management is not aware of any material uncertainties that may cast significant doubt upon the bank’s ability to continue as a going concern. Therefore, the financial statements continue to be prepared on a going concern basis.
2.4.2 Financial Instruments (applicable from 1 January 2018)
Judgements made in applying accounting policies that have most significant effects on the amounts recognized in the financial statements of the year ended 31 December 2018 pertain to the changes introduced as a result of adoption of IFRS 9: Financial instruments which impact:
• Classification of financial assets: assessment of business model within which the assets are held and assessment of whether the contractual terms of the financial assets are solely payment of principal and interest of the principal amount outstanding.
• Calculation of expected credit loss (ECL): changes to the assumptions and estimate on uncertainties that have a significant impact on ECL for the year ended 31 December 2018 pertain to the changes introduced as a result of adoption of IFRS 9: Financial instruments. The impact is mainly driven by inputs, assumptions and techniques used for ECL calculation under IFRS 9 methodology.
Inputs, assumptions and techniques used for ECL calculation – IFRS 9 Methodology
Key concepts in IFRS 9 that have the most significant impact and require a high level of judgment, as considered by the Bank while determining the impact assessment, are:
Assessment of significant increase in credit risk
The assessment of a significant increase in credit risk is done on a relative basis. To assess whether the credit risk on a financial asset has increased significantly since origination, the Bank compares the risk of default occurring over the expected life of the financial asset at the reporting date to the corresponding risk of default at origination, using key risk indicators that are used in the bank’s existing risk management processes.
The bank’s assessment of significant increases in credit risk is being performed at least quarterly for each individual exposure based on three factors. If any of the
following factors indicates that a significant increase in credit risk has occurred, the instrument will be moved from Stage 1 to Stage 2:
1. The bank has established thresholds for significant increases in credit risk based on movement in Probability of Default relative to initial recognition.
2. Additional qualitative reviews have been performed to assess the staging results and make adjustments, as necessary, to better reflect the positions which have significantly increased in risk.
3. IFRS 9 contains a rebuttable presumption that instruments which are 30 days past due have experienced a significant increase in credit risk.
Movements between Stage 2 and Stage 3 are based on whether financial assets are credit-impaired as at the reporting date. The determination of credit-impairment under IFRS 9 will be similar to the individual assessment of financial assets for objective evidence of impairment under IAS 39.
Movements between Stage 2 and Stage 3 are based on whether financial assets are credit-impaired as at the reporting date. The determination of credit-impairment under IFRS 9 will be similar to the individual assessment of financial assets for objective evidence of impairment under IAS 39.
Macroeconomic Factors, Forward Looking Information (FLI) and Multiple scenariosThe measurement of ECL for each stage and the assessment of significant increases in credit risk considers information about past events and current conditions as well as reasonable and supportable forecasts of future events and economic conditions. The estimation and application of forward-looking information requires significant judgment.
Probability of Default (PD), Loss Given Default (LGD) and Exposure At Default (EAD) inputs used to estimate Stage 1 and Stage 2 credit loss allowances are modelled based on the macroeconomic variables (or changes in macroeconomic variables), that are closely correlated with credit losses in the relevant portfolio. Each macroeconomic scenario used in the bank’s ECL calculation will have forecasts of the relevant macroeconomic variables.
The bank estimation of ECL in Stage 1 and Stage 2 is a discounted probability-weighted estimate that considers a minimum of three future macroeconomic scenarios.
Scenarios are probability-weighted according to the bank best estimate of their relative likelihood based on historical frequency and current trends and conditions. Probability weights are updated on a quarterly basis (if required). All scenarios considered are applied to all portfolios subject to ECL with the same probabilities.
106 | National Bank of Oman Annual Report 2018 | 107
Notes to the Financial StatementsAs at 31 December 2018
Notes to the Financial StatementsAs at 31 December 2018
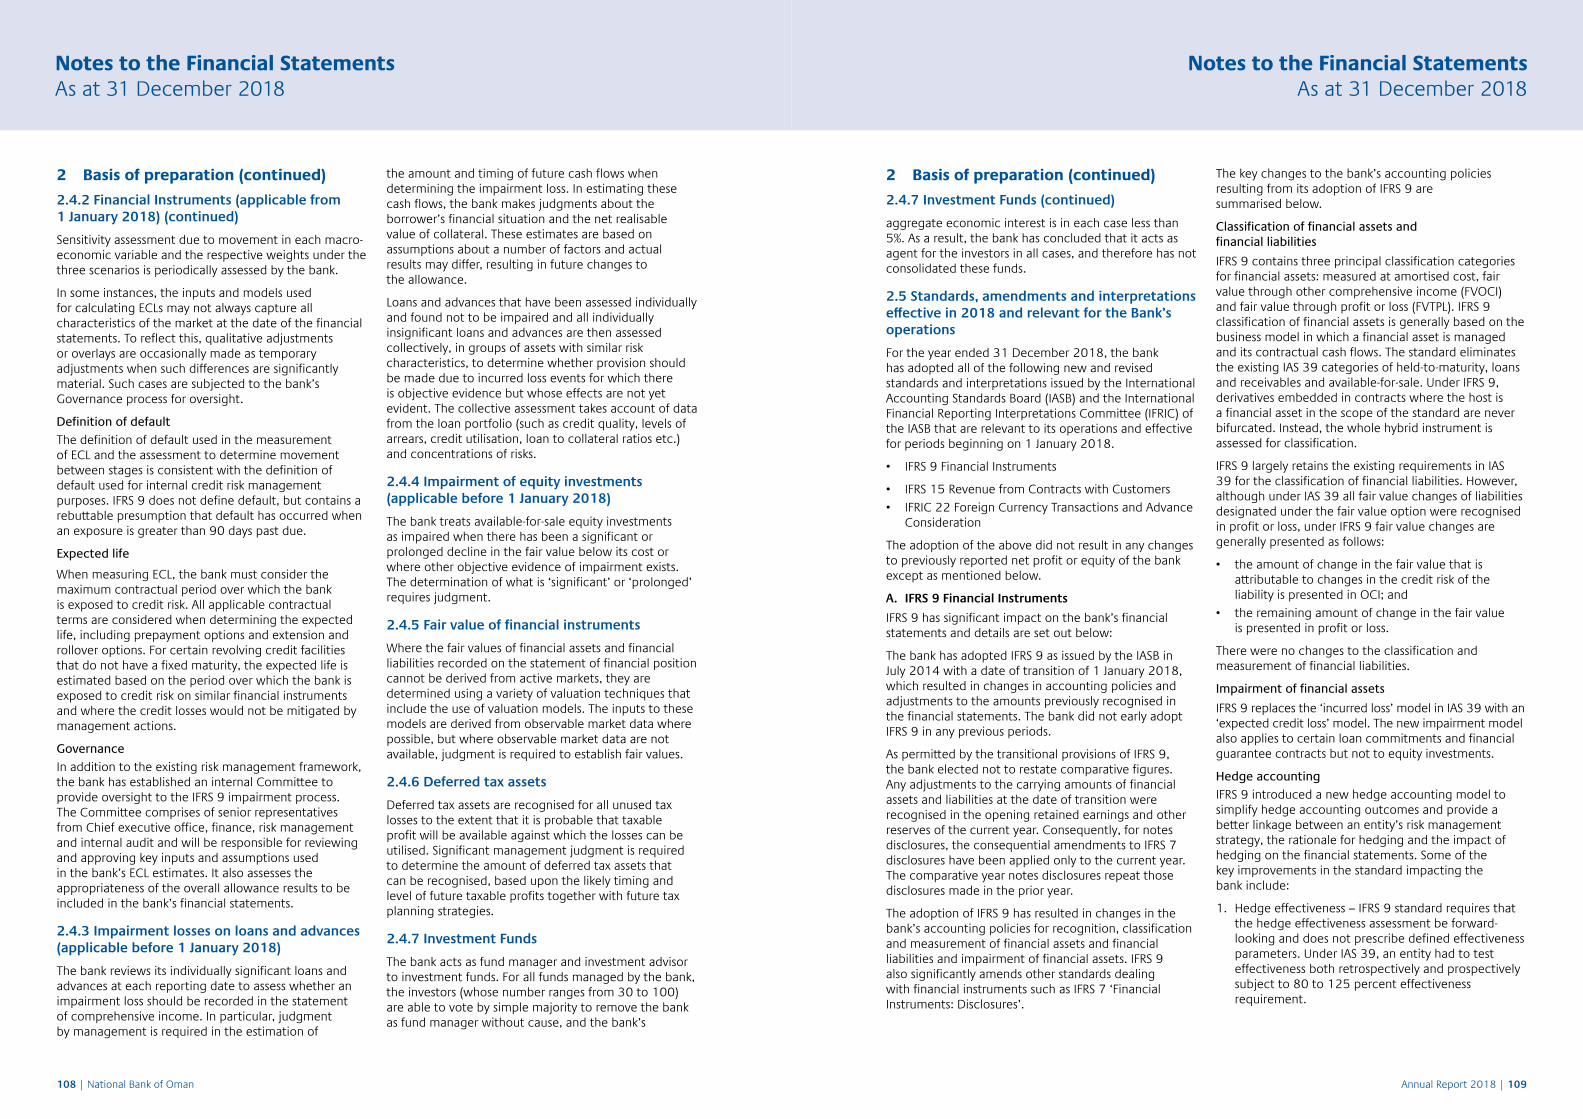
2 Basis of preparation (continued)
2.4.2 Financial Instruments (applicable from 1 January 2018) (continued)
Sensitivity assessment due to movement in each macro-economic variable and the respective weights under the three scenarios is periodically assessed by the bank.
In some instances, the inputs and models used for calculating ECLs may not always capture all characteristics of the market at the date of the financial statements. To reflect this, qualitative adjustments or overlays are occasionally made as temporary adjustments when such differences are significantly material. Such cases are subjected to the bank’s Governance process for oversight.
Definition of defaultThe definition of default used in the measurement of ECL and the assessment to determine movement between stages is consistent with the definition of default used for internal credit risk management purposes. IFRS 9 does not define default, but contains a rebuttable presumption that default has occurred when an exposure is greater than 90 days past due.
Expected life
When measuring ECL, the bank must consider the maximum contractual period over which the bank is exposed to credit risk. All applicable contractual terms are considered when determining the expected life, including prepayment options and extension and rollover options. For certain revolving credit facilities that do not have a fixed maturity, the expected life is estimated based on the period over which the bank is exposed to credit risk on similar financial instruments and where the credit losses would not be mitigated by management actions.
GovernanceIn addition to the existing risk management framework, the bank has established an internal Committee to provide oversight to the IFRS 9 impairment process. The Committee comprises of senior representatives from Chief executive office, finance, risk management and internal audit and will be responsible for reviewing and approving key inputs and assumptions used in the bank’s ECL estimates. It also assesses the appropriateness of the overall allowance results to be included in the bank’s financial statements.
2.4.3 Impairment losses on loans and advances (applicable before 1 January 2018)
The bank reviews its individually significant loans and advances at each reporting date to assess whether an impairment loss should be recorded in the statement of comprehensive income. In particular, judgment by management is required in the estimation of
the amount and timing of future cash flows when determining the impairment loss. In estimating these cash flows, the bank makes judgments about the borrower’s financial situation and the net realisable value of collateral. These estimates are based on assumptions about a number of factors and actual results may differ, resulting in future changes to the allowance.
Loans and advances that have been assessed individually and found not to be impaired and all individually insignificant loans and advances are then assessed collectively, in groups of assets with similar risk characteristics, to determine whether provision should be made due to incurred loss events for which there is objective evidence but whose effects are not yet evident. The collective assessment takes account of data from the loan portfolio (such as credit quality, levels of arrears, credit utilisation, loan to collateral ratios etc.) and concentrations of risks.
2.4.4 Impairment of equity investments (applicable before 1 January 2018)
The bank treats available-for-sale equity investments as impaired when there has been a significant or prolonged decline in the fair value below its cost or where other objective evidence of impairment exists. The determination of what is ‘significant’ or ‘prolonged’ requires judgment.
2.4.5 Fair value of financial instruments
Where the fair values of financial assets and financial liabilities recorded on the statement of financial position cannot be derived from active markets, they are determined using a variety of valuation techniques that include the use of valuation models. The inputs to these models are derived from observable market data where possible, but where observable market data are not available, judgment is required to establish fair values.
2.4.6 Deferred tax assets
Deferred tax assets are recognised for all unused tax losses to the extent that it is probable that taxable profit will be available against which the losses can be utilised. Significant management judgment is required to determine the amount of deferred tax assets that can be recognised, based upon the likely timing and level of future taxable profits together with future tax planning strategies.
2.4.7 Investment Funds
The bank acts as fund manager and investment advisor to investment funds. For all funds managed by the bank, the investors (whose number ranges from 30 to 100) are able to vote by simple majority to remove the bank as fund manager without cause, and the bank’s
2 Basis of preparation (continued)
2.4.7 Investment Funds (continued)
aggregate economic interest is in each case less than 5%. As a result, the bank has concluded that it acts as agent for the investors in all cases, and therefore has not consolidated these funds.
2.5 Standards, amendments and interpretations effective in 2018 and relevant for the Bank’s operations
For the year ended 31 December 2018, the bank has adopted all of the following new and revised standards and interpretations issued by the International Accounting Standards Board (IASB) and the International Financial Reporting Interpretations Committee (IFRIC) of the IASB that are relevant to its operations and effective for periods beginning on 1 January 2018.
• IFRS 9 Financial Instruments
• IFRS 15 Revenue from Contracts with Customers• IFRIC 22 Foreign Currency Transactions and Advance
Consideration
The adoption of the above did not result in any changes to previously reported net profit or equity of the bank except as mentioned below.
A. IFRS 9 Financial Instruments
IFRS 9 has significant impact on the bank’s financial statements and details are set out below:
The bank has adopted IFRS 9 as issued by the IASB in July 2014 with a date of transition of 1 January 2018, which resulted in changes in accounting policies and adjustments to the amounts previously recognised in the financial statements. The bank did not early adopt IFRS 9 in any previous periods.
As permitted by the transitional provisions of IFRS 9, the bank elected not to restate comparative figures. Any adjustments to the carrying amounts of financial assets and liabilities at the date of transition were recognised in the opening retained earnings and other reserves of the current year. Consequently, for notes disclosures, the consequential amendments to IFRS 7 disclosures have been applied only to the current year. The comparative year notes disclosures repeat those disclosures made in the prior year.
The adoption of IFRS 9 has resulted in changes in the bank’s accounting policies for recognition, classification and measurement of financial assets and financial liabilities and impairment of financial assets. IFRS 9 also significantly amends other standards dealing with financial instruments such as IFRS 7 ‘Financial Instruments: Disclosures’.
The key changes to the bank’s accounting policies resulting from its adoption of IFRS 9 are summarised below.
Classification of financial assets and financial liabilities
IFRS 9 contains three principal classification categories for financial assets: measured at amortised cost, fair value through other comprehensive income (FVOCI) and fair value through profit or loss (FVTPL). IFRS 9 classification of financial assets is generally based on the business model in which a financial asset is managed and its contractual cash flows. The standard eliminates the existing IAS 39 categories of held-to-maturity, loans and receivables and available-for-sale. Under IFRS 9, derivatives embedded in contracts where the host is a financial asset in the scope of the standard are never bifurcated. Instead, the whole hybrid instrument is assessed for classification.
IFRS 9 largely retains the existing requirements in IAS 39 for the classification of financial liabilities. However, although under IAS 39 all fair value changes of liabilities designated under the fair value option were recognised in profit or loss, under IFRS 9 fair value changes are generally presented as follows:
• the amount of change in the fair value that is attributable to changes in the credit risk of the liability is presented in OCI; and
• the remaining amount of change in the fair value is presented in profit or loss.
There were no changes to the classification and measurement of financial liabilities.
Impairment of financial assets
IFRS 9 replaces the ‘incurred loss’ model in IAS 39 with an ‘expected credit loss’ model. The new impairment model also applies to certain loan commitments and financial guarantee contracts but not to equity investments.
Hedge accountingIFRS 9 introduced a new hedge accounting model to simplify hedge accounting outcomes and provide a better linkage between an entity’s risk management strategy, the rationale for hedging and the impact of hedging on the financial statements. Some of the key improvements in the standard impacting the bank include:
1. Hedge effectiveness – IFRS 9 standard requires that the hedge effectiveness assessment be forward-looking and does not prescribe defined effectiveness parameters. Under IAS 39, an entity had to test effectiveness both retrospectively and prospectively subject to 80 to 125 percent effectiveness requirement.
108 | National Bank of Oman Annual Report 2018 | 109
Notes to the Financial StatementsAs at 31 December 2018
Notes to the Financial StatementsAs at 31 December 2018
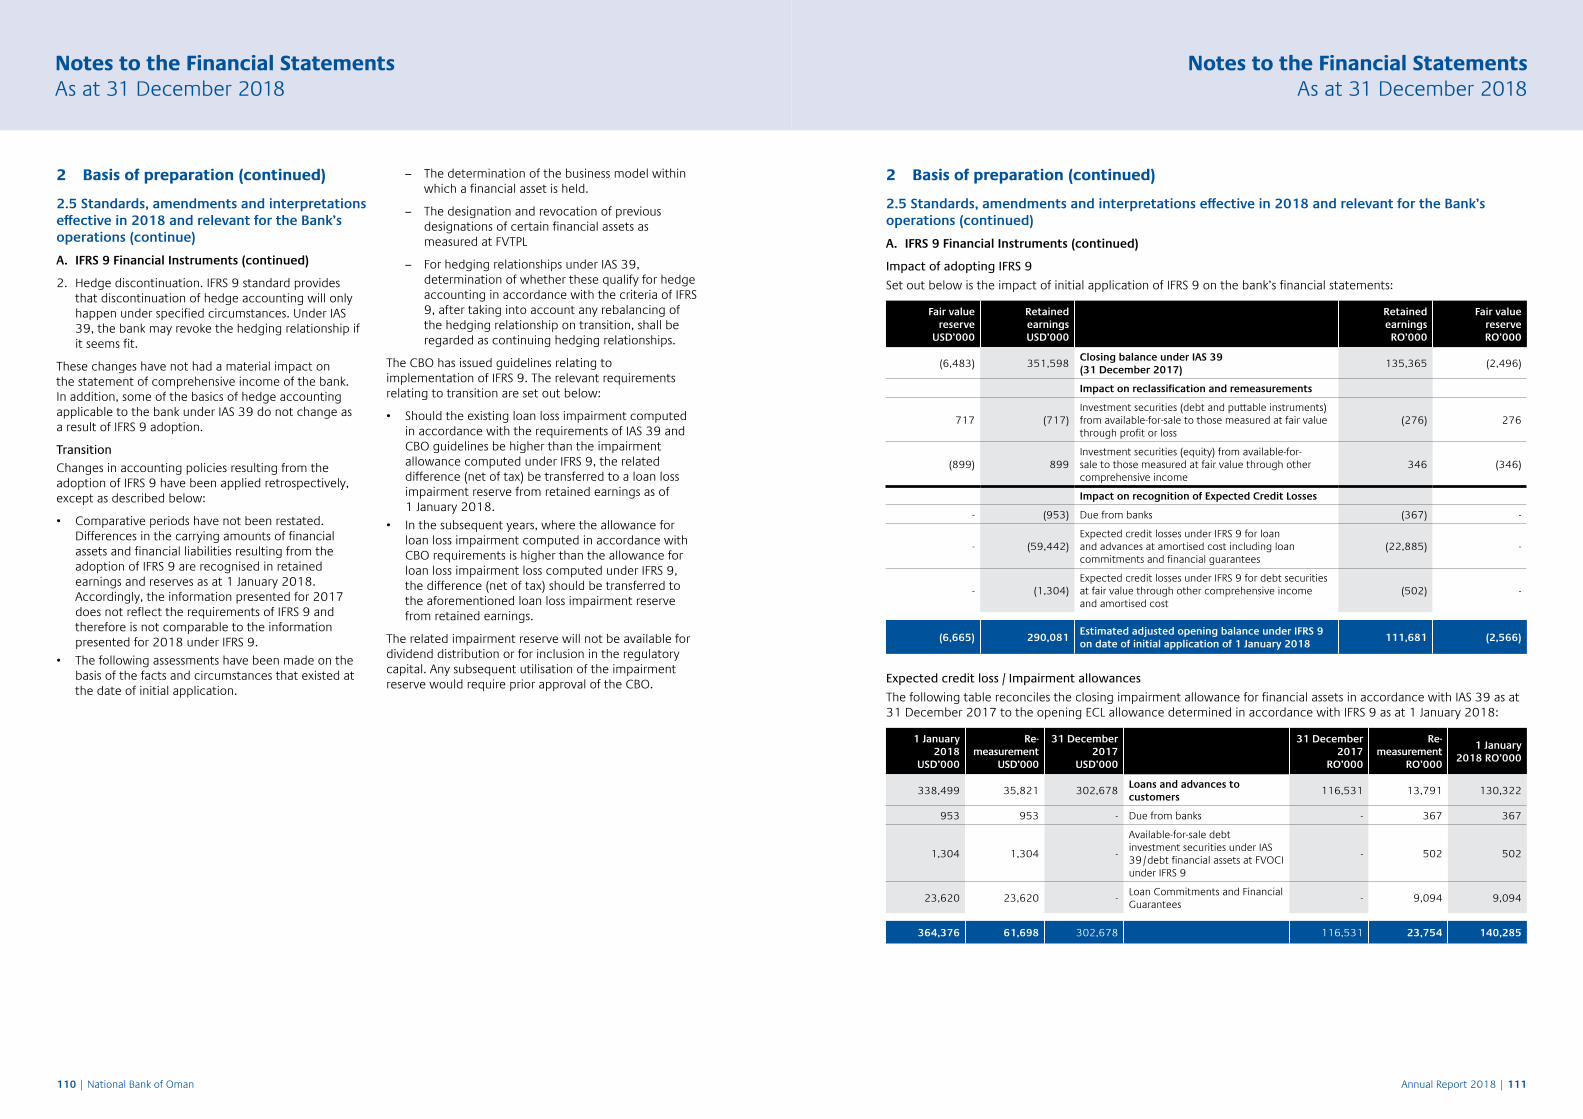
2 Basis of preparation (continued)
2.5 Standards, amendments and interpretations effective in 2018 and relevant for the Bank’s operations (continue)
A. IFRS 9 Financial Instruments (continued)
2. Hedge discontinuation. IFRS 9 standard provides that discontinuation of hedge accounting will only happen under specified circumstances. Under IAS 39, the bank may revoke the hedging relationship if it seems fit.
These changes have not had a material impact on the statement of comprehensive income of the bank. In addition, some of the basics of hedge accounting applicable to the bank under IAS 39 do not change as a result of IFRS 9 adoption.
TransitionChanges in accounting policies resulting from the adoption of IFRS 9 have been applied retrospectively, except as described below:
• Comparative periods have not been restated. Differences in the carrying amounts of financial assets and financial liabilities resulting from the adoption of IFRS 9 are recognised in retained earnings and reserves as at 1 January 2018. Accordingly, the information presented for 2017 does not reflect the requirements of IFRS 9 and therefore is not comparable to the information presented for 2018 under IFRS 9.
• The following assessments have been made on the basis of the facts and circumstances that existed at the date of initial application.
– The determination of the business model within which a financial asset is held.
– The designation and revocation of previous designations of certain financial assets as measured at FVTPL
– For hedging relationships under IAS 39, determination of whether these qualify for hedge accounting in accordance with the criteria of IFRS 9, after taking into account any rebalancing of the hedging relationship on transition, shall be regarded as continuing hedging relationships.
The CBO has issued guidelines relating to implementation of IFRS 9. The relevant requirements relating to transition are set out below:
• Should the existing loan loss impairment computed in accordance with the requirements of IAS 39 and CBO guidelines be higher than the impairment allowance computed under IFRS 9, the related difference (net of tax) be transferred to a loan loss impairment reserve from retained earnings as of 1 January 2018.
• In the subsequent years, where the allowance for loan loss impairment computed in accordance with CBO requirements is higher than the allowance for loan loss impairment loss computed under IFRS 9, the difference (net of tax) should be transferred to the aforementioned loan loss impairment reserve from retained earnings.
The related impairment reserve will not be available for dividend distribution or for inclusion in the regulatory capital. Any subsequent utilisation of the impairment reserve would require prior approval of the CBO.
Fair value reserve
USD’000
Retained earningsUSD’000
Retained earningsRO’000
Fair value reserveRO’000
(6,483) 351,598 Closing balance under IAS 39 (31 December 2017)
135,365 (2,496)
Impact on reclassification and remeasurements
717 (717)Investment securities (debt and puttable instruments) from available-for-sale to those measured at fair value through profit or loss
(276) 276
(899) 899 Investment securities (equity) from available-for-sale to those measured at fair value through other comprehensive income
346 (346)
Impact on recognition of Expected Credit Losses
- (953) Due from banks (367) -
- (59,442)Expected credit losses under IFRS 9 for loan and advances at amortised cost including loan commitments and financial guarantees
(22,885) -
- (1,304)Expected credit losses under IFRS 9 for debt securities at fair value through other comprehensive income and amortised cost
(502) -
(6,665) 290,081 Estimated adjusted opening balance under IFRS 9 on date of initial application of 1 January 2018
111,681 (2,566)
2 Basis of preparation (continued)
2.5 Standards, amendments and interpretations effective in 2018 and relevant for the Bank’s operations (continued)
A. IFRS 9 Financial Instruments (continued)
Impact of adopting IFRS 9
Set out below is the impact of initial application of IFRS 9 on the bank’s financial statements:
1 January 2018
USD’000
Re-measurement
USD’000
31 December2017
USD’000
31 December2017
RO’000
Re-measurement
RO’000
1 January 2018 RO’000
338,499 35,821 302,678 Loans and advances to customers
116,531 13,791 130,322
953 953 - Due from banks - 367 367
1,304 1,304 -
Available-for-sale debt investment securities under IAS 39/debt financial assets at FVOCI under IFRS 9
- 502 502
23,620 23,620 -Loan Commitments and Financial Guarantees
- 9,094 9,094
364,376 61,698 302,678 116,531 23,754 140,285
Expected credit loss / Impairment allowances
The following table reconciles the closing impairment allowance for financial assets in accordance with IAS 39 as at 31 December 2017 to the opening ECL allowance determined in accordance with IFRS 9 as at 1 January 2018:
110 | National Bank of Oman Annual Report 2018 | 111
Notes to the Financial StatementsAs at 31 December 2018
Notes to the Financial StatementsAs at 31 December 2018
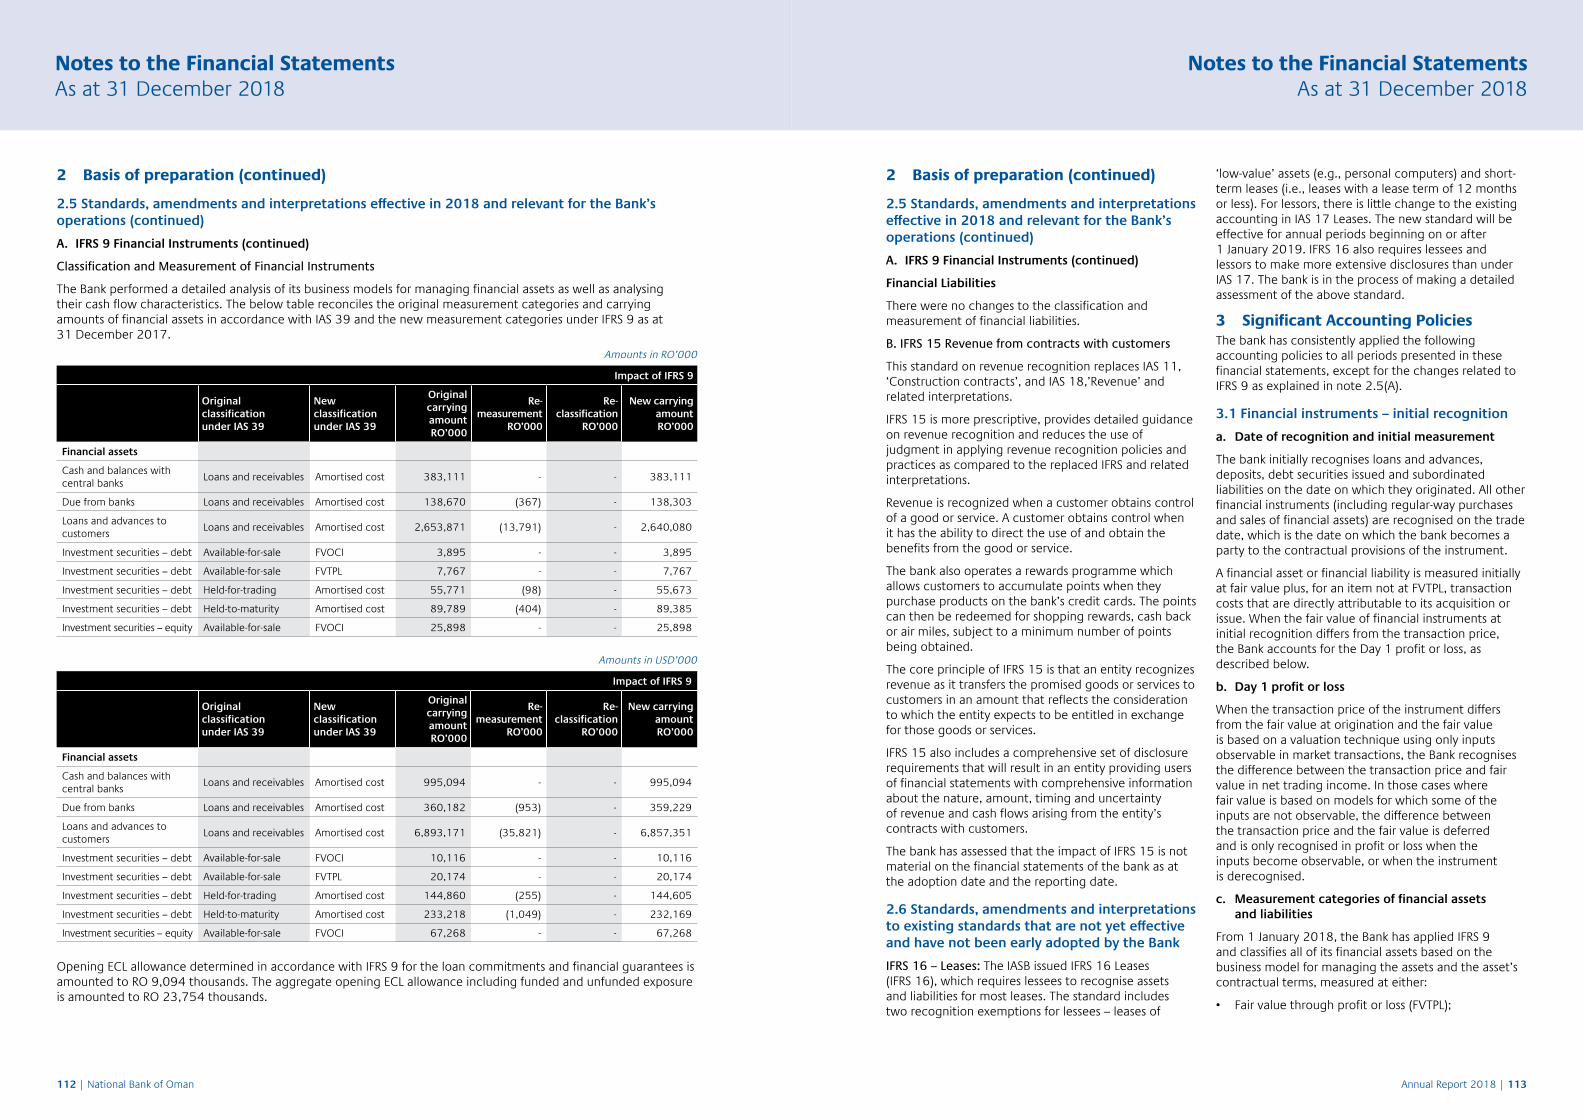
Opening ECL allowance determined in accordance with IFRS 9 for the loan commitments and financial guarantees is amounted to RO 9,094 thousands. The aggregate opening ECL allowance including funded and unfunded exposure is amounted to RO 23,754 thousands.
Impact of IFRS 9
Original classification under IAS 39
New classification under IAS 39
Original carrying amount RO’000
Re-measurement
RO’000
Re-classification
RO’000
New carrying amount RO’000
Financial assets
Cash and balances with central banks
Loans and receivables Amortised cost 383,111 - - 383,111
Due from banks Loans and receivables Amortised cost 138,670 (367) - 138,303
Loans and advances to customers
Loans and receivables Amortised cost 2,653,871 (13,791) - 2,640,080
Investment securities – debt Available-for-sale FVOCI 3,895 - - 3,895
Investment securities – debt Available-for-sale FVTPL 7,767 - - 7,767
Investment securities – debt Held-for-trading Amortised cost 55,771 (98) - 55,673
Investment securities – debt Held-to-maturity Amortised cost 89,789 (404) - 89,385
Investment securities – equity Available-for-sale FVOCI 25,898 - - 25,898
Impact of IFRS 9
Original classification under IAS 39
New classification under IAS 39
Original carrying amount RO’000
Re-measurement
RO’000
Re-classification
RO’000
New carrying amount RO’000
Financial assets
Cash and balances with central banks
Loans and receivables Amortised cost 995,094 - - 995,094
Due from banks Loans and receivables Amortised cost 360,182 (953) - 359,229
Loans and advances to customers
Loans and receivables Amortised cost 6,893,171 (35,821) - 6,857,351
Investment securities – debt Available-for-sale FVOCI 10,116 - - 10,116
Investment securities – debt Available-for-sale FVTPL 20,174 - - 20,174
Investment securities – debt Held-for-trading Amortised cost 144,860 (255) - 144,605
Investment securities – debt Held-to-maturity Amortised cost 233,218 (1,049) - 232,169
Investment securities – equity Available-for-sale FVOCI 67,268 - - 67,268
Amounts in RO’000
Amounts in USD’000
2 Basis of preparation (continued)
2.5 Standards, amendments and interpretations effective in 2018 and relevant for the Bank’s operations (continued)
A. IFRS 9 Financial Instruments (continued)
Classification and Measurement of Financial Instruments
The Bank performed a detailed analysis of its business models for managing financial assets as well as analysing their cash flow characteristics. The below table reconciles the original measurement categories and carrying amounts of financial assets in accordance with IAS 39 and the new measurement categories under IFRS 9 as at 31 December 2017.
2 Basis of preparation (continued)
2.5 Standards, amendments and interpretations effective in 2018 and relevant for the Bank’s operations (continued)
A. IFRS 9 Financial Instruments (continued)
Financial Liabilities
There were no changes to the classification and measurement of financial liabilities.
B. IFRS 15 Revenue from contracts with customers
This standard on revenue recognition replaces IAS 11, ‘Construction contracts’, and IAS 18,’Revenue’ and related interpretations.
IFRS 15 is more prescriptive, provides detailed guidance on revenue recognition and reduces the use of judgment in applying revenue recognition policies and practices as compared to the replaced IFRS and related interpretations.
Revenue is recognized when a customer obtains control of a good or service. A customer obtains control when it has the ability to direct the use of and obtain the benefits from the good or service.
The bank also operates a rewards programme which allows customers to accumulate points when they purchase products on the bank’s credit cards. The points can then be redeemed for shopping rewards, cash back or air miles, subject to a minimum number of points being obtained.
The core principle of IFRS 15 is that an entity recognizes revenue as it transfers the promised goods or services to customers in an amount that reflects the consideration to which the entity expects to be entitled in exchange for those goods or services.
IFRS 15 also includes a comprehensive set of disclosure requirements that will result in an entity providing users of financial statements with comprehensive information about the nature, amount, timing and uncertainty of revenue and cash flows arising from the entity’s contracts with customers.
The bank has assessed that the impact of IFRS 15 is not material on the financial statements of the bank as at the adoption date and the reporting date.
2.6 Standards, amendments and interpretations to existing standards that are not yet effective and have not been early adopted by the Bank
IFRS 16 – Leases: The IASB issued IFRS 16 Leases (IFRS 16), which requires lessees to recognise assets and liabilities for most leases. The standard includes two recognition exemptions for lessees – leases of
‘low-value’ assets (e.g., personal computers) and short-term leases (i.e., leases with a lease term of 12 months or less). For lessors, there is little change to the existing accounting in IAS 17 Leases. The new standard will be effective for annual periods beginning on or after 1 January 2019. IFRS 16 also requires lessees and lessors to make more extensive disclosures than under IAS 17. The bank is in the process of making a detailed assessment of the above standard.
3 Significant Accounting PoliciesThe bank has consistently applied the following accounting policies to all periods presented in these financial statements, except for the changes related to IFRS 9 as explained in note 2.5(A).
3.1 Financial instruments – initial recognition
a. Date of recognition and initial measurement
The bank initially recognises loans and advances, deposits, debt securities issued and subordinated liabilities on the date on which they originated. All other financial instruments (including regular-way purchases and sales of financial assets) are recognised on the trade date, which is the date on which the bank becomes a party to the contractual provisions of the instrument.
A financial asset or financial liability is measured initially at fair value plus, for an item not at FVTPL, transaction costs that are directly attributable to its acquisition or issue. When the fair value of financial instruments at initial recognition differs from the transaction price, the Bank accounts for the Day 1 profit or loss, as described below.
b. Day 1 profit or loss
When the transaction price of the instrument differs from the fair value at origination and the fair value is based on a valuation technique using only inputs observable in market transactions, the Bank recognises the difference between the transaction price and fair value in net trading income. In those cases where fair value is based on models for which some of the inputs are not observable, the difference between the transaction price and the fair value is deferred and is only recognised in profit or loss when the inputs become observable, or when the instrument is derecognised.
c. Measurement categories of financial assets and liabilities
From 1 January 2018, the Bank has applied IFRS 9 and classifies all of its financial assets based on the business model for managing the assets and the asset’s contractual terms, measured at either:
• Fair value through profit or loss (FVTPL);
112 | National Bank of Oman Annual Report 2018 | 113
Notes to the Financial StatementsAs at 31 December 2018
Notes to the Financial StatementsAs at 31 December 2018
3 Significant Accounting Policies (continued)
3.1 Financial instruments – initial recognition (continued)
• Fair value through other comprehensive income (FVOCI); or
• Amortised cost.
Before 1 January 2018, the Bank classified its financial assets as loans and receivables (amortised cost), FVPL, available-for-sale or held-to-maturity (amortised cost).
Financial liabilities, other than loan commitments and financial guarantees, are measured at amortised cost or at FVPL when they are held for trading and derivative instruments at the fair value designation
3.2 Financial assets and liabilities
3.2.1 Due from banks, Loans and advances to customers, Financial investments at amortised cost
Before 1 January 2018, Due from bank and Loans and advances to customers, included non–derivative financial assets with fixed or determinable payments that were not quoted in an active market, other than those:
• That the Bank intended to sell immediately or in the near term
• That the Bank, upon initial recognition, designated as at FVPL or as available-for-sale
• For which the Bank may not recover substantially all of its initial investment, other than because of credit deterioration, which were designated as available-for-sale.
From 1 January 2018, the Bank only measures due from banks, loans and advances to customers and other financial investments at amortised cost if both of the following conditions are met:
• The financial asset is held within a business model with the objective to hold financial assets in order to collect contractual cash flows
• The contractual terms of the financial asset give rise on specified dates to cash flows that are solely payments of principal and interest (SPPI) on the principal amount outstanding.
The details of these conditions are outlined below.
On initial recognition of an equity investment that is not held for trading, the bank may irrevocably elect to present subsequent changes in fair value in OCI. This election is made on an investment-by-investment basis. All other financial assets are classified as measured at FVTPL.
In addition, on initial recognition, the Bank may irrevocably designate a financial asset that otherwise meets the requirements to be measured at amortised cost or at FVOCI as at FVTPL if doing so eliminates or significantly reduces an accounting mismatch that would otherwise arise.
Business model assessment
The bank makes an assessment of the objective of a business model in which an asset is held at a portfolio level because this best reflects the way the business is managed and information is provided to management. The information considered includes:
• the stated policies and objectives for the portfolio and the operation of those policies in practice. In particular, whether management’s strategy focuses on earning contractual interest revenue, maintaining a particular interest rate profile, matching the duration of the financial assets to the duration of the liabilities that are funding those assets or realising cash flows through the sale of the assets;
• how the performance of the portfolio is evaluated and reported to the Bank’s management;
• the risks that affect the performance of the business model (and the financial assets held within that business model) and how those risks are managed;
• how managers of the business are compensated – e.g. whether compensation is based on the fair value of the assets managed or the contractual cash flows collected; and
• the frequency, volume and timing of sales in prior periods, the reasons for such sales and its expectations about future sales activity. However, information about sales activity is not considered in isolation, but as part of an overall assessment of how the Bank’s stated objective for managing the financial assets is achieved and how cash flows are realised.
The business model assessment is based on reasonably expected scenarios without taking ‘worst case’ or ‘stress case’ scenarios into account. If cash flows after initial recognition are realised in a way that is different from the bank’s original expectations, the Bank does not change the classification of the remaining financial assets held in that business model, but incorporates such information when assessing newly originated or newly purchased financial assets going forward.
Financial assets that are held for trading or managed and whose performance is evaluated on a fair value basis are measured at FVTPL because they are neither held to collect contractual cash flows nor held both to collect contractual cash flows and to sell financial assets.
3 Significant Accounting Policies (continued)
3.2 Financial assets and liabilities (continued)
3.2.1 Due from banks, Loans and advances to customers, Financial investments at amortised cost (continued)
Assessment whether contractual cash flows are solely payments of principal and interest (‘SPPI’)
For the purposes of this assessment, ‘principal’ is defined as the fair value of the financial asset on initial recognition. ‘Interest’ is defined as consideration for the time value of money and for the credit risk associated with the principal amount outstanding during a particular period of time and for other basic lending risks and costs (e.g. liquidity risk and administrative costs), as well as profit margin.
In assessing whether the contractual cash flows are solely payments of principal and interest, the Bank considers the contractual terms of the instrument. This includes assessing whether the financial asset contains a contractual term that could change the timing or amount of contractual cash flows such that it would not meet this condition. In making the assessment, the Bank considers:
• contingent events that would change the amount and timing of cash flows;
• leverage features;
• prepayment and extension terms;
• terms that limit the Bank’s claim to cash flows from specified assets (e.g. non-recourse asset arrangements); and
• features that modify consideration of the time value of money – e.g. periodical reset of interest rates.
The Bank holds a portfolio of long-term fixed rate loans for which the Bank has the option to propose to revise the interest rate at periodic reset dates. These reset rights are limited to the market rate at the time of revision. The borrowers have an option to either accept the revised rate or redeem the loan at par without penalty. The Bank has determined that the contractual cash flows of these loans are solely payments of principal and interest because the option varies the interest rate in a way that is consideration for the time value of money, credit risk, other basic lending risks and costs associated with the principal amount outstanding.
Contractual terms that introduce a more than de minimise exposure to risks or volatility in the contractual cash flows that are unrelated to a basic lending arrangement do not give rise to contractual cash flows that are solely payments of principal and interest on the
amount outstanding. In such cases, the financial asset is required to be measured at FVPL.
3.2.2 Financial assets or financial liabilities held for trading
The Bank classifies financial assets or financial liabilities as held for trading when they have been purchased or issued primarily for short-term profit making through trading activities or form part of a portfolio of financial instruments that are managed together, for which there is evidence of a recent pattern of short-term profit taking. Held-for-trading assets and liabilities are recorded and measured in the statement of financial position at fair value. Changes in fair value are recognised in net trading income. Interest and dividend income or expense is recorded in net trading income according to the terms of the contract, or when the right to payment has been established.
3.2.3 Debt instruments at FVOCI (policy applicable from 1 January 2018)
The Bank applies the new category under IFRS 9 of debt instruments measured at FVOCI when both of the following conditions are met:
• The instrument is held within a business model, the objective of which is achieved by both collecting contractual cash flows and selling financial assets
• The contractual terms of the financial asset meet the SPPI test
These instruments largely comprise assets that had previously been classified as financial investments available-for-sale under IAS 39.
For debt securities measured at FVOCI, gains and losses are recognised in OCI, except for the following, which are recognised in profit or loss in the same manner as for financial assets measured at amortised cost:
• interest revenue using the effective interest method;
• ECL and reversals; and• foreign exchange gains and losses.
When debt security measured at FVOCI is derecognised, the cumulative gain or loss previously recognised in OCI is reclassified from equity to profit or loss.
3.2.4 Equity instruments at FVOCI (Policy applicable from 1 January 2018)
Upon initial recognition, the Bank occasionally elects to classify irrevocably some of its equity investments as equity instruments at FVOCI when they meet the definition of Equity under IAS 32 (Financial Instruments–Presentation) and are not held for trading. Such classification is determined on an instrument-by-instrument basis.
114 | National Bank of Oman Annual Report 2018 | 115
Notes to the Financial StatementsAs at 31 December 2018
Notes to the Financial StatementsAs at 31 December 2018
3 Significant Accounting Policies (continued)
3.2 Financial assets and liabilities (continued)
3.2.4 Equity instruments at FVOCI (Policy applicable from 1 January 2018) (continued)
Gains and losses on these equity instruments are never recycled to profit. Dividends are recognised in profit or loss as other operating income when the right of the payment has been established, except when the Bank benefits from such proceeds as a recovery of part of the cost of the instrument, in which case, such gains are recorded in OCI. Equity instruments at FVOCI are not subject to an impairment assessment.
3.2.5 Debt issued and other borrowed funds
After initial measurement, debt issued and other borrowed funds are subsequently measured at amortised cost. Amortised cost is calculated by taking into account any discount or premium on issue funds, and costs that are an integral part of the EIR. A compound financial instrument which contains both a liability and an equity component is separated at the issue date.
3.2.6 Financial assets and financial liabilities at fair value through profit or loss
Financial assets and financial liabilities in this category are those that are not held for trading and have been either designated by management upon initial recognition or are mandatorily required to be measured at fair value under IFRS 9. Management only designates an instrument at FVPL upon initial recognition when one of the following criteria are met. Such designation is determined on an instrument-by-instrument basis:
• The designation eliminates, or significantly reduces, the inconsistent treatment that would otherwise arise from measuring the assets or liabilities or recognising gains or losses on them on a different basis
Or
• The liabilities (and assets until 1 January 2018 under IAS 39) are part of a group of financial liabilities (or financial assets, or both under IAS 39), which are managed and their performance evaluated on a fair value basis, in accordance with a documented risk management or investment strategy
Or
• The liabilities (and assets until 1 January 2018 under IAS 39) containing one or more embedded derivatives, unless they do not significantly modify the cash flows that would otherwise be required by the contract, or it is clear with little or no analysis when a similar instrument is first considered that separation of the embedded derivative(s) is prohibited
Financial assets and financial liabilities at FVPL are recorded in the statement of financial position at fair value. Changes in fair value are recorded in profit and loss with the exception of movements in fair value of liabilities designated at FVPL due to changes in the Bank’s own credit risk. Such changes in fair value are recorded in the Own credit reserve through OCI and do not get recycled to the profit or loss. Interest earned or incurred on instruments designated at FVPL is accrued in interest income or interest expense, respectively, using the EIR, taking into account any discount/ premium and qualifying transaction costs being an integral part of instrument. Interest earned on assets mandatorily required to be measured at FVPL is recorded using contractual interest rate. Dividend income from equity instruments measured at FVPL is recorded in profit or loss as other operating income when the right to the payment has been established.
3.2.7 Financial guarantees, letters of credit and undrawn loan commitments
The Bank issues financial guarantees, letters of credit and loan commitments.
Financial guarantees are initially recognised in the financial statements (within Provisions) at fair value, being the premium received. Subsequent to initial recognition, the bank’s liability under each guarantee is measured at the higher of the amount initially recognised less cumulative amortisation recognised in the income statement, and – under IAS 39 – the best estimate of expenditure required to settle any financial obligation arising as a result of the guarantee, or – under IFRS 9 – an ECL provision.
The premium received is recognised in the income statement in Net fees and commission income on a straight line basis over the life of the guarantee.
Undrawn loan commitments and letters of credits are commitments under which, over the duration of the commitment, the bank is required to provide a loan with pre-specified terms to the customer. Similar to financial guarantee contracts, under IAS 39, a provision was made if they were an onerous contract but, from 1 January 2018, these contracts are in the scope of the ECL requirements.
The nominal contractual value of financial guarantees, letters of credit and undrawn loan commitments, where the loan agreed to be provided is on market terms, are not recorded on in the statement of financial position. The nominal values of these instruments together with the corresponding ECLs are disclosed in Note 6.
3.2.8 Financial liabilities
IFRS 9 largely retains the existing requirements in IAS 39 for the classification of financial liabilities. However, although under IAS 39 all fair value changes of liabilities designated under the fair value option were recognised
3 Significant Accounting Policies (continued)
3.2 Financial assets and liabilities (continued)
3.2.8 Financial liabilities (continued)
in profit or loss, under IFRS 9 fair value changes are generally presented as follows:
• the amount of change in the fair value that is attributable to changes in the credit risk of the liability is presented in OCI; and
• the remaining amount of change in the fair value is presented in profit or loss.
The amount presented separately in OCI related to changes in own credit risk of a designated financial liability at FVTPL are not recycled to profit or loss, even when the liability is derecognised and the amounts are paid. Instead, own credit gains and losses should be reclassified to retained earnings within equity upon derecognition of the relevant liability.
3.2.9 Derivative financial instruments and hedging activities
Derivatives are initially recognised at fair value on the date a derivative contract is entered into and are subsequently remeasured at their fair value. The method of recognising the resulting gain or loss depends on whether the derivative is designated as a hedging instrument, and if so, the nature of the item being hedged. The Bank designates certain derivatives as either:
(i) hedges of the fair value of recognised assets or liabilities or a firm commitment (fair value hedge);
(ii) hedges of a particular risk associated with a recognised asset or liability or a highly probable forecast transaction (cash flow hedge); or
(iii) hedges of a net investment in a foreign operation (net investment hedge).The Bank makes use of derivative instruments to manage exposures to interest rate, foreign currency and credit risks, including exposures arising from highly probable forecast transactions and firm commitments. In order to manage particular risks, the bank applies hedge accounting for transactions which meet specified criteria. Certain derivative instruments do not qualify for hedge accounting. Changes in the fair value of any such derivative instruments are recognised immediately in the statement of comprehensive income within ‘Other operating income’.
Hedge documentation, effectiveness assessment, and discontinuation accounting disclosures are provided in Note 3.10.
Fair value hedgesFor designated and qualifying fair value hedges, the cumulative change in the fair value of a hedging derivative is recognised in the profit or loss in other operating income. Meanwhile, the cumulative change in the fair value of the hedged item attributable to the risk hedged is recorded as part of the carrying value of the hedged item in the statement of financial position and is also recognised in the profit or loss in other operating income. If the hedging instrument expires or is sold, terminated or exercised, or where the hedge no longer meets the criteria for hedge accounting, the hedge relationship is discontinued prospectively. For hedged items recorded at amortised cost, the difference between the carrying value of the hedged item on termination and the face value is amortised over the remaining term of the original hedge using the recalculated EIR method. If the hedged item is derecognised, the unamortised fair value adjustment is recognised immediately in the profit or loss.
Cash flow hedges
For designated and qualifying cash flow hedges, the effective portion of the cumulative gain or loss on the hedging instrument is initially recognised directly in equity in the cash flow hedge reserve. The ineffective portion of the gain or loss on the hedging instrument is recognised immediately in other operating income in the profit or loss.
When the hedged cash flow affects the profit or loss, the gain or loss on the hedging instrument is recorded in the corresponding income or expense line of the profit or loss. When the forecast transaction subsequently results in the recognition of a non-financial asset or a non-financial liability, the gains and losses previously recognised in the other comprehensive income are removed from the reserve and included in the initial cost of the asset or liability. When a hedging instrument expires, or is sold, terminated, exercised, or when a hedge no longer meets the criteria for hedge accounting, any cumulative gain or loss that has been recognised in other comprehensive income at that time remains in other comprehensive income and is recognised when the hedged forecast transaction is ultimately recognised in the profit or loss. When a forecast transaction is no longer expected to occur, the cumulative gain or loss that was reported in other comprehensive income is immediately transferred to the profit or loss.
3.3 Reclassifications
From 1 January 2018, the Bank does not reclassify its financial assets subsequent to their initial recognition, except in the period after the bank changes its business model for managing financial assets. Financial liabilities are never reclassified. The Bank did not reclassify any of its financial assets or liabilities in 2017.
116 | National Bank of Oman Annual Report 2018 | 117
Notes to the Financial StatementsAs at 31 December 2018
Notes to the Financial StatementsAs at 31 December 2018
3 Significant Accounting Policies (continued)
3.4 Derecognition of the financial assets and liabilities
Financial assetsA financial asset (or, where applicable a part of a financial asset or part of a group of similar financial assets) is derecognised where:
• the rights to receive cash flows from the asset have expired; or
• the Bank has transferred its rights to receive cash flows from the asset or has assumed an obligation to pay the received cash flows in full without material delay to a third party under a ‘pass-through’ arrangement; and
• Either (a) the Bank has transferred substantially all the risks and rewards of the asset, or (b) the Bank has neither transferred nor retained substantially all the risks and rewards of the asset, but has transferred control of the asset.
When the Bank has transferred its rights to receive cash flows from an asset or has entered into a pass-through arrangement, and has neither transferred nor retained substantially all the risks and rewards of the asset nor transferred control of the asset, the asset is recognised to the extent of the Bank’s continuing involvement in the asset. In that case, the bank also recognises an associated liability. The transferred asset and the associated liability are measured on a basis that reflects the rights and obligations that the Bank has retained. Continuing involvement that takes the form of a guarantee over the transferred asset is measured at the lower of the original carrying amount of the asset and the maximum amount of consideration that the Bank could be required to repay.
Financial liabilitiesA financial liability is derecognised when the obligation under the liability is discharged or cancelled or expires. Where an existing financial liability is replaced by another from the same lender on substantially different terms, or the terms of an existing liability are substantially modified, such an exchange or modification is treated as a derecognition of the original liability and the recognition of a new liability, and the difference in the respective carrying amounts is recognised in profit or loss for the year.
3.5 Modifications of financial assets and financial liabilities
Financial assetsIf the terms of a financial asset are modified, the bank evaluates whether the cash flows of the modified asset are substantially different. If the cash flows are
substantially different, the original financial asset is derecognised and a new financial asset is recognised at fair value. If the cash flows are not substantially different, then the modification does not result in derecognition of the financial asset. In this case, the bank recalculates the gross carrying amount of the financial asset and recognises the amount arising from adjusting the gross carrying amount as a modification gain or loss in the statement of income. If such a modification is carried out because of financial difficulties of the borrower, then the gain or loss is presented together with impairment losses. In other cases, it is presented as interest income.
If the terms of a financial asset were modified because of financial difficulties of the borrower and the asset was not derecognised, then impairment of the asset was measured using the pre-modification interest rate.
Financial liabilitiesThe bank derecognises a financial liability when its terms are modified and the cash flows of the modified liability are substantially different. In this case, a new financial liability based on the modified terms is recognised at either amortised cost or fair value. The difference between the carrying amount of the financial liability derecognised and the new financial liability with modified terms is recognised in the statement of income.
3.6 Impairment of financial assets (Policy applicable from 1 January 2018)
The Bank recognises loss allowances for ECL on the following financial instruments that are not measured at FVTPL:
• financial assets that are debt instruments;
• financial guarantee contracts issued; and
• loan commitments issued.
No impairment loss is recognised on equity investments. The bank measures loss allowances at an amount equal to lifetime ECL, except for other financial instruments on which credit risk has not increased significantly since their initial recognition which they are measured as 12-month ECL.
12-month ECL are the portion of ECL that result from default events on a financial instrument that are possible within the 12 months after the reporting date.
3.6.1 Measurement of ECL
ECL are a probability-weighted estimate of credit losses. They are measured as follows:
• financial assets that are not credit-impaired at the reporting date: as the present value of all cash shortfalls (i.e. the difference between the cash flows due to the Bank in accordance with the contract and the cash flows that the Bank expects to receive);
3 Significant Accounting Policies (continued)
3.6 Impairment of financial assets (Policy applicable from 1 January 2018) (continued)
3.6.1 Measurement of ECL (continued)
• financial assets that are credit-impaired at the reporting date: as the difference between the gross carrying amount and the present value of estimated future cash flows;
• undrawn loan commitments: as the present value of the difference between the contractual cash flows that are due to the Bank if the commitment is drawn down and the cash flows that the bank expects to receive; and
• financial guarantee contracts: the expected payments to reimburse the holder less any amounts that the bank expects to recover.
3.6.2 Overview of the ECL principles
The adoption of IFRS 9 has fundamentally changed the bank’s financing loss impairment method by replacing incurred loss approach with a forward-looking ECL approach. From 1 January 2018, the Bank has been recording the allowance for expected credit losses for all financing exposure and other debt financial assets not held at FVPL, together with financing commitments and financial guarantee contracts. Equity instruments are not subject to impairment under IFRS 9.
The ECL allowance is based on the credit losses expected to arise over the life of the asset (the lifetime expected credit loss (LTECL), unless there has been no significant increase in credit risk since origination, in which case, the allowance is based on the 12 months’ expected credit loss (12 month ECL).
The 12 month ECL is the portion of LTECLs that represent the ECLs that result from default events on a financial instrument that are possible within the 12 months after the reporting date.
Both LTECLs and 12mECLs are calculated on either an individual basis or a collective basis, depending on the nature of the underlying portfolio of financial instruments.
The Bank has established a policy to perform an assessment, at the end of each reporting period, of whether a financial instrument’s credit risk has increased significantly since initial recognition, by considering the change in the risk of default occurring over the remaining life of the financial instrument.
Based on the above process, the Bank groups its financing exposure into Stage 1, Stage 2, and Stage 3, as described below:
Stage 1
When financing is first recognised, the Bank recognises
an allowance based on 12 month ECLs. Stage 1 financing exposure also include facilities where the credit risk has improved and the financing exposure has been reclassified from Stage 2.
Stage 2When a financing exposure has shown a significant increase in credit risk since origination, the Bank records an allowance for the LTECLs. Stage 2 financing exposure also include facilities, where the credit risk has improved and the financing exposure has been reclassified from Stage 3.
Stage 3
Financing exposure considered credit-impaired. The bank records an allowance for the LTECLs.
At initial recognition of a financial asset, the bank recognises a loss allowance equal to 12-month expected credit losses. After initial recognition, the three stages under the proposals would be applied as follows:
Stage 1
Credit risk has not increased significantly since initial recognition – recognise 12-month expected credit losses.
Stage 2Credit risk has increased significantly since initial recognition – recognise lifetime expected losses (this is recognising a provision earlier than under IAS 39 Financial assets: Recognition and Measurement) with revenue being calculated based on the gross amount of the asset.
Stage 3
There is objective evidence of impairment as at the reporting date to recognise lifetime expected losses, with revenue being based on the net amount of the asset (that is, based on the impaired amount of the asset).
3.6.3 The calculation of ECLs
The bank calculates ECLs based on a three probability-weighted scenarios to measure the expected cash shortfalls, discounted at an approximation to the EIR. A cash shortfall is the difference between the cash flows that are due in accordance with the contract and the cash flows that are expected to be received.
The mechanics of the ECL calculations are outlined below and the key elements are, as follows:
• PD – The Probability of Default is an estimate of the likelihood of default over a given time horizon. A default may only happen at a certain time over the assessed period, if the facility has not been previously derecognised and is still in the portfolio.
118 | National Bank of Oman Annual Report 2018 | 119
Notes to the Financial StatementsAs at 31 December 2018
Notes to the Financial StatementsAs at 31 December 2018
3 Significant Accounting Policies (continued)
3.6 Impairment of financial assets (Policy applicable from 1 January 2018) (continued)
3.6.3 The calculation of ECLs (continued)
• EAD – The Exposure at Default is an estimate of the exposure at a future default date, taking into account expected changes in the exposure after the reporting date, including repayments of principal and profit, whether scheduled by contract or otherwise, expected drawdowns on committed facilities, and accrued profit from missed payments.
• LGD–The Loss Given Default is an estimate of the loss arising in the case where a default occurs at a given time. It is based on the difference between the contractual cash flows due and those that the Bank would expect to receive, including from the realisation of any collateral, if any. It is usually expressed as a percentage of the EAD.
3.6.4 Presentation of allowance for ECL in the statement of financial position
Loss allowances for ECL are presented in the statement of financial position as follows:
• financial assets measured at amortised cost: as a deduction from the gross carrying amount of the assets;
• loan commitments and financial guarantee contracts: generally, as a provision;
• where a financial instrument includes both a drawn and an undrawn component, and the Bank cannot identify the ECL on the loan commitment component separately from those on the drawn component: the Bank presents a combined loss allowance for both components. The combined amount is presented as a deduction from the gross carrying amount of the drawn component. Any excess of the loss allowance over the gross amount of the drawn component is presented as a provision; and
• debt instruments measured at FVOCI: no loss allowance is recognised in the statement of financial position because the carrying amount of these assets is their fair value. However, the loss allowance is disclosed and is recognised in the fair value reserve.
3.6.5 Debt instruments measured at fair value through OCI
The ECLs for debt instruments measured at FVOCI do not reduce the carrying amount of these financial assets in the statement of financial position, which remains at fair value. Instead, an amount equal to the allowance that would arise if the assets were measured at amortised cost is recognised in OCI as an accumulated
impairment amount, with a corresponding charge to profit or loss. The accumulated loss recognised in OCI is recycled to the profit and loss upon derecognition of the assets.
3.6.6 Purchased or originated credit impaired financial assets (POCI)
For POCI financial assets, the Bank only recognises the cumulative changes in LTECL since initial recognition in the loss allowance.
3.6.7 Credit cards and other revolving facilities
The bank’s product offering includes a variety of corporate and retail overdraft and credit cards facilities, in which the Bank has the right to cancel and/or reduce the facilities with one day’s notice. The Bank does not limit its exposure to credit losses to the contractual notice period, but, instead calculates ECL over a period that reflects the Bank’s expectations of the customer behaviour, its likelihood of default and the Bank’s future risk mitigation procedures, which could include reducing or cancelling the facilities. Based on past experience and the Bank’s expectations, the period over which the Bank calculates ECLs for these products, is five years for corporate and seven years for retail products.
3.7 Restructured financial assets
If the terms of a financial asset are renegotiated or modified or an existing financial asset is replaced with a new one due to financial difficulties of the borrower, then an assessment is made of whether the financial asset should be derecognized and ECL are measured as follows.
• If the expected restructuring will not result in derecognition of the existing asset, then the expected cash flows arising from the modified financial asset are included in calculating the cash shortfalls from the existing asset.
• If the expected restructuring will result in derecognition of the existing asset, then the expected amortised fair value of the new asset is treated as the final cash flow from the existing financial asset at the time of its derecognition. This amount is included in calculating the cash shortfalls from the existing financial asset that are discounted from the expected date of derecognition to the reporting date using the original effective interest rate of the existing financial asset.
3.8 Credit-impaired financial assets
At each reporting date, the Bank assesses whether financial assets carried at amortised cost and debt financial assets carried at FVOCI are credit-impaired. A financial asset is ‘credit-impaired’ when one or more events that have a detrimental impact on the estimated future cash flows of the financial asset have occurred.
3 Significant Accounting Policies (continued)
3.8 Credit-impaired financial assets (continued)
Evidence that a financial asset is credit-impaired includes the following observable data:
• significant financial difficulty of the borrower or issuer;
• a breach of contract such as a default or past due event;
• the restructuring of a loan or advance by the Bank on terms that the Bank would not consider otherwise;
• it is becoming probable that the borrower will enter bankruptcy or other financial reorganisation; or
• the disappearance of an active market for a security because of financial difficulties.
A loan that has been renegotiated due to a deterioration in the borrower’s condition is usually considered to be credit-impaired unless there is evidence that the risk of not receiving contractual cash flows has reduced significantly and there are no other indicators of impairment. In addition, a retail loan that is overdue for 90 days or more is considered impaired.
In making an assessment of whether an investment in sovereign debt is credit-impaired, the Bank considers the following factors.
• The market’s assessment of creditworthiness as reflected in the bond yields.
• The rating agencies’ assessments of creditworthiness.
• The country’s ability to access the capital markets for new debt issuance.
• The probability of debt being restructured, resulting in holders suffering losses through voluntary or mandatory debt forgiveness.
• The international support mechanisms in place to provide the necessary support as ‘lender of last resort’ to that country, as well as the intention, reflected in public statements, of governments and agencies to use those mechanisms. This includes an assessment of the depth of those mechanisms and, irrespective of the political intent, whether there is the capacity to fulfil the required criteria.
3.9 Write-off
The Bank’s accounting policy under IFRS 9 remains the same as it was under IAS 39. Loans and debt securities are written off (either partially or in full) when there is no realistic prospect of recovery. This is generally the case when the bank determines that the borrower does not have assets or sources of income that could generate sufficient cash flows to repay the amounts subject to the write-off. However, financial assets that are written off could still be subject to enforcement activities in order to comply with the bank’s procedures for recovery of amounts due.
3.10 Hedge documentation, effectiveness assessment, and discontinuation
At the inception of the hedge, the bank formally designates and documents the hedging relationship to which the bank wishes to apply hedge accounting, and the risk management objective and strategy for undertaking the hedge. That documentation shall include identification of the hedging instrument, the hedged item, the nature of the risk being hedged and how the Bank will assess whether the hedging relationship meets the hedge effectiveness requirements (including its analysis of the sources of hedge ineffectiveness and how it determines the hedge ratio). Such hedges are expected to be highly effective in achieving offsetting changes in fair value or cash flows and are assessed on an ongoing basis at each reporting date or upon a significant change in the circumstances affecting the hedge effectiveness requirements, whichever comes first. The assessment relates to expectations about hedge effectiveness and is therefore only forward-looking.
A hedging relationship qualifies for hedge accounting if it meets all of the following effectiveness requirements:
• there is ‘an economic relationship’ between the hedged item and the hedging instrument;
• the effect of credit risk does not ‘dominate the value changes’ that result from that economic relationship; and
• the hedge ratio of the hedging relationship is the same as that resulting from the quantity of hedged item that the Bank actually hedges and the quantity of the hedging instrument that the Bank actually uses to hedge that quantity of hedged item.
When the hedging instrument or instruments have been sold or terminated, or when a hedging relationship no longer meets the risk management objective or the criteria for hedge accounting, any cumulative gain or loss that has been recognised in other comprehensive income at that time remains in other comprehensive income and is recognised when the hedged forecast transaction is ultimately recognised in the profit or loss. When a forecast transaction is no longer expected to occur, the cumulative gain or loss that was reported in other comprehensive income is immediately transferred to the profit or loss.
The Bank performs a hedge effectiveness assessment in a similar manner as at the inception of the hedging relationship and subsequently on every reporting period.
A hedging relationship is discontinued in its entirety when as a whole it ceases to meet the qualifying criteria of the hedging relationship. Voluntary discontinuation when the qualifying criteria are met is prohibited. In the event of discontinuation any subsequent changes in fair value of the hedging instrument are recognised in profit or loss. For effective fair value hedges of financial
120 | National Bank of Oman Annual Report 2018 | 121
Notes to the Financial StatementsAs at 31 December 2018
Notes to the Financial StatementsAs at 31 December 2018
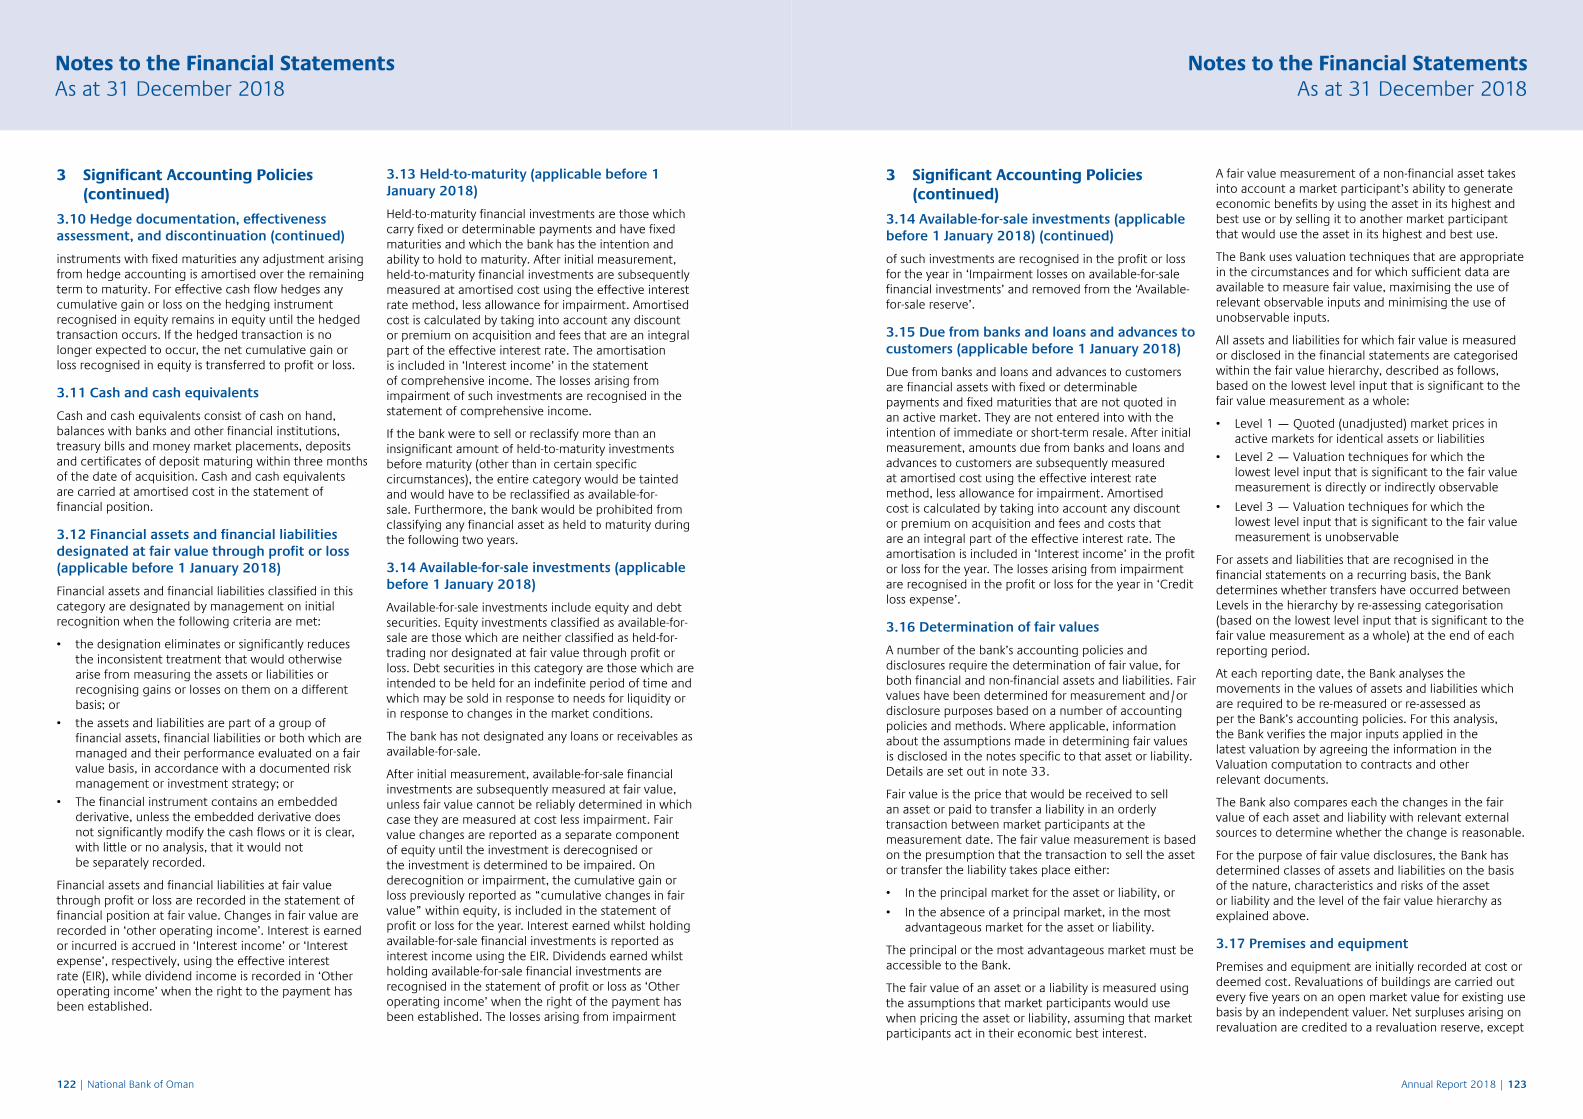
3 Significant Accounting Policies (continued)
3.10 Hedge documentation, effectiveness assessment, and discontinuation (continued)
instruments with fixed maturities any adjustment arising from hedge accounting is amortised over the remaining term to maturity. For effective cash flow hedges any cumulative gain or loss on the hedging instrument recognised in equity remains in equity until the hedged transaction occurs. If the hedged transaction is no longer expected to occur, the net cumulative gain or loss recognised in equity is transferred to profit or loss.
3.11 Cash and cash equivalents
Cash and cash equivalents consist of cash on hand, balances with banks and other financial institutions, treasury bills and money market placements, deposits and certificates of deposit maturing within three months of the date of acquisition. Cash and cash equivalents are carried at amortised cost in the statement of financial position.
3.12 Financial assets and financial liabilities designated at fair value through profit or loss (applicable before 1 January 2018)
Financial assets and financial liabilities classified in this category are designated by management on initial recognition when the following criteria are met:
• the designation eliminates or significantly reduces the inconsistent treatment that would otherwise arise from measuring the assets or liabilities or recognising gains or losses on them on a different basis; or
• the assets and liabilities are part of a group of financial assets, financial liabilities or both which are managed and their performance evaluated on a fair value basis, in accordance with a documented risk management or investment strategy; or
• The financial instrument contains an embedded derivative, unless the embedded derivative does not significantly modify the cash flows or it is clear, with little or no analysis, that it would not be separately recorded.
Financial assets and financial liabilities at fair value through profit or loss are recorded in the statement of financial position at fair value. Changes in fair value are recorded in ‘other operating income’. Interest is earned or incurred is accrued in ‘Interest income’ or ‘Interest expense’, respectively, using the effective interest rate (EIR), while dividend income is recorded in ‘Other operating income’ when the right to the payment has been established.
3.13 Held-to-maturity (applicable before 1 January 2018)
Held-to-maturity financial investments are those which carry fixed or determinable payments and have fixed maturities and which the bank has the intention and ability to hold to maturity. After initial measurement, held-to-maturity financial investments are subsequently measured at amortised cost using the effective interest rate method, less allowance for impairment. Amortised cost is calculated by taking into account any discount or premium on acquisition and fees that are an integral part of the effective interest rate. The amortisation is included in ‘Interest income’ in the statement of comprehensive income. The losses arising from impairment of such investments are recognised in the statement of comprehensive income.
If the bank were to sell or reclassify more than an insignificant amount of held-to-maturity investments before maturity (other than in certain specific circumstances), the entire category would be tainted and would have to be reclassified as available-for-sale. Furthermore, the bank would be prohibited from classifying any financial asset as held to maturity during the following two years.
3.14 Available-for-sale investments (applicable before 1 January 2018)
Available-for-sale investments include equity and debt securities. Equity investments classified as available-for-sale are those which are neither classified as held-for-trading nor designated at fair value through profit or loss. Debt securities in this category are those which are intended to be held for an indefinite period of time and which may be sold in response to needs for liquidity or in response to changes in the market conditions.
The bank has not designated any loans or receivables as available-for-sale.
After initial measurement, available-for-sale financial investments are subsequently measured at fair value, unless fair value cannot be reliably determined in which case they are measured at cost less impairment. Fair value changes are reported as a separate component of equity until the investment is derecognised or the investment is determined to be impaired. On derecognition or impairment, the cumulative gain or loss previously reported as “cumulative changes in fair value” within equity, is included in the statement of profit or loss for the year. Interest earned whilst holding available-for-sale financial investments is reported as interest income using the EIR. Dividends earned whilst holding available-for-sale financial investments are recognised in the statement of profit or loss as ‘Other operating income’ when the right of the payment has been established. The losses arising from impairment
3 Significant Accounting Policies (continued)
3.14 Available-for-sale investments (applicable before 1 January 2018) (continued)
of such investments are recognised in the profit or loss for the year in ‘Impairment losses on available-for-sale financial investments’ and removed from the ‘Available-for-sale reserve’.
3.15 Due from banks and loans and advances to customers (applicable before 1 January 2018)
Due from banks and loans and advances to customers are financial assets with fixed or determinable payments and fixed maturities that are not quoted in an active market. They are not entered into with the intention of immediate or short-term resale. After initial measurement, amounts due from banks and loans and advances to customers are subsequently measured at amortised cost using the effective interest rate method, less allowance for impairment. Amortised cost is calculated by taking into account any discount or premium on acquisition and fees and costs that are an integral part of the effective interest rate. The amortisation is included in ‘Interest income’ in the profit or loss for the year. The losses arising from impairment are recognised in the profit or loss for the year in ‘Credit loss expense’.
3.16 Determination of fair values
A number of the bank’s accounting policies and disclosures require the determination of fair value, for both financial and non-financial assets and liabilities. Fair values have been determined for measurement and/or disclosure purposes based on a number of accounting policies and methods. Where applicable, information about the assumptions made in determining fair values is disclosed in the notes specific to that asset or liability. Details are set out in note 33.
Fair value is the price that would be received to sell an asset or paid to transfer a liability in an orderly transaction between market participants at the measurement date. The fair value measurement is based on the presumption that the transaction to sell the asset or transfer the liability takes place either:
• In the principal market for the asset or liability, or
• In the absence of a principal market, in the most advantageous market for the asset or liability.
The principal or the most advantageous market must be accessible to the Bank.
The fair value of an asset or a liability is measured using the assumptions that market participants would use when pricing the asset or liability, assuming that market participants act in their economic best interest.
A fair value measurement of a non-financial asset takes into account a market participant’s ability to generate economic benefits by using the asset in its highest and best use or by selling it to another market participant that would use the asset in its highest and best use.
The Bank uses valuation techniques that are appropriate in the circumstances and for which sufficient data are available to measure fair value, maximising the use of relevant observable inputs and minimising the use of unobservable inputs.
All assets and liabilities for which fair value is measured or disclosed in the financial statements are categorised within the fair value hierarchy, described as follows, based on the lowest level input that is significant to the fair value measurement as a whole:
• Level 1 — Quoted (unadjusted) market prices in active markets for identical assets or liabilities
• Level 2 — Valuation techniques for which the lowest level input that is significant to the fair value measurement is directly or indirectly observable
• Level 3 — Valuation techniques for which the lowest level input that is significant to the fair value measurement is unobservable
For assets and liabilities that are recognised in the financial statements on a recurring basis, the Bank determines whether transfers have occurred between Levels in the hierarchy by re-assessing categorisation (based on the lowest level input that is significant to the fair value measurement as a whole) at the end of each reporting period.
At each reporting date, the Bank analyses the movements in the values of assets and liabilities which are required to be re-measured or re-assessed as per the Bank’s accounting policies. For this analysis, the Bank verifies the major inputs applied in the latest valuation by agreeing the information in the Valuation computation to contracts and other relevant documents.
The Bank also compares each the changes in the fair value of each asset and liability with relevant external sources to determine whether the change is reasonable.
For the purpose of fair value disclosures, the Bank has determined classes of assets and liabilities on the basis of the nature, characteristics and risks of the asset or liability and the level of the fair value hierarchy as explained above.
3.17 Premises and equipment
Premises and equipment are initially recorded at cost or deemed cost. Revaluations of buildings are carried out every five years on an open market value for existing use basis by an independent valuer. Net surpluses arising on revaluation are credited to a revaluation reserve, except
122 | National Bank of Oman Annual Report 2018 | 123
Notes to the Financial StatementsAs at 31 December 2018
Notes to the Financial StatementsAs at 31 December 2018

3 Significant Accounting Policies (continued)
3.17 Premises and equipment (continued)
that a revaluation increase is recognised as income to the extent that it reverses a revaluation decrease of the same asset previously recognised as an expense.
A decrease as a result of a revaluation is recognised as an expense, except that it is charged directly against any related revaluation surplus to the extent that the decrease does not exceed the amount held in the revaluation surplus in respect of that same asset. On disposal the related revaluation surplus is credited to retained earnings.
Land and capital work in progress are stated at cost and tested for impairment, if any. Depreciation is provided on a straight-line basis over the estimated useful lives of all premises and equipment other than freehold land, which is deemed to have an indefinite life, and capital work in progress.
The rates of depreciation are based upon the following estimated useful lives:
Buildings on freehold land: 25 to 40 years
Leasehold improvements: Over the lease terms 3 to 10 years
Motor vehicles: 4 yearsFurniture: 3 to 10 yearsEquipment: 5 to 20 years
The assets’ residual values, useful lives and depreciation methods are reviewed and adjusted if appropriate at each statement of financial position date.
3.18 Collateral pending sale
The bank occasionally acquires real estate in settlement of certain loans and advances. Real estate is stated at the lower of the net realisable value of the related loans and advances and the current fair value of such assets. Gains or losses on disposal, and unrealised losses on revaluation, are recognised in the profit or loss for the year.
3.19 Deposits
All money market and customer deposits are carried at amortised cost using EIR.
3.20 Other borrowed funds
Other borrowings including subordinate private placements are recognised initially at their issue proceeds. Borrowings are subsequently stated at amortised cost; any difference between proceeds, net of transaction costs, and the redemption value is recognised in the profit or loss over the period of the borrowings using EIR.
3.21 Taxation – current and deferred
Taxation is provided for based on the relevant tax laws of the respective countries, in which the bank operates.
Income tax on the profit or loss for the year comprises current and deferred tax. Income tax is recognised in the profit or loss for the year except to the extent that it relates to items recognised directly to other comprehensive income, in which case it is recognised in equity.
Current tax is the expected tax payable on the taxable income for the year, using tax rates enacted or substantially enacted at the reporting date, and any adjustment to tax payable in respect of previous years.
Deferred tax is calculated using the balance sheet liability method, providing for temporary differences between the carrying amounts of assets and liabilities for financial reporting purposes and the amounts used for taxation purposes. The amount of deferred tax provided is based on expected manner of realisation or settlement of the carrying amount of assets and liabilities, using tax rates enacted or substantially enacted at the reporting date.
A deferred tax asset is recognised only to the extent that it is probable that future taxable profits will be available against which the asset can be utilised. Deferred tax assets are reduced to the extent that it is no longer probable that the related tax benefit will be realised.
3.22 Fiduciary assets
Assets held in trust or in a fiduciary capacity are not treated as assets of the bank and accordingly are not included in these financial statements.
3.23 Provisions
Provisions are recognised when the bank has a present obligation (legal or constructive) arising from a past event and the costs to settle the obligation are both probable and able to be reliably measured.
3.24 Impairment of financial assets (applicable before 1 January 2018)
The Bank assesses at each reporting date whether there is any objective evidence that a financial asset or a group of financial assets is impaired. A financial asset or a group of financial assets is deemed to be impaired if, and only if, there is an objective evidence of impairment as a result of one or more events that has occurred after the initial recognition of the asset (an incurred ‘loss event’) and that loss event (or events) has an impact on the estimated future cash flows of the financial asset or the group of financial assets that can be reliably estimated. Evidence of impairment may include indications that the borrower or a group of borrowers is experiencing significant financial difficulty, default or
3 Significant Accounting Policies (continued)
3.24 Impairment of financial assets (applicable before 1 January 2018) (continued)
delinquency in interest or principal payments, the probability that they will enter bankruptcy or other financial reorganisation and where observable data indicate that there is a measurable decrease in the estimated future cash flows, such as changes in arrears or economic conditions that correlate with defaults. If such evidence exists, the impairment loss is recognised in the profit or loss for the year.
Due from banks and loans and advances to customers
For amounts due from banks and loans and advances to customers carried at amortised cost, the bank first assesses individually whether objective evidence of impairment exists individually for financial assets that are individually significant, or collectively for financial assets that are not individually significant. If the bank determines that no objective evidence of impairment exists for an individually assessed financial asset, whether significant or not, it includes the asset in a group of financial assets with similar credit risk characteristics and collectively assesses them for impairment. Assets that are individually assessed for impairment and for which an impairment loss is, or continues to be, recognised are not included in a collective assessment of impairment.
If there is objective evidence that an impairment loss has been incurred, the amount of the loss is measured as the difference between the assets’ carrying amount and the present value of estimated future cash flows (excluding future expected credit losses that have not yet been incurred). The carrying amount of the asset is reduced through the use of an allowance account and the amount of the loss is recognised in the profit or loss for the year. Interest income continues to be accrued on the reduced carrying amount based on the original effective interest rate of the asset. Loans together with the associated allowance are written off when there is no realistic prospect of future recovery and all collateral has been realised or has been transferred to the bank. If, in a subsequent year, the amount of the estimated impairment loss increases or decreases because of an event occurring after the impairment was recognised, the previously recognised impairment loss is increased or reduced by adjusting the allowance account. If a future write-off is later recovered, the recovery is credited to the ‘Recoveries from loans and advances written off’.
The present value of the estimated future cash flows is discounted at the financial asset’s original effective interest rate. If a loan has a variable interest rate, the
discount rate for measuring any impairment loss is the current effective interest rate. The calculation of the present value of the estimated future cash flows of a collateralised financial asset reflects the cash flows that may result from foreclosure less costs for obtaining and selling the collateral, whether or not foreclosure is probable.
For the purpose of a collective evaluation of impairment, financial assets are grouped on the basis of the bank’s internal credit grading system that considers credit risk characteristics such as asset type, industry, geographical location, collateral type, past-due status and other relevant factors.
Future cash flows on a group of financial assets that are collectively evaluated for impairment are estimated on the basis of historical loss experience for assets with credit risk characteristics similar to those in the bank. Historical loss experience is adjusted on the basis of current observable data to reflect the effects of current conditions that did not affect the years on which the historical loss experience is based and to remove the effects of conditions in the historical period that do not exist currently. Estimates of changes in future cash flows reflect, and are directionally consistent with, changes in related observable data from year to year (such as changes in unemployment rates, property prices, payment status, or other factors that are indicative of incurred losses in the bank and their magnitude). The methodology and assumptions used for estimating future cash flows are reviewed regularly to reduce any differences between loss estimates and actual loss experience.
Renegotiated loans
Where possible, the bank seeks to restructure loans rather than to take possession of collateral. This may involve extending the payment arrangements and the agreement of new loan conditions. Once the terms have been renegotiated, the loan is no longer considered past due. Management continuously reviews renegotiated loans to ensure that all criteria are met and that future payments are likely to occur. The loans continue to be subject to an individual or collective impairment assessment, calculated using the loan’s original effective interest rate.
Held-to-maturity financial investments
For held-to-maturity investments the bank assesses individually whether there is objective evidence of impairment. If there is objective evidence that an impairment loss has been incurred, the amount of the loss is measured as the difference between the assets’ carrying amount and the present value of estimated future cash flows. The carrying amount of the asset is reduced and the amount of the loss is recognised in the profit or loss for the year.
124 | National Bank of Oman Annual Report 2018 | 125
Notes to the Financial StatementsAs at 31 December 2018
Notes to the Financial StatementsAs at 31 December 2018
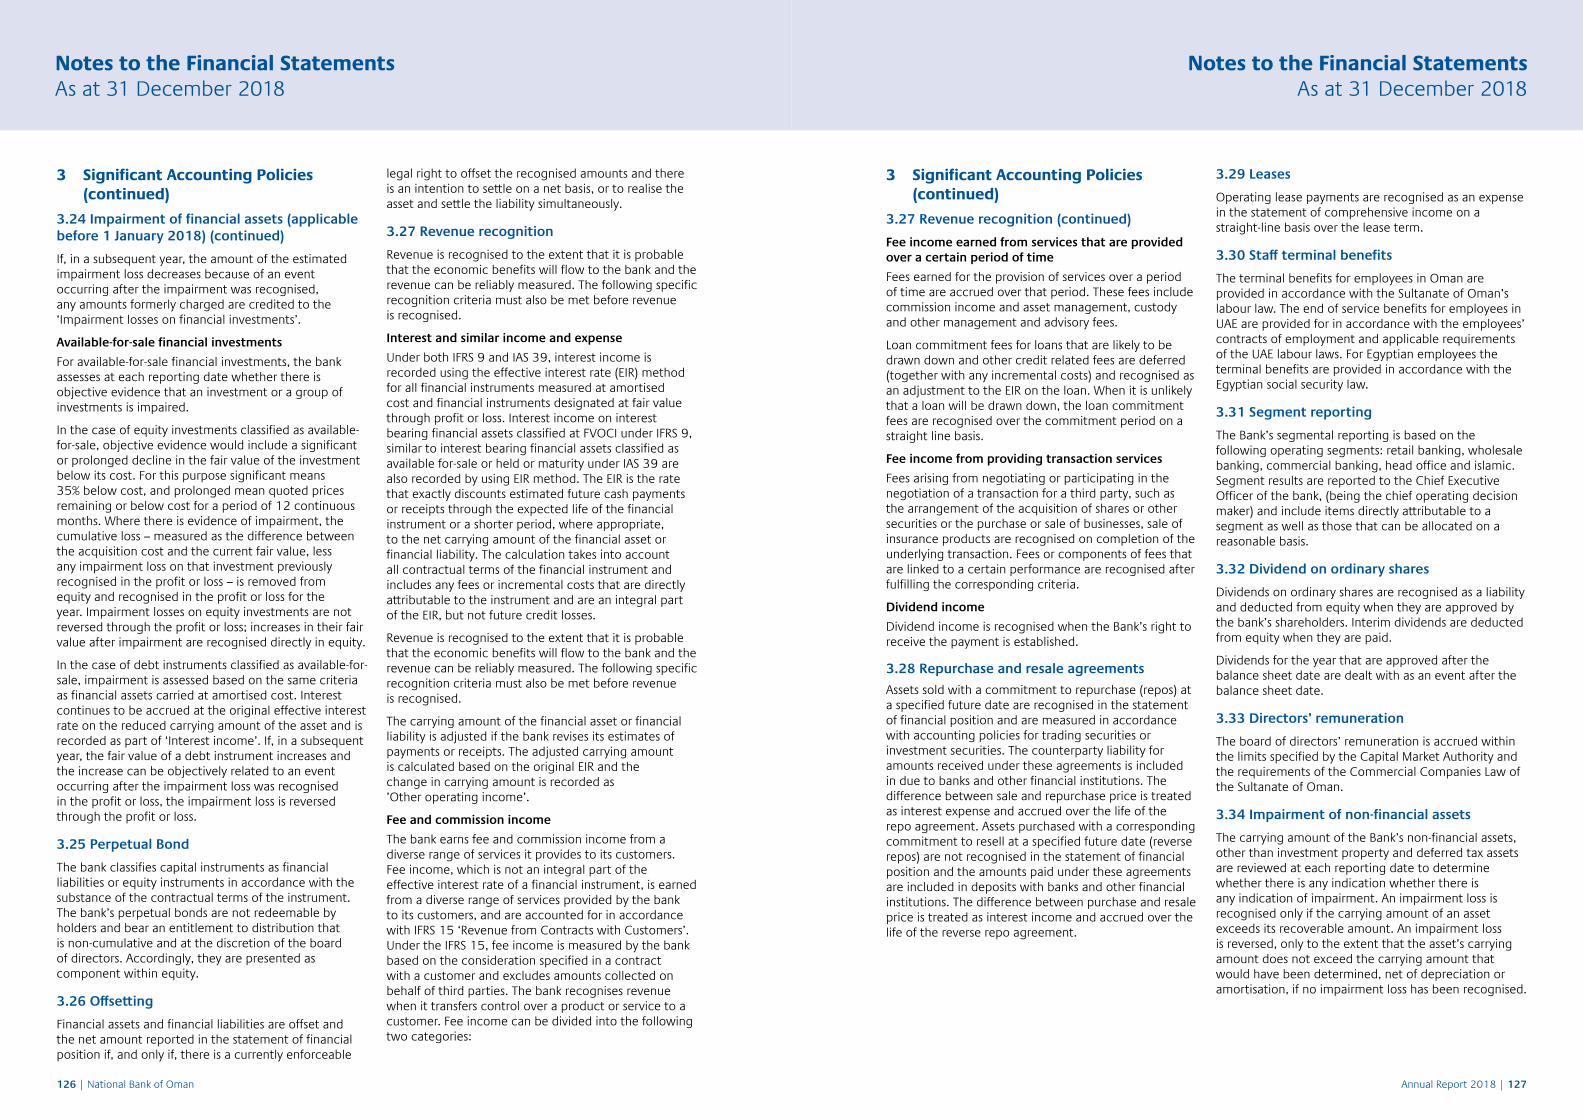
3 Significant Accounting Policies (continued)
3.24 Impairment of financial assets (applicable before 1 January 2018) (continued)
If, in a subsequent year, the amount of the estimated impairment loss decreases because of an event occurring after the impairment was recognised, any amounts formerly charged are credited to the ‘Impairment losses on financial investments’.
Available-for-sale financial investments
For available-for-sale financial investments, the bank assesses at each reporting date whether there is objective evidence that an investment or a group of investments is impaired.
In the case of equity investments classified as available-for-sale, objective evidence would include a significant or prolonged decline in the fair value of the investment below its cost. For this purpose significant means 35% below cost, and prolonged mean quoted prices remaining or below cost for a period of 12 continuous months. Where there is evidence of impairment, the cumulative loss – measured as the difference between the acquisition cost and the current fair value, less any impairment loss on that investment previously recognised in the profit or loss – is removed from equity and recognised in the profit or loss for the year. Impairment losses on equity investments are not reversed through the profit or loss; increases in their fair value after impairment are recognised directly in equity.
In the case of debt instruments classified as available-for-sale, impairment is assessed based on the same criteria as financial assets carried at amortised cost. Interest continues to be accrued at the original effective interest rate on the reduced carrying amount of the asset and is recorded as part of ‘Interest income’. If, in a subsequent year, the fair value of a debt instrument increases and the increase can be objectively related to an event occurring after the impairment loss was recognised in the profit or loss, the impairment loss is reversed through the profit or loss.
3.25 Perpetual Bond
The bank classifies capital instruments as financial liabilities or equity instruments in accordance with the substance of the contractual terms of the instrument. The bank’s perpetual bonds are not redeemable by holders and bear an entitlement to distribution that is non-cumulative and at the discretion of the board of directors. Accordingly, they are presented as component within equity.
3.26 Offsetting
Financial assets and financial liabilities are offset and the net amount reported in the statement of financial position if, and only if, there is a currently enforceable
legal right to offset the recognised amounts and there is an intention to settle on a net basis, or to realise the asset and settle the liability simultaneously.
3.27 Revenue recognition
Revenue is recognised to the extent that it is probable that the economic benefits will flow to the bank and the revenue can be reliably measured. The following specific recognition criteria must also be met before revenue is recognised.
Interest and similar income and expense
Under both IFRS 9 and IAS 39, interest income is recorded using the effective interest rate (EIR) method for all financial instruments measured at amortised cost and financial instruments designated at fair value through profit or loss. Interest income on interest bearing financial assets classified at FVOCI under IFRS 9, similar to interest bearing financial assets classified as available for-sale or held or maturity under IAS 39 are also recorded by using EIR method. The EIR is the rate that exactly discounts estimated future cash payments or receipts through the expected life of the financial instrument or a shorter period, where appropriate, to the net carrying amount of the financial asset or financial liability. The calculation takes into account all contractual terms of the financial instrument and includes any fees or incremental costs that are directly attributable to the instrument and are an integral part of the EIR, but not future credit losses.
Revenue is recognised to the extent that it is probable that the economic benefits will flow to the bank and the revenue can be reliably measured. The following specific recognition criteria must also be met before revenue is recognised.
The carrying amount of the financial asset or financial liability is adjusted if the bank revises its estimates of payments or receipts. The adjusted carrying amount is calculated based on the original EIR and the change in carrying amount is recorded as ’Other operating income’.
Fee and commission income
The bank earns fee and commission income from a diverse range of services it provides to its customers. Fee income, which is not an integral part of the effective interest rate of a financial instrument, is earned from a diverse range of services provided by the bank to its customers, and are accounted for in accordance with IFRS 15 ‘Revenue from Contracts with Customers’. Under the IFRS 15, fee income is measured by the bank based on the consideration specified in a contract with a customer and excludes amounts collected on behalf of third parties. The bank recognises revenue when it transfers control over a product or service to a customer. Fee income can be divided into the following two categories:
3 Significant Accounting Policies (continued)
3.27 Revenue recognition (continued)
Fee income earned from services that are provided over a certain period of time
Fees earned for the provision of services over a period of time are accrued over that period. These fees include commission income and asset management, custody and other management and advisory fees.
Loan commitment fees for loans that are likely to be drawn down and other credit related fees are deferred (together with any incremental costs) and recognised as an adjustment to the EIR on the loan. When it is unlikely that a loan will be drawn down, the loan commitment fees are recognised over the commitment period on a straight line basis.
Fee income from providing transaction services
Fees arising from negotiating or participating in the negotiation of a transaction for a third party, such as the arrangement of the acquisition of shares or other securities or the purchase or sale of businesses, sale of insurance products are recognised on completion of the underlying transaction. Fees or components of fees that are linked to a certain performance are recognised after fulfilling the corresponding criteria.
Dividend income
Dividend income is recognised when the Bank’s right to receive the payment is established.
3.28 Repurchase and resale agreements
Assets sold with a commitment to repurchase (repos) at a specified future date are recognised in the statement of financial position and are measured in accordance with accounting policies for trading securities or investment securities. The counterparty liability for amounts received under these agreements is included in due to banks and other financial institutions. The difference between sale and repurchase price is treated as interest expense and accrued over the life of the repo agreement. Assets purchased with a corresponding commitment to resell at a specified future date (reverse repos) are not recognised in the statement of financial position and the amounts paid under these agreements are included in deposits with banks and other financial institutions. The difference between purchase and resale price is treated as interest income and accrued over the life of the reverse repo agreement.
3.29 Leases
Operating lease payments are recognised as an expense in the statement of comprehensive income on a straight-line basis over the lease term.
3.30 Staff terminal benefits
The terminal benefits for employees in Oman are provided in accordance with the Sultanate of Oman’s labour law. The end of service benefits for employees in UAE are provided for in accordance with the employees’ contracts of employment and applicable requirements of the UAE labour laws. For Egyptian employees the terminal benefits are provided in accordance with the Egyptian social security law.
3.31 Segment reporting
The Bank’s segmental reporting is based on the following operating segments: retail banking, wholesale banking, commercial banking, head office and islamic. Segment results are reported to the Chief Executive Officer of the bank, (being the chief operating decision maker) and include items directly attributable to a segment as well as those that can be allocated on a reasonable basis.
3.32 Dividend on ordinary shares
Dividends on ordinary shares are recognised as a liability and deducted from equity when they are approved by the bank’s shareholders. Interim dividends are deducted from equity when they are paid.
Dividends for the year that are approved after the balance sheet date are dealt with as an event after the balance sheet date.
3.33 Directors’ remuneration
The board of directors’ remuneration is accrued within the limits specified by the Capital Market Authority and the requirements of the Commercial Companies Law of the Sultanate of Oman.
3.34 Impairment of non-financial assets
The carrying amount of the Bank’s non-financial assets, other than investment property and deferred tax assets are reviewed at each reporting date to determine whether there is any indication whether there is any indication of impairment. An impairment loss is recognised only if the carrying amount of an asset exceeds its recoverable amount. An impairment loss is reversed, only to the extent that the asset’s carrying amount does not exceed the carrying amount that would have been determined, net of depreciation or amortisation, if no impairment loss has been recognised.
126 | National Bank of Oman Annual Report 2018 | 127
Notes to the Financial StatementsAs at 31 December 2018
Notes to the Financial StatementsAs at 31 December 2018
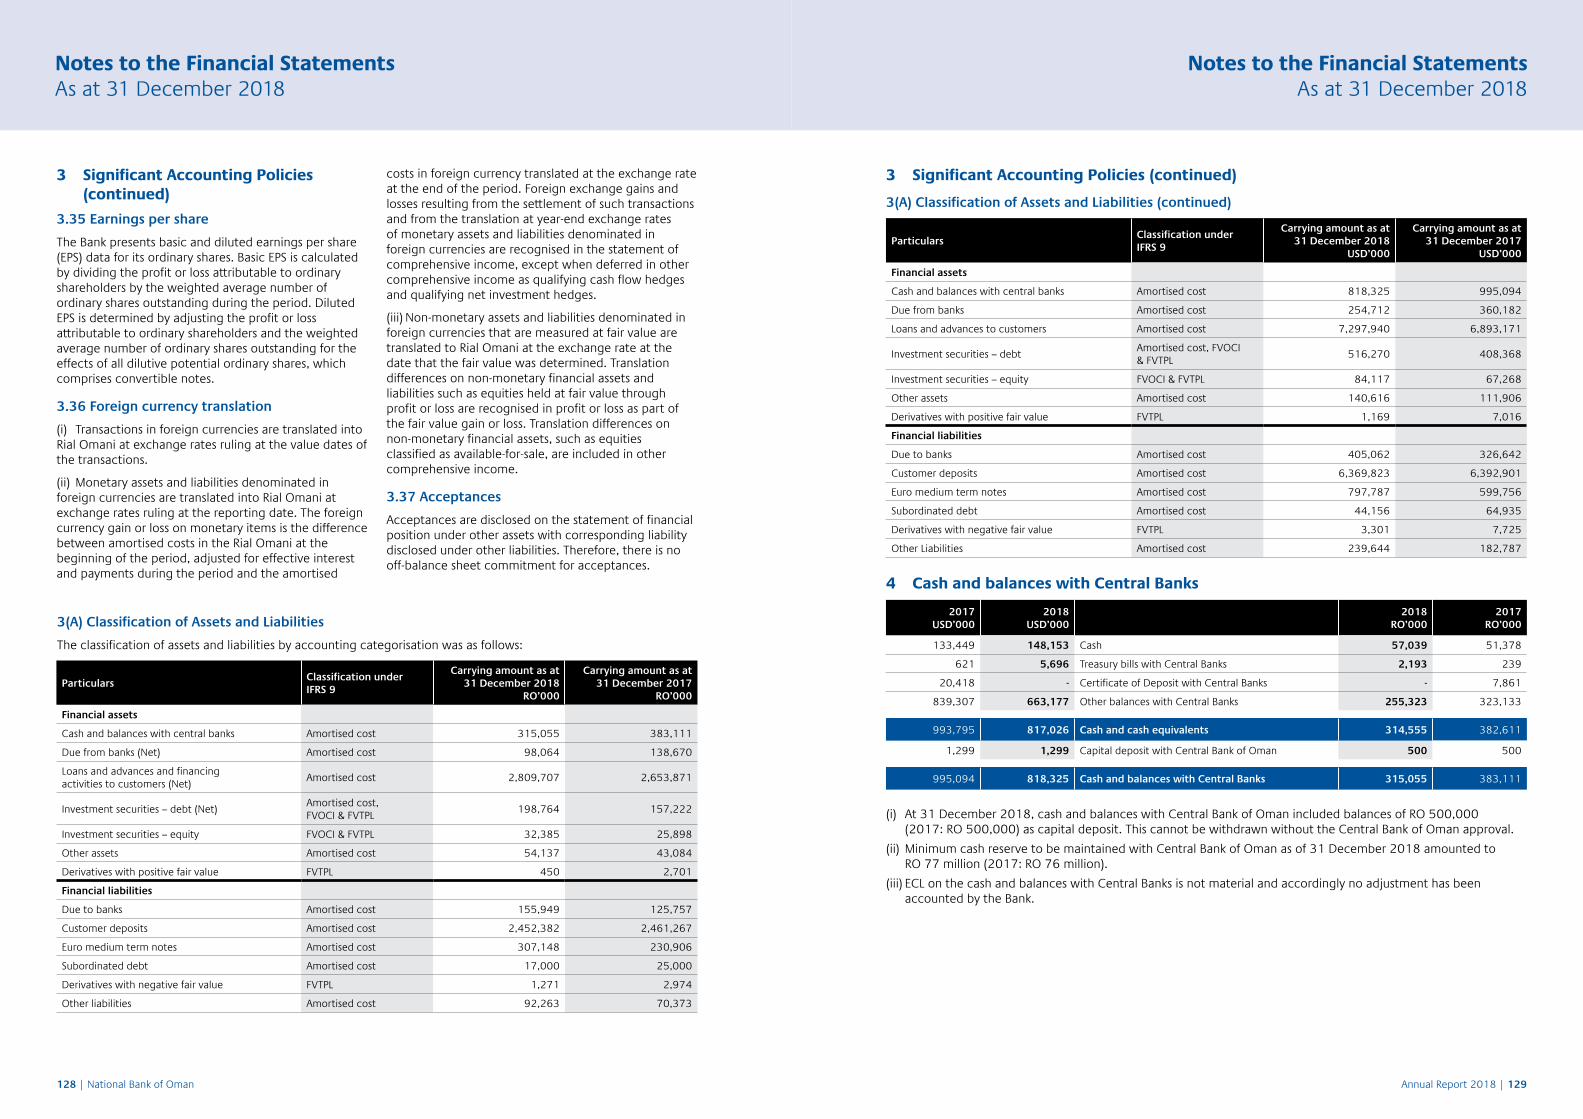
3 Significant Accounting Policies (continued)
3.35 Earnings per share
The Bank presents basic and diluted earnings per share (EPS) data for its ordinary shares. Basic EPS is calculated by dividing the profit or loss attributable to ordinary shareholders by the weighted average number of ordinary shares outstanding during the period. Diluted EPS is determined by adjusting the profit or loss attributable to ordinary shareholders and the weighted average number of ordinary shares outstanding for the effects of all dilutive potential ordinary shares, which comprises convertible notes.
3.36 Foreign currency translation
(i) Transactions in foreign currencies are translated into Rial Omani at exchange rates ruling at the value dates of the transactions.
(ii) Monetary assets and liabilities denominated in foreign currencies are translated into Rial Omani at exchange rates ruling at the reporting date. The foreign currency gain or loss on monetary items is the difference between amortised costs in the Rial Omani at the beginning of the period, adjusted for effective interest and payments during the period and the amortised
costs in foreign currency translated at the exchange rate at the end of the period. Foreign exchange gains and losses resulting from the settlement of such transactions and from the translation at year-end exchange rates of monetary assets and liabilities denominated in foreign currencies are recognised in the statement of comprehensive income, except when deferred in other comprehensive income as qualifying cash flow hedges and qualifying net investment hedges.
(iii) Non-monetary assets and liabilities denominated in foreign currencies that are measured at fair value are translated to Rial Omani at the exchange rate at the date that the fair value was determined. Translation differences on non-monetary financial assets and liabilities such as equities held at fair value through profit or loss are recognised in profit or loss as part of the fair value gain or loss. Translation differences on non-monetary financial assets, such as equities classified as available-for-sale, are included in other comprehensive income.
3.37 Acceptances
Acceptances are disclosed on the statement of financial position under other assets with corresponding liability disclosed under other liabilities. Therefore, there is no off-balance sheet commitment for acceptances.
ParticularsClassification under IFRS 9
Carrying amount as at 31 December 2018
RO’000
Carrying amount as at 31 December 2017
RO’000
Financial assets
Cash and balances with central banks Amortised cost 315,055 383,111
Due from banks (Net) Amortised cost 98,064 138,670
Loans and advances and financing activities to customers (Net)
Amortised cost 2,809,707 2,653,871
Investment securities – debt (Net)Amortised cost, FVOCI & FVTPL
198,764 157,222
Investment securities – equity FVOCI & FVTPL 32,385 25,898
Other assets Amortised cost 54,137 43,084
Derivatives with positive fair value FVTPL 450 2,701
Financial liabilities
Due to banks Amortised cost 155,949 125,757
Customer deposits Amortised cost 2,452,382 2,461,267
Euro medium term notes Amortised cost 307,148 230,906
Subordinated debt Amortised cost 17,000 25,000
Derivatives with negative fair value FVTPL 1,271 2,974
Other liabilities Amortised cost 92,263 70,373
3(A) Classification of Assets and Liabilities
The classification of assets and liabilities by accounting categorisation was as follows:
ParticularsClassification under IFRS 9
Carrying amount as at 31 December 2018
USD’000
Carrying amount as at 31 December 2017
USD’000
Financial assets
Cash and balances with central banks Amortised cost 818,325 995,094
Due from banks Amortised cost 254,712 360,182
Loans and advances to customers Amortised cost 7,297,940 6,893,171
Investment securities – debtAmortised cost, FVOCI & FVTPL
516,270 408,368
Investment securities – equity FVOCI & FVTPL 84,117 67,268
Other assets Amortised cost 140,616 111,906
Derivatives with positive fair value FVTPL 1,169 7,016
Financial liabilities
Due to banks Amortised cost 405,062 326,642
Customer deposits Amortised cost 6,369,823 6,392,901
Euro medium term notes Amortised cost 797,787 599,756
Subordinated debt Amortised cost 44,156 64,935
Derivatives with negative fair value FVTPL 3,301 7,725
Other Liabilities Amortised cost 239,644 182,787
3 Significant Accounting Policies (continued)
3(A) Classification of Assets and Liabilities (continued)
4 Cash and balances with Central Banks
2017 USD’000
2018 USD’000
2018 RO’000
2017 RO’000
133,449 148,153 Cash 57,039 51,378
621 5,696 Treasury bills with Central Banks 2,193 239
20,418 - Certificate of Deposit with Central Banks - 7,861
839,307 663,177 Other balances with Central Banks 255,323 323,133
993,795 817,026 Cash and cash equivalents 314,555 382,611
1,299 1,299 Capital deposit with Central Bank of Oman 500 500
995,094 818,325 Cash and balances with Central Banks 315,055 383,111
(i) At 31 December 2018, cash and balances with Central Bank of Oman included balances of RO 500,000 (2017: RO 500,000) as capital deposit. This cannot be withdrawn without the Central Bank of Oman approval.
(ii) Minimum cash reserve to be maintained with Central Bank of Oman as of 31 December 2018 amounted to RO 77 million (2017: RO 76 million).
(iii) ECL on the cash and balances with Central Banks is not material and accordingly no adjustment has been accounted by the Bank.
128 | National Bank of Oman Annual Report 2018 | 129
Notes to the Financial StatementsAs at 31 December 2018
Notes to the Financial StatementsAs at 31 December 2018
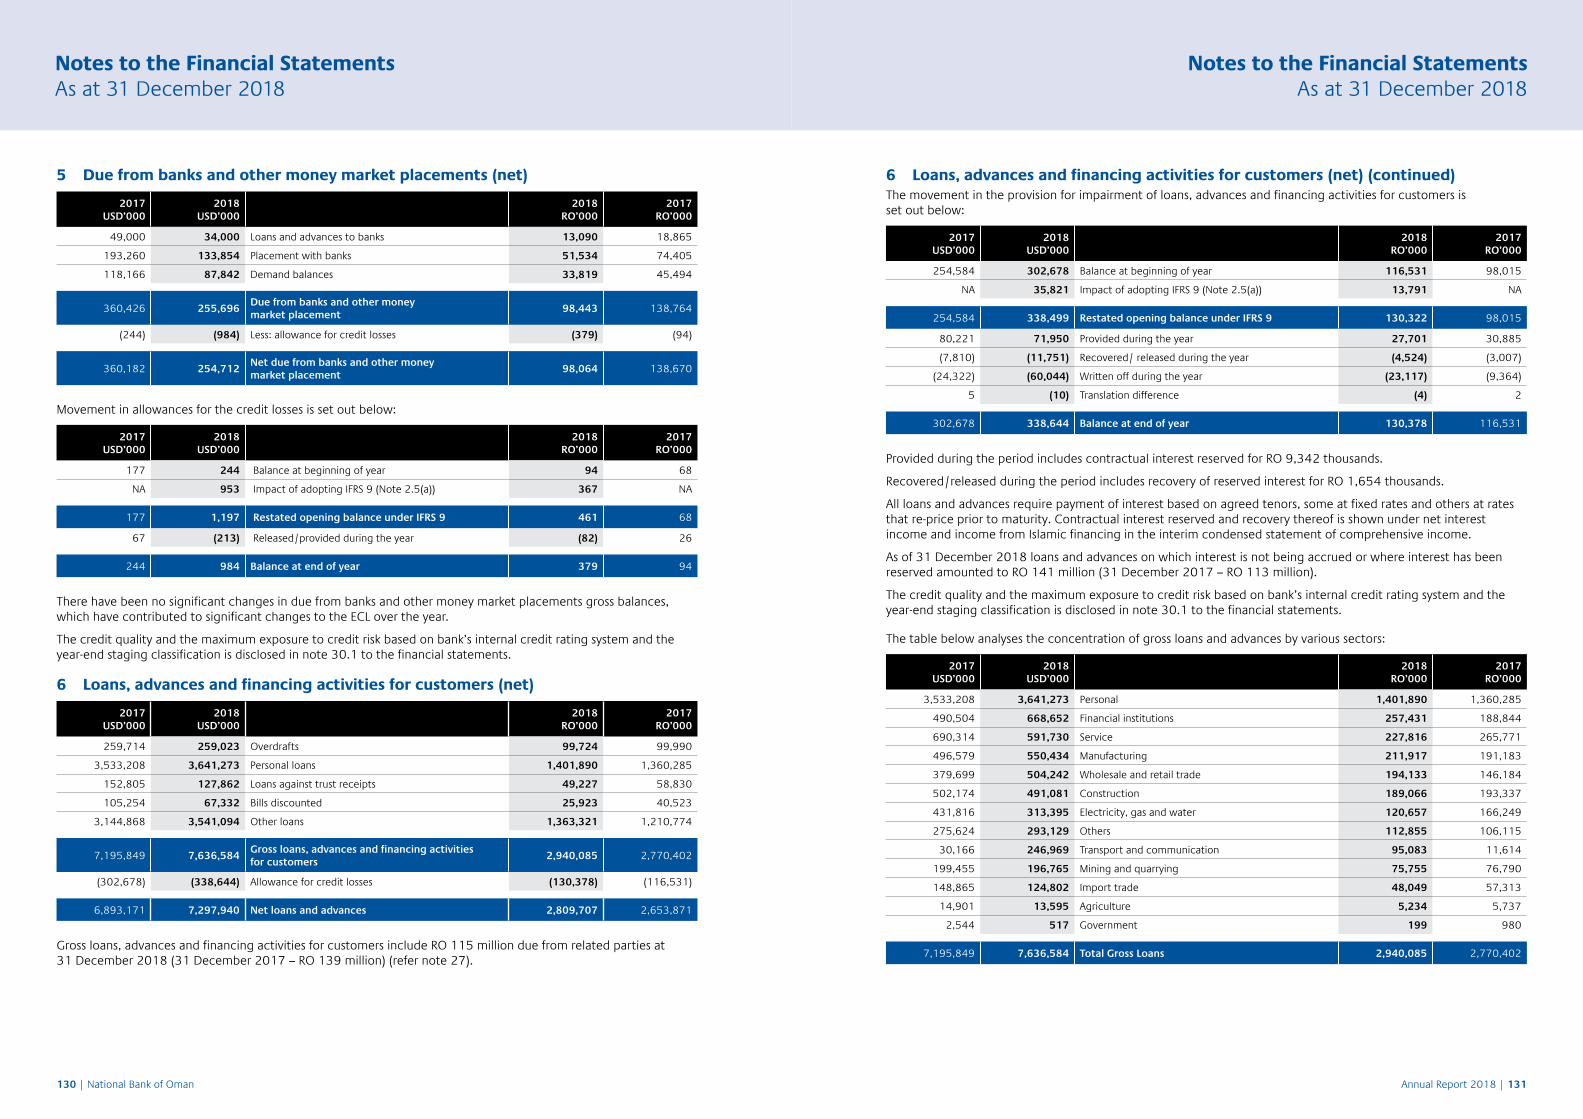
5 Due from banks and other money market placements (net)
6 Loans, advances and financing activities for customers (net)
2017 USD’000
2018 USD’000
2018 RO’000
2017 RO’000
49,000 34,000 Loans and advances to banks 13,090 18,865
193,260 133,854 Placement with banks 51,534 74,405
118,166 87,842 Demand balances 33,819 45,494
360,426 255,696Due from banks and other money market placement
98,443 138,764
(244) (984) Less: allowance for credit losses (379) (94)
360,182 254,712Net due from banks and other money market placement
98,064 138,670
2017 USD’000
2018 USD’000
2018 RO’000
2017 RO’000
259,714 259,023 Overdrafts 99,724 99,990
3,533,208 3,641,273 Personal loans 1,401,890 1,360,285
152,805 127,862 Loans against trust receipts 49,227 58,830
105,254 67,332 Bills discounted 25,923 40,523
3,144,868 3,541,094 Other loans 1,363,321 1,210,774
7,195,849 7,636,584 Gross loans, advances and financing activities for customers
2,940,085 2,770,402
(302,678) (338,644) Allowance for credit losses (130,378) (116,531)
6,893,171 7,297,940 Net loans and advances 2,809,707 2,653,871
2017 USD’000
2018 USD’000
2018 RO’000
2017 RO’000
177 244 Balance at beginning of year 94 68
NA 953 Impact of adopting IFRS 9 (Note 2.5(a)) 367 NA
177 1,197 Restated opening balance under IFRS 9 461 68
67 (213) Released/provided during the year (82) 26
244 984 Balance at end of year 379 94
Movement in allowances for the credit losses is set out below:
There have been no significant changes in due from banks and other money market placements gross balances, which have contributed to significant changes to the ECL over the year.
The credit quality and the maximum exposure to credit risk based on bank’s internal credit rating system and the year-end staging classification is disclosed in note 30.1 to the financial statements.
Gross loans, advances and financing activities for customers include RO 115 million due from related parties at 31 December 2018 (31 December 2017 – RO 139 million) (refer note 27).
6 Loans, advances and financing activities for customers (net) (continued)The movement in the provision for impairment of loans, advances and financing activities for customers is set out below:
Provided during the period includes contractual interest reserved for RO 9,342 thousands.
Recovered/released during the period includes recovery of reserved interest for RO 1,654 thousands.
All loans and advances require payment of interest based on agreed tenors, some at fixed rates and others at rates that re-price prior to maturity. Contractual interest reserved and recovery thereof is shown under net interest income and income from Islamic financing in the interim condensed statement of comprehensive income.
As of 31 December 2018 loans and advances on which interest is not being accrued or where interest has been reserved amounted to RO 141 million (31 December 2017 – RO 113 million).
The credit quality and the maximum exposure to credit risk based on bank’s internal credit rating system and the year-end staging classification is disclosed in note 30.1 to the financial statements.
2017 USD’000
2018 USD’000
2018 RO’000
2017 RO’000
254,584 302,678 Balance at beginning of year 116,531 98,015
NA 35,821 Impact of adopting IFRS 9 (Note 2.5(a)) 13,791 NA
254,584 338,499 Restated opening balance under IFRS 9 130,322 98,015
80,221 71,950 Provided during the year 27,701 30,885
(7,810) (11,751) Recovered/ released during the year (4,524) (3,007)
(24,322) (60,044) Written off during the year (23,117) (9,364)
5 (10) Translation difference (4) 2
302,678 338,644 Balance at end of year 130,378 116,531
2017 USD’000
2018 USD’000
2018 RO’000
2017 RO’000
3,533,208 3,641,273 Personal 1,401,890 1,360,285
490,504 668,652 Financial institutions 257,431 188,844
690,314 591,730 Service 227,816 265,771
496,579 550,434 Manufacturing 211,917 191,183
379,699 504,242 Wholesale and retail trade 194,133 146,184
502,174 491,081 Construction 189,066 193,337
431,816 313,395 Electricity, gas and water 120,657 166,249
275,624 293,129 Others 112,855 106,115
30,166 246,969 Transport and communication 95,083 11,614
199,455 196,765 Mining and quarrying 75,755 76,790
148,865 124,802 Import trade 48,049 57,313
14,901 13,595 Agriculture 5,234 5,737
2,544 517 Government 199 980
7,195,849 7,636,584 Total Gross Loans 2,940,085 2,770,402
The table below analyses the concentration of gross loans and advances by various sectors:
130 | National Bank of Oman Annual Report 2018 | 131
Notes to the Financial StatementsAs at 31 December 2018
Notes to the Financial StatementsAs at 31 December 2018
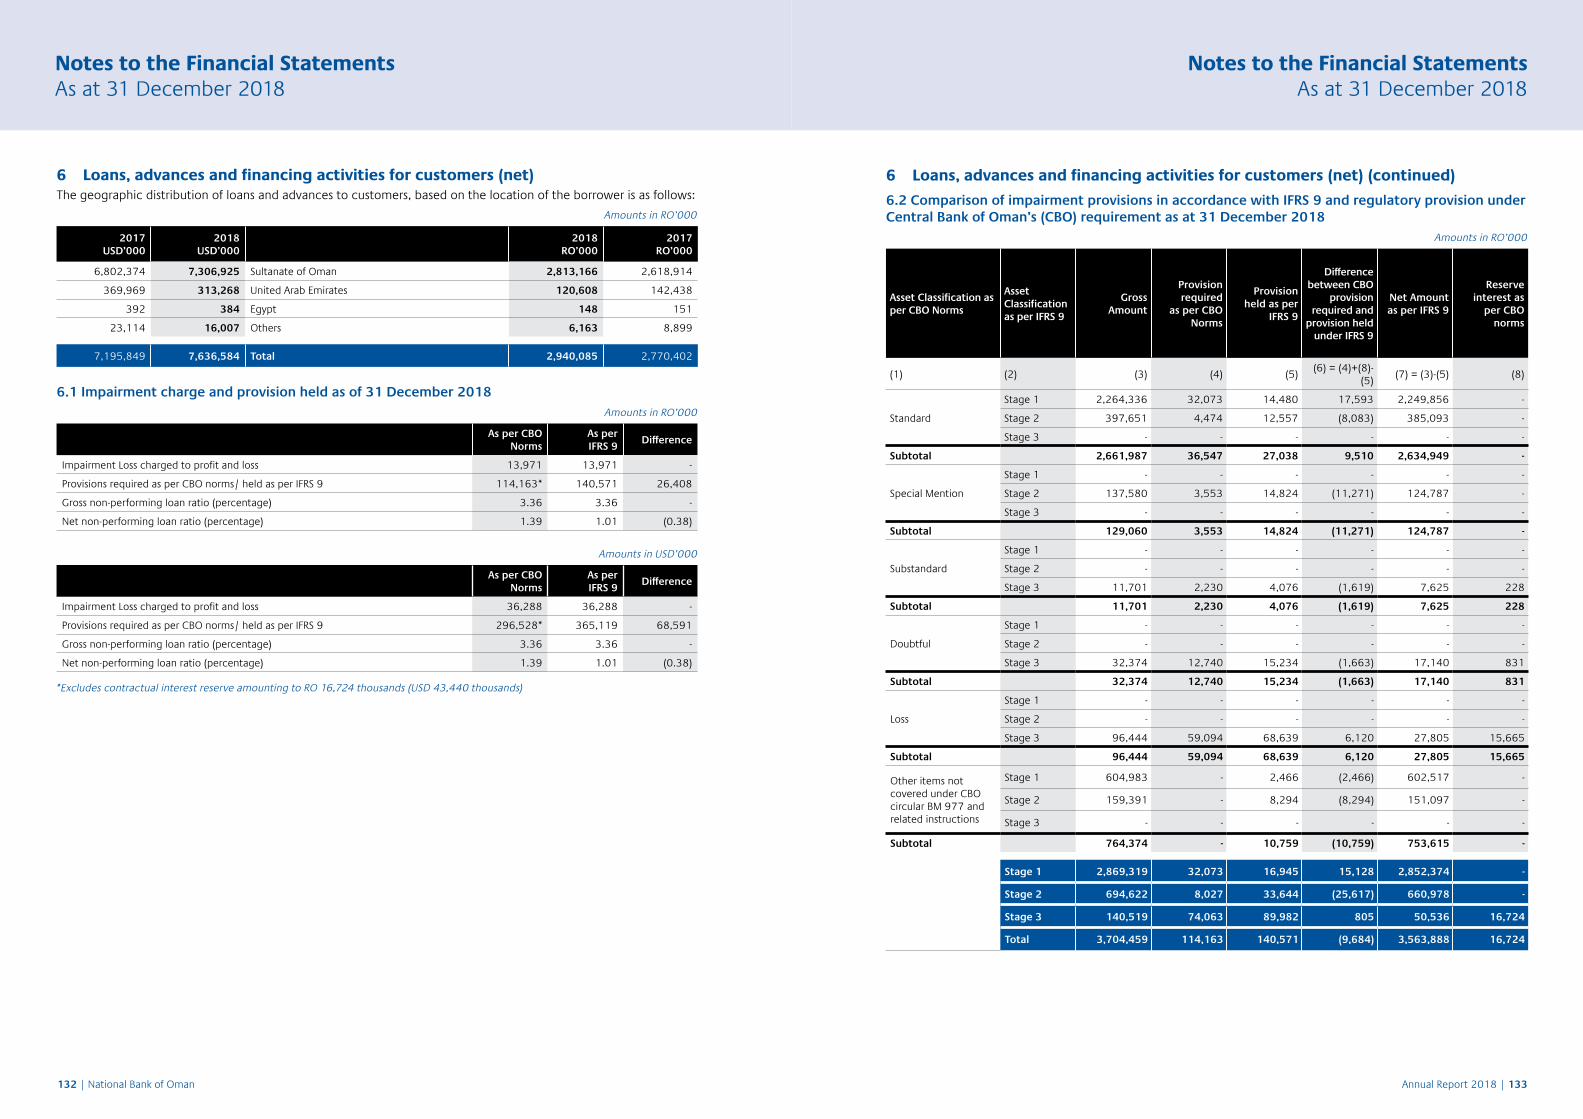
6 Loans, advances and financing activities for customers (net)The geographic distribution of loans and advances to customers, based on the location of the borrower is as follows:
2017 USD’000
2018 USD’000
2018 RO’000
2017 RO’000
6,802,374 7,306,925 Sultanate of Oman 2,813,166 2,618,914
369,969 313,268 United Arab Emirates 120,608 142,438
392 384 Egypt 148 151
23,114 16,007 Others 6,163 8,899
7,195,849 7,636,584 Total 2,940,085 2,770,402
6.1 Impairment charge and provision held as of 31 December 2018
As per CBO Norms
As per IFRS 9
Difference
Impairment Loss charged to profit and loss 13,971 13,971 -
Provisions required as per CBO norms/ held as per IFRS 9 114,163* 140,571 26,408
Gross non-performing loan ratio (percentage) 3.36 3.36 -
Net non-performing loan ratio (percentage) 1.39 1.01 (0.38)
As per CBO Norms
As per IFRS 9
Difference
Impairment Loss charged to profit and loss 36,288 36,288 -
Provisions required as per CBO norms/ held as per IFRS 9 296,528* 365,119 68,591
Gross non-performing loan ratio (percentage) 3.36 3.36 -
Net non-performing loan ratio (percentage) 1.39 1.01 (0.38)
Amounts in RO’000
Amounts in RO’000
Amounts in USD’000
*Excludes contractual interest reserve amounting to RO 16,724 thousands (USD 43,440 thousands)
6 Loans, advances and financing activities for customers (net) (continued)
6.2 Comparison of impairment provisions in accordance with IFRS 9 and regulatory provision under Central Bank of Oman’s (CBO) requirement as at 31 December 2018
Asset Classification as per CBO Norms
Asset Classification as per IFRS 9
Gross Amount
Provision required
as per CBO Norms
Provision held as per
IFRS 9
Difference between CBO
provision required and
provision held under IFRS 9
Net Amount as per IFRS 9
Reserve interest as
per CBO norms
(1) (2) (3) (4) (5)(6) = (4)+(8)-
(5)(7) = (3)-(5) (8)
Standard
Stage 1 2,264,336 32,073 14,480 17,593 2,249,856 -
Stage 2 397,651 4,474 12,557 (8,083) 385,093 -
Stage 3 - - - - - -
Subtotal 2,661,987 36,547 27,038 9,510 2,634,949 -
Special Mention
Stage 1 - - - - - -
Stage 2 137,580 3,553 14,824 (11,271) 124,787 -
Stage 3 - - - - - -
Subtotal 129,060 3,553 14,824 (11,271) 124,787 -
Substandard
Stage 1 - - - - - -
Stage 2 - - - - - -
Stage 3 11,701 2,230 4,076 (1,619) 7,625 228
Subtotal 11,701 2,230 4,076 (1,619) 7,625 228
Doubtful
Stage 1 - - - - - -
Stage 2 - - - - - -
Stage 3 32,374 12,740 15,234 (1,663) 17,140 831
Subtotal 32,374 12,740 15,234 (1,663) 17,140 831
Loss
Stage 1 - - - - - -
Stage 2 - - - - - -
Stage 3 96,444 59,094 68,639 6,120 27,805 15,665
Subtotal 96,444 59,094 68,639 6,120 27,805 15,665
Other items not covered under CBO circular BM 977 and related instructions
Stage 1 604,983 - 2,466 (2,466) 602,517 -
Stage 2 159,391 - 8,294 (8,294) 151,097 -
Stage 3 - - - - - -
Subtotal 764,374 - 10,759 (10,759) 753,615 -
Stage 1 2,869,319 32,073 16,945 15,128 2,852,374 -
Stage 2 694,622 8,027 33,644 (25,617) 660,978 -
Stage 3 140,519 74,063 89,982 805 50,536 16,724
Total 3,704,459 114,163 140,571 (9,684) 3,563,888 16,724
Amounts in RO’000
132 | National Bank of Oman Annual Report 2018 | 133
Notes to the Financial StatementsAs at 31 December 2018
Notes to the Financial StatementsAs at 31 December 2018
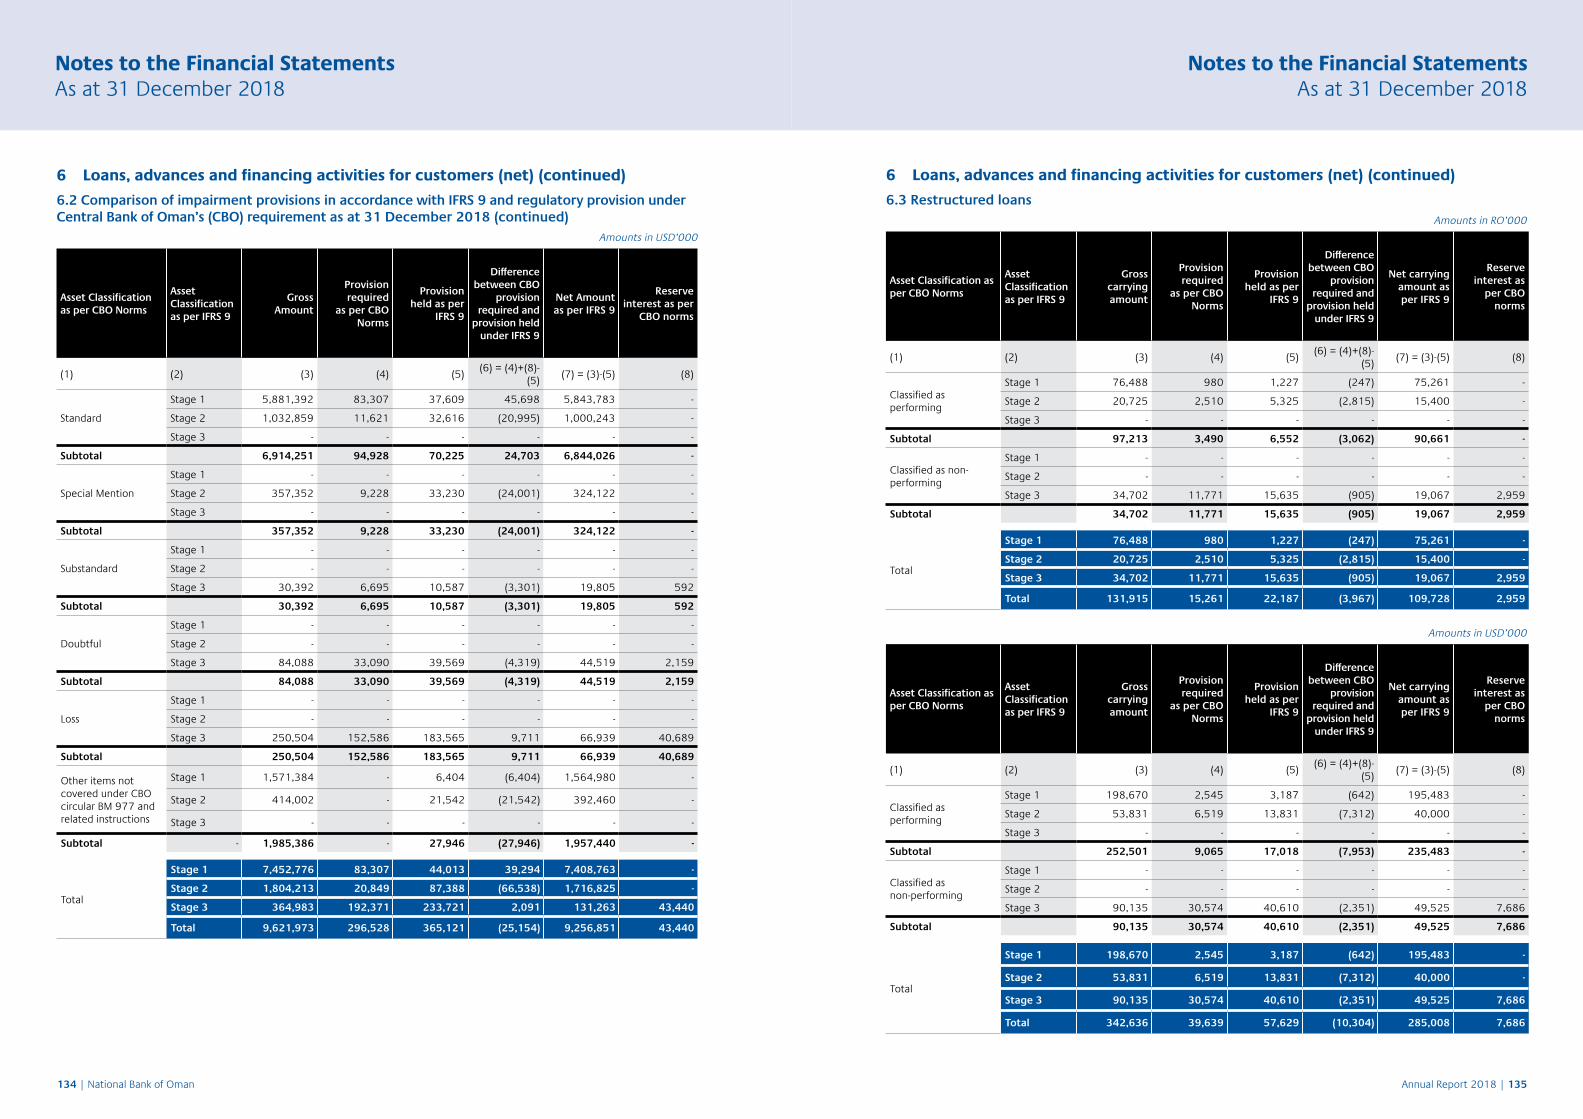
6 Loans, advances and financing activities for customers (net) (continued)
6.2 Comparison of impairment provisions in accordance with IFRS 9 and regulatory provision under Central Bank of Oman’s (CBO) requirement as at 31 December 2018 (continued)
Asset Classification as per CBO Norms
Asset Classification as per IFRS 9
Gross Amount
Provision required
as per CBO Norms
Provision held as per
IFRS 9
Difference between CBO
provision required and
provision held under IFRS 9
Net Amount as per IFRS 9
Reserve interest as per
CBO norms
(1) (2) (3) (4) (5)(6) = (4)+(8)-
(5)(7) = (3)-(5) (8)
Standard
Stage 1 5,881,392 83,307 37,609 45,698 5,843,783 -
Stage 2 1,032,859 11,621 32,616 (20,995) 1,000,243 -
Stage 3 - - - - - -
Subtotal 6,914,251 94,928 70,225 24,703 6,844,026 -
Special Mention
Stage 1 - - - - - -
Stage 2 357,352 9,228 33,230 (24,001) 324,122 -
Stage 3 - - - - - -
Subtotal 357,352 9,228 33,230 (24,001) 324,122 -
Substandard
Stage 1 - - - - - -
Stage 2 - - - - - -
Stage 3 30,392 6,695 10,587 (3,301) 19,805 592
Subtotal 30,392 6,695 10,587 (3,301) 19,805 592
Doubtful
Stage 1 - - - - - -
Stage 2 - - - - - -
Stage 3 84,088 33,090 39,569 (4,319) 44,519 2,159
Subtotal 84,088 33,090 39,569 (4,319) 44,519 2,159
Loss
Stage 1 - - - - - -
Stage 2 - - - - - -
Stage 3 250,504 152,586 183,565 9,711 66,939 40,689
Subtotal 250,504 152,586 183,565 9,711 66,939 40,689
Other items not covered under CBO circular BM 977 and related instructions
Stage 1 1,571,384 - 6,404 (6,404) 1,564,980 -
Stage 2 414,002 - 21,542 (21,542) 392,460 -
Stage 3 - - - - - -
Subtotal - 1,985,386 - 27,946 (27,946) 1,957,440 -
Total
Stage 1 7,452,776 83,307 44,013 39,294 7,408,763 -
Stage 2 1,804,213 20,849 87,388 (66,538) 1,716,825 -
Stage 3 364,983 192,371 233,721 2,091 131,263 43,440
Total 9,621,973 296,528 365,121 (25,154) 9,256,851 43,440
Amounts in USD’000
6 Loans, advances and financing activities for customers (net) (continued)
6.3 Restructured loans
Asset Classification as per CBO Norms
Asset Classification as per IFRS 9
Gross carrying amount
Provision required
as per CBO Norms
Provision held as per
IFRS 9
Difference between CBO
provision required and
provision held under IFRS 9
Net carrying amount as per IFRS 9
Reserve interest as
per CBO norms
(1) (2) (3) (4) (5)(6) = (4)+(8)-
(5)(7) = (3)-(5) (8)
Classified as performing
Stage 1 76,488 980 1,227 (247) 75,261 -
Stage 2 20,725 2,510 5,325 (2,815) 15,400 -
Stage 3 - - - - - -
Subtotal 97,213 3,490 6,552 (3,062) 90,661 -
Classified as non-performing
Stage 1 - - - - - -
Stage 2 - - - - - -
Stage 3 34,702 11,771 15,635 (905) 19,067 2,959
Subtotal 34,702 11,771 15,635 (905) 19,067 2,959
Total
Stage 1 76,488 980 1,227 (247) 75,261 -
Stage 2 20,725 2,510 5,325 (2,815) 15,400 -
Stage 3 34,702 11,771 15,635 (905) 19,067 2,959
Total 131,915 15,261 22,187 (3,967) 109,728 2,959
Asset Classification as per CBO Norms
Asset Classification as per IFRS 9
Gross carrying amount
Provision required
as per CBO Norms
Provision held as per
IFRS 9
Difference between CBO
provision required and
provision held under IFRS 9
Net carrying amount as per IFRS 9
Reserve interest as
per CBO norms
(1) (2) (3) (4) (5)(6) = (4)+(8)-
(5)(7) = (3)-(5) (8)
Classified as performing
Stage 1 198,670 2,545 3,187 (642) 195,483 -
Stage 2 53,831 6,519 13,831 (7,312) 40,000 -
Stage 3 - - - - - -
Subtotal 252,501 9,065 17,018 (7,953) 235,483 -
Classified as non-performing
Stage 1 - - - - - -
Stage 2 - - - - - -
Stage 3 90,135 30,574 40,610 (2,351) 49,525 7,686
Subtotal 90,135 30,574 40,610 (2,351) 49,525 7,686
Total
Stage 1 198,670 2,545 3,187 (642) 195,483 -
Stage 2 53,831 6,519 13,831 (7,312) 40,000 -
Stage 3 90,135 30,574 40,610 (2,351) 49,525 7,686
Total 342,636 39,639 57,629 (10,304) 285,008 7,686
Amounts in RO’000
Amounts in USD’000
134 | National Bank of Oman Annual Report 2018 | 135
Notes to the Financial StatementsAs at 31 December 2018
Notes to the Financial StatementsAs at 31 December 2018
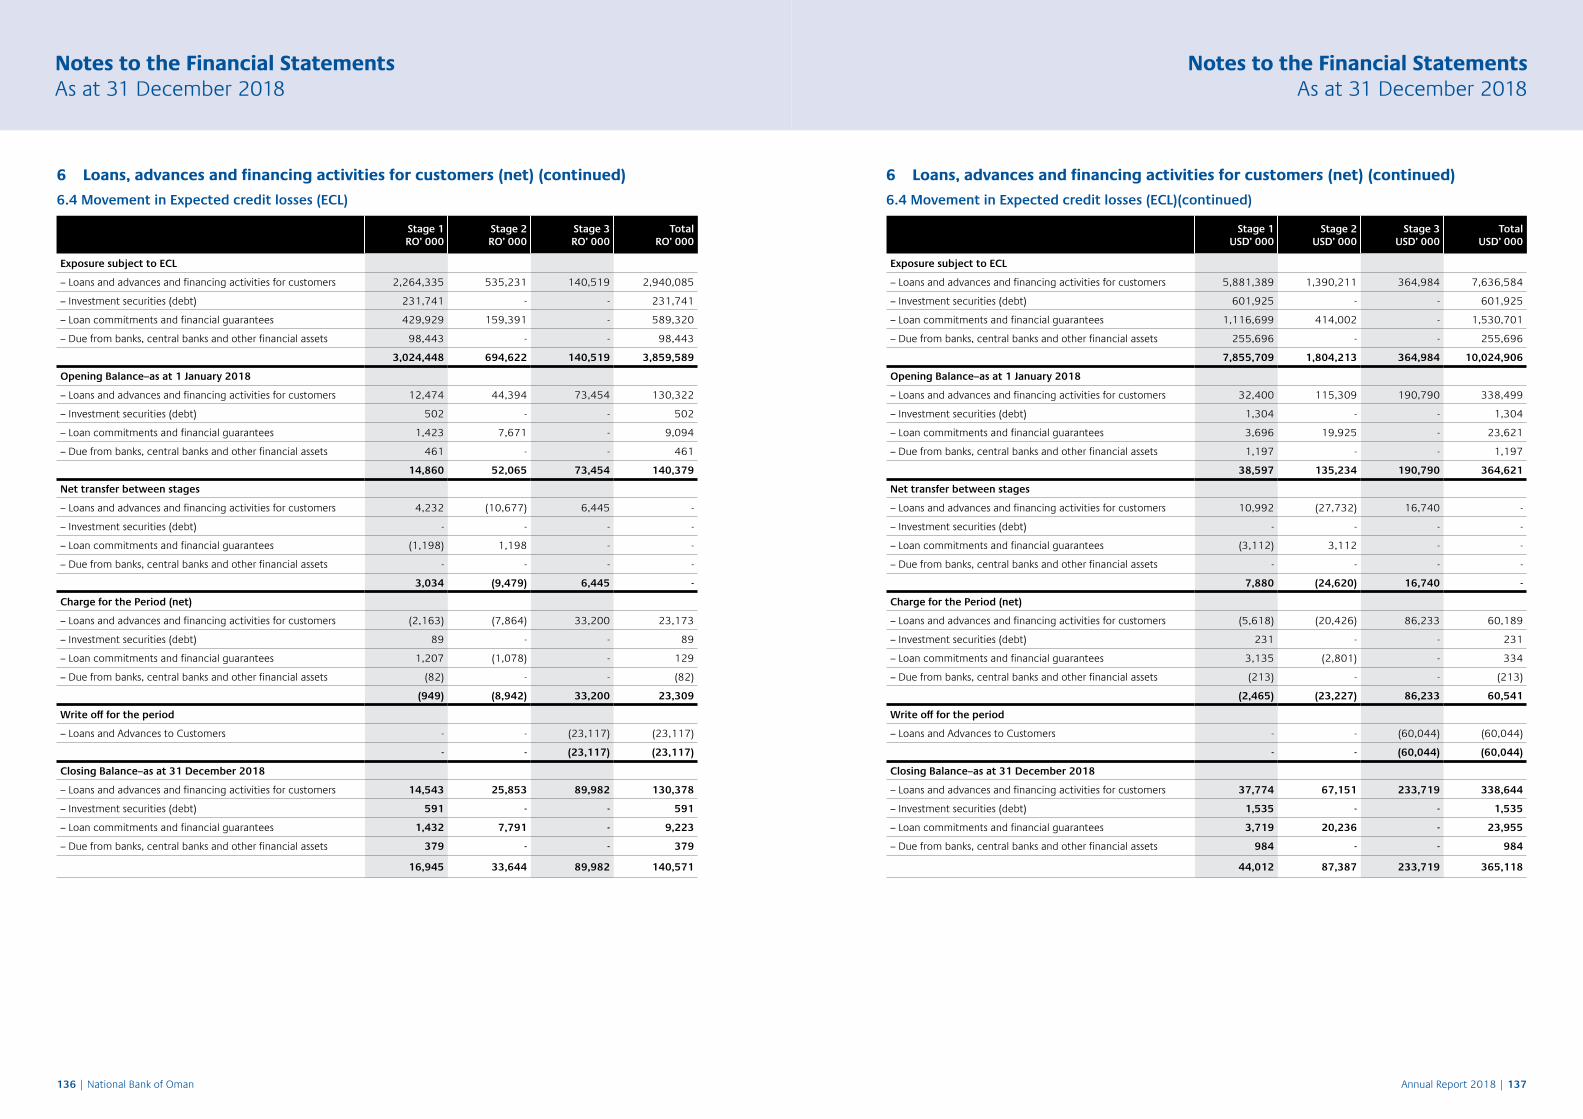
6 Loans, advances and financing activities for customers (net) (continued)
6.4 Movement in Expected credit losses (ECL)
Stage 1 RO’ 000
Stage 2 RO’ 000
Stage 3 RO’ 000
Total RO’ 000
Exposure subject to ECL
– Loans and advances and financing activities for customers 2,264,335 535,231 140,519 2,940,085
– Investment securities (debt) 231,741 - - 231,741
– Loan commitments and financial guarantees 429,929 159,391 - 589,320
– Due from banks, central banks and other financial assets 98,443 - - 98,443
3,024,448 694,622 140,519 3,859,589
Opening Balance–as at 1 January 2018
– Loans and advances and financing activities for customers 12,474 44,394 73,454 130,322
– Investment securities (debt) 502 - - 502
– Loan commitments and financial guarantees 1,423 7,671 - 9,094
– Due from banks, central banks and other financial assets 461 - - 461
14,860 52,065 73,454 140,379
Net transfer between stages
– Loans and advances and financing activities for customers 4,232 (10,677) 6,445 -
– Investment securities (debt) - - - -
– Loan commitments and financial guarantees (1,198) 1,198 - -
– Due from banks, central banks and other financial assets - - - -
3,034 (9,479) 6,445 -
Charge for the Period (net)
– Loans and advances and financing activities for customers (2,163) (7,864) 33,200 23,173
– Investment securities (debt) 89 - - 89
– Loan commitments and financial guarantees 1,207 (1,078) - 129
– Due from banks, central banks and other financial assets (82) - - (82)
(949) (8,942) 33,200 23,309
Write off for the period
– Loans and Advances to Customers - - (23,117) (23,117)
- - (23,117) (23,117)
Closing Balance–as at 31 December 2018
– Loans and advances and financing activities for customers 14,543 25,853 89,982 130,378
– Investment securities (debt) 591 - - 591
– Loan commitments and financial guarantees 1,432 7,791 - 9,223
– Due from banks, central banks and other financial assets 379 - - 379
16,945 33,644 89,982 140,571
6 Loans, advances and financing activities for customers (net) (continued)
6.4 Movement in Expected credit losses (ECL)(continued)
Stage 1 USD’ 000
Stage 2 USD’ 000
Stage 3 USD’ 000
Total USD’ 000
Exposure subject to ECL
– Loans and advances and financing activities for customers 5,881,389 1,390,211 364,984 7,636,584
– Investment securities (debt) 601,925 - - 601,925
– Loan commitments and financial guarantees 1,116,699 414,002 - 1,530,701
– Due from banks, central banks and other financial assets 255,696 - - 255,696
7,855,709 1,804,213 364,984 10,024,906
Opening Balance–as at 1 January 2018
– Loans and advances and financing activities for customers 32,400 115,309 190,790 338,499
– Investment securities (debt) 1,304 - - 1,304
– Loan commitments and financial guarantees 3,696 19,925 - 23,621
– Due from banks, central banks and other financial assets 1,197 - - 1,197
38,597 135,234 190,790 364,621
Net transfer between stages
– Loans and advances and financing activities for customers 10,992 (27,732) 16,740 -
– Investment securities (debt) - - - -
– Loan commitments and financial guarantees (3,112) 3,112 - -
– Due from banks, central banks and other financial assets - - - -
7,880 (24,620) 16,740 -
Charge for the Period (net)
– Loans and advances and financing activities for customers (5,618) (20,426) 86,233 60,189
– Investment securities (debt) 231 - - 231
– Loan commitments and financial guarantees 3,135 (2,801) - 334
– Due from banks, central banks and other financial assets (213) - - (213)
(2,465) (23,227) 86,233 60,541
Write off for the period
– Loans and Advances to Customers - - (60,044) (60,044)
- - (60,044) (60,044)
Closing Balance–as at 31 December 2018
– Loans and advances and financing activities for customers 37,774 67,151 233,719 338,644
– Investment securities (debt) 1,535 - - 1,535
– Loan commitments and financial guarantees 3,719 20,236 - 23,955
– Due from banks, central banks and other financial assets 984 - - 984
44,012 87,387 233,719 365,118
136 | National Bank of Oman Annual Report 2018 | 137
Notes to the Financial StatementsAs at 31 December 2018
Notes to the Financial StatementsAs at 31 December 2018
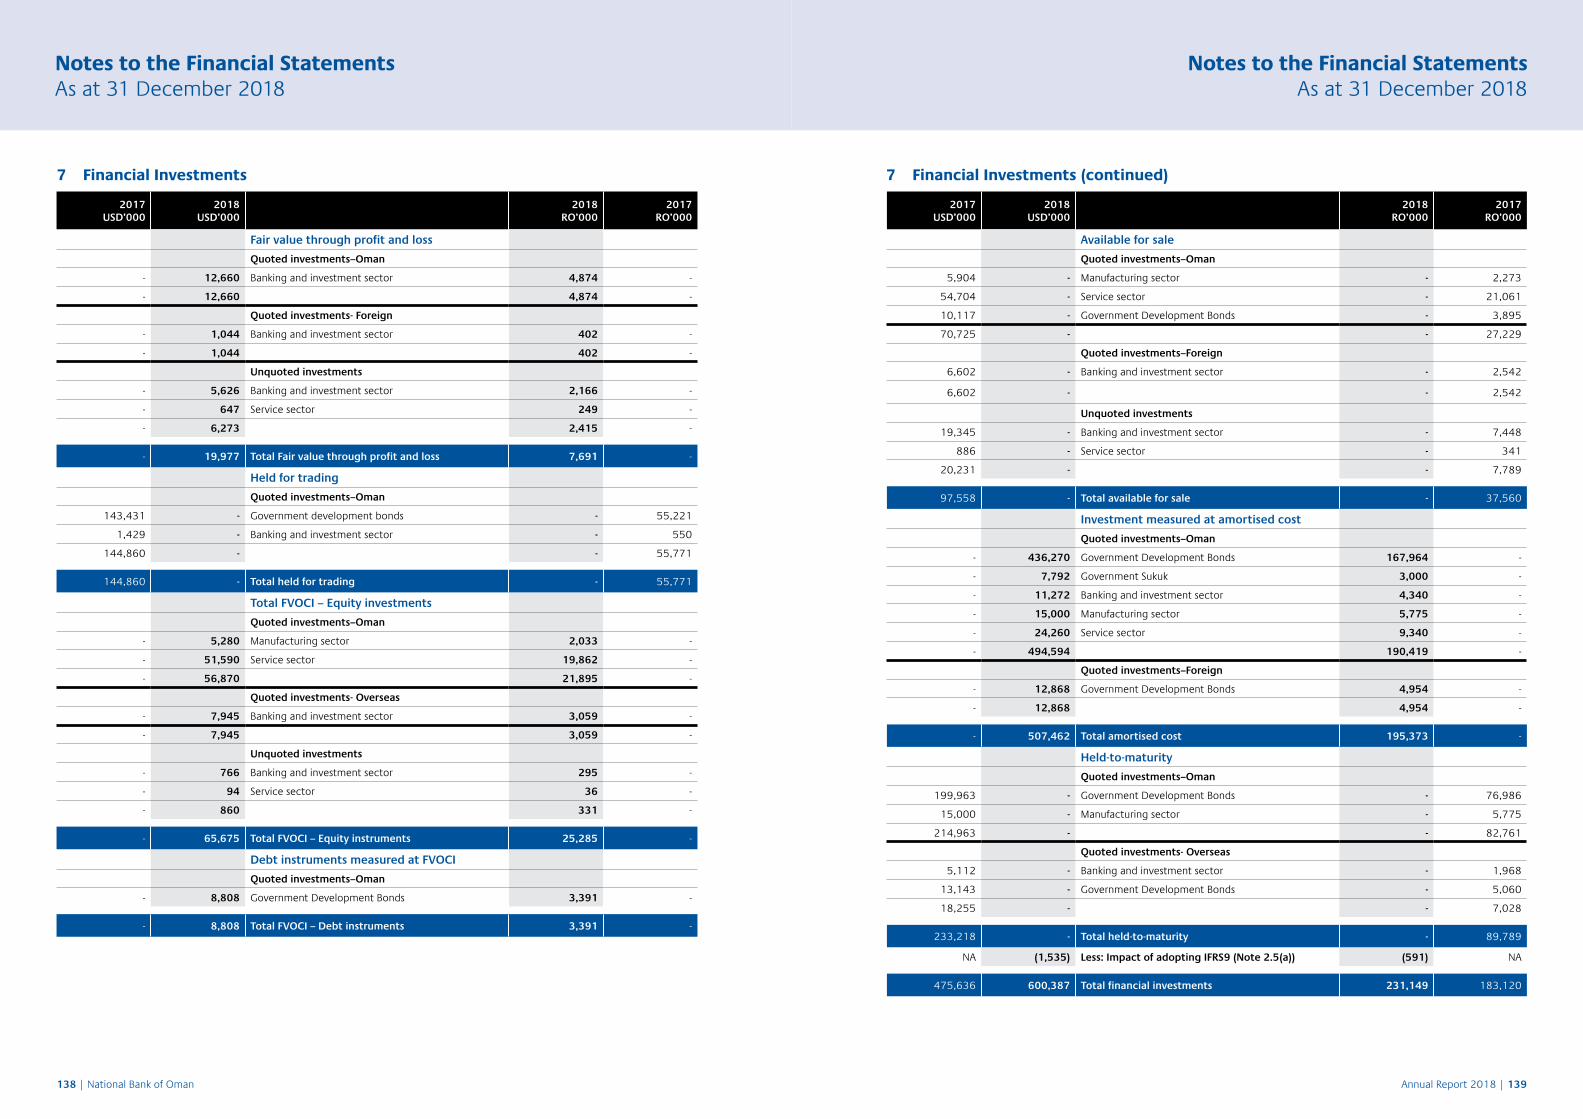
7 Financial Investments
2017USD’000
2018USD’000
2018RO’000
2017RO’000
Fair value through profit and loss
Quoted investments–Oman
- 12,660 Banking and investment sector 4,874 -
- 12,660 4,874 -
Quoted investments- Foreign
- 1,044 Banking and investment sector 402 -
- 1,044 402 -
Unquoted investments
- 5,626 Banking and investment sector 2,166 -
- 647 Service sector 249 -
- 6,273 2,415 -
- 19,977 Total Fair value through profit and loss 7,691 -
Held for trading
Quoted investments–Oman
143,431 - Government development bonds - 55,221
1,429 - Banking and investment sector - 550
144,860 - - 55,771
144,860 - Total held for trading - 55,771
Total FVOCI – Equity investments
Quoted investments–Oman
- 5,280 Manufacturing sector 2,033 -
- 51,590 Service sector 19,862 -
- 56,870 21,895 -
Quoted investments- Overseas
- 7,945 Banking and investment sector 3,059 -
- 7,945 3,059 -
Unquoted investments
- 766 Banking and investment sector 295 -
- 94 Service sector 36 -
- 860 331 -
- 65,675 Total FVOCI – Equity instruments 25,285 -
Debt instruments measured at FVOCI
Quoted investments–Oman
- 8,808 Government Development Bonds 3,391 -
- 8,808 Total FVOCI – Debt instruments 3,391 -
7 Financial Investments (continued)
2017USD’000
2018USD’000
2018RO’000
2017RO’000
Available for sale
Quoted investments–Oman
5,904 - Manufacturing sector - 2,273
54,704 - Service sector - 21,061
10,117 - Government Development Bonds - 3,895
70,725 - - 27,229
Quoted investments–Foreign
6,602 - Banking and investment sector - 2,542
6,602 - - 2,542
Unquoted investments
19,345 - Banking and investment sector - 7,448
886 - Service sector - 341
20,231 - - 7,789
97,558 - Total available for sale - 37,560
Investment measured at amortised cost
Quoted investments–Oman
- 436,270 Government Development Bonds 167,964 -
- 7,792 Government Sukuk 3,000 -
- 11,272 Banking and investment sector 4,340 -
- 15,000 Manufacturing sector 5,775 -
- 24,260 Service sector 9,340 -
- 494,594 190,419 -
Quoted investments–Foreign
- 12,868 Government Development Bonds 4,954 -
- 12,868 4,954 -
- 507,462 Total amortised cost 195,373 -
Held-to-maturity
Quoted investments–Oman
199,963 - Government Development Bonds - 76,986
15,000 - Manufacturing sector - 5,775
214,963 - - 82,761
Quoted investments- Overseas
5,112 - Banking and investment sector - 1,968
13,143 - Government Development Bonds - 5,060
18,255 - - 7,028
233,218 - Total held-to-maturity - 89,789
NA (1,535) Less: Impact of adopting IFRS9 (Note 2.5(a)) (591) NA
475,636 600,387 Total financial investments 231,149 183,120
138 | National Bank of Oman Annual Report 2018 | 139
Notes to the Financial StatementsAs at 31 December 2018
Notes to the Financial StatementsAs at 31 December 2018
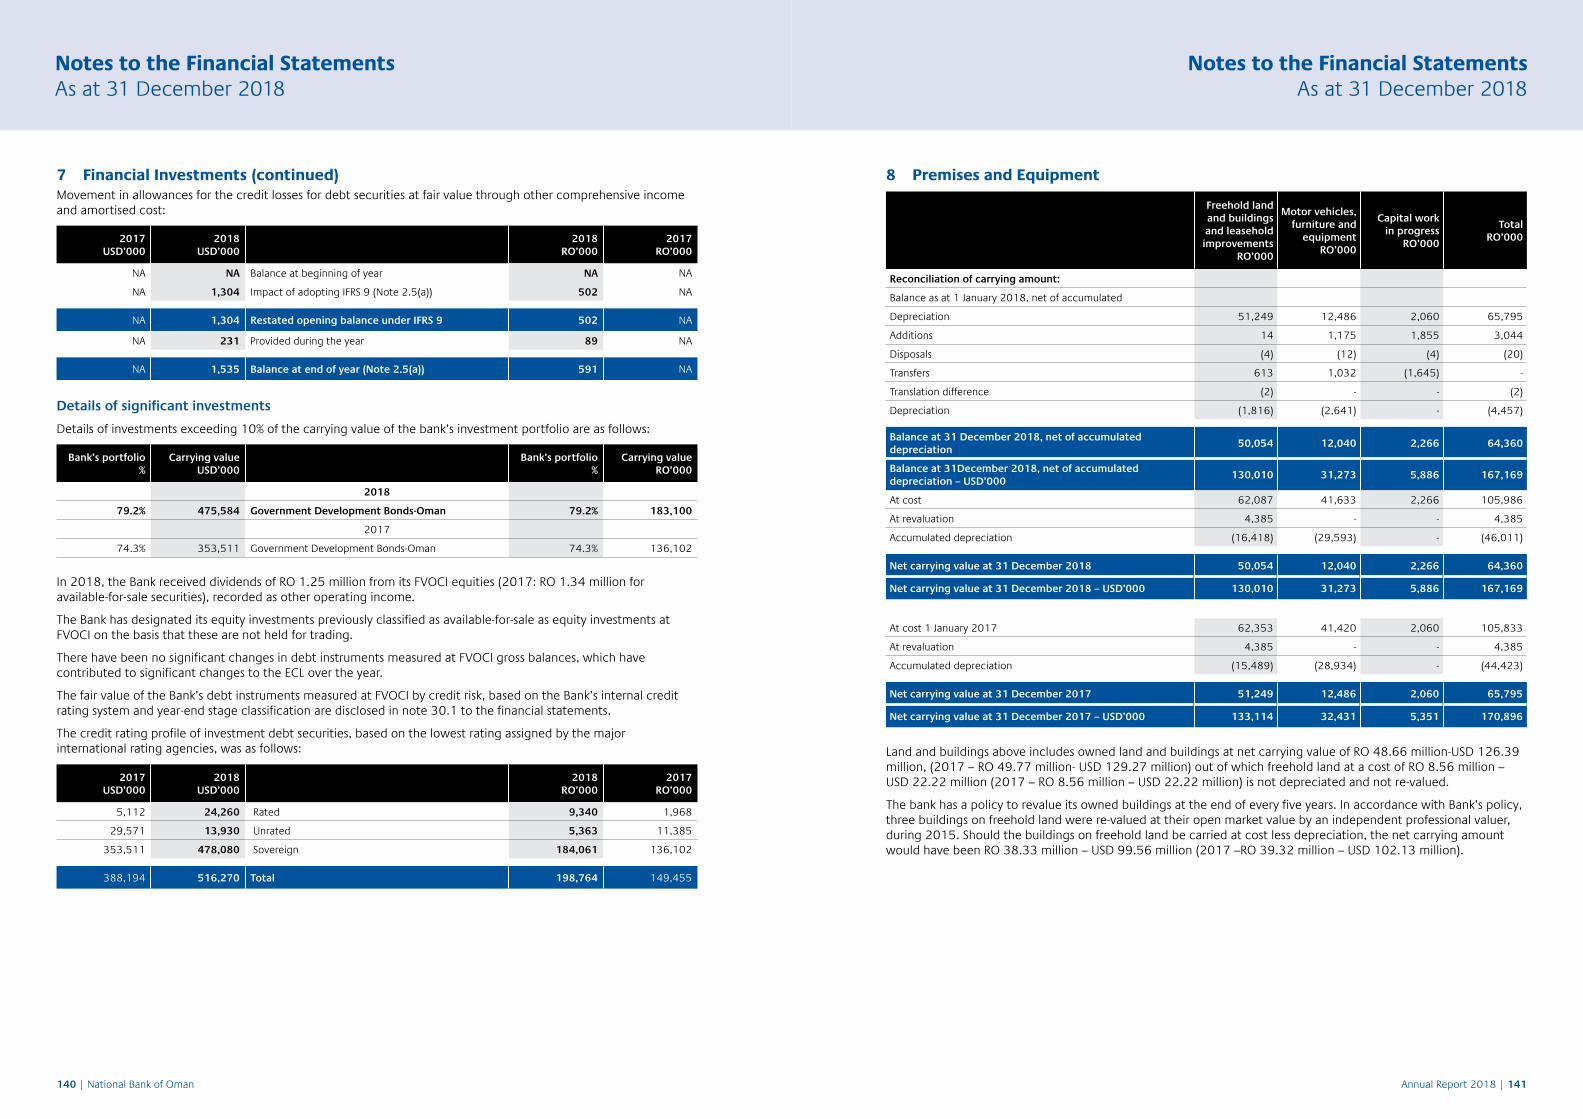
7 Financial Investments (continued)Movement in allowances for the credit losses for debt securities at fair value through other comprehensive income and amortised cost:
Details of significant investments
Details of investments exceeding 10% of the carrying value of the bank’s investment portfolio are as follows:
In 2018, the Bank received dividends of RO 1.25 million from its FVOCI equities (2017: RO 1.34 million for available-for-sale securities), recorded as other operating income.
The Bank has designated its equity investments previously classified as available-for-sale as equity investments at FVOCI on the basis that these are not held for trading.
There have been no significant changes in debt instruments measured at FVOCI gross balances, which have contributed to significant changes to the ECL over the year.
The fair value of the Bank’s debt instruments measured at FVOCI by credit risk, based on the Bank’s internal credit rating system and year-end stage classification are disclosed in note 30.1 to the financial statements.
The credit rating profile of investment debt securities, based on the lowest rating assigned by the major international rating agencies, was as follows:
2017USD’000
2018USD’000
2018RO’000
2017RO’000
NA NA Balance at beginning of year NA NA
NA 1,304 Impact of adopting IFRS 9 (Note 2.5(a)) 502 NA
NA 1,304 Restated opening balance under IFRS 9 502 NA
NA 231 Provided during the year 89 NA
NA 1,535 Balance at end of year (Note 2.5(a)) 591 NA
2017USD’000
2018USD’000
2018RO’000
2017RO’000
5,112 24,260 Rated 9,340 1,968
29,571 13,930 Unrated 5,363 11,385
353,511 478,080 Sovereign 184,061 136,102
388,194 516,270 Total 198,764 149,455
Bank’s portfolio %
Carrying valueUSD’000
Bank’s portfolio%
Carrying valueRO’000
2018
79.2% 475,584 Government Development Bonds-Oman 79.2% 183,100
2017
74.3% 353,511 Government Development Bonds-Oman 74.3% 136,102
8 Premises and Equipment
Freehold land and buildings and leasehold improvements
RO’000
Motor vehicles, furniture and
equipmentRO’000
Capital work in progress
RO’000
TotalRO’000
Reconciliation of carrying amount:
Balance as at 1 January 2018, net of accumulated
Depreciation 51,249 12,486 2,060 65,795
Additions 14 1,175 1,855 3,044
Disposals (4) (12) (4) (20)
Transfers 613 1,032 (1,645) -
Translation difference (2) - - (2)
Depreciation (1,816) (2,641) - (4,457)
Balance at 31 December 2018, net of accumulated depreciation
50,054 12,040 2,266 64,360
Balance at 31December 2018, net of accumulated depreciation – USD’000
130,010 31,273 5,886 167,169
At cost 62,087 41,633 2,266 105,986
At revaluation 4,385 - - 4,385
Accumulated depreciation (16,418) (29,593) - (46,011)
Net carrying value at 31 December 2018 50,054 12,040 2,266 64,360
Net carrying value at 31 December 2018 – USD’000 130,010 31,273 5,886 167,169
At cost 1 January 2017 62,353 41,420 2,060 105,833
At revaluation 4,385 - - 4,385
Accumulated depreciation (15,489) (28,934) - (44,423)
Net carrying value at 31 December 2017 51,249 12,486 2,060 65,795
Net carrying value at 31 December 2017 – USD’000 133,114 32,431 5,351 170,896
Land and buildings above includes owned land and buildings at net carrying value of RO 48.66 million-USD 126.39 million, (2017 – RO 49.77 million- USD 129.27 million) out of which freehold land at a cost of RO 8.56 million – USD 22.22 million (2017 – RO 8.56 million – USD 22.22 million) is not depreciated and not re-valued.
The bank has a policy to revalue its owned buildings at the end of every five years. In accordance with Bank’s policy, three buildings on freehold land were re-valued at their open market value by an independent professional valuer, during 2015. Should the buildings on freehold land be carried at cost less depreciation, the net carrying amount would have been RO 38.33 million – USD 99.56 million (2017 –RO 39.32 million – USD 102.13 million).
140 | National Bank of Oman Annual Report 2018 | 141
Notes to the Financial StatementsAs at 31 December 2018
Notes to the Financial StatementsAs at 31 December 2018
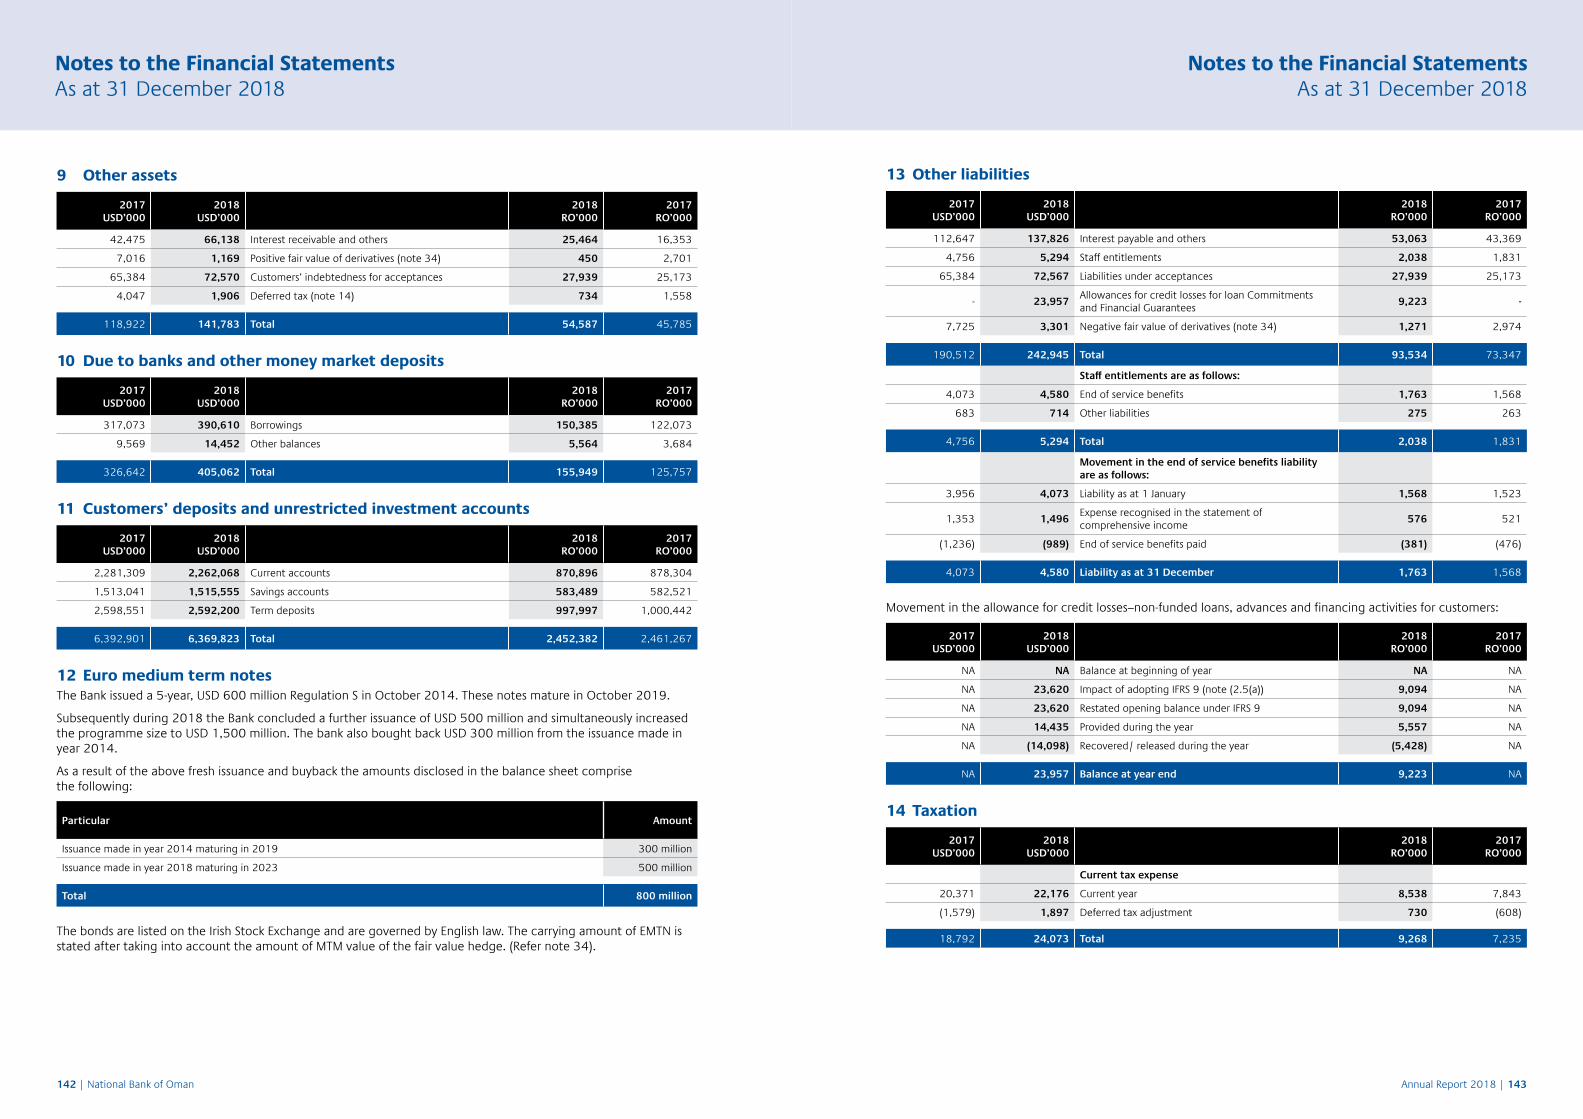
9 Other assets
10 Due to banks and other money market deposits
11 Customers’ deposits and unrestricted investment accounts
12 Euro medium term notesThe Bank issued a 5-year, USD 600 million Regulation S in October 2014. These notes mature in October 2019.
Subsequently during 2018 the Bank concluded a further issuance of USD 500 million and simultaneously increased the programme size to USD 1,500 million. The bank also bought back USD 300 million from the issuance made in year 2014.
As a result of the above fresh issuance and buyback the amounts disclosed in the balance sheet comprise the following:
The bonds are listed on the Irish Stock Exchange and are governed by English law. The carrying amount of EMTN is stated after taking into account the amount of MTM value of the fair value hedge. (Refer note 34).
2017USD’000
2018USD’000
2018RO’000
2017RO’000
42,475 66,138 Interest receivable and others 25,464 16,353
7,016 1,169 Positive fair value of derivatives (note 34) 450 2,701
65,384 72,570 Customers’ indebtedness for acceptances 27,939 25,173
4,047 1,906 Deferred tax (note 14) 734 1,558
118,922 141,783 Total 54,587 45,785
2017USD’000
2018USD’000
2018RO’000
2017RO’000
2,281,309 2,262,068 Current accounts 870,896 878,304
1,513,041 1,515,555 Savings accounts 583,489 582,521
2,598,551 2,592,200 Term deposits 997,997 1,000,442
6,392,901 6,369,823 Total 2,452,382 2,461,267
Particular Amount
Issuance made in year 2014 maturing in 2019 300 million
Issuance made in year 2018 maturing in 2023 500 million
Total 800 million
2017USD’000
2018USD’000
2018RO’000
2017RO’000
317,073 390,610 Borrowings 150,385 122,073
9,569 14,452 Other balances 5,564 3,684
326,642 405,062 Total 155,949 125,757
13 Other liabilities
14 Taxation
2017USD’000
2018USD’000
2018RO’000
2017RO’000
112,647 137,826 Interest payable and others 53,063 43,369
4,756 5,294 Staff entitlements 2,038 1,831
65,384 72,567 Liabilities under acceptances 27,939 25,173
- 23,957Allowances for credit losses for loan Commitments and Financial Guarantees
9,223 -
7,725 3,301 Negative fair value of derivatives (note 34) 1,271 2,974
190,512 242,945 Total 93,534 73,347
Staff entitlements are as follows:
4,073 4,580 End of service benefits 1,763 1,568
683 714 Other liabilities 275 263
4,756 5,294 Total 2,038 1,831
Movement in the end of service benefits liability are as follows:
3,956 4,073 Liability as at 1 January 1,568 1,523
1,353 1,496 Expense recognised in the statement of comprehensive income
576 521
(1,236) (989) End of service benefits paid (381) (476)
4,073 4,580 Liability as at 31 December 1,763 1,568
2017USD’000
2018USD’000
2018RO’000
2017RO’000
Current tax expense
20,371 22,176 Current year 8,538 7,843
(1,579) 1,897 Deferred tax adjustment 730 (608)
18,792 24,073 Total 9,268 7,235
2017USD’000
2018USD’000
2018RO’000
2017RO’000
NA NA Balance at beginning of year NA NA
NA 23,620 Impact of adopting IFRS 9 (note (2.5(a)) 9,094 NA
NA 23,620 Restated opening balance under IFRS 9 9,094 NA
NA 14,435 Provided during the year 5,557 NA
NA (14,098) Recovered/ released during the year (5,428) NA
NA 23,957 Balance at year end 9,223 NA
Movement in the allowance for credit losses–non-funded loans, advances and financing activities for customers:
142 | National Bank of Oman Annual Report 2018 | 143
Notes to the Financial StatementsAs at 31 December 2018
Notes to the Financial StatementsAs at 31 December 2018
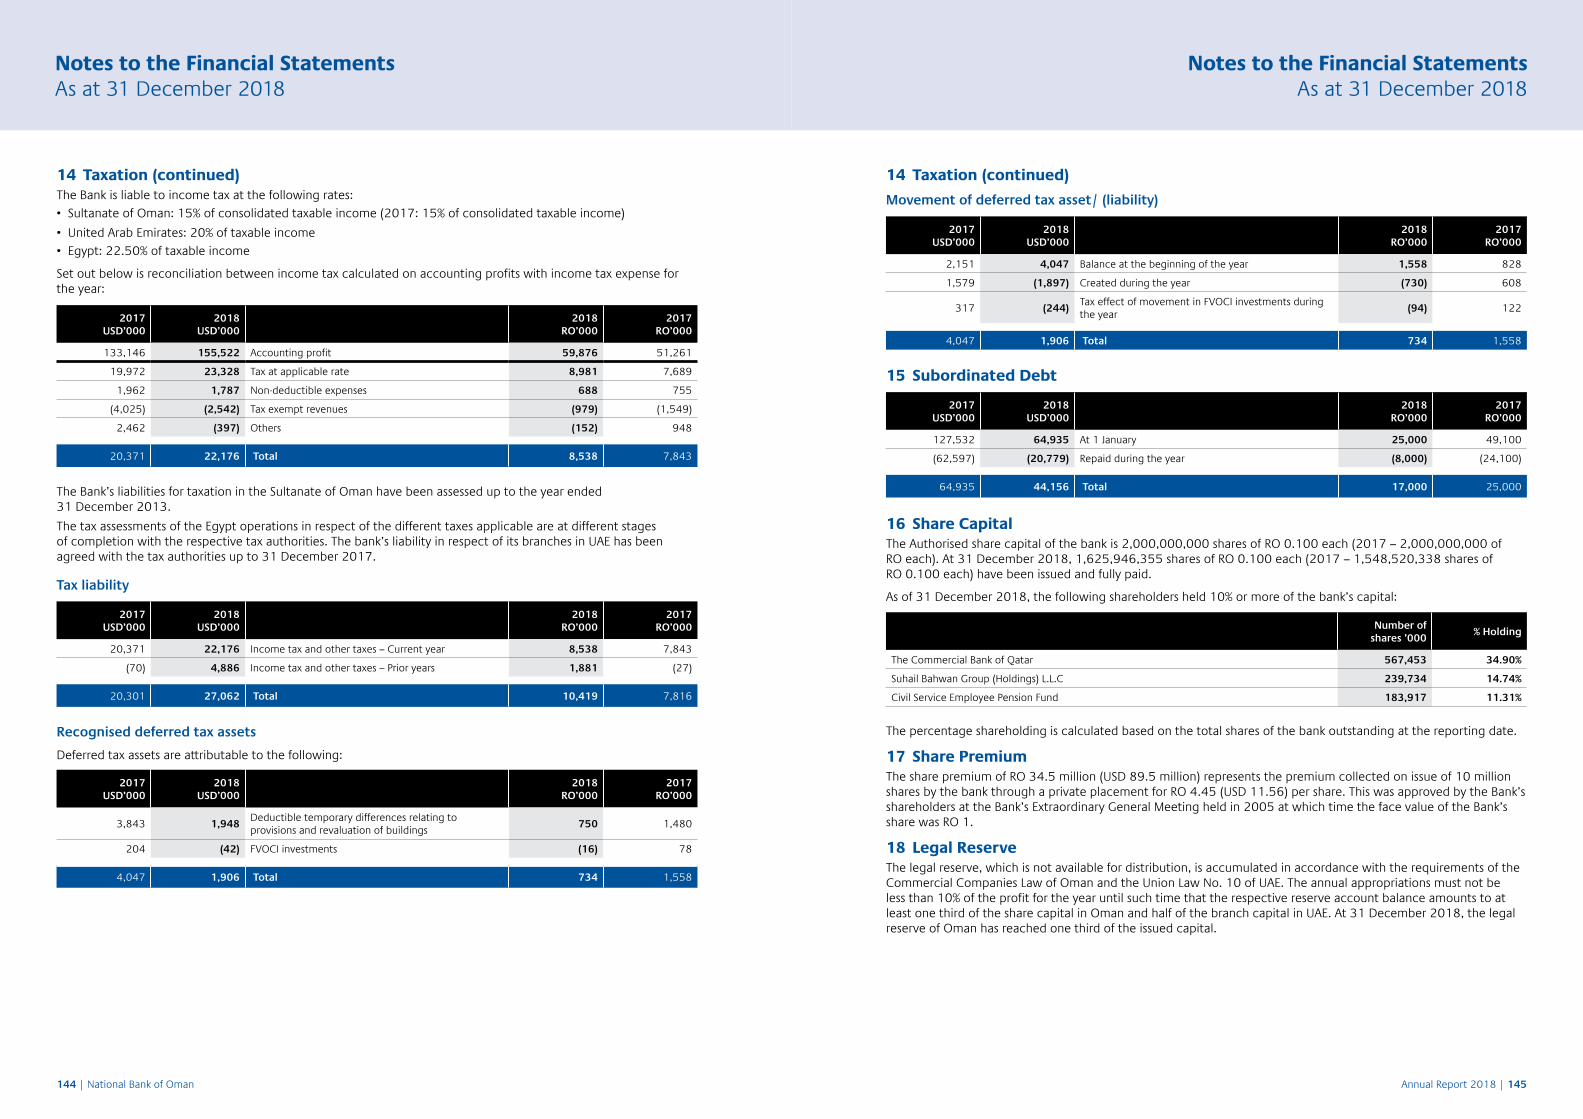
Tax liability
Recognised deferred tax assets
Deferred tax assets are attributable to the following:
2017USD’000
2018USD’000
2018RO’000
2017RO’000
133,146 155,522 Accounting profit 59,876 51,261
19,972 23,328 Tax at applicable rate 8,981 7,689
1,962 1,787 Non-deductible expenses 688 755
(4,025) (2,542) Tax exempt revenues (979) (1,549)
2,462 (397) Others (152) 948
20,371 22,176 Total 8,538 7,843
2017USD’000
2018USD’000
2018RO’000
2017RO’000
20,371 22,176 Income tax and other taxes – Current year 8,538 7,843
(70) 4,886 Income tax and other taxes – Prior years 1,881 (27)
20,301 27,062 Total 10,419 7,816
2017USD’000
2018USD’000
2018RO’000
2017RO’000
3,843 1,948 Deductible temporary differences relating to provisions and revaluation of buildings
750 1,480
204 (42) FVOCI investments (16) 78
4,047 1,906 Total 734 1,558
The Bank’s liabilities for taxation in the Sultanate of Oman have been assessed up to the year ended 31 December 2013.
The tax assessments of the Egypt operations in respect of the different taxes applicable are at different stages of completion with the respective tax authorities. The bank’s liability in respect of its branches in UAE has been agreed with the tax authorities up to 31 December 2017.
14 Taxation (continued)The Bank is liable to income tax at the following rates:• Sultanate of Oman: 15% of consolidated taxable income (2017: 15% of consolidated taxable income)
• United Arab Emirates: 20% of taxable income• Egypt: 22.50% of taxable income
Set out below is reconciliation between income tax calculated on accounting profits with income tax expense for the year:
2017USD’000
2018USD’000
2018RO’000
2017RO’000
2,151 4,047 Balance at the beginning of the year 1,558 828
1,579 (1,897) Created during the year (730) 608
317 (244)Tax effect of movement in FVOCI investments during the year
(94) 122
4,047 1,906 Total 734 1,558
2017USD’000
2018USD’000
2018RO’000
2017RO’000
127,532 64,935 At 1 January 25,000 49,100
(62,597) (20,779) Repaid during the year (8,000) (24,100)
64,935 44,156 Total 17,000 25,000
Number of shares ’000
% Holding
The Commercial Bank of Qatar 567,453 34.90%
Suhail Bahwan Group (Holdings) L.L.C 239,734 14.74%
Civil Service Employee Pension Fund 183,917 11.31%
14 Taxation (continued)
Movement of deferred tax asset/ (liability)
15 Subordinated Debt
16 Share CapitalThe Authorised share capital of the bank is 2,000,000,000 shares of RO 0.100 each (2017 – 2,000,000,000 of RO each). At 31 December 2018, 1,625,946,355 shares of RO 0.100 each (2017 – 1,548,520,338 shares of RO 0.100 each) have been issued and fully paid.
As of 31 December 2018, the following shareholders held 10% or more of the bank’s capital:
The percentage shareholding is calculated based on the total shares of the bank outstanding at the reporting date.
17 Share PremiumThe share premium of RO 34.5 million (USD 89.5 million) represents the premium collected on issue of 10 million shares by the bank through a private placement for RO 4.45 (USD 11.56) per share. This was approved by the Bank’s shareholders at the Bank’s Extraordinary General Meeting held in 2005 at which time the face value of the Bank’s share was RO 1.
18 Legal ReserveThe legal reserve, which is not available for distribution, is accumulated in accordance with the requirements of the Commercial Companies Law of Oman and the Union Law No. 10 of UAE. The annual appropriations must not be less than 10% of the profit for the year until such time that the respective reserve account balance amounts to at least one third of the share capital in Oman and half of the branch capital in UAE. At 31 December 2018, the legal reserve of Oman has reached one third of the issued capital.
144 | National Bank of Oman Annual Report 2018 | 145
Notes to the Financial StatementsAs at 31 December 2018
Notes to the Financial StatementsAs at 31 December 2018
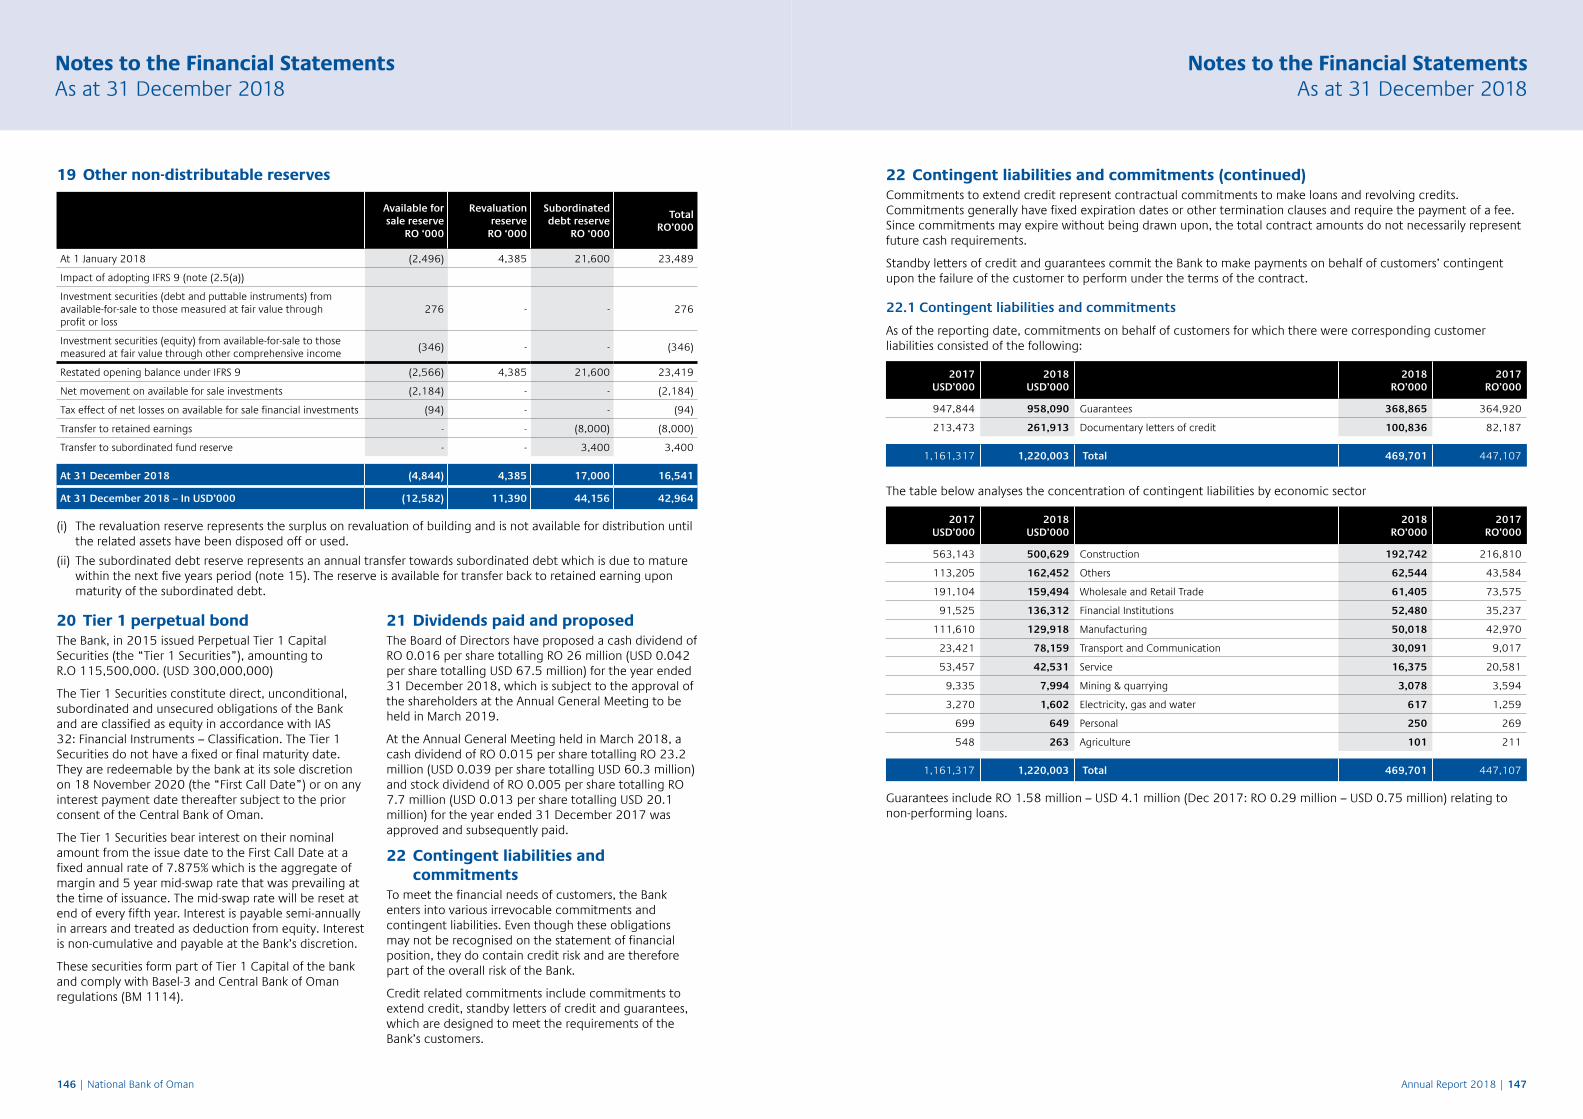
19 Other non-distributable reserves
20 Tier 1 perpetual bondThe Bank, in 2015 issued Perpetual Tier 1 Capital Securities (the “Tier 1 Securities”), amounting to R.O 115,500,000. (USD 300,000,000)
The Tier 1 Securities constitute direct, unconditional, subordinated and unsecured obligations of the Bank and are classified as equity in accordance with IAS 32: Financial Instruments – Classification. The Tier 1 Securities do not have a fixed or final maturity date. They are redeemable by the bank at its sole discretion on 18 November 2020 (the “First Call Date”) or on any interest payment date thereafter subject to the prior consent of the Central Bank of Oman.
The Tier 1 Securities bear interest on their nominal amount from the issue date to the First Call Date at a fixed annual rate of 7.875% which is the aggregate of margin and 5 year mid-swap rate that was prevailing at the time of issuance. The mid-swap rate will be reset at end of every fifth year. Interest is payable semi-annually in arrears and treated as deduction from equity. Interest is non-cumulative and payable at the Bank’s discretion.
These securities form part of Tier 1 Capital of the bank and comply with Basel-3 and Central Bank of Oman regulations (BM 1114).
21 Dividends paid and proposedThe Board of Directors have proposed a cash dividend of RO 0.016 per share totalling RO 26 million (USD 0.042 per share totalling USD 67.5 million) for the year ended 31 December 2018, which is subject to the approval of the shareholders at the Annual General Meeting to be held in March 2019.
At the Annual General Meeting held in March 2018, a cash dividend of RO 0.015 per share totalling RO 23.2 million (USD 0.039 per share totalling USD 60.3 million) and stock dividend of RO 0.005 per share totalling RO 7.7 million (USD 0.013 per share totalling USD 20.1 million) for the year ended 31 December 2017 was approved and subsequently paid.
22 Contingent liabilities and commitmentsTo meet the financial needs of customers, the Bank enters into various irrevocable commitments and contingent liabilities. Even though these obligations may not be recognised on the statement of financial position, they do contain credit risk and are therefore part of the overall risk of the Bank.
Credit related commitments include commitments to extend credit, standby letters of credit and guarantees, which are designed to meet the requirements of the Bank’s customers.
Available for sale reserve
RO ‘000
Revaluation reserve
RO ‘000
Subordinated debt reserve
RO ‘000
TotalRO’000
At 1 January 2018 (2,496) 4,385 21,600 23,489
Impact of adopting IFRS 9 (note (2.5(a))
Investment securities (debt and puttable instruments) from available-for-sale to those measured at fair value through profit or loss
276 - - 276
Investment securities (equity) from available-for-sale to those measured at fair value through other comprehensive income
(346) - - (346)
Restated opening balance under IFRS 9 (2,566) 4,385 21,600 23,419
Net movement on available for sale investments (2,184) - - (2,184)
Tax effect of net losses on available for sale financial investments (94) - - (94)
Transfer to retained earnings - - (8,000) (8,000)
Transfer to subordinated fund reserve - - 3,400 3,400
At 31 December 2018 (4,844) 4,385 17,000 16,541
At 31 December 2018 – In USD’000 (12,582) 11,390 44,156 42,964
(i) The revaluation reserve represents the surplus on revaluation of building and is not available for distribution until the related assets have been disposed off or used.
(ii) The subordinated debt reserve represents an annual transfer towards subordinated debt which is due to mature within the next five years period (note 15). The reserve is available for transfer back to retained earning upon maturity of the subordinated debt.
22 Contingent liabilities and commitments (continued)Commitments to extend credit represent contractual commitments to make loans and revolving credits. Commitments generally have fixed expiration dates or other termination clauses and require the payment of a fee. Since commitments may expire without being drawn upon, the total contract amounts do not necessarily represent future cash requirements.
Standby letters of credit and guarantees commit the Bank to make payments on behalf of customers’ contingent upon the failure of the customer to perform under the terms of the contract.
The table below analyses the concentration of contingent liabilities by economic sector
Guarantees include RO 1.58 million – USD 4.1 million (Dec 2017: RO 0.29 million – USD 0.75 million) relating to non-performing loans.
2017USD’000
2018USD’000
2018RO’000
2017RO’000
947,844 958,090 Guarantees 368,865 364,920
213,473 261,913 Documentary letters of credit 100,836 82,187
1,161,317 1,220,003 Total 469,701 447,107
2017USD’000
2018USD’000
2018RO’000
2017RO’000
563,143 500,629 Construction 192,742 216,810
113,205 162,452 Others 62,544 43,584
191,104 159,494 Wholesale and Retail Trade 61,405 73,575
91,525 136,312 Financial Institutions 52,480 35,237
111,610 129,918 Manufacturing 50,018 42,970
23,421 78,159 Transport and Communication 30,091 9,017
53,457 42,531 Service 16,375 20,581
9,335 7,994 Mining & quarrying 3,078 3,594
3,270 1,602 Electricity, gas and water 617 1,259
699 649 Personal 250 269
548 263 Agriculture 101 211
1,161,317 1,220,003 Total 469,701 447,107
22.1 Contingent liabilities and commitments
As of the reporting date, commitments on behalf of customers for which there were corresponding customer liabilities consisted of the following:
146 | National Bank of Oman Annual Report 2018 | 147
Notes to the Financial StatementsAs at 31 December 2018
Notes to the Financial StatementsAs at 31 December 2018
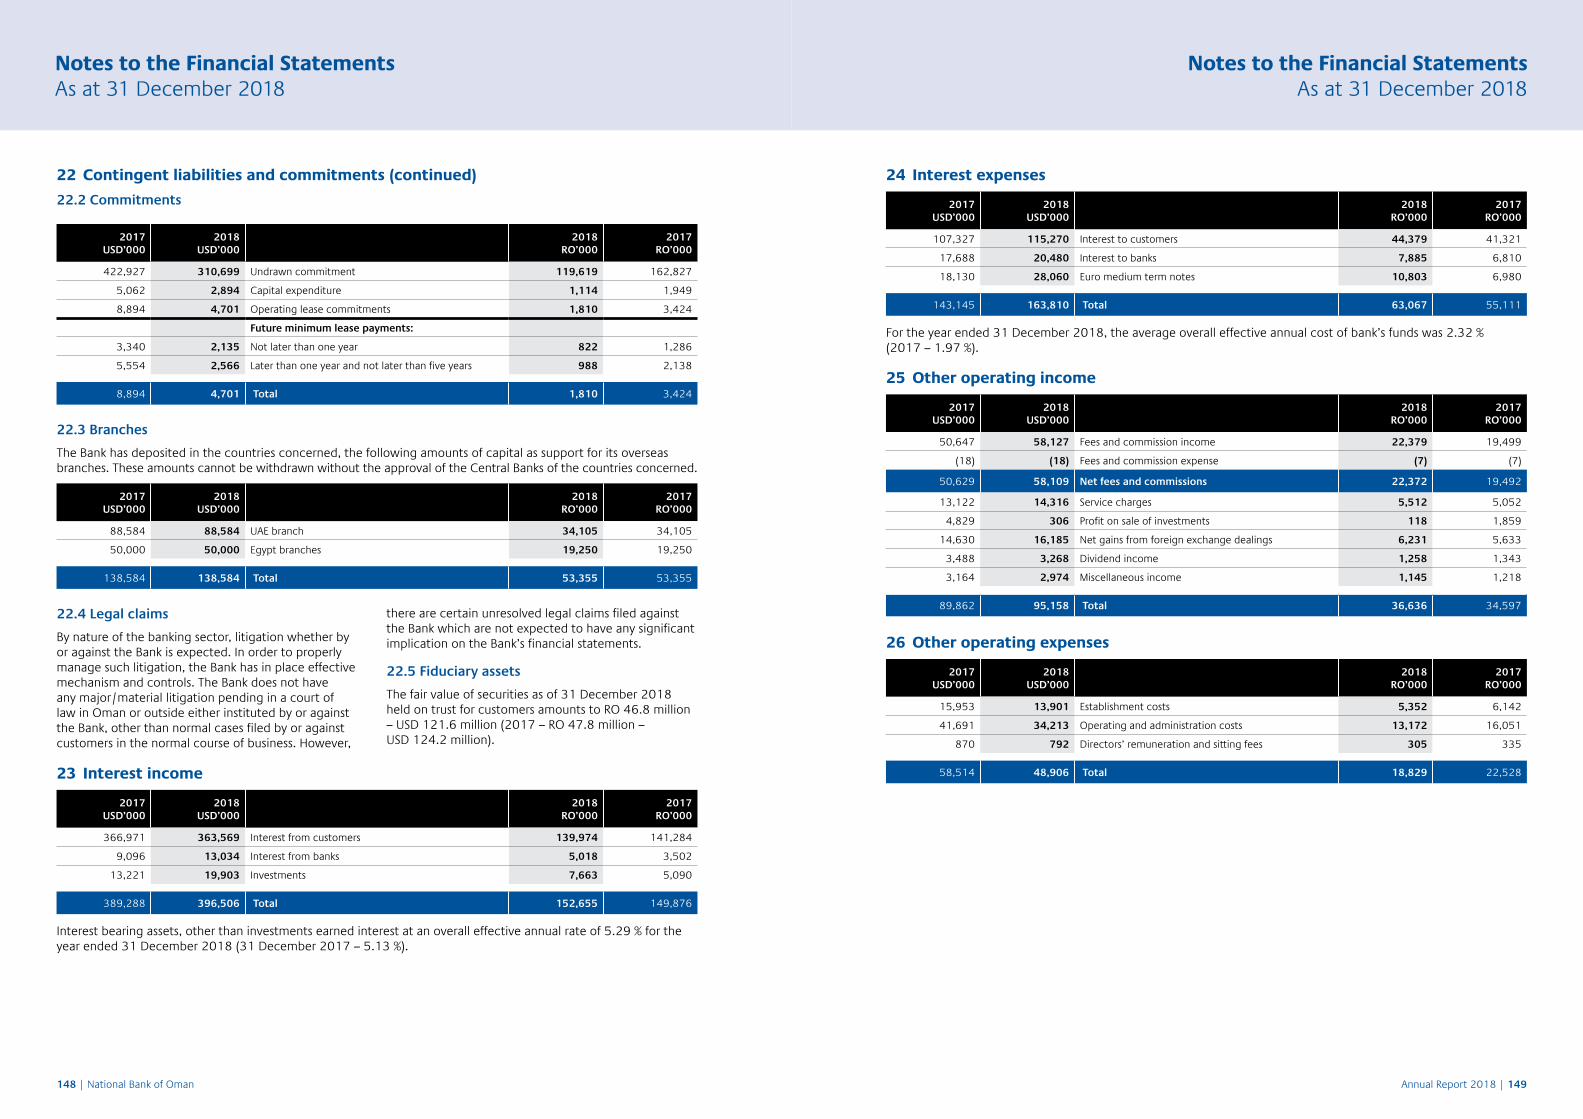
22 Contingent liabilities and commitments (continued)
22.2 Commitments
23 Interest income
22.3 Branches
The Bank has deposited in the countries concerned, the following amounts of capital as support for its overseas branches. These amounts cannot be withdrawn without the approval of the Central Banks of the countries concerned.
22.4 Legal claims
By nature of the banking sector, litigation whether by or against the Bank is expected. In order to properly manage such litigation, the Bank has in place effective mechanism and controls. The Bank does not have any major/material litigation pending in a court of law in Oman or outside either instituted by or against the Bank, other than normal cases filed by or against customers in the normal course of business. However,
there are certain unresolved legal claims filed against the Bank which are not expected to have any significant implication on the Bank’s financial statements.
22.5 Fiduciary assets
The fair value of securities as of 31 December 2018 held on trust for customers amounts to RO 46.8 million – USD 121.6 million (2017 – RO 47.8 million – USD 124.2 million).
Interest bearing assets, other than investments earned interest at an overall effective annual rate of 5.29 % for the year ended 31 December 2018 (31 December 2017 – 5.13 %).
2017USD’000
2018USD’000
2018RO’000
2017RO’000
422,927 310,699 Undrawn commitment 119,619 162,827
5,062 2,894 Capital expenditure 1,114 1,949
8,894 4,701 Operating lease commitments 1,810 3,424
Future minimum lease payments:
3,340 2,135 Not later than one year 822 1,286
5,554 2,566 Later than one year and not later than five years 988 2,138
8,894 4,701 Total 1,810 3,424
2017USD’000
2018USD’000
2018RO’000
2017RO’000
366,971 363,569 Interest from customers 139,974 141,284
9,096 13,034 Interest from banks 5,018 3,502
13,221 19,903 Investments 7,663 5,090
389,288 396,506 Total 152,655 149,876
2017USD’000
2018USD’000
2018RO’000
2017RO’000
88,584 88,584 UAE branch 34,105 34,105
50,000 50,000 Egypt branches 19,250 19,250
138,584 138,584 Total 53,355 53,355
24 Interest expenses
25 Other operating income
26 Other operating expenses
2017USD’000
2018USD’000
2018RO’000
2017RO’000
107,327 115,270 Interest to customers 44,379 41,321
17,688 20,480 Interest to banks 7,885 6,810
18,130 28,060 Euro medium term notes 10,803 6,980
143,145 163,810 Total 63,067 55,111
2017USD’000
2018USD’000
2018RO’000
2017RO’000
15,953 13,901 Establishment costs 5,352 6,142
41,691 34,213 Operating and administration costs 13,172 16,051
870 792 Directors’ remuneration and sitting fees 305 335
58,514 48,906 Total 18,829 22,528
2017USD’000
2018USD’000
2018RO’000
2017RO’000
50,647 58,127 Fees and commission income 22,379 19,499
(18) (18) Fees and commission expense (7) (7)
50,629 58,109 Net fees and commissions 22,372 19,492
13,122 14,316 Service charges 5,512 5,052
4,829 306 Profit on sale of investments 118 1,859
14,630 16,185 Net gains from foreign exchange dealings 6,231 5,633
3,488 3,268 Dividend income 1,258 1,343
3,164 2,974 Miscellaneous income 1,145 1,218
89,862 95,158 Total 36,636 34,597
For the year ended 31 December 2018, the average overall effective annual cost of bank’s funds was 2.32 % (2017 – 1.97 %).
148 | National Bank of Oman Annual Report 2018 | 149
Notes to the Financial StatementsAs at 31 December 2018
Notes to the Financial StatementsAs at 31 December 2018
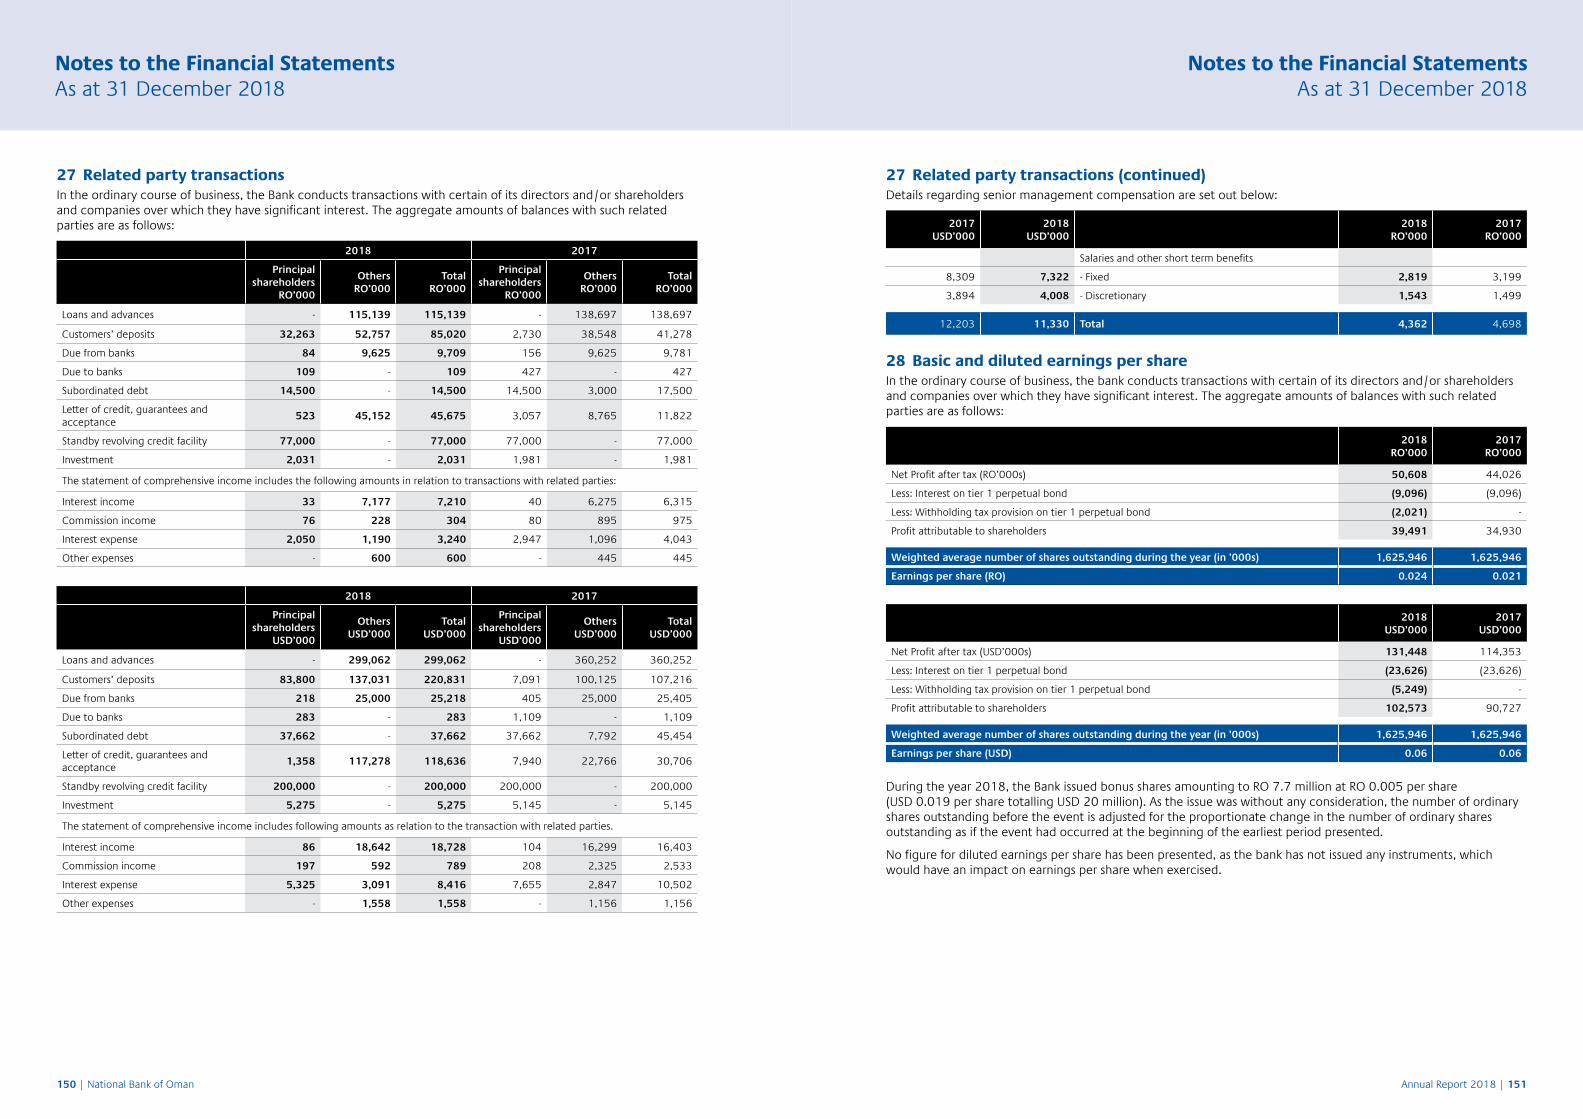
27 Related party transactionsIn the ordinary course of business, the Bank conducts transactions with certain of its directors and/or shareholders and companies over which they have significant interest. The aggregate amounts of balances with such related parties are as follows:
2018 2017
Principal shareholders
RO’000
OthersRO’000
TotalRO’000
Principal shareholders
RO’000
OthersRO’000
TotalRO’000
Loans and advances - 115,139 115,139 - 138,697 138,697
Customers’ deposits 32,263 52,757 85,020 2,730 38,548 41,278
Due from banks 84 9,625 9,709 156 9,625 9,781
Due to banks 109 - 109 427 - 427
Subordinated debt 14,500 - 14,500 14,500 3,000 17,500
Letter of credit, guarantees and acceptance
523 45,152 45,675 3,057 8,765 11,822
Standby revolving credit facility 77,000 - 77,000 77,000 - 77,000
Investment 2,031 - 2,031 1,981 - 1,981
The statement of comprehensive income includes the following amounts in relation to transactions with related parties:
Interest income 33 7,177 7,210 40 6,275 6,315
Commission income 76 228 304 80 895 975
Interest expense 2,050 1,190 3,240 2,947 1,096 4,043
Other expenses - 600 600 - 445 445
2018 2017
Principal shareholders
USD’000
OthersUSD’000
TotalUSD’000
Principal shareholders
USD’000
OthersUSD’000
TotalUSD’000
Loans and advances - 299,062 299,062 - 360,252 360,252
Customers’ deposits 83,800 137,031 220,831 7,091 100,125 107,216
Due from banks 218 25,000 25,218 405 25,000 25,405
Due to banks 283 - 283 1,109 - 1,109
Subordinated debt 37,662 - 37,662 37,662 7,792 45,454
Letter of credit, guarantees and acceptance
1,358 117,278 118,636 7,940 22,766 30,706
Standby revolving credit facility 200,000 - 200,000 200,000 - 200,000
Investment 5,275 - 5,275 5,145 - 5,145
The statement of comprehensive income includes following amounts as relation to the transaction with related parties.
Interest income 86 18,642 18,728 104 16,299 16,403
Commission income 197 592 789 208 2,325 2,533
Interest expense 5,325 3,091 8,416 7,655 2,847 10,502
Other expenses - 1,558 1,558 - 1,156 1,156
27 Related party transactions (continued)Details regarding senior management compensation are set out below:
2017USD’000
2018USD’000
2018RO’000
2017RO’000
Salaries and other short term benefits
8,309 7,322 - Fixed 2,819 3,199
3,894 4,008 - Discretionary 1,543 1,499
12,203 11,330 Total 4,362 4,698
28 Basic and diluted earnings per shareIn the ordinary course of business, the bank conducts transactions with certain of its directors and/or shareholders and companies over which they have significant interest. The aggregate amounts of balances with such related parties are as follows:
During the year 2018, the Bank issued bonus shares amounting to RO 7.7 million at RO 0.005 per share (USD 0.019 per share totalling USD 20 million). As the issue was without any consideration, the number of ordinary shares outstanding before the event is adjusted for the proportionate change in the number of ordinary shares outstanding as if the event had occurred at the beginning of the earliest period presented.
No figure for diluted earnings per share has been presented, as the bank has not issued any instruments, which would have an impact on earnings per share when exercised.
2018RO’000
2017RO’000
Net Profit after tax (RO’000s) 50,608 44,026
Less: Interest on tier 1 perpetual bond (9,096) (9,096)
Less: Withholding tax provision on tier 1 perpetual bond (2,021) -
Profit attributable to shareholders 39,491 34,930
Weighted average number of shares outstanding during the year (in ’000s) 1,625,946 1,625,946
Earnings per share (RO) 0.024 0.021
2018USD’000
2017USD’000
Net Profit after tax (USD’000s) 131,448 114,353
Less: Interest on tier 1 perpetual bond (23,626) (23,626)
Less: Withholding tax provision on tier 1 perpetual bond (5,249) -
Profit attributable to shareholders 102,573 90,727
Weighted average number of shares outstanding during the year (in ’000s) 1,625,946 1,625,946
Earnings per share (USD) 0.06 0.06
150 | National Bank of Oman Annual Report 2018 | 151
Notes to the Financial StatementsAs at 31 December 2018
Notes to the Financial StatementsAs at 31 December 2018
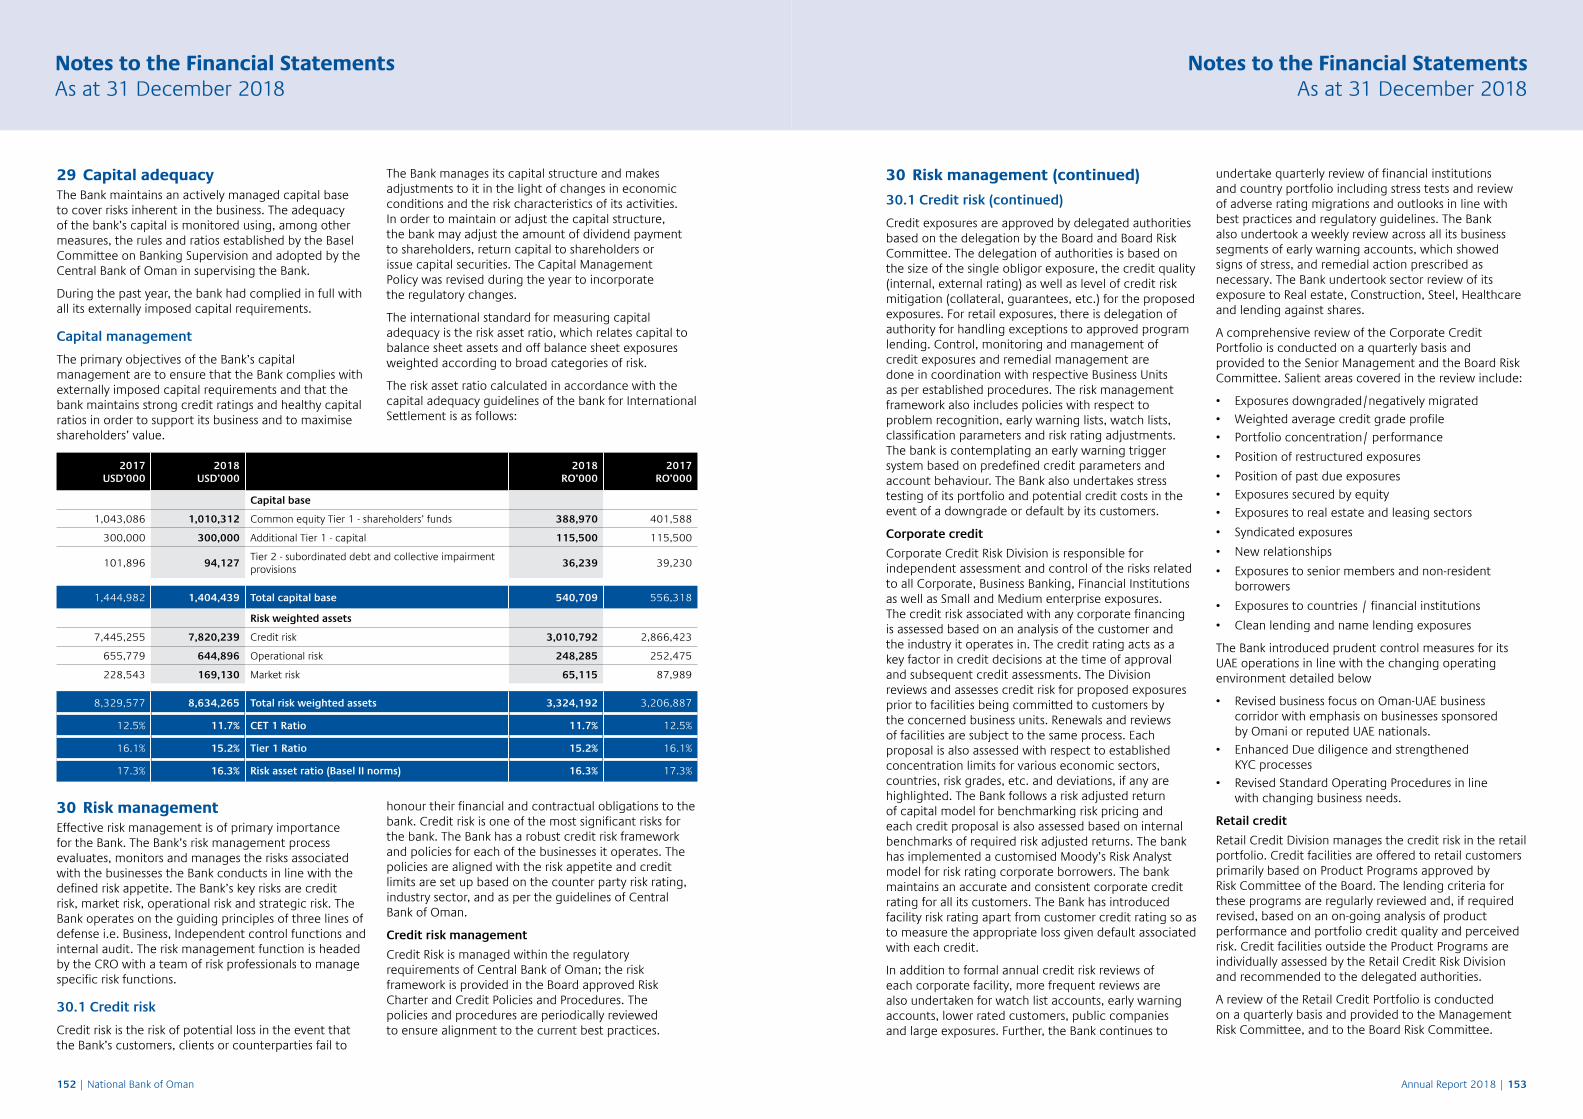
29 Capital adequacyThe Bank maintains an actively managed capital base to cover risks inherent in the business. The adequacy of the bank’s capital is monitored using, among other measures, the rules and ratios established by the Basel Committee on Banking Supervision and adopted by the Central Bank of Oman in supervising the Bank.
During the past year, the bank had complied in full with all its externally imposed capital requirements.
Capital management
The primary objectives of the Bank’s capital management are to ensure that the Bank complies with externally imposed capital requirements and that the bank maintains strong credit ratings and healthy capital ratios in order to support its business and to maximise shareholders’ value.
The Bank manages its capital structure and makes adjustments to it in the light of changes in economic conditions and the risk characteristics of its activities. In order to maintain or adjust the capital structure, the bank may adjust the amount of dividend payment to shareholders, return capital to shareholders or issue capital securities. The Capital Management Policy was revised during the year to incorporate the regulatory changes.
The international standard for measuring capital adequacy is the risk asset ratio, which relates capital to balance sheet assets and off balance sheet exposures weighted according to broad categories of risk.
The risk asset ratio calculated in accordance with the capital adequacy guidelines of the bank for International Settlement is as follows:
30 Risk managementEffective risk management is of primary importance for the Bank. The Bank’s risk management process evaluates, monitors and manages the risks associated with the businesses the Bank conducts in line with the defined risk appetite. The Bank’s key risks are credit risk, market risk, operational risk and strategic risk. The Bank operates on the guiding principles of three lines of defense i.e. Business, Independent control functions and internal audit. The risk management function is headed by the CRO with a team of risk professionals to manage specific risk functions.
30.1 Credit risk
Credit risk is the risk of potential loss in the event that the Bank’s customers, clients or counterparties fail to
honour their financial and contractual obligations to the bank. Credit risk is one of the most significant risks for the bank. The Bank has a robust credit risk framework and policies for each of the businesses it operates. The policies are aligned with the risk appetite and credit limits are set up based on the counter party risk rating, industry sector, and as per the guidelines of Central Bank of Oman.
Credit risk management
Credit Risk is managed within the regulatory requirements of Central Bank of Oman; the risk framework is provided in the Board approved Risk Charter and Credit Policies and Procedures. The policies and procedures are periodically reviewed to ensure alignment to the current best practices.
2017USD’000
2018USD’000
2018RO’000
2017RO’000
Capital base
1,043,086 1,010,312 Common equity Tier 1 - shareholders’ funds 388,970 401,588
300,000 300,000 Additional Tier 1 - capital 115,500 115,500
101,896 94,127Tier 2 - subordinated debt and collective impairment provisions
36,239 39,230
1,444,982 1,404,439 Total capital base 540,709 556,318
Risk weighted assets
7,445,255 7,820,239 Credit risk 3,010,792 2,866,423
655,779 644,896 Operational risk 248,285 252,475
228,543 169,130 Market risk 65,115 87,989
8,329,577 8,634,265 Total risk weighted assets 3,324,192 3,206,887
12.5% 11.7% CET 1 Ratio 11.7% 12.5%
16.1% 15.2% Tier 1 Ratio 15.2% 16.1%
17.3% 16.3% Risk asset ratio (Basel II norms) 16.3% 17.3%
30 Risk management (continued)
30.1 Credit risk (continued)
Credit exposures are approved by delegated authorities based on the delegation by the Board and Board Risk Committee. The delegation of authorities is based on the size of the single obligor exposure, the credit quality (internal, external rating) as well as level of credit risk mitigation (collateral, guarantees, etc.) for the proposed exposures. For retail exposures, there is delegation of authority for handling exceptions to approved program lending. Control, monitoring and management of credit exposures and remedial management are done in coordination with respective Business Units as per established procedures. The risk management framework also includes policies with respect to problem recognition, early warning lists, watch lists, classification parameters and risk rating adjustments. The bank is contemplating an early warning trigger system based on predefined credit parameters and account behaviour. The Bank also undertakes stress testing of its portfolio and potential credit costs in the event of a downgrade or default by its customers.
Corporate credit
Corporate Credit Risk Division is responsible for independent assessment and control of the risks related to all Corporate, Business Banking, Financial Institutions as well as Small and Medium enterprise exposures. The credit risk associated with any corporate financing is assessed based on an analysis of the customer and the industry it operates in. The credit rating acts as a key factor in credit decisions at the time of approval and subsequent credit assessments. The Division reviews and assesses credit risk for proposed exposures prior to facilities being committed to customers by the concerned business units. Renewals and reviews of facilities are subject to the same process. Each proposal is also assessed with respect to established concentration limits for various economic sectors, countries, risk grades, etc. and deviations, if any are highlighted. The Bank follows a risk adjusted return of capital model for benchmarking risk pricing and each credit proposal is also assessed based on internal benchmarks of required risk adjusted returns. The bank has implemented a customised Moody’s Risk Analyst model for risk rating corporate borrowers. The bank maintains an accurate and consistent corporate credit rating for all its customers. The Bank has introduced facility risk rating apart from customer credit rating so as to measure the appropriate loss given default associated with each credit.
In addition to formal annual credit risk reviews of each corporate facility, more frequent reviews are also undertaken for watch list accounts, early warning accounts, lower rated customers, public companies and large exposures. Further, the Bank continues to
undertake quarterly review of financial institutions and country portfolio including stress tests and review of adverse rating migrations and outlooks in line with best practices and regulatory guidelines. The Bank also undertook a weekly review across all its business segments of early warning accounts, which showed signs of stress, and remedial action prescribed as necessary. The Bank undertook sector review of its exposure to Real estate, Construction, Steel, Healthcare and lending against shares.
A comprehensive review of the Corporate Credit Portfolio is conducted on a quarterly basis and provided to the Senior Management and the Board Risk Committee. Salient areas covered in the review include:
• Exposures downgraded/negatively migrated• Weighted average credit grade profile• Portfolio concentration/ performance
• Position of restructured exposures
• Position of past due exposures• Exposures secured by equity• Exposures to real estate and leasing sectors
• Syndicated exposures
• New relationships
• Exposures to senior members and non-resident borrowers
• Exposures to countries / financial institutions
• Clean lending and name lending exposures
The Bank introduced prudent control measures for its UAE operations in line with the changing operating environment detailed below
• Revised business focus on Oman-UAE business corridor with emphasis on businesses sponsored by Omani or reputed UAE nationals.
• Enhanced Due diligence and strengthened KYC processes
• Revised Standard Operating Procedures in line with changing business needs.
Retail credit
Retail Credit Division manages the credit risk in the retail portfolio. Credit facilities are offered to retail customers primarily based on Product Programs approved by Risk Committee of the Board. The lending criteria for these programs are regularly reviewed and, if required revised, based on an on-going analysis of product performance and portfolio credit quality and perceived risk. Credit facilities outside the Product Programs are individually assessed by the Retail Credit Risk Division and recommended to the delegated authorities.
A review of the Retail Credit Portfolio is conducted on a quarterly basis and provided to the Management Risk Committee, and to the Board Risk Committee.
152 | National Bank of Oman Annual Report 2018 | 153
Notes to the Financial StatementsAs at 31 December 2018
Notes to the Financial StatementsAs at 31 December 2018
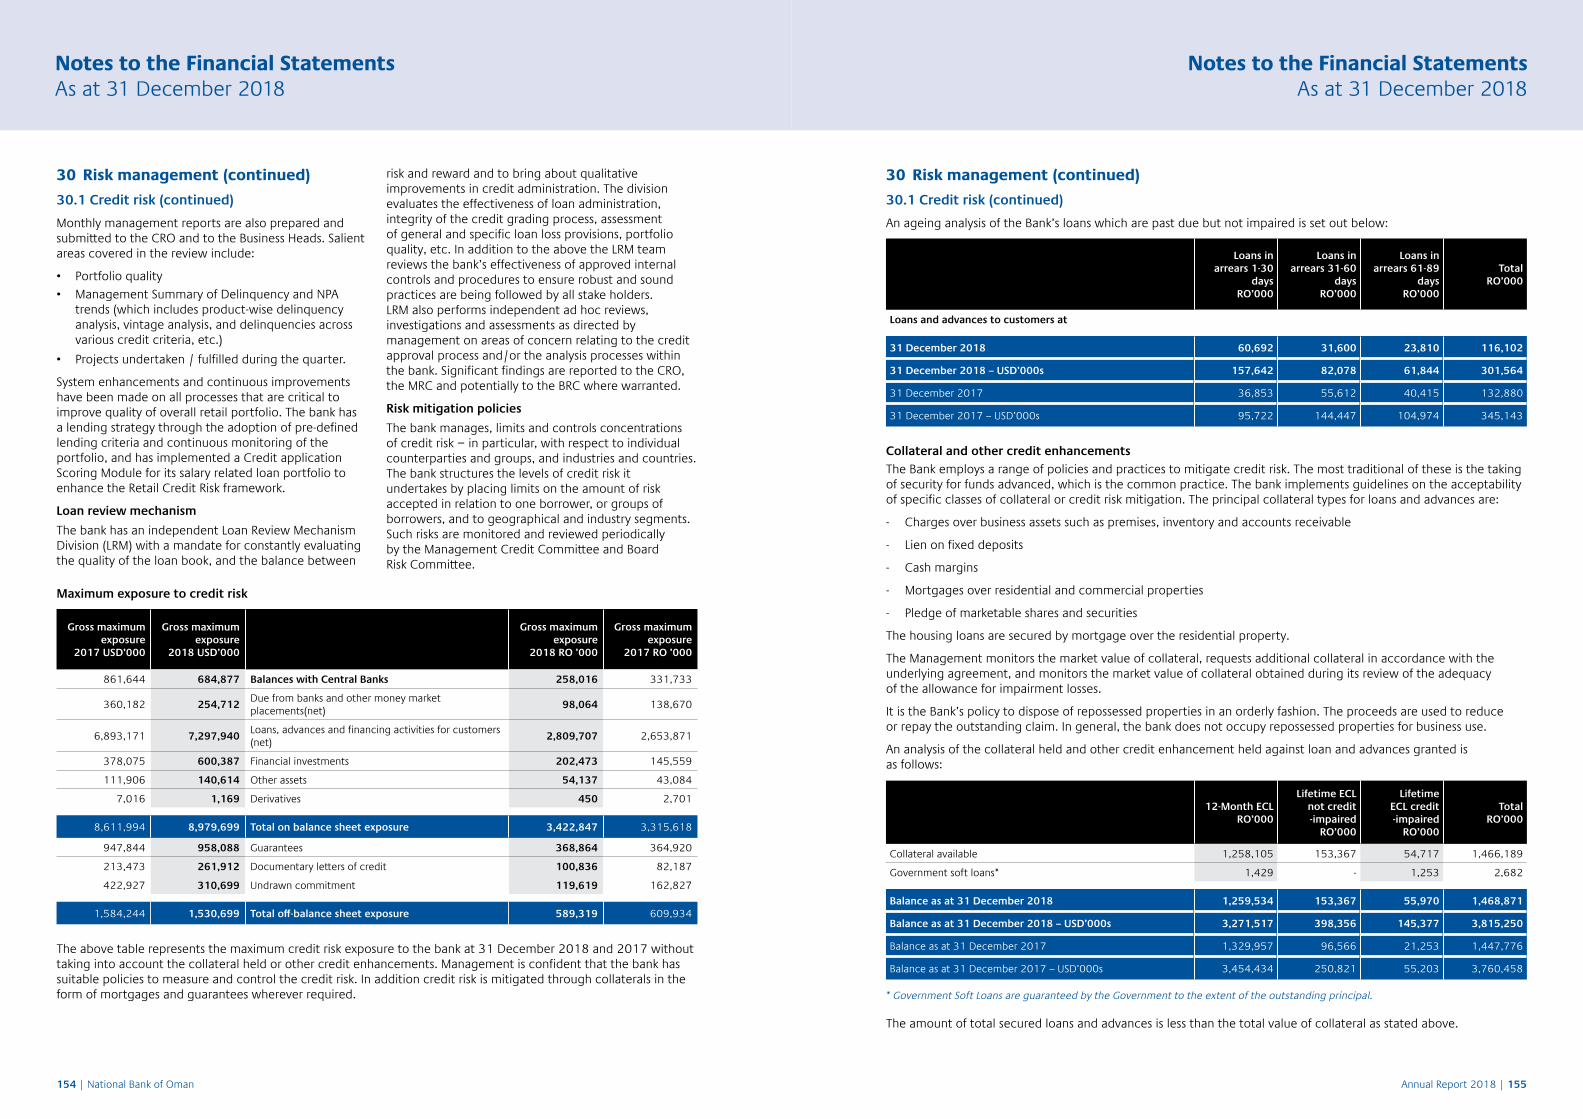
30 Risk management (continued)
30.1 Credit risk (continued)
Monthly management reports are also prepared and submitted to the CRO and to the Business Heads. Salient areas covered in the review include:
• Portfolio quality• Management Summary of Delinquency and NPA
trends (which includes product-wise delinquency analysis, vintage analysis, and delinquencies across various credit criteria, etc.)
• Projects undertaken / fulfilled during the quarter.
System enhancements and continuous improvements have been made on all processes that are critical to improve quality of overall retail portfolio. The bank has a lending strategy through the adoption of pre-defined lending criteria and continuous monitoring of the portfolio, and has implemented a Credit application Scoring Module for its salary related loan portfolio to enhance the Retail Credit Risk framework.
Loan review mechanism
The bank has an independent Loan Review Mechanism Division (LRM) with a mandate for constantly evaluating the quality of the loan book, and the balance between
risk and reward and to bring about qualitative improvements in credit administration. The division evaluates the effectiveness of loan administration, integrity of the credit grading process, assessment of general and specific loan loss provisions, portfolio quality, etc. In addition to the above the LRM team reviews the bank’s effectiveness of approved internal controls and procedures to ensure robust and sound practices are being followed by all stake holders. LRM also performs independent ad hoc reviews, investigations and assessments as directed by management on areas of concern relating to the credit approval process and/or the analysis processes within the bank. Significant findings are reported to the CRO, the MRC and potentially to the BRC where warranted.
Risk mitigation policies
The bank manages, limits and controls concentrations of credit risk − in particular, with respect to individual counterparties and groups, and industries and countries. The bank structures the levels of credit risk it undertakes by placing limits on the amount of risk accepted in relation to one borrower, or groups of borrowers, and to geographical and industry segments. Such risks are monitored and reviewed periodically by the Management Credit Committee and Board Risk Committee.
Gross maximum exposure
2017 USD’000
Gross maximum exposure
2018 USD’000
Gross maximum exposure
2018 RO ’000
Gross maximum exposure
2017 RO ’000
861,644 684,877 Balances with Central Banks 258,016 331,733
360,182 254,712Due from banks and other money market placements(net)
98,064 138,670
6,893,171 7,297,940Loans, advances and financing activities for customers (net)
2,809,707 2,653,871
378,075 600,387 Financial investments 202,473 145,559
111,906 140,614 Other assets 54,137 43,084
7,016 1,169 Derivatives 450 2,701
8,611,994 8,979,699 Total on balance sheet exposure 3,422,847 3,315,618
947,844 958,088 Guarantees 368,864 364,920
213,473 261,912 Documentary letters of credit 100,836 82,187
422,927 310,699 Undrawn commitment 119,619 162,827
1,584,244 1,530,699 Total off-balance sheet exposure 589,319 609,934
The above table represents the maximum credit risk exposure to the bank at 31 December 2018 and 2017 without taking into account the collateral held or other credit enhancements. Management is confident that the bank has suitable policies to measure and control the credit risk. In addition credit risk is mitigated through collaterals in the form of mortgages and guarantees wherever required.
Maximum exposure to credit risk
30 Risk management (continued)
30.1 Credit risk (continued)
An ageing analysis of the Bank’s loans which are past due but not impaired is set out below:
The amount of total secured loans and advances is less than the total value of collateral as stated above.
Loans in arrears 1-30
daysRO’000
Loans in arrears 31-60
daysRO’000
Loans in arrears 61-89
daysRO’000
TotalRO’000
Loans and advances to customers at
31 December 2018 60,692 31,600 23,810 116,102
31 December 2018 – USD’000s 157,642 82,078 61,844 301,564
31 December 2017 36,853 55,612 40,415 132,880
31 December 2017 – USD’000s 95,722 144,447 104,974 345,143
12-Month ECL RO’000
Lifetime ECL not credit -impaired
RO’000
Lifetime ECL credit -impaired
RO’000
TotalRO’000
Collateral available 1,258,105 153,367 54,717 1,466,189
Government soft loans* 1,429 - 1,253 2,682
Balance as at 31 December 2018 1,259,534 153,367 55,970 1,468,871
Balance as at 31 December 2018 – USD’000s 3,271,517 398,356 145,377 3,815,250
Balance as at 31 December 2017 1,329,957 96,566 21,253 1,447,776
Balance as at 31 December 2017 – USD’000s 3,454,434 250,821 55,203 3,760,458
Collateral and other credit enhancementsThe Bank employs a range of policies and practices to mitigate credit risk. The most traditional of these is the taking of security for funds advanced, which is the common practice. The bank implements guidelines on the acceptability of specific classes of collateral or credit risk mitigation. The principal collateral types for loans and advances are:
- Charges over business assets such as premises, inventory and accounts receivable
- Lien on fixed deposits
- Cash margins
- Mortgages over residential and commercial properties
- Pledge of marketable shares and securities
The housing loans are secured by mortgage over the residential property.
The Management monitors the market value of collateral, requests additional collateral in accordance with the underlying agreement, and monitors the market value of collateral obtained during its review of the adequacy of the allowance for impairment losses.
It is the Bank’s policy to dispose of repossessed properties in an orderly fashion. The proceeds are used to reduce or repay the outstanding claim. In general, the bank does not occupy repossessed properties for business use.
An analysis of the collateral held and other credit enhancement held against loan and advances granted is as follows:
* Government Soft Loans are guaranteed by the Government to the extent of the outstanding principal.
154 | National Bank of Oman Annual Report 2018 | 155
Notes to the Financial StatementsAs at 31 December 2018
Notes to the Financial StatementsAs at 31 December 2018
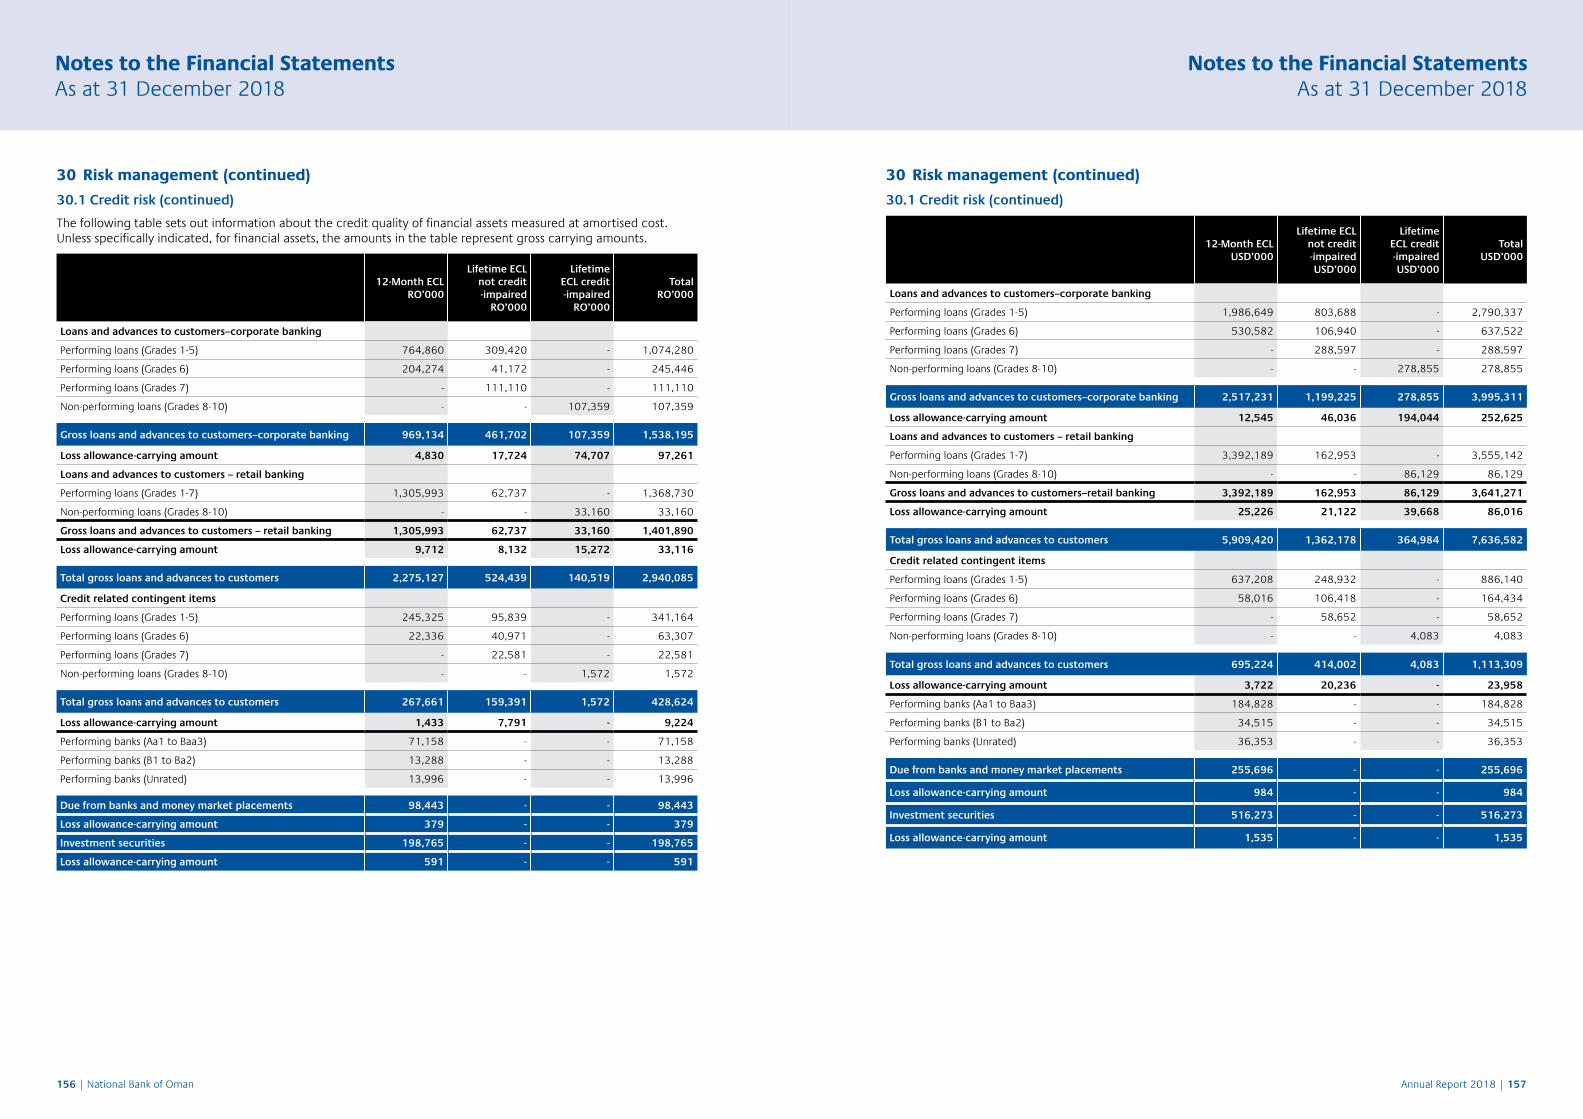
30 Risk management (continued)
30.1 Credit risk (continued)
The following table sets out information about the credit quality of financial assets measured at amortised cost. Unless specifically indicated, for financial assets, the amounts in the table represent gross carrying amounts.
12-Month ECL RO’000
Lifetime ECL not credit -impaired
RO’000
Lifetime ECL credit -impaired
RO’000
TotalRO’000
Loans and advances to customers–corporate banking
Performing loans (Grades 1-5) 764,860 309,420 - 1,074,280
Performing loans (Grades 6) 204,274 41,172 - 245,446
Performing loans (Grades 7) - 111,110 - 111,110
Non-performing loans (Grades 8-10) - - 107,359 107,359
Gross loans and advances to customers–corporate banking 969,134 461,702 107,359 1,538,195
Loss allowance-carrying amount 4,830 17,724 74,707 97,261
Loans and advances to customers – retail banking
Performing loans (Grades 1-7) 1,305,993 62,737 - 1,368,730
Non-performing loans (Grades 8-10) - - 33,160 33,160
Gross loans and advances to customers – retail banking 1,305,993 62,737 33,160 1,401,890
Loss allowance-carrying amount 9,712 8,132 15,272 33,116
Total gross loans and advances to customers 2,275,127 524,439 140,519 2,940,085
Credit related contingent items
Performing loans (Grades 1-5) 245,325 95,839 - 341,164
Performing loans (Grades 6) 22,336 40,971 - 63,307
Performing loans (Grades 7) - 22,581 - 22,581
Non-performing loans (Grades 8-10) - - 1,572 1,572
Total gross loans and advances to customers 267,661 159,391 1,572 428,624
Loss allowance-carrying amount 1,433 7,791 - 9,224
Performing banks (Aa1 to Baa3) 71,158 - - 71,158
Performing banks (B1 to Ba2) 13,288 - - 13,288
Performing banks (Unrated) 13,996 - - 13,996
Due from banks and money market placements 98,443 - - 98,443
Loss allowance-carrying amount 379 - - 379
Investment securities 198,765 - - 198,765
Loss allowance-carrying amount 591 - - 591
30 Risk management (continued)
30.1 Credit risk (continued)
12-Month ECL USD’000
Lifetime ECL not credit -impairedUSD’000
Lifetime ECL credit -impairedUSD’000
TotalUSD’000
Loans and advances to customers–corporate banking
Performing loans (Grades 1-5) 1,986,649 803,688 - 2,790,337
Performing loans (Grades 6) 530,582 106,940 - 637,522
Performing loans (Grades 7) - 288,597 - 288,597
Non-performing loans (Grades 8-10) - - 278,855 278,855
Gross loans and advances to customers–corporate banking 2,517,231 1,199,225 278,855 3,995,311
Loss allowance-carrying amount 12,545 46,036 194,044 252,625
Loans and advances to customers – retail banking
Performing loans (Grades 1-7) 3,392,189 162,953 - 3,555,142
Non-performing loans (Grades 8-10) - - 86,129 86,129
Gross loans and advances to customers–retail banking 3,392,189 162,953 86,129 3,641,271
Loss allowance-carrying amount 25,226 21,122 39,668 86,016
Total gross loans and advances to customers 5,909,420 1,362,178 364,984 7,636,582
Credit related contingent items
Performing loans (Grades 1-5) 637,208 248,932 - 886,140
Performing loans (Grades 6) 58,016 106,418 - 164,434
Performing loans (Grades 7) - 58,652 - 58,652
Non-performing loans (Grades 8-10) - - 4,083 4,083
Total gross loans and advances to customers 695,224 414,002 4,083 1,113,309
Loss allowance-carrying amount 3,722 20,236 - 23,958
Performing banks (Aa1 to Baa3) 184,828 - - 184,828
Performing banks (B1 to Ba2) 34,515 - - 34,515
Performing banks (Unrated) 36,353 - - 36,353
Due from banks and money market placements 255,696 - - 255,696
Loss allowance-carrying amount 984 - - 984
Investment securities 516,273 - - 516,273
Loss allowance-carrying amount 1,535 - - 1,535
156 | National Bank of Oman Annual Report 2018 | 157
Notes to the Financial StatementsAs at 31 December 2018
Notes to the Financial StatementsAs at 31 December 2018
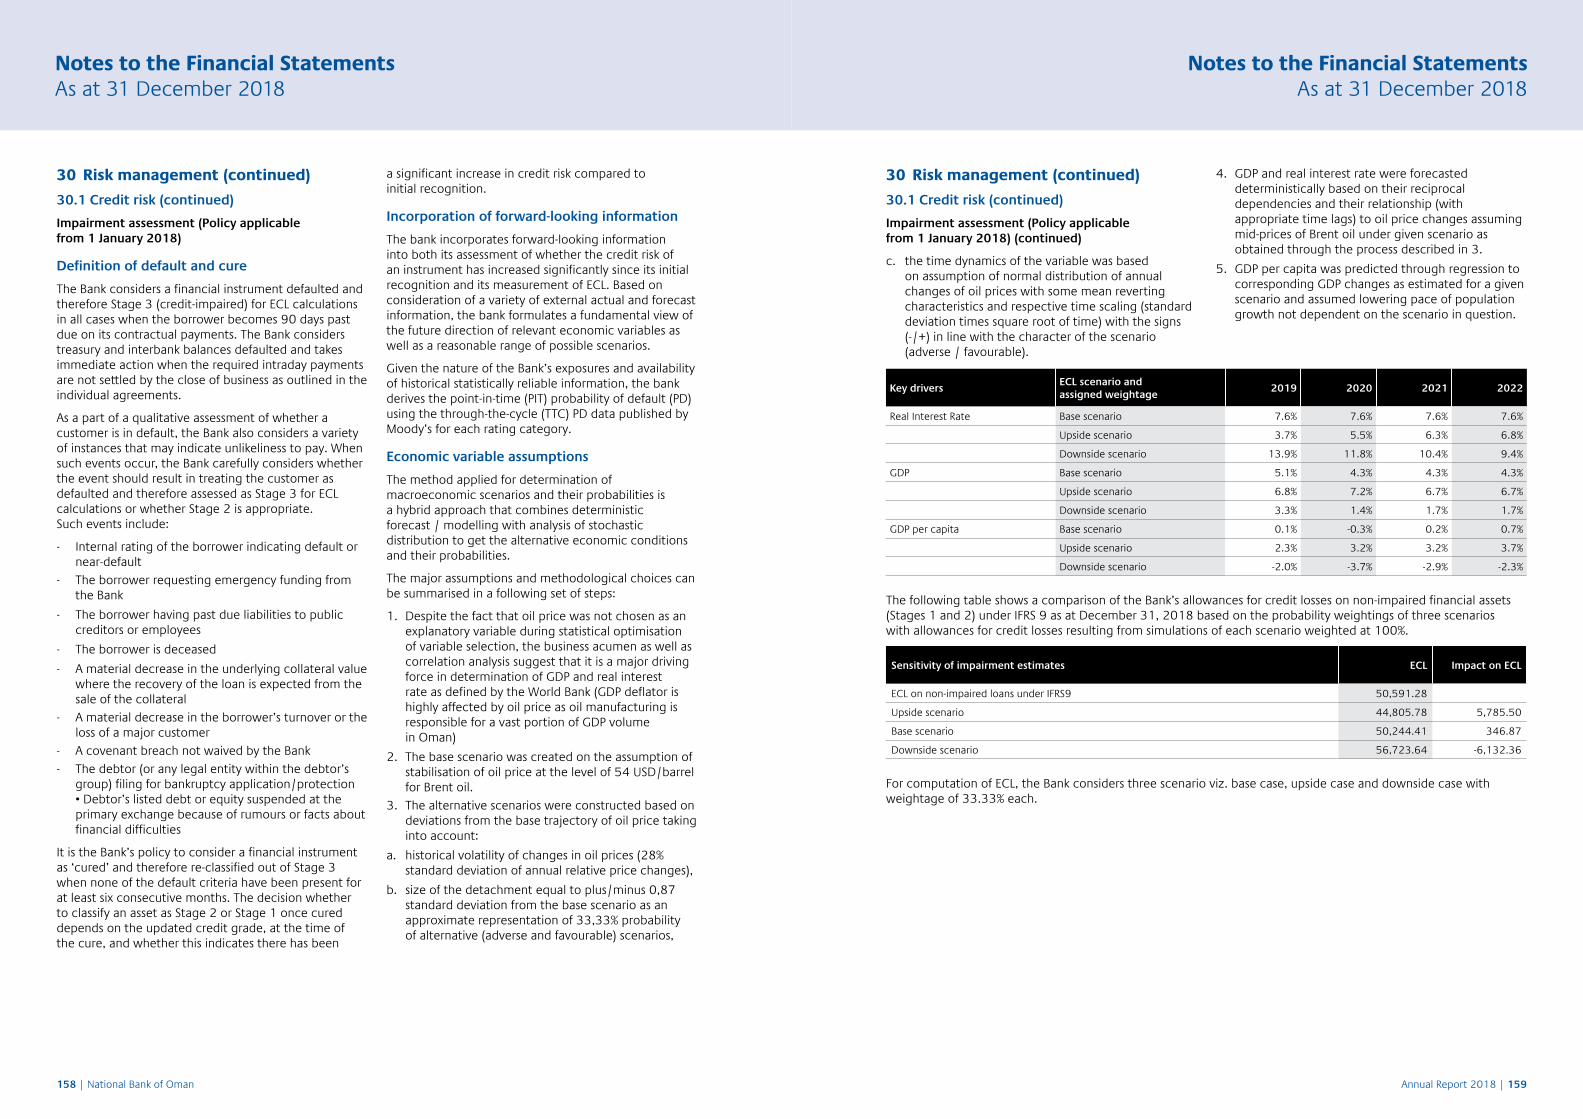
30 Risk management (continued)
30.1 Credit risk (continued)
Impairment assessment (Policy applicable from 1 January 2018)
Definition of default and cure
The Bank considers a financial instrument defaulted and therefore Stage 3 (credit-impaired) for ECL calculations in all cases when the borrower becomes 90 days past due on its contractual payments. The Bank considers treasury and interbank balances defaulted and takes immediate action when the required intraday payments are not settled by the close of business as outlined in the individual agreements.
As a part of a qualitative assessment of whether a customer is in default, the Bank also considers a variety of instances that may indicate unlikeliness to pay. When such events occur, the Bank carefully considers whether the event should result in treating the customer as defaulted and therefore assessed as Stage 3 for ECL calculations or whether Stage 2 is appropriate. Such events include:
- Internal rating of the borrower indicating default or near-default
- The borrower requesting emergency funding from the Bank
- The borrower having past due liabilities to public creditors or employees
- The borrower is deceased
- A material decrease in the underlying collateral value where the recovery of the loan is expected from the sale of the collateral
- A material decrease in the borrower’s turnover or the loss of a major customer
- A covenant breach not waived by the Bank- The debtor (or any legal entity within the debtor’s
group) filing for bankruptcy application/protection • Debtor’s listed debt or equity suspended at the primary exchange because of rumours or facts about financial difficulties
It is the Bank’s policy to consider a financial instrument as ‘cured’ and therefore re-classified out of Stage 3 when none of the default criteria have been present for at least six consecutive months. The decision whether to classify an asset as Stage 2 or Stage 1 once cured depends on the updated credit grade, at the time of the cure, and whether this indicates there has been
a significant increase in credit risk compared to initial recognition.
Incorporation of forward-looking information
The bank incorporates forward-looking information into both its assessment of whether the credit risk of an instrument has increased significantly since its initial recognition and its measurement of ECL. Based on consideration of a variety of external actual and forecast information, the bank formulates a fundamental view of the future direction of relevant economic variables as well as a reasonable range of possible scenarios.
Given the nature of the Bank’s exposures and availability of historical statistically reliable information, the bank derives the point-in-time (PIT) probability of default (PD) using the through-the-cycle (TTC) PD data published by Moody’s for each rating category.
Economic variable assumptions
The method applied for determination of macroeconomic scenarios and their probabilities is a hybrid approach that combines deterministic forecast / modelling with analysis of stochastic distribution to get the alternative economic conditions and their probabilities.
The major assumptions and methodological choices can be summarised in a following set of steps:
1. Despite the fact that oil price was not chosen as an explanatory variable during statistical optimisation of variable selection, the business acumen as well as correlation analysis suggest that it is a major driving force in determination of GDP and real interest rate as defined by the World Bank (GDP deflator is highly affected by oil price as oil manufacturing is responsible for a vast portion of GDP volume in Oman)
2. The base scenario was created on the assumption of stabilisation of oil price at the level of 54 USD/barrel for Brent oil.
3. The alternative scenarios were constructed based on deviations from the base trajectory of oil price taking into account:
a. historical volatility of changes in oil prices (28% standard deviation of annual relative price changes),
b. size of the detachment equal to plus/minus 0,87 standard deviation from the base scenario as an approximate representation of 33,33% probability of alternative (adverse and favourable) scenarios,
30 Risk management (continued)
30.1 Credit risk (continued)
Impairment assessment (Policy applicable from 1 January 2018) (continued)
c. the time dynamics of the variable was based on assumption of normal distribution of annual changes of oil prices with some mean reverting characteristics and respective time scaling (standard deviation times square root of time) with the signs (-/+) in line with the character of the scenario (adverse / favourable).
4. GDP and real interest rate were forecasted deterministically based on their reciprocal dependencies and their relationship (with appropriate time lags) to oil price changes assuming mid-prices of Brent oil under given scenario as obtained through the process described in 3.
5. GDP per capita was predicted through regression to corresponding GDP changes as estimated for a given scenario and assumed lowering pace of population growth not dependent on the scenario in question.
The following table shows a comparison of the Bank’s allowances for credit losses on non-impaired financial assets (Stages 1 and 2) under IFRS 9 as at December 31, 2018 based on the probability weightings of three scenarios with allowances for credit losses resulting from simulations of each scenario weighted at 100%.
For computation of ECL, the Bank considers three scenario viz. base case, upside case and downside case with weightage of 33.33% each.
Key driversECL scenario and assigned weightage
2019 2020 2021 2022
Real Interest Rate Base scenario 7.6% 7.6% 7.6% 7.6%
Upside scenario 3.7% 5.5% 6.3% 6.8%
Downside scenario 13.9% 11.8% 10.4% 9.4%
GDP Base scenario 5.1% 4.3% 4.3% 4.3%
Upside scenario 6.8% 7.2% 6.7% 6.7%
Downside scenario 3.3% 1.4% 1.7% 1.7%
GDP per capita Base scenario 0.1% -0.3% 0.2% 0.7%
Upside scenario 2.3% 3.2% 3.2% 3.7%
Downside scenario -2.0% -3.7% -2.9% -2.3%
Sensitivity of impairment estimates ECL Impact on ECL
ECL on non-impaired loans under IFRS9 50,591.28
Upside scenario 44,805.78 5,785.50
Base scenario 50,244.41 346.87
Downside scenario 56,723.64 -6,132.36
158 | National Bank of Oman Annual Report 2018 | 159
Notes to the Financial StatementsAs at 31 December 2018
Notes to the Financial StatementsAs at 31 December 2018
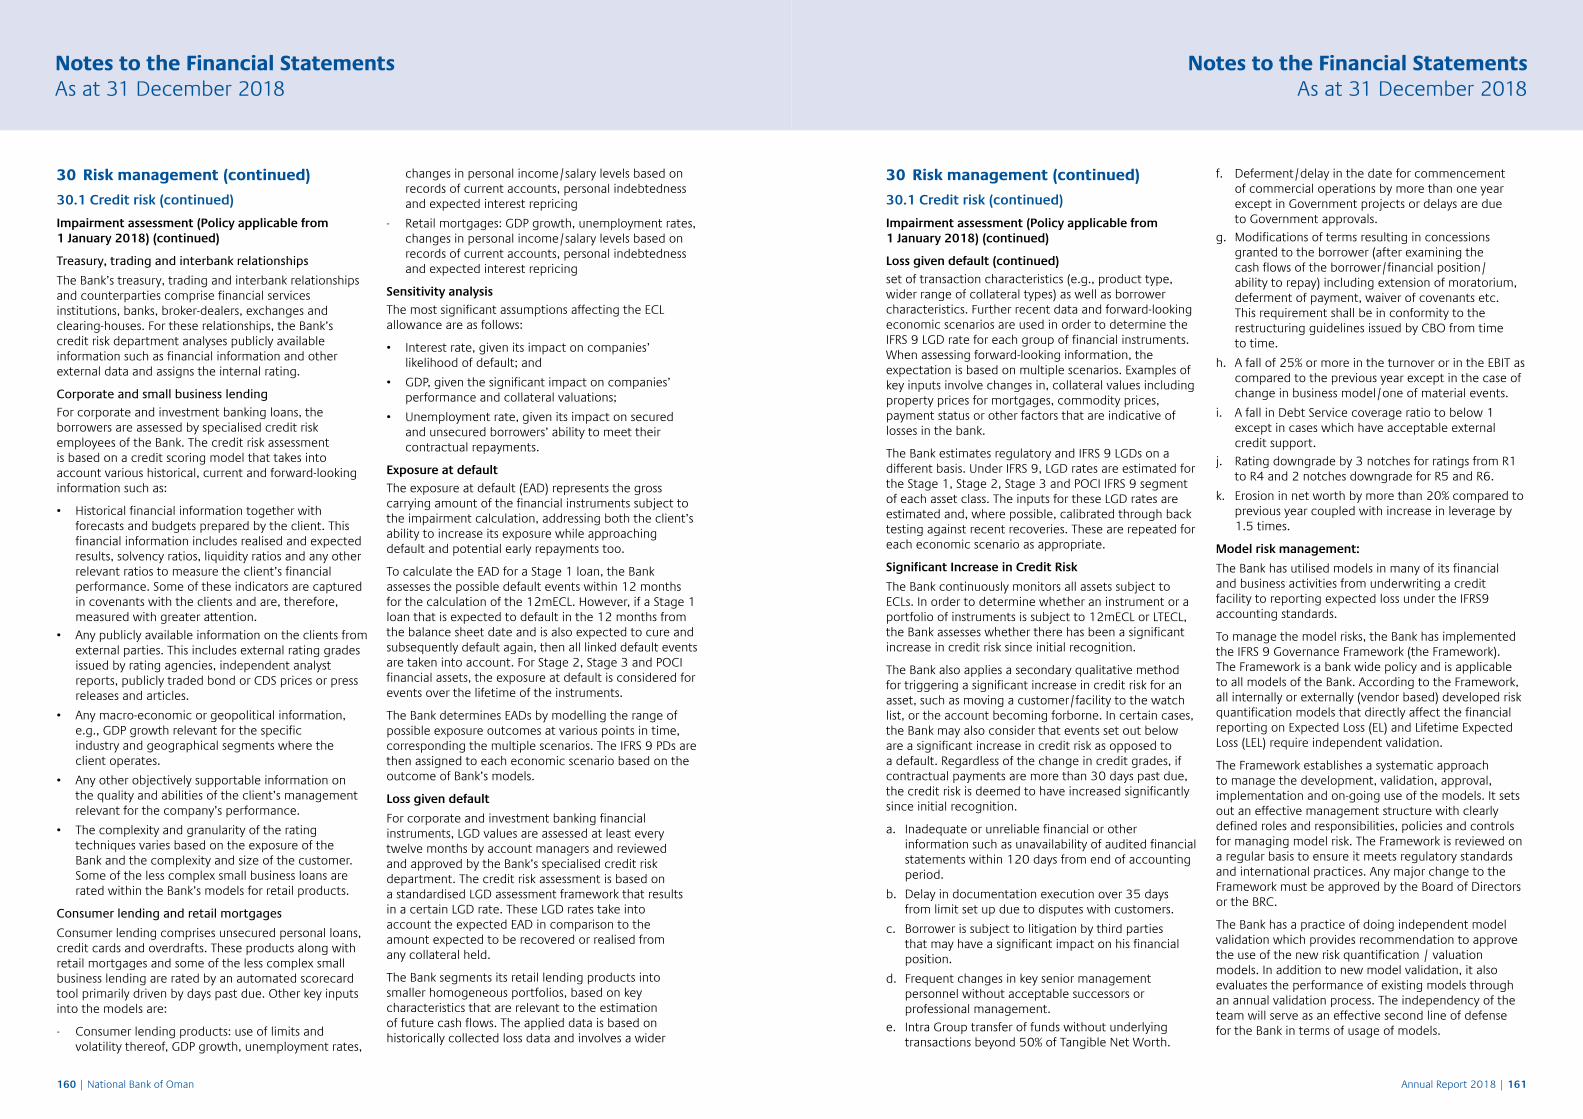
30 Risk management (continued)
30.1 Credit risk (continued)
Impairment assessment (Policy applicable from 1 January 2018) (continued)
Treasury, trading and interbank relationships
The Bank’s treasury, trading and interbank relationships and counterparties comprise financial services institutions, banks, broker-dealers, exchanges and clearing-houses. For these relationships, the Bank’s credit risk department analyses publicly available information such as financial information and other external data and assigns the internal rating.
Corporate and small business lendingFor corporate and investment banking loans, the borrowers are assessed by specialised credit risk employees of the Bank. The credit risk assessment is based on a credit scoring model that takes into account various historical, current and forward-looking information such as:
• Historical financial information together with forecasts and budgets prepared by the client. This financial information includes realised and expected results, solvency ratios, liquidity ratios and any other relevant ratios to measure the client’s financial performance. Some of these indicators are captured in covenants with the clients and are, therefore, measured with greater attention.
• Any publicly available information on the clients from external parties. This includes external rating grades issued by rating agencies, independent analyst reports, publicly traded bond or CDS prices or press releases and articles.
• Any macro-economic or geopolitical information, e.g., GDP growth relevant for the specific industry and geographical segments where the client operates.
• Any other objectively supportable information on the quality and abilities of the client’s management relevant for the company’s performance.
• The complexity and granularity of the rating techniques varies based on the exposure of the Bank and the complexity and size of the customer. Some of the less complex small business loans are rated within the Bank’s models for retail products.
Consumer lending and retail mortgages
Consumer lending comprises unsecured personal loans, credit cards and overdrafts. These products along with retail mortgages and some of the less complex small business lending are rated by an automated scorecard tool primarily driven by days past due. Other key inputs into the models are:
- Consumer lending products: use of limits and volatility thereof, GDP growth, unemployment rates,
changes in personal income/salary levels based on records of current accounts, personal indebtedness and expected interest repricing
- Retail mortgages: GDP growth, unemployment rates, changes in personal income/salary levels based on records of current accounts, personal indebtedness and expected interest repricing
Sensitivity analysisThe most significant assumptions affecting the ECL allowance are as follows:
• Interest rate, given its impact on companies’ likelihood of default; and
• GDP, given the significant impact on companies’ performance and collateral valuations;
• Unemployment rate, given its impact on secured and unsecured borrowers’ ability to meet their contractual repayments.
Exposure at defaultThe exposure at default (EAD) represents the gross carrying amount of the financial instruments subject to the impairment calculation, addressing both the client’s ability to increase its exposure while approaching default and potential early repayments too.
To calculate the EAD for a Stage 1 loan, the Bank assesses the possible default events within 12 months for the calculation of the 12mECL. However, if a Stage 1 loan that is expected to default in the 12 months from the balance sheet date and is also expected to cure and subsequently default again, then all linked default events are taken into account. For Stage 2, Stage 3 and POCI financial assets, the exposure at default is considered for events over the lifetime of the instruments.
The Bank determines EADs by modelling the range of possible exposure outcomes at various points in time, corresponding the multiple scenarios. The IFRS 9 PDs are then assigned to each economic scenario based on the outcome of Bank’s models.
Loss given default
For corporate and investment banking financial instruments, LGD values are assessed at least every twelve months by account managers and reviewed and approved by the Bank’s specialised credit risk department. The credit risk assessment is based on a standardised LGD assessment framework that results in a certain LGD rate. These LGD rates take into account the expected EAD in comparison to the amount expected to be recovered or realised from any collateral held.
The Bank segments its retail lending products into smaller homogeneous portfolios, based on key characteristics that are relevant to the estimation of future cash flows. The applied data is based on historically collected loss data and involves a wider
30 Risk management (continued)
30.1 Credit risk (continued)
Impairment assessment (Policy applicable from 1 January 2018) (continued)
Loss given default (continued)set of transaction characteristics (e.g., product type, wider range of collateral types) as well as borrower characteristics. Further recent data and forward-looking economic scenarios are used in order to determine the IFRS 9 LGD rate for each group of financial instruments. When assessing forward-looking information, the expectation is based on multiple scenarios. Examples of key inputs involve changes in, collateral values including property prices for mortgages, commodity prices, payment status or other factors that are indicative of losses in the bank.
The Bank estimates regulatory and IFRS 9 LGDs on a different basis. Under IFRS 9, LGD rates are estimated for the Stage 1, Stage 2, Stage 3 and POCI IFRS 9 segment of each asset class. The inputs for these LGD rates are estimated and, where possible, calibrated through back testing against recent recoveries. These are repeated for each economic scenario as appropriate.
Significant Increase in Credit Risk
The Bank continuously monitors all assets subject to ECLs. In order to determine whether an instrument or a portfolio of instruments is subject to 12mECL or LTECL, the Bank assesses whether there has been a significant increase in credit risk since initial recognition.
The Bank also applies a secondary qualitative method for triggering a significant increase in credit risk for an asset, such as moving a customer/facility to the watch list, or the account becoming forborne. In certain cases, the Bank may also consider that events set out below are a significant increase in credit risk as opposed to a default. Regardless of the change in credit grades, if contractual payments are more than 30 days past due, the credit risk is deemed to have increased significantly since initial recognition.
a. Inadequate or unreliable financial or other information such as unavailability of audited financial statements within 120 days from end of accounting period.
b. Delay in documentation execution over 35 days from limit set up due to disputes with customers.
c. Borrower is subject to litigation by third parties that may have a significant impact on his financial position.
d. Frequent changes in key senior management personnel without acceptable successors or professional management.
e. Intra Group transfer of funds without underlying transactions beyond 50% of Tangible Net Worth.
f. Deferment/delay in the date for commencement of commercial operations by more than one year except in Government projects or delays are due to Government approvals.
g. Modifications of terms resulting in concessions granted to the borrower (after examining the cash flows of the borrower/financial position/ability to repay) including extension of moratorium, deferment of payment, waiver of covenants etc. This requirement shall be in conformity to the restructuring guidelines issued by CBO from time to time.
h. A fall of 25% or more in the turnover or in the EBIT as compared to the previous year except in the case of change in business model/one of material events.
i. A fall in Debt Service coverage ratio to below 1 except in cases which have acceptable external credit support.
j. Rating downgrade by 3 notches for ratings from R1 to R4 and 2 notches downgrade for R5 and R6.
k. Erosion in net worth by more than 20% compared to previous year coupled with increase in leverage by 1.5 times.
Model risk management:
The Bank has utilised models in many of its financial and business activities from underwriting a credit facility to reporting expected loss under the IFRS9 accounting standards.
To manage the model risks, the Bank has implemented the IFRS 9 Governance Framework (the Framework). The Framework is a bank wide policy and is applicable to all models of the Bank. According to the Framework, all internally or externally (vendor based) developed risk quantification models that directly affect the financial reporting on Expected Loss (EL) and Lifetime Expected Loss (LEL) require independent validation.
The Framework establishes a systematic approach to manage the development, validation, approval, implementation and on-going use of the models. It sets out an effective management structure with clearly defined roles and responsibilities, policies and controls for managing model risk. The Framework is reviewed on a regular basis to ensure it meets regulatory standards and international practices. Any major change to the Framework must be approved by the Board of Directors or the BRC.
The Bank has a practice of doing independent model validation which provides recommendation to approve the use of the new risk quantification / valuation models. In addition to new model validation, it also evaluates the performance of existing models through an annual validation process. The independency of the team will serve as an effective second line of defense for the Bank in terms of usage of models.
160 | National Bank of Oman Annual Report 2018 | 161
Notes to the Financial StatementsAs at 31 December 2018
Notes to the Financial StatementsAs at 31 December 2018
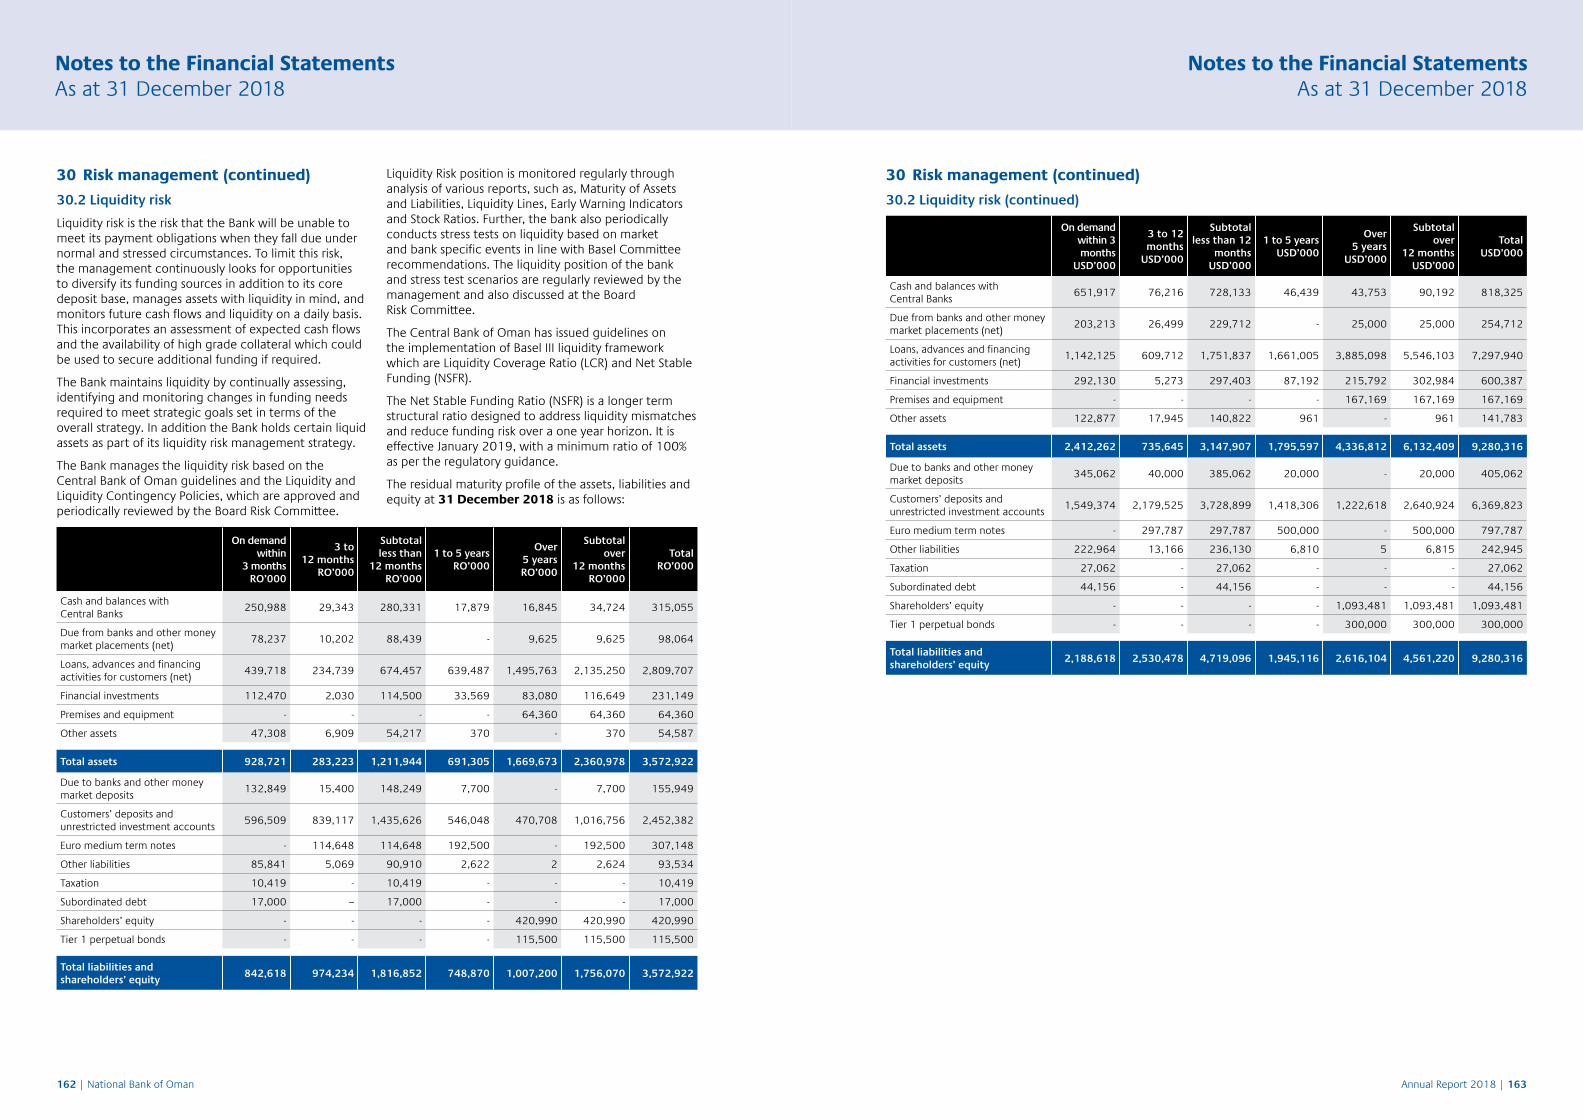
30 Risk management (continued)
30.2 Liquidity risk
Liquidity risk is the risk that the Bank will be unable to meet its payment obligations when they fall due under normal and stressed circumstances. To limit this risk, the management continuously looks for opportunities to diversify its funding sources in addition to its core deposit base, manages assets with liquidity in mind, and monitors future cash flows and liquidity on a daily basis. This incorporates an assessment of expected cash flows and the availability of high grade collateral which could be used to secure additional funding if required.
The Bank maintains liquidity by continually assessing, identifying and monitoring changes in funding needs required to meet strategic goals set in terms of the overall strategy. In addition the Bank holds certain liquid assets as part of its liquidity risk management strategy.
The Bank manages the liquidity risk based on the Central Bank of Oman guidelines and the Liquidity and Liquidity Contingency Policies, which are approved and periodically reviewed by the Board Risk Committee.
Liquidity Risk position is monitored regularly through analysis of various reports, such as, Maturity of Assets and Liabilities, Liquidity Lines, Early Warning Indicators and Stock Ratios. Further, the bank also periodically conducts stress tests on liquidity based on market and bank specific events in line with Basel Committee recommendations. The liquidity position of the bank and stress test scenarios are regularly reviewed by the management and also discussed at the Board Risk Committee.
The Central Bank of Oman has issued guidelines on the implementation of Basel III liquidity framework which are Liquidity Coverage Ratio (LCR) and Net Stable Funding (NSFR).
The Net Stable Funding Ratio (NSFR) is a longer term structural ratio designed to address liquidity mismatches and reduce funding risk over a one year horizon. It is effective January 2019, with a minimum ratio of 100% as per the regulatory guidance.
The residual maturity profile of the assets, liabilities and equity at 31 December 2018 is as follows:
On demand within
3 monthsRO’000
3 to 12 months
RO’000
Subtotal less than
12 monthsRO’000
1 to 5 yearsRO’000
Over 5 yearsRO’000
Subtotal over
12 monthsRO’000
TotalRO’000
Cash and balances with Central Banks
250,988 29,343 280,331 17,879 16,845 34,724 315,055
Due from banks and other money market placements (net)
78,237 10,202 88,439 - 9,625 9,625 98,064
Loans, advances and financing activities for customers (net)
439,718 234,739 674,457 639,487 1,495,763 2,135,250 2,809,707
Financial investments 112,470 2,030 114,500 33,569 83,080 116,649 231,149
Premises and equipment - - - - 64,360 64,360 64,360
Other assets 47,308 6,909 54,217 370 - 370 54,587
Total assets 928,721 283,223 1,211,944 691,305 1,669,673 2,360,978 3,572,922
Due to banks and other money market deposits
132,849 15,400 148,249 7,700 - 7,700 155,949
Customers’ deposits and unrestricted investment accounts
596,509 839,117 1,435,626 546,048 470,708 1,016,756 2,452,382
Euro medium term notes - 114,648 114,648 192,500 - 192,500 307,148
Other liabilities 85,841 5,069 90,910 2,622 2 2,624 93,534
Taxation 10,419 - 10,419 - - - 10,419
Subordinated debt 17,000 – 17,000 - - - 17,000
Shareholders’ equity - - - - 420,990 420,990 420,990
Tier 1 perpetual bonds - - - - 115,500 115,500 115,500
Total liabilities and shareholders’ equity
842,618 974,234 1,816,852 748,870 1,007,200 1,756,070 3,572,922
On demand within 3 months
USD’000
3 to 12 months
USD’000
Subtotal less than 12
monthsUSD’000
1 to 5 yearsUSD’000
Over 5 years
USD’000
Subtotal over
12 monthsUSD’000
TotalUSD’000
Cash and balances with Central Banks
651,917 76,216 728,133 46,439 43,753 90,192 818,325
Due from banks and other money market placements (net)
203,213 26,499 229,712 - 25,000 25,000 254,712
Loans, advances and financing activities for customers (net)
1,142,125 609,712 1,751,837 1,661,005 3,885,098 5,546,103 7,297,940
Financial investments 292,130 5,273 297,403 87,192 215,792 302,984 600,387
Premises and equipment - - - - 167,169 167,169 167,169
Other assets 122,877 17,945 140,822 961 - 961 141,783
Total assets 2,412,262 735,645 3,147,907 1,795,597 4,336,812 6,132,409 9,280,316
Due to banks and other money market deposits
345,062 40,000 385,062 20,000 - 20,000 405,062
Customers’ deposits and unrestricted investment accounts
1,549,374 2,179,525 3,728,899 1,418,306 1,222,618 2,640,924 6,369,823
Euro medium term notes - 297,787 297,787 500,000 - 500,000 797,787
Other liabilities 222,964 13,166 236,130 6,810 5 6,815 242,945
Taxation 27,062 - 27,062 - - - 27,062
Subordinated debt 44,156 - 44,156 - - - 44,156
Shareholders’ equity - - - - 1,093,481 1,093,481 1,093,481
Tier 1 perpetual bonds - - - - 300,000 300,000 300,000
Total liabilities and shareholders’ equity
2,188,618 2,530,478 4,719,096 1,945,116 2,616,104 4,561,220 9,280,316
30 Risk management (continued)
30.2 Liquidity risk (continued)
162 | National Bank of Oman Annual Report 2018 | 163
Notes to the Financial StatementsAs at 31 December 2018
Notes to the Financial StatementsAs at 31 December 2018
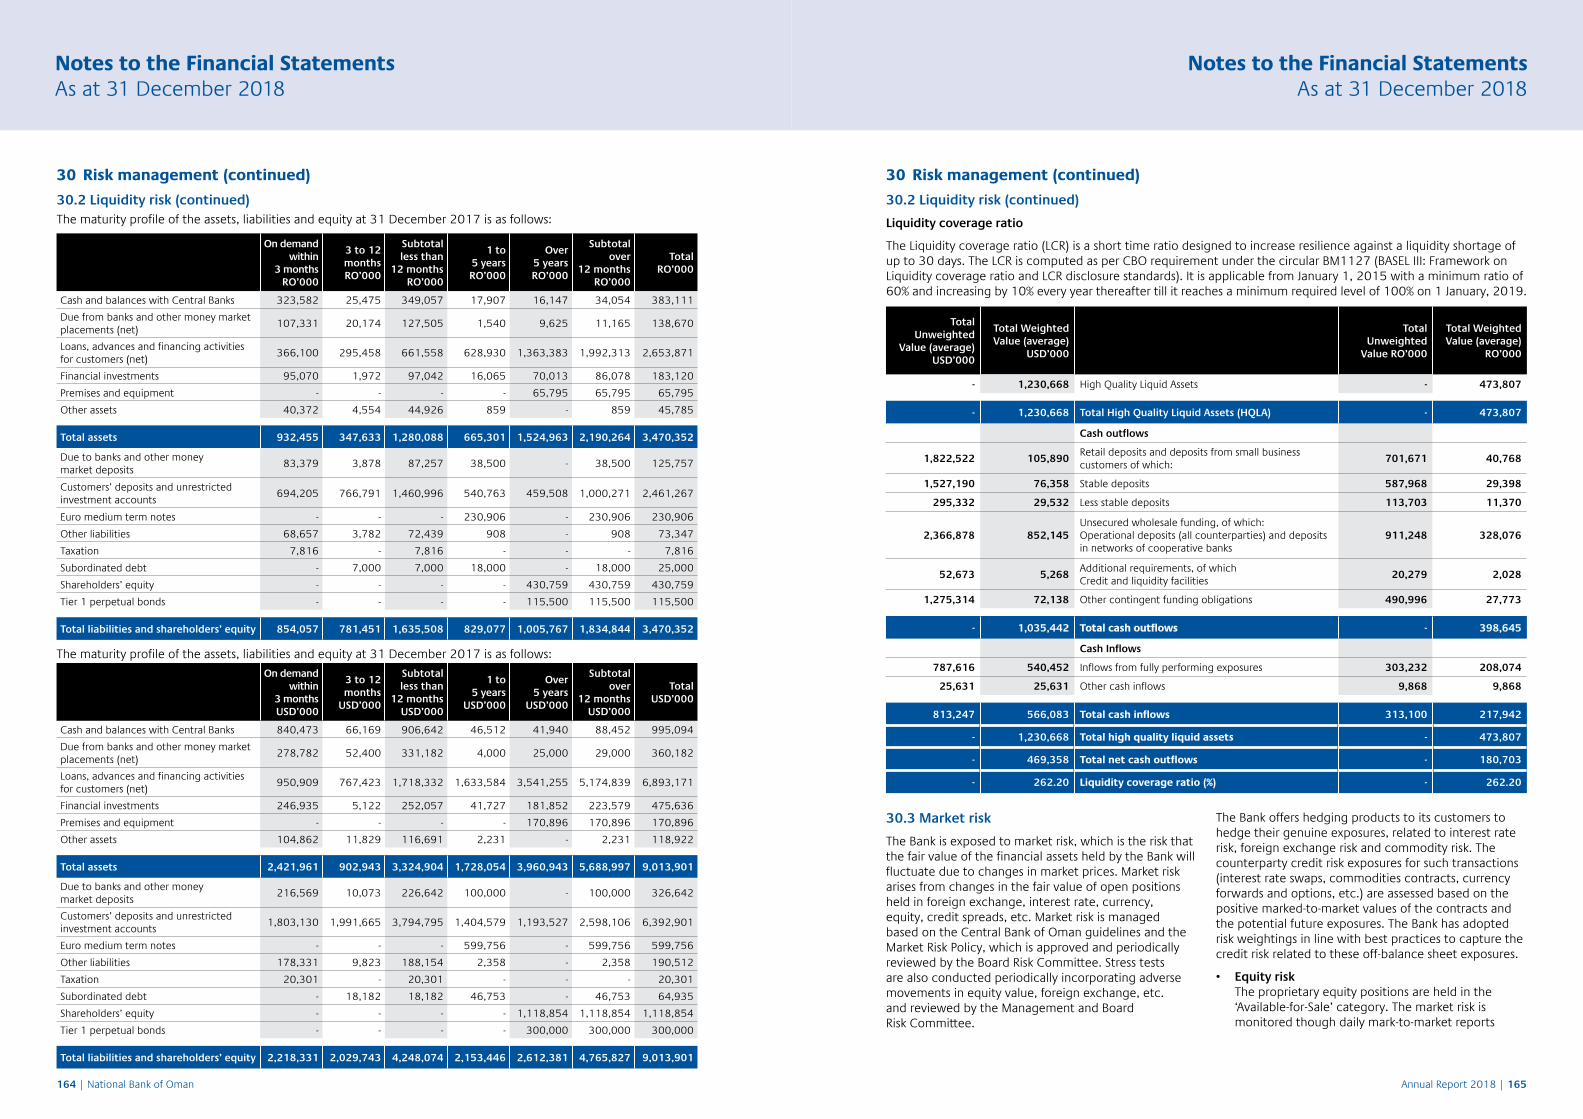
On demand within
3 monthsUSD’000
3 to 12 months
USD’000
Subtotal less than
12 monthsUSD’000
1 to 5 years
USD’000
Over 5 years
USD’000
Subtotal over
12 monthsUSD’000
TotalUSD’000
Cash and balances with Central Banks 840,473 66,169 906,642 46,512 41,940 88,452 995,094
Due from banks and other money market placements (net)
278,782 52,400 331,182 4,000 25,000 29,000 360,182
Loans, advances and financing activities for customers (net)
950,909 767,423 1,718,332 1,633,584 3,541,255 5,174,839 6,893,171
Financial investments 246,935 5,122 252,057 41,727 181,852 223,579 475,636
Premises and equipment - - - - 170,896 170,896 170,896
Other assets 104,862 11,829 116,691 2,231 - 2,231 118,922
Total assets 2,421,961 902,943 3,324,904 1,728,054 3,960,943 5,688,997 9,013,901
Due to banks and other money market deposits
216,569 10,073 226,642 100,000 - 100,000 326,642
Customers’ deposits and unrestricted investment accounts
1,803,130 1,991,665 3,794,795 1,404,579 1,193,527 2,598,106 6,392,901
Euro medium term notes - - - 599,756 - 599,756 599,756
Other liabilities 178,331 9,823 188,154 2,358 - 2,358 190,512
Taxation 20,301 - 20,301 - - - 20,301
Subordinated debt - 18,182 18,182 46,753 - 46,753 64,935
Shareholders’ equity - - - - 1,118,854 1,118,854 1,118,854
Tier 1 perpetual bonds - - - - 300,000 300,000 300,000
Total liabilities and shareholders’ equity 2,218,331 2,029,743 4,248,074 2,153,446 2,612,381 4,765,827 9,013,901
The maturity profile of the assets, liabilities and equity at 31 December 2017 is as follows:
On demand within
3 monthsRO’000
3 to 12 monthsRO’000
Subtotal less than
12 monthsRO’000
1 to 5 yearsRO’000
Over 5 yearsRO’000
Subtotal over
12 monthsRO’000
TotalRO’000
Cash and balances with Central Banks 323,582 25,475 349,057 17,907 16,147 34,054 383,111
Due from banks and other money market placements (net)
107,331 20,174 127,505 1,540 9,625 11,165 138,670
Loans, advances and financing activities for customers (net)
366,100 295,458 661,558 628,930 1,363,383 1,992,313 2,653,871
Financial investments 95,070 1,972 97,042 16,065 70,013 86,078 183,120
Premises and equipment - - - - 65,795 65,795 65,795
Other assets 40,372 4,554 44,926 859 - 859 45,785
Total assets 932,455 347,633 1,280,088 665,301 1,524,963 2,190,264 3,470,352
Due to banks and other money market deposits
83,379 3,878 87,257 38,500 - 38,500 125,757
Customers’ deposits and unrestricted investment accounts
694,205 766,791 1,460,996 540,763 459,508 1,000,271 2,461,267
Euro medium term notes - - - 230,906 - 230,906 230,906
Other liabilities 68,657 3,782 72,439 908 - 908 73,347
Taxation 7,816 - 7,816 - - - 7,816
Subordinated debt - 7,000 7,000 18,000 - 18,000 25,000
Shareholders’ equity - - - - 430,759 430,759 430,759
Tier 1 perpetual bonds - - - - 115,500 115,500 115,500
Total liabilities and shareholders’ equity 854,057 781,451 1,635,508 829,077 1,005,767 1,834,844 3,470,352
30 Risk management (continued)
30.2 Liquidity risk (continued)The maturity profile of the assets, liabilities and equity at 31 December 2017 is as follows:
30 Risk management (continued)
30.2 Liquidity risk (continued)
Liquidity coverage ratio
The Liquidity coverage ratio (LCR) is a short time ratio designed to increase resilience against a liquidity shortage of up to 30 days. The LCR is computed as per CBO requirement under the circular BM1127 (BASEL III: Framework on Liquidity coverage ratio and LCR disclosure standards). It is applicable from January 1, 2015 with a minimum ratio of 60% and increasing by 10% every year thereafter till it reaches a minimum required level of 100% on 1 January, 2019.
30.3 Market risk
The Bank is exposed to market risk, which is the risk that the fair value of the financial assets held by the Bank will fluctuate due to changes in market prices. Market risk arises from changes in the fair value of open positions held in foreign exchange, interest rate, currency, equity, credit spreads, etc. Market risk is managed based on the Central Bank of Oman guidelines and the Market Risk Policy, which is approved and periodically reviewed by the Board Risk Committee. Stress tests are also conducted periodically incorporating adverse movements in equity value, foreign exchange, etc. and reviewed by the Management and Board Risk Committee.
The Bank offers hedging products to its customers to hedge their genuine exposures, related to interest rate risk, foreign exchange risk and commodity risk. The counterparty credit risk exposures for such transactions (interest rate swaps, commodities contracts, currency forwards and options, etc.) are assessed based on the positive marked-to-market values of the contracts and the potential future exposures. The Bank has adopted risk weightings in line with best practices to capture the credit risk related to these off-balance sheet exposures.
• Equity risk The proprietary equity positions are held in the ‘Available-for-Sale’ category. The market risk is monitored though daily mark-to-market reports
Total Unweighted
Value (average)USD’000
Total Weighted Value (average)
USD’000
Total Unweighted
Value RO’000
Total Weighted Value (average)
RO’000
- 1,230,668 High Quality Liquid Assets - 473,807
- 1,230,668 Total High Quality Liquid Assets (HQLA) - 473,807
Cash outflows
1,822,522 105,890Retail deposits and deposits from small business customers of which:
701,671 40,768
1,527,190 76,358 Stable deposits 587,968 29,398
295,332 29,532 Less stable deposits 113,703 11,370
2,366,878 852,145Unsecured wholesale funding, of which:Operational deposits (all counterparties) and deposits in networks of cooperative banks
911,248 328,076
52,673 5,268Additional requirements, of which Credit and liquidity facilities
20,279 2,028
1,275,314 72,138 Other contingent funding obligations 490,996 27,773
- 1,035,442 Total cash outflows - 398,645
Cash Inflows
787,616 540,452 Inflows from fully performing exposures 303,232 208,074
25,631 25,631 Other cash inflows 9,868 9,868
813,247 566,083 Total cash inflows 313,100 217,942
- 1,230,668 Total high quality liquid assets - 473,807
- 469,358 Total net cash outflows - 180,703
- 262.20 Liquidity coverage ratio (%) - 262.20
164 | National Bank of Oman Annual Report 2018 | 165
Notes to the Financial StatementsAs at 31 December 2018
Notes to the Financial StatementsAs at 31 December 2018
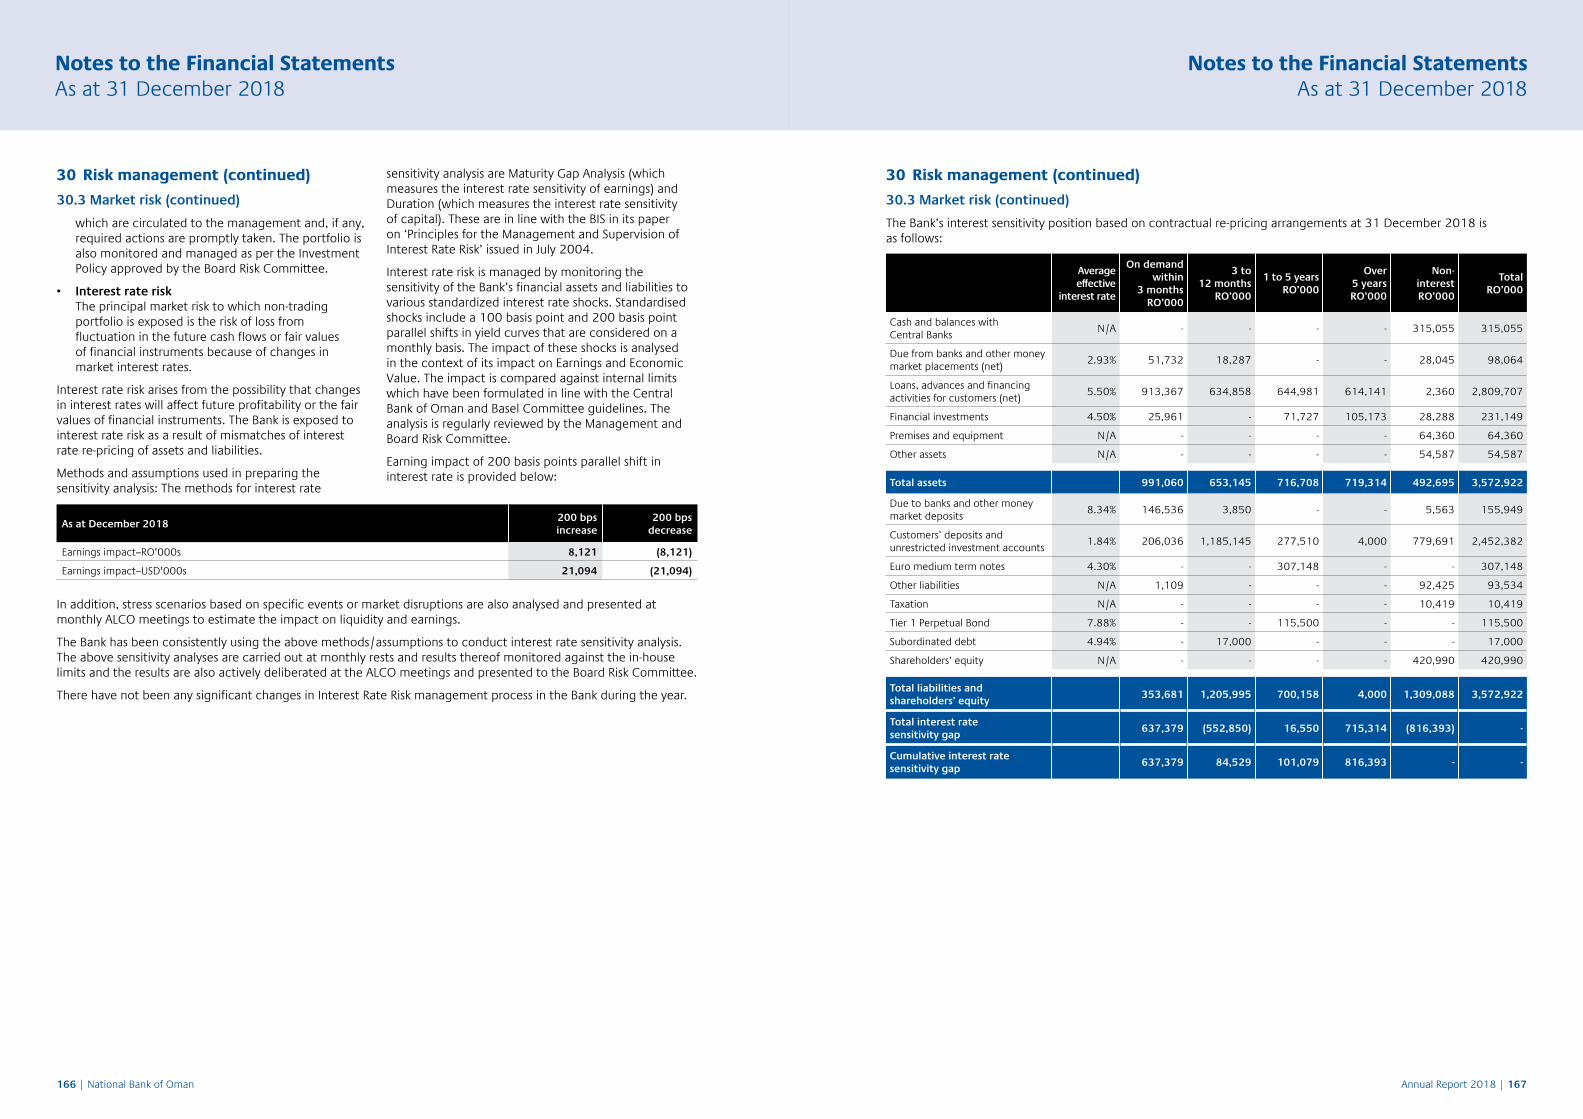
In addition, stress scenarios based on specific events or market disruptions are also analysed and presented at monthly ALCO meetings to estimate the impact on liquidity and earnings.
The Bank has been consistently using the above methods/assumptions to conduct interest rate sensitivity analysis. The above sensitivity analyses are carried out at monthly rests and results thereof monitored against the in-house limits and the results are also actively deliberated at the ALCO meetings and presented to the Board Risk Committee.
There have not been any significant changes in Interest Rate Risk management process in the Bank during the year.
As at December 2018 200 bps increase
200 bps decrease
Earnings impact–RO'000s 8,121 (8,121)
Earnings impact–USD'000s 21,094 (21,094)
30 Risk management (continued)
30.3 Market risk (continued)
which are circulated to the management and, if any, required actions are promptly taken. The portfolio is also monitored and managed as per the Investment Policy approved by the Board Risk Committee.
• Interest rate risk The principal market risk to which non-trading portfolio is exposed is the risk of loss from fluctuation in the future cash flows or fair values of financial instruments because of changes in market interest rates.
Interest rate risk arises from the possibility that changes in interest rates will affect future profitability or the fair values of financial instruments. The Bank is exposed to interest rate risk as a result of mismatches of interest rate re-pricing of assets and liabilities.
Methods and assumptions used in preparing the sensitivity analysis: The methods for interest rate
sensitivity analysis are Maturity Gap Analysis (which measures the interest rate sensitivity of earnings) and Duration (which measures the interest rate sensitivity of capital). These are in line with the BIS in its paper on ‘Principles for the Management and Supervision of Interest Rate Risk’ issued in July 2004.
Interest rate risk is managed by monitoring the sensitivity of the Bank’s financial assets and liabilities to various standardized interest rate shocks. Standardised shocks include a 100 basis point and 200 basis point parallel shifts in yield curves that are considered on a monthly basis. The impact of these shocks is analysed in the context of its impact on Earnings and Economic Value. The impact is compared against internal limits which have been formulated in line with the Central Bank of Oman and Basel Committee guidelines. The analysis is regularly reviewed by the Management and Board Risk Committee.
Earning impact of 200 basis points parallel shift in interest rate is provided below:
Average effective
interest rate
On demand within
3 monthsRO’000
3 to 12 months
RO’000
1 to 5 years RO’000
Over 5 years RO’000
Non-interest RO’000
TotalRO’000
Cash and balances with Central Banks
N/A - - - - 315,055 315,055
Due from banks and other money market placements (net)
2.93% 51,732 18,287 - - 28,045 98,064
Loans, advances and financing activities for customers (net)
5.50% 913,367 634,858 644,981 614,141 2,360 2,809,707
Financial investments 4.50% 25,961 - 71,727 105,173 28,288 231,149
Premises and equipment N/A - - - - 64,360 64,360
Other assets N/A - - - - 54,587 54,587
Total assets 991,060 653,145 716,708 719,314 492,695 3,572,922
Due to banks and other money market deposits
8.34% 146,536 3,850 - - 5,563 155,949
Customers’ deposits and unrestricted investment accounts
1.84% 206,036 1,185,145 277,510 4,000 779,691 2,452,382
Euro medium term notes 4.30% - - 307,148 - - 307,148
Other liabilities N/A 1,109 - - - 92,425 93,534
Taxation N/A - - - - 10,419 10,419
Tier 1 Perpetual Bond 7.88% - - 115,500 - - 115,500
Subordinated debt 4.94% - 17,000 - - - 17,000
Shareholders’ equity N/A - - - - 420,990 420,990
Total liabilities and shareholders’ equity
353,681 1,205,995 700,158 4,000 1,309,088 3,572,922
Total interest rate sensitivity gap
637,379 (552,850) 16,550 715,314 (816,393) -
Cumulative interest rate sensitivity gap
637,379 84,529 101,079 816,393 - -
30 Risk management (continued)
30.3 Market risk (continued)
The Bank’s interest sensitivity position based on contractual re-pricing arrangements at 31 December 2018 is as follows:
166 | National Bank of Oman Annual Report 2018 | 167
Notes to the Financial StatementsAs at 31 December 2018
Notes to the Financial StatementsAs at 31 December 2018
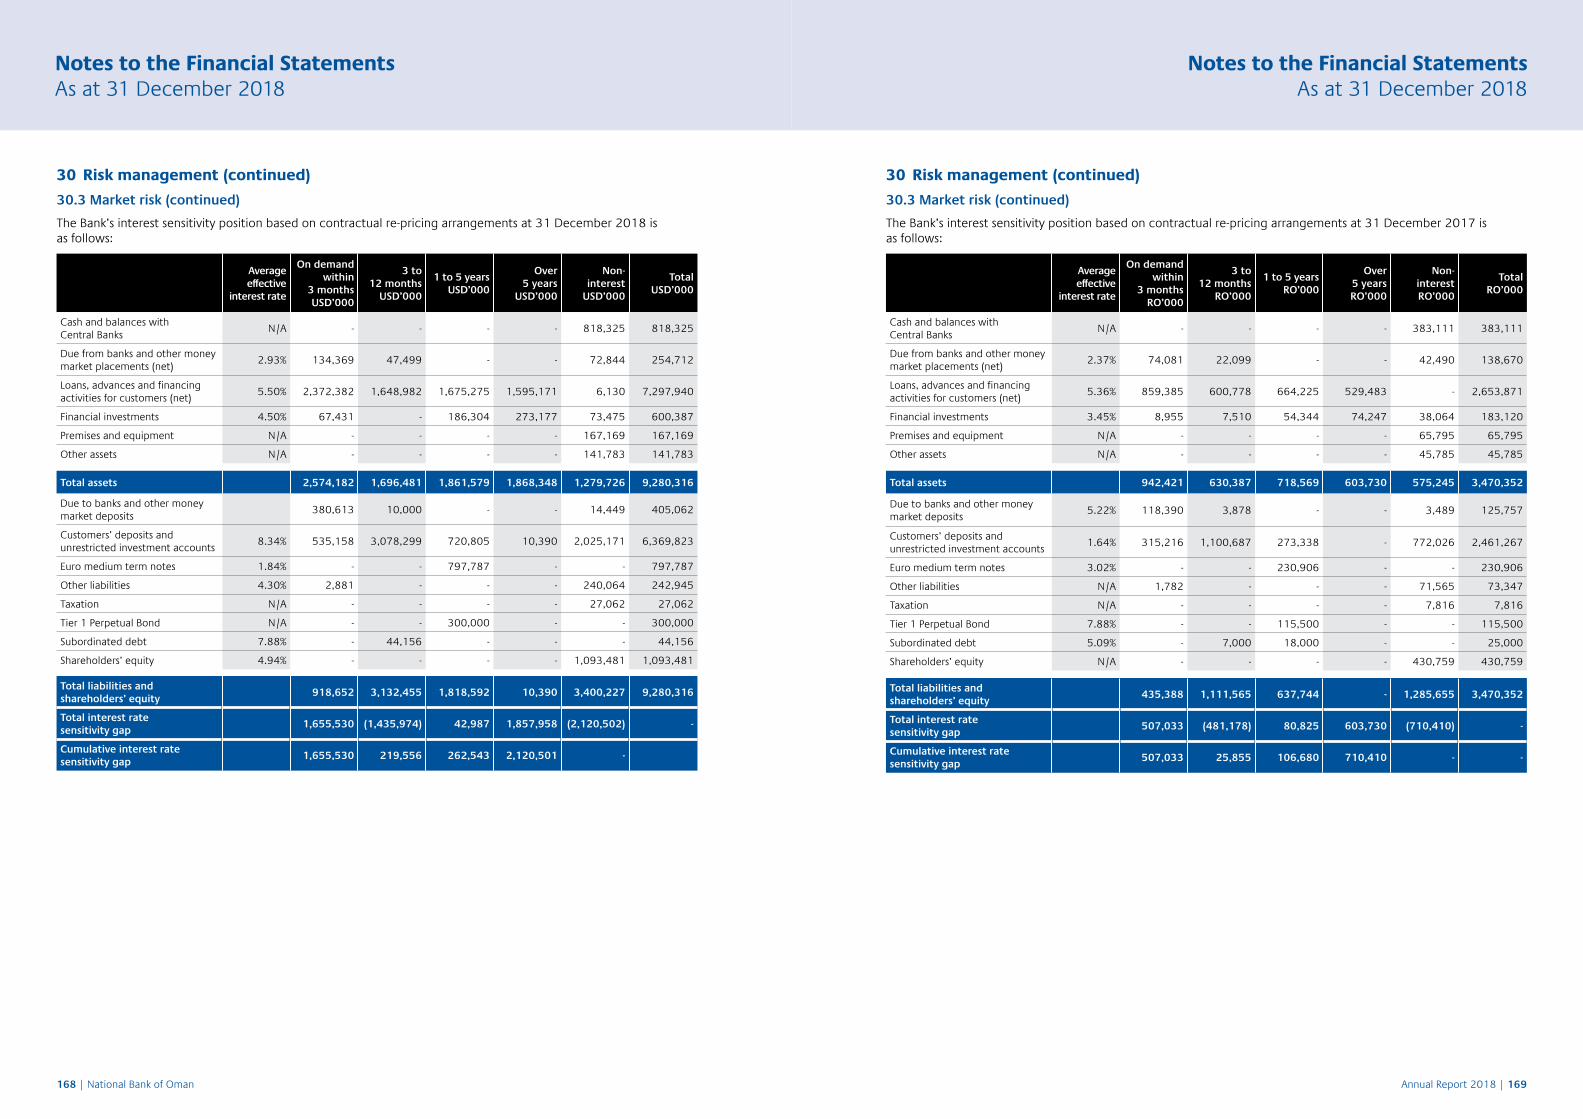
Average effective
interest rate
On demand within
3 monthsUSD’000
3 to 12 months
USD’000
1 to 5 years USD’000
Over 5 years
USD’000
Non-interest
USD’000
TotalUSD’000
Cash and balances with Central Banks
N/A - - - - 818,325 818,325
Due from banks and other money market placements (net)
2.93% 134,369 47,499 - - 72,844 254,712
Loans, advances and financing activities for customers (net)
5.50% 2,372,382 1,648,982 1,675,275 1,595,171 6,130 7,297,940
Financial investments 4.50% 67,431 - 186,304 273,177 73,475 600,387
Premises and equipment N/A - - - - 167,169 167,169
Other assets N/A - - - - 141,783 141,783
Total assets 2,574,182 1,696,481 1,861,579 1,868,348 1,279,726 9,280,316
Due to banks and other money market deposits
380,613 10,000 - - 14,449 405,062
Customers’ deposits and unrestricted investment accounts
8.34% 535,158 3,078,299 720,805 10,390 2,025,171 6,369,823
Euro medium term notes 1.84% - - 797,787 - - 797,787
Other liabilities 4.30% 2,881 - - - 240,064 242,945
Taxation N/A - - - - 27,062 27,062
Tier 1 Perpetual Bond N/A - - 300,000 - - 300,000
Subordinated debt 7.88% - 44,156 - - - 44,156
Shareholders’ equity 4.94% - - - - 1,093,481 1,093,481
Total liabilities and shareholders’ equity
918,652 3,132,455 1,818,592 10,390 3,400,227 9,280,316
Total interest rate sensitivity gap
1,655,530 (1,435,974) 42,987 1,857,958 (2,120,502) -
Cumulative interest rate sensitivity gap
1,655,530 219,556 262,543 2,120,501 -
30 Risk management (continued)
30.3 Market risk (continued)
The Bank’s interest sensitivity position based on contractual re-pricing arrangements at 31 December 2018 is as follows:
30 Risk management (continued)
30.3 Market risk (continued)
The Bank’s interest sensitivity position based on contractual re-pricing arrangements at 31 December 2017 is as follows:
Average effective
interest rate
On demand within
3 monthsRO’000
3 to 12 months
RO’000
1 to 5 years RO’000
Over 5 years RO’000
Non-interest RO’000
TotalRO’000
Cash and balances with Central Banks
N/A - - - - 383,111 383,111
Due from banks and other money market placements (net)
2.37% 74,081 22,099 - - 42,490 138,670
Loans, advances and financing activities for customers (net)
5.36% 859,385 600,778 664,225 529,483 - 2,653,871
Financial investments 3.45% 8,955 7,510 54,344 74,247 38,064 183,120
Premises and equipment N/A - - - - 65,795 65,795
Other assets N/A - - - - 45,785 45,785
Total assets 942,421 630,387 718,569 603,730 575,245 3,470,352
Due to banks and other money market deposits
5.22% 118,390 3,878 - - 3,489 125,757
Customers’ deposits and unrestricted investment accounts
1.64% 315,216 1,100,687 273,338 - 772,026 2,461,267
Euro medium term notes 3.02% - - 230,906 - - 230,906
Other liabilities N/A 1,782 - - - 71,565 73,347
Taxation N/A - - - - 7,816 7,816
Tier 1 Perpetual Bond 7.88% - - 115,500 - - 115,500
Subordinated debt 5.09% - 7,000 18,000 - - 25,000
Shareholders’ equity N/A - - - - 430,759 430,759
Total liabilities and shareholders’ equity
435,388 1,111,565 637,744 - 1,285,655 3,470,352
Total interest rate sensitivity gap
507,033 (481,178) 80,825 603,730 (710,410) -
Cumulative interest rate sensitivity gap
507,033 25,855 106,680 710,410 - -
168 | National Bank of Oman Annual Report 2018 | 169
Notes to the Financial StatementsAs at 31 December 2018
Notes to the Financial StatementsAs at 31 December 2018
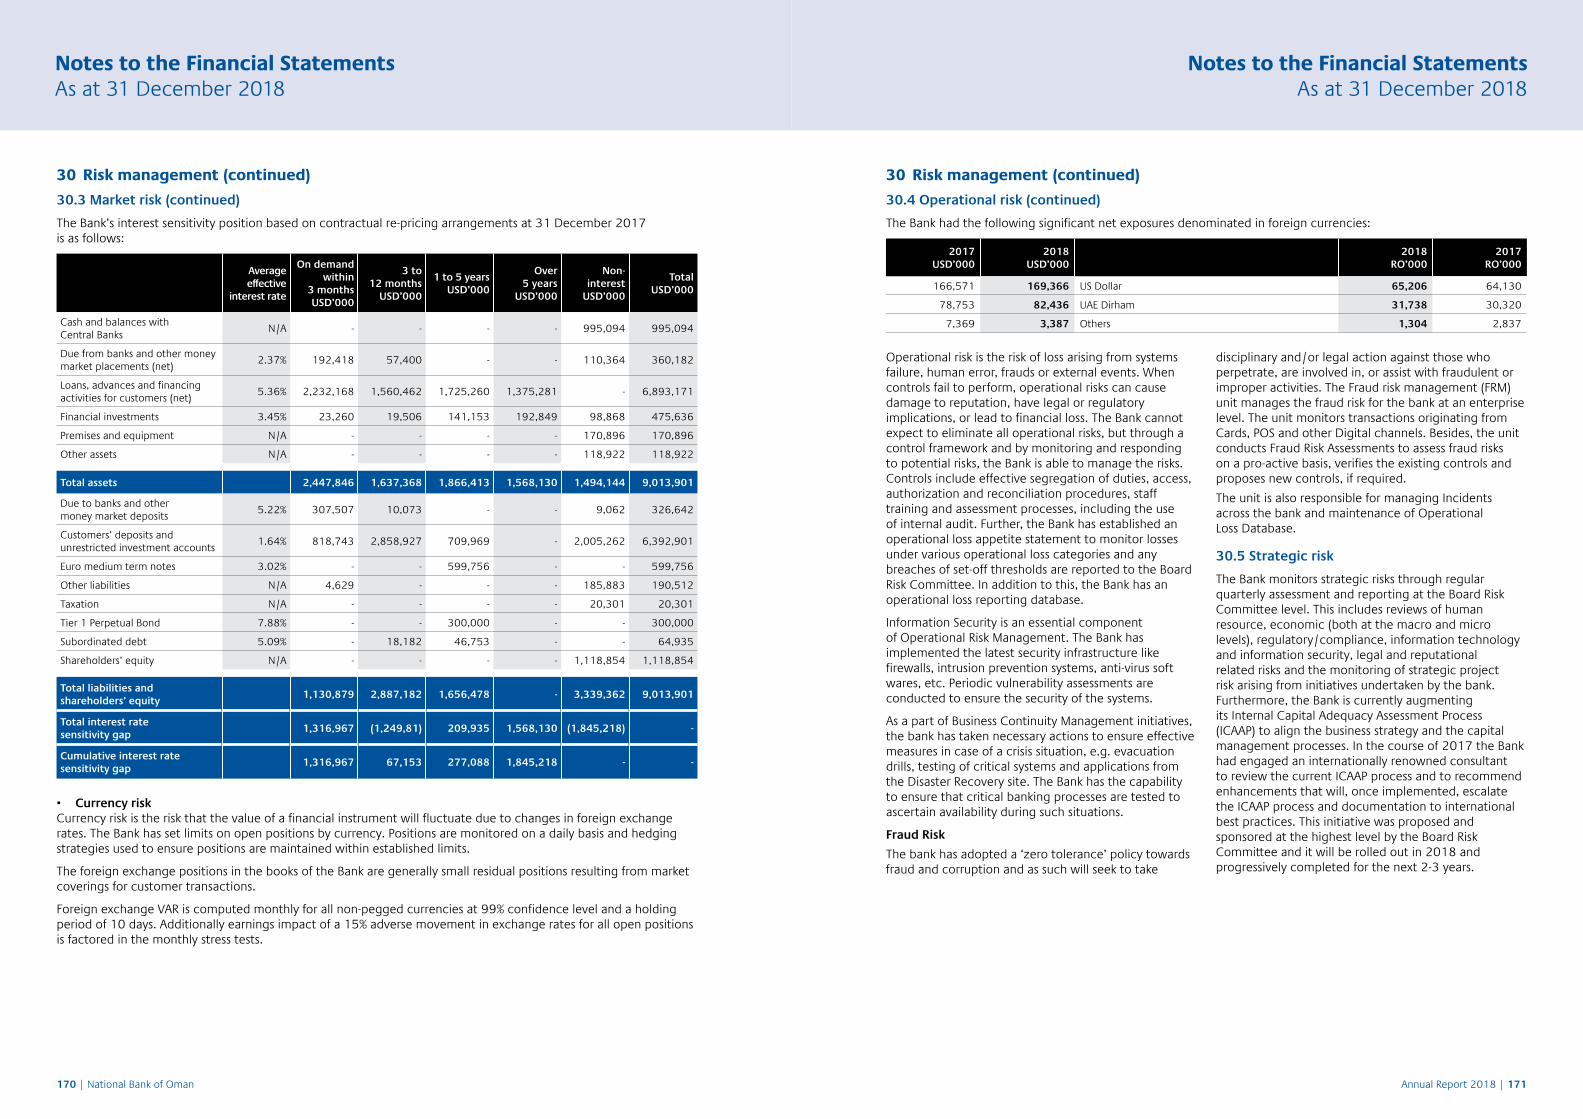
30 Risk management (continued)
30.3 Market risk (continued)
The Bank’s interest sensitivity position based on contractual re-pricing arrangements at 31 December 2017 is as follows:
Average effective
interest rate
On demand within
3 monthsUSD’000
3 to 12 months
USD’000
1 to 5 years USD’000
Over 5 years
USD’000
Non-interest
USD’000
TotalUSD’000
Cash and balances with Central Banks
N/A - - - - 995,094 995,094
Due from banks and other money market placements (net)
2.37% 192,418 57,400 - - 110,364 360,182
Loans, advances and financing activities for customers (net)
5.36% 2,232,168 1,560,462 1,725,260 1,375,281 - 6,893,171
Financial investments 3.45% 23,260 19,506 141,153 192,849 98,868 475,636
Premises and equipment N/A - - - - 170,896 170,896
Other assets N/A - - - - 118,922 118,922
Total assets 2,447,846 1,637,368 1,866,413 1,568,130 1,494,144 9,013,901
Due to banks and other money market deposits
5.22% 307,507 10,073 - - 9,062 326,642
Customers’ deposits and unrestricted investment accounts
1.64% 818,743 2,858,927 709,969 - 2,005,262 6,392,901
Euro medium term notes 3.02% - - 599,756 - - 599,756
Other liabilities N/A 4,629 - - - 185,883 190,512
Taxation N/A - - - - 20,301 20,301
Tier 1 Perpetual Bond 7.88% - - 300,000 - - 300,000
Subordinated debt 5.09% - 18,182 46,753 - - 64,935
Shareholders’ equity N/A - - - - 1,118,854 1,118,854
Total liabilities and shareholders’ equity
1,130,879 2,887,182 1,656,478 - 3,339,362 9,013,901
Total interest rate sensitivity gap
1,316,967 (1,249,81) 209,935 1,568,130 (1,845,218) -
Cumulative interest rate sensitivity gap
1,316,967 67,153 277,088 1,845,218 - -
• Currency risk Currency risk is the risk that the value of a financial instrument will fluctuate due to changes in foreign exchange rates. The Bank has set limits on open positions by currency. Positions are monitored on a daily basis and hedging strategies used to ensure positions are maintained within established limits.
The foreign exchange positions in the books of the Bank are generally small residual positions resulting from market coverings for customer transactions.
Foreign exchange VAR is computed monthly for all non-pegged currencies at 99% confidence level and a holding period of 10 days. Additionally earnings impact of a 15% adverse movement in exchange rates for all open positions is factored in the monthly stress tests.
Operational risk is the risk of loss arising from systems failure, human error, frauds or external events. When controls fail to perform, operational risks can cause damage to reputation, have legal or regulatory implications, or lead to financial loss. The Bank cannot expect to eliminate all operational risks, but through a control framework and by monitoring and responding to potential risks, the Bank is able to manage the risks. Controls include effective segregation of duties, access, authorization and reconciliation procedures, staff training and assessment processes, including the use of internal audit. Further, the Bank has established an operational loss appetite statement to monitor losses under various operational loss categories and any breaches of set-off thresholds are reported to the Board Risk Committee. In addition to this, the Bank has an operational loss reporting database.
Information Security is an essential component of Operational Risk Management. The Bank has implemented the latest security infrastructure like firewalls, intrusion prevention systems, anti-virus soft wares, etc. Periodic vulnerability assessments are conducted to ensure the security of the systems.
As a part of Business Continuity Management initiatives, the bank has taken necessary actions to ensure effective measures in case of a crisis situation, e.g. evacuation drills, testing of critical systems and applications from the Disaster Recovery site. The Bank has the capability to ensure that critical banking processes are tested to ascertain availability during such situations.
Fraud Risk
The bank has adopted a ‘zero tolerance’ policy towards fraud and corruption and as such will seek to take
disciplinary and/or legal action against those who perpetrate, are involved in, or assist with fraudulent or improper activities. The Fraud risk management (FRM) unit manages the fraud risk for the bank at an enterprise level. The unit monitors transactions originating from Cards, POS and other Digital channels. Besides, the unit conducts Fraud Risk Assessments to assess fraud risks on a pro-active basis, verifies the existing controls and proposes new controls, if required.
The unit is also responsible for managing Incidents across the bank and maintenance of Operational Loss Database.
30.5 Strategic risk
The Bank monitors strategic risks through regular quarterly assessment and reporting at the Board Risk Committee level. This includes reviews of human resource, economic (both at the macro and micro levels), regulatory/compliance, information technology and information security, legal and reputational related risks and the monitoring of strategic project risk arising from initiatives undertaken by the bank. Furthermore, the Bank is currently augmenting its Internal Capital Adequacy Assessment Process (ICAAP) to align the business strategy and the capital management processes. In the course of 2017 the Bank had engaged an internationally renowned consultant to review the current ICAAP process and to recommend enhancements that will, once implemented, escalate the ICAAP process and documentation to international best practices. This initiative was proposed and sponsored at the highest level by the Board Risk Committee and it will be rolled out in 2018 and progressively completed for the next 2-3 years.
30 Risk management (continued)
30.4 Operational risk (continued)
The Bank had the following significant net exposures denominated in foreign currencies:
2017USD’000
2018USD’000
2018RO’000
2017RO’000
166,571 169,366 US Dollar 65,206 64,130
78,753 82,436 UAE Dirham 31,738 30,320
7,369 3,387 Others 1,304 2,837
170 | National Bank of Oman Annual Report 2018 | 171
Notes to the Financial StatementsAs at 31 December 2018
Notes to the Financial StatementsAs at 31 December 2018
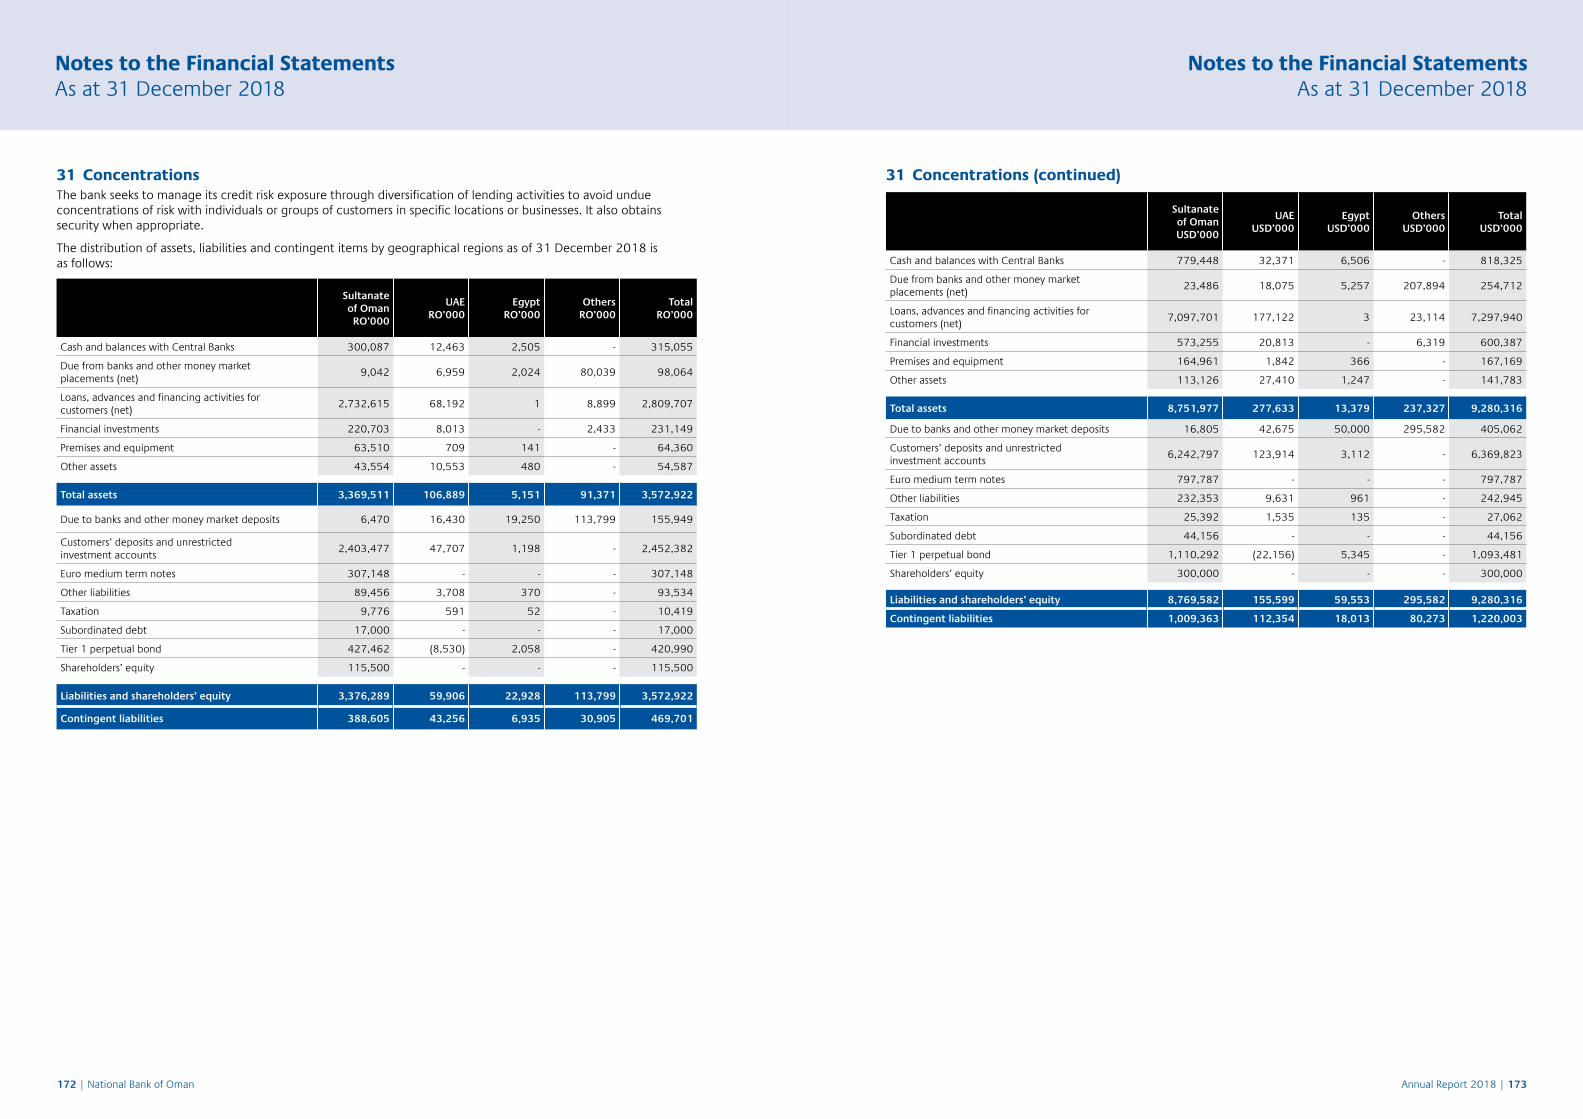
31 ConcentrationsThe bank seeks to manage its credit risk exposure through diversification of lending activities to avoid undue concentrations of risk with individuals or groups of customers in specific locations or businesses. It also obtains security when appropriate.
The distribution of assets, liabilities and contingent items by geographical regions as of 31 December 2018 is as follows:
Sultanate of OmanRO’000
UAERO’000
EgyptRO’000
OthersRO’000
TotalRO’000
Cash and balances with Central Banks 300,087 12,463 2,505 - 315,055
Due from banks and other money market placements (net)
9,042 6,959 2,024 80,039 98,064
Loans, advances and financing activities for customers (net)
2,732,615 68,192 1 8,899 2,809,707
Financial investments 220,703 8,013 - 2,433 231,149
Premises and equipment 63,510 709 141 - 64,360
Other assets 43,554 10,553 480 - 54,587
Total assets 3,369,511 106,889 5,151 91,371 3,572,922
Due to banks and other money market deposits 6,470 16,430 19,250 113,799 155,949
Customers’ deposits and unrestricted investment accounts
2,403,477 47,707 1,198 - 2,452,382
Euro medium term notes 307,148 - - - 307,148
Other liabilities 89,456 3,708 370 - 93,534
Taxation 9,776 591 52 - 10,419
Subordinated debt 17,000 - - - 17,000
Tier 1 perpetual bond 427,462 (8,530) 2,058 - 420,990
Shareholders’ equity 115,500 - - - 115,500
Liabilities and shareholders’ equity 3,376,289 59,906 22,928 113,799 3,572,922
Contingent liabilities 388,605 43,256 6,935 30,905 469,701
31 Concentrations (continued)
Sultanate of OmanUSD’000
UAEUSD’000
EgyptUSD’000
OthersUSD’000
TotalUSD’000
Cash and balances with Central Banks 779,448 32,371 6,506 - 818,325
Due from banks and other money market placements (net)
23,486 18,075 5,257 207,894 254,712
Loans, advances and financing activities for customers (net)
7,097,701 177,122 3 23,114 7,297,940
Financial investments 573,255 20,813 - 6,319 600,387
Premises and equipment 164,961 1,842 366 - 167,169
Other assets 113,126 27,410 1,247 - 141,783
Total assets 8,751,977 277,633 13,379 237,327 9,280,316
Due to banks and other money market deposits 16,805 42,675 50,000 295,582 405,062
Customers’ deposits and unrestricted investment accounts
6,242,797 123,914 3,112 - 6,369,823
Euro medium term notes 797,787 - - - 797,787
Other liabilities 232,353 9,631 961 - 242,945
Taxation 25,392 1,535 135 - 27,062
Subordinated debt 44,156 - - - 44,156
Tier 1 perpetual bond 1,110,292 (22,156) 5,345 - 1,093,481
Shareholders’ equity 300,000 - - - 300,000
Liabilities and shareholders’ equity 8,769,582 155,599 59,553 295,582 9,280,316
Contingent liabilities 1,009,363 112,354 18,013 80,273 1,220,003
172 | National Bank of Oman Annual Report 2018 | 173
Notes to the Financial StatementsAs at 31 December 2018
Notes to the Financial StatementsAs at 31 December 2018
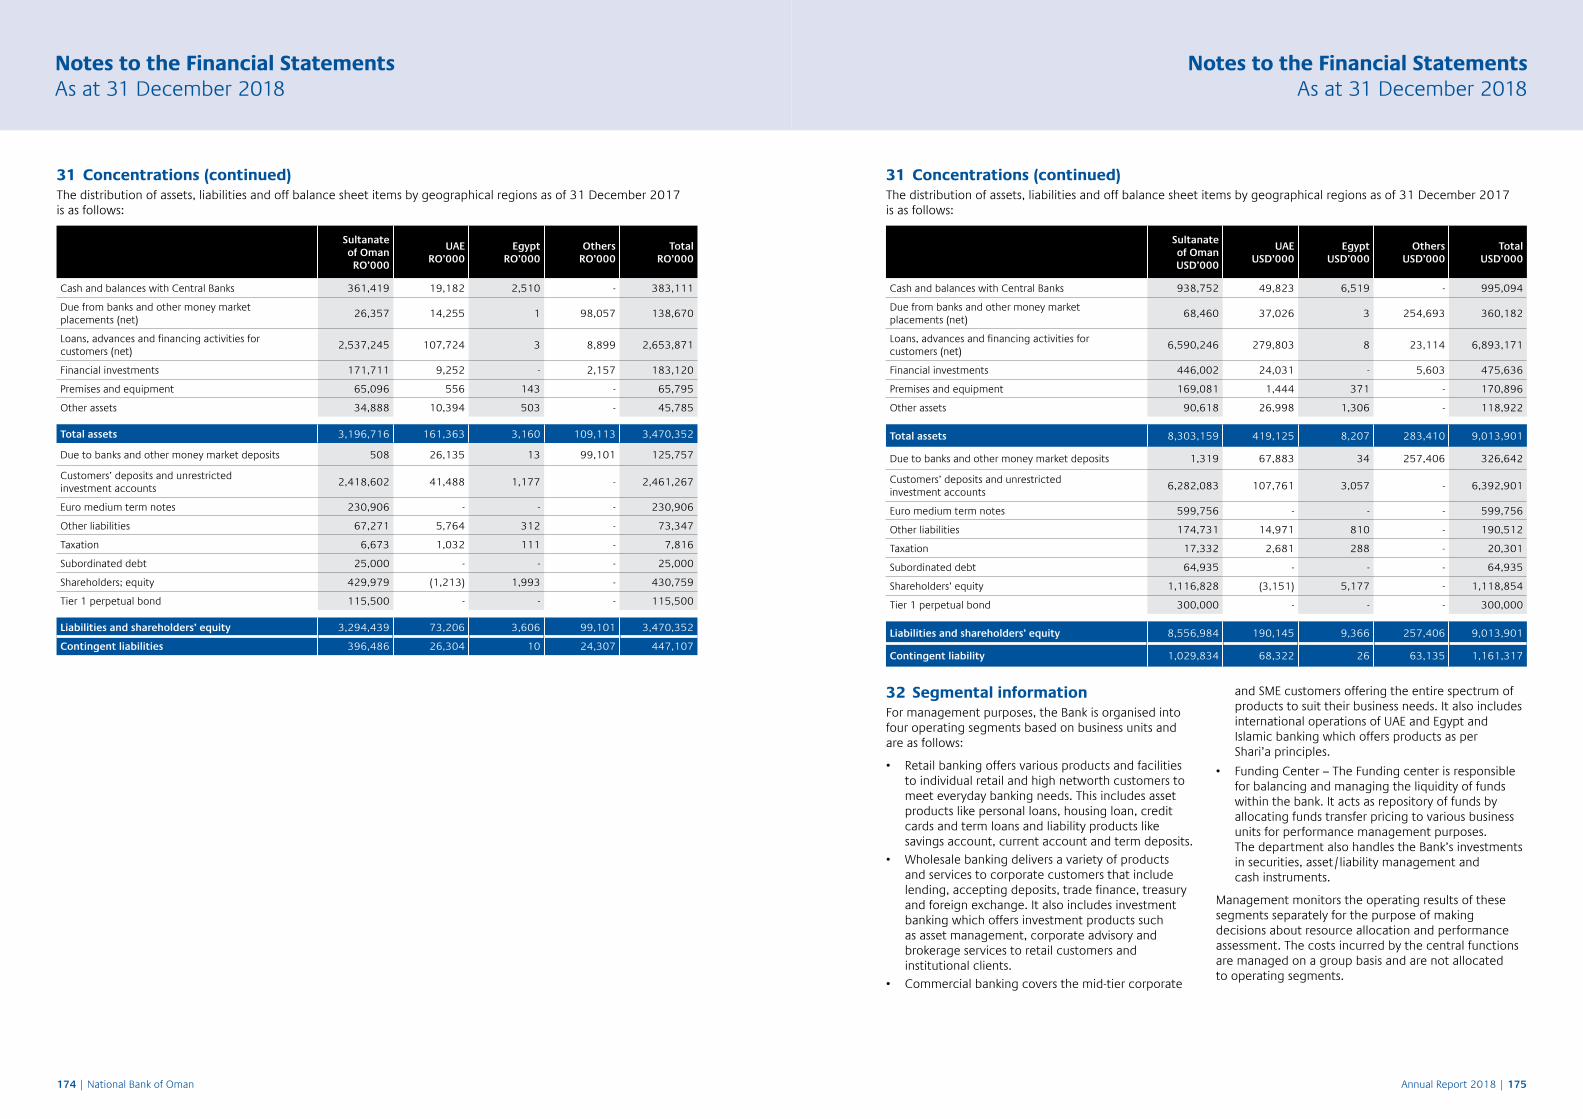
31 Concentrations (continued)The distribution of assets, liabilities and off balance sheet items by geographical regions as of 31 December 2017 is as follows:
Sultanate of OmanRO’000
UAERO’000
EgyptRO’000
OthersRO’000
TotalRO’000
Cash and balances with Central Banks 361,419 19,182 2,510 - 383,111
Due from banks and other money market placements (net)
26,357 14,255 1 98,057 138,670
Loans, advances and financing activities for customers (net)
2,537,245 107,724 3 8,899 2,653,871
Financial investments 171,711 9,252 - 2,157 183,120
Premises and equipment 65,096 556 143 - 65,795
Other assets 34,888 10,394 503 - 45,785
Total assets 3,196,716 161,363 3,160 109,113 3,470,352
Due to banks and other money market deposits 508 26,135 13 99,101 125,757
Customers’ deposits and unrestricted investment accounts
2,418,602 41,488 1,177 - 2,461,267
Euro medium term notes 230,906 - - - 230,906
Other liabilities 67,271 5,764 312 - 73,347
Taxation 6,673 1,032 111 - 7,816
Subordinated debt 25,000 - - - 25,000
Shareholders; equity 429,979 (1,213) 1,993 - 430,759
Tier 1 perpetual bond 115,500 - - - 115,500
Liabilities and shareholders’ equity 3,294,439 73,206 3,606 99,101 3,470,352
Contingent liabilities 396,486 26,304 10 24,307 447,107
31 Concentrations (continued)The distribution of assets, liabilities and off balance sheet items by geographical regions as of 31 December 2017 is as follows:
Sultanate of OmanUSD’000
UAEUSD’000
EgyptUSD’000
OthersUSD’000
TotalUSD’000
Cash and balances with Central Banks 938,752 49,823 6,519 - 995,094
Due from banks and other money market placements (net)
68,460 37,026 3 254,693 360,182
Loans, advances and financing activities for customers (net)
6,590,246 279,803 8 23,114 6,893,171
Financial investments 446,002 24,031 - 5,603 475,636
Premises and equipment 169,081 1,444 371 - 170,896
Other assets 90,618 26,998 1,306 - 118,922
Total assets 8,303,159 419,125 8,207 283,410 9,013,901
Due to banks and other money market deposits 1,319 67,883 34 257,406 326,642
Customers’ deposits and unrestricted investment accounts
6,282,083 107,761 3,057 - 6,392,901
Euro medium term notes 599,756 - - - 599,756
Other liabilities 174,731 14,971 810 - 190,512
Taxation 17,332 2,681 288 - 20,301
Subordinated debt 64,935 - - - 64,935
Shareholders’ equity 1,116,828 (3,151) 5,177 - 1,118,854
Tier 1 perpetual bond 300,000 - - - 300,000
Liabilities and shareholders’ equity 8,556,984 190,145 9,366 257,406 9,013,901
Contingent liability 1,029,834 68,322 26 63,135 1,161,317
32 Segmental informationFor management purposes, the Bank is organised into four operating segments based on business units and are as follows:
• Retail banking offers various products and facilities to individual retail and high networth customers to meet everyday banking needs. This includes asset products like personal loans, housing loan, credit cards and term loans and liability products like savings account, current account and term deposits.
• Wholesale banking delivers a variety of products and services to corporate customers that include lending, accepting deposits, trade finance, treasury and foreign exchange. It also includes investment banking which offers investment products such as asset management, corporate advisory and brokerage services to retail customers and institutional clients.
• Commercial banking covers the mid-tier corporate
and SME customers offering the entire spectrum of products to suit their business needs. It also includes international operations of UAE and Egypt and Islamic banking which offers products as per Shari’a principles.
• Funding Center – The Funding center is responsible for balancing and managing the liquidity of funds within the bank. It acts as repository of funds by allocating funds transfer pricing to various business units for performance management purposes. The department also handles the Bank’s investments in securities, asset/liability management and cash instruments.
Management monitors the operating results of these segments separately for the purpose of making decisions about resource allocation and performance assessment. The costs incurred by the central functions are managed on a group basis and are not allocated to operating segments.
174 | National Bank of Oman Annual Report 2018 | 175
Notes to the Financial StatementsAs at 31 December 2018
Notes to the Financial StatementsAs at 31 December 2018
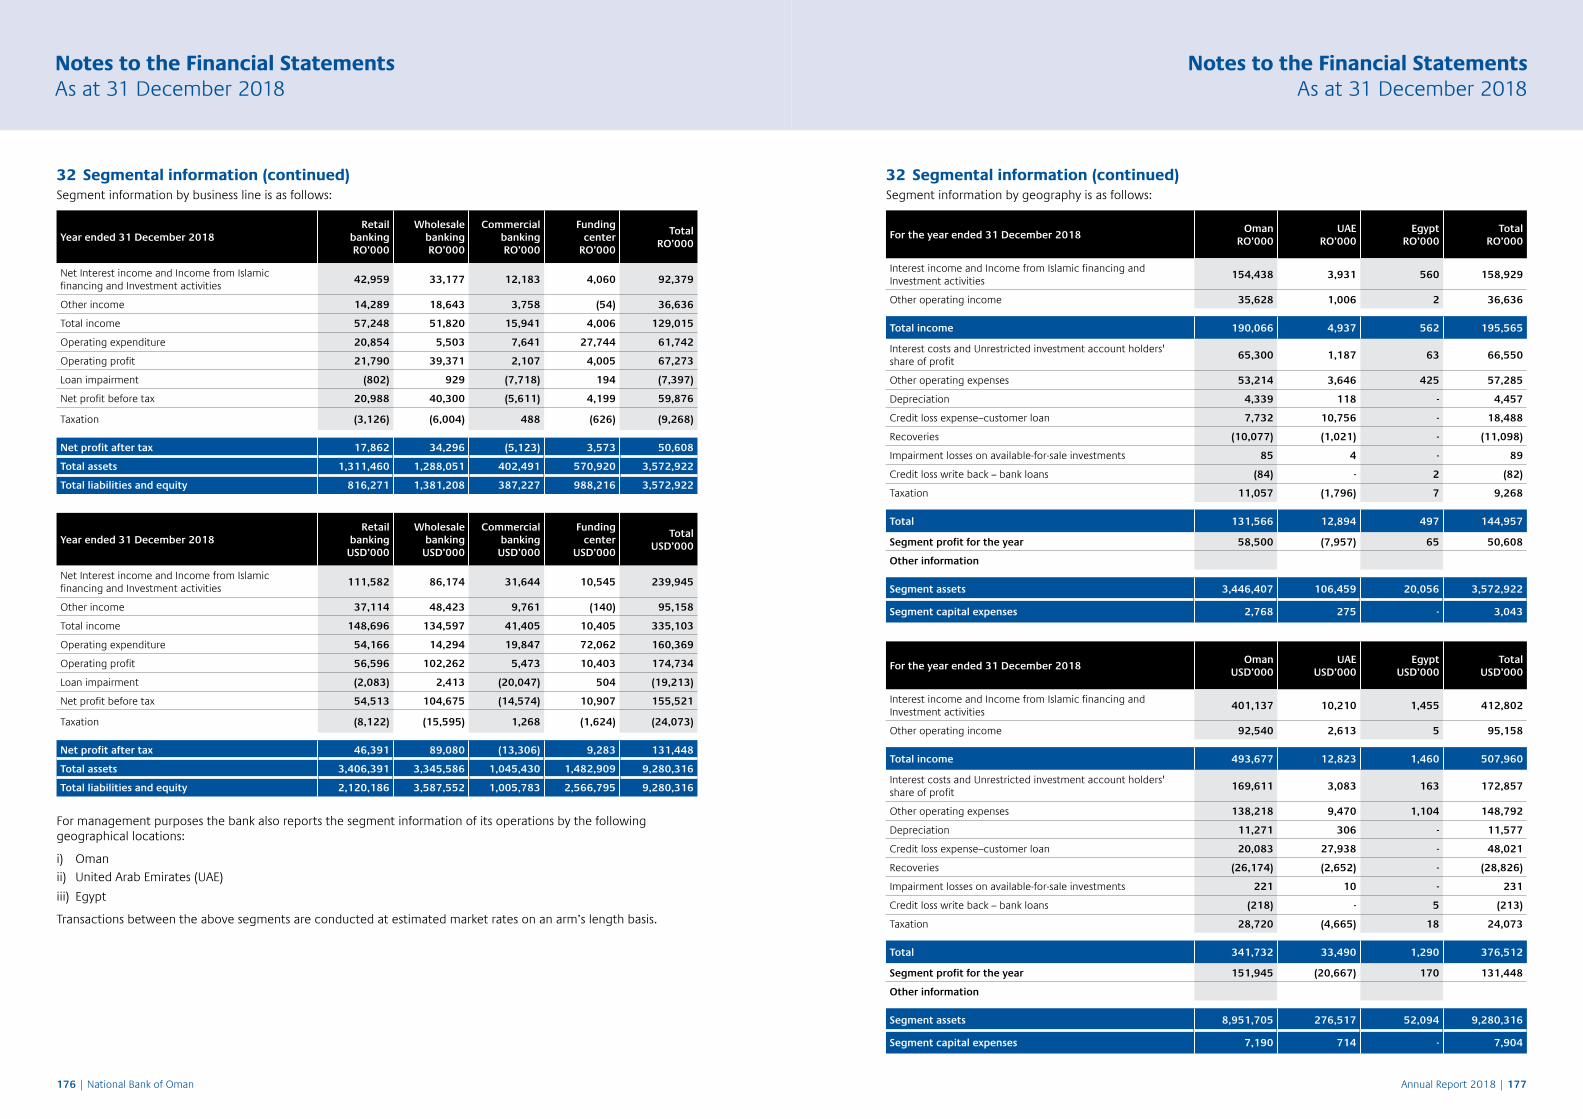
32 Segmental information (continued)Segment information by business line is as follows:
Year ended 31 December 2018Retail
bankingRO’000
Wholesale bankingRO’000
Commercial banking RO’000
Funding center
RO’000
Total RO’000
Net Interest income and Income from Islamic financing and Investment activities
42,959 33,177 12,183 4,060 92,379
Other income 14,289 18,643 3,758 (54) 36,636
Total income 57,248 51,820 15,941 4,006 129,015
Operating expenditure 20,854 5,503 7,641 27,744 61,742
Operating profit 21,790 39,371 2,107 4,005 67,273
Loan impairment (802) 929 (7,718) 194 (7,397)
Net profit before tax 20,988 40,300 (5,611) 4,199 59,876
Taxation (3,126) (6,004) 488 (626) (9,268)
Net profit after tax 17,862 34,296 (5,123) 3,573 50,608
Total assets 1,311,460 1,288,051 402,491 570,920 3,572,922
Total liabilities and equity 816,271 1,381,208 387,227 988,216 3,572,922
Year ended 31 December 2018Retail
bankingUSD’000
Wholesale banking
USD’000
Commercial banking
USD’000
Funding center
USD’000
Total USD’000
Net Interest income and Income from Islamic financing and Investment activities
111,582 86,174 31,644 10,545 239,945
Other income 37,114 48,423 9,761 (140) 95,158
Total income 148,696 134,597 41,405 10,405 335,103
Operating expenditure 54,166 14,294 19,847 72,062 160,369
Operating profit 56,596 102,262 5,473 10,403 174,734
Loan impairment (2,083) 2,413 (20,047) 504 (19,213)
Net profit before tax 54,513 104,675 (14,574) 10,907 155,521
Taxation (8,122) (15,595) 1,268 (1,624) (24,073)
Net profit after tax 46,391 89,080 (13,306) 9,283 131,448
Total assets 3,406,391 3,345,586 1,045,430 1,482,909 9,280,316
Total liabilities and equity 2,120,186 3,587,552 1,005,783 2,566,795 9,280,316
For management purposes the bank also reports the segment information of its operations by the following geographical locations:
i) Omanii) United Arab Emirates (UAE)
iii) Egypt
Transactions between the above segments are conducted at estimated market rates on an arm’s length basis.
32 Segmental information (continued)Segment information by geography is as follows:
For the year ended 31 December 2018Oman
RO’000UAE
RO’000Egypt
RO’000Total
RO’000
Interest income and Income from Islamic financing and Investment activities
154,438 3,931 560 158,929
Other operating income 35,628 1,006 2 36,636
Total income 190,066 4,937 562 195,565
Interest costs and Unrestricted investment account holders' share of profit
65,300 1,187 63 66,550
Other operating expenses 53,214 3,646 425 57,285
Depreciation 4,339 118 - 4,457
Credit loss expense–customer loan 7,732 10,756 - 18,488
Recoveries (10,077) (1,021) - (11,098)
Impairment losses on available-for-sale investments 85 4 - 89
Credit loss write back – bank loans (84) - 2 (82)
Taxation 11,057 (1,796) 7 9,268
Total 131,566 12,894 497 144,957
Segment profit for the year 58,500 (7,957) 65 50,608
Other information
Segment assets 3,446,407 106,459 20,056 3,572,922
Segment capital expenses 2,768 275 - 3,043
For the year ended 31 December 2018Oman
USD’000UAE
USD’000Egypt
USD’000Total
USD’000
Interest income and Income from Islamic financing and Investment activities
401,137 10,210 1,455 412,802
Other operating income 92,540 2,613 5 95,158
Total income 493,677 12,823 1,460 507,960
Interest costs and Unrestricted investment account holders' share of profit
169,611 3,083 163 172,857
Other operating expenses 138,218 9,470 1,104 148,792
Depreciation 11,271 306 - 11,577
Credit loss expense–customer loan 20,083 27,938 - 48,021
Recoveries (26,174) (2,652) - (28,826)
Impairment losses on available-for-sale investments 221 10 - 231
Credit loss write back – bank loans (218) - 5 (213)
Taxation 28,720 (4,665) 18 24,073
Total 341,732 33,490 1,290 376,512
Segment profit for the year 151,945 (20,667) 170 131,448
Other information
Segment assets 8,951,705 276,517 52,094 9,280,316
Segment capital expenses 7,190 714 - 7,904
176 | National Bank of Oman Annual Report 2018 | 177
Notes to the Financial StatementsAs at 31 December 2018
Notes to the Financial StatementsAs at 31 December 2018
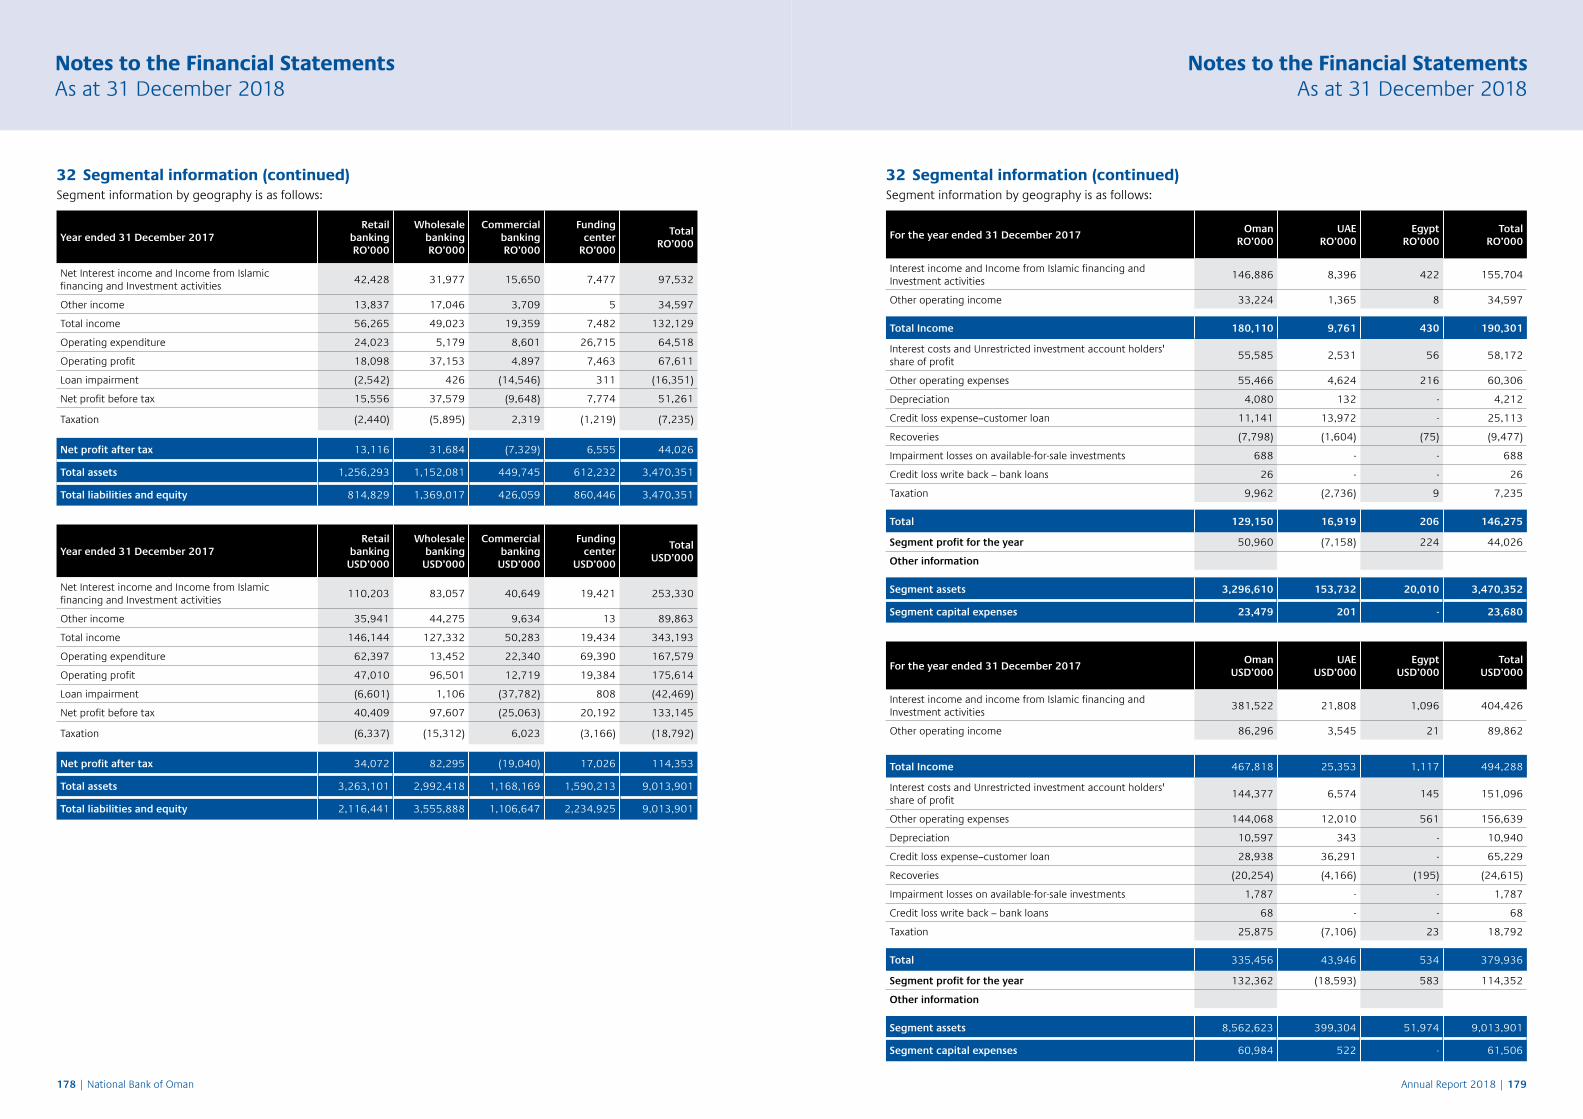
Year ended 31 December 2017Retail
banking RO’000
Wholesale banking RO’000
Commercial banking RO’000
Funding center
RO’000
Total RO’000
Net Interest income and Income from Islamic financing and Investment activities
42,428 31,977 15,650 7,477 97,532
Other income 13,837 17,046 3,709 5 34,597
Total income 56,265 49,023 19,359 7,482 132,129
Operating expenditure 24,023 5,179 8,601 26,715 64,518
Operating profit 18,098 37,153 4,897 7,463 67,611
Loan impairment (2,542) 426 (14,546) 311 (16,351)
Net profit before tax 15,556 37,579 (9,648) 7,774 51,261
Taxation (2,440) (5,895) 2,319 (1,219) (7,235)
Net profit after tax 13,116 31,684 (7,329) 6,555 44,026
Total assets 1,256,293 1,152,081 449,745 612,232 3,470,351
Total liabilities and equity 814,829 1,369,017 426,059 860,446 3,470,351
Year ended 31 December 2017Retail
banking USD’000
Wholesale banking
USD’000
Commercial banking
USD’000
Funding center
USD’000
Total USD’000
Net Interest income and Income from Islamic financing and Investment activities
110,203 83,057 40,649 19,421 253,330
Other income 35,941 44,275 9,634 13 89,863
Total income 146,144 127,332 50,283 19,434 343,193
Operating expenditure 62,397 13,452 22,340 69,390 167,579
Operating profit 47,010 96,501 12,719 19,384 175,614
Loan impairment (6,601) 1,106 (37,782) 808 (42,469)
Net profit before tax 40,409 97,607 (25,063) 20,192 133,145
Taxation (6,337) (15,312) 6,023 (3,166) (18,792)
Net profit after tax 34,072 82,295 (19,040) 17,026 114,353
Total assets 3,263,101 2,992,418 1,168,169 1,590,213 9,013,901
Total liabilities and equity 2,116,441 3,555,888 1,106,647 2,234,925 9,013,901
32 Segmental information (continued)Segment information by geography is as follows:
32 Segmental information (continued)Segment information by geography is as follows:
For the year ended 31 December 2017Oman
RO’000UAE
RO’000Egypt
RO’000Total
RO’000
Interest income and Income from Islamic financing and Investment activities
146,886 8,396 422 155,704
Other operating income 33,224 1,365 8 34,597
Total Income 180,110 9,761 430 190,301
Interest costs and Unrestricted investment account holders' share of profit
55,585 2,531 56 58,172
Other operating expenses 55,466 4,624 216 60,306
Depreciation 4,080 132 - 4,212
Credit loss expense–customer loan 11,141 13,972 - 25,113
Recoveries (7,798) (1,604) (75) (9,477)
Impairment losses on available-for-sale investments 688 - - 688
Credit loss write back – bank loans 26 - - 26
Taxation 9,962 (2,736) 9 7,235
Total 129,150 16,919 206 146,275
Segment profit for the year 50,960 (7,158) 224 44,026
Other information
Segment assets 3,296,610 153,732 20,010 3,470,352
Segment capital expenses 23,479 201 - 23,680
For the year ended 31 December 2017Oman
USD’000UAE
USD’000Egypt
USD’000Total
USD’000
Interest income and income from Islamic financing and Investment activities
381,522 21,808 1,096 404,426
Other operating income 86,296 3,545 21 89,862
Total Income 467,818 25,353 1,117 494,288
Interest costs and Unrestricted investment account holders' share of profit
144,377 6,574 145 151,096
Other operating expenses 144,068 12,010 561 156,639
Depreciation 10,597 343 - 10,940
Credit loss expense–customer loan 28,938 36,291 - 65,229
Recoveries (20,254) (4,166) (195) (24,615)
Impairment losses on available-for-sale investments 1,787 - - 1,787
Credit loss write back – bank loans 68 - - 68
Taxation 25,875 (7,106) 23 18,792
Total 335,456 43,946 534 379,936
Segment profit for the year 132,362 (18,593) 583 114,352
Other information
Segment assets 8,562,623 399,304 51,974 9,013,901
Segment capital expenses 60,984 522 - 61,506
178 | National Bank of Oman Annual Report 2018 | 179
Notes to the Financial StatementsAs at 31 December 2018
Notes to the Financial StatementsAs at 31 December 2018
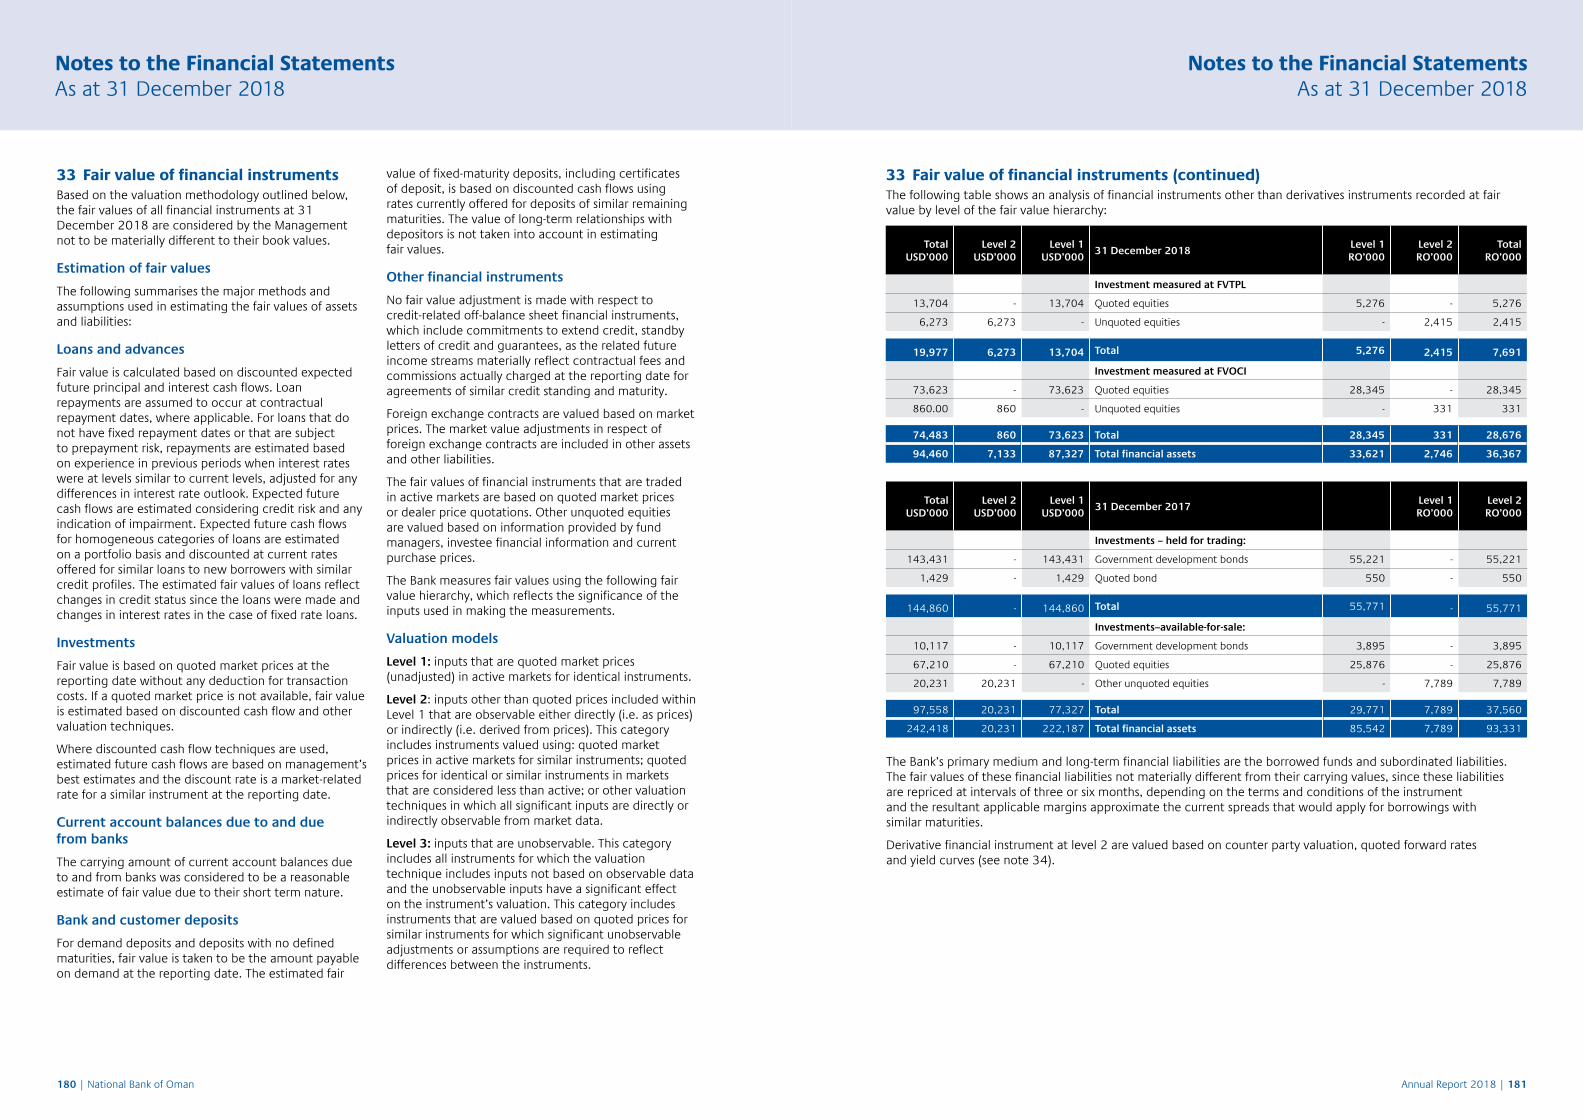
33 Fair value of financial instrumentsBased on the valuation methodology outlined below, the fair values of all financial instruments at 31 December 2018 are considered by the Management not to be materially different to their book values.
Estimation of fair values
The following summarises the major methods and assumptions used in estimating the fair values of assets and liabilities:
Loans and advances
Fair value is calculated based on discounted expected future principal and interest cash flows. Loan repayments are assumed to occur at contractual repayment dates, where applicable. For loans that do not have fixed repayment dates or that are subject to prepayment risk, repayments are estimated based on experience in previous periods when interest rates were at levels similar to current levels, adjusted for any differences in interest rate outlook. Expected future cash flows are estimated considering credit risk and any indication of impairment. Expected future cash flows for homogeneous categories of loans are estimated on a portfolio basis and discounted at current rates offered for similar loans to new borrowers with similar credit profiles. The estimated fair values of loans reflect changes in credit status since the loans were made and changes in interest rates in the case of fixed rate loans.
Investments
Fair value is based on quoted market prices at the reporting date without any deduction for transaction costs. If a quoted market price is not available, fair value is estimated based on discounted cash flow and other valuation techniques.
Where discounted cash flow techniques are used, estimated future cash flows are based on management’s best estimates and the discount rate is a market-related rate for a similar instrument at the reporting date.
Current account balances due to and due from banks
The carrying amount of current account balances due to and from banks was considered to be a reasonable estimate of fair value due to their short term nature.
Bank and customer deposits
For demand deposits and deposits with no defined maturities, fair value is taken to be the amount payable on demand at the reporting date. The estimated fair
value of fixed-maturity deposits, including certificates of deposit, is based on discounted cash flows using rates currently offered for deposits of similar remaining maturities. The value of long-term relationships with depositors is not taken into account in estimating fair values.
Other financial instruments
No fair value adjustment is made with respect to credit-related off-balance sheet financial instruments, which include commitments to extend credit, standby letters of credit and guarantees, as the related future income streams materially reflect contractual fees and commissions actually charged at the reporting date for agreements of similar credit standing and maturity.
Foreign exchange contracts are valued based on market prices. The market value adjustments in respect of foreign exchange contracts are included in other assets and other liabilities.
The fair values of financial instruments that are traded in active markets are based on quoted market prices or dealer price quotations. Other unquoted equities are valued based on information provided by fund managers, investee financial information and current purchase prices.
The Bank measures fair values using the following fair value hierarchy, which reflects the significance of the inputs used in making the measurements.
Valuation models
Level 1: inputs that are quoted market prices (unadjusted) in active markets for identical instruments.
Level 2: inputs other than quoted prices included within Level 1 that are observable either directly (i.e. as prices) or indirectly (i.e. derived from prices). This category includes instruments valued using: quoted market prices in active markets for similar instruments; quoted prices for identical or similar instruments in markets that are considered less than active; or other valuation techniques in which all significant inputs are directly or indirectly observable from market data.
Level 3: inputs that are unobservable. This category includes all instruments for which the valuation technique includes inputs not based on observable data and the unobservable inputs have a significant effect on the instrument’s valuation. This category includes instruments that are valued based on quoted prices for similar instruments for which significant unobservable adjustments or assumptions are required to reflect differences between the instruments.
The Bank’s primary medium and long-term financial liabilities are the borrowed funds and subordinated liabilities. The fair values of these financial liabilities not materially different from their carrying values, since these liabilities are repriced at intervals of three or six months, depending on the terms and conditions of the instrument and the resultant applicable margins approximate the current spreads that would apply for borrowings with similar maturities.
Derivative financial instrument at level 2 are valued based on counter party valuation, quoted forward rates and yield curves (see note 34).
33 Fair value of financial instruments (continued)The following table shows an analysis of financial instruments other than derivatives instruments recorded at fair value by level of the fair value hierarchy:
TotalUSD’000
Level 2USD’000
Level 1USD’000
31 December 2018Level 1RO’000
Level 2RO’000
TotalRO’000
Investment measured at FVTPL
13,704 - 13,704 Quoted equities 5,276 - 5,276
6,273 6,273 - Unquoted equities - 2,415 2,415
19,977 6,273 13,704 Total 5,276 2,415 7,691
Investment measured at FVOCI
73,623 - 73,623 Quoted equities 28,345 - 28,345
860.00 860 - Unquoted equities - 331 331
74,483 860 73,623 Total 28,345 331 28,676
94,460 7,133 87,327 Total financial assets 33,621 2,746 36,367
TotalUSD’000
Level 2USD’000
Level 1USD’000
31 December 2017Level 1RO’000
Level 2RO’000
Investments – held for trading:
143,431 - 143,431 Government development bonds 55,221 - 55,221
1,429 - 1,429 Quoted bond 550 - 550
144,860 - 144,860 Total 55,771 - 55,771
Investments–available-for-sale:
10,117 - 10,117 Government development bonds 3,895 - 3,895
67,210 - 67,210 Quoted equities 25,876 - 25,876
20,231 20,231 - Other unquoted equities - 7,789 7,789
97,558 20,231 77,327 Total 29,771 7,789 37,560
242,418 20,231 222,187 Total financial assets 85,542 7,789 93,331
180 | National Bank of Oman Annual Report 2018 | 181
Notes to the Financial StatementsAs at 31 December 2018
Notes to the Financial StatementsAs at 31 December 2018
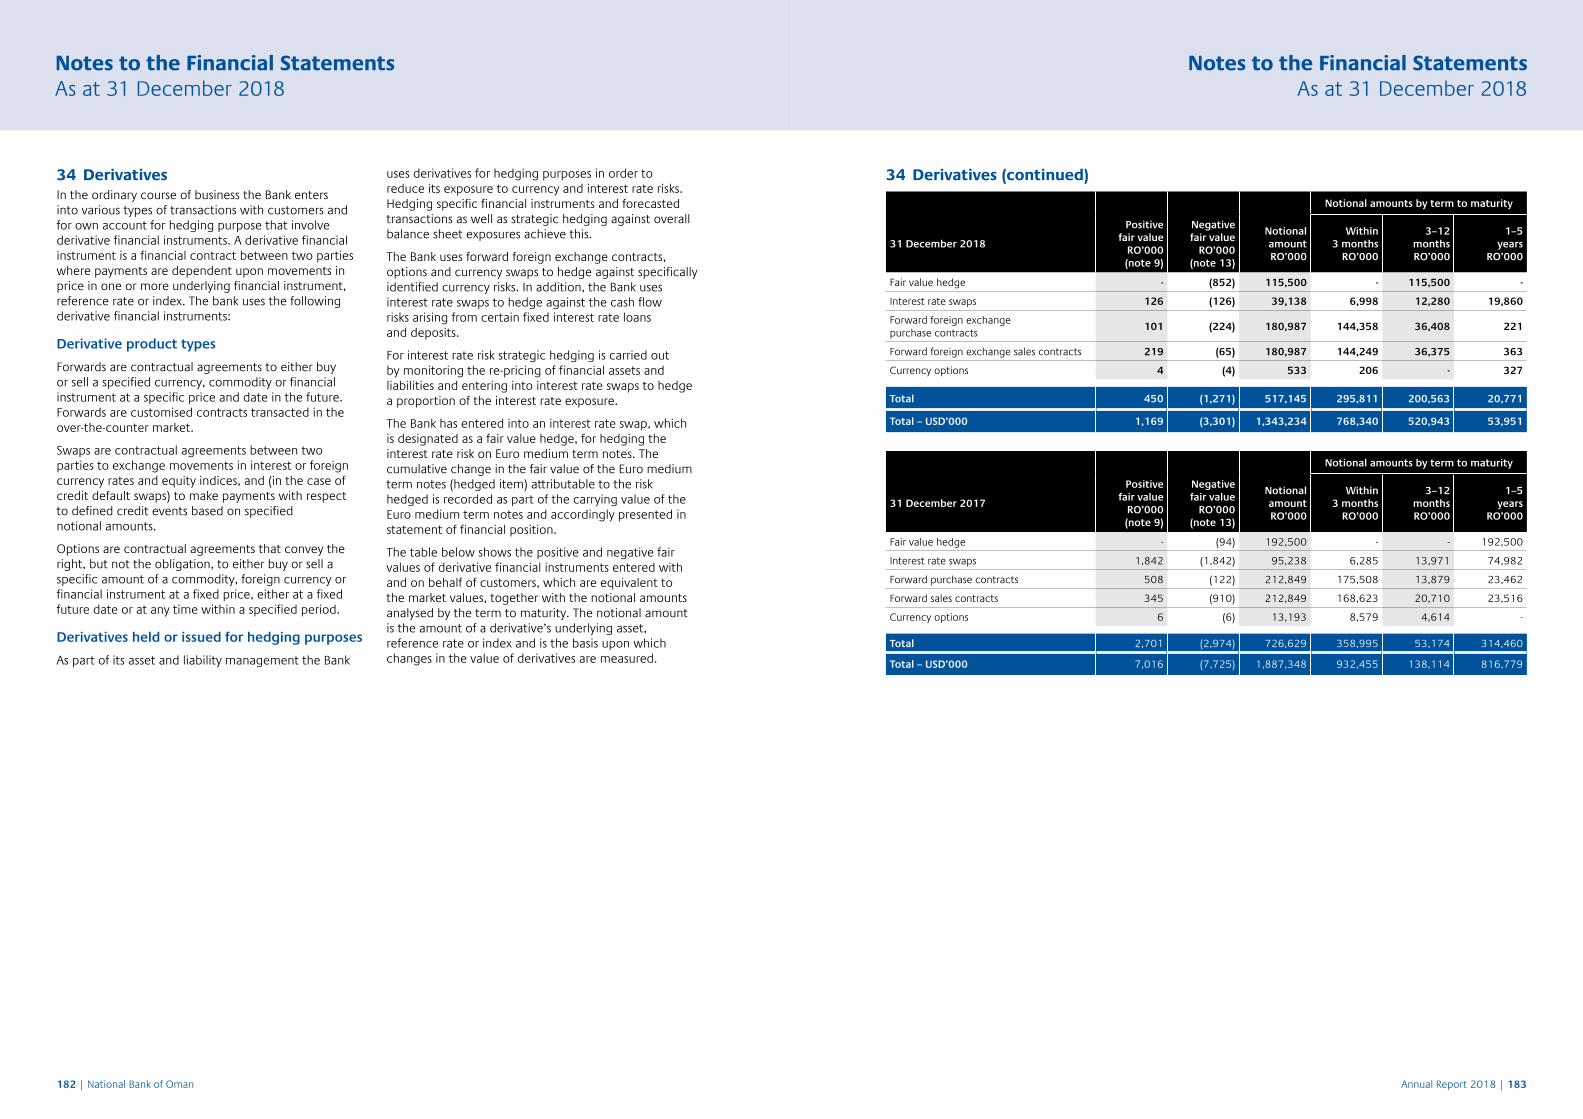
34 DerivativesIn the ordinary course of business the Bank enters into various types of transactions with customers and for own account for hedging purpose that involve derivative financial instruments. A derivative financial instrument is a financial contract between two parties where payments are dependent upon movements in price in one or more underlying financial instrument, reference rate or index. The bank uses the following derivative financial instruments:
Derivative product types
Forwards are contractual agreements to either buy or sell a specified currency, commodity or financial instrument at a specific price and date in the future. Forwards are customised contracts transacted in the over-the-counter market.
Swaps are contractual agreements between two parties to exchange movements in interest or foreign currency rates and equity indices, and (in the case of credit default swaps) to make payments with respect to defined credit events based on specified notional amounts.
Options are contractual agreements that convey the right, but not the obligation, to either buy or sell a specific amount of a commodity, foreign currency or financial instrument at a fixed price, either at a fixed future date or at any time within a specified period.
Derivatives held or issued for hedging purposes
As part of its asset and liability management the Bank
uses derivatives for hedging purposes in order to reduce its exposure to currency and interest rate risks. Hedging specific financial instruments and forecasted transactions as well as strategic hedging against overall balance sheet exposures achieve this.
The Bank uses forward foreign exchange contracts, options and currency swaps to hedge against specifically identified currency risks. In addition, the Bank uses interest rate swaps to hedge against the cash flow risks arising from certain fixed interest rate loans and deposits.
For interest rate risk strategic hedging is carried out by monitoring the re-pricing of financial assets and liabilities and entering into interest rate swaps to hedge a proportion of the interest rate exposure.
The Bank has entered into an interest rate swap, which is designated as a fair value hedge, for hedging the interest rate risk on Euro medium term notes. The cumulative change in the fair value of the Euro medium term notes (hedged item) attributable to the risk hedged is recorded as part of the carrying value of the Euro medium term notes and accordingly presented in statement of financial position.
The table below shows the positive and negative fair values of derivative financial instruments entered with and on behalf of customers, which are equivalent to the market values, together with the notional amounts analysed by the term to maturity. The notional amount is the amount of a derivative’s underlying asset, reference rate or index and is the basis upon which changes in the value of derivatives are measured.
34 Derivatives (continued)
Notional amounts by term to maturity
31 December 2018
Positive fair value
RO’000(note 9)
Negative fair value
RO’000(note 13)
Notional amountRO’000
Within 3 months
RO’000
3–12 monthsRO’000
1–5 years
RO’000
Fair value hedge - (852) 115,500 - 115,500 -
Interest rate swaps 126 (126) 39,138 6,998 12,280 19,860
Forward foreign exchange purchase contracts
101 (224) 180,987 144,358 36,408 221
Forward foreign exchange sales contracts 219 (65) 180,987 144,249 36,375 363
Currency options 4 (4) 533 206 - 327
Total 450 (1,271) 517,145 295,811 200,563 20,771
Total – USD’000 1,169 (3,301) 1,343,234 768,340 520,943 53,951
Notional amounts by term to maturity
31 December 2017
Positive fair value
RO’000(note 9)
Negative fair value
RO’000(note 13)
Notional amountRO’000
Within 3 months
RO’000
3–12 monthsRO’000
1–5 years
RO’000
Fair value hedge - (94) 192,500 - - 192,500
Interest rate swaps 1,842 (1,842) 95,238 6,285 13,971 74,982
Forward purchase contracts 508 (122) 212,849 175,508 13,879 23,462
Forward sales contracts 345 (910) 212,849 168,623 20,710 23,516
Currency options 6 (6) 13,193 8,579 4,614 -
Total 2,701 (2,974) 726,629 358,995 53,174 314,460
Total – USD’000 7,016 (7,725) 1,887,348 932,455 138,114 816,779
182 | National Bank of Oman Annual Report 2018 | 183
Notes to the Financial StatementsAs at 31 December 2018
Notes to the Financial StatementsAs at 31 December 2018
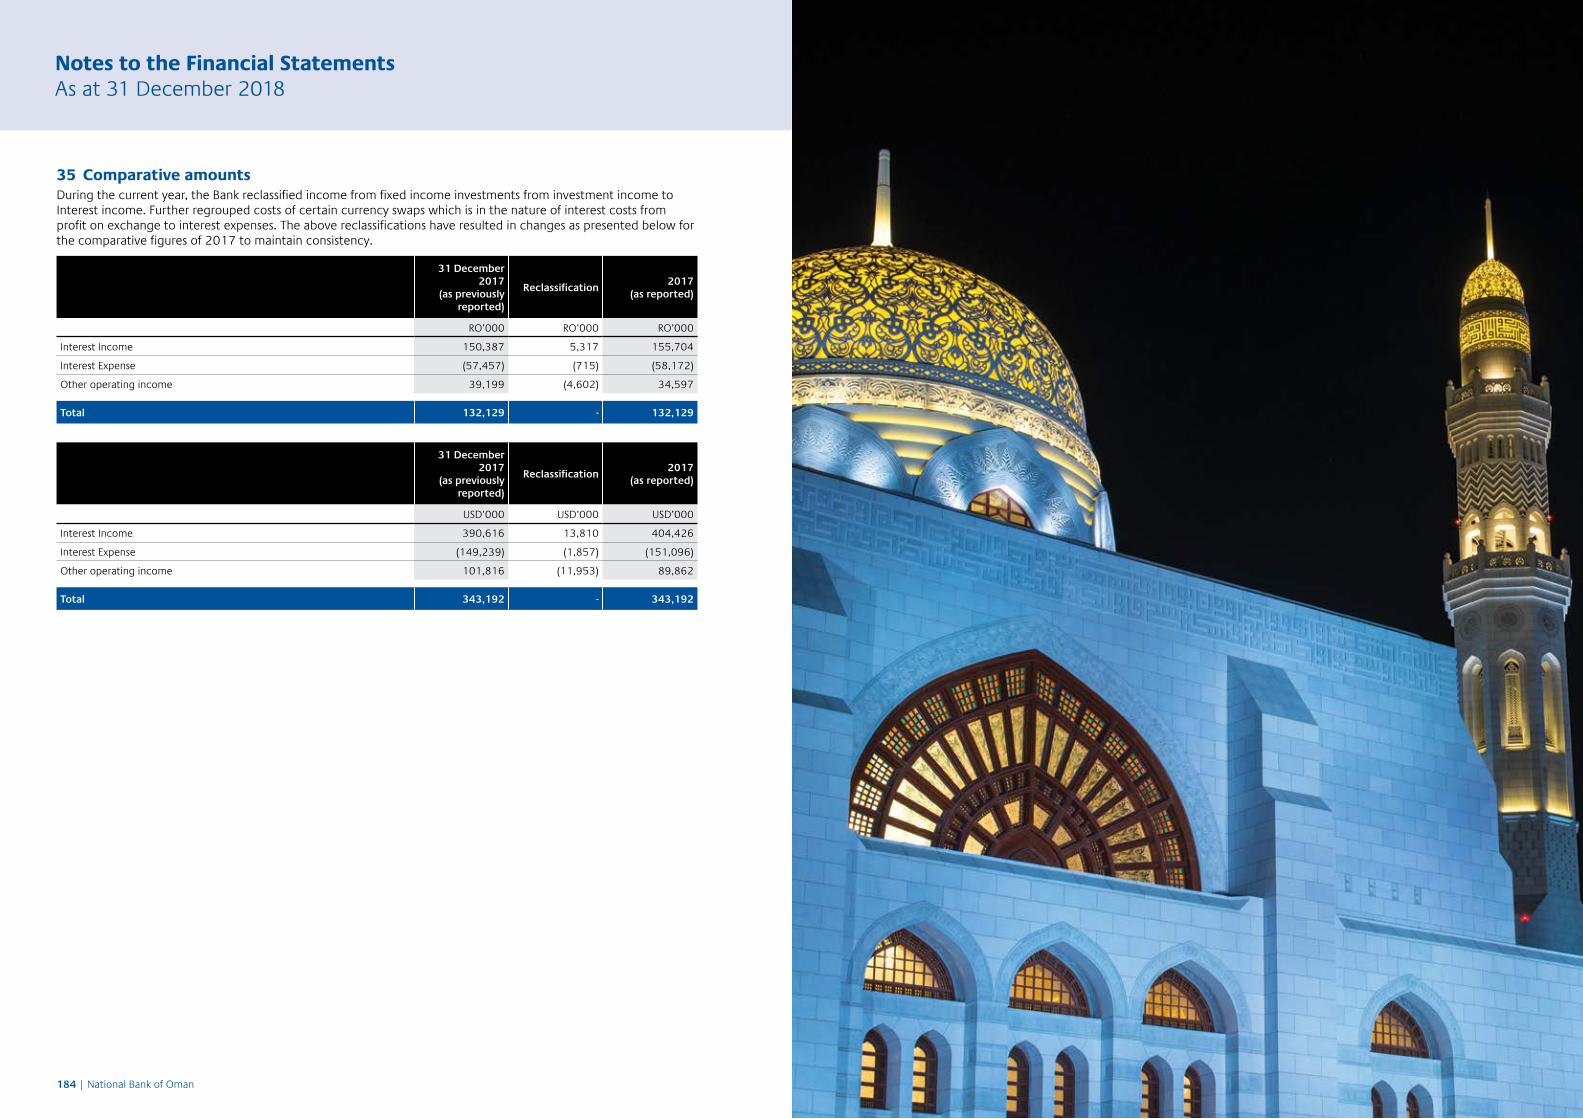
35 Comparative amountsDuring the current year, the Bank reclassified income from fixed income investments from investment income to Interest income. Further regrouped costs of certain currency swaps which is in the nature of interest costs from profit on exchange to interest expenses. The above reclassifications have resulted in changes as presented below for the comparative figures of 2017 to maintain consistency.
31 December 2017
(as previously reported)
Reclassification 2017
(as reported)
RO’000 RO’000 RO’000
Interest Income 150,387 5,317 155,704
Interest Expense (57,457) (715) (58,172)
Other operating income 39,199 (4,602) 34,597
Total 132,129 - 132,129
31 December 2017
(as previously reported)
Reclassification 2017
(as reported)
USD’000 USD’000 USD’000
Interest Income 390,616 13,810 404,426
Interest Expense (149,239) (1,857) (151,096)
Other operating income 101,816 (11,953) 89,862
Total 343,192 - 343,192
184 | National Bank of Oman
Notes to the Financial StatementsAs at 31 December 2018

Muzn Islamic Banking
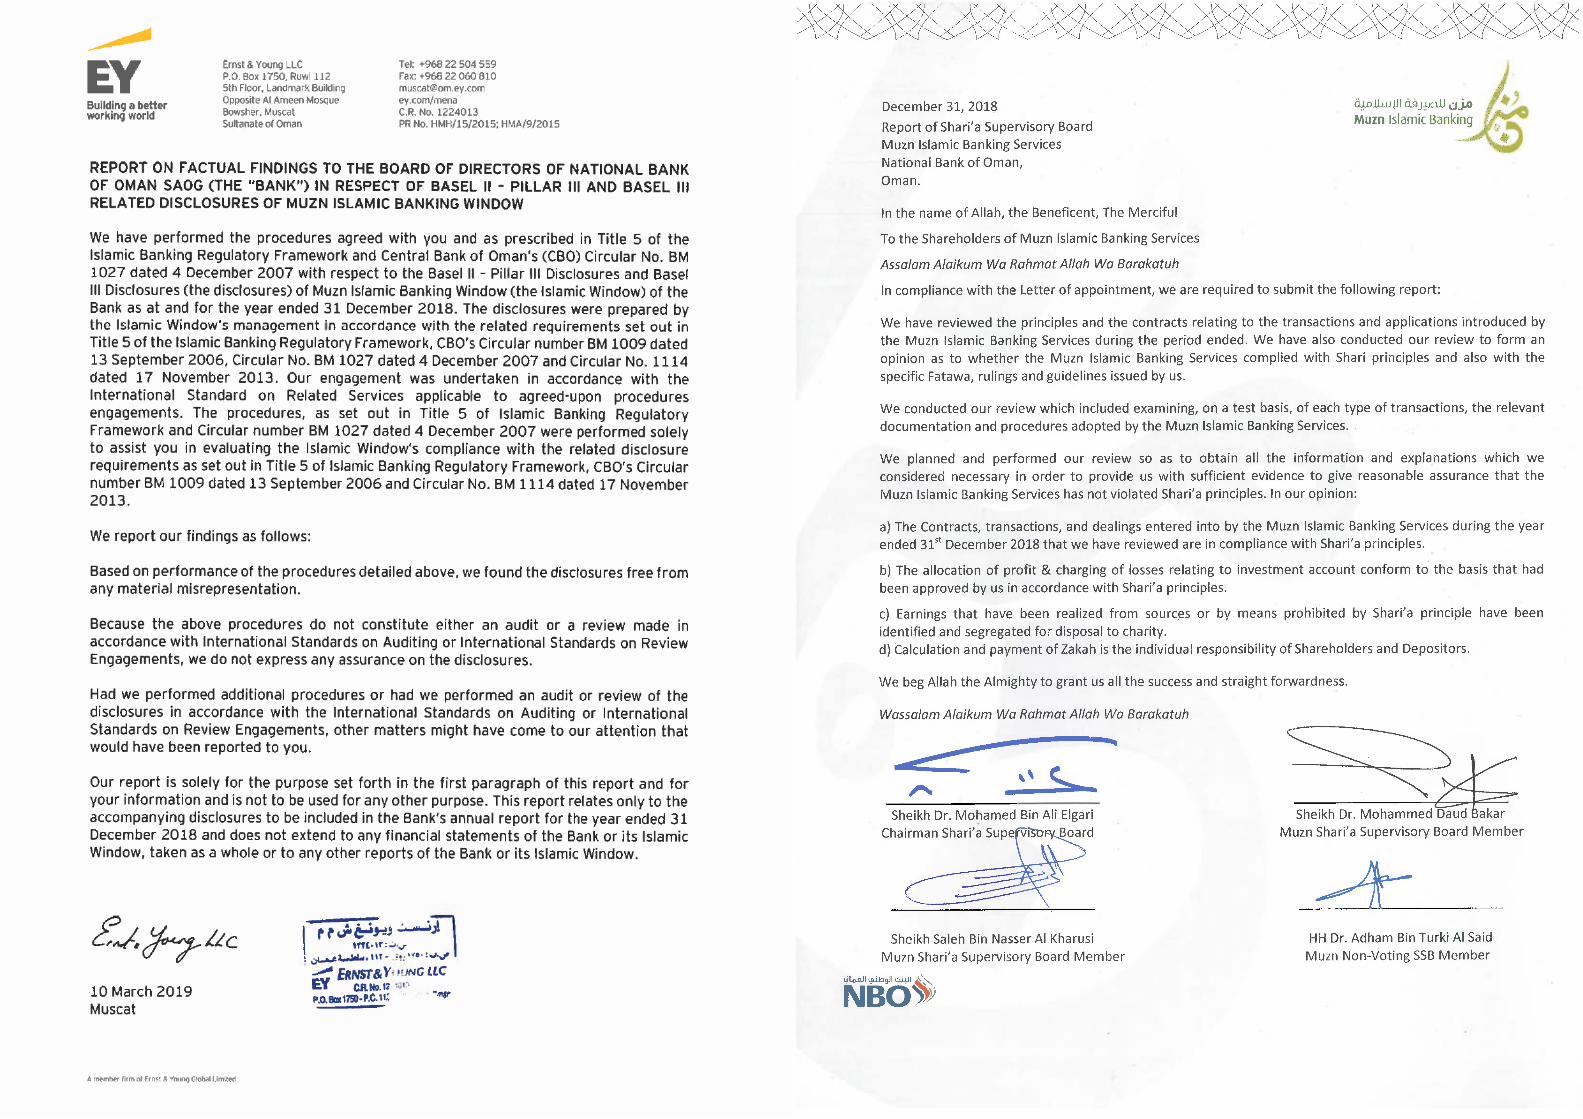

Basel II and III - Pillar III 2018
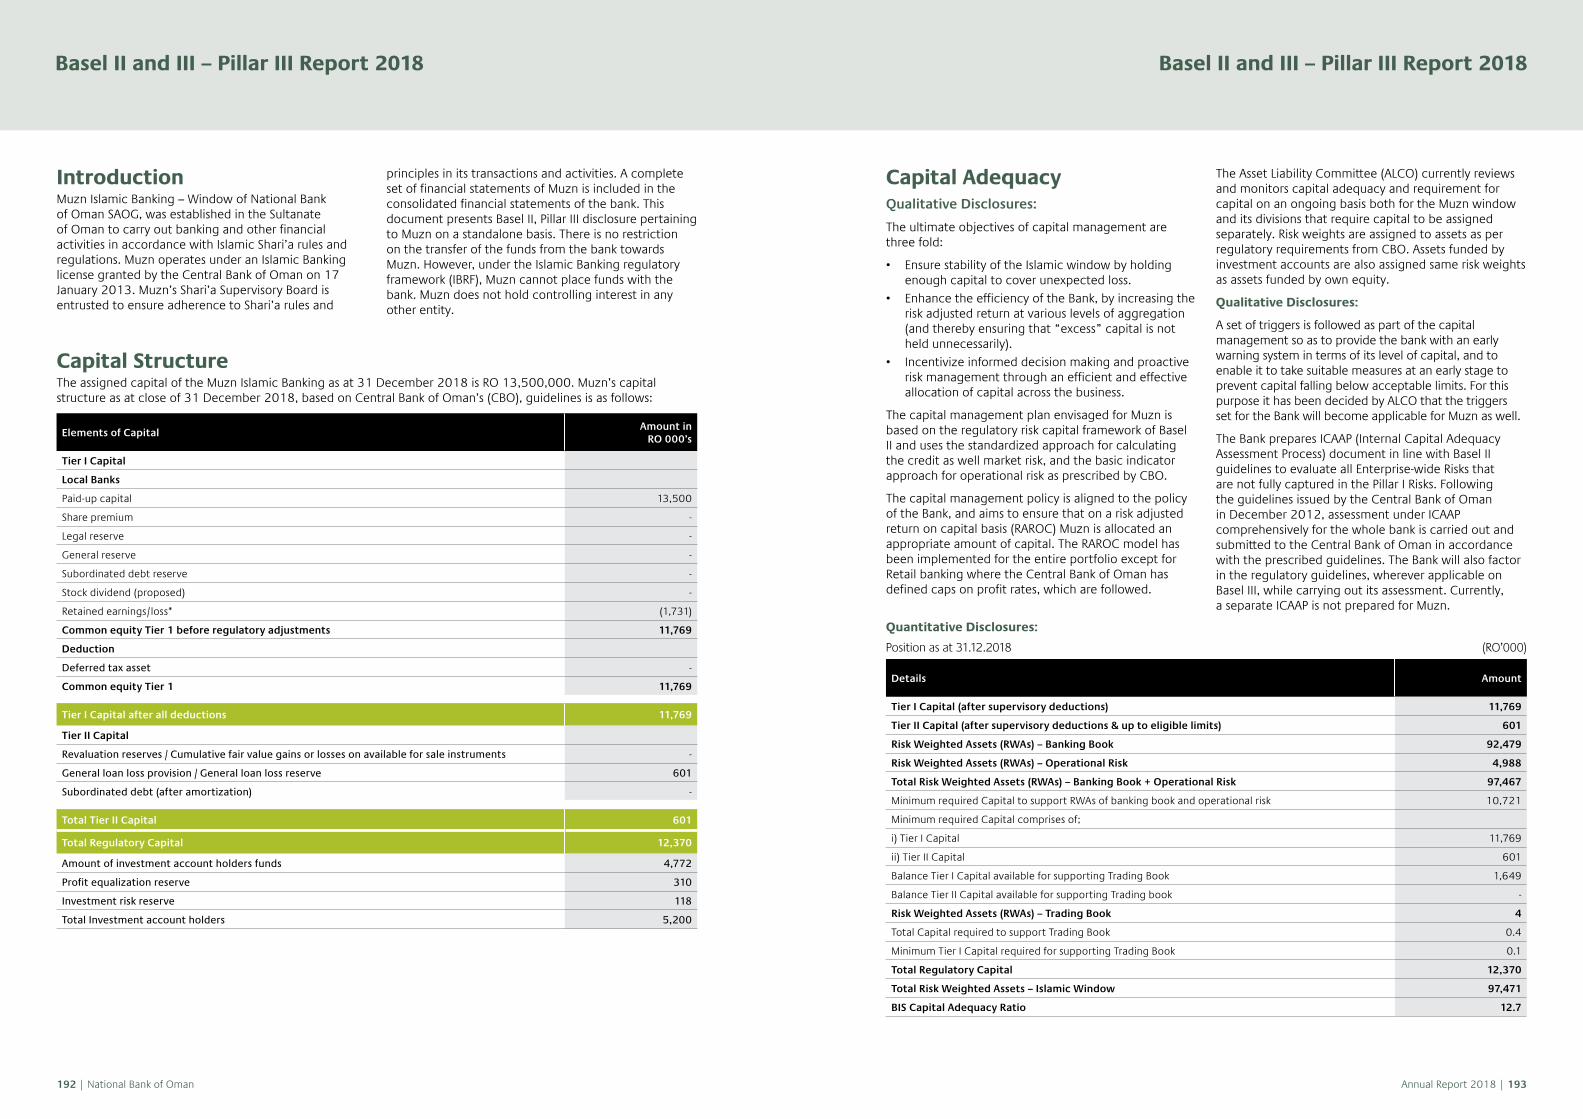
Basel II and III – Pillar III Report 2018 Basel II and III – Pillar III Report 2018
Capital StructureThe assigned capital of the Muzn Islamic Banking as at 31 December 2018 is RO 13,500,000. Muzn’s capital structure as at close of 31 December 2018, based on Central Bank of Oman’s (CBO), guidelines is as follows:
Elements of CapitalAmount in
RO 000’s
Tier I Capital
Local Banks
Paid-up capital 13,500
Share premium -
Legal reserve -
General reserve -
Subordinated debt reserve -
Stock dividend (proposed) -
Retained earnings/loss* (1,731)
Common equity Tier 1 before regulatory adjustments 11,769
Deduction
Deferred tax asset -
Common equity Tier 1 11,769
Tier I Capital after all deductions 11,769
Tier II Capital
Revaluation reserves / Cumulative fair value gains or losses on available for sale instruments -
General loan loss provision / General loan loss reserve 601
Subordinated debt (after amortization) -
Total Tier II Capital 601
Total Regulatory Capital 12,370
Amount of investment account holders funds 4,772
Profit equalization reserve 310
Investment risk reserve 118
Total Investment account holders 5,200
IntroductionMuzn Islamic Banking – Window of National Bank of Oman SAOG, was established in the Sultanate of Oman to carry out banking and other financial activities in accordance with Islamic Shari’a rules and regulations. Muzn operates under an Islamic Banking license granted by the Central Bank of Oman on 17 January 2013. Muzn’s Shari’a Supervisory Board is entrusted to ensure adherence to Shari’a rules and
principles in its transactions and activities. A complete set of financial statements of Muzn is included in the consolidated financial statements of the bank. This document presents Basel II, Pillar III disclosure pertaining to Muzn on a standalone basis. There is no restriction on the transfer of the funds from the bank towards Muzn. However, under the Islamic Banking regulatory framework (IBRF), Muzn cannot place funds with the bank. Muzn does not hold controlling interest in any other entity.
Details Amount
Tier I Capital (after supervisory deductions) 11,769
Tier II Capital (after supervisory deductions & up to eligible limits) 601
Risk Weighted Assets (RWAs) – Banking Book 92,479
Risk Weighted Assets (RWAs) – Operational Risk 4,988
Total Risk Weighted Assets (RWAs) – Banking Book + Operational Risk 97,467
Minimum required Capital to support RWAs of banking book and operational risk 10,721
Minimum required Capital comprises of;
i) Tier I Capital 11,769
ii) Tier II Capital 601
Balance Tier I Capital available for supporting Trading Book 1,649
Balance Tier II Capital available for supporting Trading book -
Risk Weighted Assets (RWAs) – Trading Book 4
Total Capital required to support Trading Book 0.4
Minimum Tier I Capital required for supporting Trading Book 0.1
Total Regulatory Capital 12,370
Total Risk Weighted Assets – Islamic Window 97,471
BIS Capital Adequacy Ratio 12.7
Capital AdequacyQualitative Disclosures:
The ultimate objectives of capital management are three fold:
• Ensure stability of the Islamic window by holding enough capital to cover unexpected loss.
• Enhance the efficiency of the Bank, by increasing the risk adjusted return at various levels of aggregation (and thereby ensuring that “excess” capital is not held unnecessarily).
• Incentivize informed decision making and proactive risk management through an efficient and effective allocation of capital across the business.
The capital management plan envisaged for Muzn is based on the regulatory risk capital framework of Basel II and uses the standardized approach for calculating the credit as well market risk, and the basic indicator approach for operational risk as prescribed by CBO.
The capital management policy is aligned to the policy of the Bank, and aims to ensure that on a risk adjusted return on capital basis (RAROC) Muzn is allocated an appropriate amount of capital. The RAROC model has been implemented for the entire portfolio except for Retail banking where the Central Bank of Oman has defined caps on profit rates, which are followed.
The Asset Liability Committee (ALCO) currently reviews and monitors capital adequacy and requirement for capital on an ongoing basis both for the Muzn window and its divisions that require capital to be assigned separately. Risk weights are assigned to assets as per regulatory requirements from CBO. Assets funded by investment accounts are also assigned same risk weights as assets funded by own equity.
Qualitative Disclosures:
A set of triggers is followed as part of the capital management so as to provide the bank with an early warning system in terms of its level of capital, and to enable it to take suitable measures at an early stage to prevent capital falling below acceptable limits. For this purpose it has been decided by ALCO that the triggers set for the Bank will become applicable for Muzn as well.
The Bank prepares ICAAP (Internal Capital Adequacy Assessment Process) document in line with Basel II guidelines to evaluate all Enterprise-wide Risks that are not fully captured in the Pillar I Risks. Following the guidelines issued by the Central Bank of Oman in December 2012, assessment under ICAAP comprehensively for the whole bank is carried out and submitted to the Central Bank of Oman in accordance with the prescribed guidelines. The Bank will also factor in the regulatory guidelines, wherever applicable on Basel III, while carrying out its assessment. Currently, a separate ICAAP is not prepared for Muzn.
Position as at 31.12.2018 (RO’000)
Quantitative Disclosures:
192 | National Bank of Oman Annual Report 2018 | 193
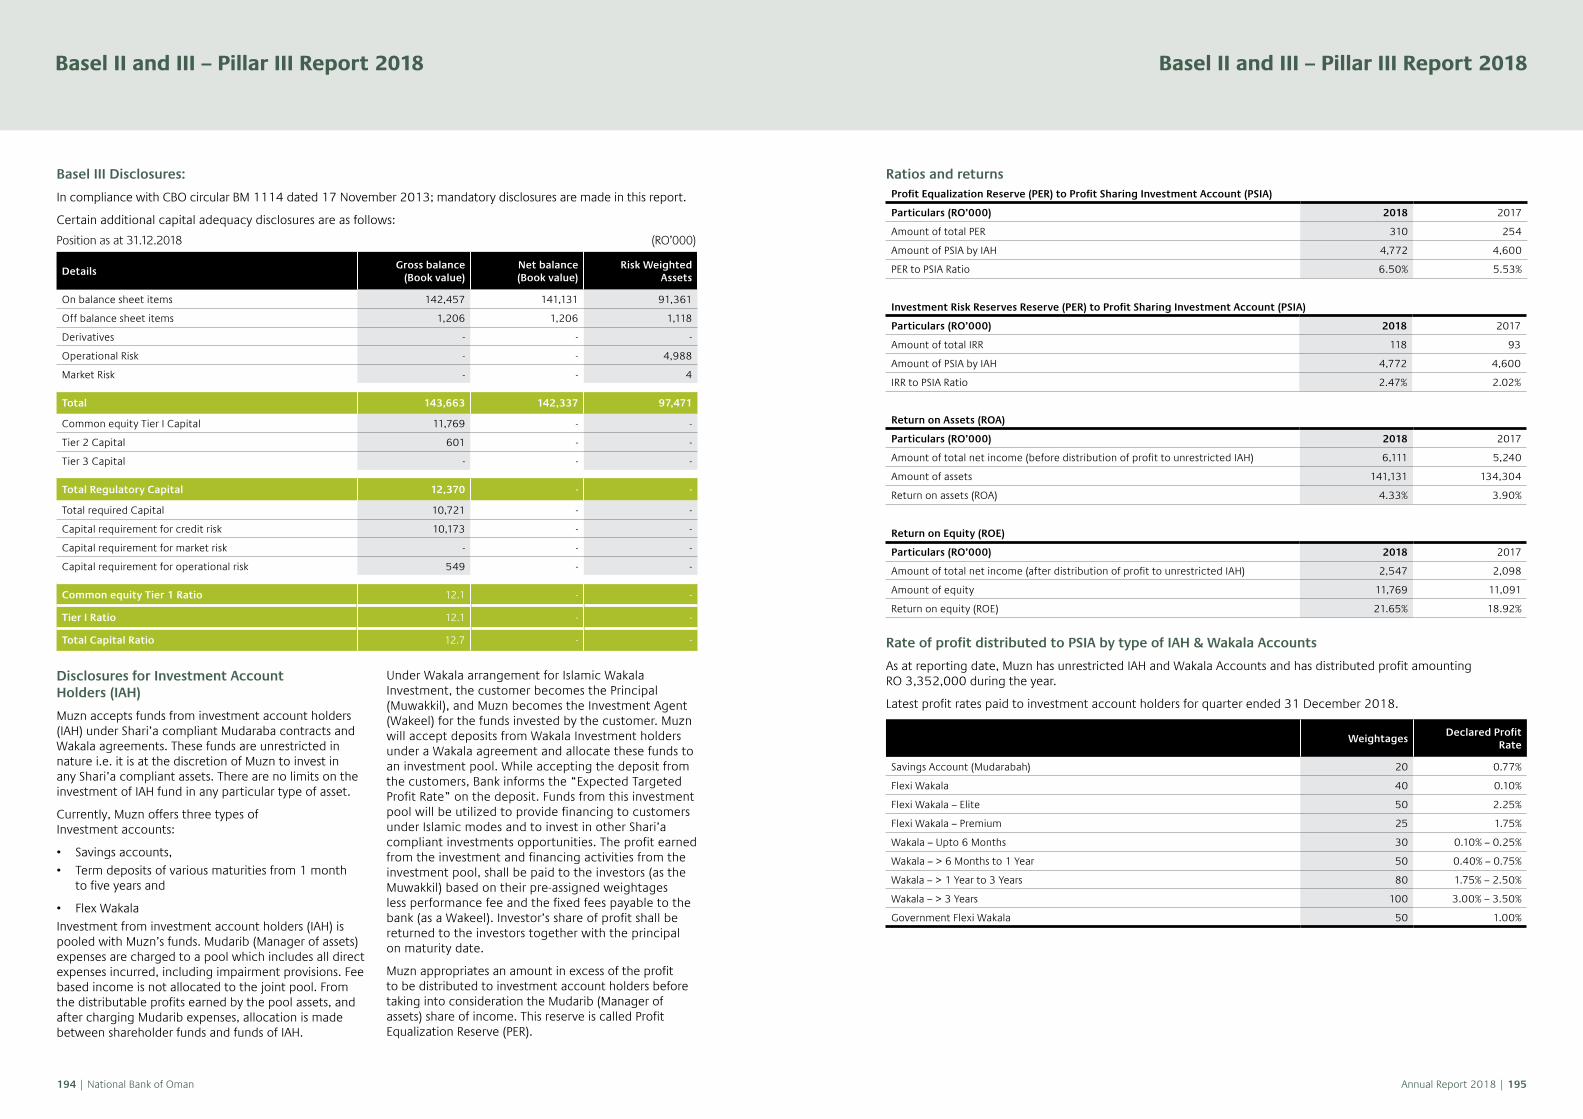
Basel II and III – Pillar III Report 2018 Basel II and III – Pillar III Report 2018
Basel III Disclosures:
In compliance with CBO circular BM 1114 dated 17 November 2013; mandatory disclosures are made in this report.
Certain additional capital adequacy disclosures are as follows:
Position as at 31.12.2018 (RO’000)
DetailsGross balance
(Book value)Net balance (Book value)
Risk Weighted Assets
On balance sheet items 142,457 141,131 91,361
Off balance sheet items 1,206 1,206 1,118
Derivatives - - -
Operational Risk - - 4,988
Market Risk - - 4
Total 143,663 142,337 97,471
Common equity Tier I Capital 11,769 - -
Tier 2 Capital 601 - -
Tier 3 Capital - - -
Total Regulatory Capital 12,370 - -
Total required Capital 10,721 - -
Capital requirement for credit risk 10,173 - -
Capital requirement for market risk - - -
Capital requirement for operational risk 549 - -
Common equity Tier 1 Ratio 12.1 - -
Tier I Ratio 12.1 - -
Total Capital Ratio 12.7 - -
Disclosures for Investment Account Holders (IAH)
Muzn accepts funds from investment account holders (IAH) under Shari’a compliant Mudaraba contracts and Wakala agreements. These funds are unrestricted in nature i.e. it is at the discretion of Muzn to invest in any Shari’a compliant assets. There are no limits on the investment of IAH fund in any particular type of asset.
Currently, Muzn offers three types of Investment accounts:
• Savings accounts, • Term deposits of various maturities from 1 month
to five years and
• Flex WakalaInvestment from investment account holders (IAH) is pooled with Muzn’s funds. Mudarib (Manager of assets) expenses are charged to a pool which includes all direct expenses incurred, including impairment provisions. Fee based income is not allocated to the joint pool. From the distributable profits earned by the pool assets, and after charging Mudarib expenses, allocation is made between shareholder funds and funds of IAH.
Under Wakala arrangement for Islamic Wakala Investment, the customer becomes the Principal (Muwakkil), and Muzn becomes the Investment Agent (Wakeel) for the funds invested by the customer. Muzn will accept deposits from Wakala Investment holders under a Wakala agreement and allocate these funds to an investment pool. While accepting the deposit from the customers, Bank informs the “Expected Targeted Profit Rate” on the deposit. Funds from this investment pool will be utilized to provide financing to customers under Islamic modes and to invest in other Shari’a compliant investments opportunities. The profit earned from the investment and financing activities from the investment pool, shall be paid to the investors (as the Muwakkil) based on their pre-assigned weightages less performance fee and the fixed fees payable to the bank (as a Wakeel). Investor’s share of profit shall be returned to the investors together with the principal on maturity date.
Muzn appropriates an amount in excess of the profit to be distributed to investment account holders before taking into consideration the Mudarib (Manager of assets) share of income. This reserve is called Profit Equalization Reserve (PER).
Ratios and returns
Investment Risk Reserves Reserve (PER) to Profit Sharing Investment Account (PSIA)
Particulars (RO’000) 2018 2017
Amount of total IRR 118 93
Amount of PSIA by IAH 4,772 4,600
IRR to PSIA Ratio 2.47% 2.02%
Profit Equalization Reserve (PER) to Profit Sharing Investment Account (PSIA)
Particulars (RO’000) 2018 2017
Amount of total PER 310 254
Amount of PSIA by IAH 4,772 4,600
PER to PSIA Ratio 6.50% 5.53%
Return on Assets (ROA)
Particulars (RO’000) 2018 2017
Amount of total net income (before distribution of profit to unrestricted IAH) 6,111 5,240
Amount of assets 141,131 134,304
Return on assets (ROA) 4.33% 3.90%
Return on Equity (ROE)
Particulars (RO’000) 2018 2017
Amount of total net income (after distribution of profit to unrestricted IAH) 2,547 2,098
Amount of equity 11,769 11,091
Return on equity (ROE) 21.65% 18.92%
Rate of profit distributed to PSIA by type of IAH & Wakala Accounts
As at reporting date, Muzn has unrestricted IAH and Wakala Accounts and has distributed profit amounting RO 3,352,000 during the year.
Latest profit rates paid to investment account holders for quarter ended 31 December 2018.
WeightagesDeclared Profit
Rate
Savings Account (Mudarabah) 20 0.77%
Flexi Wakala 40 0.10%
Flexi Wakala – Elite 50 2.25%
Flexi Wakala – Premium 25 1.75%
Wakala – Upto 6 Months 30 0.10% – 0.25%
Wakala – > 6 Months to 1 Year 50 0.40% – 0.75%
Wakala – > 1 Year to 3 Years 80 1.75% – 2.50%
Wakala – > 3 Years 100 3.00% – 3.50%
Government Flexi Wakala 50 1.00%
194 | National Bank of Oman Annual Report 2018 | 195
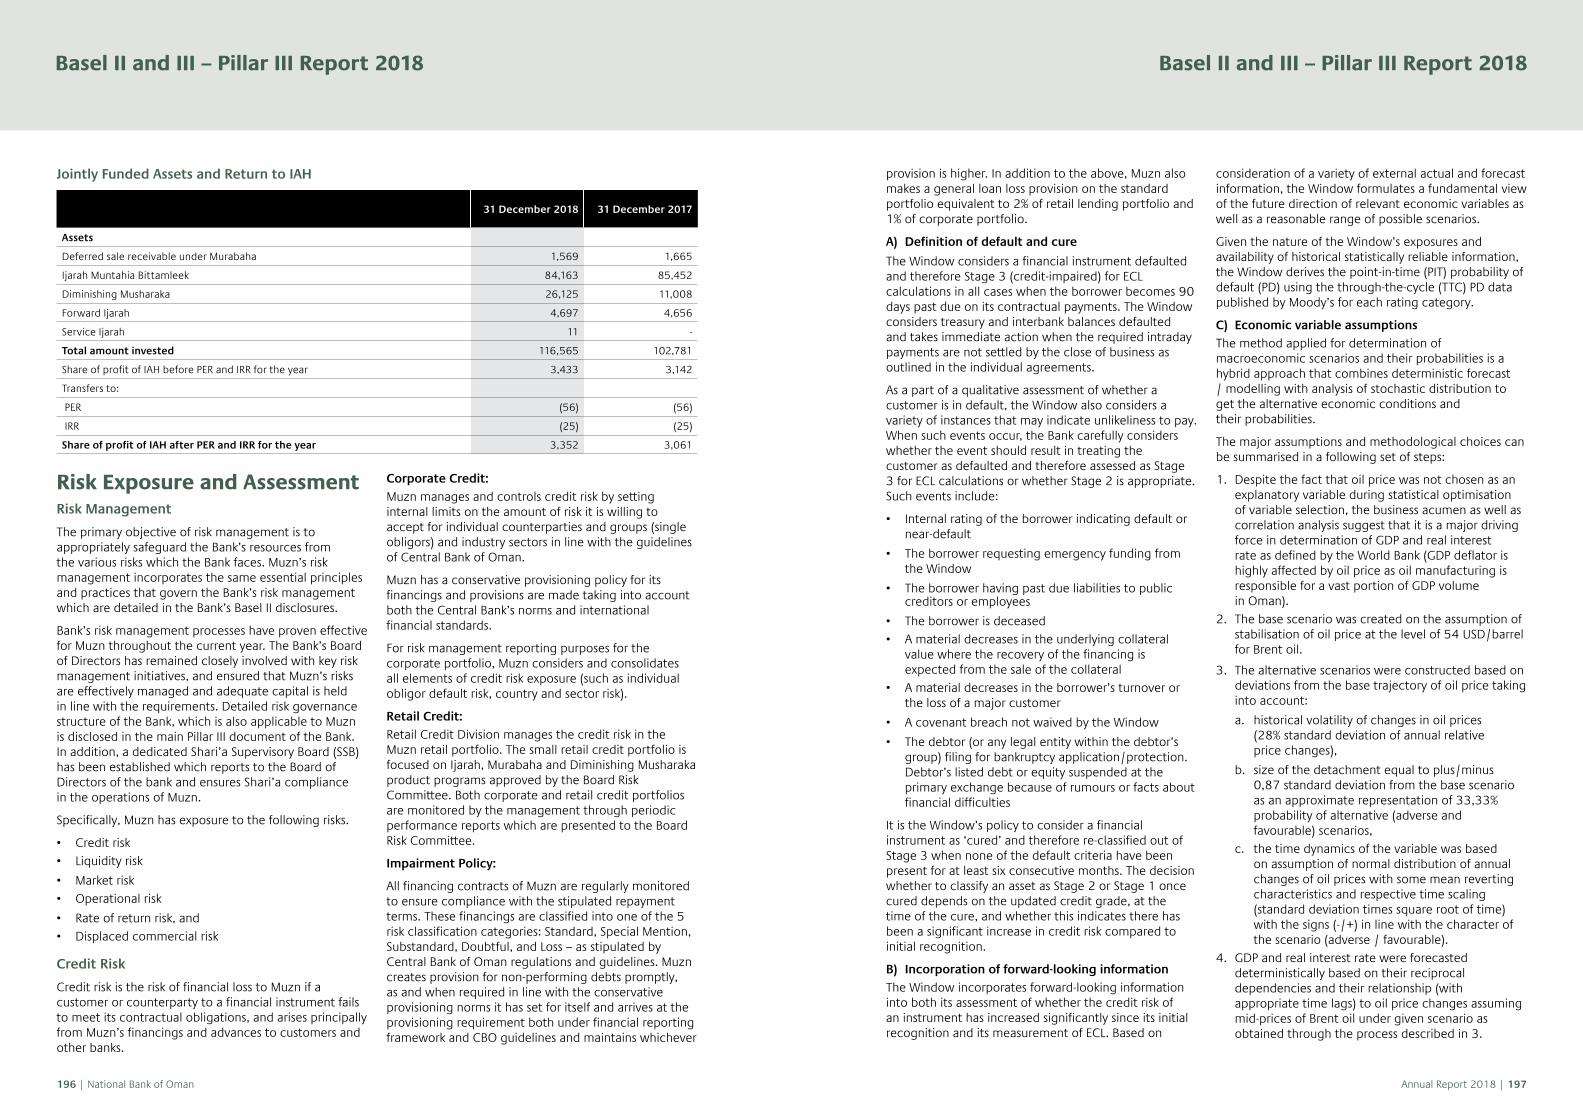
Basel II and III – Pillar III Report 2018 Basel II and III – Pillar III Report 2018
31 December 2018 31 December 2017
Assets
Deferred sale receivable under Murabaha 1,569 1,665
Ijarah Muntahia Bittamleek 84,163 85,452
Diminishing Musharaka 26,125 11,008
Forward Ijarah 4,697 4,656
Service Ijarah 11 -
Total amount invested 116,565 102,781
Share of profit of IAH before PER and IRR for the year 3,433 3,142
Transfers to:
PER (56) (56)
IRR (25) (25)
Share of profit of IAH after PER and IRR for the year 3,352 3,061
Jointly Funded Assets and Return to IAH
Risk Exposure and AssessmentRisk Management
The primary objective of risk management is to appropriately safeguard the Bank’s resources from the various risks which the Bank faces. Muzn’s risk management incorporates the same essential principles and practices that govern the Bank’s risk management which are detailed in the Bank’s Basel II disclosures.
Bank’s risk management processes have proven effective for Muzn throughout the current year. The Bank’s Board of Directors has remained closely involved with key risk management initiatives, and ensured that Muzn’s risks are effectively managed and adequate capital is held in line with the requirements. Detailed risk governance structure of the Bank, which is also applicable to Muzn is disclosed in the main Pillar III document of the Bank. In addition, a dedicated Shari’a Supervisory Board (SSB) has been established which reports to the Board of Directors of the bank and ensures Shari’a compliance in the operations of Muzn.
Specifically, Muzn has exposure to the following risks.
• Credit risk• Liquidity risk
• Market risk• Operational risk
• Rate of return risk, and• Displaced commercial risk
Credit Risk
Credit risk is the risk of financial loss to Muzn if a customer or counterparty to a financial instrument fails to meet its contractual obligations, and arises principally from Muzn’s financings and advances to customers and other banks.
Corporate Credit:Muzn manages and controls credit risk by setting internal limits on the amount of risk it is willing to accept for individual counterparties and groups (single obligors) and industry sectors in line with the guidelines of Central Bank of Oman.
Muzn has a conservative provisioning policy for its financings and provisions are made taking into account both the Central Bank’s norms and international financial standards.
For risk management reporting purposes for the corporate portfolio, Muzn considers and consolidates all elements of credit risk exposure (such as individual obligor default risk, country and sector risk).
Retail Credit:Retail Credit Division manages the credit risk in the Muzn retail portfolio. The small retail credit portfolio is focused on Ijarah, Murabaha and Diminishing Musharaka product programs approved by the Board Risk Committee. Both corporate and retail credit portfolios are monitored by the management through periodic performance reports which are presented to the Board Risk Committee.
Impairment Policy:
All financing contracts of Muzn are regularly monitored to ensure compliance with the stipulated repayment terms. These financings are classified into one of the 5 risk classification categories: Standard, Special Mention, Substandard, Doubtful, and Loss – as stipulated by Central Bank of Oman regulations and guidelines. Muzn creates provision for non-performing debts promptly, as and when required in line with the conservative provisioning norms it has set for itself and arrives at the provisioning requirement both under financial reporting framework and CBO guidelines and maintains whichever
provision is higher. In addition to the above, Muzn also makes a general loan loss provision on the standard portfolio equivalent to 2% of retail lending portfolio and 1% of corporate portfolio.
A) Definition of default and cure
The Window considers a financial instrument defaulted and therefore Stage 3 (credit-impaired) for ECL calculations in all cases when the borrower becomes 90 days past due on its contractual payments. The Window considers treasury and interbank balances defaulted and takes immediate action when the required intraday payments are not settled by the close of business as outlined in the individual agreements.
As a part of a qualitative assessment of whether a customer is in default, the Window also considers a variety of instances that may indicate unlikeliness to pay. When such events occur, the Bank carefully considers whether the event should result in treating the customer as defaulted and therefore assessed as Stage 3 for ECL calculations or whether Stage 2 is appropriate. Such events include:
• Internal rating of the borrower indicating default or near-default
• The borrower requesting emergency funding from the Window
• The borrower having past due liabilities to public creditors or employees
• The borrower is deceased• A material decreases in the underlying collateral
value where the recovery of the financing is expected from the sale of the collateral
• A material decreases in the borrower’s turnover or the loss of a major customer
• A covenant breach not waived by the Window
• The debtor (or any legal entity within the debtor’s group) filing for bankruptcy application/protection. Debtor’s listed debt or equity suspended at the primary exchange because of rumours or facts about financial difficulties
It is the Window’s policy to consider a financial instrument as ‘cured’ and therefore re-classified out of Stage 3 when none of the default criteria have been present for at least six consecutive months. The decision whether to classify an asset as Stage 2 or Stage 1 once cured depends on the updated credit grade, at the time of the cure, and whether this indicates there has been a significant increase in credit risk compared to initial recognition.
B) Incorporation of forward-looking information The Window incorporates forward-looking information into both its assessment of whether the credit risk of an instrument has increased significantly since its initial recognition and its measurement of ECL. Based on
consideration of a variety of external actual and forecast information, the Window formulates a fundamental view of the future direction of relevant economic variables as well as a reasonable range of possible scenarios.
Given the nature of the Window’s exposures and availability of historical statistically reliable information, the Window derives the point-in-time (PIT) probability of default (PD) using the through-the-cycle (TTC) PD data published by Moody’s for each rating category.
C) Economic variable assumptionsThe method applied for determination of macroeconomic scenarios and their probabilities is a hybrid approach that combines deterministic forecast / modelling with analysis of stochastic distribution to get the alternative economic conditions and their probabilities.
The major assumptions and methodological choices can be summarised in a following set of steps:
1. Despite the fact that oil price was not chosen as an explanatory variable during statistical optimisation of variable selection, the business acumen as well as correlation analysis suggest that it is a major driving force in determination of GDP and real interest rate as defined by the World Bank (GDP deflator is highly affected by oil price as oil manufacturing is responsible for a vast portion of GDP volume in Oman).
2. The base scenario was created on the assumption of stabilisation of oil price at the level of 54 USD/barrel for Brent oil.
3. The alternative scenarios were constructed based on deviations from the base trajectory of oil price taking into account:
a. historical volatility of changes in oil prices (28% standard deviation of annual relative price changes),
b. size of the detachment equal to plus/minus 0,87 standard deviation from the base scenario as an approximate representation of 33,33% probability of alternative (adverse and favourable) scenarios,
c. the time dynamics of the variable was based on assumption of normal distribution of annual changes of oil prices with some mean reverting characteristics and respective time scaling (standard deviation times square root of time) with the signs (-/+) in line with the character of the scenario (adverse / favourable).
4. GDP and real interest rate were forecasted deterministically based on their reciprocal dependencies and their relationship (with appropriate time lags) to oil price changes assuming mid-prices of Brent oil under given scenario as obtained through the process described in 3.
196 | National Bank of Oman Annual Report 2018 | 197
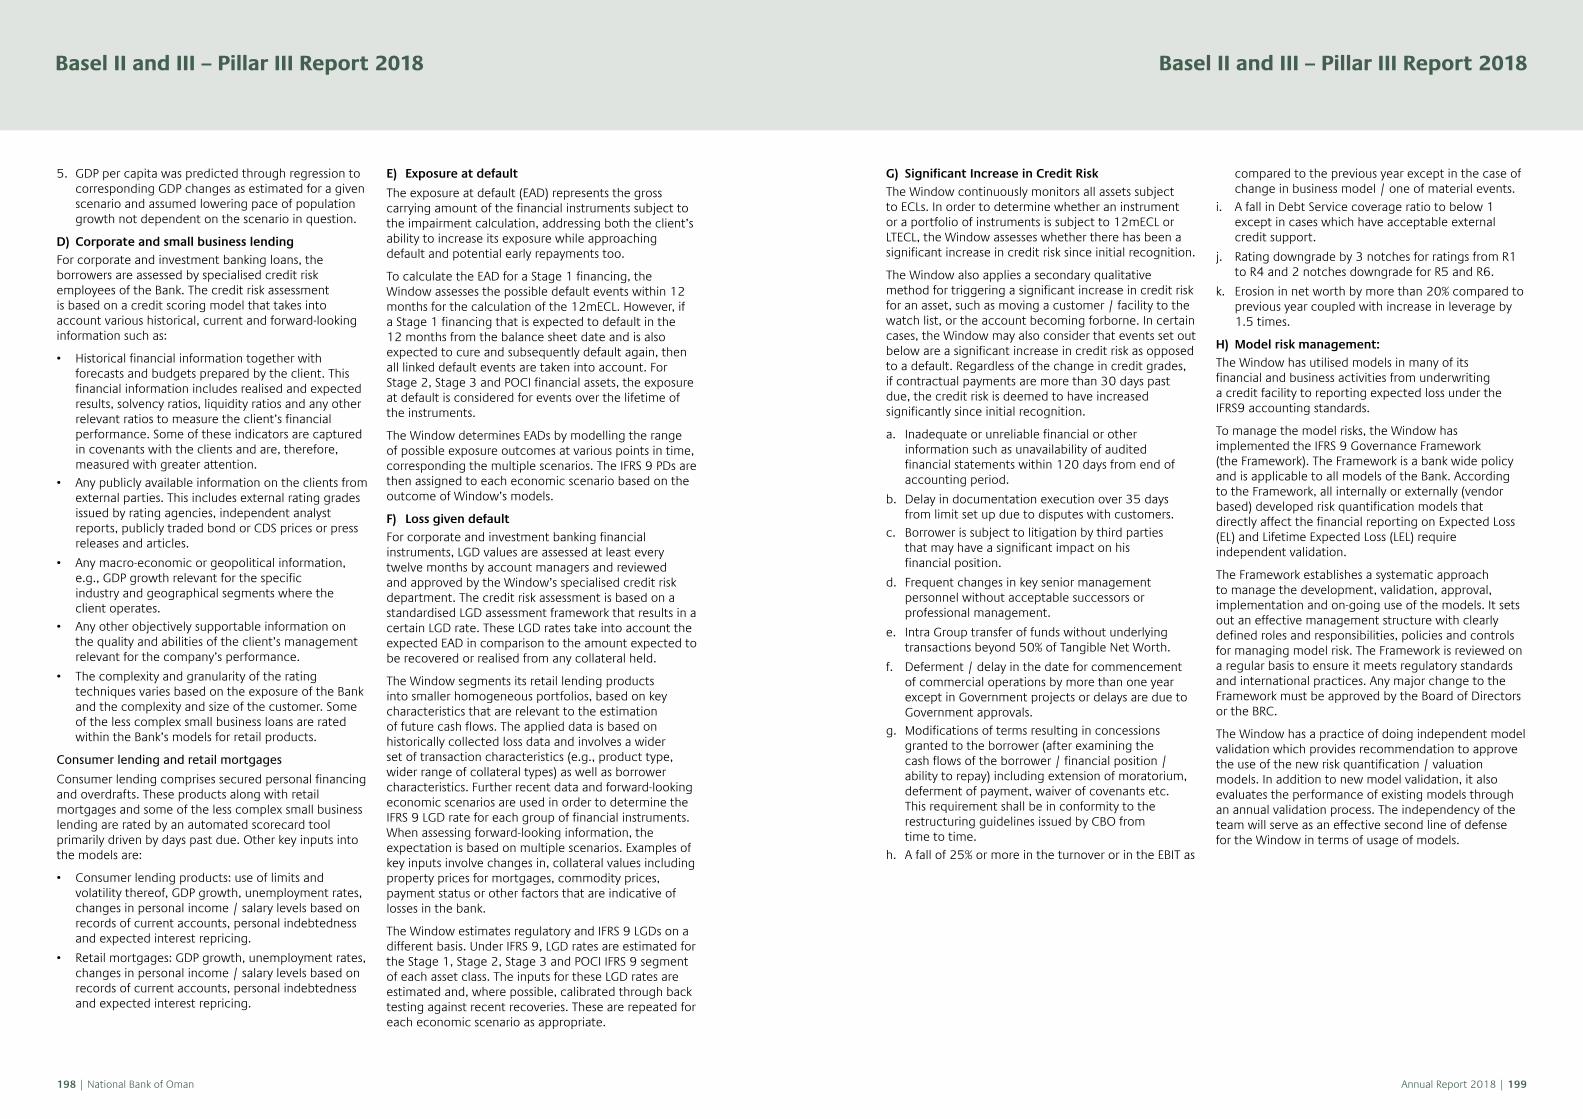
Basel II and III – Pillar III Report 2018 Basel II and III – Pillar III Report 2018
5. GDP per capita was predicted through regression to corresponding GDP changes as estimated for a given scenario and assumed lowering pace of population growth not dependent on the scenario in question.
D) Corporate and small business lendingFor corporate and investment banking loans, the borrowers are assessed by specialised credit risk employees of the Bank. The credit risk assessment is based on a credit scoring model that takes into account various historical, current and forward-looking information such as:
• Historical financial information together with forecasts and budgets prepared by the client. This financial information includes realised and expected results, solvency ratios, liquidity ratios and any other relevant ratios to measure the client’s financial performance. Some of these indicators are captured in covenants with the clients and are, therefore, measured with greater attention.
• Any publicly available information on the clients from external parties. This includes external rating grades issued by rating agencies, independent analyst reports, publicly traded bond or CDS prices or press releases and articles.
• Any macro-economic or geopolitical information, e.g., GDP growth relevant for the specific industry and geographical segments where the client operates.
• Any other objectively supportable information on the quality and abilities of the client’s management relevant for the company’s performance.
• The complexity and granularity of the rating techniques varies based on the exposure of the Bank and the complexity and size of the customer. Some of the less complex small business loans are rated within the Bank’s models for retail products.
Consumer lending and retail mortgages
Consumer lending comprises secured personal financing and overdrafts. These products along with retail mortgages and some of the less complex small business lending are rated by an automated scorecard tool primarily driven by days past due. Other key inputs into the models are:
• Consumer lending products: use of limits and volatility thereof, GDP growth, unemployment rates, changes in personal income / salary levels based on records of current accounts, personal indebtedness and expected interest repricing.
• Retail mortgages: GDP growth, unemployment rates, changes in personal income / salary levels based on records of current accounts, personal indebtedness and expected interest repricing.
E) Exposure at default
The exposure at default (EAD) represents the gross carrying amount of the financial instruments subject to the impairment calculation, addressing both the client’s ability to increase its exposure while approaching default and potential early repayments too.
To calculate the EAD for a Stage 1 financing, the Window assesses the possible default events within 12 months for the calculation of the 12mECL. However, if a Stage 1 financing that is expected to default in the 12 months from the balance sheet date and is also expected to cure and subsequently default again, then all linked default events are taken into account. For Stage 2, Stage 3 and POCI financial assets, the exposure at default is considered for events over the lifetime of the instruments.
The Window determines EADs by modelling the range of possible exposure outcomes at various points in time, corresponding the multiple scenarios. The IFRS 9 PDs are then assigned to each economic scenario based on the outcome of Window’s models.
F) Loss given defaultFor corporate and investment banking financial instruments, LGD values are assessed at least every twelve months by account managers and reviewed and approved by the Window’s specialised credit risk department. The credit risk assessment is based on a standardised LGD assessment framework that results in a certain LGD rate. These LGD rates take into account the expected EAD in comparison to the amount expected to be recovered or realised from any collateral held.
The Window segments its retail lending products into smaller homogeneous portfolios, based on key characteristics that are relevant to the estimation of future cash flows. The applied data is based on historically collected loss data and involves a wider set of transaction characteristics (e.g., product type, wider range of collateral types) as well as borrower characteristics. Further recent data and forward-looking economic scenarios are used in order to determine the IFRS 9 LGD rate for each group of financial instruments. When assessing forward-looking information, the expectation is based on multiple scenarios. Examples of key inputs involve changes in, collateral values including property prices for mortgages, commodity prices, payment status or other factors that are indicative of losses in the bank.
The Window estimates regulatory and IFRS 9 LGDs on a different basis. Under IFRS 9, LGD rates are estimated for the Stage 1, Stage 2, Stage 3 and POCI IFRS 9 segment of each asset class. The inputs for these LGD rates are estimated and, where possible, calibrated through back testing against recent recoveries. These are repeated for each economic scenario as appropriate.
G) Significant Increase in Credit RiskThe Window continuously monitors all assets subject to ECLs. In order to determine whether an instrument or a portfolio of instruments is subject to 12mECL or LTECL, the Window assesses whether there has been a significant increase in credit risk since initial recognition.
The Window also applies a secondary qualitative method for triggering a significant increase in credit risk for an asset, such as moving a customer / facility to the watch list, or the account becoming forborne. In certain cases, the Window may also consider that events set out below are a significant increase in credit risk as opposed to a default. Regardless of the change in credit grades, if contractual payments are more than 30 days past due, the credit risk is deemed to have increased significantly since initial recognition.
a. Inadequate or unreliable financial or other information such as unavailability of audited financial statements within 120 days from end of accounting period.
b. Delay in documentation execution over 35 days from limit set up due to disputes with customers.
c. Borrower is subject to litigation by third parties that may have a significant impact on his financial position.
d. Frequent changes in key senior management personnel without acceptable successors or professional management.
e. Intra Group transfer of funds without underlying transactions beyond 50% of Tangible Net Worth.
f. Deferment / delay in the date for commencement of commercial operations by more than one year except in Government projects or delays are due to Government approvals.
g. Modifications of terms resulting in concessions granted to the borrower (after examining the cash flows of the borrower / financial position /ability to repay) including extension of moratorium, deferment of payment, waiver of covenants etc. This requirement shall be in conformity to the restructuring guidelines issued by CBO from time to time.
h. A fall of 25% or more in the turnover or in the EBIT as
compared to the previous year except in the case of change in business model / one of material events.
i. A fall in Debt Service coverage ratio to below 1 except in cases which have acceptable external credit support.
j. Rating downgrade by 3 notches for ratings from R1 to R4 and 2 notches downgrade for R5 and R6.
k. Erosion in net worth by more than 20% compared to previous year coupled with increase in leverage by 1.5 times.
H) Model risk management:The Window has utilised models in many of its financial and business activities from underwriting a credit facility to reporting expected loss under the IFRS9 accounting standards.
To manage the model risks, the Window has implemented the IFRS 9 Governance Framework (the Framework). The Framework is a bank wide policy and is applicable to all models of the Bank. According to the Framework, all internally or externally (vendor based) developed risk quantification models that directly affect the financial reporting on Expected Loss (EL) and Lifetime Expected Loss (LEL) require independent validation.
The Framework establishes a systematic approach to manage the development, validation, approval, implementation and on-going use of the models. It sets out an effective management structure with clearly defined roles and responsibilities, policies and controls for managing model risk. The Framework is reviewed on a regular basis to ensure it meets regulatory standards and international practices. Any major change to the Framework must be approved by the Board of Directors or the BRC.
The Window has a practice of doing independent model validation which provides recommendation to approve the use of the new risk quantification / valuation models. In addition to new model validation, it also evaluates the performance of existing models through an annual validation process. The independency of the team will serve as an effective second line of defense for the Window in terms of usage of models.
198 | National Bank of Oman Annual Report 2018 | 199
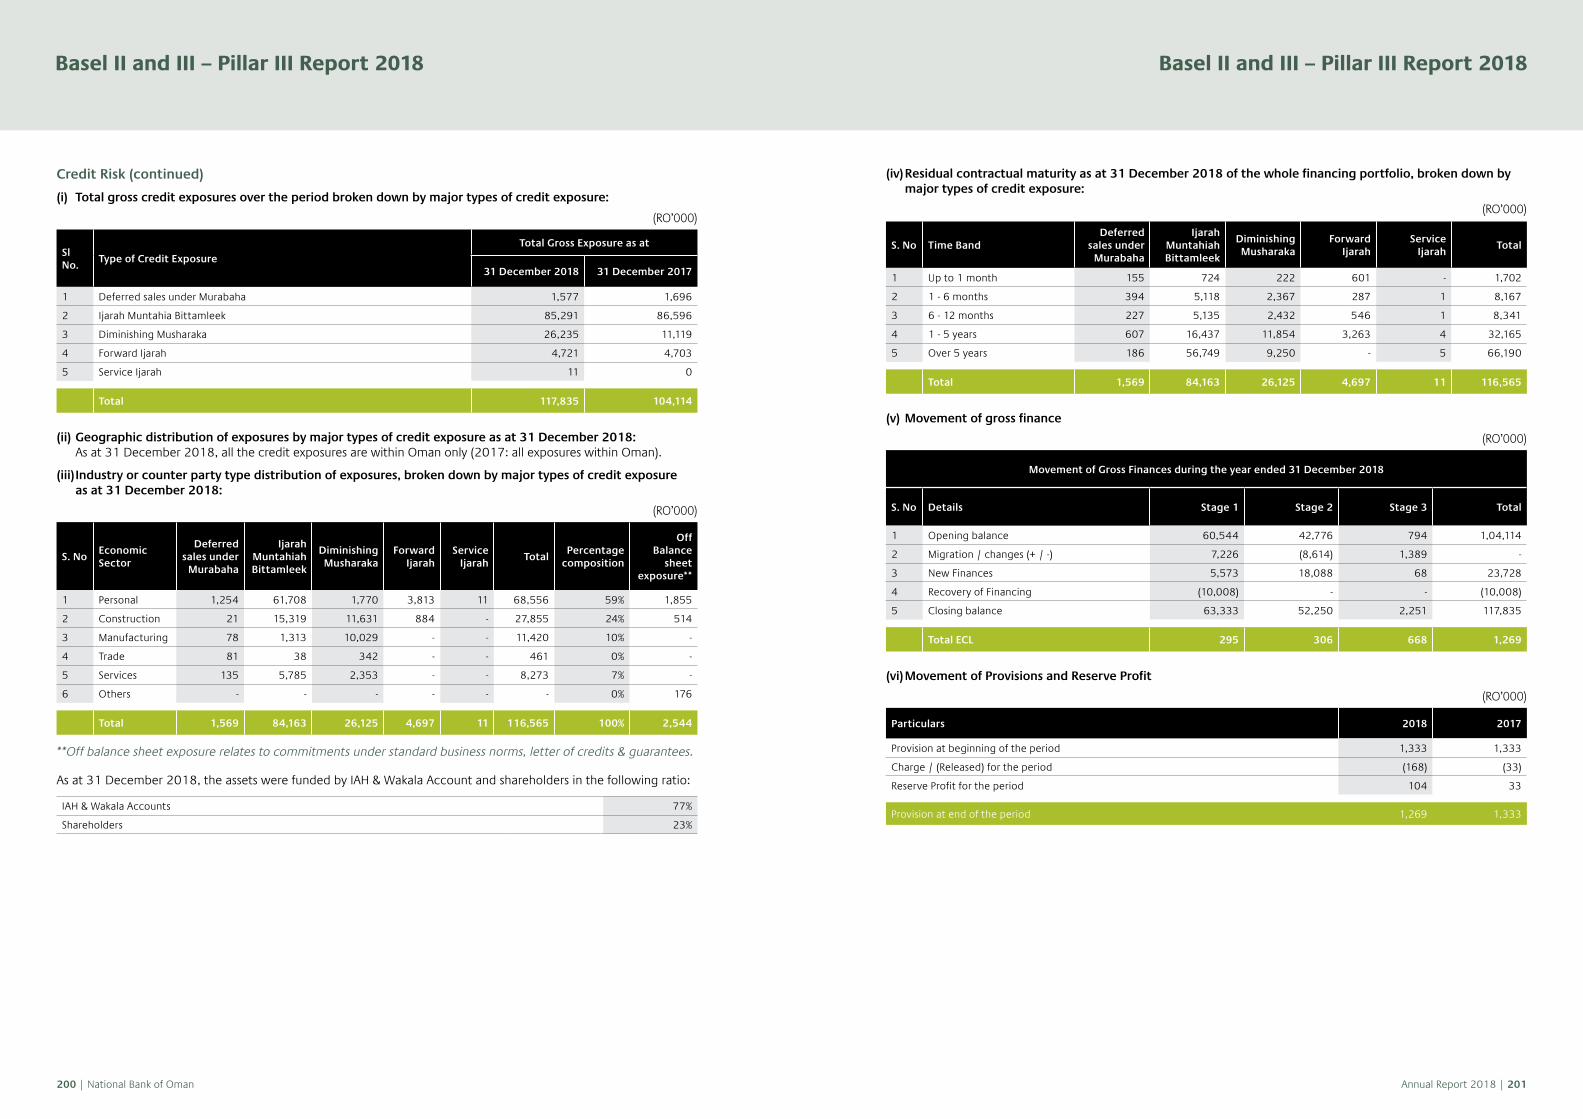
Basel II and III – Pillar III Report 2018 Basel II and III – Pillar III Report 2018
Credit Risk (continued)
(i) Total gross credit exposures over the period broken down by major types of credit exposure:
(ii) Geographic distribution of exposures by major types of credit exposure as at 31 December 2018: As at 31 December 2018, all the credit exposures are within Oman only (2017: all exposures within Oman).
(iii) Industry or counter party type distribution of exposures, broken down by major types of credit exposure as at 31 December 2018:
Sl No.
Type of Credit Exposure
Total Gross Exposure as at
31 December 2018 31 December 2017
1 Deferred sales under Murabaha 1,577 1,696
2 Ijarah Muntahia Bittamleek 85,291 86,596
3 Diminishing Musharaka 26,235 11,119
4 Forward Ijarah 4,721 4,703
5 Service Ijarah 11 0
Total 117,835 104,114
(RO’000)
(RO’000)
IAH & Wakala Accounts 77%
Shareholders 23%
S. NoEconomic Sector
Deferred sales under
Murabaha
Ijarah Muntahiah Bittamleek
Diminishing Musharaka
Forward Ijarah
ServiceIjarah
TotalPercentage
composition
Off Balance
sheet exposure**
1 Personal 1,254 61,708 1,770 3,813 11 68,556 59% 1,855
2 Construction 21 15,319 11,631 884 - 27,855 24% 514
3 Manufacturing 78 1,313 10,029 - - 11,420 10% -
4 Trade 81 38 342 - - 461 0% -
5 Services 135 5,785 2,353 - - 8,273 7% -
6 Others - - - - - - 0% 176
Total 1,569 84,163 26,125 4,697 11 116,565 100% 2,544
**Off balance sheet exposure relates to commitments under standard business norms, letter of credits & guarantees.
As at 31 December 2018, the assets were funded by IAH & Wakala Account and shareholders in the following ratio:
(iv) Residual contractual maturity as at 31 December 2018 of the whole financing portfolio, broken down by major types of credit exposure:
(v) Movement of gross finance
(vi) Movement of Provisions and Reserve Profit
(RO’000)
(RO’000)
(RO’000)
S. No Time BandDeferred
sales under Murabaha
Ijarah Muntahiah Bittamleek
Diminishing Musharaka
Forward Ijarah
ServiceIjarah
Total
1 Up to 1 month 155 724 222 601 - 1,702
2 1 - 6 months 394 5,118 2,367 287 1 8,167
3 6 - 12 months 227 5,135 2,432 546 1 8,341
4 1 - 5 years 607 16,437 11,854 3,263 4 32,165
5 Over 5 years 186 56,749 9,250 - 5 66,190
Total 1,569 84,163 26,125 4,697 11 116,565
Movement of Gross Finances during the year ended 31 December 2018
S. No Details Stage 1 Stage 2 Stage 3 Total
1 Opening balance 60,544 42,776 794 1,04,114
2 Migration / changes (+ / -) 7,226 (8,614) 1,389 -
3 New Finances 5,573 18,088 68 23,728
4 Recovery of Financing (10,008) - - (10,008)
5 Closing balance 63,333 52,250 2,251 117,835
Total ECL 295 306 668 1,269
Particulars 2018 2017
Provision at beginning of the period 1,333 1,333
Charge / (Released) for the period (168) (33)
Reserve Profit for the period 104 33
Provision at end of the period 1,269 1,333
200 | National Bank of Oman Annual Report 2018 | 201
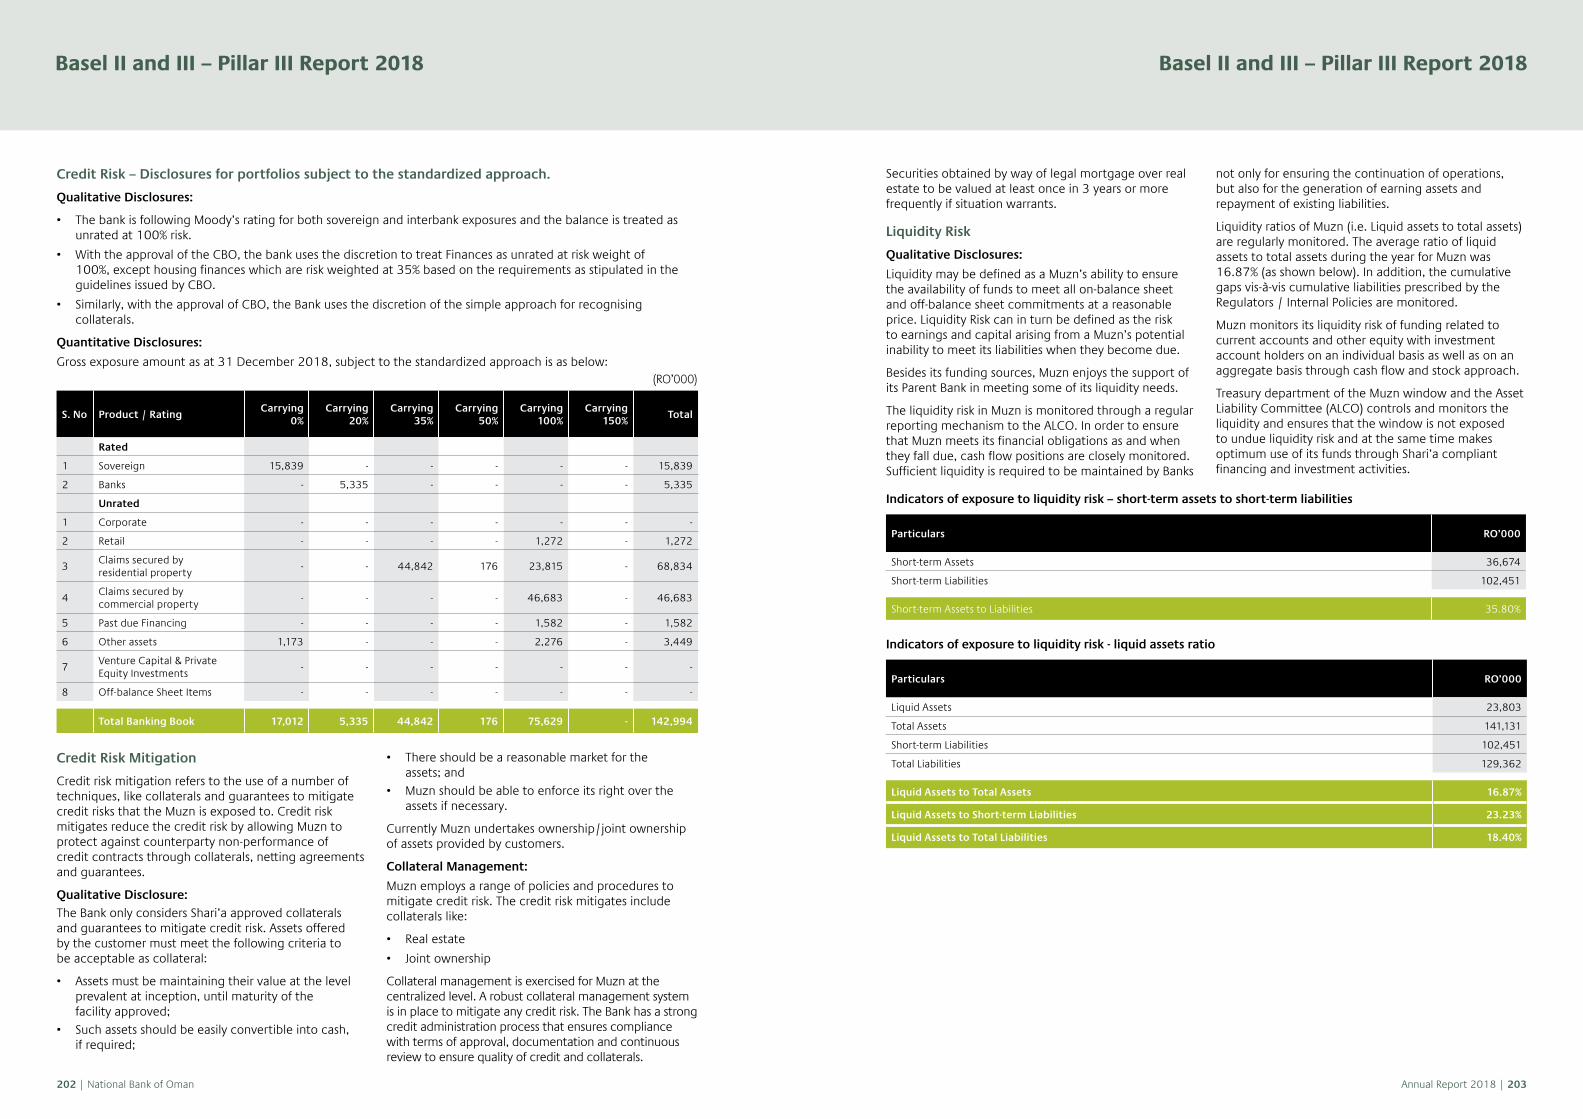
Basel II and III – Pillar III Report 2018 Basel II and III – Pillar III Report 2018
Credit Risk – Disclosures for portfolios subject to the standardized approach.
Qualitative Disclosures:
• The bank is following Moody’s rating for both sovereign and interbank exposures and the balance is treated as unrated at 100% risk.
• With the approval of the CBO, the bank uses the discretion to treat Finances as unrated at risk weight of 100%, except housing finances which are risk weighted at 35% based on the requirements as stipulated in the guidelines issued by CBO.
• Similarly, with the approval of CBO, the Bank uses the discretion of the simple approach for recognising collaterals.
Quantitative Disclosures:
Gross exposure amount as at 31 December 2018, subject to the standardized approach is as below:
Credit Risk Mitigation
Credit risk mitigation refers to the use of a number of techniques, like collaterals and guarantees to mitigate credit risks that the Muzn is exposed to. Credit risk mitigates reduce the credit risk by allowing Muzn to protect against counterparty non-performance of credit contracts through collaterals, netting agreements and guarantees.
Qualitative Disclosure:The Bank only considers Shari’a approved collaterals and guarantees to mitigate credit risk. Assets offered by the customer must meet the following criteria to be acceptable as collateral:
• Assets must be maintaining their value at the level prevalent at inception, until maturity of the facility approved;
• Such assets should be easily convertible into cash, if required;
• There should be a reasonable market for the assets; and
• Muzn should be able to enforce its right over the assets if necessary.
Currently Muzn undertakes ownership/joint ownership of assets provided by customers.
Collateral Management:
Muzn employs a range of policies and procedures to mitigate credit risk. The credit risk mitigates include collaterals like:
• Real estate
• Joint ownership
Collateral management is exercised for Muzn at the centralized level. A robust collateral management system is in place to mitigate any credit risk. The Bank has a strong credit administration process that ensures compliance with terms of approval, documentation and continuous review to ensure quality of credit and collaterals.
(RO’000)
S. No Product / RatingCarrying
0%Carrying
20%Carrying
35%Carrying
50%Carrying
100%Carrying
150%Total
Rated
1 Sovereign 15,839 - - - - - 15,839
2 Banks - 5,335 - - - - 5,335
Unrated
1 Corporate - - - - - - -
2 Retail - - - - 1,272 - 1,272
3Claims secured by residential property
- - 44,842 176 23,815 - 68,834
4Claims secured by commercial property
- - - - 46,683 - 46,683
5 Past due Financing - - - - 1,582 - 1,582
6 Other assets 1,173 - - - 2,276 - 3,449
7Venture Capital & Private Equity Investments
- - - - - - -
8 Off-balance Sheet Items - - - - - - -
Total Banking Book 17,012 5,335 44,842 176 75,629 - 142,994
Securities obtained by way of legal mortgage over real estate to be valued at least once in 3 years or more frequently if situation warrants.
Liquidity Risk
Qualitative Disclosures:
Liquidity may be defined as a Muzn’s ability to ensure the availability of funds to meet all on-balance sheet and off-balance sheet commitments at a reasonable price. Liquidity Risk can in turn be defined as the risk to earnings and capital arising from a Muzn’s potential inability to meet its liabilities when they become due.
Besides its funding sources, Muzn enjoys the support of its Parent Bank in meeting some of its liquidity needs.
The liquidity risk in Muzn is monitored through a regular reporting mechanism to the ALCO. In order to ensure that Muzn meets its financial obligations as and when they fall due, cash flow positions are closely monitored. Sufficient liquidity is required to be maintained by Banks
not only for ensuring the continuation of operations, but also for the generation of earning assets and repayment of existing liabilities.
Liquidity ratios of Muzn (i.e. Liquid assets to total assets) are regularly monitored. The average ratio of liquid assets to total assets during the year for Muzn was 16.87% (as shown below). In addition, the cumulative gaps vis-à-vis cumulative liabilities prescribed by the Regulators / Internal Policies are monitored.
Muzn monitors its liquidity risk of funding related to current accounts and other equity with investment account holders on an individual basis as well as on an aggregate basis through cash flow and stock approach.
Treasury department of the Muzn window and the Asset Liability Committee (ALCO) controls and monitors the liquidity and ensures that the window is not exposed to undue liquidity risk and at the same time makes optimum use of its funds through Shari’a compliant financing and investment activities.
Indicators of exposure to liquidity risk – short-term assets to short-term liabilities
Indicators of exposure to liquidity risk - liquid assets ratio
Particulars RO’000
Short-term Assets 36,674
Short-term Liabilities 102,451
Short-term Assets to Liabilities 35.80%
Particulars RO’000
Liquid Assets 23,803
Total Assets 141,131
Short-term Liabilities 102,451
Total Liabilities 129,362
Liquid Assets to Total Assets 16.87%
Liquid Assets to Short-term Liabilities 23.23%
Liquid Assets to Total Liabilities 18.40%
202 | National Bank of Oman Annual Report 2018 | 203
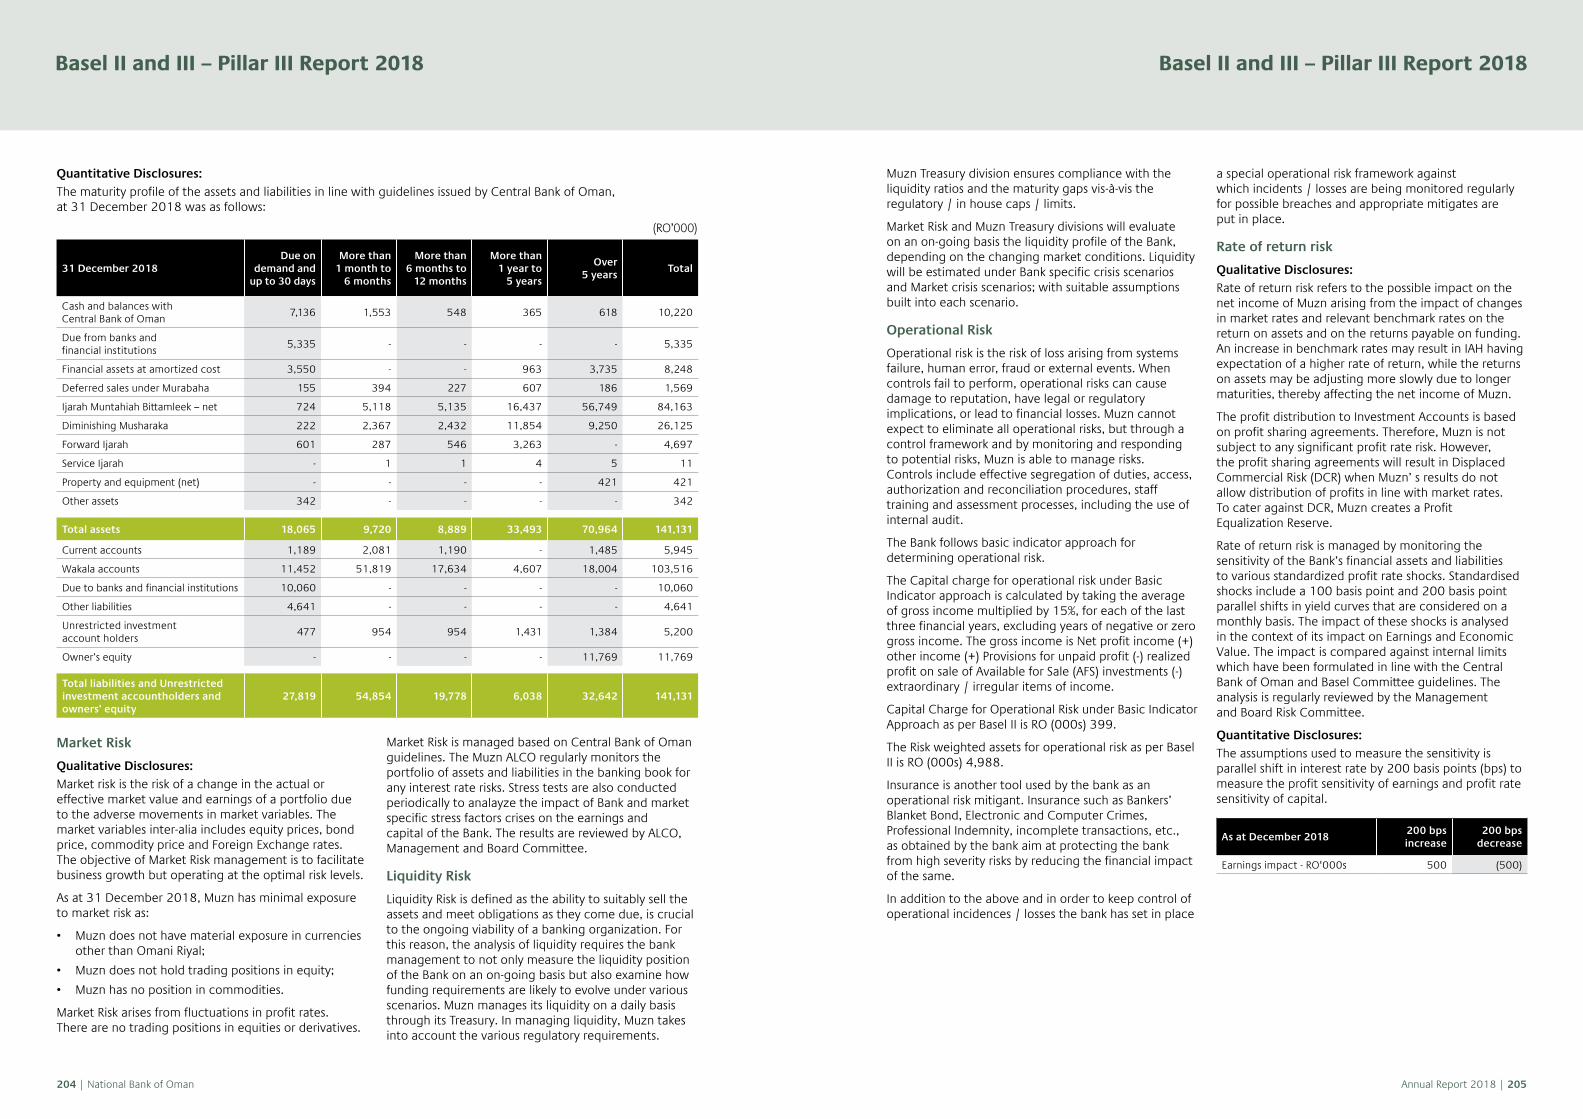
Basel II and III – Pillar III Report 2018 Basel II and III – Pillar III Report 2018
Quantitative Disclosures:The maturity profile of the assets and liabilities in line with guidelines issued by Central Bank of Oman, at 31 December 2018 was as follows:
Market Risk
Qualitative Disclosures:Market risk is the risk of a change in the actual or effective market value and earnings of a portfolio due to the adverse movements in market variables. The market variables inter-alia includes equity prices, bond price, commodity price and Foreign Exchange rates. The objective of Market Risk management is to facilitate business growth but operating at the optimal risk levels.
As at 31 December 2018, Muzn has minimal exposure to market risk as:
• Muzn does not have material exposure in currencies other than Omani Riyal;
• Muzn does not hold trading positions in equity;
• Muzn has no position in commodities.
Market Risk arises from fluctuations in profit rates. There are no trading positions in equities or derivatives.
Market Risk is managed based on Central Bank of Oman guidelines. The Muzn ALCO regularly monitors the portfolio of assets and liabilities in the banking book for any interest rate risks. Stress tests are also conducted periodically to analayze the impact of Bank and market specific stress factors crises on the earnings and capital of the Bank. The results are reviewed by ALCO, Management and Board Committee.
Liquidity Risk
Liquidity Risk is defined as the ability to suitably sell the assets and meet obligations as they come due, is crucial to the ongoing viability of a banking organization. For this reason, the analysis of liquidity requires the bank management to not only measure the liquidity position of the Bank on an on-going basis but also examine how funding requirements are likely to evolve under various scenarios. Muzn manages its liquidity on a daily basis through its Treasury. In managing liquidity, Muzn takes into account the various regulatory requirements.
31 December 2018Due on
demand and up to 30 days
More than 1 month to
6 months
More than 6 months to
12 months
More than1 year to
5 years
Over5 years
Total
Cash and balances with Central Bank of Oman
7,136 1,553 548 365 618 10,220
Due from banks and financial institutions
5,335 - - - - 5,335
Financial assets at amortized cost 3,550 - - 963 3,735 8,248
Deferred sales under Murabaha 155 394 227 607 186 1,569
Ijarah Muntahiah Bittamleek – net 724 5,118 5,135 16,437 56,749 84,163
Diminishing Musharaka 222 2,367 2,432 11,854 9,250 26,125
Forward Ijarah 601 287 546 3,263 - 4,697
Service Ijarah - 1 1 4 5 11
Property and equipment (net) - - - - 421 421
Other assets 342 - - - - 342
Total assets 18,065 9,720 8,889 33,493 70,964 141,131
Current accounts 1,189 2,081 1,190 - 1,485 5,945
Wakala accounts 11,452 51,819 17,634 4,607 18,004 103,516
Due to banks and financial institutions 10,060 - - - - 10,060
Other liabilities 4,641 - - - - 4,641
Unrestricted investment account holders
477 954 954 1,431 1,384 5,200
Owner’s equity - - - - 11,769 11,769
Total liabilities and Unrestricted investment accountholders and owners’ equity
27,819 54,854 19,778 6,038 32,642 141,131
(RO’000)
Muzn Treasury division ensures compliance with the liquidity ratios and the maturity gaps vis-à-vis the regulatory / in house caps / limits.
Market Risk and Muzn Treasury divisions will evaluate on an on-going basis the liquidity profile of the Bank, depending on the changing market conditions. Liquidity will be estimated under Bank specific crisis scenarios and Market crisis scenarios; with suitable assumptions built into each scenario.
Operational Risk
Operational risk is the risk of loss arising from systems failure, human error, fraud or external events. When controls fail to perform, operational risks can cause damage to reputation, have legal or regulatory implications, or lead to financial losses. Muzn cannot expect to eliminate all operational risks, but through a control framework and by monitoring and responding to potential risks, Muzn is able to manage risks. Controls include effective segregation of duties, access, authorization and reconciliation procedures, staff training and assessment processes, including the use of internal audit.
The Bank follows basic indicator approach for determining operational risk.
The Capital charge for operational risk under Basic Indicator approach is calculated by taking the average of gross income multiplied by 15%, for each of the last three financial years, excluding years of negative or zero gross income. The gross income is Net profit income (+) other income (+) Provisions for unpaid profit (-) realized profit on sale of Available for Sale (AFS) investments (-) extraordinary / irregular items of income.
Capital Charge for Operational Risk under Basic Indicator Approach as per Basel II is RO (000s) 399.
The Risk weighted assets for operational risk as per Basel II is RO (000s) 4,988.
Insurance is another tool used by the bank as an operational risk mitigant. Insurance such as Bankers’ Blanket Bond, Electronic and Computer Crimes, Professional Indemnity, incomplete transactions, etc., as obtained by the bank aim at protecting the bank from high severity risks by reducing the financial impact of the same.
In addition to the above and in order to keep control of operational incidences / losses the bank has set in place
a special operational risk framework against which incidents / losses are being monitored regularly for possible breaches and appropriate mitigates are put in place.
Rate of return risk
Qualitative Disclosures:Rate of return risk refers to the possible impact on the net income of Muzn arising from the impact of changes in market rates and relevant benchmark rates on the return on assets and on the returns payable on funding. An increase in benchmark rates may result in IAH having expectation of a higher rate of return, while the returns on assets may be adjusting more slowly due to longer maturities, thereby affecting the net income of Muzn.
The profit distribution to Investment Accounts is based on profit sharing agreements. Therefore, Muzn is not subject to any significant profit rate risk. However, the profit sharing agreements will result in Displaced Commercial Risk (DCR) when Muzn’ s results do not allow distribution of profits in line with market rates. To cater against DCR, Muzn creates a Profit Equalization Reserve.
Rate of return risk is managed by monitoring the sensitivity of the Bank’s financial assets and liabilities to various standardized profit rate shocks. Standardised shocks include a 100 basis point and 200 basis point parallel shifts in yield curves that are considered on a monthly basis. The impact of these shocks is analysed in the context of its impact on Earnings and Economic Value. The impact is compared against internal limits which have been formulated in line with the Central Bank of Oman and Basel Committee guidelines. The analysis is regularly reviewed by the Management and Board Risk Committee.
Quantitative Disclosures:The assumptions used to measure the sensitivity is parallel shift in interest rate by 200 basis points (bps) to measure the profit sensitivity of earnings and profit rate sensitivity of capital.
As at December 2018200 bps increase
200 bps decrease
Earnings impact - RO'000s 500 (500)
204 | National Bank of Oman Annual Report 2018 | 205
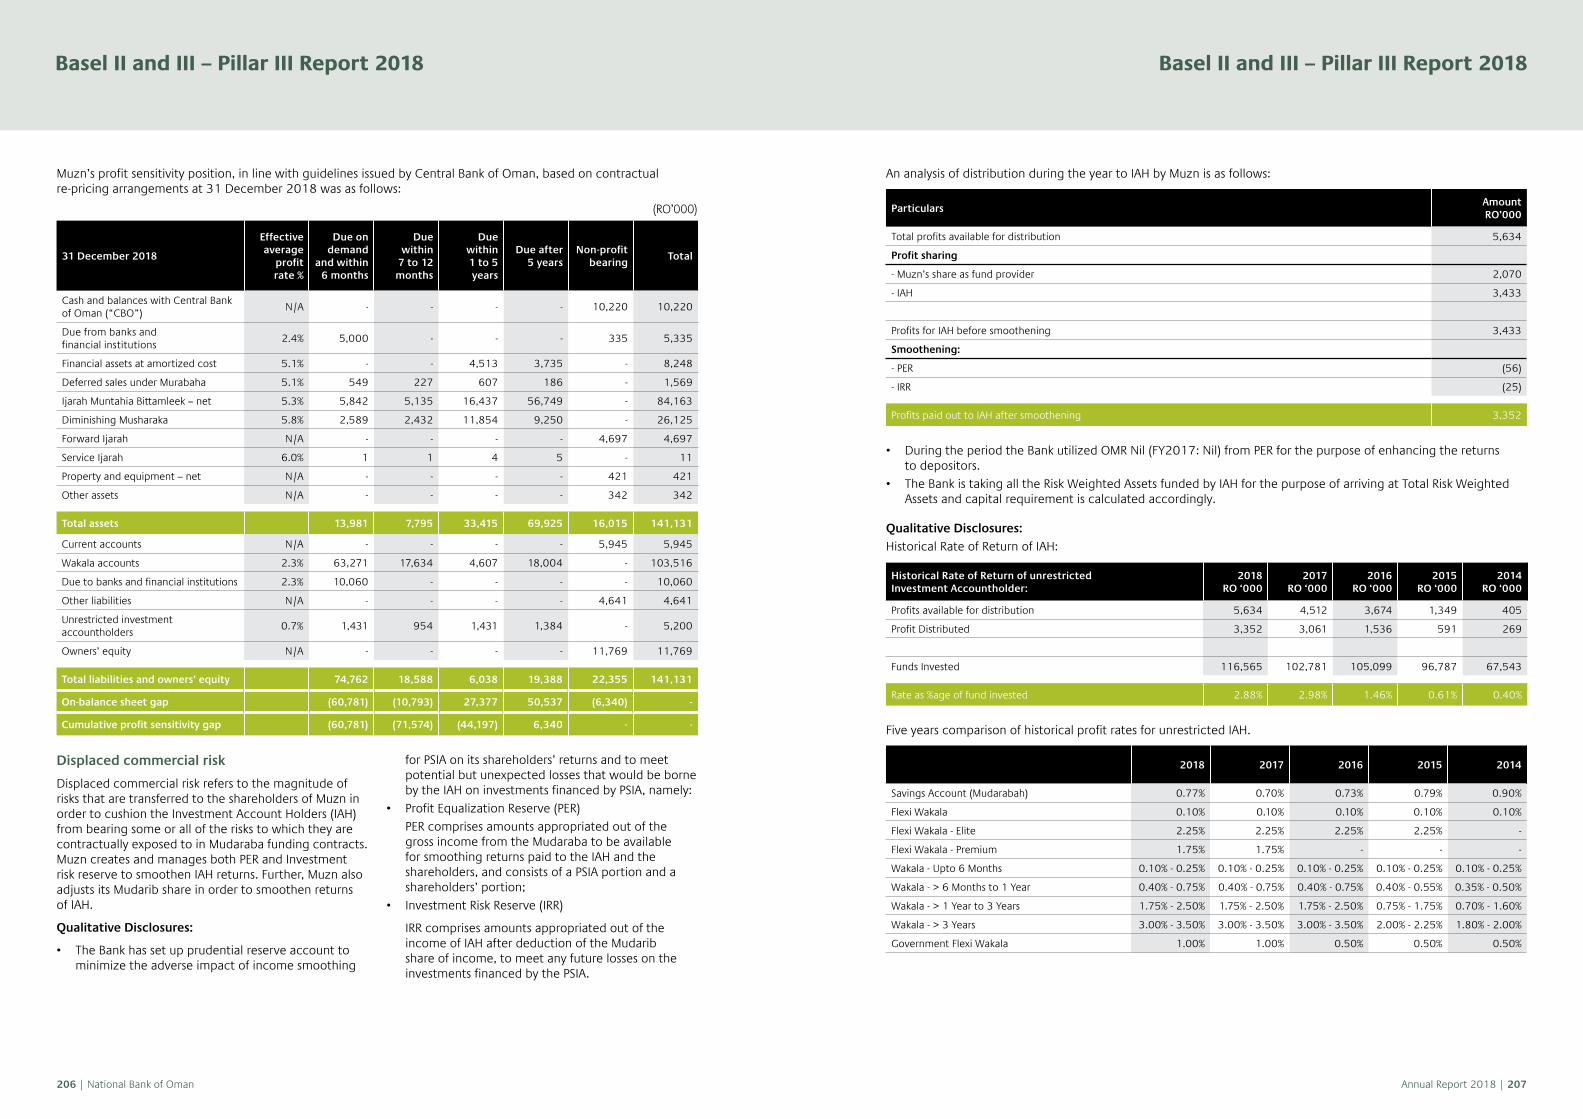
Basel II and III – Pillar III Report 2018 Basel II and III – Pillar III Report 2018
Muzn’s profit sensitivity position, in line with guidelines issued by Central Bank of Oman, based on contractual re-pricing arrangements at 31 December 2018 was as follows:
(RO’000)
31 December 2018
Effectiveaverage
profit rate %
Due on demand
and within 6 months
Due within
7 to 12 months
Due within 1 to 5 years
Due after 5 years
Non-profit bearing
Total
Cash and balances with Central Bank of Oman (“CBO”)
N/A - - - - 10,220 10,220
Due from banks and financial institutions
2.4% 5,000 - - - 335 5,335
Financial assets at amortized cost 5.1% - - 4,513 3,735 - 8,248
Deferred sales under Murabaha 5.1% 549 227 607 186 - 1,569
Ijarah Muntahia Bittamleek – net 5.3% 5,842 5,135 16,437 56,749 - 84,163
Diminishing Musharaka 5.8% 2,589 2,432 11,854 9,250 - 26,125
Forward Ijarah N/A - - - - 4,697 4,697
Service Ijarah 6.0% 1 1 4 5 - 11
Property and equipment – net N/A - - - - 421 421
Other assets N/A - - - - 342 342
Total assets 13,981 7,795 33,415 69,925 16,015 141,131
Current accounts N/A - - - - 5,945 5,945
Wakala accounts 2.3% 63,271 17,634 4,607 18,004 - 103,516
Due to banks and financial institutions 2.3% 10,060 - - - - 10,060
Other liabilities N/A - - - - 4,641 4,641
Unrestricted investment accountholders
0.7% 1,431 954 1,431 1,384 - 5,200
Owners’ equity N/A - - - - 11,769 11,769
Total liabilities and owners’ equity 74,762 18,588 6,038 19,388 22,355 141,131
On-balance sheet gap (60,781) (10,793) 27,377 50,537 (6,340) -
Cumulative profit sensitivity gap (60,781) (71,574) (44,197) 6,340 - -
Displaced commercial risk
Displaced commercial risk refers to the magnitude of risks that are transferred to the shareholders of Muzn in order to cushion the Investment Account Holders (IAH) from bearing some or all of the risks to which they are contractually exposed to in Mudaraba funding contracts. Muzn creates and manages both PER and Investment risk reserve to smoothen IAH returns. Further, Muzn also adjusts its Mudarib share in order to smoothen returns of IAH.
Qualitative Disclosures:
• The Bank has set up prudential reserve account to minimize the adverse impact of income smoothing
for PSIA on its shareholders’ returns and to meet potential but unexpected losses that would be borne by the IAH on investments financed by PSIA, namely:
• Profit Equalization Reserve (PER) PER comprises amounts appropriated out of the
gross income from the Mudaraba to be available for smoothing returns paid to the IAH and the shareholders, and consists of a PSIA portion and a shareholders’ portion;
• Investment Risk Reserve (IRR)
IRR comprises amounts appropriated out of the income of IAH after deduction of the Mudarib share of income, to meet any future losses on the investments financed by the PSIA.
• During the period the Bank utilized OMR Nil (FY2017: Nil) from PER for the purpose of enhancing the returns to depositors.
• The Bank is taking all the Risk Weighted Assets funded by IAH for the purpose of arriving at Total Risk Weighted Assets and capital requirement is calculated accordingly.
ParticularsAmount RO’000
Total profits available for distribution 5,634
Profit sharing
- Muzn’s share as fund provider 2,070
- IAH 3,433
Profits for IAH before smoothening 3,433
Smoothening:
- PER (56)
- IRR (25)
Profits paid out to IAH after smoothening 3,352
Qualitative Disclosures:Historical Rate of Return of IAH:
Five years comparison of historical profit rates for unrestricted IAH.
Historical Rate of Return of unrestricted Investment Accountholder:
2018 RO ‘000
2017 RO ‘000
2016 RO ‘000
2015 RO ‘000
2014 RO ‘000
Profits available for distribution 5,634 4,512 3,674 1,349 405
Profit Distributed 3,352 3,061 1,536 591 269
Funds Invested 116,565 102,781 105,099 96,787 67,543
Rate as %age of fund invested 2.88% 2.98% 1.46% 0.61% 0.40%
2018 2017 2016 2015 2014
Savings Account (Mudarabah) 0.77% 0.70% 0.73% 0.79% 0.90%
Flexi Wakala 0.10% 0.10% 0.10% 0.10% 0.10%
Flexi Wakala - Elite 2.25% 2.25% 2.25% 2.25% -
Flexi Wakala - Premium 1.75% 1.75% - - -
Wakala - Upto 6 Months 0.10% - 0.25% 0.10% - 0.25% 0.10% - 0.25% 0.10% - 0.25% 0.10% - 0.25%
Wakala - > 6 Months to 1 Year 0.40% - 0.75% 0.40% - 0.75% 0.40% - 0.75% 0.40% - 0.55% 0.35% - 0.50%
Wakala - > 1 Year to 3 Years 1.75% - 2.50% 1.75% - 2.50% 1.75% - 2.50% 0.75% - 1.75% 0.70% - 1.60%
Wakala - > 3 Years 3.00% - 3.50% 3.00% - 3.50% 3.00% - 3.50% 2.00% - 2.25% 1.80% - 2.00%
Government Flexi Wakala 1.00% 1.00% 0.50% 0.50% 0.50%
An analysis of distribution during the year to IAH by Muzn is as follows:
206 | National Bank of Oman Annual Report 2018 | 207
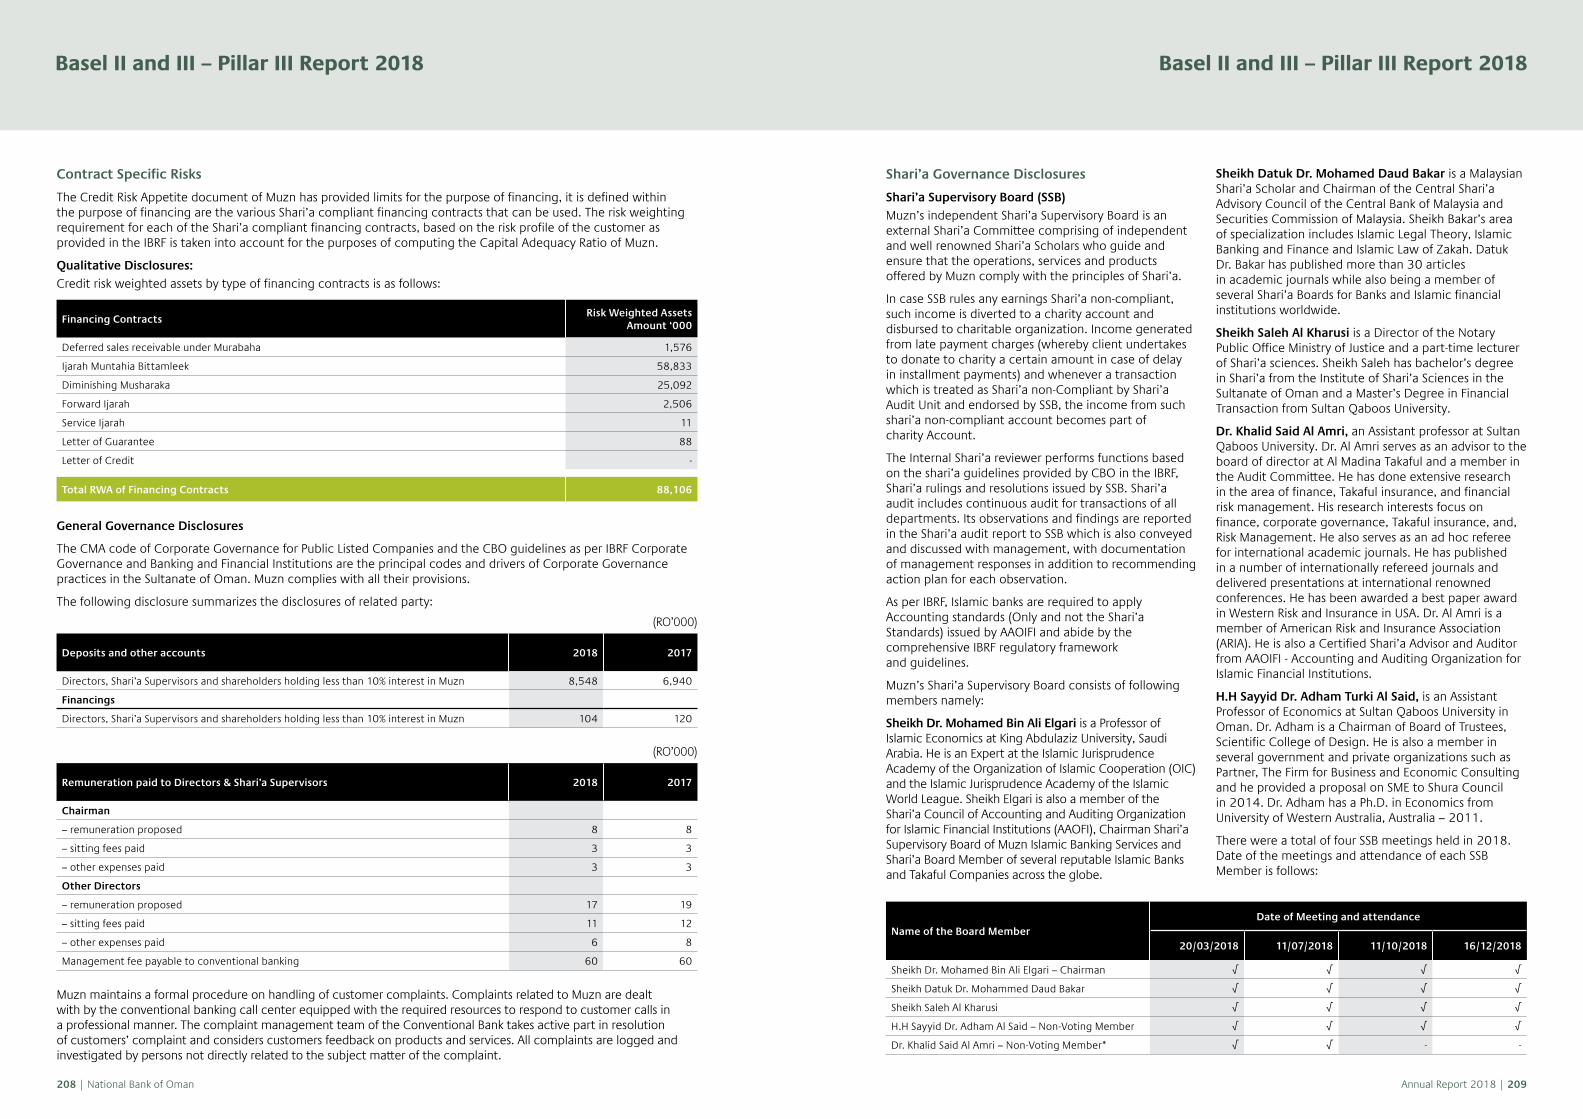
Basel II and III – Pillar III Report 2018 Basel II and III – Pillar III Report 2018
Contract Specific Risks
The Credit Risk Appetite document of Muzn has provided limits for the purpose of financing, it is defined within the purpose of financing are the various Shari’a compliant financing contracts that can be used. The risk weighting requirement for each of the Shari’a compliant financing contracts, based on the risk profile of the customer as provided in the IBRF is taken into account for the purposes of computing the Capital Adequacy Ratio of Muzn.
Qualitative Disclosures:Credit risk weighted assets by type of financing contracts is as follows:
General Governance Disclosures
The CMA code of Corporate Governance for Public Listed Companies and the CBO guidelines as per IBRF Corporate Governance and Banking and Financial Institutions are the principal codes and drivers of Corporate Governance practices in the Sultanate of Oman. Muzn complies with all their provisions.
The following disclosure summarizes the disclosures of related party:
Financing ContractsRisk Weighted Assets
Amount ‘000
Deferred sales receivable under Murabaha 1,576
Ijarah Muntahia Bittamleek 58,833
Diminishing Musharaka 25,092
Forward Ijarah 2,506
Service Ijarah 11
Letter of Guarantee 88
Letter of Credit -
Total RWA of Financing Contracts 88,106
Deposits and other accounts 2018 2017
Directors, Shari’a Supervisors and shareholders holding less than 10% interest in Muzn 8,548 6,940
Financings
Directors, Shari’a Supervisors and shareholders holding less than 10% interest in Muzn 104 120
Remuneration paid to Directors & Shari’a Supervisors 2018 2017
Chairman
– remuneration proposed 8 8
– sitting fees paid 3 3
– other expenses paid 3 3
Other Directors
– remuneration proposed 17 19
– sitting fees paid 11 12
– other expenses paid 6 8
Management fee payable to conventional banking 60 60
(RO’000)
(RO’000)
Muzn maintains a formal procedure on handling of customer complaints. Complaints related to Muzn are dealt with by the conventional banking call center equipped with the required resources to respond to customer calls in a professional manner. The complaint management team of the Conventional Bank takes active part in resolution of customers’ complaint and considers customers feedback on products and services. All complaints are logged and investigated by persons not directly related to the subject matter of the complaint.
Shari’a Governance Disclosures
Shari’a Supervisory Board (SSB)Muzn’s independent Shari’a Supervisory Board is an external Shari’a Committee comprising of independent and well renowned Shari’a Scholars who guide and ensure that the operations, services and products offered by Muzn comply with the principles of Shari’a.
In case SSB rules any earnings Shari’a non-compliant, such income is diverted to a charity account and disbursed to charitable organization. Income generated from late payment charges (whereby client undertakes to donate to charity a certain amount in case of delay in installment payments) and whenever a transaction which is treated as Shari’a non-Compliant by Shari’a Audit Unit and endorsed by SSB, the income from such shari’a non-compliant account becomes part of charity Account.
The Internal Shari’a reviewer performs functions based on the shari’a guidelines provided by CBO in the IBRF, Shari’a rulings and resolutions issued by SSB. Shari’a audit includes continuous audit for transactions of all departments. Its observations and findings are reported in the Shari’a audit report to SSB which is also conveyed and discussed with management, with documentation of management responses in addition to recommending action plan for each observation.
As per IBRF, Islamic banks are required to apply Accounting standards (Only and not the Shari’a Standards) issued by AAOIFI and abide by the comprehensive IBRF regulatory framework and guidelines.
Muzn’s Shari’a Supervisory Board consists of following members namely:
Sheikh Dr. Mohamed Bin Ali Elgari is a Professor of Islamic Economics at King Abdulaziz University, Saudi Arabia. He is an Expert at the Islamic Jurisprudence Academy of the Organization of Islamic Cooperation (OIC) and the Islamic Jurisprudence Academy of the Islamic World League. Sheikh Elgari is also a member of the Shari’a Council of Accounting and Auditing Organization for Islamic Financial Institutions (AAOFI), Chairman Shari’a Supervisory Board of Muzn Islamic Banking Services and Shari’a Board Member of several reputable Islamic Banks and Takaful Companies across the globe.
Sheikh Datuk Dr. Mohamed Daud Bakar is a Malaysian Shari’a Scholar and Chairman of the Central Shari’a Advisory Council of the Central Bank of Malaysia and Securities Commission of Malaysia. Sheikh Bakar’s area of specialization includes Islamic Legal Theory, Islamic Banking and Finance and Islamic Law of Zakah. Datuk Dr. Bakar has published more than 30 articles in academic journals while also being a member of several Shari’a Boards for Banks and Islamic financial institutions worldwide.
Sheikh Saleh Al Kharusi is a Director of the Notary Public Office Ministry of Justice and a part-time lecturer of Shari’a sciences. Sheikh Saleh has bachelor’s degree in Shari’a from the Institute of Shari’a Sciences in the Sultanate of Oman and a Master’s Degree in Financial Transaction from Sultan Qaboos University.
Dr. Khalid Said Al Amri, an Assistant professor at Sultan Qaboos University. Dr. Al Amri serves as an advisor to the board of director at Al Madina Takaful and a member in the Audit Committee. He has done extensive research in the area of finance, Takaful insurance, and financial risk management. His research interests focus on finance, corporate governance, Takaful insurance, and, Risk Management. He also serves as an ad hoc referee for international academic journals. He has published in a number of internationally refereed journals and delivered presentations at international renowned conferences. He has been awarded a best paper award in Western Risk and Insurance in USA. Dr. Al Amri is a member of American Risk and Insurance Association (ARIA). He is also a Certified Shari’a Advisor and Auditor from AAOIFI - Accounting and Auditing Organization for Islamic Financial Institutions.
H.H Sayyid Dr. Adham Turki Al Said, is an Assistant Professor of Economics at Sultan Qaboos University in Oman. Dr. Adham is a Chairman of Board of Trustees, Scientific College of Design. He is also a member in several government and private organizations such as Partner, The Firm for Business and Economic Consulting and he provided a proposal on SME to Shura Council in 2014. Dr. Adham has a Ph.D. in Economics from University of Western Australia, Australia – 2011.
There were a total of four SSB meetings held in 2018. Date of the meetings and attendance of each SSB Member is follows:
Name of the Board MemberDate of Meeting and attendance
20/03/2018 11/07/2018 11/10/2018 16/12/2018
Sheikh Dr. Mohamed Bin Ali Elgari – Chairman √ √ √ √
Sheikh Datuk Dr. Mohammed Daud Bakar √ √ √ √
Sheikh Saleh Al Kharusi √ √ √ √
H.H Sayyid Dr. Adham Al Said – Non-Voting Member √ √ √ √
Dr. Khalid Said Al Amri – Non-Voting Member* √ √ - -
208 | National Bank of Oman Annual Report 2018 | 209
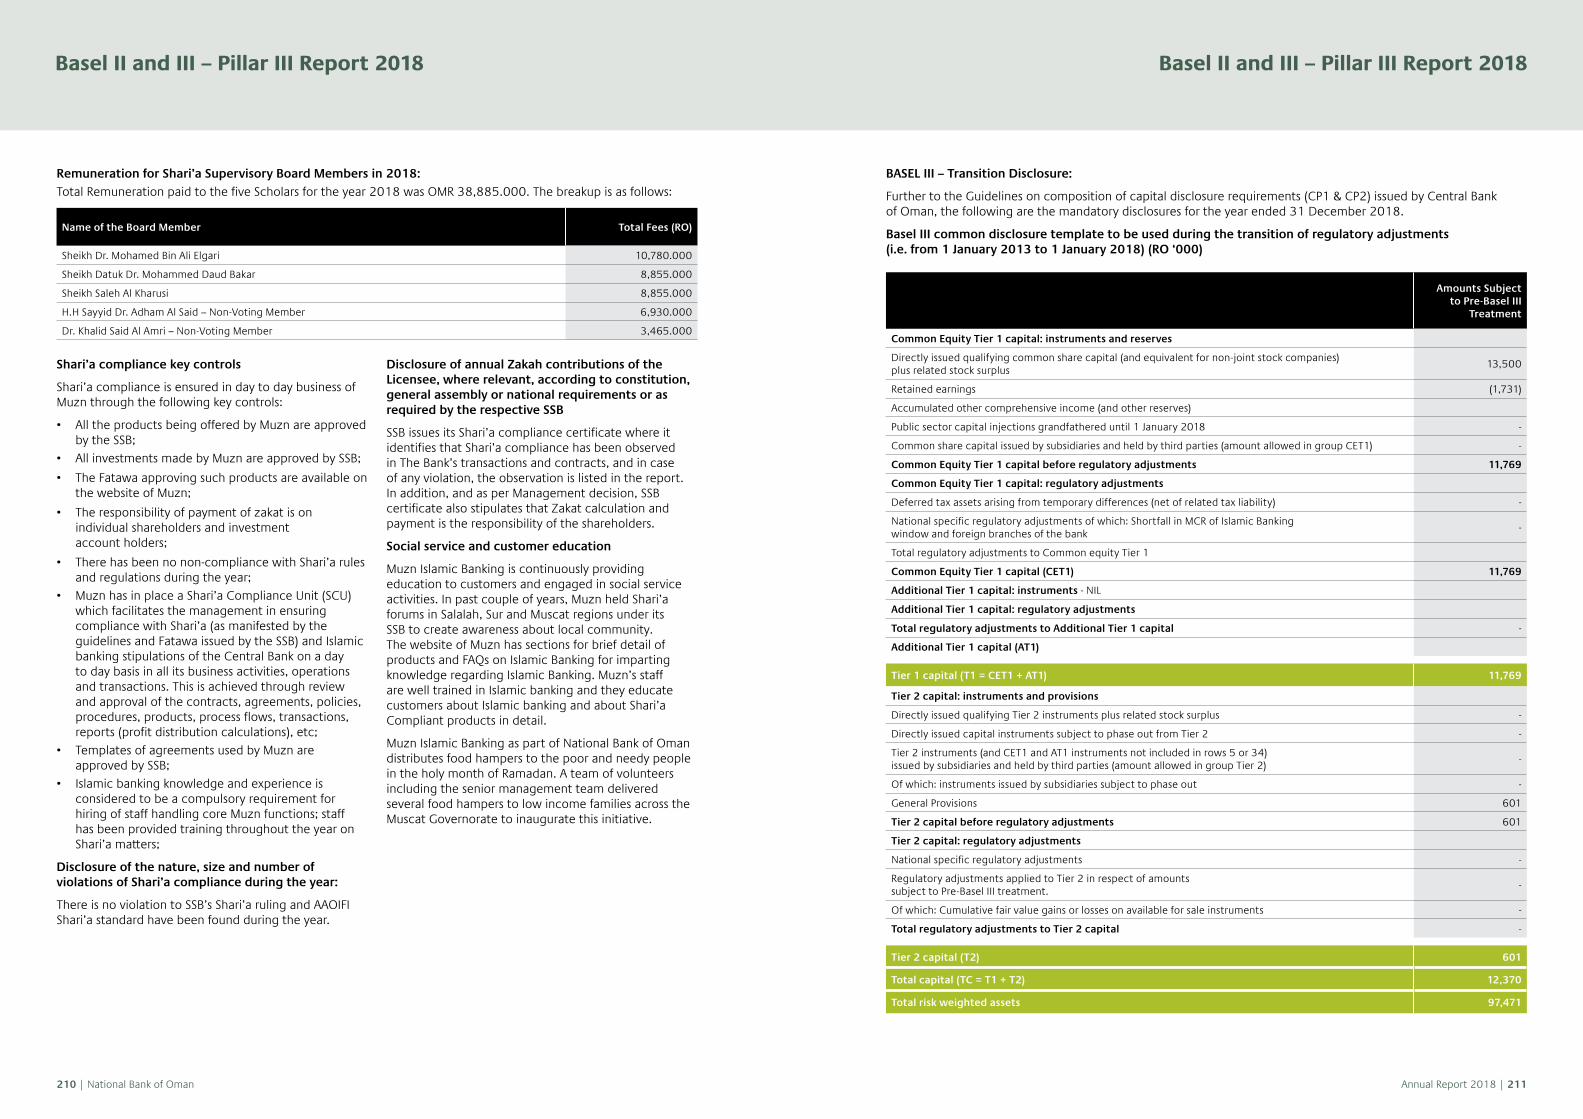
Basel II and III – Pillar III Report 2018 Basel II and III – Pillar III Report 2018
Remuneration for Shari’a Supervisory Board Members in 2018:Total Remuneration paid to the five Scholars for the year 2018 was OMR 38,885.000. The breakup is as follows:
Shari’a compliance key controls
Shari’a compliance is ensured in day to day business of Muzn through the following key controls:
• All the products being offered by Muzn are approved by the SSB;
• All investments made by Muzn are approved by SSB;
• The Fatawa approving such products are available on the website of Muzn;
• The responsibility of payment of zakat is on individual shareholders and investment account holders;
• There has been no non-compliance with Shari’a rules and regulations during the year;
• Muzn has in place a Shari’a Compliance Unit (SCU) which facilitates the management in ensuring compliance with Shari’a (as manifested by the guidelines and Fatawa issued by the SSB) and Islamic banking stipulations of the Central Bank on a day to day basis in all its business activities, operations and transactions. This is achieved through review and approval of the contracts, agreements, policies, procedures, products, process flows, transactions, reports (profit distribution calculations), etc;
• Templates of agreements used by Muzn are approved by SSB;
• Islamic banking knowledge and experience is considered to be a compulsory requirement for hiring of staff handling core Muzn functions; staff has been provided training throughout the year on Shari’a matters;
Disclosure of the nature, size and number of violations of Shari’a compliance during the year:
There is no violation to SSB’s Shari’a ruling and AAOIFI Shari’a standard have been found during the year.
Disclosure of annual Zakah contributions of the Licensee, where relevant, according to constitution, general assembly or national requirements or as required by the respective SSB
SSB issues its Shari’a compliance certificate where it identifies that Shari’a compliance has been observed in The Bank’s transactions and contracts, and in case of any violation, the observation is listed in the report. In addition, and as per Management decision, SSB certificate also stipulates that Zakat calculation and payment is the responsibility of the shareholders.
Social service and customer education
Muzn Islamic Banking is continuously providing education to customers and engaged in social service activities. In past couple of years, Muzn held Shari’a forums in Salalah, Sur and Muscat regions under its SSB to create awareness about local community. The website of Muzn has sections for brief detail of products and FAQs on Islamic Banking for imparting knowledge regarding Islamic Banking. Muzn’s staff are well trained in Islamic banking and they educate customers about Islamic banking and about Shari’a Compliant products in detail.
Muzn Islamic Banking as part of National Bank of Oman distributes food hampers to the poor and needy people in the holy month of Ramadan. A team of volunteers including the senior management team delivered several food hampers to low income families across the Muscat Governorate to inaugurate this initiative.
Name of the Board Member Total Fees (RO)
Sheikh Dr. Mohamed Bin Ali Elgari 10,780.000
Sheikh Datuk Dr. Mohammed Daud Bakar 8,855.000
Sheikh Saleh Al Kharusi 8,855.000
H.H Sayyid Dr. Adham Al Said – Non-Voting Member 6,930.000
Dr. Khalid Said Al Amri – Non-Voting Member 3,465.000
BASEL III – Transition Disclosure:
Further to the Guidelines on composition of capital disclosure requirements (CP1 & CP2) issued by Central Bank of Oman, the following are the mandatory disclosures for the year ended 31 December 2018.
Basel III common disclosure template to be used during the transition of regulatory adjustments (i.e. from 1 January 2013 to 1 January 2018) (RO ‘000)
Amounts Subject to Pre-Basel III
Treatment
Common Equity Tier 1 capital: instruments and reserves
Directly issued qualifying common share capital (and equivalent for non-joint stock companies) plus related stock surplus
13,500
Retained earnings (1,731)
Accumulated other comprehensive income (and other reserves)
Public sector capital injections grandfathered until 1 January 2018 -
Common share capital issued by subsidiaries and held by third parties (amount allowed in group CET1) -
Common Equity Tier 1 capital before regulatory adjustments 11,769
Common Equity Tier 1 capital: regulatory adjustments
Deferred tax assets arising from temporary differences (net of related tax liability) -
National specific regulatory adjustments of which: Shortfall in MCR of Islamic Banking window and foreign branches of the bank
-
Total regulatory adjustments to Common equity Tier 1
Common Equity Tier 1 capital (CET1) 11,769
Additional Tier 1 capital: instruments - NIL
Additional Tier 1 capital: regulatory adjustments
Total regulatory adjustments to Additional Tier 1 capital -
Additional Tier 1 capital (AT1)
Tier 1 capital (T1 = CET1 + AT1) 11,769
Tier 2 capital: instruments and provisions
Directly issued qualifying Tier 2 instruments plus related stock surplus -
Directly issued capital instruments subject to phase out from Tier 2 -
Tier 2 instruments (and CET1 and AT1 instruments not included in rows 5 or 34) issued by subsidiaries and held by third parties (amount allowed in group Tier 2)
-
Of which: instruments issued by subsidiaries subject to phase out -
General Provisions 601
Tier 2 capital before regulatory adjustments 601
Tier 2 capital: regulatory adjustments
National specific regulatory adjustments -
Regulatory adjustments applied to Tier 2 in respect of amounts subject to Pre-Basel III treatment.
-
Of which: Cumulative fair value gains or losses on available for sale instruments -
Total regulatory adjustments to Tier 2 capital -
Tier 2 capital (T2) 601
Total capital (TC = T1 + T2) 12,370
Total risk weighted assets 97,471
210 | National Bank of Oman Annual Report 2018 | 211
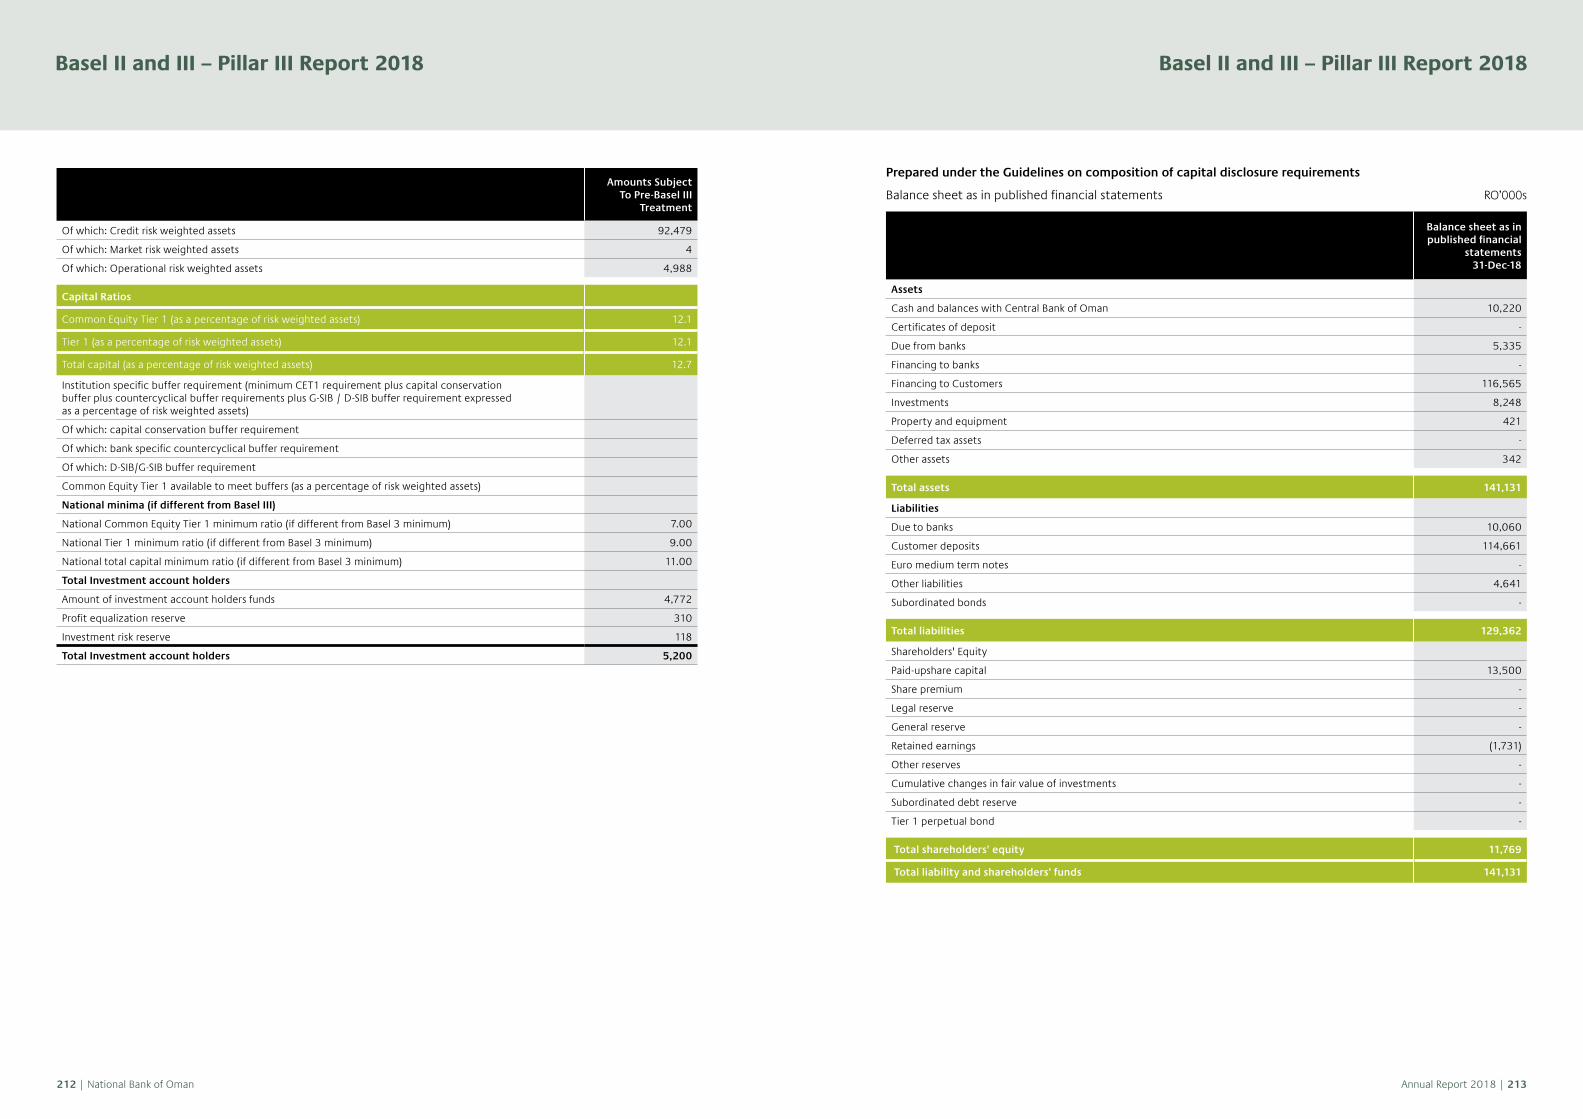
Basel II and III – Pillar III Report 2018 Basel II and III – Pillar III Report 2018
Amounts Subject To Pre-Basel III
Treatment
Of which: Credit risk weighted assets 92,479
Of which: Market risk weighted assets 4
Of which: Operational risk weighted assets 4,988
Capital Ratios
Common Equity Tier 1 (as a percentage of risk weighted assets) 12.1
Tier 1 (as a percentage of risk weighted assets) 12.1
Total capital (as a percentage of risk weighted assets) 12.7
Institution specific buffer requirement (minimum CET1 requirement plus capital conservation buffer plus countercyclical buffer requirements plus G-SIB / D-SIB buffer requirement expressed as a percentage of risk weighted assets)
Of which: capital conservation buffer requirement
Of which: bank specific countercyclical buffer requirement
Of which: D-SIB/G-SIB buffer requirement
Common Equity Tier 1 available to meet buffers (as a percentage of risk weighted assets)
National minima (if different from Basel III)
National Common Equity Tier 1 minimum ratio (if different from Basel 3 minimum) 7.00
National Tier 1 minimum ratio (if different from Basel 3 minimum) 9.00
National total capital minimum ratio (if different from Basel 3 minimum) 11.00
Total Investment account holders
Amount of investment account holders funds 4,772
Profit equalization reserve 310
Investment risk reserve 118
Total Investment account holders 5,200
Prepared under the Guidelines on composition of capital disclosure requirements
Balance sheet as in published financial statements RO’000s
Balance sheet as in published financial
statements 31-Dec-18
Assets
Cash and balances with Central Bank of Oman 10,220
Certificates of deposit -
Due from banks 5,335
Financing to banks -
Financing to Customers 116,565
Investments 8,248
Property and equipment 421
Deferred tax assets -
Other assets 342
Total assets 141,131
Liabilities
Due to banks 10,060
Customer deposits 114,661
Euro medium term notes -
Other liabilities 4,641
Subordinated bonds -
Total liabilities 129,362
Shareholders' Equity
Paid-upshare capital 13,500
Share premium -
Legal reserve -
General reserve -
Retained earnings (1,731)
Other reserves -
Cumulative changes in fair value of investments -
Subordinated debt reserve -
Tier 1 perpetual bond -
Total shareholders' equity 11,769
Total liability and shareholders’ funds 141,131
212 | National Bank of Oman Annual Report 2018 | 213
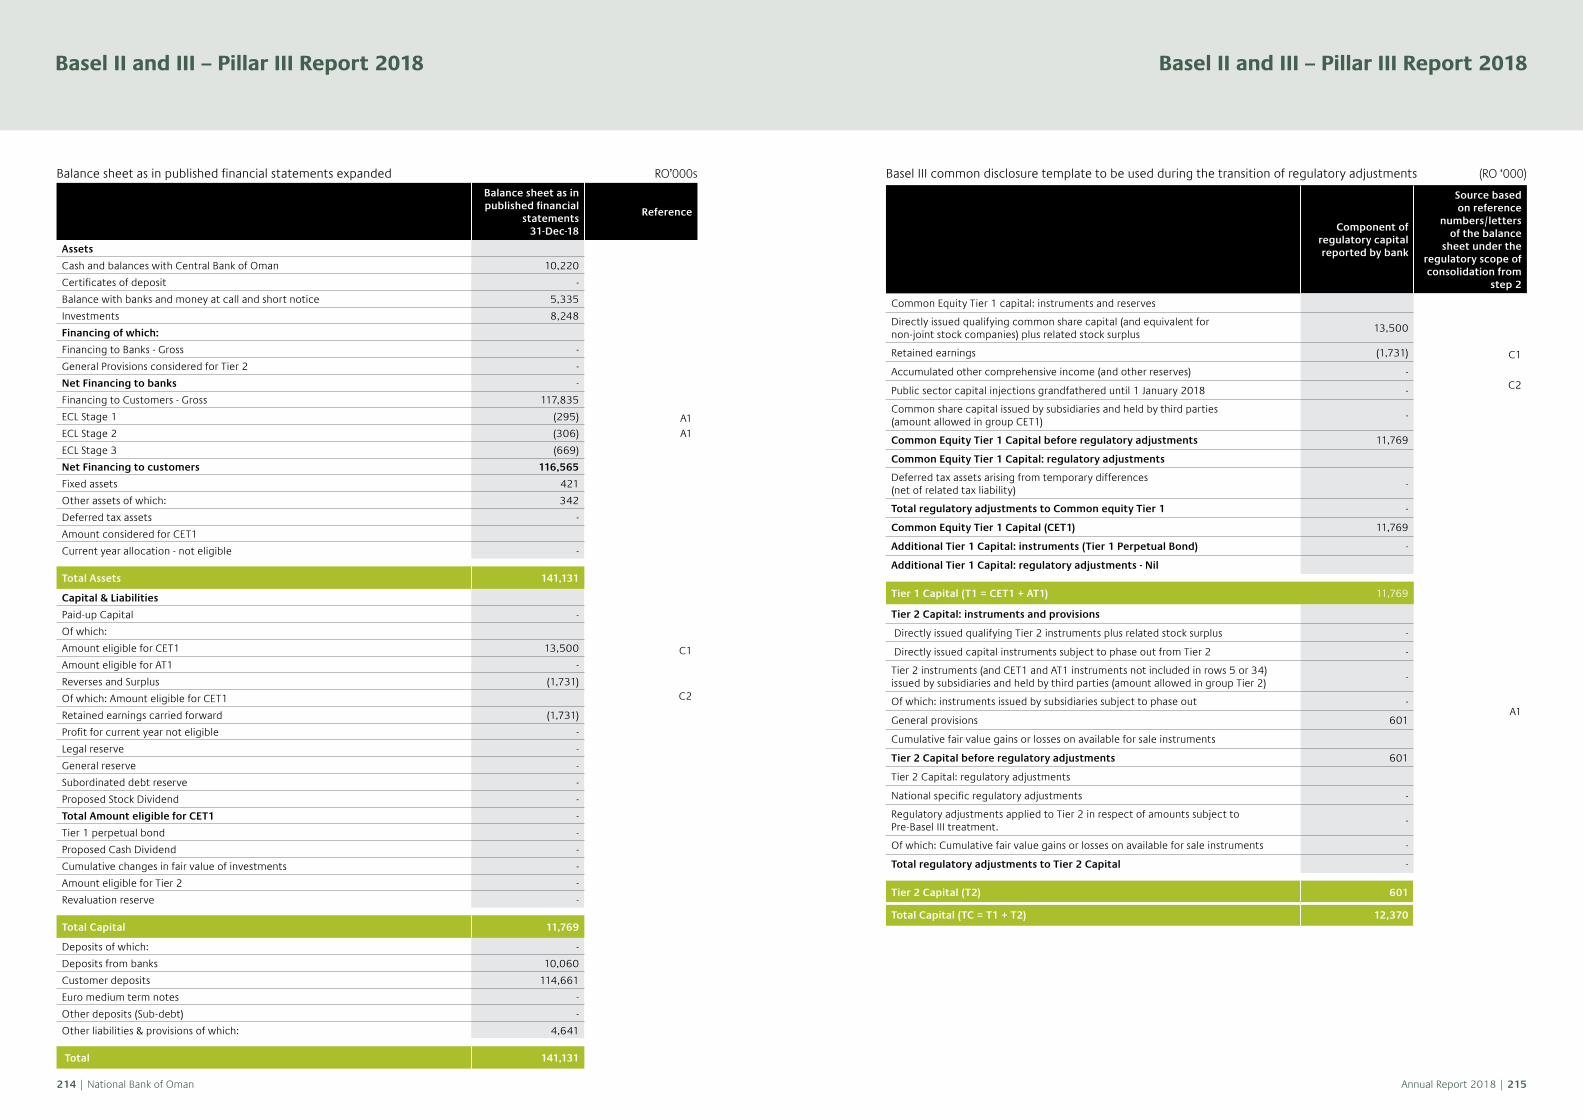
Basel II and III – Pillar III Report 2018 Basel II and III – Pillar III Report 2018
Balance sheet as in published financial statements expanded RO’000s
Balance sheet as in published financial
statements 31-Dec-18
Reference
Assets
Cash and balances with Central Bank of Oman 10,220
Certificates of deposit -
Balance with banks and money at call and short notice 5,335
Investments 8,248
Financing of which:
Financing to Banks - Gross -
General Provisions considered for Tier 2 -
Net Financing to banks -
Financing to Customers - Gross 117,835
A1A1
ECL Stage 1 (295)
ECL Stage 2 (306)
ECL Stage 3 (669)
Net Financing to customers 116,565
Fixed assets 421
Other assets of which: 342
Deferred tax assets -
Amount considered for CET1
Current year allocation - not eligible -
Total Assets 141,131
Capital & Liabilities
Paid-up Capital -
C1
C2
Of which:
Amount eligible for CET1 13,500
Amount eligible for AT1 -
Reverses and Surplus (1,731)
Of which: Amount eligible for CET1
Retained earnings carried forward (1,731)
Profit for current year not eligible -
Legal reserve -
General reserve -
Subordinated debt reserve -
Proposed Stock Dividend -
Total Amount eligible for CET1 -
Tier 1 perpetual bond -
Proposed Cash Dividend -
Cumulative changes in fair value of investments -
Amount eligible for Tier 2 -
Revaluation reserve -
Total Capital 11,769
Deposits of which: -
Deposits from banks 10,060
Customer deposits 114,661
Euro medium term notes -
Other deposits (Sub-debt) -
Other liabilities & provisions of which: 4,641
Total 141,131
Basel III common disclosure template to be used during the transition of regulatory adjustments (RO ‘000)
Component of regulatory capital reported by bank
Source based on reference
numbers/letters of the balance
sheet under the regulatory scope of consolidation from
step 2
Common Equity Tier 1 capital: instruments and reserves
C1
C2
Directly issued qualifying common share capital (and equivalent for non-joint stock companies) plus related stock surplus
13,500
Retained earnings (1,731)
Accumulated other comprehensive income (and other reserves) -
Public sector capital injections grandfathered until 1 January 2018 -
Common share capital issued by subsidiaries and held by third parties (amount allowed in group CET1)
-
Common Equity Tier 1 Capital before regulatory adjustments 11,769
Common Equity Tier 1 Capital: regulatory adjustments
Deferred tax assets arising from temporary differences (net of related tax liability)
-
Total regulatory adjustments to Common equity Tier 1 -
Common Equity Tier 1 Capital (CET1) 11,769
Additional Tier 1 Capital: instruments (Tier 1 Perpetual Bond) -
Additional Tier 1 Capital: regulatory adjustments - Nil
Tier 1 Capital (T1 = CET1 + AT1) 11,769
Tier 2 Capital: instruments and provisions
Directly issued qualifying Tier 2 instruments plus related stock surplus -
A1
Directly issued capital instruments subject to phase out from Tier 2 -
Tier 2 instruments (and CET1 and AT1 instruments not included in rows 5 or 34) issued by subsidiaries and held by third parties (amount allowed in group Tier 2)
-
Of which: instruments issued by subsidiaries subject to phase out -
General provisions 601
Cumulative fair value gains or losses on available for sale instruments
Tier 2 Capital before regulatory adjustments 601
Tier 2 Capital: regulatory adjustments
National specific regulatory adjustments -
Regulatory adjustments applied to Tier 2 in respect of amounts subject to Pre-Basel III treatment.
-
Of which: Cumulative fair value gains or losses on available for sale instruments -
Total regulatory adjustments to Tier 2 Capital -
Tier 2 Capital (T2) 601
Total Capital (TC = T1 + T2) 12,370
214 | National Bank of Oman Annual Report 2018 | 215
Basel II and III – Pillar III Report 2018
Disclosure template for main features of all regulatory capital instruments
1. Common Equity Common equity comprises of assigned capital amounting to RO 13,500,000 transferred from National Bank
of Oman SAOG.
2. All other regulatory capital instruments - Nil This report on Basel II & III disclosures set out from pages no 1 to 25 was authorized for issue on
28th January 2018.
Rawan bint Ahmed Al SaidChairperson
216 | National Bank of Oman
Financial Statement
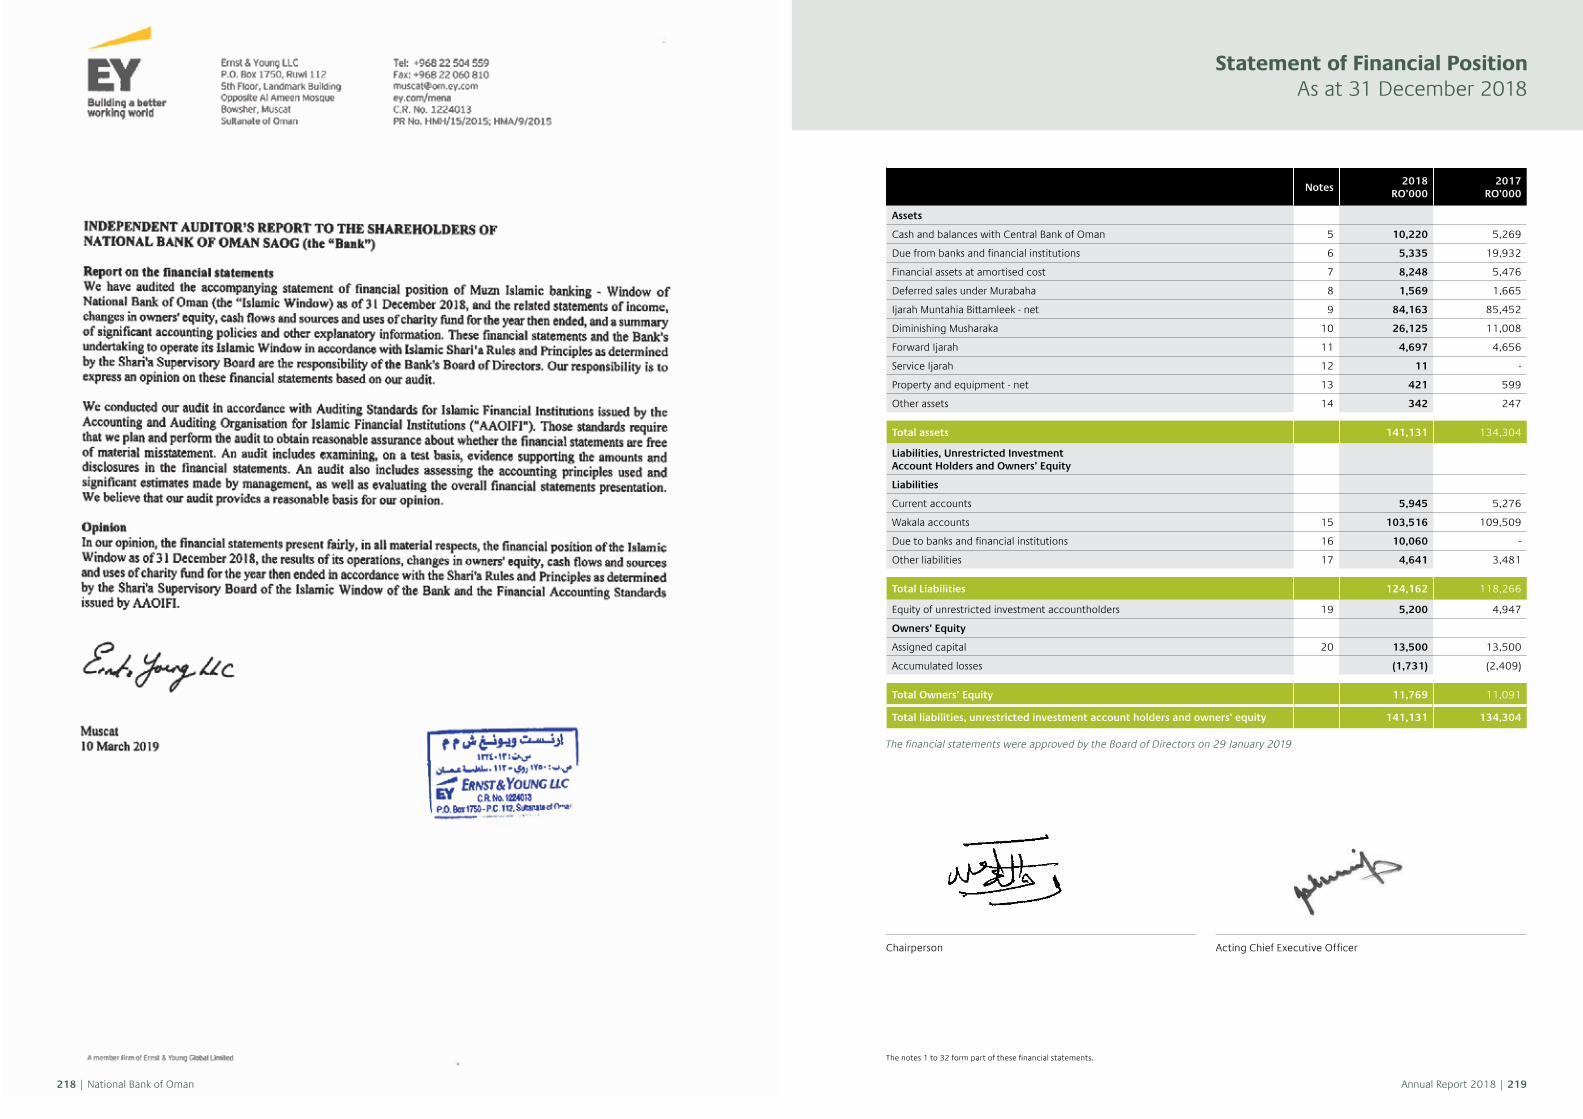
DateMuscat
Notes2018
RO’0002017
RO’000
Assets
Cash and balances with Central Bank of Oman 5 10,220 5,269
Due from banks and financial institutions 6 5,335 19,932
Financial assets at amortised cost 7 8,248 5,476
Deferred sales under Murabaha 8 1,569 1,665
Ijarah Muntahia Bittamleek - net 9 84,163 85,452
Diminishing Musharaka 10 26,125 11,008
Forward Ijarah 11 4,697 4,656
Service Ijarah 12 11 -
Property and equipment - net 13 421 599
Other assets 14 342 247
Total assets 141,131 134,304
Liabilities, Unrestricted Investment Account Holders and Owners’ Equity
Liabilities
Current accounts 5,945 5,276
Wakala accounts 15 103,516 109,509
Due to banks and financial institutions 16 10,060 -
Other liabilities 17 4,641 3,481
Total Liabilities 124,162 118,266
Equity of unrestricted investment accountholders 19 5,200 4,947
Owners’ Equity
Assigned capital 20 13,500 13,500
Accumulated losses (1,731) (2,409)
Total Owners’ Equity 11,769 11,091
Total liabilities, unrestricted investment account holders and owners’ equity 141,131 134,304
The financial statements were approved by the Board of Directors on 29 January 2019
The notes 1 to 32 form part of these financial statements.
Statement of Financial PositionAs at 31 December 2018
Chairperson Acting Chief Executive Officer
Annual Report 2018 | 219218 | National Bank of Oman
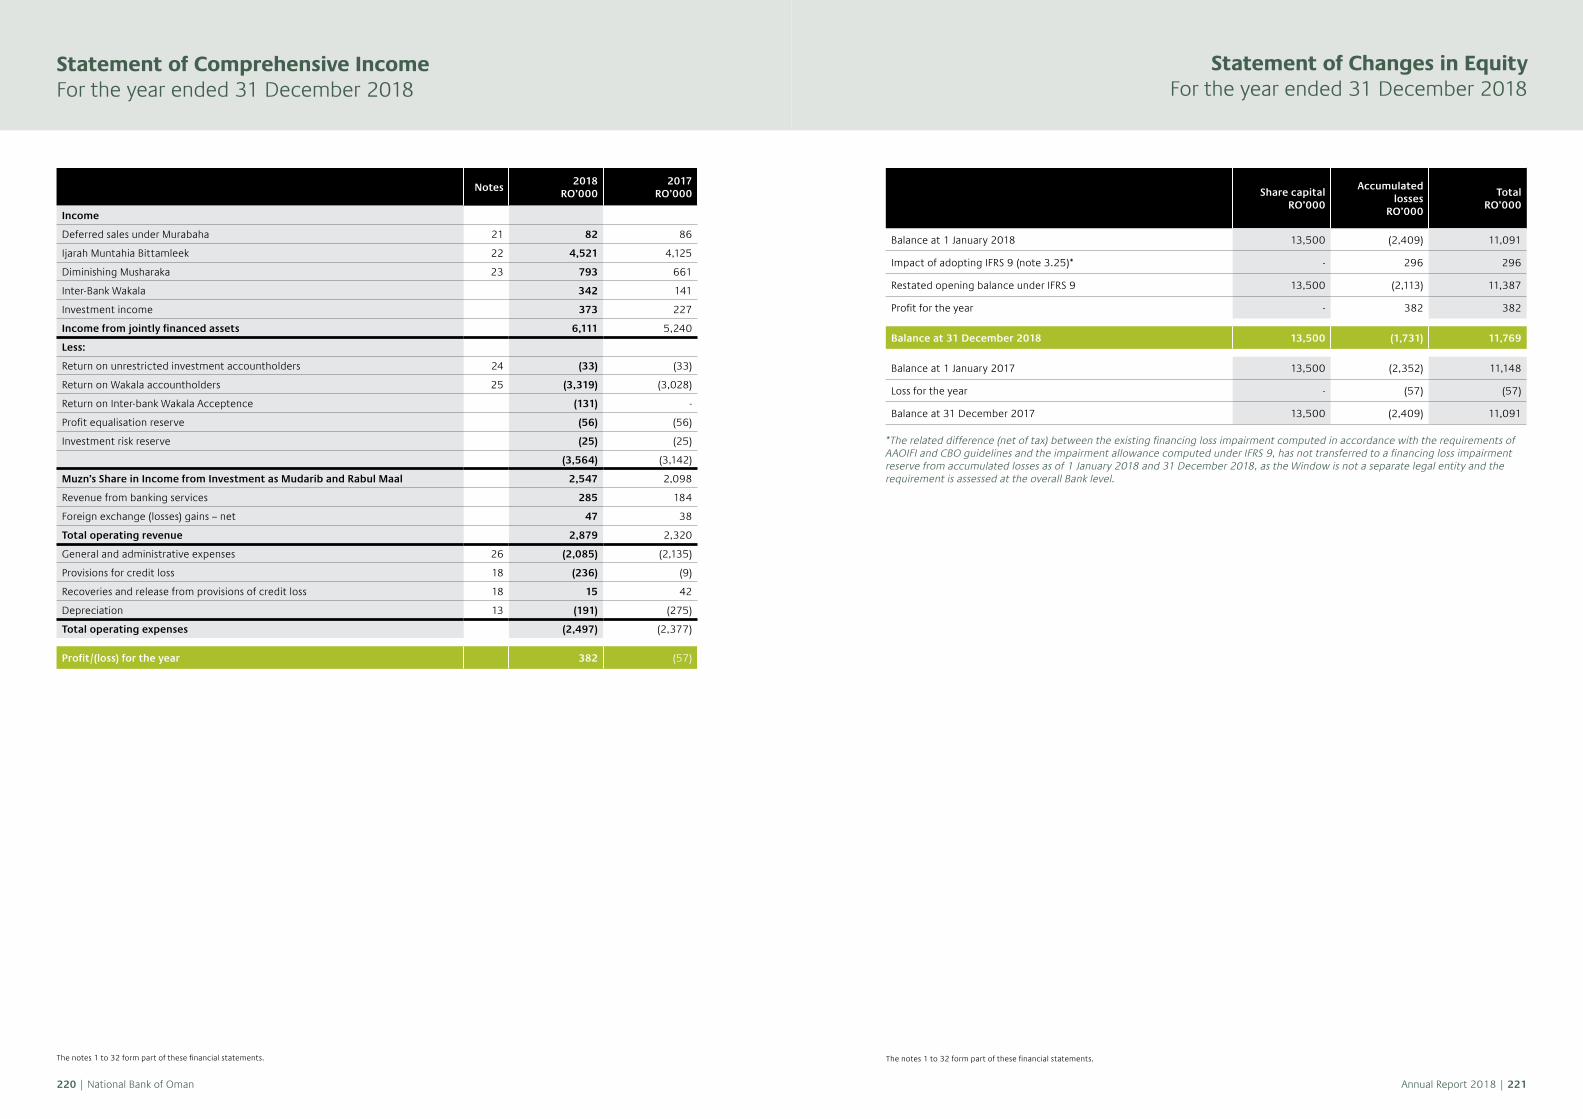
Statement of Comprehensive Income For the year ended 31 December 2018
Notes2018
RO’0002017
RO’000
Income
Deferred sales under Murabaha 21 82 86
Ijarah Muntahia Bittamleek 22 4,521 4,125
Diminishing Musharaka 23 793 661
Inter-Bank Wakala 342 141
Investment income 373 227
Income from jointly financed assets 6,111 5,240
Less:
Return on unrestricted investment accountholders 24 (33) (33)
Return on Wakala accountholders 25 (3,319) (3,028)
Return on Inter-bank Wakala Acceptence (131) -
Profit equalisation reserve (56) (56)
Investment risk reserve (25) (25)
(3,564) (3,142)
Muzn’s Share in Income from Investment as Mudarib and Rabul Maal 2,547 2,098
Revenue from banking services 285 184
Foreign exchange (losses) gains – net 47 38
Total operating revenue 2,879 2,320
General and administrative expenses 26 (2,085) (2,135)
Provisions for credit loss 18 (236) (9)
Recoveries and release from provisions of credit loss 18 15 42
Depreciation 13 (191) (275)
Total operating expenses (2,497) (2,377)
Profit/(loss) for the year 382 (57)
The notes 1 to 32 form part of these financial statements.
Statement of Changes in Equity For the year ended 31 December 2018
The notes 1 to 32 form part of these financial statements.
Share capital RO’000
Accumulated losses
RO’000
Total RO’000
Balance at 1 January 2018 13,500 (2,409) 11,091
Impact of adopting IFRS 9 (note 3.25)* - 296 296
Restated opening balance under IFRS 9 13,500 (2,113) 11,387
Profit for the year - 382 382
Balance at 31 December 2018 13,500 (1,731) 11,769
Balance at 1 January 2017 13,500 (2,352) 11,148
Loss for the year - (57) (57)
Balance at 31 December 2017 13,500 (2,409) 11,091
*The related difference (net of tax) between the existing financing loss impairment computed in accordance with the requirements of AAOIFI and CBO guidelines and the impairment allowance computed under IFRS 9, has not transferred to a financing loss impairment reserve from accumulated losses as of 1 January 2018 and 31 December 2018, as the Window is not a separate legal entity and the requirement is assessed at the overall Bank level.
220 | National Bank of Oman Annual Report 2018 | 221
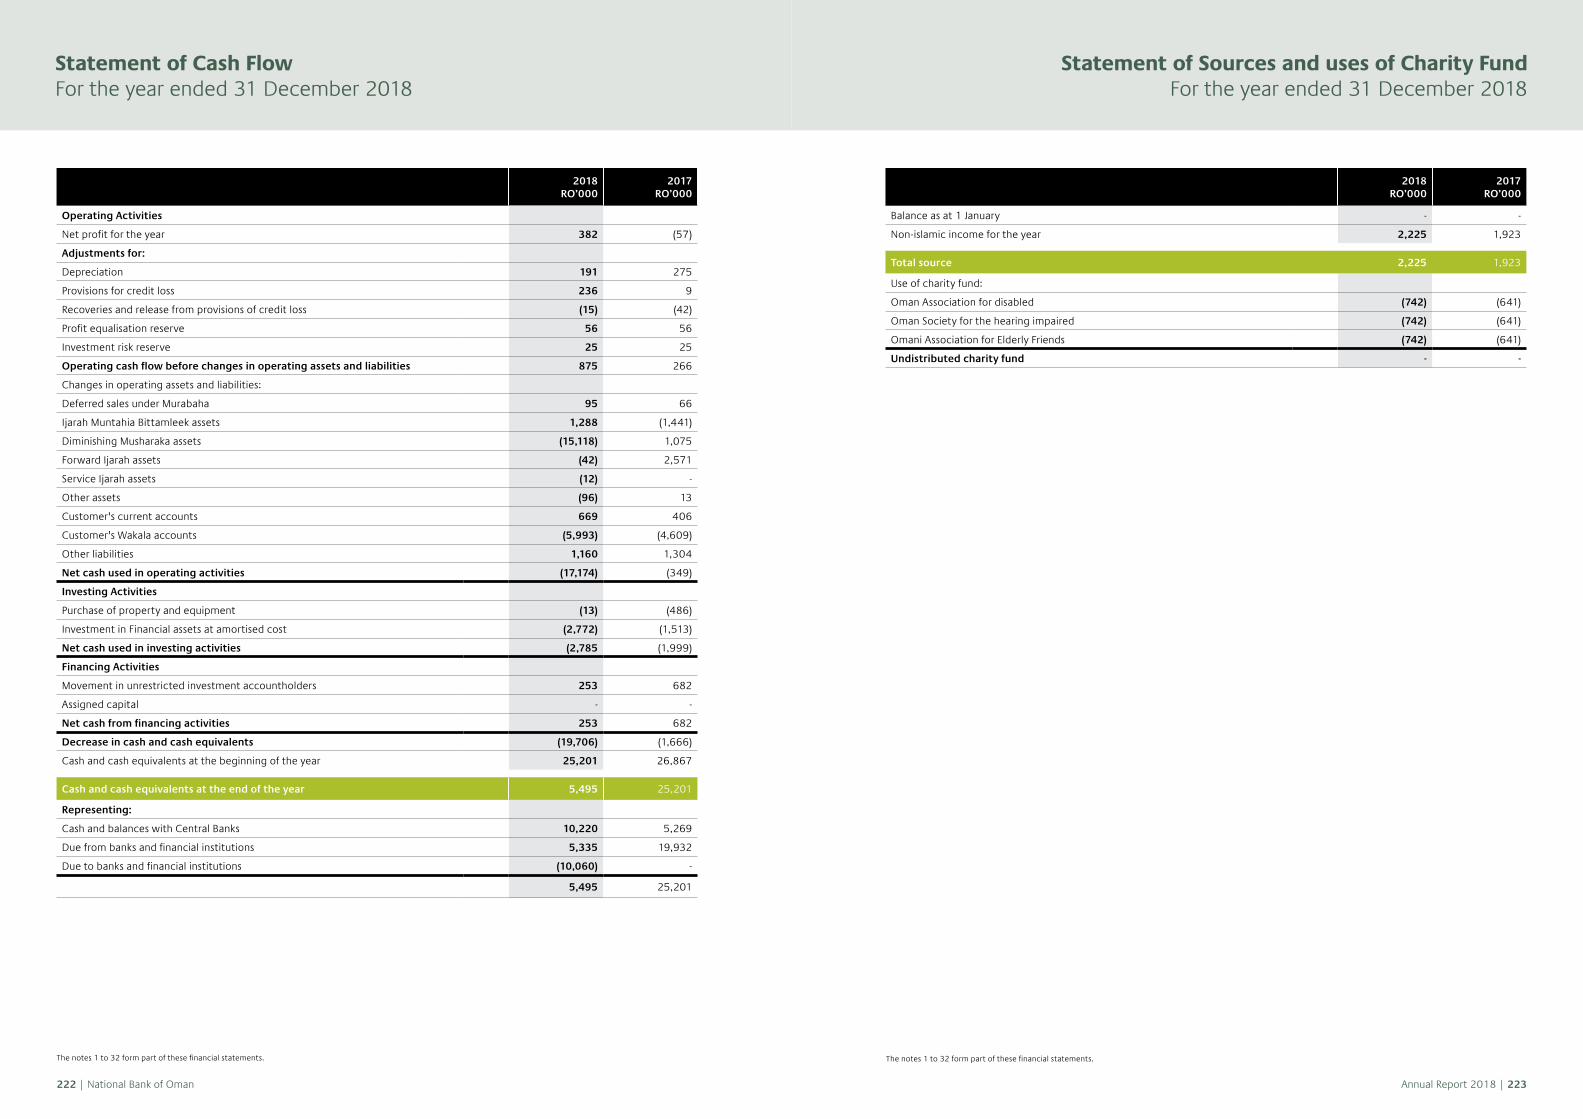
2018 RO’000
2017 RO’000
Operating Activities
Net profit for the year 382 (57)
Adjustments for:
Depreciation 191 275
Provisions for credit loss 236 9
Recoveries and release from provisions of credit loss (15) (42)
Profit equalisation reserve 56 56
Investment risk reserve 25 25
Operating cash flow before changes in operating assets and liabilities 875 266
Changes in operating assets and liabilities:
Deferred sales under Murabaha 95 66
Ijarah Muntahia Bittamleek assets 1,288 (1,441)
Diminishing Musharaka assets (15,118) 1,075
Forward Ijarah assets (42) 2,571
Service Ijarah assets (12) -
Other assets (96) 13
Customer's current accounts 669 406
Customer's Wakala accounts (5,993) (4,609)
Other liabilities 1,160 1,304
Net cash used in operating activities (17,174) (349)
Investing Activities
Purchase of property and equipment (13) (486)
Investment in Financial assets at amortised cost (2,772) (1,513)
Net cash used in investing activities (2,785 (1,999)
Financing Activities
Movement in unrestricted investment accountholders 253 682
Assigned capital - -
Net cash from financing activities 253 682
Decrease in cash and cash equivalents (19,706) (1,666)
Cash and cash equivalents at the beginning of the year 25,201 26,867
Cash and cash equivalents at the end of the year 5,495 25,201
Representing:
Cash and balances with Central Banks 10,220 5,269
Due from banks and financial institutions 5,335 19,932
Due to banks and financial institutions (10,060) -
5,495 25,201
Statement of Cash Flow For the year ended 31 December 2018
The notes 1 to 32 form part of these financial statements.
2018 RO’000
2017 RO’000
Balance as at 1 January - -
Non-islamic income for the year 2,225 1,923
Total source 2,225 1,923
Use of charity fund:
Oman Association for disabled (742) (641)
Oman Society for the hearing impaired (742) (641)
Omani Association for Elderly Friends (742) (641)
Undistributed charity fund - -
Statement of Sources and uses of Charity Fund For the year ended 31 December 2018
The notes 1 to 32 form part of these financial statements.
222 | National Bank of Oman Annual Report 2018 | 223
1 Legal status and principal activitiesMuzn Islamic Banking – Window of National Bank of Oman SAOG (‘Muzn’) was registered in the Sultanate of Oman as a window of National Bank of Oman SAOG. Muzn’s principle place of business is in Muscat, Sultanate of Oman.
Muzn’s operations commenced on 17 January 2013 and it currently operates through six branches in the Sultanate under the license issued by the Central Bank of Oman on 15 January 2013.
The principle activities of Muzn are taking demand, saving and deposit accounts, providing Murabaha finance, Ijarah financing, Musharaka financing and other Shari’a compliant forms of financing as well as managing investor’s money on the basis of Mudaraba or agency for a fee, providing commercial banking services and other investment activities.
Muzn’s activities are regulated by the Central Bank of Oman (‘CBO‘) and supervised by Shari’a Supervisory Board (‘SSB’) comprising of five members.
Muzn’s address is PO Box 751 and PC 112, Muscat, Sultanate of Oman.
Muzn employed 62 employees as at 31 December 2018 (2017: 66).
2 Basis of preparation
2.1 Statement of compliance
The financial statements of Muzn Islamic Banking have been prepared in accordance with Financial Accounting Standards (‘FAS’) issued by the Accounting and Auditing Organisation for Islamic Financial Institutions (AAOIFI), the Shari’a rules and principles as determined by the Shari’a Supervisory Board of Muzn and the applicable laws and regulations issued by the CBO. In accordance with the requirements of IBRF, for accounting matters which are not covered by the AAOIFI standards, Muzn uses the relevant International Financial Reporting Standards (‘IFRS’) issued by the International Accounting Standards Board (IASB). The significant accounting policies are set out in note 3 to the financial statements.
These financial statements relate to the Islamic Window operation only and do not include the financial results of the Bank. The complete set of Bank’s financial statements are presented separately. The window is not a separate legal entity, the separate financial statements of National Bank of Oman SAOG has been prepared to comply with the requirements of Articles 1.5.1.2 to 1.5.1.4 of Title 2 ‘General Obligations and Governance’ of IBRF issued by Central Bank of Oman
In accordance with the requirements of Central Bank of Oman’s circular BM 1149 dated 13 April 2017 Window has adopted IFRS 9. These are the first set of annual financial statements in which IFRS 9 has been applied. Changes to significant accounting policies are described
in note 3.24 and the related transition impact is set out in note 3.25.
Statement of restricted investment accountholders and statement of Qard fund and Zakat are not presented as these are not applicable/relevant to Muzn’s operations.
2.2 Basis of measurement
The financial statements are prepared on historical cost basis except for the measurement at fair value of certain instrument(s) carried at fair value.
2.3 Functional and presentation currency
The financial statements have been presented in Rial Omani (RO) which is the functional currency of Muzn. Except as otherwise indicated, financial information presented has been rounded off to the nearest thousand Rial Omani (RO).
2.4 Use of estimates and judgements
The preparation of financial statements in conformity with AAOIFI requires management to make judgments estimates and assumptions that effect the application of accounting policies and the reported amounts of assets, liabilities, income and expenses. Actual results may differ from these estimates.
Estimates and underlying assumptions are reviewed on an ongoing basis. Revisions to accounting estimates are recognized in the period in which the estimate is revised and in any future periods affected.
Information about significant areas of uncertainty and critical judgments in applying accounting policies that have the most significant effect on the amounts recognized in the financial statements are described in note 4.
3 Significant accounting policiesThe accounting policies set below have been consistently applied in dealing with items that are considered material in relation to Muzn’s financial statements to the period presented.
3.1 Foreign currency translations
Foreign currency transactions are translated into the functional currency using the exchange rates prevailing at the dates of the transactions. Foreign exchange gains and losses resulting from the settlement of such transactions and from the translation at period-end exchange rates of monetary assets and liabilities denominated in foreign currencies are recognised in income statement.
Figures are also presented in United States Dollar (USD) for statement of financial position, income statement, statement of changes in equity, statement of cash flows and statement of sources and uses of charity fund, which have been translated from Rial Omani at an exchange rate of RO 0.385 to each US Dollar.
3.2 Financial instruments (Policy applicable up to 31 December 2017)
3.2.1 Recognition
Muzn recognises Islamic financial assets and liabilities on the date at which they originated. Regular way purchases and sales of financial assets are recognised on the trade date at which Muzn commits to purchase and sell the asset. All other financial assets and liabilities (including assets and liabilities at fair value through profit or loss) are initially recognised on the trade date at which Muzn becomes a party to the contractual provisions of the instrument.
A financial asset or financial liability is measured initially at fair value, plus for an item not at fair value through profit or loss, transaction costs that are directly attributable to its acquisition or issue.
3.2.2 Derecognition
A financial asset (or, where applicable a part of a financial asset or part of a group of similar assets) is derecognised when:
(i) the right to receive cash flows from the asset has expired;
(ii) Muzn has transferred its rights to receive cash flows from the asset and either (a) has transferred substantially all the risks and rewards of the asset, or (b) has neither transferred nor retained substantially all the risks and rewards of the asset, but has transferred control of the asset.
A financial liability is derecognised when the obligation specified in the contract is discharged, cancelled or expires.
3.2.3 Measurement
Financial assets are measured initially at fair value plus transaction costs for all financial assets not carried at fair value through profit or loss.
Subsequent to initial recognition all financial assets are measured at fair value, except equity instrument that does not have a quoted market price in an active market and whose fair value cannot be reliably measured is stated at cost, including transaction costs, less impairment losses.
All non-trading financial liabilities are measured at amortised cost less impairment losses. Amortised cost is calculated on the effective profit rate method. Premiums and discounts, including initial transaction costs, are included in the carrying amount of the related instrument and amortised based on the effective profit rate of the instrument.
3.3 Cash and cash equivalents
For the purpose of the cash flow statement, cash and cash equivalents comprise balances with less than
three months’ maturity from the date of acquisition, including: cash on hand, non-restricted cash deposited with the Central Bank of Oman and, amounts due from other banks.
3.4 Offsetting
Financial assets and liabilities are offset and the net amount is reported in the statement of financial position when there is a legally enforceable right to set off the recognised amounts and there is an intention to settle on a net basis, or realise the asset and settle the liability simultaneously. Further, this should also be as per the Shari’a principles and guidelines.
Income and expenses are presented on a net basis only for permitted transaction.
3.5 Deferred sales under Murabaha
Deferred sales under Murabaha are stated net of deferred profits and provisions for impairment. Muzn considers the promise made in the deferred sales to the purchase orderer as obligatory.
3.6 Ijarah Muntahia Bittamleek assets and Forward Ijarah
Ijarah Muntahia Bittamleek assets are initially recorded at cost. Ijarah Muntahia Bittamleek is a lease whereby the legal title of the leased asset passes to the lessee at the end of the Ijarah (lease term), provided that all Ijarah installments are settled.
Depreciation is calculated using the straight-line method on all Ijarah Muntahia Bittamleek assets, at rates calculated to write off the cost of each asset over its useful life.
Forward Ijarah assets are recognised as assets at cost during the period of construction.
3.7 Diminishing Musharaka
Musharaka contract represents a partnership between Muzn and a customer whereby each party contributes to the capital in equal or varying proportions to develop a new asset or share an existing one, and whereby each of the party becomes an owner of the capital on a permanent or declining basis and shall have a share of profits or losses.
These are stated at the fair value of consideration given less any amounts written off and provision for impairment, if any. In Diminishing Musharaka based transactions, Muzn enters into a Musharaka based on Shirkat-ul-milk for financing an agreed share of fixed asset (e.g. house or land) with its customers and enters into periodic profit payment agreement on Ijarah basis for the utilisation of Muzn’s Musharaka share by the customer.
Over the tenor, one partner’s investment in the partnership declines on account of the other partner’s
Notes to the Financial StatementsAs at 31 December 2018
Notes to the Financial StatementsAs at 31 December 2018
224 | National Bank of Oman Annual Report 2018 | 225
increase in the partnership investment through repayment of the former partner’s share.
3.8 Service Ijarah
Deferred Contracts under Service Ijarah are stated net of deferred profits and provisions for impairment. Muzn considers the payments to be made under Deferred Service Ijarah Contracts as obligatory.
3.9 Property and equipment
Items of property and equipment are stated at cost less accumulated depreciation and impairment loss. Depreciation is calculated so as to write off the cost of property and equipment, by equal installments over their estimated economic useful lives from the date the asset is brought into use, as follows:
Nature of assets Useful life
in years
Furniture and fixtures 10
Equipment 5-20
Motor vehicles 4
Leasehold improvements 3-10
The assets’ residual values and useful lives are reviewed, and adjusted if appropriate, at each statement of financial position date. An asset’s carrying amount is written down immediately to its recoverable amount if the asset’s carrying amount is greater than its estimated recoverable amount. The recoverable amount is the higher of the asset’s fair value less costs to sell and value in use.
Gains and losses on disposal of property and equipment are determined by reference to their carrying amount and are taken into account in determining operating profit. Repairs and renewals are charged to income statement when the expense is incurred. Subsequent expenditure is capitalised only when it increases the future economic benefits embodied in the item of property and equipment. All other expenditure is recognised in income statement as an expense when incurred.
3.10 Unrestricted investment accountholders
All unrestricted investment accounts will be carried at cost plus profit attributable to unrestricted investment account holders and related reserves, less amounts settled.
Unrestricted investment account holders’ share of income will be calculated based on the income generated from investment accounts after deducting Mudarib share. Operating expenses will be charged to shareholders’ funds and not included in the calculation.
The basis applied by Muzn in arriving at the unrestricted investment account holders’ share of income will be (total income from jointly financed Islamic finances less shareholders’ income). Pre agreed profit share generated from unrestricted investment account holders will be deducted as Mudarib share and the remaining will be distributed to the unrestricted investment account holders.
3.11 Investments (applicable from 1 January 2018)
Investments comprise of debt type instruments carried at amortised cost, equity type instruments carried at fair value through equity and equity type instruments carried at fair value through statement of income.
All investments, are initially recognised at cost, being the fair value of the consideration given including acquisition charges associated with the investment, except in the case of investments carried at fair value through statement of income.
Debt type instruments carried at amortised cost (Applicable to 2017)
Investments which have fixed or determinable payments and where the Window has both the intent and ability to hold to maturity are classified as debt type instruments carried at amortised cost. Such investments are carried at amortised cost, less provision for impairment in value. Amortised cost is calculated by taking into account any premium or discount on acquisition. Any gain or loss on such instruments is recognised in the statement of comprehensive income when the instruments are de-recognised or impaired.
Debt instruments at FVTE (IFRS 9: FVOCI) (policy applicable from 1 January 2018)
The Window applies the new category under IFRS 9 of debt instruments measured at FVTE when both of the following conditions are met:
- The instrument is held within a business model, the objective of which is achieved by both collecting contractual cash flows and selling financial assets
- The contractual terms of the financial asset meet the SPPI test
For debt securities measured at FVTE, gains and losses are recognised in equity and upon sale realized through Profit and Loss.
When debt security measured at FVTE is derecognised, the cumulative gain or loss previously recognised in fair value reserve is reclassified from equity to profit or loss.
Equity type instruments carried at fair value through equity (Applicable to 2017)
Subsequent to acquisition, equity type instruments are remeasured at fair value, with unrealised gains and
losses recognised in a separate component of equity until the investment is derecognised or the investment is determined to be impaired. On derecognition or impairment, the cumulative gain or loss previously recorded in equity is recognised in the statement of comprehensive income for the year.
Impairment losses on equity type instruments carried at fair value through equity are not reversed through the statement of comprehensive income and increases in their fair value after impairment are recognised directly in owners’ equity.
Equity instruments at FVTE (IFRS 9:FVOCI) (Policy applicable from 1 January 2018)
Upon initial recognition, the Window occasionally elects to classify irrevocably some of its equity investments as equity instruments at FVTE when they meet the definition of definition of Equity under IAS 32 Financial Instruments: Presentation and are not held for trading. Such classification is determined on an instrument-by-instrument basis.
Gains and losses on these equity instruments are never recycled to profit. Dividends are recognised in profit or loss as other operating income when the right of the payment has been established, except when the Window benefits from such proceeds as a recovery of part of the cost of the instrument, in which case, such gains are recorded in equity. Equity instruments at FVOCI are not subject to an impairment assessment.
Equity type instruments carried at fair value through statement of income (Applicable to 2017)
These are subsequently re-measured at fair value. All related realised and unrealised gains or losses are included in the statement of comprehensive income.
3.11 Investment risk reserve
Investment risk reserves are amounts appropriated out of the income of unrestricted investment account holders, after allocating the Mudarib share, in order to cater against future losses for unrestricted investment account holders.
3.12 Profit equalisation reserve
Muzn appropriates a certain amount in excess of the profit to be distributed to unrestricted investment accounts before taking into consideration the Mudarib share of income. This will be used to maintain a certain level of return on investment for unrestricted investment account holders.
3.13 Provisions
Provisions are recognised when Muzn has a present obligation (legal or constructive) arising from a past event and the costs to settle the obligation are both probable and able to be measured reliably.
According to the regulations of the Central Bank of Oman; Banks are required to have portfolio credit loss provisions, at least equivalent to 1% of the total financing and interbank 0.5% categorized as Standard and Special Mention. However, for personal finance a minimum portfolio loss provision of 2% of the Standard and Special Mention is required to address the heightened inherent risk.
3.14 Dividends
Dividends are recognised as a liability in the year in which they are declared.
3.15 Earnings prohibited by shari’a
Muzn is committed to avoid recognising any income generated from non-Islamic sources. Accordingly, all non-Islamic income is credited to a charity fund where Muzn disburses these funds according to the Shari’a Supervisory Board’s supervision and instructions.
3.16 Zakah
The responsibility of payment of zakah is on individual shareholders and investment account holders.
3.17 Joint and self-financed
Financing and receivables that are jointly owned by Muzn and the unrestricted investment accounts holders will be classified under the caption “jointly-financed” in the financial statements. Financing and receivables that are financed solely by Muzn will be classified under “self-financed”.
3.18 Funds for Muzn
Muzn functions with funds specifically available for its Islamic banking activities and there is no commingling of funds with conventional banking business.
3.19 Revenue recognition
3.19.1 Deferred sales under Murabaha
Where the income is quantifiable and contractually determined at the commencement of the contract, income will be recognised on a time-apportioned basis over the period of the contract based on the principal amounts outstanding. Where the income from a contract is not quantifiable or contractually determinable, it will be recognized when realised. Income related to non performing accounts will be excluded from the income statement.
3.19.2 Diminishing Musharaka
Income from Musharaka is recognised when the right to receive payment is established or when distribution is made.
Notes to the Financial StatementsAs at 31 December 2018
Notes to the Financial StatementsAs at 31 December 2018
226 | National Bank of Oman Annual Report 2018 | 227
3.19.3 Ijarah Muntahia Bittamleek
Income from Ijarah Muntahia Bittamleek will be recognised on a time-apportioned basis over the lease term, net of depreciation. Income related to non performing Ijarah Muntahia Bittamleek assets will be excluded from the statement of income.
3.19.4 Service Ijarah
Where the income is quantifiable and contractually determined at the commencement of the contract, income will be recognised on a time-apportioned basis over the period of the contract based on the principal amounts outstanding. Where the income from a contract is not quantifiable or contractually determinable, it will be recognized when realised. Income related to non performing accounts will be excluded from the income statement.
3.19.5 Dividends
Dividends will be recognised when the right to receive payment is established.
3.19.6 Fee and Commission Income
Fee and commission income will be recognised when earned.
3.19.7 Muzn’s Share as a Mudarib
Muzn’s share as a Mudarib for managing unrestricted investment accounts will be accrued based on the terms and conditions of the related Mudaraba agreements.
3.19.8 Income allocation
Income from jointly financed activities will be allocated proportionately between unrestricted investment accounts and shareholders on the basis of the average balances outstanding during the year.
3.20 Taxation
Muzn is not a separate legal entity and therefore is not taxable on a stand-alone basis as per the prevailing tax laws.
National Bank of Oman SAOG is taxable on a consolidated basis i.e including Muzn’s financial results, accounted for as per the International Financial Reporting Standards. Accordingly, no current tax and deferred tax has been accounted for in these financial statements.
3.21 Employee benefits
End of service benefits are accrued in accordance with the terms of employment of the Muzn’s employees at the statement of financial position date, having regard to the requirements of the Oman Labour Law. Employee entitlements to annual leave and leave passage are
recognized when they accrue to employees and an accrual is made for the estimated liability arising as a result of services rendered by employees up to the statement of financial position date.
Contributions to a defined contribution retirement plan and occupational hazard insurance for Omani employees in accordance with the Omani Social Insurances Law of 1991 and its subsequent amendments are recognized as an expense in income statement as incurred.
3.22 Segment reporting
An operating segment is a component of Muzn that engages in business activities from which it may earn revenues and incur expenses including revenue and expenses that relate to transactions with any of the Muzn’s other components whose operating results are reviewed regularly by the management to make decisions about the resources allocated to each segment and asses its performance and for which discrete financial information is available. Muzn’s primary format for reporting segmental information is business segment, based upon management internal reporting structure. Muzn’s main business segments comprise of retail, corporate and treasury operations.
3.23 Shari’a supervisory board
All business activities, products, transactions, agreements, contracts and other relevant documents are subject to the supervision of the Shari’a Supervisory Board of Muzn, which meets four times a year and consists of three prominent Shari’a scholars as voting members and two non-voting members who are expert in the field. The SSB members appointed for a period of three years are:
• Sh. Dr. Mohamed Bin Ali Elgari – Chairman• Dr. Mohammed Daud Bakar– Member
• H.H. Dr. Adham Al Said – Member• Sh. Dr. Khalid Al Amri – Member
(contract expired in July 2018)
• Sh. Saleh Al Kharusi – Member
3.24 IFRS 9 - Financial Instruments
In accordance with the requirements of Central Bank of Oman’s circular BM 1149 dated 13 April 2017, the Window has adopted IFRS 9 as issued by the IASB in July 2014 with a date of transition of 1 January 2018, which resulted in changes in accounting policies and adjustments to the amounts previously recognised in the financial statements as of and for the year ended 31 December 2017.
As permitted by the transitional provisions of IFRS 9, the Window elected not to restate comparative figures. Any adjustments to the carrying amounts of financial assets
and liabilities at the date of transition were recognised in the opening retained earnings and the opening balance of fair value reserve of the current period.
The adoption of IFRS 9 has resulted in changes in the accounting policies for recognition, classification and measurement of financial assets and financial liabilities and impairment of financial assets. IFRS 9 also significantly amends other standards dealing with financial instruments such as IFRS 7 “Financial Instruments: Disclosures”.
Changes in accounting policies resulting from the adoption of IFRS 9 have been applied retrospectively, except as described below:
- Comparative periods have not been restated. Differences in the carrying amounts of financial assets and financial liabilities resulting from the adoption of IFRS 9 are recognised in retained earnings and reserves as at 1 January 2018. Accordingly, the information presented for 2017 does not reflect the requirements of IFRS 9 and therefore is not comparable to the information presented for 2018 under IFRS 9.
- The following assessments have been made on the basis of the facts and circumstances that existed at the date of initial application.
a) The determination of the business model within which a financial asset is held.
b) The designation and revocation of previous designations of certain financial assets and financial liabilities as measured at FVTPL.
c) The designation of certain investments in equity instruments not held for trading as at FVTE (IFRS 9: FVOCI).
If a debt security had low credit risk at the date of initial application of IFRS 9, then the Window has assumed that credit risk on the asset had not increased significantly since its initial recognition.
The key changes to the Window’s accounting policies resulting from its adoption of IFRS 9 are summarised below:
3.24.1 Classification of financial assets
From 1 January 2018, the Window has applied IFRS 9 and classifies its financial assets in the following measurement categories:
a) Fair value through equity (FVTE) which is IFRS 9: FVOCI; or
b) Amortised cost.c) Fair value through profit or loss (FVTPL);
A financial asset is measured at amortised cost if it meets both of the following conditions and is not designated as at FVTPL:
a) The asset is held within a business model whose objective is to hold assets to collect contractual cash flows; and
b) The contractual terms of the financial asset give rise on specified dates to cash flows that are solely payments of principal and profit.
A debt instrument is measured at FVTE only if it meets both of the following conditions and is not designated as at FVTPL:
a) The asset is held within a business model whose objective is achieved by both collecting contractual cash flows and selling financial assets; and
b) The contractual terms of the financial asset give rise on specified dates to cash flows that are solely payments of principal and profit.
On initial recognition of an equity investment that is not held for trading, the Window may irrevocably elect to present subsequent changes in fair value in OCI. This election is made on an investment-by-investment basis. All other financial assets are classified as measured at FVTPL.
In addition, on initial recognition, the Window may irrevocably designate a financial asset that otherwise meets the requirements to be measured at amortised cost or at FVTE as at FVTPL if doing so eliminates or significantly reduces an accounting mismatch that would otherwise arise.
3.24.2 Business model assessment
The Window makes an assessment of the objective of a business model in which an asset is held at a portfolio level because this best reflects the way the business is managed and information is provided to management. The information considered includes:
a) The stated policies and objectives for the portfolio and the operation of those policies in practice. In particular, whether management’s strategy focuses on earning contractual profits, maintaining a particular profit rate profile, matching the duration of the financial assets to the duration of the liabilities that are funding those assets or realising cash flows through the sale of the assets;
b) how the performance of the portfolio is evaluated and reported to the Window’s management;
c) the risks that affect the performance of the business model (and the financial assets held within that business model) and how those risks are managed;
d) how managers of the business are compensated – e.g. whether compensation is based on the fair value of the assets managed or the contractual cash flows collected; and
e) The frequency, volume and timing of sales in prior periods, the reasons for such sales and its expectations about future sales activity. However, information
Notes to the Financial StatementsAs at 31 December 2018
Notes to the Financial StatementsAs at 31 December 2018
228 | National Bank of Oman Annual Report 2018 | 229
about sales activity is not considered in isolation, but as part of an overall assessment of how the Window’s stated objective for managing the financial assets is achieved and how cash flows are realised.
The business model assessment is based on reasonably expected scenarios without taking ‘worst case’ or ‘stress case’ scenarios into account. If cash flows after initial recognition are realised in a way that is different from the Window’s original expectations, the Window does not change the classification of the remaining financial assets held in that business model, but incorporates such information when assessing newly originated or newly purchased financial assets going forward.
Financial assets that are held for trading or managed and whose performance is evaluated on a fair value basis are measured at FVTPL because they are neither held to collect contractual cash flows nor held both to collect contractual cash flows and to sell financial assets.
3.24.3 Assessment whether contractual cash flows are solely payments of principal and profits (‘SPPP’)
In assessing whether the contractual cash flows are solely payments of principal and profit, the Window considers the contractual terms of the instrument. This includes assessing whether the financial asset contains a contractual term that could change the timing or amount of contractual cash flows such that it would not meet this condition. In making the assessment, the Window considers:
a) contingent events that would change the amount and timing of cash flows;
b) leverage features; c) prepayment and extension terms;d) terms that limit the Window’s claim to cash flows
from specified assets (e.g. non-recourse asset arrangements); and
e) features that modify the profit rates based on the given circumstances.
Contractual terms that introduce a more than de minimis exposure to risks or volatility in the contractual cash flows that are unrelated to a basic lending arrangement do not give rise to contractual cash flows that are solely payments of principal and profit on the amount outstanding. In such cases, the financial asset is required to be measured at FVPL.
The ‘investments’ caption in the statement of financial position includes:
a) debt investment securities measured at amortised cost; these are initially measured at fair value plus incremental direct transaction costs, and subsequently at their amortised cost using the effective profit method;
b) debt and equity investment securities mandatorily measured at FVTPL or designated as at FVTPL; these are at fair value with changes recognised immediately in profit or loss;
c) debt securities measured at FVTE; and
d) equity investment securities designated as at FVTE.
For debt securities measured at FVTE, gains and losses are recognised in equity, except for the following, which are recognised in profit or loss in the same manner as for financial assets measured at amortised cost:
a) Profits from the financial assets
b) ECL and reversals; andc) Foreign exchange gains and losses.
When debt security measured at FVTE is derecognised, the cumulative gain or loss previously recognised in OCI is reclassified from equity to profit or loss.
The Window elects to present in OCI changes in the fair value of certain investments in equity instruments that are not held for trading. The election is made on an instrument-by-instrument basis on initial recognition and is irrevocable.
Gains and losses on such equity instruments are never reclassified to profit or loss and no impairment is recognised in profit or loss. Dividends are recognised in profit or loss unless they clearly represent a recovery of part of the cost of the investment, in which case they are recognised in fair value reserve. Cumulative gains and losses recognised in fair value reserve are transferred to retained earnings on disposal of an investment.
3.24.4 Reclassifications
Financial assets are not reclassified subsequent to their initial recognition, except in the period after the Window changes its business model for managing financial assets.
3.24.5 Impairment
Policies applicable from 01 January 2018
The Window recognises loss allowances for ECL on the following financial instruments that are not measured at FVTPL:
a) financial assets that are debt instruments;
b) financial guarantee contracts issued; and
c) financing commitments issued.
No impairment loss is recognised on equity investments. The Window measures loss allowances at an amount equal to lifetime ECL, except for the following, for which they are measured as 12-month ECL:
a) debt investment securities that are determined to have low credit risk at the reporting date; and
b) other financial instruments (other than lease receivables) on which credit risk has not increased significantly since their initial recognition.
Credit-impaired financial assets
At each reporting date, the Window assesses whether financial assets carried at amortised cost and debt financial assets carried at FVTE are credit-impaired. A financial asset is ‘credit-impaired’ when one or more events that have a detrimental impact on the estimated future cash flows of the financial asset have occurred. Evidence that a financial asset is credit-impaired includes the following observable data:
a) significant financial difficulty of the borrower or issuer;
b) a breach of contract such as a default or past due event;
c) the restructuring of a financing or advance by the Window on the terms that the Window would not consider otherwise;
d) it is becoming probable that the borrower will enter bankruptcy or other financial reorganisation; or
e) the disappearance of an active market for a security because of financial difficulties.
A financing that has been renegotiated due to a deterioration in the borrower’s condition is usually considered to be credit-impaired unless there is evidence that the risk of not receiving contractual cash flows has reduced significantly and there are no other indicators of impairment. In addition, a retail financing exposure that is overdue for 90 days or more is considered impaired.
In making an assessment of whether an investment in sovereign debt is credit-impaired, the Window considers the following factors.
a) The market’s assessment of creditworthiness as reflected in the Sukuk yields.
b) The rating agencies’ assessments of creditworthiness.c) The country’s ability to access the capital markets for
new debt issuance.
d) The probability of debt being restructured, resulting in holders suffering losses through voluntary or mandatory debt forgiveness.
e) The international support mechanisms in place to provide the necessary support as ‘lender of last resort’ to that country, as well as the intention, reflected in public statements, of governments and agencies to use those mechanisms. This includes an assessment of the depth of those mechanisms and, irrespective of the political intent, whether there is the capacity to fulfil the required criteria.
Calculation of expected credit loss (ECL)
Changes to the assumptions and estimate on uncertainties that have a significant impact on ECL for the year ended 31 December 2018 pertain to the changes introduced as a result of adoption of IFRS 9: Financial instruments. The impact is mainly driven by inputs, assumptions and techniques used for ECL calculation under IFRS 9 methodology.
Inputs, assumptions and techniques used for ECL calculation – IFRS 9 Methodology
Key concepts in IFRS 9 that have the most significant impact and require a high level of judgment, as considered by the Window while determining the impact assessment, are:
Assessment of Significant Increase in Credit Risk
The assessment of a significant increase in credit risk is done on a relative basis. To assess whether the credit risk on a financial asset has increased significantly since origination, the Window compares the risk of default occurring over the expected life of the financial asset at the reporting date to the corresponding risk of default at origination, using key risk indicators that are used in the Window’s existing risk management processes.
The Window’s assessment of significant increases in credit risk is being performed at least quarterly for each individual exposure based on eleven factors. If any of the following factors indicates that a significant increase in credit risk has occurred, the instrument will be moved from Stage 1 to Stage 2:
The Window will consider a financial asset to have experienced a significant increase in credit risk when one or more of the following quantitative, qualitative or backstop criteria have been met:
a. The remaining Lifetime PD at the reporting date has increased as result of downgrading of internal rating by two notches;
b. Inadequate or unreliable financial and other information such as unavailability of audited financial statement
c. Non-cooperation by the counterparty in matter pertaining to documentation
d. Counterparty is the subject of litigation by third parties that may have a significant impact on his financial position
e. Frequent changes in senior management
f. Intra-group transfer of funds without underlying transactions
g. Deferment/delay in the date for commencement of commercial operations by more than one year
h. Modification of terms resulting in concessions granted to counterparty including extension of
Notes to the Financial StatementsAs at 31 December 2018
Notes to the Financial StatementsAs at 31 December 2018
230 | National Bank of Oman Annual Report 2018 | 231
moratorium, deferment of payment, waiver of covenants, etc. In applying this requirement, bank is guided by the extant instructions of CBO in regard to treating an account as restructured.
i. A fall of 25 percent or more in the turnover or in the EBIT as compared to previous year.
j. Erosion in net-worth by more than 20 percent as compared to the previous year and coupled with an increase in leverage.
k. A fall in the debt service ratio.
IFRS 9 contains a rebuttable presumption that instruments which are 30 days past due have experienced a significant increase in credit risk.
Movements between Stage 2 and Stage 3 are based on whether financial assets are credit-impaired as at the reporting date. The determination of credit-impairment under IFRS 9 will be similar to the individual assessment of financial assets for objective evidence of impairment under IAS 39.
Macroeconomic Factors, Forward Looking Information (FLI) and Multiple Scenarios
The measurement of ECL for each stage and the assessment of significant increases in credit risk considers information about past events and current conditions as well as reasonable and supportable forecasts of future events and economic conditions. The estimation and application of forward-looking information requires significant judgment.
Probability of Default (PD), Loss Given Default (LGD) and Exposure At Default (EAD) inputs used to estimate Stage 1 and Stage 2 credit loss allowances are modelled based on the macroeconomic variables (or changes in macroeconomic variables), that are closely correlated with credit losses in the relevant portfolio.
The windows base case scenario is based on macroeconomic forecasts using historical information from external sources including impact of portfolio and industry related information. Where worse-case scenario is developed taking the historical information of defaults and is regressed to arrive at forward looking results.
Scenarios are probability-weighted according to the window best estimate of their relative likelihood based on historical frequency and current trends and conditions. Probability weights are updated on an annual basis (if required).
Definition of default
The definition of default used in the measurement of ECL and the assessment to determine movement between stages is consistent with the definition of default used for internal credit risk management purposes. IFRS 9 does not define default, but contains a rebuttable presumption that default has occurred when an exposure is greater than 90 days past due.
Expected life
When measuring ECL, the Window must consider the maximum contractual period over which the Window is exposed to credit risk. All applicable contractual terms are considered when determining the expected life, including prepayment options and extension and rollover options. For certain revolving credit facilities that do not have a fixed maturity, the expected life is estimated based on the period over which the Window is exposed to credit risk and where the credit losses would not be mitigated by management actions.
Overview of the ECL principles
The adoption of IFRS 9 has fundamentally changed the Window’s financing loss impairment method by replacing incurred loss approach with a forward-looking ECL approach. From 1 January 2018, the Window has been recording the allowance for expected credit losses for all financing exposure and other debt financial assets not held at FVPL, together with financing commitments and financial guarantee contracts. Equity instruments are not subject to impairment under IFRS 9.
The ECL allowance is based on the credit losses expected to arise over the life of the asset (the lifetime expected credit loss (LTECL), unless there has been no significant increase in credit risk since origination, in which case, the allowance is based on the 12 months’ expected credit loss (12-month ECL).
The 12-month ECL is the portion of LTECLs that represent the ECLs that result from default events on a financial instrument that are possible within the 12 months after the reporting date.
Both LTECLs and 12mECLs are calculated on either an individual basis or a collective basis, depending on the nature of the underlying portfolio of financial instruments.
The Window has established a policy to perform an assessment, at the end of each reporting period, of whether a financial instrument’s credit risk has increased significantly since initial recognition, by considering the change in the risk of default occurring over the remaining life of the financial instrument.
Based on the above process, the Window groups its financing exposure into Stage 1, Stage 2, and Stage 3, as described below:
Stage 1
When financing are first recognised, the Window recognises an allowance based on 12 month ECLs. Stage 1 financing exposure also include facilities where the credit risk has improved and the financing exposure has been reclassified from Stage 2.
Stage 2
When a financing exposure has shown a significant increase in credit risk since origination, the Window
records an allowance for the LTECLs. Stage 2 financing exposure also include facilities, where the credit risk has improved and the financing exposure has been reclassified from Stage 3.
Stage 3
Financing exposure considered credit-impaired. The Window records an allowance for the LTECLs.
At initial recognition of a financial asset, the Window recognises a loss allowance equal to 12-month expected credit losses. After initial recognition, the three stages under the proposals would be applied as follows:
Stage 1
Credit risk has not increased significantly since initial recognition – recognise 12-month expected credit losses.
Stage 2
Credit risk has increased significantly since initial recognition – recognise lifetime expected losses (this is recognising a provision earlier than under IAS 39 Financial assets: Recognition and Measurement) with revenue being calculated based on the gross amount of the asset.
Stage 3
There is objective evidence of impairment as at the reporting date to recognise lifetime expected losses, with revenue being based on the net amount of the asset (that is, based on the impaired amount of the asset).
Purchased or originated credit impaired (POCI) assets are financial assets that are credit impaired on initial recognition. POCI assets are recorded at fair value at original recognition and profit is subsequently recognised based on a credit-adjusted effective profit rate (EPR). ECLs are only recognised or released to the extent that there is a subsequent change in the expected credit losses.
For financial assets for which the Window has no reasonable expectations of recovering either the entire outstanding amount, or a proportion thereof, the gross carrying amount of the financial asset is reduced. This is considered a (partial) derecognition of the financial asset.
The calculation of ECLs
The Window calculates ECLs based on a two probability-weighted scenarios to measure the expected cash shortfalls, discounted at an approximation to the EPR. A cash shortfall is the difference between the cash flows that are due to an entity in accordance with the contract and the cash flows that the entity expects to receive.
The mechanics of the ECL calculations are outlined below and the key elements are, as follows:
- PD – The Probability of Default is an estimate of the likelihood of default over a given time horizon. A default may only happen at a certain time over the assessed period, if the facility has not been previously derecognised and is still in the portfolio.
- EAD – The Exposure at Default is an estimate of the exposure at a future default date, taking into account expected changes in the exposure after the reporting date, including repayments of principal and profit, whether scheduled by contract or otherwise, expected drawdowns on committed facilities, and accrued profit from missed payments.
LGD - The Loss Given Default is an estimate of the loss arising in the case where a default occurs at a given time. It is based on the difference between the contractual cash flows due and those that the Bank would expect to receive, including from the realisation of any collateral, if any. It is usually expressed as a percentage of the EAD. The Window has applied a LGD of 0% on Government Sukuk issued by Government of Oman which are classified as investments under amortised cost.
Notes to the Financial StatementsAs at 31 December 2018
Notes to the Financial StatementsAs at 31 December 2018
232 | National Bank of Oman Annual Report 2018 | 233
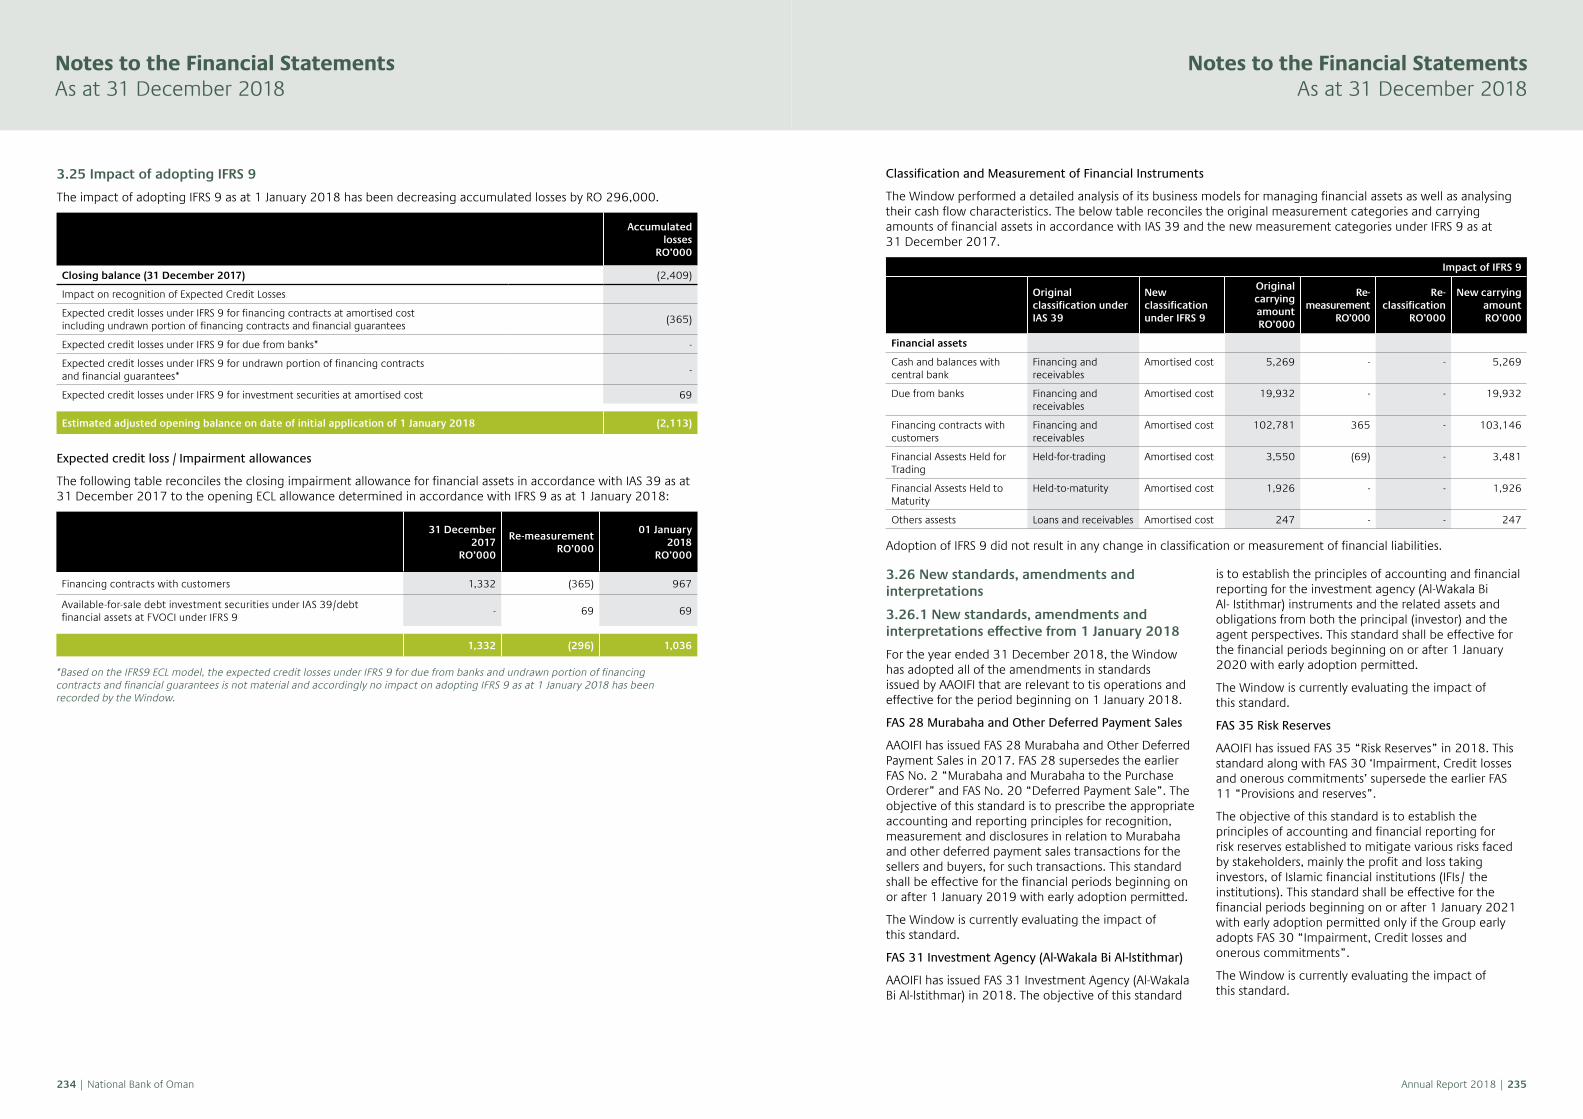
3.25 Impact of adopting IFRS 9
The impact of adopting IFRS 9 as at 1 January 2018 has been decreasing accumulated losses by RO 296,000.
Accumulated losses
RO’000
Closing balance (31 December 2017) (2,409)
Impact on recognition of Expected Credit Losses
Expected credit losses under IFRS 9 for financing contracts at amortised cost including undrawn portion of financing contracts and financial guarantees
(365)
Expected credit losses under IFRS 9 for due from banks* -
Expected credit losses under IFRS 9 for undrawn portion of financing contracts and financial guarantees*
-
Expected credit losses under IFRS 9 for investment securities at amortised cost 69
Estimated adjusted opening balance on date of initial application of 1 January 2018 (2,113)
Expected credit loss / Impairment allowances
The following table reconciles the closing impairment allowance for financial assets in accordance with IAS 39 as at 31 December 2017 to the opening ECL allowance determined in accordance with IFRS 9 as at 1 January 2018:
31 December 2017
RO’000
Re-measurementRO’000
01 January 2018
RO’000
Financing contracts with customers 1,332 (365) 967
Available-for-sale debt investment securities under IAS 39/debt financial assets at FVOCI under IFRS 9
- 69 69
1,332 (296) 1,036
*Based on the IFRS9 ECL model, the expected credit losses under IFRS 9 for due from banks and undrawn portion of financing contracts and financial guarantees is not material and accordingly no impact on adopting IFRS 9 as at 1 January 2018 has been recorded by the Window.
Classification and Measurement of Financial Instruments
The Window performed a detailed analysis of its business models for managing financial assets as well as analysing their cash flow characteristics. The below table reconciles the original measurement categories and carrying amounts of financial assets in accordance with IAS 39 and the new measurement categories under IFRS 9 as at 31 December 2017.
3.26 New standards, amendments and interpretations
3.26.1 New standards, amendments and interpretations effective from 1 January 2018
For the year ended 31 December 2018, the Window has adopted all of the amendments in standards issued by AAOIFI that are relevant to tis operations and effective for the period beginning on 1 January 2018.
FAS 28 Murabaha and Other Deferred Payment Sales
AAOIFI has issued FAS 28 Murabaha and Other Deferred Payment Sales in 2017. FAS 28 supersedes the earlier FAS No. 2 “Murabaha and Murabaha to the Purchase Orderer” and FAS No. 20 “Deferred Payment Sale”. The objective of this standard is to prescribe the appropriate accounting and reporting principles for recognition, measurement and disclosures in relation to Murabaha and other deferred payment sales transactions for the sellers and buyers, for such transactions. This standard shall be effective for the financial periods beginning on or after 1 January 2019 with early adoption permitted.
The Window is currently evaluating the impact of this standard.
FAS 31 Investment Agency (Al-Wakala Bi Al-lstithmar)
AAOIFI has issued FAS 31 Investment Agency (Al-Wakala Bi Al-lstithmar) in 2018. The objective of this standard
is to establish the principles of accounting and financial reporting for the investment agency (Al-Wakala Bi Al- Istithmar) instruments and the related assets and obligations from both the principal (investor) and the agent perspectives. This standard shall be effective for the financial periods beginning on or after 1 January 2020 with early adoption permitted.
The Window is currently evaluating the impact of this standard.
FAS 35 Risk Reserves
AAOIFI has issued FAS 35 “Risk Reserves” in 2018. This standard along with FAS 30 ‘Impairment, Credit losses and onerous commitments’ supersede the earlier FAS 11 “Provisions and reserves”.
The objective of this standard is to establish the principles of accounting and financial reporting for risk reserves established to mitigate various risks faced by stakeholders, mainly the profit and loss taking investors, of Islamic financial institutions (IFIs/ the institutions). This standard shall be effective for the financial periods beginning on or after 1 January 2021 with early adoption permitted only if the Group early adopts FAS 30 “Impairment, Credit losses and onerous commitments”.
The Window is currently evaluating the impact of this standard.
Adoption of IFRS 9 did not result in any change in classification or measurement of financial liabilities.
Impact of IFRS 9
Original classification under IAS 39
New classification under IFRS 9
Original carrying amount RO’000
Re-measurement
RO’000
Re-classification
RO’000
New carrying amount RO’000
Financial assets
Cash and balances with central bank
Financing and receivables
Amortised cost 5,269 - - 5,269
Due from banks Financing and receivables
Amortised cost 19,932 - - 19,932
Financing contracts with customers
Financing and receivables
Amortised cost 102,781 365 - 103,146
Financial Assests Held for Trading
Held-for-trading Amortised cost 3,550 (69) - 3,481
Financial Assests Held to Maturity
Held-to-maturity Amortised cost 1,926 - - 1,926
Others assests Loans and receivables Amortised cost 247 - - 247
Notes to the Financial StatementsAs at 31 December 2018
Notes to the Financial StatementsAs at 31 December 2018
234 | National Bank of Oman Annual Report 2018 | 235
FAS 30 Impairment, Credit losses and onerous commitments
In November 2017, the Accounting and Auditing Organization for Islamic Financial Institutions (AAOIFI) issued Financial Accounting Standard (FAS) 30 - Impairment, credit losses and onerous commitments, the standard supersedes the earlier FAS 11 “Provisions and Reserves” effective from the financial periods beginning on or after 1 January 2020, with early adoption permitted.
However, during the year 2017, the CBO has issued a circular BM 1149 dated 13 April 2017 governing implementation of IFRS 9 Financial Instruments (IFRS 9) for all the banks, which also apply to Islamic banks/windows subject to any specific instructions by the Central Bank for Islamic Banking entities on IFRS 9 if, as and when instructions are issued.
The Window adopted IFRS 9 on 1 January 2018 and did not restate the comparative information in accordance with relevant requirements of IFRS 9. IFRS 9 replaces IAS 39 Financial Instruments: Recognition and Measurement and introduces new requirements for the classification and measurement of financial assets and financial liabilities, a new model based on expected credit losses for recognising loan loss provisions more closely with risk management methodology.
The key changes to the Window’s accounting policies resulting from its adoption of IFRS 9 are summarised below.
(i) Classification and measurement
IFRS 9 contains classification and measurement approach for financial assets that reflects the business model in which financial assets are managed and the underlying cash flow characteristics. IFRS 9 contains three principal classification categories for financial assets: (a) measured at Amortised Cost (AC), Fair Value through Other Comprehensive Income (FVOCI) and Fair Value through Profit or Loss (FVPL). Under IFRS 9, derivatives embedded in contracts where the host is a financial asset are never bifurcated. Instead, the hybrid financial instrument as a whole is assessed for classification.
(ii) Expected credit losses
IFRS 9 replaces the ‘incurred loss’ model in IAS 39 with a forward-looking ‘expected credit loss’ (ECL) model. The new impairment model will apply to financial assets measured at amortised cost or FVOCI, except for investments in equity instruments. A number of significant judgements are also required in applying the accounting requirements for measuring ECL, such as:
• Determining criteria for significant increase in credit risk (SICR);
• Choosing appropriate models and assumptions for the measurement of ECL;
• Establishing the number and relative weightings of forward-looking scenarios for each type of product/market and the associated ECL; and
• Establishing groups of similar financial assets for the purposes of measuring ECL.
The Central Bank of Oman (CBO) has issued guidelines relating to implementation of IFRS 9. The relevant requirements relating to transition are set out below:
• Should the existing financing loss impairment computed in accordance with the requirements of IAS 39 and CBO guidelines be higher than the impairment allowance computed under IFRS 9, the related difference (net of tax) be transferred to a financing loss impairment reserve from retained earnings as of 1 January 2018.
• ln the subsequent years, where the allowance for financing loss impairment computed in accordance with CBO requirements is higher than the allowance for financing loss impairment loss computed under IFRS 9, the difference (net of tax) should be transferred to the aforementioned financing loss impairment reserve from retained earnings.
• The related impairment reserve will not be available for dividend distribution or for inclusion in the regulatory capital. Any subsequent utilisation of the impairment reserve would require prior approval of the CBO.
(iii) Financial liabilities
Most of the requirements in IAS 39 for classification and measurement of financial liabilities were carried forward unchanged to IFRS 9. The key change is that an entity will be required to present the effects of changes in own credit risk of financial liabilities designated at fair value through profit or loss in other comprehensive income.
As IFRS 9 does not change the general principles of how an entity accounts for effective hedges, the Bank does not expect a significant impact as a result of applying IFRS 9.
(iv) Disclosure
IFRS 9 also introduces expanded disclosure requirements and changes in presentation. These are expected to change the nature and extent of the Bank’s disclosures about its financial instruments particularly in the year of the adoption of IFRS 9.
4 Critical accounting judgment and key sources of estimation uncertainty
4.1 Financial Instruments (applicable from 1 January 2018)
Judgements made in applying accounting policies that have most significant effects on the amounts recognized in the financial statements of the year ended 31 December 2018 pertain to the changes introduced
as a result of adoption of IFRS 9: Financial instruments which impact:
• Classification of financial assets: assessment of business model within which the assets are held and assessment of whether the contractual terms of the financial assets are solely payment of principal and profit of the principal amount outstanding.
• Calculation of expected credit loss (ECL): changes to the assumptions and estimate on uncertainties that have a significant impact on ECL for the year ended 31 December 2018 pertain to the changes introduced as a result of adoption of IFRS 9: Financial instruments. The impact is mainly driven by inputs, assumptions and techniques used for ECL calculation under IFRS 9 methodology.
Inputs, assumptions and techniques used for ECL calculation – IFRS 9 Methodology
Key concepts in IFRS 9 that have the most significant impact and require a high level of judgment, as considered by the Bank while determining the impact assessment, are:
• Assessment of significant Increase in credit risk
• Macro-economic factors, forward looking information and multiple scenarios
• Definition of default• Expected life
Detail on criteria for significant increase in credit risk, macro-economic factors, forward looking information and multiple factors and definition of default and expected life is given on the note reference 2.6.5 of the financial statement.
The Window’s ECL calculations are outputs of complex models with number of underlying assumptions regarding the choice of variable inputs and their interdependencies. Elements of the ECL models that are considered accounting judgements and estimates include:
- The Window’s internal credit grading model
- The Window’s criteria for assessing if there has been a significant increase in credit risk and so allowances for financial assets should be measured on a Lifetime Expected Credit Losses (LTECL) basis and the qualitative assessment
- The segmentation of financial assets when their ECL is assessed on a collective basis
- Development of ECL models, including the various formulas and the choice of inputs
- Determination of associations between macroeconomic scenarios and, economic inputs, such as unemployment levels and collateral values, and the effect on Probability of Default (PD), Exposure At Default (EAD) and Loss Given Default (LGD)
- Selection of forward-looking macroeconomic scenarios and their probability weightings, to derive the economic inputs into the ECL models.
4.2 Impairment losses on financing (Policy applicable up to 31 December 2017)
Management reviews its financing portfolio to assess impairment at least on a quarterly basis. In determining whether an impairment loss should be recorded in the statement of income, management makes judgment’s as to whether there is any observable data indicating that there is a measurable decrease in the estimated future cash flows from a portfolio of finances before the decrease can be identified with an individual receivable in that portfolio. This evidence may include observable data indicating that there has been an adverse change in the payment status of customers in a group that correlates with defaults on assets in the group. Management uses estimates based on historical loss experience for assets with credit risk characteristics and objective evidence of impairment similar to those in the portfolio when scheduling its future cash flows. The methodology and assumptions used for estimating both the amount and timing of future cash flows are reviewed regularly to reduce any differences between loss estimates and actual loss experience.
4.3 Useful life of property and equipment
Depreciation is charged so as to write off the cost of assets over their estimated useful lives. The calculation of useful lives is based on management’s assessment of various factors such as the operating cycles, the maintenance programs, and normal wear and tear using its best estimates.
Notes to the Financial StatementsAs at 31 December 2018
Notes to the Financial StatementsAs at 31 December 2018
236 | National Bank of Oman Annual Report 2018 | 237
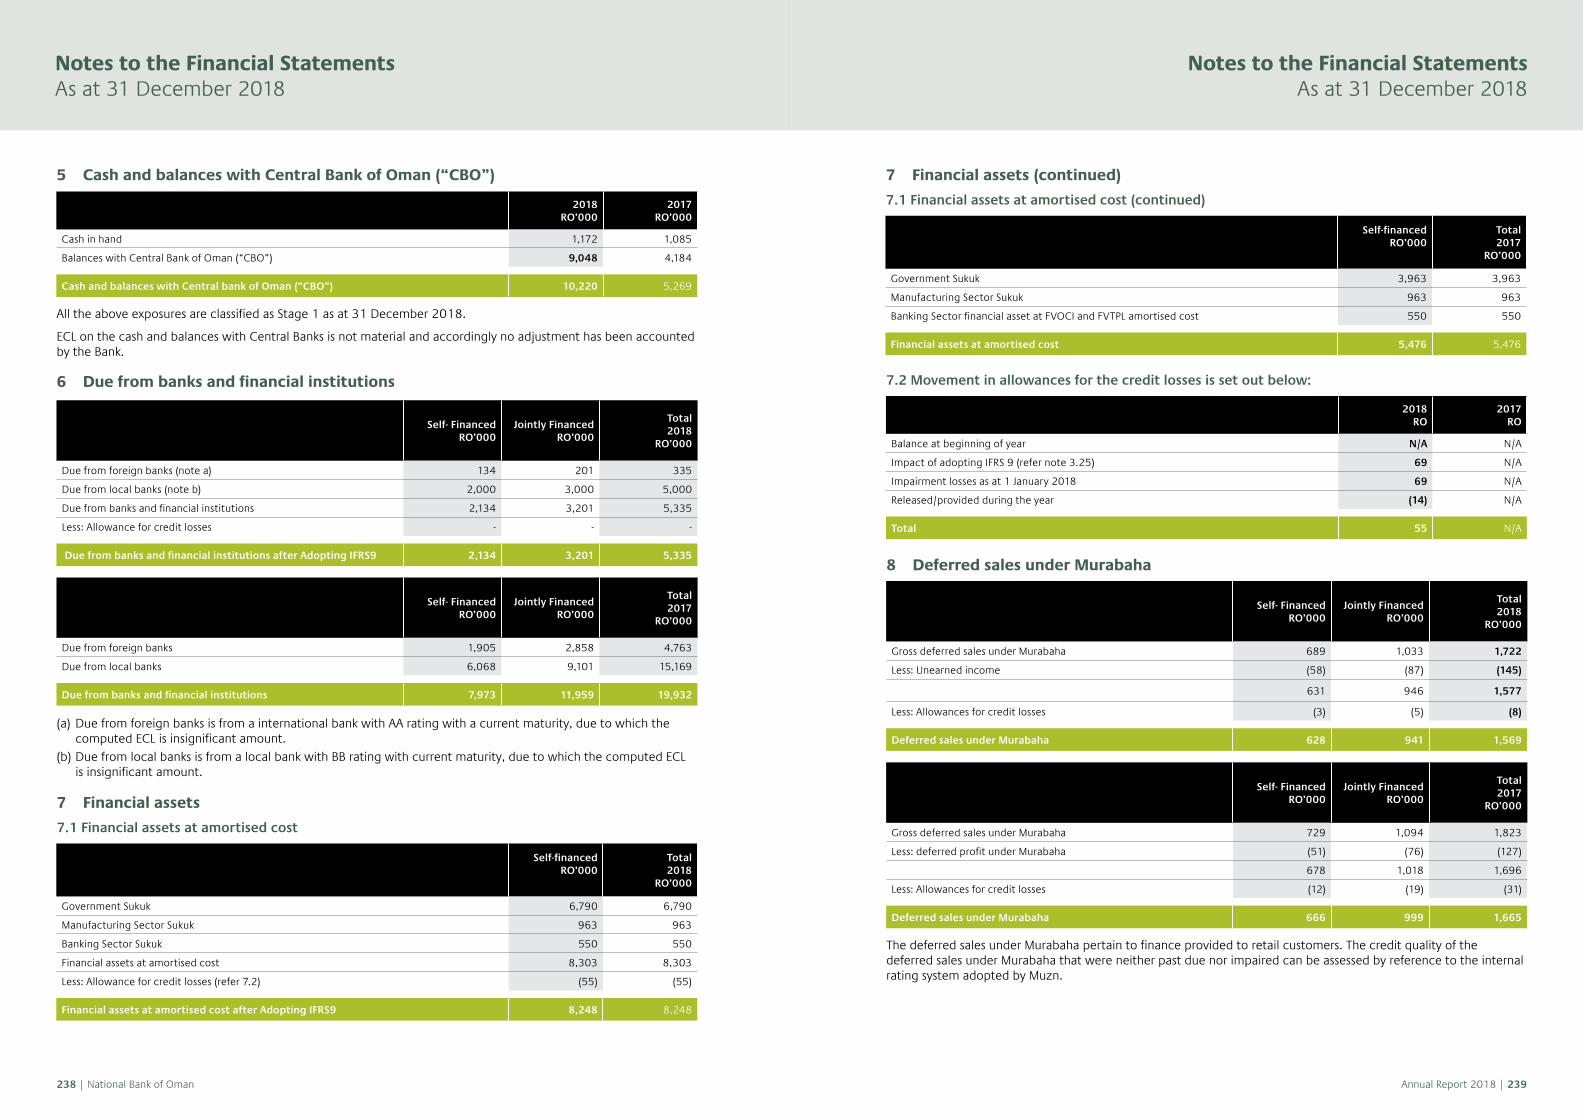
7 Financial assets
7.1 Financial assets at amortised cost
6 Due from banks and financial institutions
2018RO’000
2017RO’000
Cash in hand 1,172 1,085
Balances with Central Bank of Oman (“CBO”) 9,048 4,184
Cash and balances with Central bank of Oman (“CBO”) 10,220 5,269
Self-financedRO’000
Total 2018
RO’000
Government Sukuk 6,790 6,790
Manufacturing Sector Sukuk 963 963
Banking Sector Sukuk 550 550
Financial assets at amortised cost 8,303 8,303
Less: Allowance for credit losses (refer 7.2) (55) (55)
Financial assets at amortised cost after Adopting IFRS9 8,248 8,248
All the above exposures are classified as Stage 1 as at 31 December 2018.
ECL on the cash and balances with Central Banks is not material and accordingly no adjustment has been accounted by the Bank.
Self- FinancedRO’000
Jointly FinancedRO’000
Total 2018
RO’000
Due from foreign banks (note a) 134 201 335
Due from local banks (note b) 2,000 3,000 5,000
Due from banks and financial institutions 2,134 3,201 5,335
Less: Allowance for credit losses - - -
Due from banks and financial institutions after Adopting IFRS9 2,134 3,201 5,335
Self- FinancedRO’000
Jointly FinancedRO’000
Total 2017
RO’000
Due from foreign banks 1,905 2,858 4,763
Due from local banks 6,068 9,101 15,169
Due from banks and financial institutions 7,973 11,959 19,932
(a) Due from foreign banks is from a international bank with AA rating with a current maturity, due to which the computed ECL is insignificant amount.
(b) Due from local banks is from a local bank with BB rating with current maturity, due to which the computed ECL is insignificant amount.
5 Cash and balances with Central Bank of Oman (“CBO”) 7 Financial assets (continued)
7.1 Financial assets at amortised cost (continued)
7.2 Movement in allowances for the credit losses is set out below:
8 Deferred sales under Murabaha
2018RO
2017RO
Balance at beginning of year N/A N/A
Impact of adopting IFRS 9 (refer note 3.25) 69 N/A
Impairment losses as at 1 January 2018 69 N/A
Released/provided during the year (14) N/A
Total 55 N/A
Self-financedRO’000
Total 2017
RO’000
Government Sukuk 3,963 3,963
Manufacturing Sector Sukuk 963 963
Banking Sector financial asset at FVOCI and FVTPL amortised cost 550 550
Financial assets at amortised cost 5,476 5,476
Self- FinancedRO’000
Jointly FinancedRO’000
Total 2018
RO’000
Gross deferred sales under Murabaha 689 1,033 1,722
Less: Unearned income (58) (87) (145)
631 946 1,577
Less: Allowances for credit losses (3) (5) (8)
Deferred sales under Murabaha 628 941 1,569
Self- FinancedRO’000
Jointly FinancedRO’000
Total 2017
RO’000
Gross deferred sales under Murabaha 729 1,094 1,823
Less: deferred profit under Murabaha (51) (76) (127)
678 1,018 1,696
Less: Allowances for credit losses (12) (19) (31)
Deferred sales under Murabaha 666 999 1,665
The deferred sales under Murabaha pertain to finance provided to retail customers. The credit quality of the deferred sales under Murabaha that were neither past due nor impaired can be assessed by reference to the internal rating system adopted by Muzn.
Notes to the Financial StatementsAs at 31 December 2018
Notes to the Financial StatementsAs at 31 December 2018
238 | National Bank of Oman Annual Report 2018 | 239
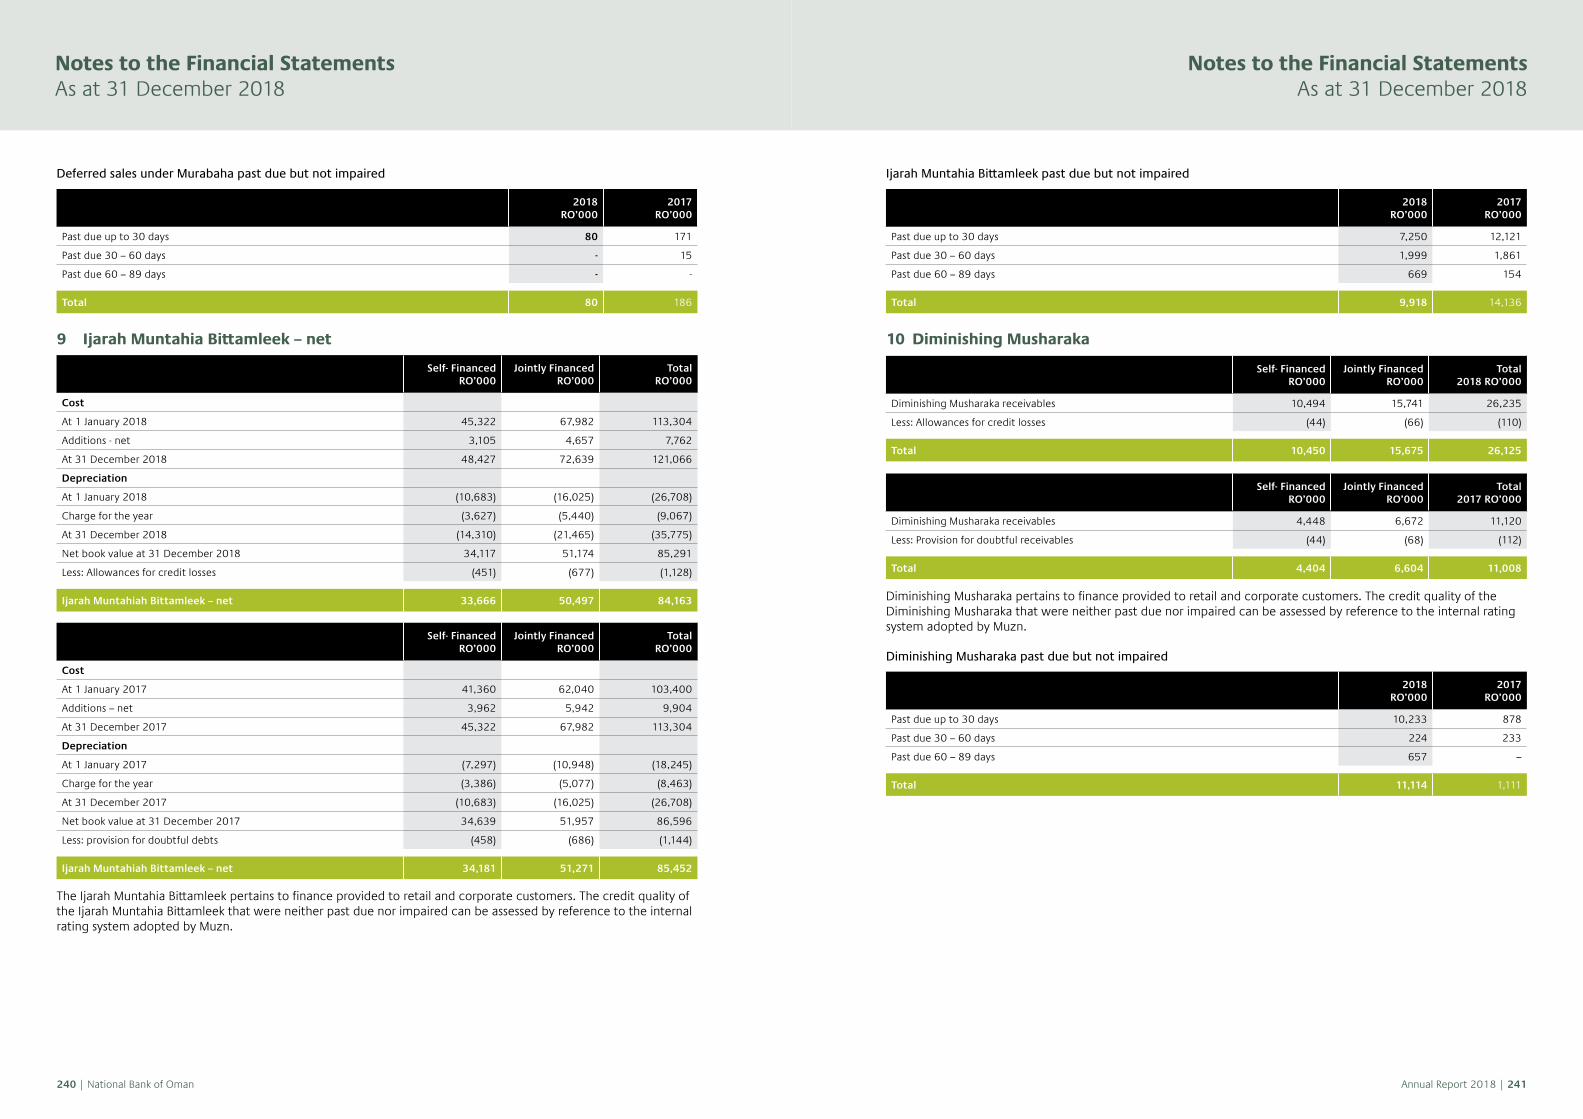
Deferred sales under Murabaha past due but not impaired
2018RO’000
2017RO’000
Past due up to 30 days 80 171
Past due 30 – 60 days - 15
Past due 60 – 89 days - -
Total 80 186
9 Ijarah Muntahia Bittamleek – net
Self- FinancedRO’000
Jointly FinancedRO’000
Total RO’000
Cost
At 1 January 2018 45,322 67,982 113,304
Additions - net 3,105 4,657 7,762
At 31 December 2018 48,427 72,639 121,066
Depreciation
At 1 January 2018 (10,683) (16,025) (26,708)
Charge for the year (3,627) (5,440) (9,067)
At 31 December 2018 (14,310) (21,465) (35,775)
Net book value at 31 December 2018 34,117 51,174 85,291
Less: Allowances for credit losses (451) (677) (1,128)
Ijarah Muntahiah Bittamleek – net 33,666 50,497 84,163
Self- FinancedRO’000
Jointly FinancedRO’000
Total RO’000
Cost
At 1 January 2017 41,360 62,040 103,400
Additions – net 3,962 5,942 9,904
At 31 December 2017 45,322 67,982 113,304
Depreciation
At 1 January 2017 (7,297) (10,948) (18,245)
Charge for the year (3,386) (5,077) (8,463)
At 31 December 2017 (10,683) (16,025) (26,708)
Net book value at 31 December 2017 34,639 51,957 86,596
Less: provision for doubtful debts (458) (686) (1,144)
Ijarah Muntahiah Bittamleek – net 34,181 51,271 85,452
The Ijarah Muntahia Bittamleek pertains to finance provided to retail and corporate customers. The credit quality of the Ijarah Muntahia Bittamleek that were neither past due nor impaired can be assessed by reference to the internal rating system adopted by Muzn.
Ijarah Muntahia Bittamleek past due but not impaired
Diminishing Musharaka past due but not impaired
2018RO’000
2017RO’000
Past due up to 30 days 7,250 12,121
Past due 30 – 60 days 1,999 1,861
Past due 60 – 89 days 669 154
Total 9,918 14,136
2018RO’000
2017RO’000
Past due up to 30 days 10,233 878
Past due 30 – 60 days 224 233
Past due 60 – 89 days 657 –
Total 11,114 1,111
10 Diminishing Musharaka
Self- FinancedRO’000
Jointly FinancedRO’000
Total 2018 RO’000
Diminishing Musharaka receivables 10,494 15,741 26,235
Less: Allowances for credit losses (44) (66) (110)
Total 10,450 15,675 26,125
Self- FinancedRO’000
Jointly FinancedRO’000
Total 2017 RO’000
Diminishing Musharaka receivables 4,448 6,672 11,120
Less: Provision for doubtful receivables (44) (68) (112)
Total 4,404 6,604 11,008
Diminishing Musharaka pertains to finance provided to retail and corporate customers. The credit quality of the Diminishing Musharaka that were neither past due nor impaired can be assessed by reference to the internal rating system adopted by Muzn.
Notes to the Financial StatementsAs at 31 December 2018
Notes to the Financial StatementsAs at 31 December 2018
240 | National Bank of Oman Annual Report 2018 | 241
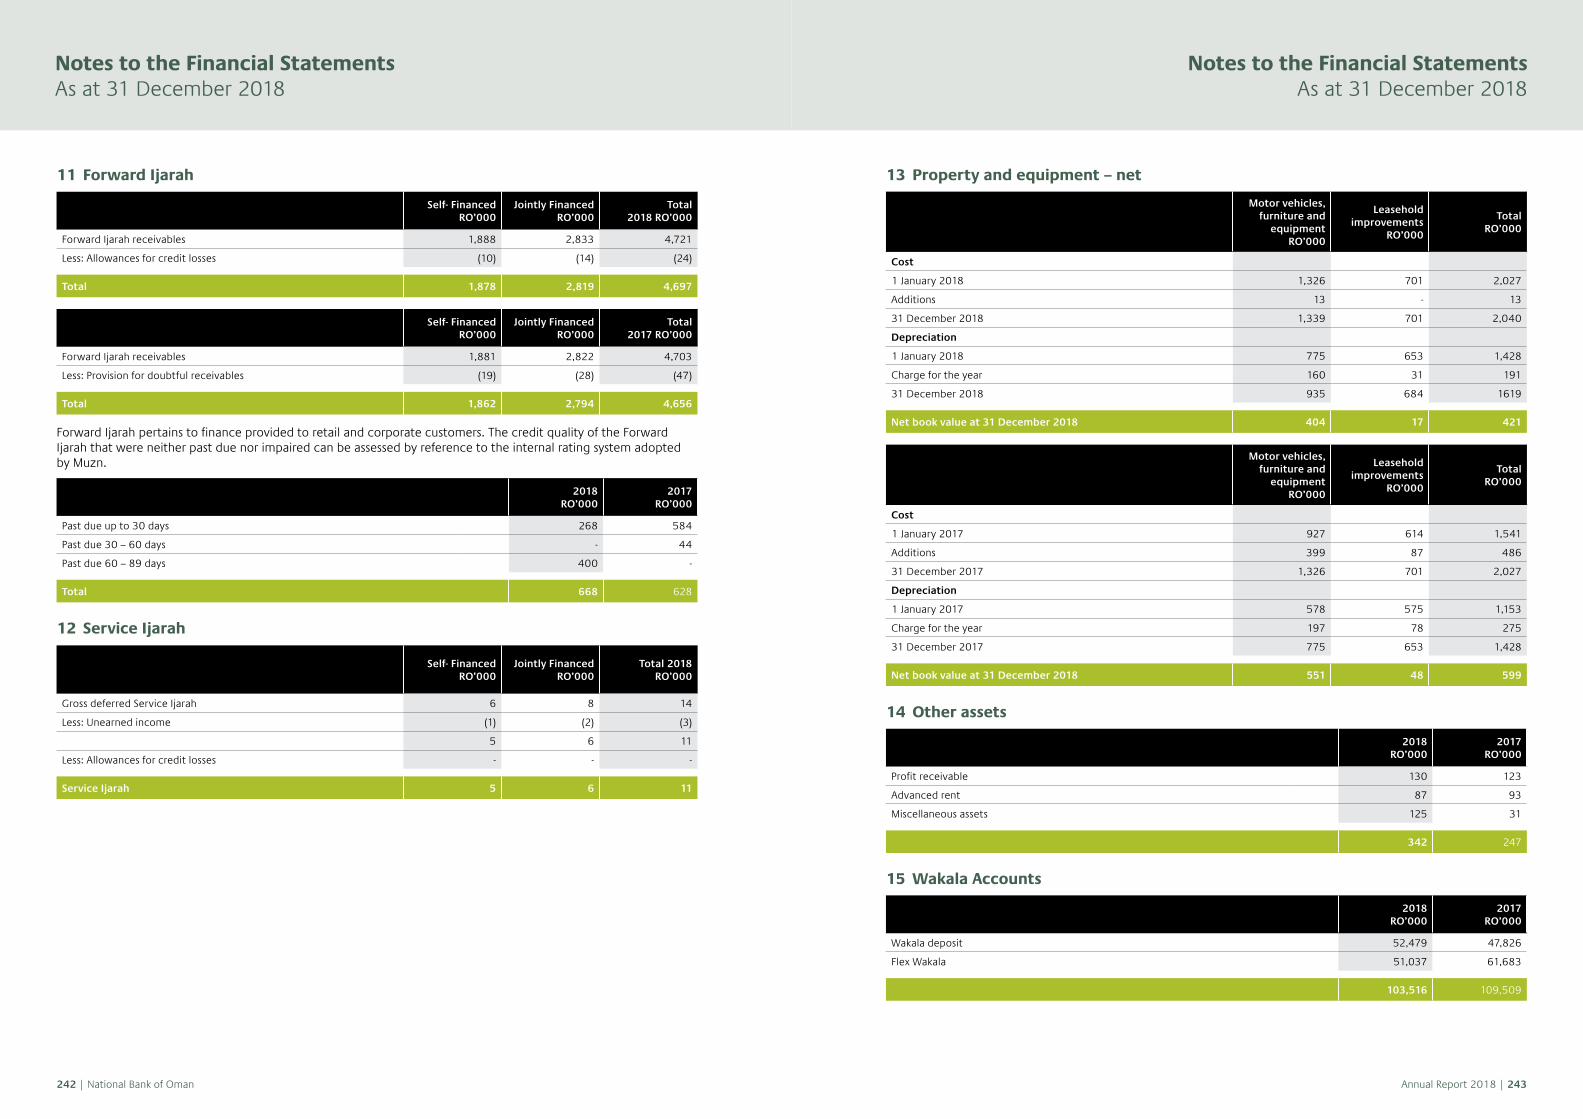
2018RO’000
2017RO’000
Past due up to 30 days 268 584
Past due 30 – 60 days - 44
Past due 60 – 89 days 400 -
Total 668 628
11 Forward Ijarah
12 Service Ijarah
Self- FinancedRO’000
Jointly FinancedRO’000
Total 2018 RO’000
Forward Ijarah receivables 1,888 2,833 4,721
Less: Allowances for credit losses (10) (14) (24)
Total 1,878 2,819 4,697
Self- FinancedRO’000
Jointly FinancedRO’000
Total 2018RO’000
Gross deferred Service Ijarah 6 8 14
Less: Unearned income (1) (2) (3)
5 6 11
Less: Allowances for credit losses - - -
Service Ijarah 5 6 11
Self- FinancedRO’000
Jointly FinancedRO’000
Total 2017 RO’000
Forward Ijarah receivables 1,881 2,822 4,703
Less: Provision for doubtful receivables (19) (28) (47)
Total 1,862 2,794 4,656
Forward Ijarah pertains to finance provided to retail and corporate customers. The credit quality of the Forward Ijarah that were neither past due nor impaired can be assessed by reference to the internal rating system adopted by Muzn.
2018RO’000
2017RO’000
Profit receivable 130 123
Advanced rent 87 93
Miscellaneous assets 125 31
342 247
2018RO’000
2017RO’000
Wakala deposit 52,479 47,826
Flex Wakala 51,037 61,683
103,516 109,509
14 Other assets
15 Wakala Accounts
13 Property and equipment – net
Motor vehicles, furniture and
equipmentRO’000
Leasehold improvements
RO’000
Total RO’000
Cost
1 January 2018 1,326 701 2,027
Additions 13 - 13
31 December 2018 1,339 701 2,040
Depreciation
1 January 2018 775 653 1,428
Charge for the year 160 31 191
31 December 2018 935 684 1619
Net book value at 31 December 2018 404 17 421
Motor vehicles, furniture and
equipmentRO’000
Leasehold improvements
RO’000
Total RO’000
Cost
1 January 2017 927 614 1,541
Additions 399 87 486
31 December 2017 1,326 701 2,027
Depreciation
1 January 2017 578 575 1,153
Charge for the year 197 78 275
31 December 2017 775 653 1,428
Net book value at 31 December 2018 551 48 599
Notes to the Financial StatementsAs at 31 December 2018
Notes to the Financial StatementsAs at 31 December 2018
242 | National Bank of Oman Annual Report 2018 | 243
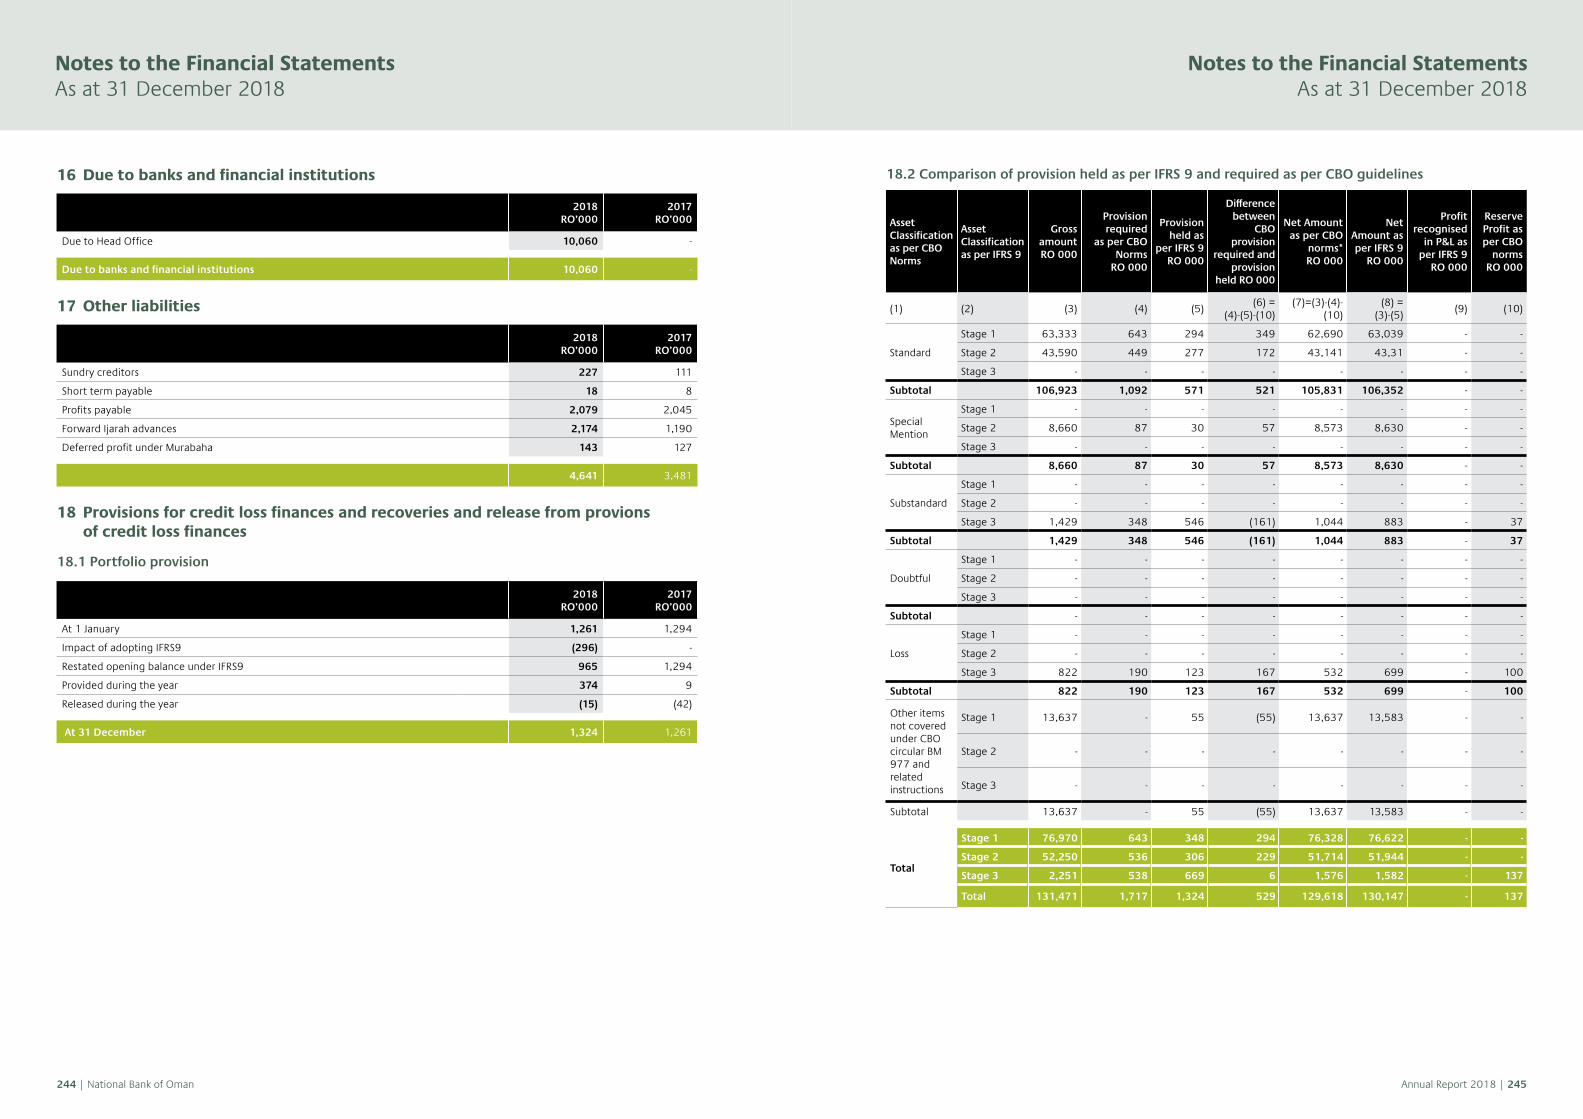
16 Due to banks and financial institutions
17 Other liabilities
18 Provisions for credit loss finances and recoveries and release from provions of credit loss finances
18.1 Portfolio provision
2018RO’000
2017RO’000
Due to Head Office 10,060 -
Due to banks and financial institutions 10,060 -
2018RO’000
2017RO’000
Sundry creditors 227 111
Short term payable 18 8
Profits payable 2,079 2,045
Forward Ijarah advances 2,174 1,190
Deferred profit under Murabaha 143 127
4,641 3,481
2018RO’000
2017RO’000
At 1 January 1,261 1,294
Impact of adopting IFRS9 (296) -
Restated opening balance under IFRS9 965 1,294
Provided during the year 374 9
Released during the year (15) (42)
At 31 December 1,324 1,261
Asset Classification as per CBO Norms
Asset Classification as per IFRS 9
Gross amountRO 000
Provision required
as per CBO Norms
RO 000
Provision held as
per IFRS 9RO 000
Difference between
CBO provision
required and provision
held RO 000
Net Amount as per CBO
norms*RO 000
Net Amount as per IFRS 9
RO 000
Profit recognised
in P&L as per IFRS 9
RO 000
Reserve Profit as per CBO
normsRO 000
(1) (2) (3) (4) (5)(6) =
(4)-(5)-(10)(7)=(3)-(4)-
(10)(8) =
(3)-(5)(9) (10)
Standard
Stage 1 63,333 643 294 349 62,690 63,039 - -
Stage 2 43,590 449 277 172 43,141 43,31 - -
Stage 3 - - - - - - - -
Subtotal 106,923 1,092 571 521 105,831 106,352 - -
Special Mention
Stage 1 - - - - - - - -
Stage 2 8,660 87 30 57 8,573 8,630 - -
Stage 3 - - - - - - - -
Subtotal 8,660 87 30 57 8,573 8,630 - -
Substandard
Stage 1 - - - - - - - -
Stage 2 - - - - - - - -
Stage 3 1,429 348 546 (161) 1,044 883 - 37
Subtotal 1,429 348 546 (161) 1,044 883 - 37
Doubtful
Stage 1 - - - - - - - -
Stage 2 - - - - - - - -
Stage 3 - - - - - - - -
Subtotal - - - - - - - -
Loss
Stage 1 - - - - - - - -
Stage 2 - - - - - - - -
Stage 3 822 190 123 167 532 699 - 100
Subtotal 822 190 123 167 532 699 - 100
Other items not covered under CBO circular BM 977 and related instructions
Stage 1 13,637 - 55 (55) 13,637 13,583 - -
Stage 2 - - - - - - - -
Stage 3 - - - - - - - -
Subtotal 13,637 - 55 (55) 13,637 13,583 - -
Total
Stage 1 76,970 643 348 294 76,328 76,622 - -
Stage 2 52,250 536 306 229 51,714 51,944 - -
Stage 3 2,251 538 669 6 1,576 1,582 - 137
Total 131,471 1,717 1,324 529 129,618 130,147 - 137
18.2 Comparison of provision held as per IFRS 9 and required as per CBO guidelines
Notes to the Financial StatementsAs at 31 December 2018
Notes to the Financial StatementsAs at 31 December 2018
244 | National Bank of Oman Annual Report 2018 | 245
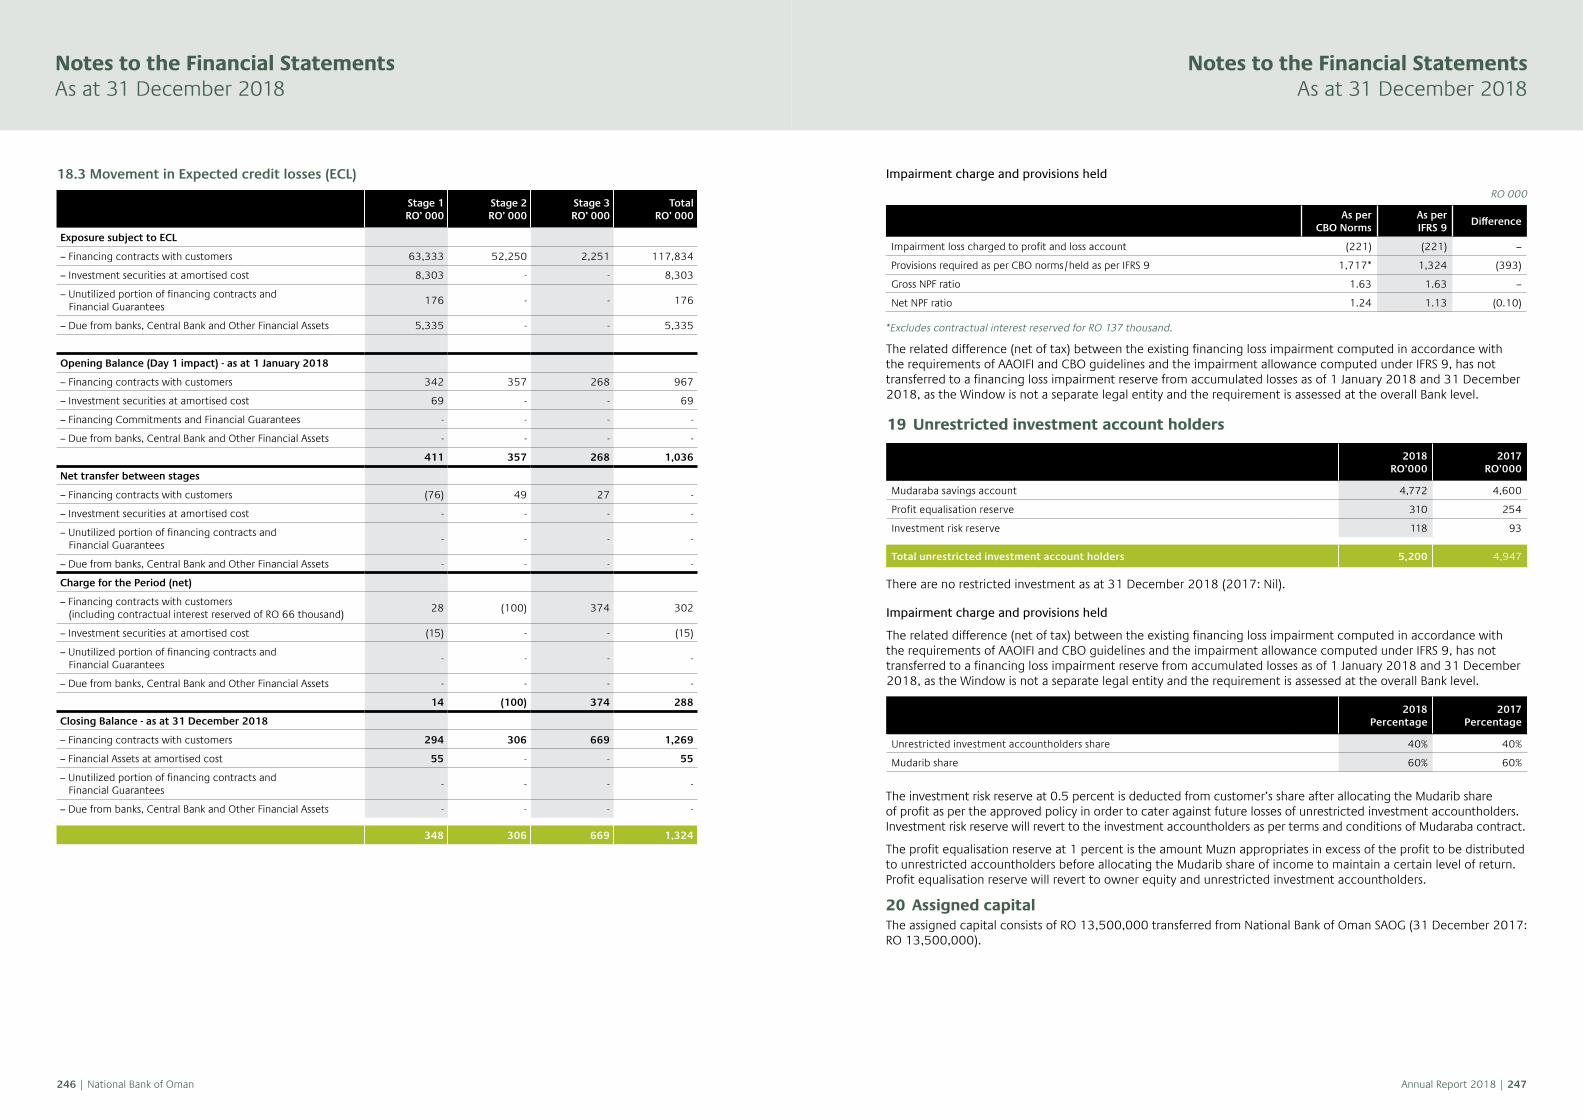
18.3 Movement in Expected credit losses (ECL)
Stage 1 RO’ 000
Stage 2 RO’ 000
Stage 3 RO’ 000
Total RO’ 000
Exposure subject to ECL
– Financing contracts with customers 63,333 52,250 2,251 117,834
– Investment securities at amortised cost 8,303 - - 8,303
– Unutilized portion of financing contracts and Financial Guarantees
176 - - 176
– Due from banks, Central Bank and Other Financial Assets 5,335 - - 5,335
Opening Balance (Day 1 impact) - as at 1 January 2018
– Financing contracts with customers 342 357 268 967
– Investment securities at amortised cost 69 - - 69
– Financing Commitments and Financial Guarantees - - - -
– Due from banks, Central Bank and Other Financial Assets - - - -
411 357 268 1,036
Net transfer between stages
– Financing contracts with customers (76) 49 27 -
– Investment securities at amortised cost - - - -
– Unutilized portion of financing contracts and Financial Guarantees
- - - -
– Due from banks, Central Bank and Other Financial Assets - - - -
Charge for the Period (net)
– Financing contracts with customers (including contractual interest reserved of RO 66 thousand)
28 (100) 374 302
– Investment securities at amortised cost (15) - - (15)
– Unutilized portion of financing contracts and Financial Guarantees
- - - -
– Due from banks, Central Bank and Other Financial Assets - - - -
14 (100) 374 288
Closing Balance - as at 31 December 2018
– Financing contracts with customers 294 306 669 1,269
– Financial Assets at amortised cost 55 - - 55
– Unutilized portion of financing contracts and Financial Guarantees
- - - -
– Due from banks, Central Bank and Other Financial Assets - - - -
348 306 669 1,324
As per CBO Norms
As per IFRS 9
Difference
Impairment loss charged to profit and loss account (221) (221) –
Provisions required as per CBO norms/held as per IFRS 9 1,717* 1,324 (393)
Gross NPF ratio 1.63 1.63 –
Net NPF ratio 1.24 1.13 (0.10)
RO 000
*Excludes contractual interest reserved for RO 137 thousand.
There are no restricted investment as at 31 December 2018 (2017: Nil).
The related difference (net of tax) between the existing financing loss impairment computed in accordance with the requirements of AAOIFI and CBO guidelines and the impairment allowance computed under IFRS 9, has not transferred to a financing loss impairment reserve from accumulated losses as of 1 January 2018 and 31 December 2018, as the Window is not a separate legal entity and the requirement is assessed at the overall Bank level.
Impairment charge and provisions held
2018RO’000
2017RO’000
Mudaraba savings account 4,772 4,600
Profit equalisation reserve 310 254
Investment risk reserve 118 93
Total unrestricted investment account holders 5,200 4,947
2018Percentage
2017Percentage
Unrestricted investment accountholders share 40% 40%
Mudarib share 60% 60%
19 Unrestricted investment account holders
Impairment charge and provisions held
The related difference (net of tax) between the existing financing loss impairment computed in accordance with the requirements of AAOIFI and CBO guidelines and the impairment allowance computed under IFRS 9, has not transferred to a financing loss impairment reserve from accumulated losses as of 1 January 2018 and 31 December 2018, as the Window is not a separate legal entity and the requirement is assessed at the overall Bank level.
The investment risk reserve at 0.5 percent is deducted from customer’s share after allocating the Mudarib share of profit as per the approved policy in order to cater against future losses of unrestricted investment accountholders. Investment risk reserve will revert to the investment accountholders as per terms and conditions of Mudaraba contract.
The profit equalisation reserve at 1 percent is the amount Muzn appropriates in excess of the profit to be distributed to unrestricted accountholders before allocating the Mudarib share of income to maintain a certain level of return. Profit equalisation reserve will revert to owner equity and unrestricted investment accountholders.
20 Assigned capitalThe assigned capital consists of RO 13,500,000 transferred from National Bank of Oman SAOG (31 December 2017: RO 13,500,000).
Notes to the Financial StatementsAs at 31 December 2018
Notes to the Financial StatementsAs at 31 December 2018
246 | National Bank of Oman Annual Report 2018 | 247
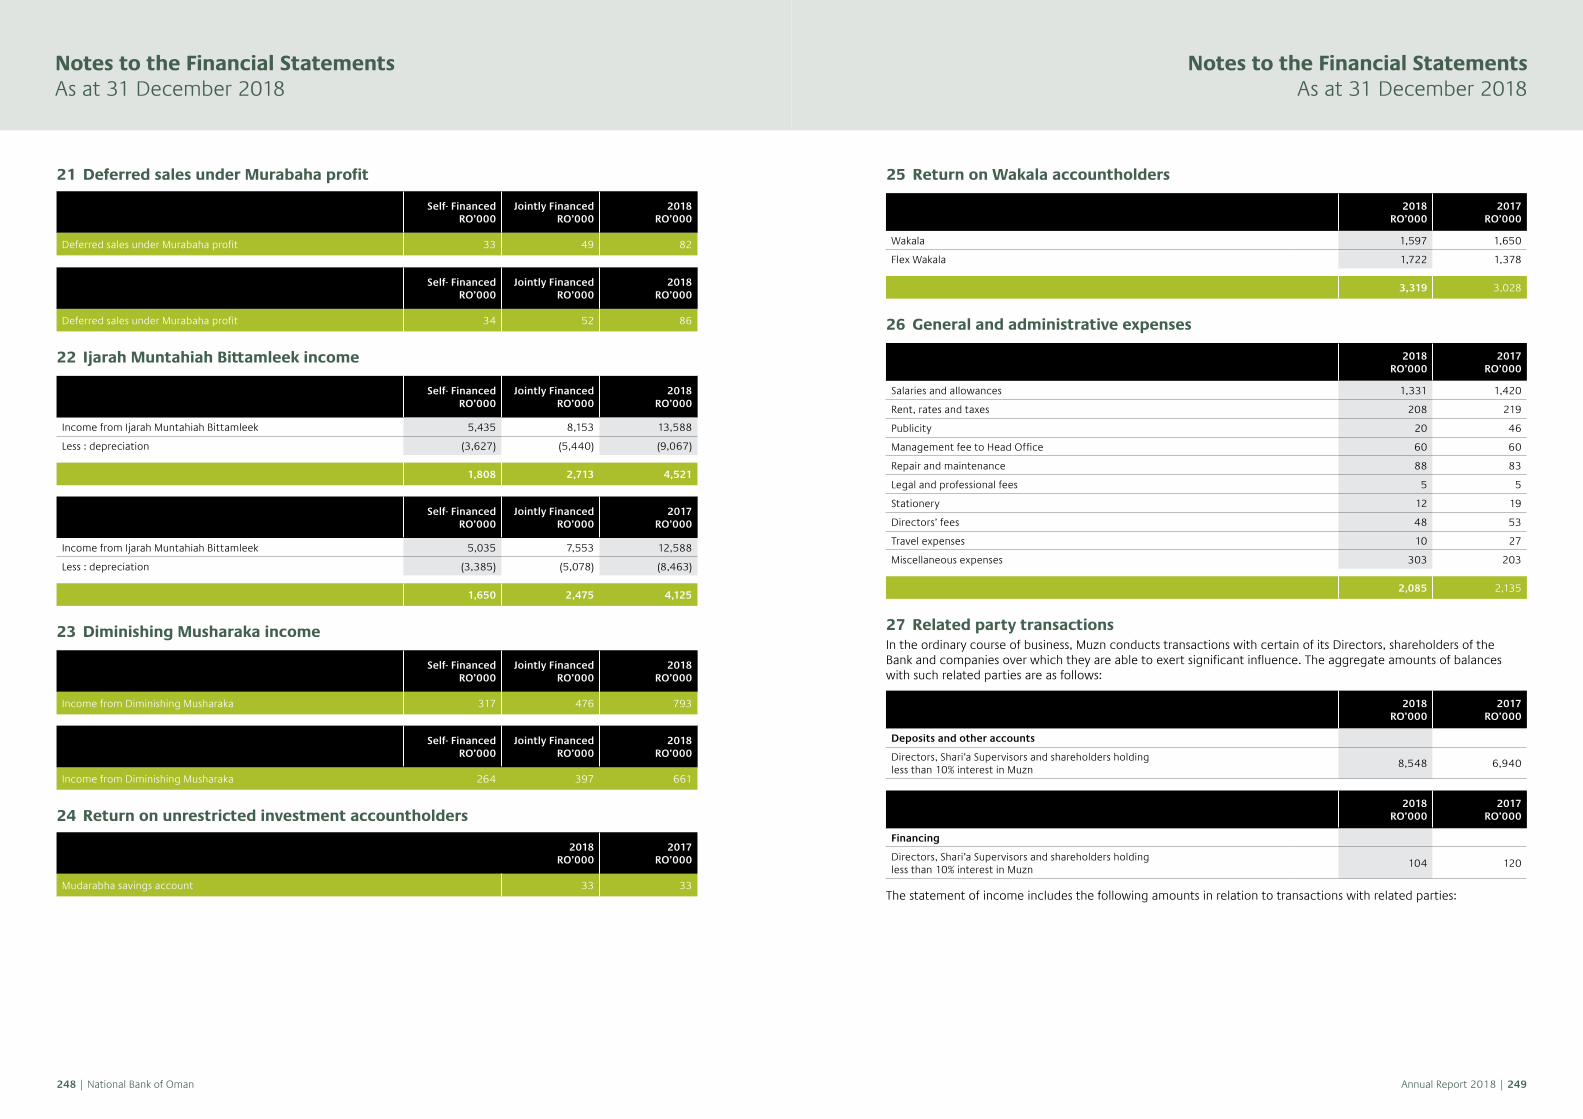
Self- FinancedRO’000
Jointly FinancedRO’000
2018RO’000
Deferred sales under Murabaha profit 33 49 82
2018RO’000
2017RO’000
Mudarabha savings account 33 33
Self- FinancedRO’000
Jointly FinancedRO’000
2018RO’000
Income from Diminishing Musharaka 317 476 793
Self- FinancedRO’000
Jointly FinancedRO’000
2018RO’000
Income from Diminishing Musharaka 264 397 661
Self- FinancedRO’000
Jointly FinancedRO’000
2018RO’000
Deferred sales under Murabaha profit 34 52 86
21 Deferred sales under Murabaha profit
22 Ijarah Muntahiah Bittamleek income
Self- FinancedRO’000
Jointly FinancedRO’000
2018RO’000
Income from Ijarah Muntahiah Bittamleek 5,435 8,153 13,588
Less : depreciation (3,627) (5,440) (9,067)
1,808 2,713 4,521
Self- FinancedRO’000
Jointly FinancedRO’000
2017RO’000
Income from Ijarah Muntahiah Bittamleek 5,035 7,553 12,588
Less : depreciation (3,385) (5,078) (8,463)
1,650 2,475 4,125
23 Diminishing Musharaka income
24 Return on unrestricted investment accountholders
2018RO’000
2017RO’000
Wakala 1,597 1,650
Flex Wakala 1,722 1,378
3,319 3,028
2018RO’000
2017RO’000
Salaries and allowances 1,331 1,420
Rent, rates and taxes 208 219
Publicity 20 46
Management fee to Head Office 60 60
Repair and maintenance 88 83
Legal and professional fees 5 5
Stationery 12 19
Directors’ fees 48 53
Travel expenses 10 27
Miscellaneous expenses 303 203
2,085 2,135
2018RO’000
2017RO’000
Deposits and other accounts
Directors, Shari’a Supervisors and shareholders holding less than 10% interest in Muzn
8,548 6,940
2018RO’000
2017RO’000
Financing
Directors, Shari’a Supervisors and shareholders holding less than 10% interest in Muzn
104 120
25 Return on Wakala accountholders
26 General and administrative expenses
27 Related party transactionsIn the ordinary course of business, Muzn conducts transactions with certain of its Directors, shareholders of the Bank and companies over which they are able to exert significant influence. The aggregate amounts of balances with such related parties are as follows:
The statement of income includes the following amounts in relation to transactions with related parties:
Notes to the Financial StatementsAs at 31 December 2018
Notes to the Financial StatementsAs at 31 December 2018
248 | National Bank of Oman Annual Report 2018 | 249
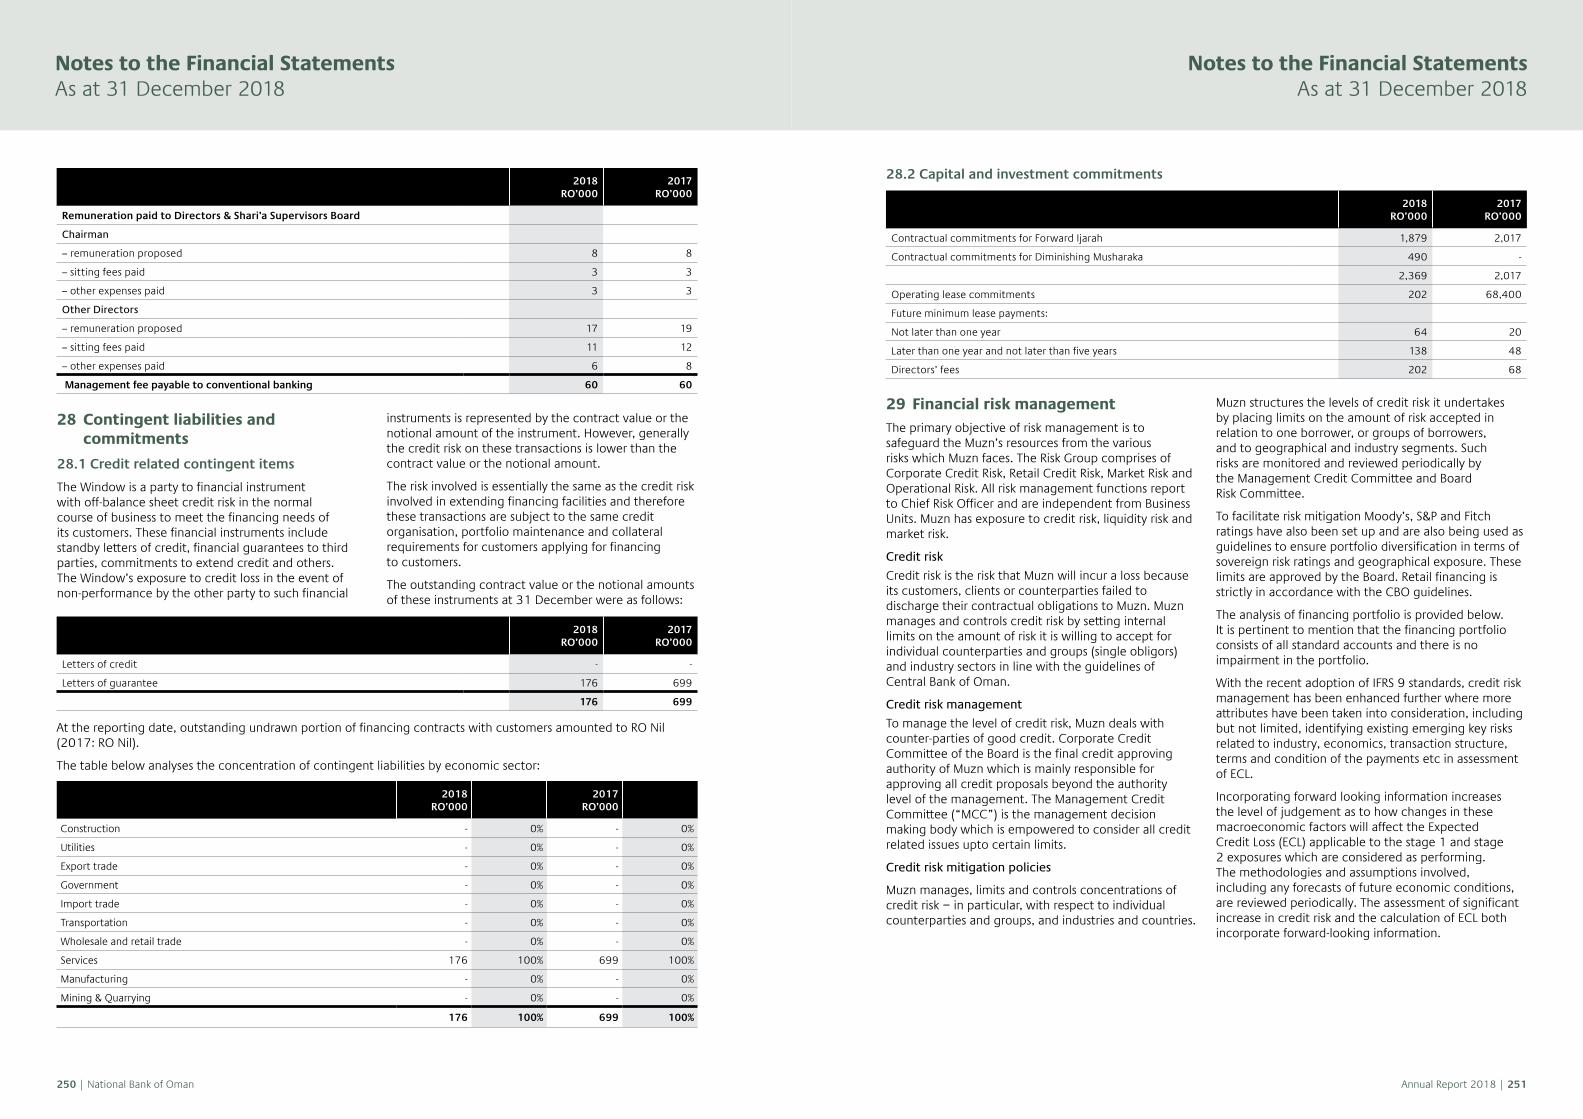
2018RO’000
2017RO’000
Remuneration paid to Directors & Shari’a Supervisors Board
Chairman
– remuneration proposed 8 8
– sitting fees paid 3 3
– other expenses paid 3 3
Other Directors
– remuneration proposed 17 19
– sitting fees paid 11 12
– other expenses paid 6 8
Management fee payable to conventional banking 60 60
28 Contingent liabilities and commitments
28.1 Credit related contingent items
The Window is a party to financial instrument with off-balance sheet credit risk in the normal course of business to meet the financing needs of its customers. These financial instruments include standby letters of credit, financial guarantees to third parties, commitments to extend credit and others. The Window’s exposure to credit loss in the event of non-performance by the other party to such financial
instruments is represented by the contract value or the notional amount of the instrument. However, generally the credit risk on these transactions is lower than the contract value or the notional amount.
The risk involved is essentially the same as the credit risk involved in extending financing facilities and therefore these transactions are subject to the same credit organisation, portfolio maintenance and collateral requirements for customers applying for financing to customers.
The outstanding contract value or the notional amounts of these instruments at 31 December were as follows:
2018RO’000
2017RO’000
Letters of credit - -
Letters of guarantee 176 699
176 699
At the reporting date, outstanding undrawn portion of financing contracts with customers amounted to RO Nil (2017: RO Nil).
The table below analyses the concentration of contingent liabilities by economic sector:
2018
RO’000
2017RO’000
Construction - 0% - 0%
Utilities - 0% - 0%
Export trade - 0% - 0%
Government - 0% - 0%
Import trade - 0% - 0%
Transportation - 0% - 0%
Wholesale and retail trade - 0% - 0%
Services 176 100% 699 100%
Manufacturing - 0% - 0%
Mining & Quarrying - 0% - 0%
176 100% 699 100%
29 Financial risk managementThe primary objective of risk management is to safeguard the Muzn’s resources from the various risks which Muzn faces. The Risk Group comprises of Corporate Credit Risk, Retail Credit Risk, Market Risk and Operational Risk. All risk management functions report to Chief Risk Officer and are independent from Business Units. Muzn has exposure to credit risk, liquidity risk and market risk.
Credit risk
Credit risk is the risk that Muzn will incur a loss because its customers, clients or counterparties failed to discharge their contractual obligations to Muzn. Muzn manages and controls credit risk by setting internal limits on the amount of risk it is willing to accept for individual counterparties and groups (single obligors) and industry sectors in line with the guidelines of Central Bank of Oman.
Credit risk management
To manage the level of credit risk, Muzn deals with counter-parties of good credit. Corporate Credit Committee of the Board is the final credit approving authority of Muzn which is mainly responsible for approving all credit proposals beyond the authority level of the management. The Management Credit Committee (“MCC”) is the management decision making body which is empowered to consider all credit related issues upto certain limits.
Credit risk mitigation policies
Muzn manages, limits and controls concentrations of credit risk − in particular, with respect to individual counterparties and groups, and industries and countries.
Muzn structures the levels of credit risk it undertakes by placing limits on the amount of risk accepted in relation to one borrower, or groups of borrowers, and to geographical and industry segments. Such risks are monitored and reviewed periodically by the Management Credit Committee and Board Risk Committee.
To facilitate risk mitigation Moody’s, S&P and Fitch ratings have also been set up and are also being used as guidelines to ensure portfolio diversification in terms of sovereign risk ratings and geographical exposure. These limits are approved by the Board. Retail financing is strictly in accordance with the CBO guidelines.
The analysis of financing portfolio is provided below. It is pertinent to mention that the financing portfolio consists of all standard accounts and there is no impairment in the portfolio.
With the recent adoption of IFRS 9 standards, credit risk management has been enhanced further where more attributes have been taken into consideration, including but not limited, identifying existing emerging key risks related to industry, economics, transaction structure, terms and condition of the payments etc in assessment of ECL.
Incorporating forward looking information increases the level of judgement as to how changes in these macroeconomic factors will affect the Expected Credit Loss (ECL) applicable to the stage 1 and stage 2 exposures which are considered as performing. The methodologies and assumptions involved, including any forecasts of future economic conditions, are reviewed periodically. The assessment of significant increase in credit risk and the calculation of ECL both incorporate forward-looking information.
28.2 Capital and investment commitments
2018RO’000
2017RO’000
Contractual commitments for Forward Ijarah 1,879 2,017
Contractual commitments for Diminishing Musharaka 490 -
2,369 2,017
Operating lease commitments 202 68,400
Future minimum lease payments:
Not later than one year 64 20
Later than one year and not later than five years 138 48
Directors’ fees 202 68
Notes to the Financial StatementsAs at 31 December 2018
Notes to the Financial StatementsAs at 31 December 2018
250 | National Bank of Oman Annual Report 2018 | 251
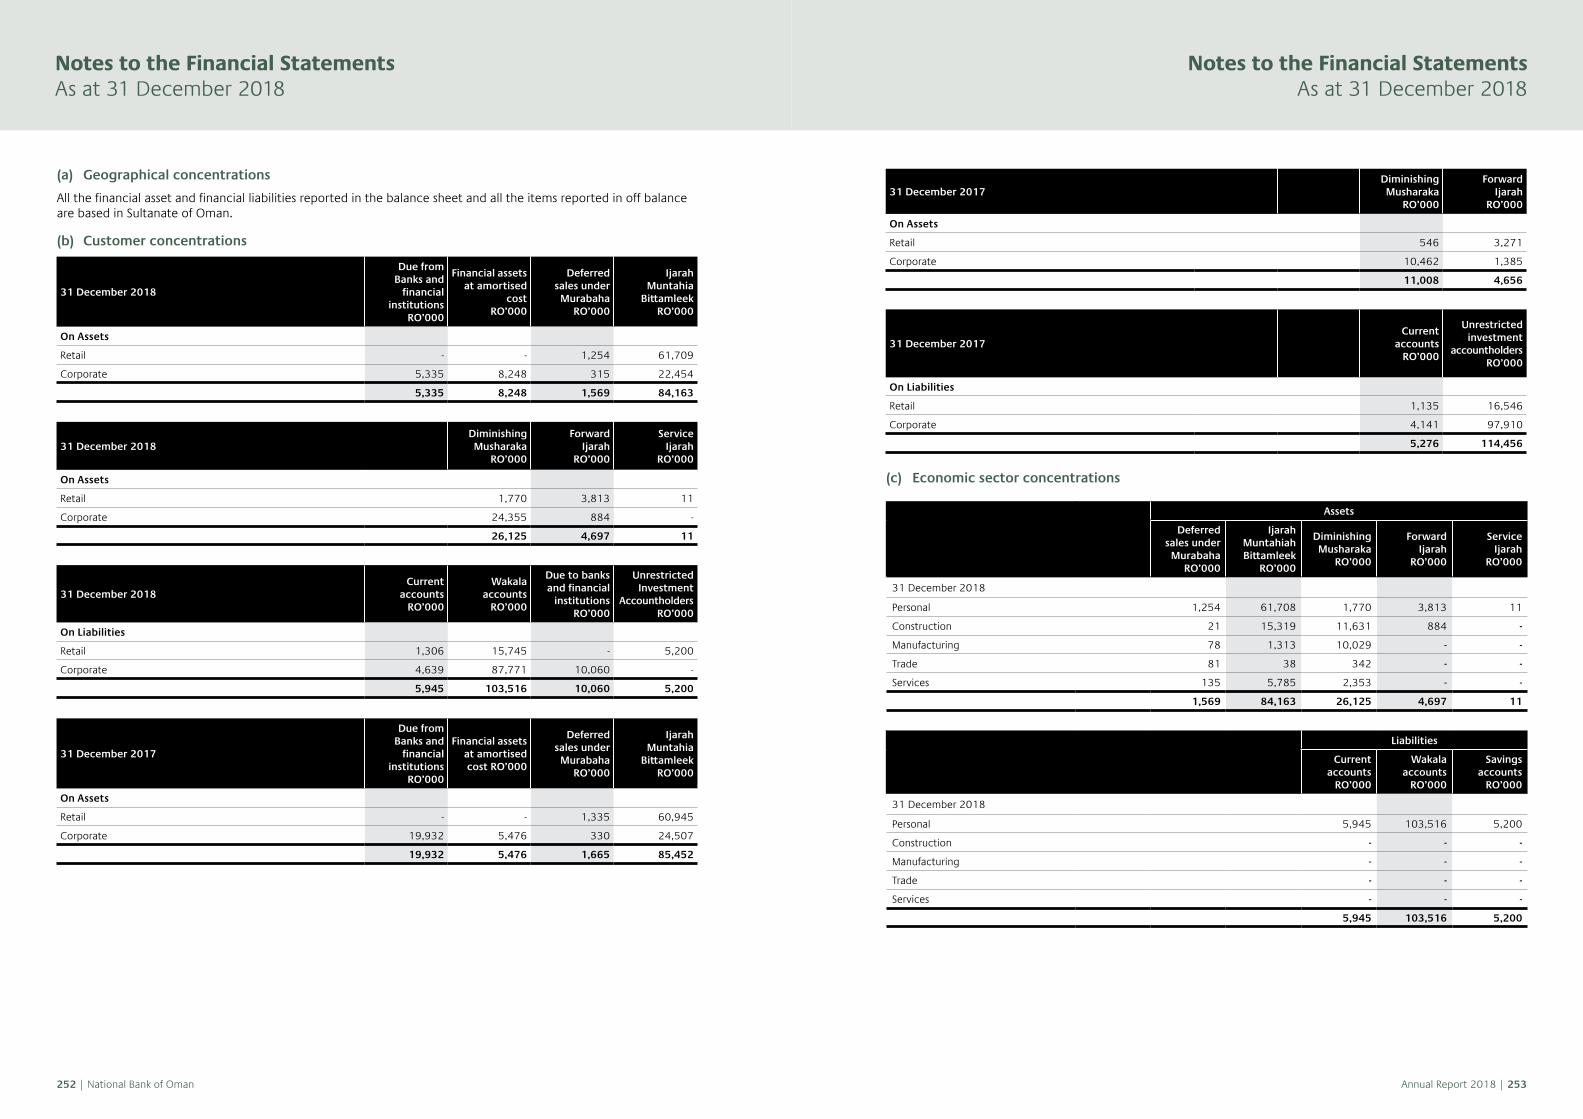
(a) Geographical concentrations
All the financial asset and financial liabilities reported in the balance sheet and all the items reported in off balance are based in Sultanate of Oman.
(b) Customer concentrations
31 December 2018
Due from Banks and
financial institutions
RO’000
Financial assets at amortised
cost RO’000
Deferred sales under
MurabahaRO’000
Ijarah Muntahia
BittamleekRO’000
On Assets
Retail - - 1,254 61,709
Corporate 5,335 8,248 315 22,454
5,335 8,248 1,569 84,163
31 December 2018Current
accountsRO’000
Wakala accounts
RO’000
Due to banks and financial
institutions RO’000
Unrestricted Investment
AccountholdersRO’000
On Liabilities
Retail 1,306 15,745 - 5,200
Corporate 4,639 87,771 10,060 -
5,945 103,516 10,060 5,200
31 December 2018 Diminishing Musharaka
RO’000
Forward Ijarah
RO’000
Service Ijarah
RO’000
On Assets
Retail 1,770 3,813 11
Corporate 24,355 884 -
26,125 4,697 11
31 December 2017
Due from Banks and
financial institutions
RO’000
Financial assets at amortised cost RO’000
Deferred sales under
Murabaha RO’000
Ijarah Muntahia
BittamleekRO’000
On Assets
Retail - - 1,335 60,945
Corporate 19,932 5,476 330 24,507
19,932 5,476 1,665 85,452
(c) Economic sector concentrations
31 December 2017 Diminishing Musharaka
RO’000
Forward Ijarah
RO’000
On Assets
Retail 546 3,271
Corporate 10,462 1,385
11,008 4,656
31 December 2017 Current
accountsRO’000
Unrestricted investment
accountholdersRO’000
On Liabilities
Retail 1,135 16,546
Corporate 4,141 97,910
5,276 114,456
Assets
Deferred sales under
MurabahaRO’000
Ijarah Muntahiah Bittamleek
RO’000
Diminishing Musharaka
RO’000
Forward Ijarah
RO’000
Service Ijarah
RO’000
31 December 2018
Personal 1,254 61,708 1,770 3,813 11
Construction 21 15,319 11,631 884 -
Manufacturing 78 1,313 10,029 - -
Trade 81 38 342 - -
Services 135 5,785 2,353 - -
1,569 84,163 26,125 4,697 11
Liabilities
Currentaccounts
RO’000
Wakalaaccounts
RO’000
Savingsaccounts
RO’000
31 December 2018
Personal 5,945 103,516 5,200
Construction - - -
Manufacturing - - -
Trade - - -
Services - - -
5,945 103,516 5,200
Notes to the Financial StatementsAs at 31 December 2018
Notes to the Financial StatementsAs at 31 December 2018
252 | National Bank of Oman Annual Report 2018 | 253
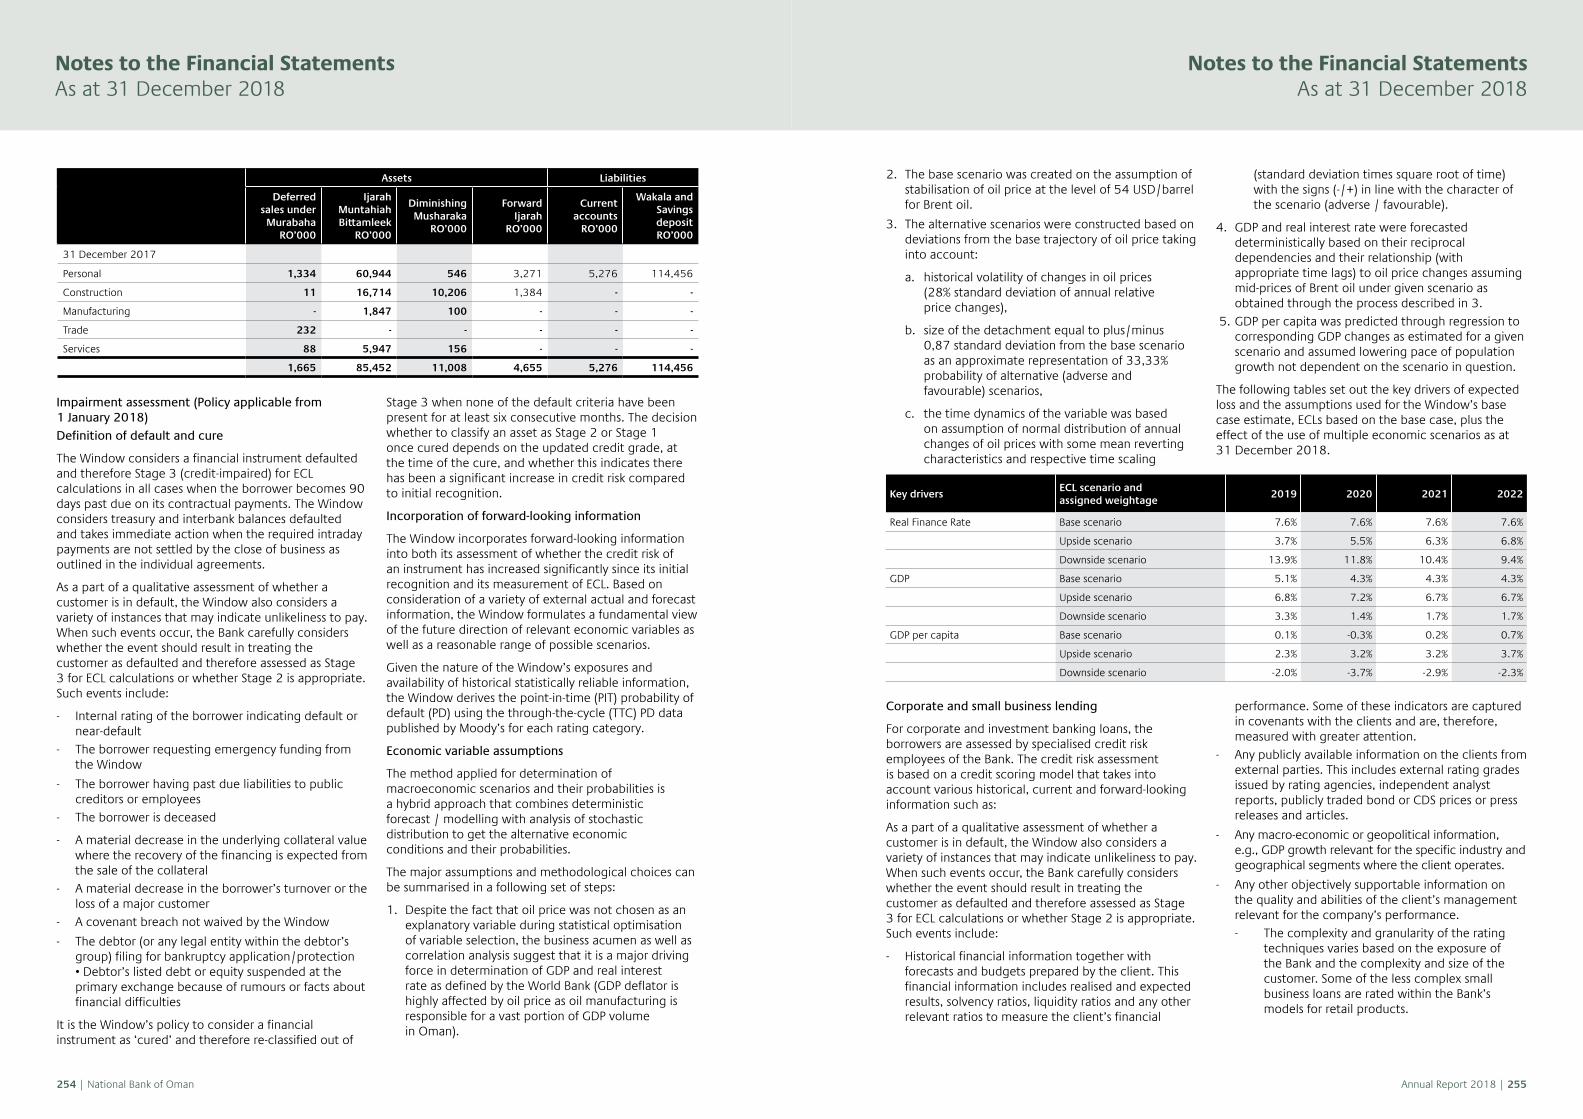
Assets Liabilities
Deferred sales under
MurabahaRO’000
Ijarah Muntahiah Bittamleek
RO’000
Diminishing Musharaka
RO’000
Forward Ijarah
RO’000
Currentaccounts
RO’000
Wakala and Savings depositRO’000
31 December 2017
Personal 1,334 60,944 546 3,271 5,276 114,456
Construction 11 16,714 10,206 1,384 - -
Manufacturing - 1,847 100 - - -
Trade 232 - - - - -
Services 88 5,947 156 - - -
1,665 85,452 11,008 4,655 5,276 114,456
Impairment assessment (Policy applicable from 1 January 2018)Definition of default and cure
The Window considers a financial instrument defaulted and therefore Stage 3 (credit-impaired) for ECL calculations in all cases when the borrower becomes 90 days past due on its contractual payments. The Window considers treasury and interbank balances defaulted and takes immediate action when the required intraday payments are not settled by the close of business as outlined in the individual agreements.
As a part of a qualitative assessment of whether a customer is in default, the Window also considers a variety of instances that may indicate unlikeliness to pay. When such events occur, the Bank carefully considers whether the event should result in treating the customer as defaulted and therefore assessed as Stage 3 for ECL calculations or whether Stage 2 is appropriate. Such events include:
- Internal rating of the borrower indicating default or near-default
- The borrower requesting emergency funding from the Window
- The borrower having past due liabilities to public creditors or employees
- The borrower is deceased
- A material decrease in the underlying collateral value where the recovery of the financing is expected from the sale of the collateral
- A material decrease in the borrower’s turnover or the loss of a major customer
- A covenant breach not waived by the Window
- The debtor (or any legal entity within the debtor’s group) filing for bankruptcy application/protection • Debtor’s listed debt or equity suspended at the primary exchange because of rumours or facts about financial difficulties
It is the Window’s policy to consider a financial instrument as ‘cured’ and therefore re-classified out of
Stage 3 when none of the default criteria have been present for at least six consecutive months. The decision whether to classify an asset as Stage 2 or Stage 1 once cured depends on the updated credit grade, at the time of the cure, and whether this indicates there has been a significant increase in credit risk compared to initial recognition.
Incorporation of forward-looking information
The Window incorporates forward-looking information into both its assessment of whether the credit risk of an instrument has increased significantly since its initial recognition and its measurement of ECL. Based on consideration of a variety of external actual and forecast information, the Window formulates a fundamental view of the future direction of relevant economic variables as well as a reasonable range of possible scenarios.
Given the nature of the Window’s exposures and availability of historical statistically reliable information, the Window derives the point-in-time (PIT) probability of default (PD) using the through-the-cycle (TTC) PD data published by Moody’s for each rating category.
Economic variable assumptions
The method applied for determination of macroeconomic scenarios and their probabilities is a hybrid approach that combines deterministic forecast / modelling with analysis of stochastic distribution to get the alternative economic conditions and their probabilities.
The major assumptions and methodological choices can be summarised in a following set of steps:
1. Despite the fact that oil price was not chosen as an explanatory variable during statistical optimisation of variable selection, the business acumen as well as correlation analysis suggest that it is a major driving force in determination of GDP and real interest rate as defined by the World Bank (GDP deflator is highly affected by oil price as oil manufacturing is responsible for a vast portion of GDP volume in Oman).
Corporate and small business lending
For corporate and investment banking loans, the borrowers are assessed by specialised credit risk employees of the Bank. The credit risk assessment is based on a credit scoring model that takes into account various historical, current and forward-looking information such as:
As a part of a qualitative assessment of whether a customer is in default, the Window also considers a variety of instances that may indicate unlikeliness to pay. When such events occur, the Bank carefully considers whether the event should result in treating the customer as defaulted and therefore assessed as Stage 3 for ECL calculations or whether Stage 2 is appropriate. Such events include:
- Historical financial information together with forecasts and budgets prepared by the client. This financial information includes realised and expected results, solvency ratios, liquidity ratios and any other relevant ratios to measure the client’s financial
performance. Some of these indicators are captured in covenants with the clients and are, therefore, measured with greater attention.
- Any publicly available information on the clients from external parties. This includes external rating grades issued by rating agencies, independent analyst reports, publicly traded bond or CDS prices or press releases and articles.
- Any macro-economic or geopolitical information, e.g., GDP growth relevant for the specific industry and geographical segments where the client operates.
- Any other objectively supportable information on the quality and abilities of the client’s management relevant for the company’s performance.
- The complexity and granularity of the rating techniques varies based on the exposure of the Bank and the complexity and size of the customer. Some of the less complex small business loans are rated within the Bank’s models for retail products.
2. The base scenario was created on the assumption of stabilisation of oil price at the level of 54 USD/barrel for Brent oil.
3. The alternative scenarios were constructed based on deviations from the base trajectory of oil price taking into account:
a. historical volatility of changes in oil prices (28% standard deviation of annual relative price changes),
b. size of the detachment equal to plus/minus 0,87 standard deviation from the base scenario as an approximate representation of 33,33% probability of alternative (adverse and favourable) scenarios,
c. the time dynamics of the variable was based on assumption of normal distribution of annual changes of oil prices with some mean reverting characteristics and respective time scaling
(standard deviation times square root of time) with the signs (-/+) in line with the character of the scenario (adverse / favourable).
4. GDP and real interest rate were forecasted deterministically based on their reciprocal dependencies and their relationship (with appropriate time lags) to oil price changes assuming mid-prices of Brent oil under given scenario as obtained through the process described in 3.
5. GDP per capita was predicted through regression to corresponding GDP changes as estimated for a given scenario and assumed lowering pace of population growth not dependent on the scenario in question.
The following tables set out the key drivers of expected loss and the assumptions used for the Window’s base case estimate, ECLs based on the base case, plus the effect of the use of multiple economic scenarios as at 31 December 2018.
Key driversECL scenario and assigned weightage
2019 2020 2021 2022
Real Finance Rate Base scenario 7.6% 7.6% 7.6% 7.6%
Upside scenario 3.7% 5.5% 6.3% 6.8%
Downside scenario 13.9% 11.8% 10.4% 9.4%
GDP Base scenario 5.1% 4.3% 4.3% 4.3%
Upside scenario 6.8% 7.2% 6.7% 6.7%
Downside scenario 3.3% 1.4% 1.7% 1.7%
GDP per capita Base scenario 0.1% -0.3% 0.2% 0.7%
Upside scenario 2.3% 3.2% 3.2% 3.7%
Downside scenario -2.0% -3.7% -2.9% -2.3%
Notes to the Financial StatementsAs at 31 December 2018
Notes to the Financial StatementsAs at 31 December 2018
254 | National Bank of Oman Annual Report 2018 | 255
Consumer lending and retail mortgages
Consumer lending comprises secured personal financing and overdrafts. These products along with retail mortgages and some of the less complex small business lending are rated by an automated scorecard tool primarily driven by days past due. Other key inputs into the models are:
- Consumer lending products: use of limits and volatility thereof, GDP growth, unemployment rates, changes in personal income/salary levels based on records of current accounts, personal indebtedness and expected interest repricing
- Retail mortgages: GDP growth, unemployment rates, changes in personal income/salary levels based on records of current accounts, personal indebtedness and expected interest repricing
Exposure at default
The exposure at default (EAD) represents the gross carrying amount of the financial instruments subject to the impairment calculation, addressing both the client’s ability to increase its exposure while approaching default and potential early repayments too.
To calculate the EAD for a Stage 1 financing, the Window assesses the possible default events within 12 months for the calculation of the 12mECL. However, if a Stage 1 financing that is expected to default in the 12 months from the balance sheet date and is also expected to cure and subsequently default again, then all linked default events are taken into account. For Stage 2, Stage 3 and POCI financial assets, the exposure at default is considered for events over the lifetime of the instruments.
The Window determines EADs by modelling the range of possible exposure outcomes at various points in time, corresponding the multiple scenarios. The IFRS 9 PDs are then assigned to each economic scenario based on the outcome of Window’s models.
Loss given default
For corporate and investment banking financial instruments, LGD values are assessed at least every twelve months by account managers and reviewed and approved by the Window’s specialised credit risk department. The credit risk assessment is based on a standardised LGD assessment framework that results in a certain LGD rate. These LGD rates take into account the expected EAD in comparison to the amount expected to be recovered or realised from any collateral held.
The Window segments its retail lending products into smaller homogeneous portfolios, based on key characteristics that are relevant to the estimation of future cash flows. The applied data is based on historically collected loss data and involves a wider set of transaction characteristics (e.g., product type, wider range of collateral types) as well as borrower
characteristics. Further recent data and forward-looking economic scenarios are used in order to determine the IFRS 9 LGD rate for each group of financial instruments. When assessing forward-looking information, the expectation is based on multiple scenarios. Examples of key inputs involve changes in, collateral values including property prices for mortgages, commodity prices, payment status or other factors that are indicative of losses in the bank.
The Window estimates regulatory and IFRS 9 LGDs on a different basis. Under IFRS 9, LGD rates are estimated for the Stage 1, Stage 2, Stage 3 and POCI IFRS 9 segment of each asset class. The inputs for these LGD rates are estimated and, where possible, calibrated through back testing against recent recoveries. These are repeated for each economic scenario as appropriate.
Significant Increase in Credit Risk
The Window continuously monitors all assets subject to ECLs. In order to determine whether an instrument or a portfolio of instruments is subject to 12mECL or LTECL, the Window assesses whether there has been a significant increase in credit risk since initial recognition.
The Window also applies a secondary qualitative method for triggering a significant increase in credit risk for an asset, such as moving a customer/facility to the watch list, or the account becoming forborne. In certain cases, the Window may also consider that events set out below are a significant increase in credit risk as opposed to a default. Regardless of the change in credit grades, if contractual payments are more than 30 days past due, the credit risk is deemed to have increased significantly since initial recognition.
a. Inadequate or unreliable financial or other information such as unavailability of audited financial statements within 120 days from end of accounting period.
b. Delay in documentation execution over 35 days from limit set up due to disputes with customers.
c. Borrower is subject to litigation by third parties that may have a significant impact on his financial position.
d. Frequent changes in key senior management personnel without acceptable successors or professional management.
e. Intra Group transfer of funds without underlying transactions beyond 50% of Tangible Net Worth.
f. Deferment/delay in the date for commencement of commercial operations by more than one year except in Government projects or delays are due to Government approvals.
g. Modifications of terms resulting in concessions granted to the borrower (after examining the cash flows of the borrower/financial position/ability to repay) including extension of moratorium, deferment of payment, waiver of covenants etc.
This requirement shall be in conformity to the restructuring guidelines issued by CBO from time to time.
h. A fall of 25% or more in the turnover or in the EBIT as compared to the previous year except in the case of change in business model/one of material events.
i. A fall in Debt Service coverage ratio to below 1 except in cases which have acceptable external credit support.
j. Rating downgrade by 3 notches for ratings from R1 to R4 and 2 notches downgrade for R5 and R6.
k. Erosion in net worth by more than 20% compared to previous year coupled with increase in leverage by 1.5 times.
Model risk management:
The Window has utilised models in many of its financial and business activities from underwriting a credit facility to reporting expected loss under the IFRS9 accounting standards.
To manage the model risks, the Window has implemented the IFRS 9 Governance Framework (the Framework). The Framework is a bank wide policy and is applicable to all models of the Bank. According to the Framework, all internally or externally (vendor based) developed risk quantification models that directly affect the financial reporting on Expected Loss (EL) and Lifetime Expected Loss (LEL) require independent validation.
The Framework establishes a systematic approach to manage the development, validation, approval, implementation and on-going use of the models. It sets out an effective management structure with clearly defined roles and responsibilities, policies and controls for managing model risk. The Framework is reviewed on a regular basis to ensure it meets regulatory standards and international practices. Any major change to the Framework must be approved by the Board of Directors or the BRC.
The Window has a practice of doing independent model validation which provides recommendation to approve the use of the new risk quantification / valuation models. In addition to new model validation, it also evaluates the performance of existing models through an annual validation process. The independency of the team will serve as an effective second line of defense for the Window in terms of usage of models.
Liquidity risk
Liquidity risk is the potential inability to meet Muzn’s liabilities as they become due. It arises when Muzn is unable to generate cash to cope with a decline in deposits or increase in assets.
Muzn’s liquidity risk management is governed by the Treasury Risk Policy document approved by the Board of Directors as well as the provisions of the relevant CBO guidelines on liquidity risk management through cash flow approach. The liquidity management does not only measure the liquidity position of the Bank on an going basis but also examine how funding requirement are likely to evolve under various scenarios.
Muzn monitors its liquidity risk through cash flow approach and stock approach. Under the cash flow approach, Muzn generates Maturity of Assets and Liabilities (MAL) report which captures all the maturing assets and liabilities into various pre-set time buckets ranging from one month to over five years. The mismatches in various time buckets indicate liquidity gap and Muzn strictly adheres to the CBO set limit of cumulative liabilities (outflows) on mismatches (liquidity gaps) in time buckets up to one year. In addition, Muzn has also set up internal limit on mismatches in time buckets beyond one year.
Treasury department of Muzn controls and monitors the liquidity risk and ensures that Muzn is not exposed to undue liquidity risk and at the same time makes optimum use of its funds. The middle office in Credit risk division also monitors the liquidity position of Muzn and provides the liquidity gap to Treasury Department to meet liquidity gaps.
The Central Bank of Oman has issued guidelines on the implementation of Basel III liquidity framework which are Liquidity Coverage Ratio (LCR) and Net Stable Funding (NSFR). The Liquidity coverage ratio (LCR) is a short time ratio designed to increase resilience against a liquidity shortage of up to 30 days. The LCR is computed as per CBO requirement under the circular BM1127 (BASEL III: Framework on Liquidity coverage ratio and LCR disclosure standards). It is required to maintain a minimum required level of 100% effective from January 1, 2019.
The Net Stable Funding Ratio (NSFR) is a longer term structural ratio designed to address liquidity mismatches and reduce funding risk over a one year horizon. It is required to maintain a minimum ratio of 100% as per the regulatory guidance. The residual maturity profile of the assets, liabilities and equity at 31 December 2018 is as follows:
Notes to the Financial StatementsAs at 31 December 2018
Notes to the Financial StatementsAs at 31 December 2018
256 | National Bank of Oman Annual Report 2018 | 257
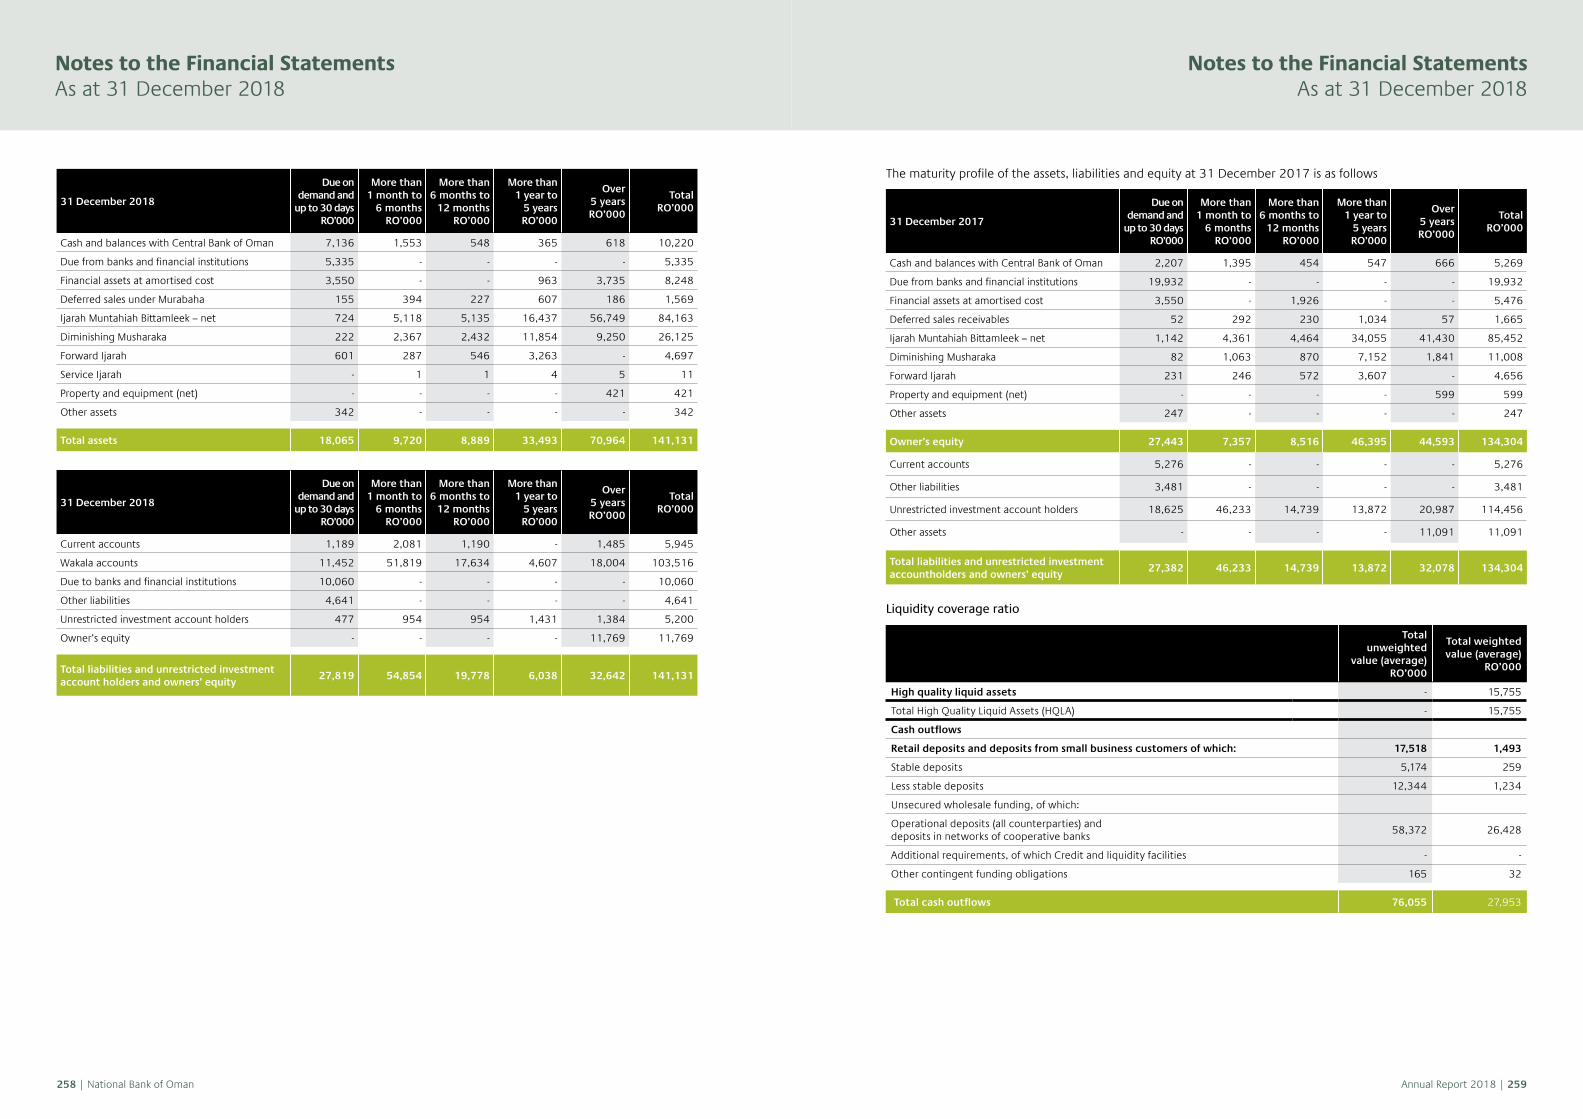
31 December 2018
Due on demand and
up to 30 daysRO’000
More than 1 month to
6 monthsRO’000
More than 6 months to
12 monthsRO’000
More than1 year to
5 yearsRO’000
Over5 yearsRO’000
TotalRO’000
Cash and balances with Central Bank of Oman 7,136 1,553 548 365 618 10,220
Due from banks and financial institutions 5,335 - - - - 5,335
Financial assets at amortised cost 3,550 - - 963 3,735 8,248
Deferred sales under Murabaha 155 394 227 607 186 1,569
Ijarah Muntahiah Bittamleek – net 724 5,118 5,135 16,437 56,749 84,163
Diminishing Musharaka 222 2,367 2,432 11,854 9,250 26,125
Forward Ijarah 601 287 546 3,263 - 4,697
Service Ijarah - 1 1 4 5 11
Property and equipment (net) - - - - 421 421
Other assets 342 - - - - 342
Total assets 18,065 9,720 8,889 33,493 70,964 141,131
31 December 2018
Due on demand and
up to 30 daysRO’000
More than 1 month to
6 monthsRO’000
More than 6 months to
12 monthsRO’000
More than1 year to
5 yearsRO’000
Over5 yearsRO’000
TotalRO’000
Current accounts 1,189 2,081 1,190 - 1,485 5,945
Wakala accounts 11,452 51,819 17,634 4,607 18,004 103,516
Due to banks and financial institutions 10,060 - - - - 10,060
Other liabilities 4,641 - - - - 4,641
Unrestricted investment account holders 477 954 954 1,431 1,384 5,200
Owner’s equity - - - - 11,769 11,769
Total liabilities and unrestricted investment account holders and owners’ equity
27,819 54,854 19,778 6,038 32,642 141,131
31 December 2017
Due on demand and
up to 30 daysRO’000
More than 1 month to
6 monthsRO’000
More than 6 months to
12 monthsRO’000
More than1 year to
5 yearsRO’000
Over5 yearsRO’000
TotalRO’000
Cash and balances with Central Bank of Oman 2,207 1,395 454 547 666 5,269
Due from banks and financial institutions 19,932 - - - - 19,932
Financial assets at amortised cost 3,550 - 1,926 - - 5,476
Deferred sales receivables 52 292 230 1,034 57 1,665
Ijarah Muntahiah Bittamleek – net 1,142 4,361 4,464 34,055 41,430 85,452
Diminishing Musharaka 82 1,063 870 7,152 1,841 11,008
Forward Ijarah 231 246 572 3,607 - 4,656
Property and equipment (net) - - - - 599 599
Other assets 247 - - - - 247
Owner’s equity 27,443 7,357 8,516 46,395 44,593 134,304
Current accounts 5,276 - - - - 5,276
Other liabilities 3,481 - - - - 3,481
Unrestricted investment account holders 18,625 46,233 14,739 13,872 20,987 114,456
Other assets - - - - 11,091 11,091
Total liabilities and unrestricted investment accountholders and owners’ equity
27,382 46,233 14,739 13,872 32,078 134,304
Liquidity coverage ratio
The maturity profile of the assets, liabilities and equity at 31 December 2017 is as follows
Total unweighted
value (average)RO’000
Total weighted value (average)
RO’000
High quality liquid assets - 15,755
Total High Quality Liquid Assets (HQLA) - 15,755
Cash outflows
Retail deposits and deposits from small business customers of which: 17,518 1,493
Stable deposits 5,174 259
Less stable deposits 12,344 1,234
Unsecured wholesale funding, of which:
Operational deposits (all counterparties) and deposits in networks of cooperative banks
58,372 26,428
Additional requirements, of which Credit and liquidity facilities - -
Other contingent funding obligations 165 32
Total cash outflows 76,055 27,953
Notes to the Financial StatementsAs at 31 December 2018
Notes to the Financial StatementsAs at 31 December 2018
258 | National Bank of Oman Annual Report 2018 | 259
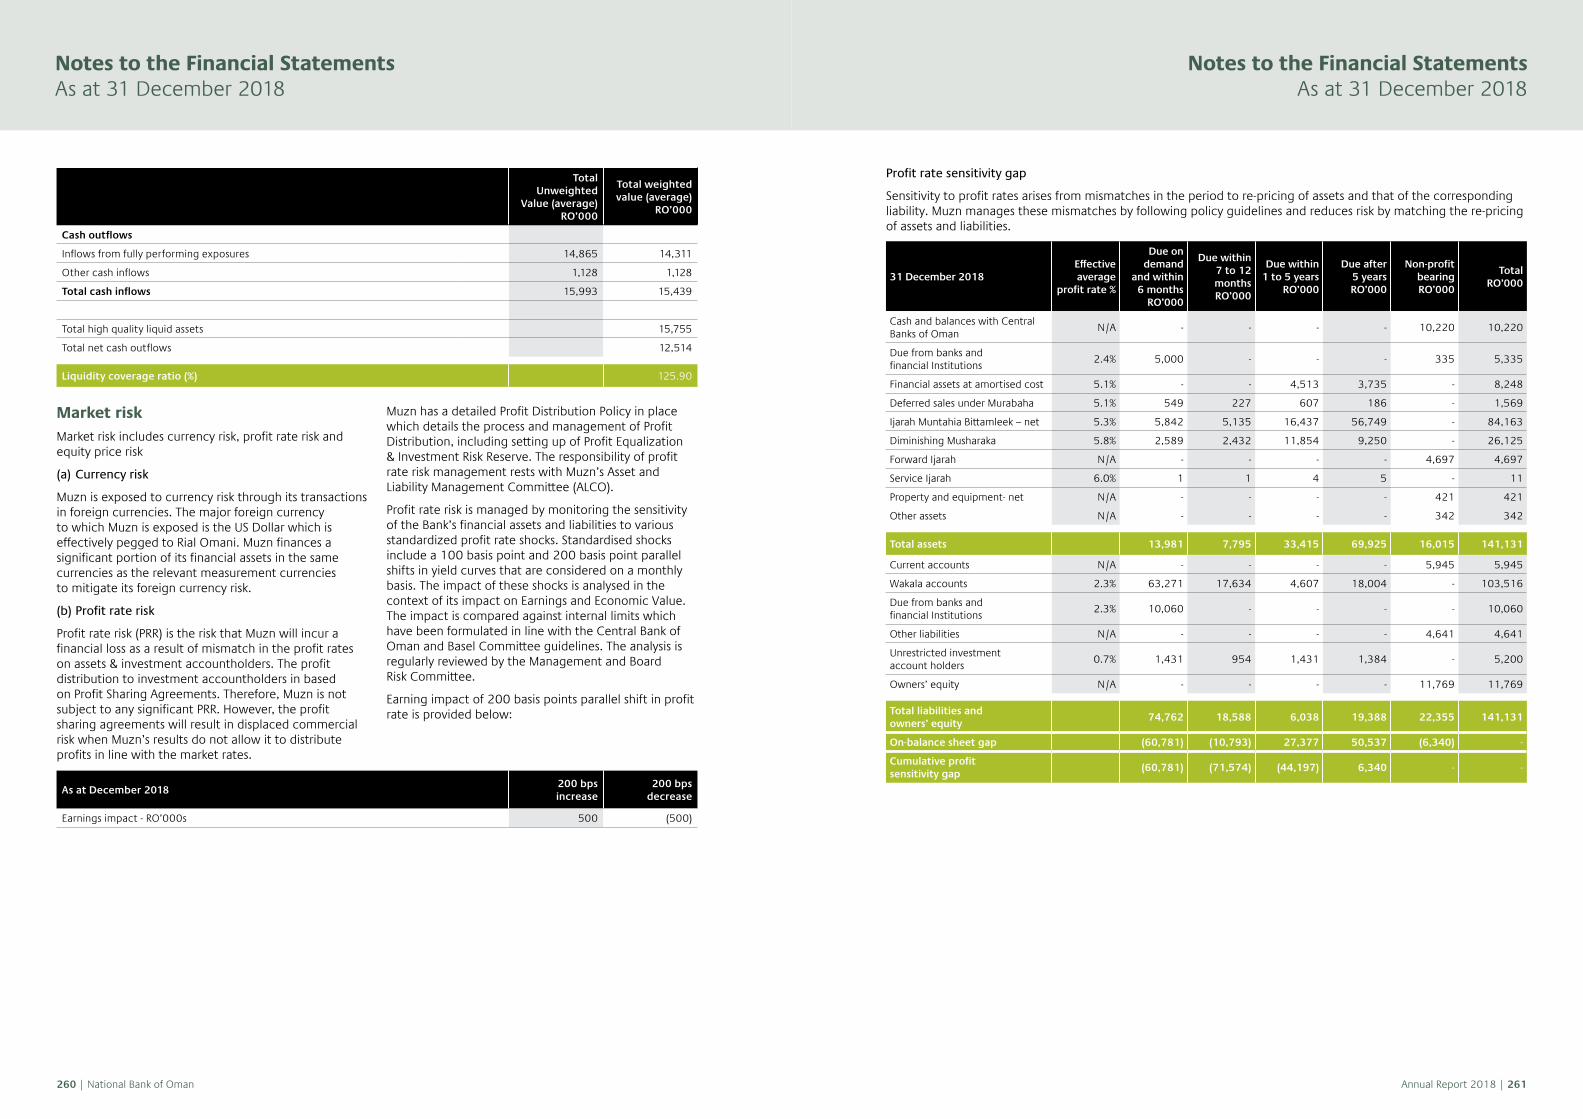
Total Unweighted
Value (average)RO’000
Total weighted value (average)
RO’000
Cash outflows
Inflows from fully performing exposures 14,865 14,311
Other cash inflows 1,128 1,128
Total cash inflows 15,993 15,439
Total high quality liquid assets 15,755
Total net cash outflows 12,514
Liquidity coverage ratio (%) 125.90
Market risk Market risk includes currency risk, profit rate risk and equity price risk
(a) Currency risk
Muzn is exposed to currency risk through its transactions in foreign currencies. The major foreign currency to which Muzn is exposed is the US Dollar which is effectively pegged to Rial Omani. Muzn finances a significant portion of its financial assets in the same currencies as the relevant measurement currencies to mitigate its foreign currency risk.
(b) Profit rate risk
Profit rate risk (PRR) is the risk that Muzn will incur a financial loss as a result of mismatch in the profit rates on assets & investment accountholders. The profit distribution to investment accountholders in based on Profit Sharing Agreements. Therefore, Muzn is not subject to any significant PRR. However, the profit sharing agreements will result in displaced commercial risk when Muzn’s results do not allow it to distribute profits in line with the market rates.
Muzn has a detailed Profit Distribution Policy in place which details the process and management of Profit Distribution, including setting up of Profit Equalization & Investment Risk Reserve. The responsibility of profit rate risk management rests with Muzn’s Asset and Liability Management Committee (ALCO).
Profit rate risk is managed by monitoring the sensitivity of the Bank’s financial assets and liabilities to various standardized profit rate shocks. Standardised shocks include a 100 basis point and 200 basis point parallel shifts in yield curves that are considered on a monthly basis. The impact of these shocks is analysed in the context of its impact on Earnings and Economic Value. The impact is compared against internal limits which have been formulated in line with the Central Bank of Oman and Basel Committee guidelines. The analysis is regularly reviewed by the Management and Board Risk Committee.
Earning impact of 200 basis points parallel shift in profit rate is provided below:
As at December 2018200 bps increase
200 bps decrease
Earnings impact - RO’000s 500 (500)
31 December 2018Effective average
profit rate %
Due on demand
and within 6 months
RO’000
Due within7 to 12 monthsRO’000
Due within 1 to 5 years
RO’000
Due after 5 yearsRO’000
Non-profit bearingRO’000
TotalRO’000
Cash and balances with Central Banks of Oman
N/A - - - - 10,220 10,220
Due from banks and financial Institutions
2.4% 5,000 - - - 335 5,335
Financial assets at amortised cost 5.1% - - 4,513 3,735 - 8,248
Deferred sales under Murabaha 5.1% 549 227 607 186 - 1,569
Ijarah Muntahia Bittamleek – net 5.3% 5,842 5,135 16,437 56,749 - 84,163
Diminishing Musharaka 5.8% 2,589 2,432 11,854 9,250 - 26,125
Forward Ijarah N/A - - - - 4,697 4,697
Service Ijarah 6.0% 1 1 4 5 - 11
Property and equipment- net N/A - - - - 421 421
Other assets N/A - - - - 342 342
Total assets 13,981 7,795 33,415 69,925 16,015 141,131
Current accounts N/A - - - - 5,945 5,945
Wakala accounts 2.3% 63,271 17,634 4,607 18,004 - 103,516
Due from banks and financial Institutions
2.3% 10,060 - - - - 10,060
Other liabilities N/A - - - - 4,641 4,641
Unrestricted investment account holders
0.7% 1,431 954 1,431 1,384 - 5,200
Owners’ equity N/A - - - - 11,769 11,769
Total liabilities and owners’ equity
74,762 18,588 6,038 19,388 22,355 141,131
On-balance sheet gap (60,781) (10,793) 27,377 50,537 (6,340) -
Cumulative profit sensitivity gap
(60,781) (71,574) (44,197) 6,340 - -
Profit rate sensitivity gap
Sensitivity to profit rates arises from mismatches in the period to re-pricing of assets and that of the corresponding liability. Muzn manages these mismatches by following policy guidelines and reduces risk by matching the re-pricing of assets and liabilities.
Notes to the Financial StatementsAs at 31 December 2018
Notes to the Financial StatementsAs at 31 December 2018
260 | National Bank of Oman Annual Report 2018 | 261
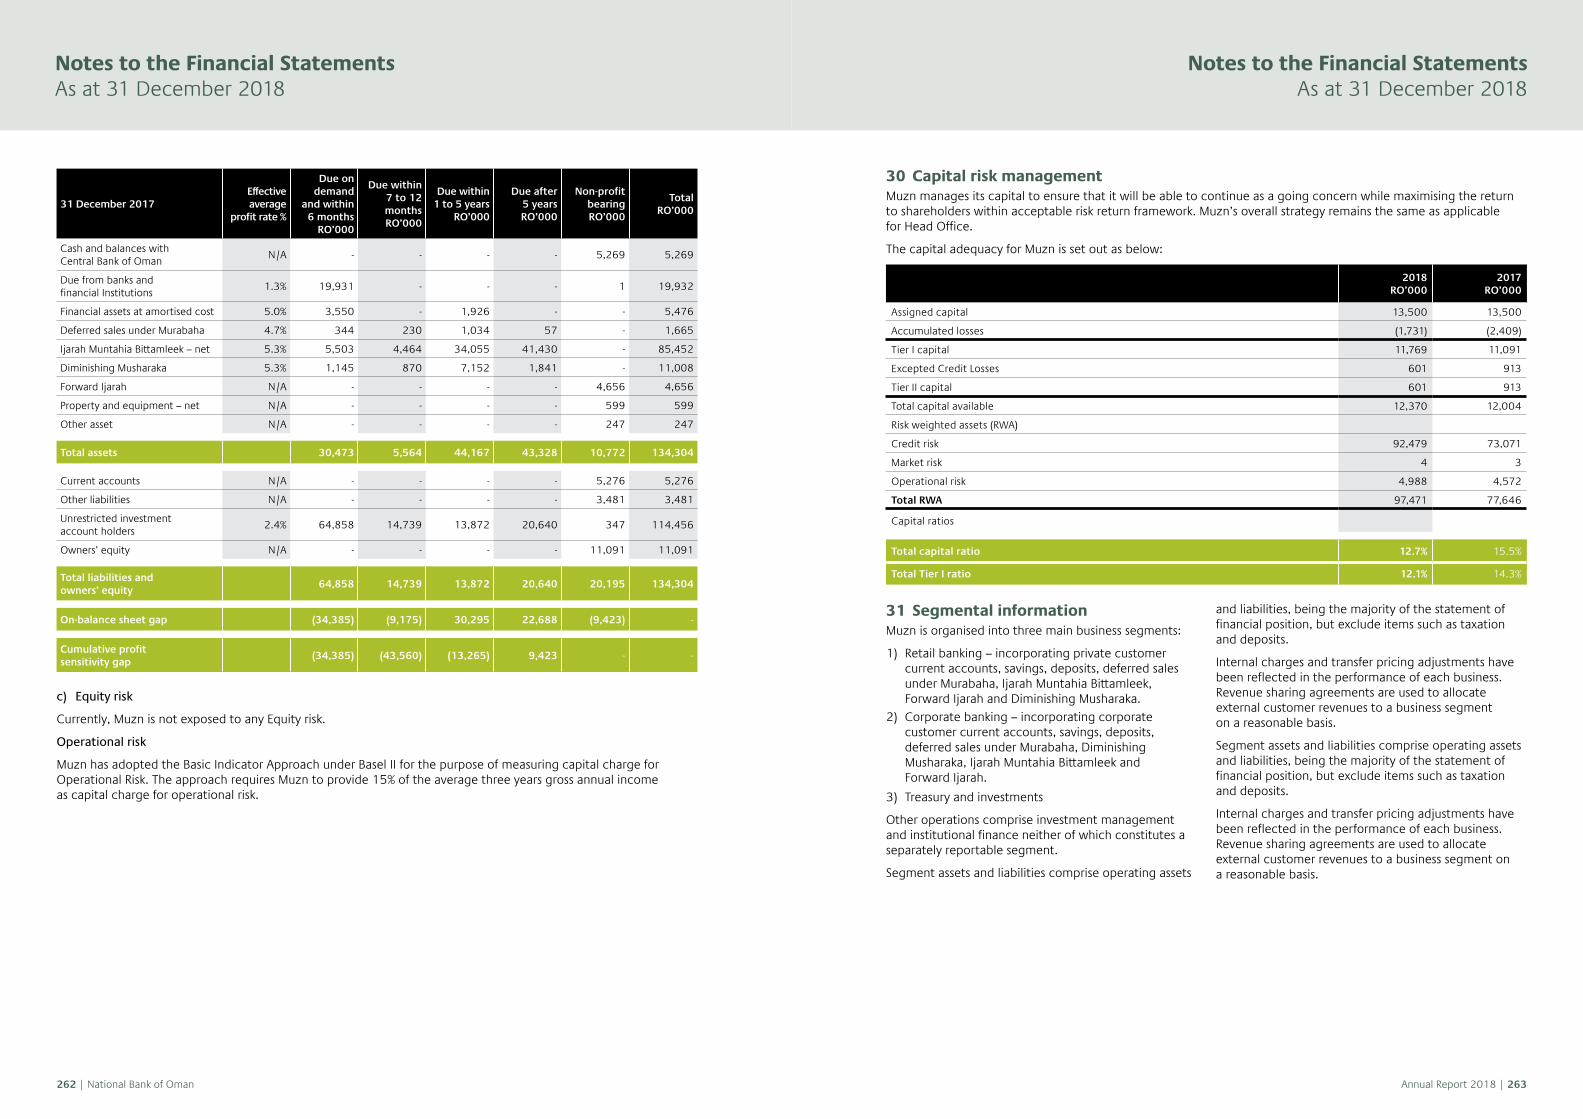
31 December 2017Effective average
profit rate %
Due on demand
and within 6 months
RO’000
Due within7 to 12 monthsRO’000
Due within 1 to 5 years
RO’000
Due after 5 yearsRO’000
Non-profit bearingRO’000
TotalRO’000
Cash and balances with Central Bank of Oman
N/A - - - - 5,269 5,269
Due from banks and financial Institutions
1.3% 19,931 - - - 1 19,932
Financial assets at amortised cost 5.0% 3,550 - 1,926 - - 5,476
Deferred sales under Murabaha 4.7% 344 230 1,034 57 - 1,665
Ijarah Muntahia Bittamleek – net 5.3% 5,503 4,464 34,055 41,430 - 85,452
Diminishing Musharaka 5.3% 1,145 870 7,152 1,841 - 11,008
Forward Ijarah N/A - - - - 4,656 4,656
Property and equipment – net N/A - - - - 599 599
Other asset N/A - - - - 247 247
Total assets 30,473 5,564 44,167 43,328 10,772 134,304
Current accounts N/A - - - - 5,276 5,276
Other liabilities N/A - - - - 3,481 3,481
Unrestricted investment account holders
2.4% 64,858 14,739 13,872 20,640 347 114,456
Owners’ equity N/A - - - - 11,091 11,091
Total liabilities and owners’ equity
64,858 14,739 13,872 20,640 20,195 134,304
On-balance sheet gap (34,385) (9,175) 30,295 22,688 (9,423) -
Cumulative profit sensitivity gap
(34,385) (43,560) (13,265) 9,423 - -
c) Equity risk
Currently, Muzn is not exposed to any Equity risk.
Operational risk
Muzn has adopted the Basic Indicator Approach under Basel II for the purpose of measuring capital charge for Operational Risk. The approach requires Muzn to provide 15% of the average three years gross annual income as capital charge for operational risk.
31 Segmental informationMuzn is organised into three main business segments:
1) Retail banking – incorporating private customer current accounts, savings, deposits, deferred sales under Murabaha, Ijarah Muntahia Bittamleek, Forward Ijarah and Diminishing Musharaka.
2) Corporate banking – incorporating corporate customer current accounts, savings, deposits, deferred sales under Murabaha, Diminishing Musharaka, Ijarah Muntahia Bittamleek and Forward Ijarah.
3) Treasury and investments
Other operations comprise investment management and institutional finance neither of which constitutes a separately reportable segment.
Segment assets and liabilities comprise operating assets
and liabilities, being the majority of the statement of financial position, but exclude items such as taxation and deposits.
Internal charges and transfer pricing adjustments have been reflected in the performance of each business. Revenue sharing agreements are used to allocate external customer revenues to a business segment on a reasonable basis.
Segment assets and liabilities comprise operating assets and liabilities, being the majority of the statement of financial position, but exclude items such as taxation and deposits.
Internal charges and transfer pricing adjustments have been reflected in the performance of each business. Revenue sharing agreements are used to allocate external customer revenues to a business segment on a reasonable basis.
2018RO’000
2017RO’000
Assigned capital 13,500 13,500
Accumulated losses (1,731) (2,409)
Tier I capital 11,769 11,091
Excepted Credit Losses 601 913
Tier II capital 601 913
Total capital available 12,370 12,004
Risk weighted assets (RWA)
Credit risk 92,479 73,071
Market risk 4 3
Operational risk 4,988 4,572
Total RWA 97,471 77,646
Capital ratios
Total capital ratio 12.7% 15.5%
Total Tier I ratio 12.1% 14.3%
30 Capital risk management Muzn manages its capital to ensure that it will be able to continue as a going concern while maximising the return to shareholders within acceptable risk return framework. Muzn’s overall strategy remains the same as applicable for Head Office.
The capital adequacy for Muzn is set out as below:
Notes to the Financial StatementsAs at 31 December 2018
Notes to the Financial StatementsAs at 31 December 2018
262 | National Bank of Oman Annual Report 2018 | 263

32 Corresponding figuresDuring the current year, the Bank reclassified income from fixed income investments from Investment income to Income from jointly financed assets. The above reclassifications have resulted in changes as presented below for the comparative figures of 2017 to maintain consistency.
2017 (as previously
reported) OMR ‘000
Reclassification 2017
(regrouped) OMR ‘000
Income from jointly financed assets 5,013 227 5,240
Other operating income 449 (227) 222
Total 5,462 – 5,462
At 31 December 2018Retail
bankingRO’000
Corporate bankingRO’000
Treasury and investments
RO’000
Other RO’000
Total RO’000
Segment operating revenues 3,133 2,263 715 - 6,111
Other revenues 65 138 83 46 332
Segment operating revenues 3,198 2,401 798 46 6,443
Profit expenses (369) (2,983) (131) (81) (3,564)
Net operating income 2,829 (582) 667 (35) 2,879
Segment cost
Operating expenses including depreciation (897) (180) (80) (1,119) (2,276)
Impairment for finances net of allowance for provision (10) (226) 15 - (221)
Net Profit for the year 1,922 (988) 602 (1,154) 382
Gross segment assets 70,175 48,832 22,686 763 142,456
Less: Impairment allowance (475) (795) (55) - (1,325)
Segment assets 69,700 48,037 22,631 763 141,131
Segment liabilities 21,823 92,410 21,829 5,069 141,131
At 31 December 2017Retail
bankingRO’000
Corporate bankingRO’000
Treasury and investments
RO’000
Other RO’000
Total RO’000
Segment operating revenues 2,841 2,030 141 - 5,012
Other revenues 70 76 268 35 449
Segment operating revenues 2,911 2,106 409 35 5,461
Profit expenses (300) (2,760) - (81) (3,141)
Net operating income 2,611 (654) 409 (46) 2,320
Segment cost
Operating expenses including depreciation (963) (246) (84) (1,117) (2,410)
Impairment for finances net of allowance for provision 23 10 - - 33
Net Profit for the year 1,671 (890) 325 (1,163) (57)
Gross segment assets 67,878 37,321 29,592 846 135,637
Less: Impairment allowance (697) (636) - - (1,333)
Segment assets 67,181 36,685 29,592 846 134,304
Segment liabilities 17,334 102,051 11,091 3,828 134,304
Notes to the Financial StatementsAs at 31 December 2018
Notes to the Financial StatementsAs at 31 December 2018
264 | National Bank of Oman Annual Report 2018 | 265
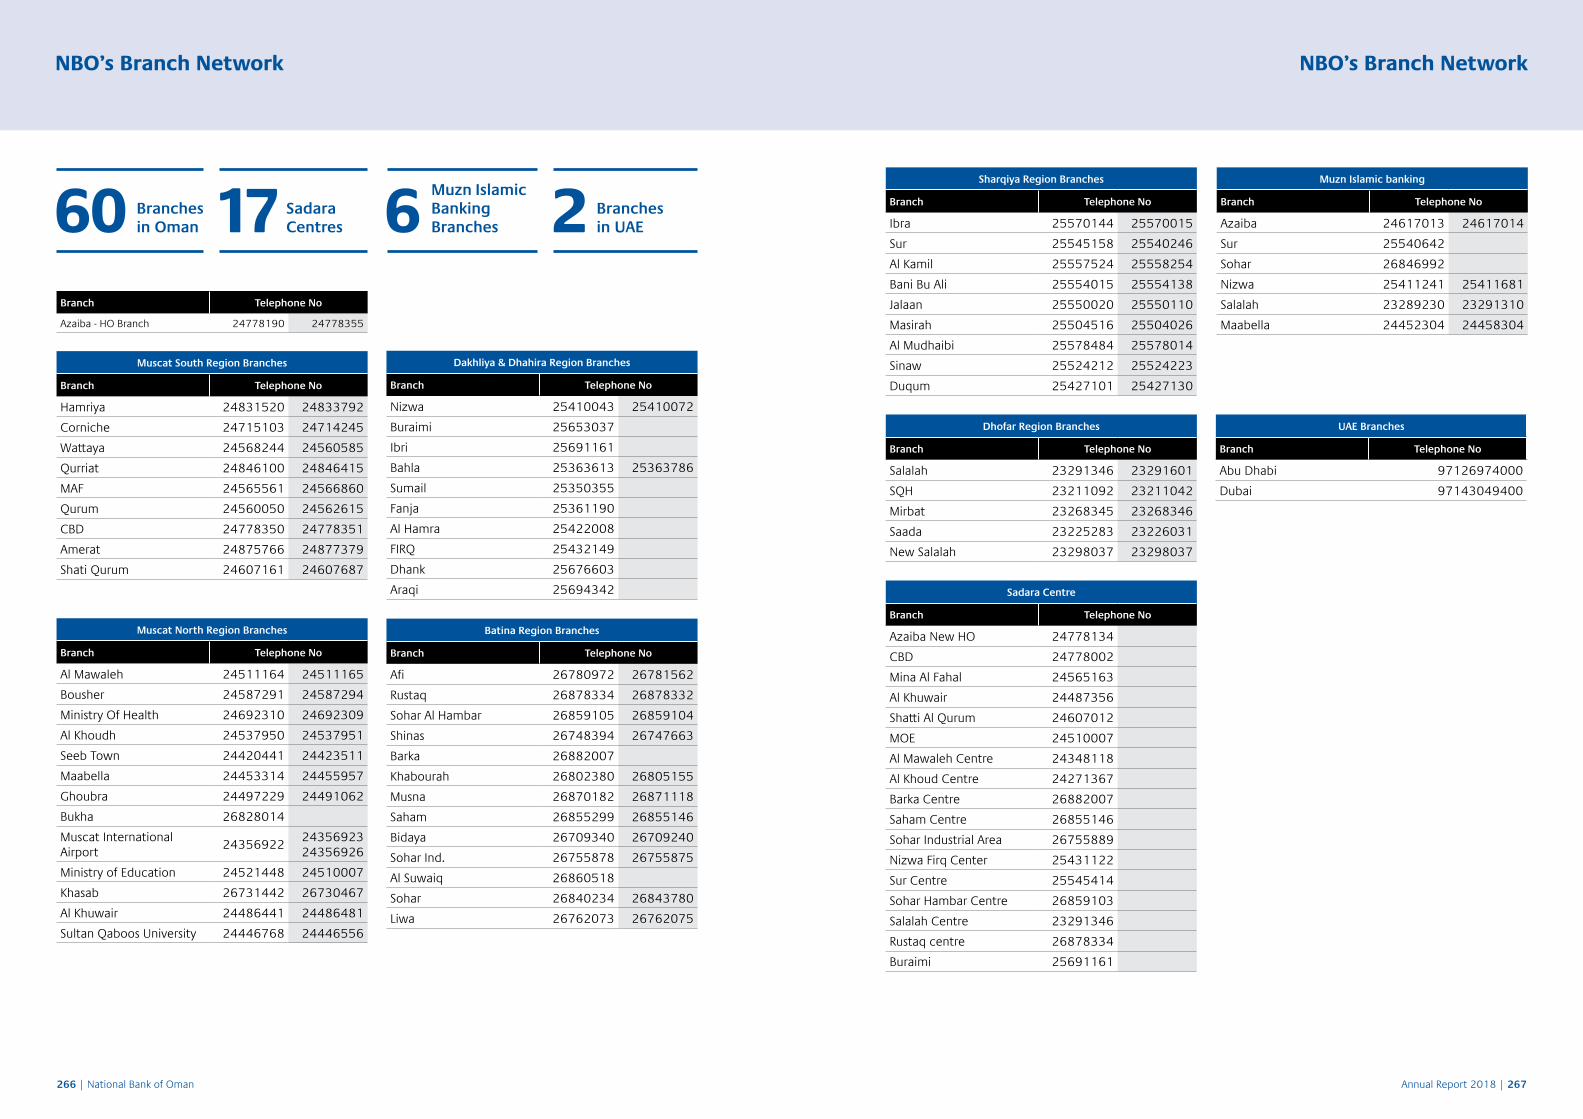
Branch Telephone No
Azaiba - HO Branch 24778190 24778355
Muscat South Region Branches
Branch Telephone No
Hamriya 24831520 24833792
Corniche 24715103 24714245
Wattaya 24568244 24560585
Qurriat 24846100 24846415
MAF 24565561 24566860
Qurum 24560050 24562615
CBD 24778350 24778351
Amerat 24875766 24877379
Shati Qurum 24607161 24607687
Dakhliya & Dhahira Region Branches
Branch Telephone No
Nizwa 25410043 25410072
Buraimi 25653037
Ibri 25691161
Bahla 25363613 25363786
Sumail 25350355
Fanja 25361190
Al Hamra 25422008
FIRQ 25432149
Dhank 25676603
Araqi 25694342
Batina Region Branches
Branch Telephone No
Afi 26780972 26781562
Rustaq 26878334 26878332
Sohar Al Hambar 26859105 26859104
Shinas 26748394 26747663
Barka 26882007
Khabourah 26802380 26805155
Musna 26870182 26871118
Saham 26855299 26855146
Bidaya 26709340 26709240
Sohar Ind. 26755878 26755875
Al Suwaiq 26860518
Sohar 26840234 26843780
Liwa 26762073 26762075
Muscat North Region Branches
Branch Telephone No
Al Mawaleh 24511164 24511165
Bousher 24587291 24587294
Ministry Of Health 24692310 24692309
Al Khoudh 24537950 24537951
Seeb Town 24420441 24423511
Maabella 24453314 24455957
Ghoubra 24497229 24491062
Bukha 26828014
Muscat International Airport
2435692224356923 24356926
Ministry of Education 24521448 24510007
Khasab 26731442 26730467
Al Khuwair 24486441 24486481
Sultan Qaboos University 24446768 24446556
Sharqiya Region Branches
Branch Telephone No
Ibra 25570144 25570015
Sur 25545158 25540246
Al Kamil 25557524 25558254
Bani Bu Ali 25554015 25554138
Jalaan 25550020 25550110
Masirah 25504516 25504026
Al Mudhaibi 25578484 25578014
Sinaw 25524212 25524223
Duqum 25427101 25427130
Muzn Islamic banking
Branch Telephone No
Azaiba 24617013 24617014
Sur 25540642
Sohar 26846992
Nizwa 25411241 25411681
Salalah 23289230 23291310
Maabella 24452304 24458304
Dhofar Region Branches
Branch Telephone No
Salalah 23291346 23291601
SQH 23211092 23211042
Mirbat 23268345 23268346
Saada 23225283 23226031
New Salalah 23298037 23298037
UAE Branches
Branch Telephone No
Abu Dhabi 97126974000
Dubai 97143049400
Sadara Centre
Branch Telephone No
Azaiba New HO 24778134
CBD 24778002
Mina Al Fahal 24565163
Al Khuwair 24487356
Shatti Al Qurum 24607012
MOE 24510007
Al Mawaleh Centre 24348118
Al Khoud Centre 24271367
Barka Centre 26882007
Saham Centre 26855146
Sohar Industrial Area 26755889
Nizwa Firq Center 25431122
Sur Centre 25545414
Sohar Hambar Centre 26859103
Salalah Centre 23291346
Rustaq centre 26878334
Buraimi 25691161
266 | National Bank of Oman Annual Report 2018 | 267
60 17 6 2Branches in Oman
Branches in UAE
Sadara Centres
Muzn Islamic Banking Branches
NBO’s Branch Network NBO’s Branch Network


National Bank of OmanPO Box 751
Ruwi, Muscat Sultanate of Oman
nbo.om


![Islamic Banking in Oman Today and The way forward part 1&2 [published] cpi financials issue 85&86](https://static.fdocuments.net/doc/165x107/568c572e1a28ab4916c97c58/islamic-banking-in-oman-today-and-the-way-forward-part-12-published-cpi.jpg)