Annual Report 2017 - Santen Pharmaceutical
116
Annual Report 2017 Ophthalmology Is Our Singular Focus Year Ended March 31, 2017 Annual Report 2017
Transcript of Annual Report 2017 - Santen Pharmaceutical
Annual Report 2017
Ophthalmology Is Our Singular Focus Year Ended March 31, 2017
Annual Report 2017
C O N T E N T S
About Santen Pharmaceutical Co., Ltd.1 Santen’s Values
2 Value Creation
4 Value Chain
6 Input and Output
8 Financial and Non-Financial Highlights
Top Message
Strategic Vision14 Long-Term Strategic Vision and Medium-Term Management Plan
16 Financial Strategy
17 Human Resource Development
Feature: Contributions to the World’s Glaucoma Patients
Business Activities24 Research and Development
28 Product Supply
30 Quality Compliance
32 Sales and Marketing, and Review of Operations
Corporate Social Responsibility (CSR)40 CSR Management
42 CSR Activities
Corporate Governance46 Corporate Governance
52 Board of Directors, Corporate Auditors and Corporate Officers
Risks Related to Our Business
Financial Information and Corporate Information56 Eleven-Year Summary of Selected Financial Data
58 Financial Section
108 Business Bases
110 History
112 Corporate Information/Stock Information
113 Santen’s Disclosure Materials
1
10
14
18
24
40
46
55
56
The following are registered trademarks of Santen’s alliance partners:
Cravit and Tarivid (Daiichi Sankyo Company, Limited);
Detantol (Eisai R&D Management Co., Ltd.);
Livostin (Johnson & Johnson);
Rescula (Sucampo Pharma, LLC)
Eylea (Bayer); and
Alesion (Boehringer Ingelheim)
Editorial PolicyThe Santen Group has adopted a policy to integrate its Annual and CSR reports into an integrated report that provides a view of overall business activities based on Santen’s Values. The new report is intended to provide customers and society an understanding of Company values and includes comprehensive coverage of financial information as well as non-financial information such as management strategies, review of operations and CSR activities.
Information ProvidedInformation contained in this report is selected in order of importance from both aspects of value creation for Santen and the impact on stakeholders.
Note on Accounting StandardsThe Santen Group has adopted International Financial Reporting Standards (IFRS) from the fiscal year ended March 31, 2015, for the purpose of enhancing the international comparability of its financial information. Figures for the fiscal year ended March 31, 2014 have been restated to conform to IFRS for comparison and analysis purposes.
Note Concerning GraphsUnless otherwise noted, graphs in this annual report are based on fiscal years ended March 31.
Note Concerning DataSome information in this annual report is based on IMS data (JPM, MIDAS).Source: Copyright 2017©QuintilesIMS.Santen analysis based on IMS-JPM/MIDAS data from April 2012 to March 2017.Reprinted with permission.
Caution Concerning Forward-Looking StatementsThis annual report contains forward-looking statements regarding the Company’s plans, strategies and results for the future. All forward-looking statements are based on judgments derived from the information available to the Company at the time of publication. Certain risks and uncertainties could cause the Company’s actual results to differ materially from any projections presented in this report. These risks and uncertainties include, but are not limited to, adverse economic conditions, delays in new products launch, currency exchange rate, legislative and regulatory developments.
Applicable ScopeSanten Pharmaceutical Co., Ltd. and consolidated subsidiaries Reports on CSR activities may refer to Santen Pharmaceutical Co., Ltd., subsidiaries in Japan and certain overseas subsidiaries.
Reporting PeriodApril 1, 2016 to March 31, 2017 (includes some information from April 1, 2017 onward)
Reference Guidelines・International Integrated Reporting Council, The International Integrated Reporting Framework・Global Reporting Initiative, The GRI Sustainability Reporting Guidelines G4・Ministry of the Environment, Environmental Reporting Guidelines 2012
Santen Pharmaceutical Co., Ltd. Annual Report 2017 1
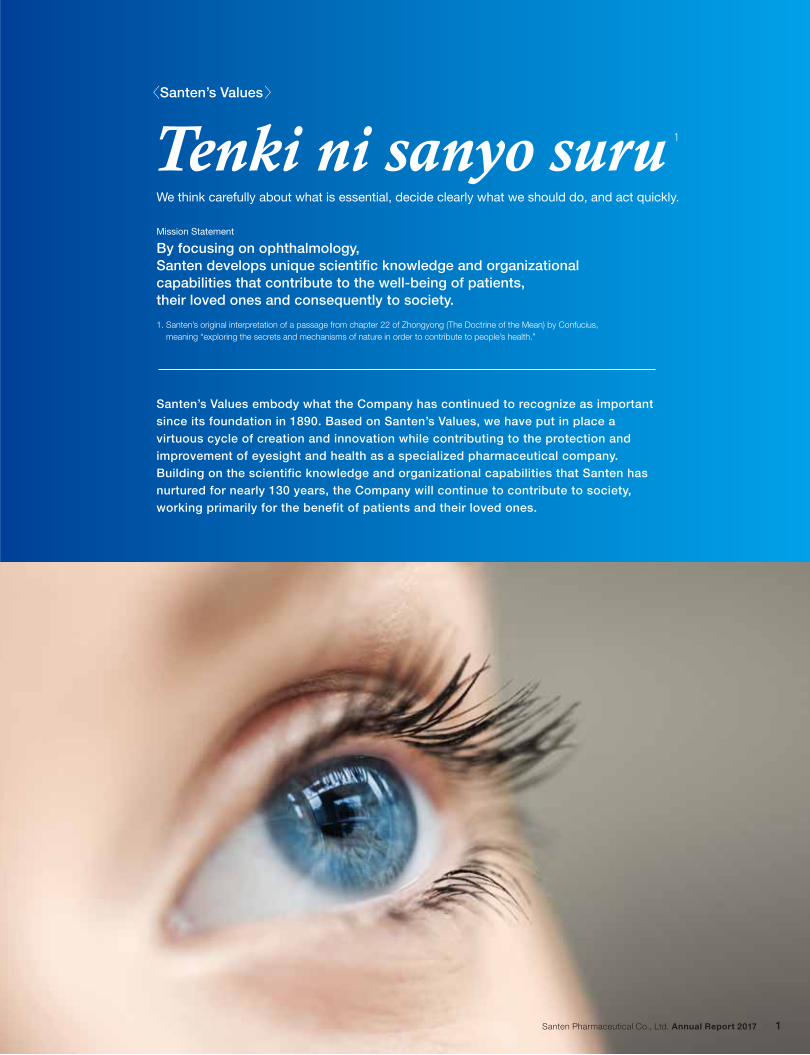
〈Santen’s Values〉
We think carefully about what is essential, decide clearly what we should do, and act quickly.
Mission Statement
By focusing on ophthalmology, Santen develops unique scientific knowledge and organizational capabilities that contribute to the well-being of patients, their loved ones and consequently to society.
1. Santen’s original interpretation of a passage from chapter 22 of Zhongyong (The Doctrine of the Mean) by Confucius, meaning “exploring the secrets and mechanisms of nature in order to contribute to people’s health.”
Santen’s Values embody what the Company has continued to recognize as important since its foundation in 1890. Based on Santen’s Values, we have put in place a virtuous cycle of creation and innovation while contributing to the protection and improvement of eyesight and health as a specialized pharmaceutical company. Building on the scientific knowledge and organizational capabilities that Santen has nurtured for nearly 130 years, the Company will continue to contribute to society, working primarily for the benefit of patients and their loved ones.
1
Santen’s Values
Santen Pharmaceutical Co., Ltd. Annual Report 20172
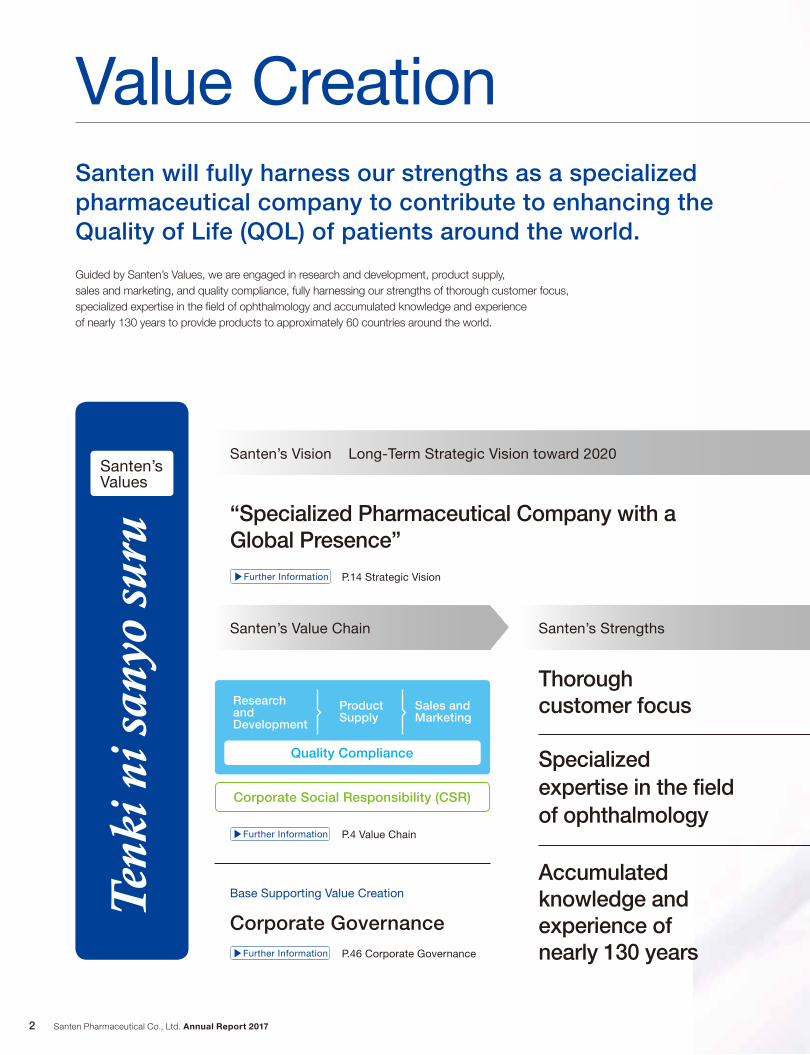
Santen will fully harness our strengths as a specialized pharmaceutical company to contribute to enhancing the Quality of Life (QOL) of patients around the world.
Value Creation
Santen’s Vision Long-Term Strategic Vision toward 2020
“Specialized Pharmaceutical Company with a Global Presence”
P.14 Strategic Vision▶Further Information
Thorough customer focus
Specialized expertise in the field of ophthalmology
Accumulated knowledge and experience of nearly 130 years
Corporate Governance
Base Supporting Value Creation
Santen’s Value Chain
P.4 Value Chain▶Further Information
P.46 Corporate Governance▶Further Information
Quality Compliance
Research and Development
Product Supply
Sales and Marketing
Corporate Social Responsibility (CSR)
Santen’s Strengths
Guided by Santen’s Values, we are engaged in research and development, product supply, sales and marketing, and quality compliance, fully harnessing our strengths of thorough customer focus, specialized expertise in the fi eld of ophthalmology and accumulated knowledge and experience of nearly 130 years to provide products to approximately 60 countries around the world.
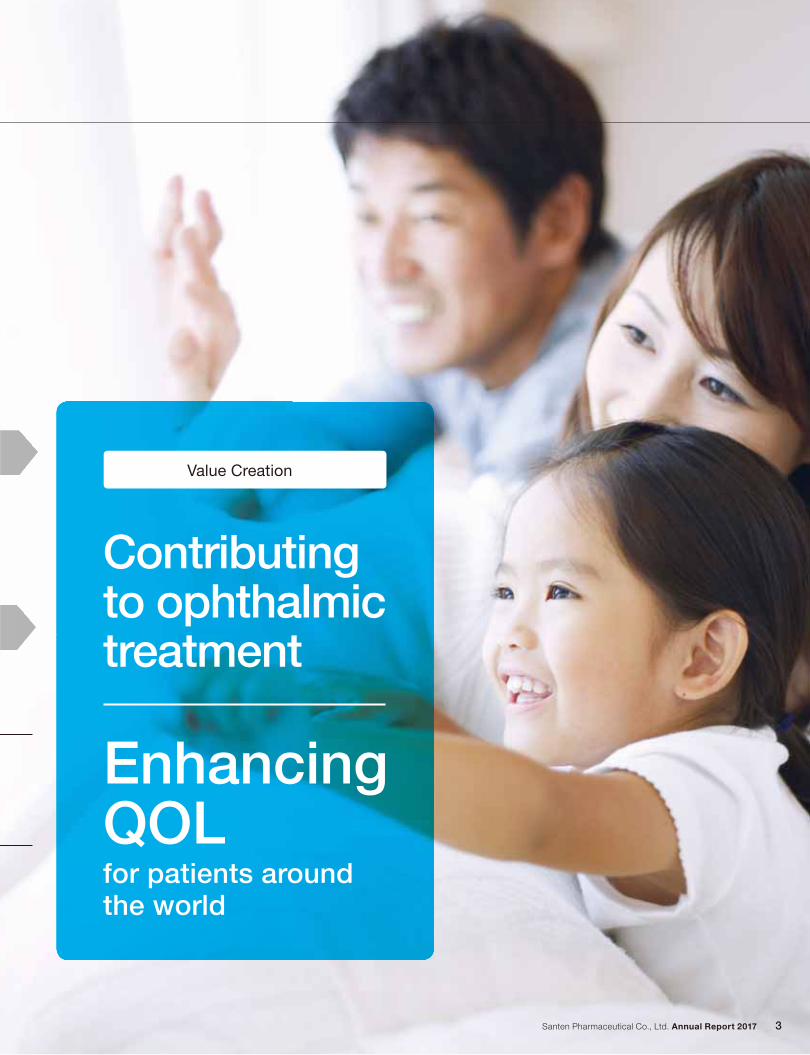
for patients around the world
Enhancing QOL
Santen Pharmaceutical Co., Ltd. Annual Report 2017 3
Value Creation
Contributing to ophthalmic treatment
Santen Pharmaceutical Co., Ltd. Annual Report 20174
Quality Compliance
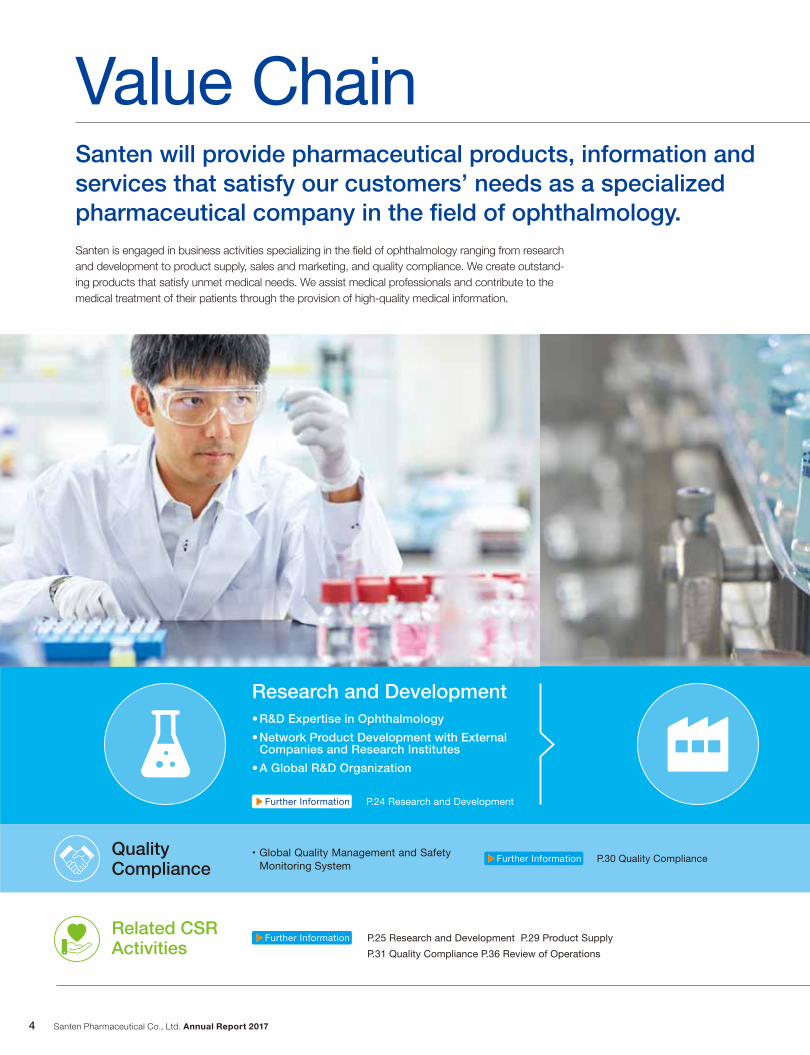
Research and Development• R&D Expertise in Ophthalmology
• Network Product Development with External Companies and Research Institutes
• A Global R&D Organization
P.24 Research and Development
• Global Quality Management and Safety Monitoring System P.30 Quality Compliance▶Further Information
▶Further Information
Related CSR Activities
Value ChainSanten will provide pharmaceutical products, information and services that satisfy our customers’ needs as a specialized pharmaceutical company in the field of ophthalmology.Santen is engaged in business activities specializing in the fi eld of ophthalmology ranging from research and development to product supply, sales and marketing, and quality compliance. We create outstand-ing products that satisfy unmet medical needs. We assist medical professionals and contribute to the medical treatment of their patients through the provision of high-quality medical information.
P.25 Research and Development P.29 Product Supply P.31 Quality Compliance P.36 Review of Operations
▶Further Information
Santen Pharmaceutical Co., Ltd. Annual Report 2017 5
Please refer to P.40 CSR for Santen’s basic CSR policies and initiatives.
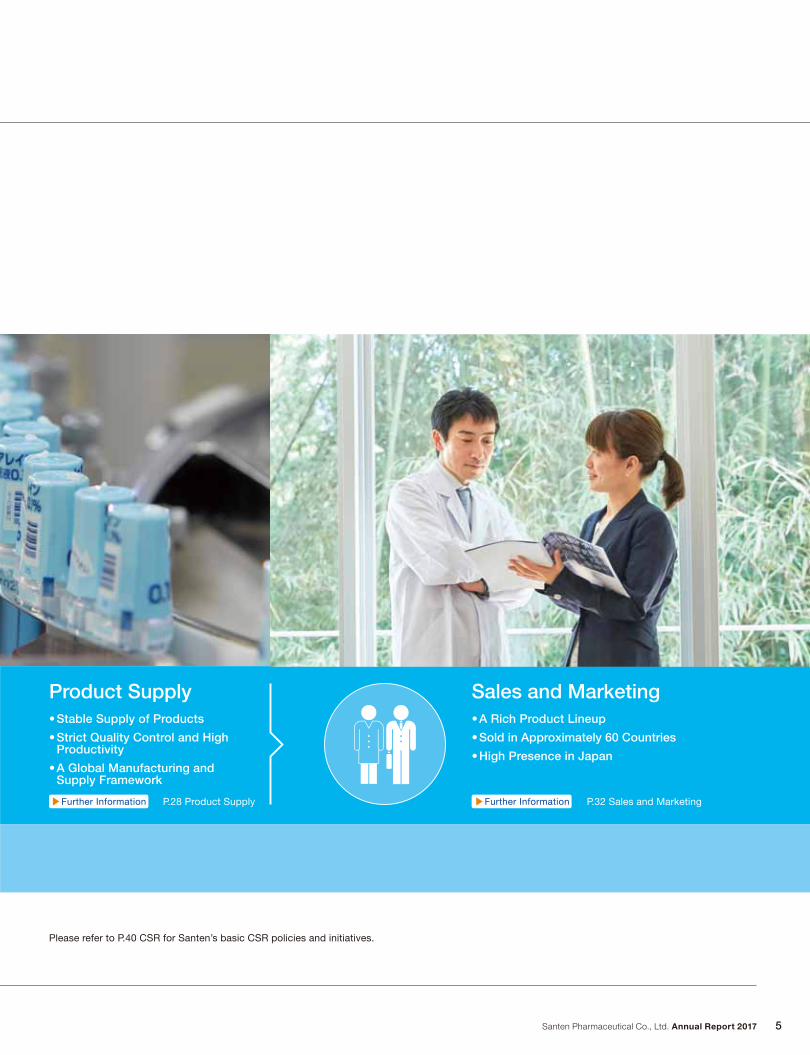
• A Rich Product Lineup
• Sold in Approximately 60 Countries
• High Presence in Japan
Sales and Marketing
P.32 Sales and Marketing
• Stable Supply of Products
• Strict Quality Control and High Productivity
• A Global Manufacturing and Supply Framework
Product Supply
P.28 Product Supply▶Further Information ▶Further Information
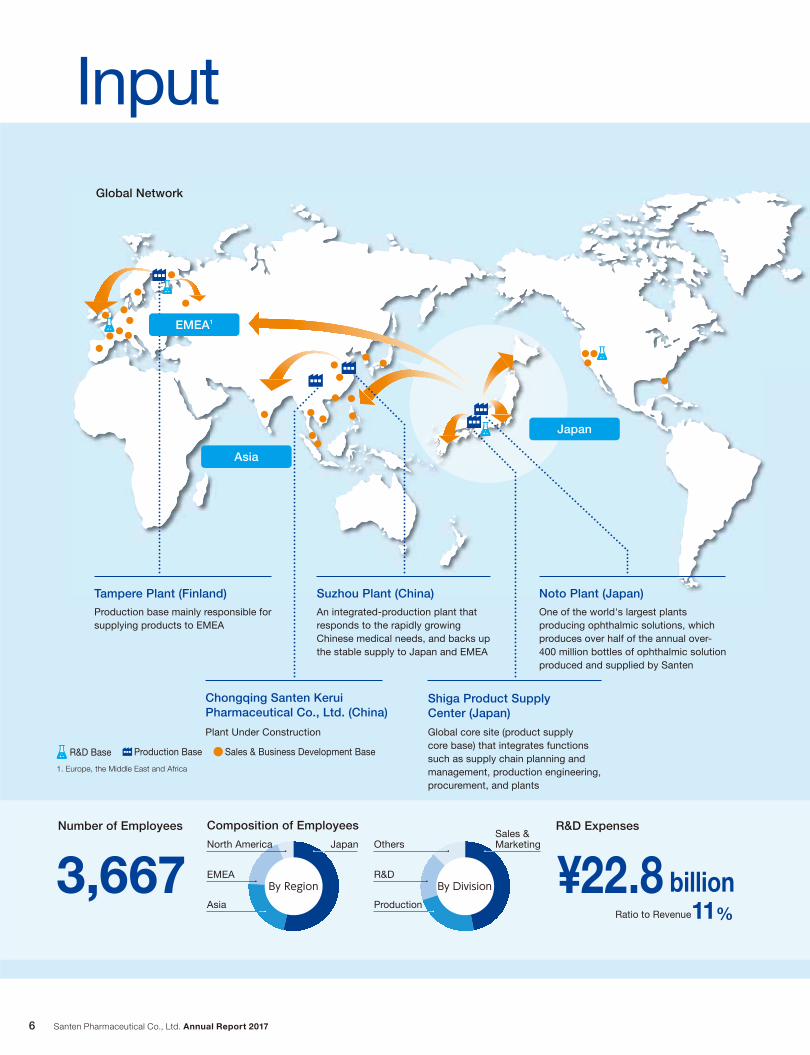
Santen Pharmaceutical Co., Ltd. Annual Report 20176
Input
1. Europe, the Middle East and Africa
Asia
Japan
Chongqing Santen Kerui Pharmaceutical Co., Ltd. (China)
Plant Under Construction
Tampere Plant (Finland)
Production base mainly responsible for supplying products to EMEA
Suzhou Plant (China)
An integrated-production plant that responds to the rapidly growing Chinese medical needs, and backs up the stable supply to Japan and EMEA
R&D ExpensesNumber of Employees
3,667
Noto Plant (Japan)
One of the world's largest plants producing ophthalmic solutions, which produces over half of the annual over-400 million bottles of ophthalmic solution produced and supplied by Santen
Shiga Product Supply Center (Japan)
Global core site (product supply core base) that integrates functions such as supply chain planning and management, production engineering, procurement, and plants
¥22.8 billion
EMEA1
Global Network
Sales & Business Development BaseProduction Base R&D Base
Ratio to Revenue11%
Composition of Employees
Others
R&D
ProductionBy Region By Division
JapanSales & MarketingNorth America
EMEA
Asia
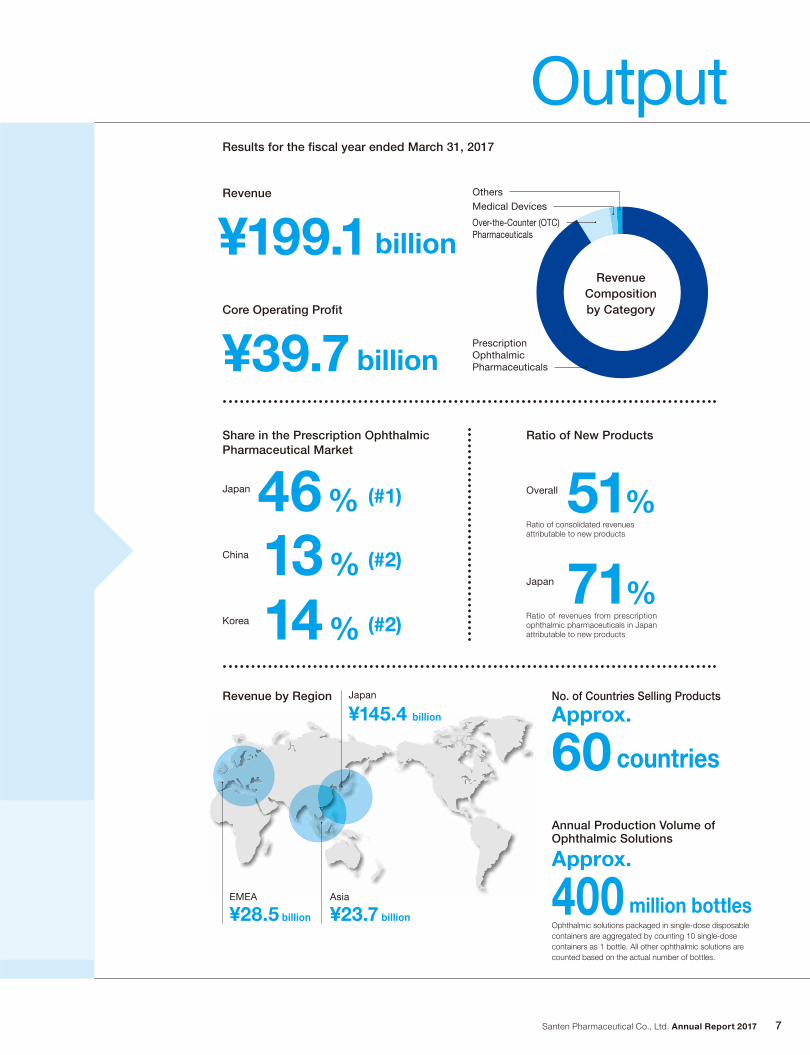
Santen Pharmaceutical Co., Ltd. Annual Report 2017 7
OutputRevenue
¥199.1 billion
Core Operating Profit
¥39.7 billion
Revenue Composition by Category
OthersMedical DevicesOver-the-Counter (OTC) Pharmaceuticals
Prescription Ophthalmic Pharmaceuticals
No. of Countries Selling Products
Approx.
60 countries
Annual Production Volume of Ophthalmic Solutions
Approx.
400 million bottlesOphthalmic solutions packaged in single-dose disposable containers are aggregated by counting 10 single-dose containers as 1 bottle. All other ophthalmic solutions are counted based on the actual number of bottles.
¥145.4 billion
Japan Revenue by Region
¥28.5 billion
EMEA
¥23.7 billion
Asia
Ratio of New ProductsShare in the Prescription Ophthalmic Pharmaceutical Market
Japan 46% (#1)Ratio of consolidated revenues attributable to new products
Overall 51%
Ratio of revenues from prescription ophthalmic pharmaceuticals in Japan attributable to new products
Japan 71%China 13% (#2)
Korea 14% (#2)
Results for the fiscal year ended March 31, 2017
2015 20172014 20162013
39.1 43.1 39.728.7
44.031.230.4
25.919.8
29.2
2016 2017 2018 (forecast)20152014
(¥ Billion) (%)
(t-CO2) (t-CO2/billion yen)(t) (%)
32.7
23.3
10.7
0.02 0.012
146.3
199.1
161.8
27.4
22.1
27.0
19.9
28.5
20.222.9
24.2
20.8
16.5
195.3
2015 20172014 20162013
0.4 0.3
1.40
1.16
0.51
263
198 197
152 156
24,54523,751
27,23725,491
28,082
218.0
The final waste disposal ratio was 0.012%.
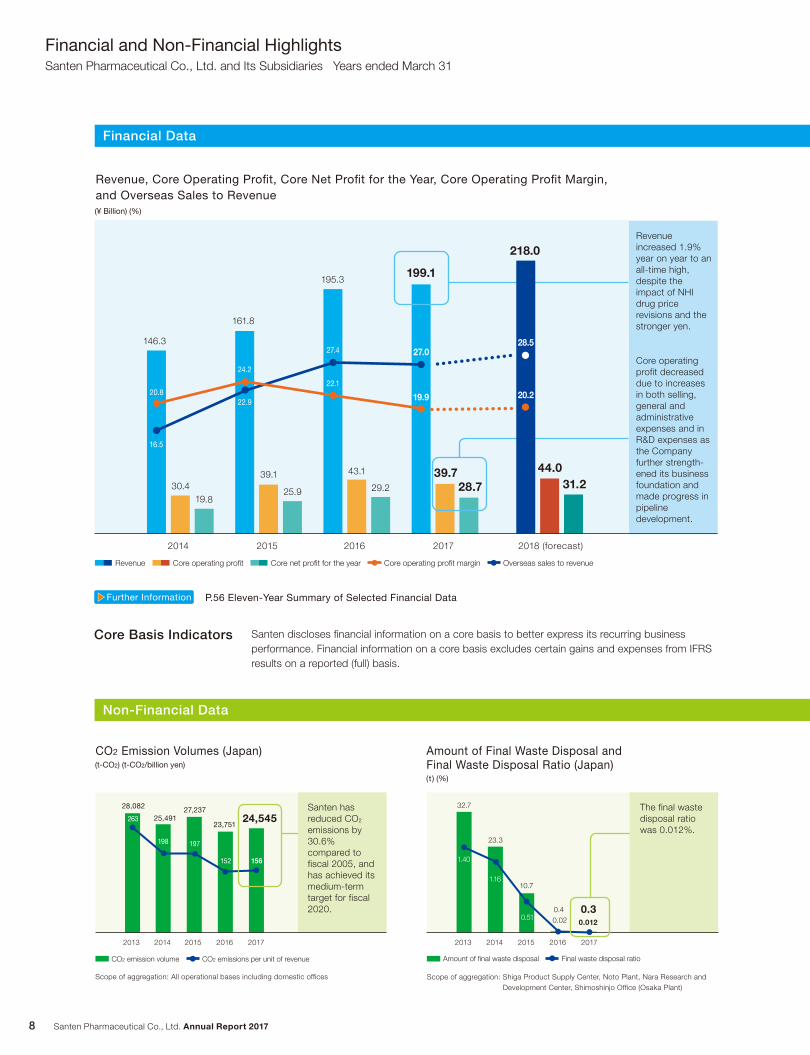
P.56 Eleven-Year Summary of Selected Financial Data
Financial Data
and Overseas Sales to Revenue
Revenue increased 1.9% year on year to an all-time high, despite the impact of NHI drug price revisions and the stronger yen.
Non-Financial Data
Core Basis Indicators
results on a reported (full) basis.
Scope of aggregation: Shiga Product Supply Center, Noto Plant, Nara Research and
CO2 Emission Volumes (Japan) Amount of Final Waste Disposal and Final Waste Disposal Ratio (Japan)
Overseas sales to revenueRevenue
CO2 emissions per unit of revenueCO2 emission volume Final waste disposal ratio
Core operating profit decreased due to increases in both selling, general and administrative
the Company further strength-ened its business foundation and made progress in pipeline development.
Santen has reduced CO2
emissions by 30.6% compared to fiscal 2005, and has achieved its medium-term target for fiscal 2020.
Santen Pharmaceutical Co., Ltd. Annual Report 20178
Financial and Non-Financial HighlightsSanten Pharmaceutical Co., Ltd. and Its Subsidiaries Years ended March 31
▶▶Further Information
2016 2018 (forecast)2015 20172014
2016 2018 (forecast)2015 20172014
16.9 17.5
20.0
22.8
11.5 10.8 10.211.4
(km3) (km3/billion yen)
46.3
3,230
3,6673,463
3,050 3,072
25.0
2016 2018 (forecast)2015 20172014
(%)
11.5
2016 2018 (forecast)2015 20172014
2015 20172014 20162013 2015 20172014 20162013
(¥ Billion) (%)
(¥) (%)(¥)
4.3
3.1 3.02.6
2.9
419
460411405
459
Santen has positioned the stable return of profits to shareholders as a key management priority.
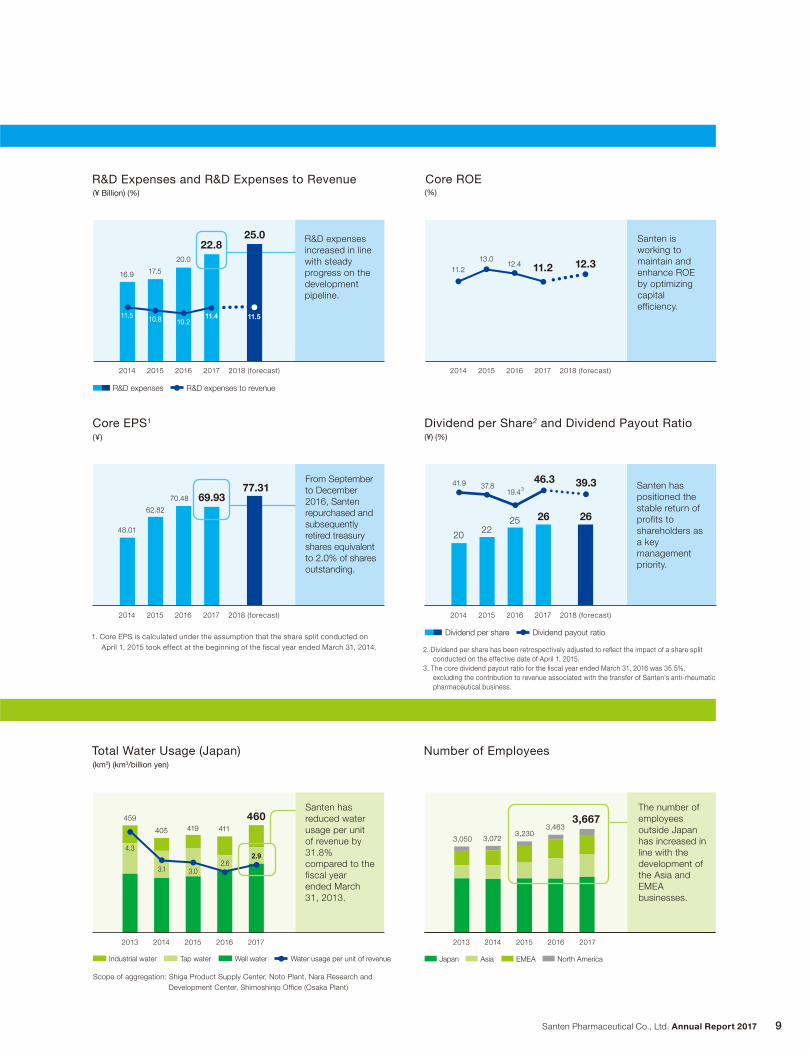
Santen has reduced water usage per unit of revenue by 31.8% compared to the fiscal year ended March 31, 2013.
The number of employees outside Japan has increased in line with the development of the Asia and EMEA businesses.
R&D Expenses and R&D Expenses to Revenue
Core EPS1
1. Core EPS is calculated under the assumption that the share split conducted on
2 and Dividend Payout Ratio
Core ROE
Santen is working to maintain and enhance ROE by optimizing capital efficiency.
conducted on the effective date of April 1, 2015.
pharmaceutical business.
increased in line with steady progress on the development pipeline.
Scope of aggregation: Shiga Product Supply Center, Noto Plant, Nara Research and
Dividend payout ratioDividend per share
Water usage per unit of revenueIndustrial water Tap water Well water Japan Asia EMEA North America
From September to December 2016, Santen repurchased and subsequently retired treasury shares equivalent to 2.0% of shares outstanding.
Total Water Usage (Japan)
25 26 26
20 22
19.43
46.3 39.341.9 37.8
12.4 11.211.213.0 12.3
62.82
70.48 69.9377.31
48.01
Santen Pharmaceutical Co., Ltd. Annual Report 2017 9
10
TOP MESSAGE
Akira KurokawaPresident and Chief Executive Officer
We will fully harness our strengths
as a specialized pharmaceutical
company to contribute to
patient treatments
around the world.
Santen Pharmaceutical Co., Ltd. Annual Report 2017 11
1. Europe, the Middle East and Africa2. Number of patients worldwide with visual impairment due to ophthalmic
disorders and so forth (not including ophthalmic patients without visual impairment, but including people with visual impairment due to ophthalmic disorders and other causes)
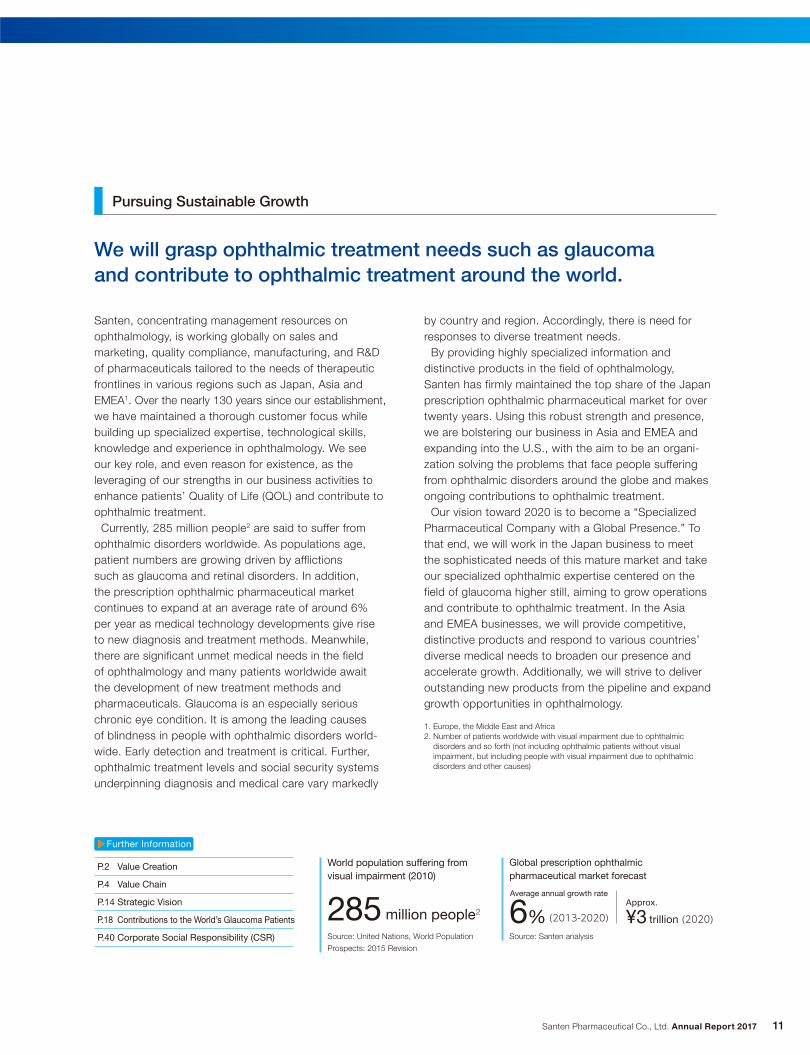
We will grasp ophthalmic treatment needs such as glaucoma and contribute to ophthalmic treatment around the world.
Pursuing Sustainable Growth
Santen, concentrating management resources on ophthalmology, is working globally on sales and marketing, quality compliance, manufacturing, and R&D of pharmaceuticals tailored to the needs of therapeutic frontlines in various regions such as Japan, Asia and EMEA1. Over the nearly 130 years since our establishment, we have maintained a thorough customer focus while building up specialized expertise, technological skills, knowledge and experience in ophthalmology. We see our key role, and even reason for existence, as the leveraging of our strengths in our business activities to enhance patients’ Quality of Life (QOL) and contribute to ophthalmic treatment. Currently, 285 million people2 are said to suffer from ophthalmic disorders worldwide. As populations age, patient numbers are growing driven by afflictions such as glaucoma and retinal disorders. In addition, the prescription ophthalmic pharmaceutical market continues to expand at an average rate of around 6% per year as medical technology developments give rise to new diagnosis and treatment methods. Meanwhile, there are significant unmet medical needs in the field of ophthalmology and many patients worldwide await the development of new treatment methods and pharmaceuticals. Glaucoma is an especially serious chronic eye condition. It is among the leading causes of blindness in people with ophthalmic disorders world-wide. Early detection and treatment is critical. Further, ophthalmic treatment levels and social security systems underpinning diagnosis and medical care vary markedly
by country and region. Accordingly, there is need for responses to diverse treatment needs. By providing highly specialized information and distinctive products in the field of ophthalmology, Santen has firmly maintained the top share of the Japan prescription ophthalmic pharmaceutical market for over twenty years. Using this robust strength and presence, we are bolstering our business in Asia and EMEA and expanding into the U.S., with the aim to be an organi-zation solving the problems that face people suffering from ophthalmic disorders around the globe and makes ongoing contributions to ophthalmic treatment. Our vision toward 2020 is to become a “Specialized Pharmaceutical Company with a Global Presence.” To that end, we will work in the Japan business to meet the sophisticated needs of this mature market and take our specialized ophthalmic expertise centered on the field of glaucoma higher still, aiming to grow operations and contribute to ophthalmic treatment. In the Asia and EMEA businesses, we will provide competitive, distinctive products and respond to various countries’ diverse medical needs to broaden our presence and accelerate growth. Additionally, we will strive to deliver outstanding new products from the pipeline and expand growth opportunities in ophthalmology.
▶Further Information
P.2 Value CreationP.4 Value ChainP.14 Strategic VisionP.18 Contributions to the World’s Glaucoma PatientsP.40 Corporate Social Responsibility (CSR)
285 million people
World population suffering from visual impairment (2010)
Source: United Nations, World Population
Prospects: 2015 Revision
2 ¥3 trillion (2020)6%
Global prescription ophthalmic pharmaceutical market forecast
Source: Santen analysis
Average annual growth rate
(2013-2020)Approx.
Santen Pharmaceutical Co., Ltd. Annual Report 201712
Top Message
Performance and Outlook
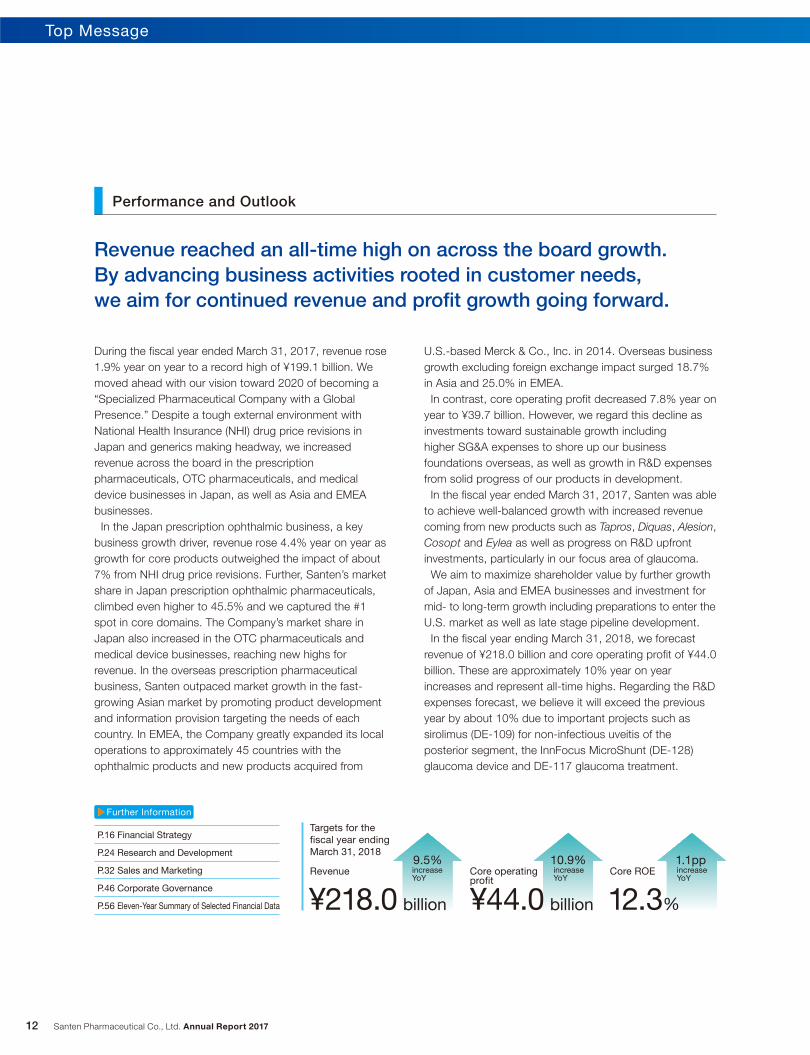
Revenue reached an all-time high on across the board growth.By advancing business activities rooted in customer needs, we aim for continued revenue and profit growth going forward.
▶Further Information
P.16 Financial StrategyP.24 Research and DevelopmentP.32 Sales and MarketingP.46 Corporate GovernanceP.56 Eleven-Year Summary of Selected Financial Data
Targets for the fiscal year ending March 31, 2018 9.5% 10.9% 1.1pp
¥218.0 billion
Revenue
¥44.0 billion
Core operating profit
12.3%
Core ROE
During the fiscal year ended March 31, 2017, revenue rose 1.9% year on year to a record high of ¥199.1 billion. We moved ahead with our vision toward 2020 of becoming a “Specialized Pharmaceutical Company with a Global Presence.” Despite a tough external environment with National Health Insurance (NHI) drug price revisions in Japan and generics making headway, we increased revenue across the board in the prescription pharmaceuticals, OTC pharmaceuticals, and medical device businesses in Japan, as well as Asia and EMEA businesses. In the Japan prescription ophthalmic business, a key business growth driver, revenue rose 4.4% year on year as growth for core products outweighed the impact of about 7% from NHI drug price revisions. Further, Santen’s market share in Japan prescription ophthalmic pharmaceuticals, climbed even higher to 45.5% and we captured the #1 spot in core domains. The Company’s market share in Japan also increased in the OTC pharmaceuticals and medical device businesses, reaching new highs for revenue. In the overseas prescription pharmaceutical business, Santen outpaced market growth in the fast-growing Asian market by promoting product development and information provision targeting the needs of each country. In EMEA, the Company greatly expanded its local operations to approximately 45 countries with the ophthalmic products and new products acquired from
U.S.-based Merck & Co., Inc. in 2014. Overseas business growth excluding foreign exchange impact surged 18.7% in Asia and 25.0% in EMEA. In contrast, core operating profit decreased 7.8% year on year to ¥39.7 billion. However, we regard this decline as investments toward sustainable growth including higher SG&A expenses to shore up our business foundations overseas, as well as growth in R&D expenses from solid progress of our products in development. In the fiscal year ended March 31, 2017, Santen was able to achieve well-balanced growth with increased revenue coming from new products such as Tapros, Diquas, Alesion, Cosopt and Eylea as well as progress on R&D upfront investments, particularly in our focus area of glaucoma. We aim to maximize shareholder value by further growth of Japan, Asia and EMEA businesses and investment for mid- to long-term growth including preparations to enter the U.S. market as well as late stage pipeline development. In the fiscal year ending March 31, 2018, we forecast revenue of ¥218.0 billion and core operating profit of ¥44.0 billion. These are approximately 10% year on year increases and represent all-time highs. Regarding the R&D expenses forecast, we believe it will exceed the previous year by about 10% due to important projects such as sirolimus (DE-109) for non-infectious uveitis of the posterior segment, the InnFocus MicroShunt (DE-128) glaucoma device and DE-117 glaucoma treatment.
increaseYoY
increaseYoY
increaseYoY
Santen Pharmaceutical Co., Ltd. Annual Report 2017 13
We will strive to enhance corporate governance while accelerating growth toward realizing our long-term strategic vision.
August 2017
▶▶Further Information
P.16 Financial Strategy Result for the fiscal year ended March 31, 2017
46.3%Dividend payout ratio
Santen is working to enhance and bolster corporate governance to achieve sustainable growth. While ensuring transparent and sound management practices, we remain focused on improving our business performance in tandem with advancing steps to mitigate risk. In the fiscal year ended March 31, 2017, we analyzed and assessed the Board of Directors’ overall effectiveness and established a
basic policy for steps to enhance governance functions. In addition, we are emphasizing stronger compliance systems and continue to operate in keeping with the globalization of the business to fulfill our social mission of providing appropriate products and services to patients around the world as we develop globally.
We strive to provide stable returns to shareholders.
Shareholder Returns
Santen has positioned the stable return of profits to shareholders as a key management priority and targets a dividend payout ratio of about 40%. We paid annual dividends of ¥26 per share for the fiscal year ended March 31, 2017, a ¥1 increase, bringing the dividend payout ratio to 46.3%. From September to December 2016, Santen repurchased treasury shares equivalent to 2.0% of shares outstanding (at a total acquisition cost of ¥12.3 billion), and subsequently retired the shares (total number of retired shares: 8,300,000). As a result, the ratio of return to shareholders taking into account dividends and the
repurchase of treasury shares (total return ratio) is over 100%. Going forward, we remain committed to providing stable shareholder returns. At the same time, we will continue to retain funds primarily for R&D investments, while examining the adoption of a flexible stance that includes the acquisition of treasury shares, as necessary. As a specialized pharmaceutical company, we will keep endeavoring to enhance QOL for patients around the world. We look forward to continued support from our stakeholders.
Akira Kurokawa President and Chief Executive Officer
Santen Pharmaceutical Co., Ltd. Annual Report 201714
Strategic Vision
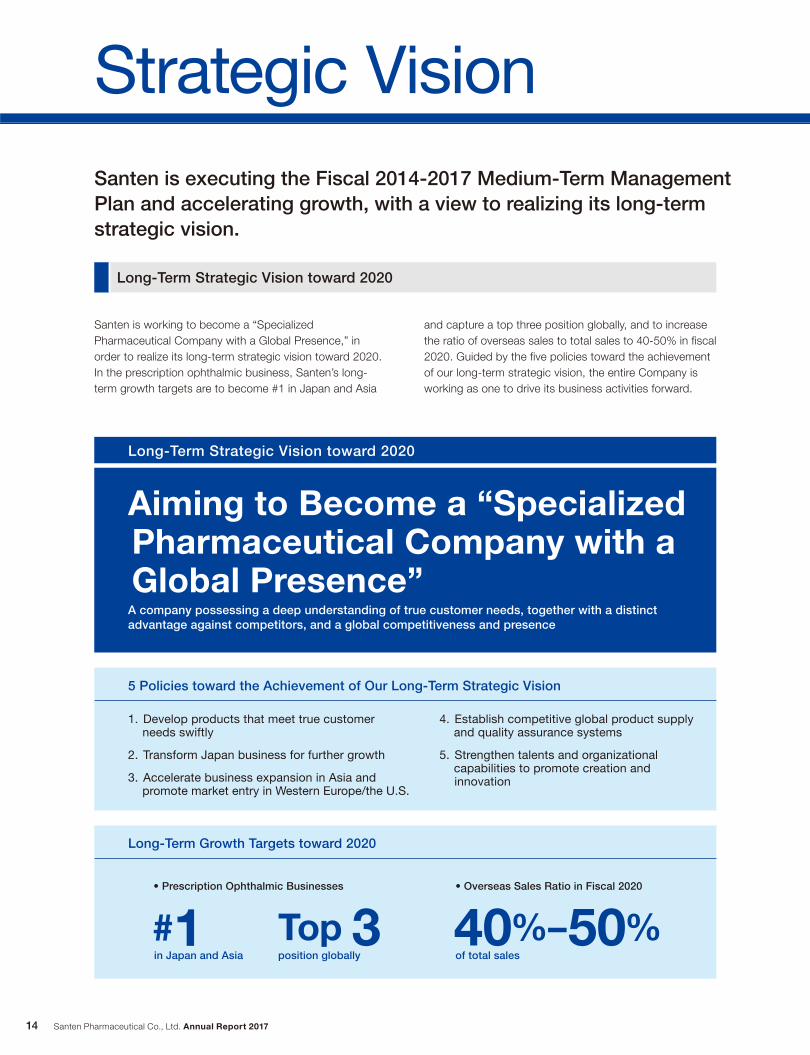
Santen is working to become a “Specialized Pharmaceutical Company with a Global Presence,” in order to realize its long-term strategic vision toward 2020. In the prescription ophthalmic business, Santen’s long-term growth targets are to become #1 in Japan and Asia
and capture a top three position globally, and to increase the ratio of overseas sales to total sales to 40-50% in fiscal 2020. Guided by the five policies toward the achievement of our long-term strategic vision, the entire Company is working as one to drive its business activities forward.
Santen is executing the Fiscal 2014-2017 Medium-Term Management Plan and accelerating growth, with a view to realizing its long-term strategic vision.
Long-Term Strategic Vision toward 2020
Aiming to Become a “Specialized Pharmaceutical Company with a Global Presence”
A company possessing a deep understanding of true customer needs, together with a distinct advantage against competitors, and a global competitiveness and presence
• Prescription Ophthalmic Businesses
in Japan and Asia position globally of total sales
#1 Top 3• Overseas Sales Ratio in Fiscal 2020
40%–50%
5 Policies toward the Achievement of Our Long-Term Strategic Vision
Long-Term Growth Targets toward 2020
1. Develop products that meet true customer needs swiftly
2. Transform Japan business for further growth3. Accelerate business expansion in Asia and
promote market entry in Western Europe/the U.S.
4. Establish competitive global product supply and quality assurance systems
5. Strengthen talents and organizational capabilities to promote creation and innovation
Long-Term Strategic Vision toward 2020
Santen Pharmaceutical Co., Ltd. Annual Report 2017 15
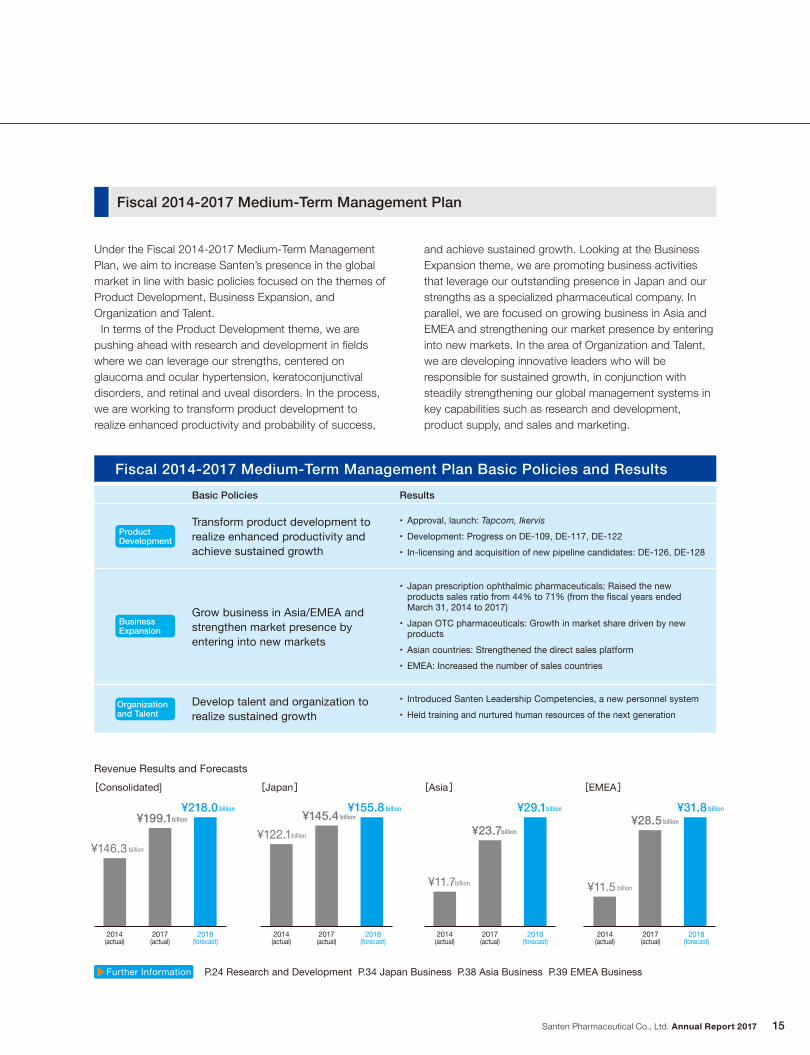
Under the Fiscal 2014-2017 Medium-Term Management Plan, we aim to increase Santen’s presence in the global market in line with basic policies focused on the themes of Product Development, Business Expansion, and Organization and Talent. In terms of the Product Development theme, we are pushing ahead with research and development in fields where we can leverage our strengths, centered on glaucoma and ocular hypertension, keratoconjunctival disorders, and retinal and uveal disorders. In the process, we are working to transform product development to realize enhanced productivity and probability of success,
and achieve sustained growth. Looking at the Business Expansion theme, we are promoting business activities that leverage our outstanding presence in Japan and our strengths as a specialized pharmaceutical company. In parallel, we are focused on growing business in Asia and EMEA and strengthening our market presence by entering into new markets. In the area of Organization and Talent,we are developing innovative leaders who will be responsible for sustained growth, in conjunction with steadily strengthening our global management systems in key capabilities such as research and development, product supply, and sales and marketing.
Revenue Results and Forecasts [Japan]
¥122.1billion
¥145.4 billion¥155.8 billion
[Consolidated]
¥146.3 billion
¥199.1billion
¥218.0 billion
2014(actual)
2014(actual)
2014(actual)
2014(actual)
2017(actual)
2017(actual)
2017(actual)
2017(actual)
2018(forecast)
2018(forecast)
2018(forecast)
2018(forecast)
[Asia]
¥11.7billion
¥23.7billion
¥29.1billion
[EMEA]
¥11.5 billion
¥28.5 billion
¥31.8 billion
Fiscal 2014-2017 Medium-Term Management Plan Basic Policies and Results
Basic Policies Results
Product Development
Transform product development to realize enhanced productivity and achieve sustained growth
• Approval, launch: Tapcom, Ikervis
• Development: Progress on DE-109, DE-117, DE-122• In-licensing and acquisition of new pipeline candidates: DE-126, DE-128
Business Expansion
Grow business in Asia/EMEA and strengthen market presence by entering into new markets
• Japan prescription ophthalmic pharmaceuticals: Raised the new products sales ratio from 44% to 71% (from the fiscal years ended March 31, 2014 to 2017)
• Japan OTC pharmaceuticals: Growth in market share driven by new products
• Asian countries: Strengthened the direct sales platform• EMEA: Increased the number of sales countries
Organization and Talent
Develop talent and organization to realize sustained growth
• Introduced Santen Leadership Competencies, a new personnel system• Held training and nurtured human resources of the next generation
▶Further Information P.24 Research and Development P.34 Japan Business P.38 Asia Business P.39 EMEA Business
Fiscal 2014-2017 Medium-Term Management Plan
IFRS
2016 2018 (forecast)2015 20172014
12.4 11.211.213.0 12.3
From September to December 2016, Santen repurchased treasury shares equivalent to 2.0% of shares outstanding (at a total acquisition cost of ¥12.3 billion), and subsequently retired the shares. As a result, the total return ratio for the fiscal year ended March 31, 2017 was 100.4%.
2017 2018 (forecast)20162008 2009 2010 2011 2012 2013 2014 2015
IFRSJ-GAAP
262522
202020161616
18
26
19.42
46.3 39.341.951.150.8
36.036.354.7
67.2
37.8
Santen Pharmaceutical Co., Ltd. Annual Report 201716
Financial Strategy
Santen will invest in future growth, along with providing steady shareholder returns.
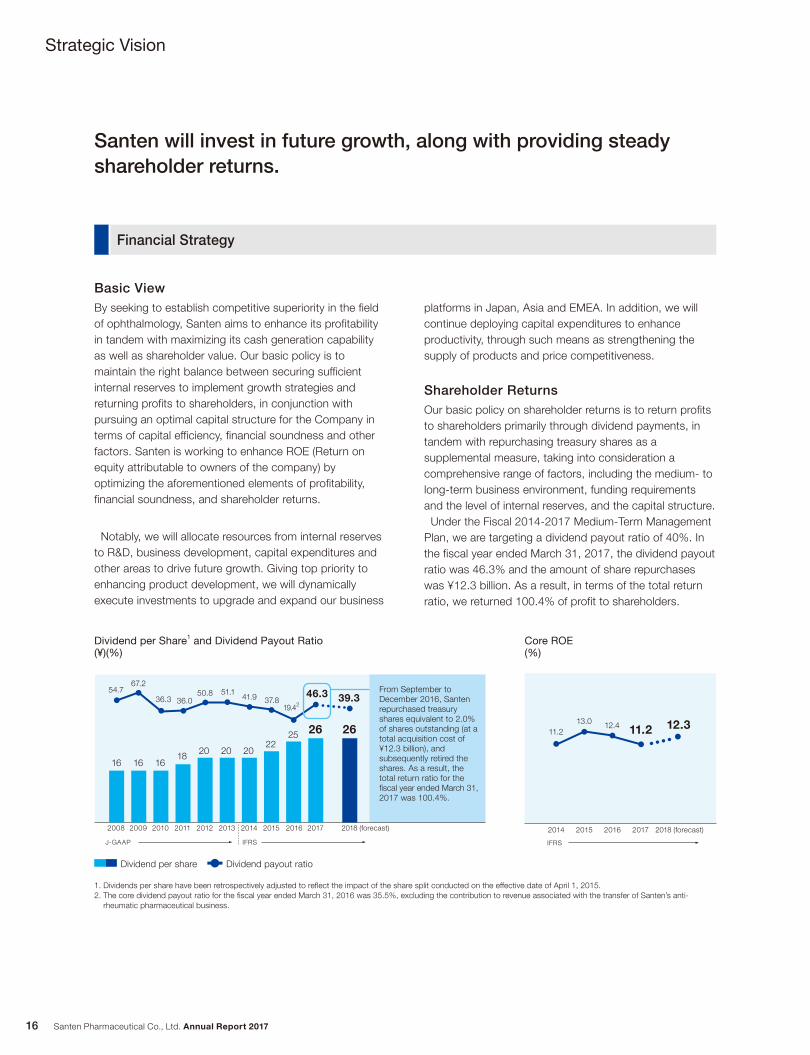
Dividend per Share1 and Dividend Payout Ratio(¥)(%)
Dividend per share Dividend payout ratio
Basic ViewBy seeking to establish competitive superiority in the field of ophthalmology, Santen aims to enhance its profitability in tandem with maximizing its cash generation capability as well as shareholder value. Our basic policy is to maintain the right balance between securing sufficient internal reserves to implement growth strategies and returning profits to shareholders, in conjunction with pursuing an optimal capital structure for the Company in terms of capital efficiency, financial soundness and other factors. Santen is working to enhance ROE (Return on equity attributable to owners of the company) by optimizing the aforementioned elements of profitability, financial soundness, and shareholder returns.
Notably, we will allocate resources from internal reserves to R&D, business development, capital expenditures and other areas to drive future growth. Giving top priority to enhancing product development, we will dynamically execute investments to upgrade and expand our business
Our basic policy on shareholder returns is to return profits to shareholders primarily through dividend payments, in tandem with repurchasing treasury shares as a supplemental measure, taking into consideration a comprehensive range of factors, including the medium- to long-term business environment, funding requirements and the level of internal reserves, and the capital structure. Under the Fiscal 2014-2017 Medium-Term Management Plan, we are targeting a dividend payout ratio of 40%. In the fiscal year ended March 31, 2017, the dividend payout ratio was 46.3% and the amount of share repurchases was ¥12.3 billion. As a result, in terms of the total return ratio, we returned 100.4% of profit to shareholders.
Shareholder Returns
Core ROE(%)
1. Dividends per share have been retrospectively adjusted to reflect the impact of the share split conducted on the effective date of April 1, 2015.2. The core dividend payout ratio for the fiscal year ended March 31, 2016 was 35.5%, excluding the contribution to revenue associated with the transfer of Santen’s anti-
rheumatic pharmaceutical business.
platforms in Japan, Asia and EMEA. In addition, we will continue deploying capital expenditures to enhance productivity, through such means as strengthening the supply of products and price competitiveness.
Strategic Vision
Santen Pharmaceutical Co., Ltd. Annual Report 2017 17
Human Resource Development
Santen is working to develop talent and strengthen organizational capabilities in order to achieve sustained growth.
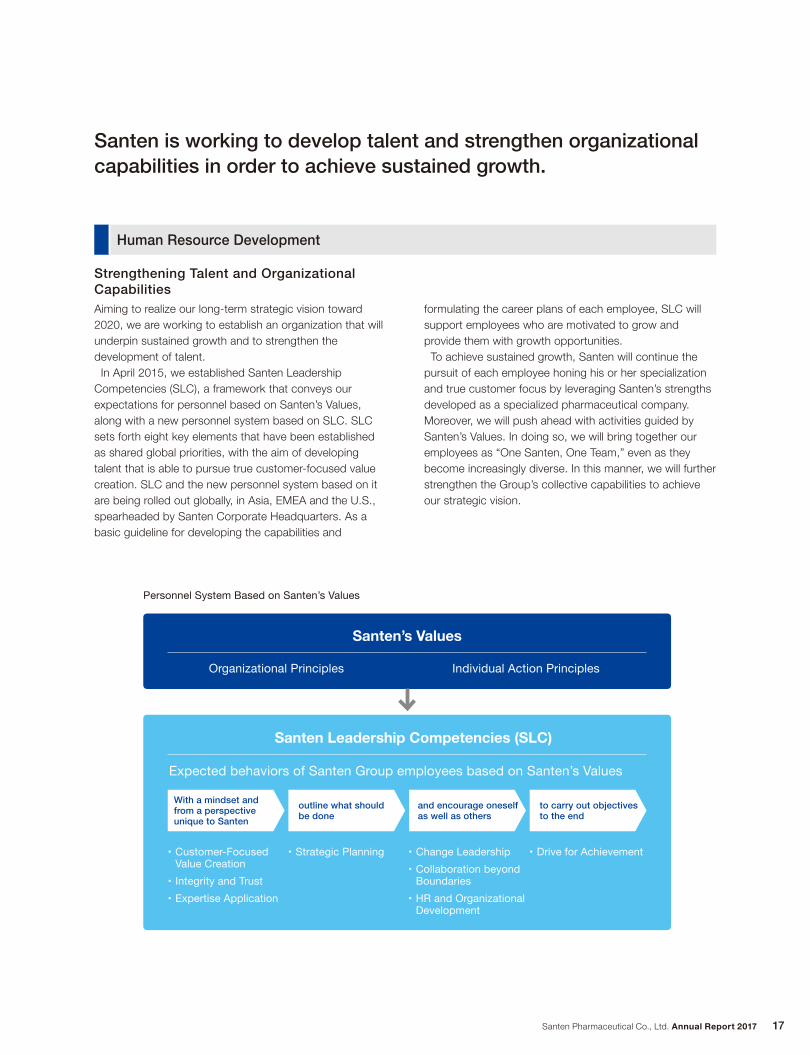
Personnel System Based on Santen’s Values
Santen’s Values
Organizational Principles Individual Action Principles
Santen Leadership Competencies (SLC)
Expected behaviors of Santen Group employees based on Santen’s Values
• Customer-Focused Value Creation
• Integrity and Trust• Expertise Application
• Strategic Planning • Change Leadership• Collaboration beyond
Boundaries• HR and Organizational
Development
• Drive for Achievement
With a mindset and from a perspective unique to Santen
outline what should be done
and encourage oneself as well as others
to carry out objectives to the end
Aiming to realize our long-term strategic vision toward 2020, we are working to establish an organization that will underpin sustained growth and to strengthen the development of talent. In April 2015, we established Santen Leadership Competencies (SLC), a framework that conveys our expectations for personnel based on Santen’s Values, along with a new personnel system based on SLC. SLC sets forth eight key elements that have been established as shared global priorities, with the aim of developing talent that is able to pursue true customer-focused value creation. SLC and the new personnel system based on it are being rolled out globally, in Asia, EMEA and the U.S., spearheaded by Santen Corporate Headquarters. As a basic guideline for developing the capabilities and
formulating the career plans of each employee, SLC will support employees who are motivated to grow and provide them with growth opportunities. To achieve sustained growth, Santen will continue the pursuit of each employee honing his or her specialization and true customer focus by leveraging Santen’s strengths developed as a specialized pharmaceutical company. Moreover, we will push ahead with activities guided by Santen’s Values. In doing so, we will bring together our employees as “One Santen, One Team,” even as they become increasingly diverse. In this manner, we will further strengthen the Group’s collective capabilities to achieve our strategic vision.
Strengthening Talent and Organizational Capabilities
Santen Pharmaceutical Co., Ltd. Annual Report 201718
27%
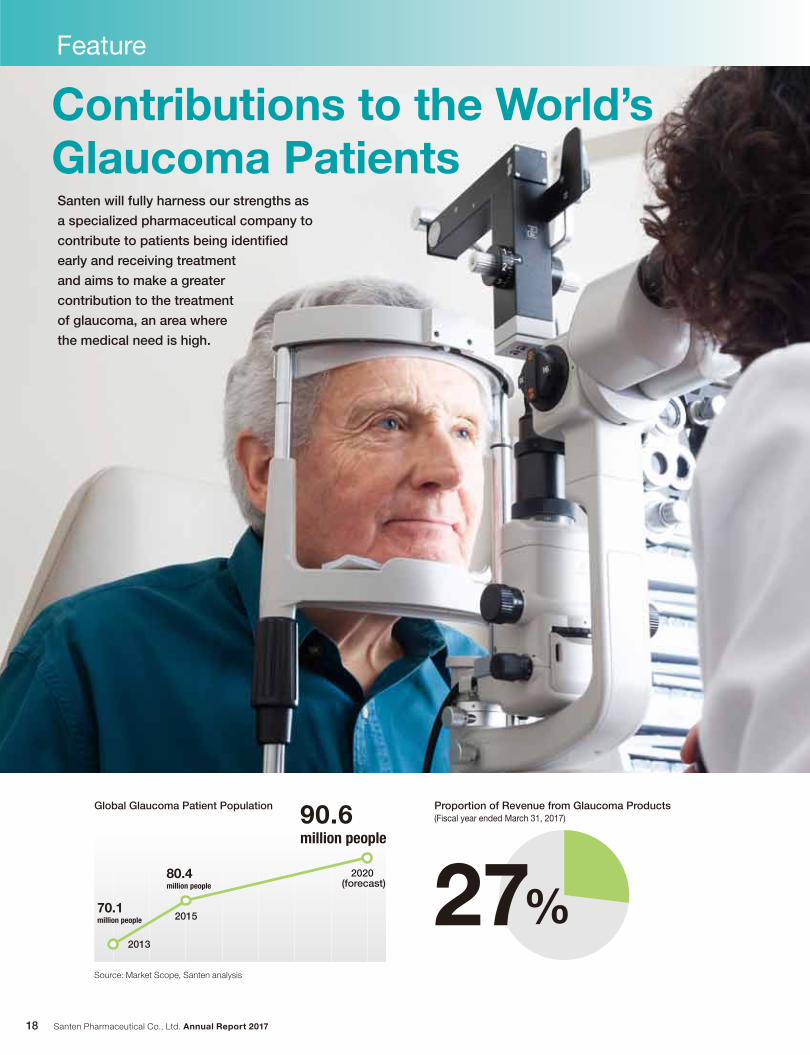
Contributions to the World’s Glaucoma Patients
Feature
Source: Market Scope, Santen analysis
Global Glaucoma Patient Population
80.4million people
2013
2015
2020 (forecast)
90.6million people
70.1million people
Santen will fully harness our strengths as
a specialized pharmaceutical company to
contribute to patients being identifi ed
early and receiving treatment
and aims to make a greater
contribution to the treatment
of glaucoma, an area where
the medical need is high.
Proportion of Revenue from Glaucoma Products(Fiscal year ended March 31, 2017)
GlaucomaFocus on
Santen Pharmaceutical Co., Ltd. Annual Report 2017 19
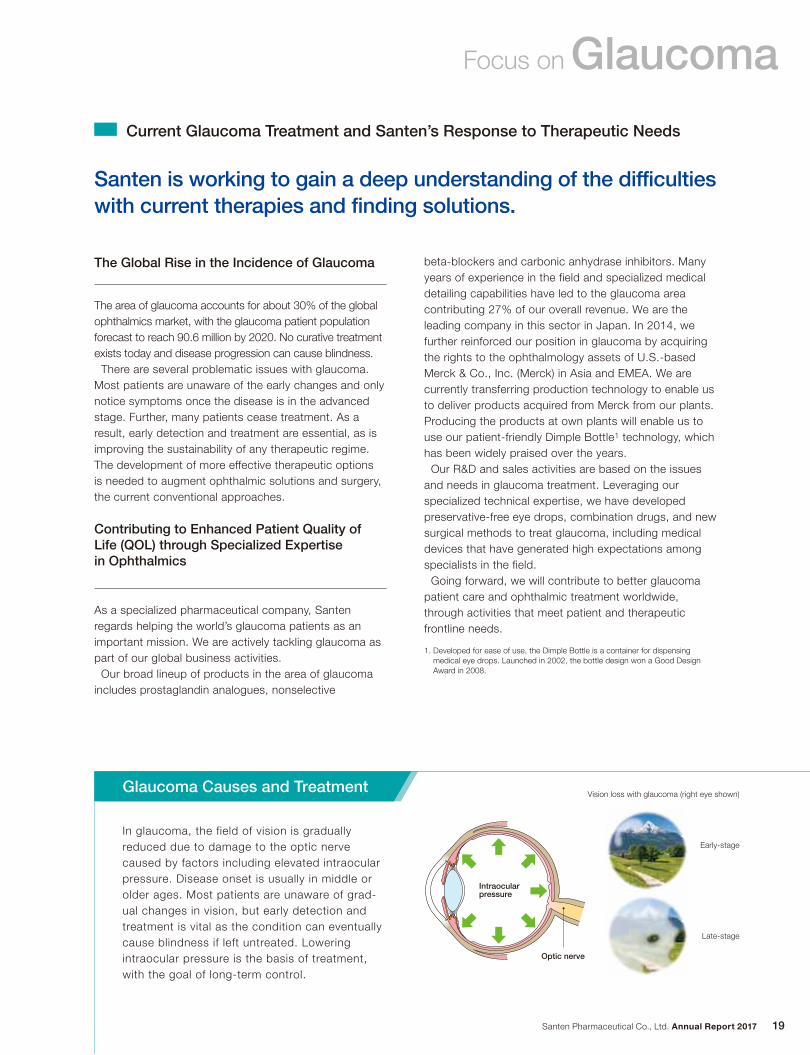
In glaucoma, the field of vision is gradually reduced due to damage to the optic nerve caused by factors including elevated intraocular pressure. Disease onset is usually in middle or older ages. Most patients are unaware of grad-ual changes in vision, but early detection and treatment is vital as the condition can eventually cause blindness if left untreated. Lowering intraocular pressure is the basis of treatment, with the goal of long-term control.
Santen is working to gain a deep understanding of the difficulties with current therapies and finding solutions.
The area of glaucoma accounts for about 30% of the global ophthalmics market, with the glaucoma patient population forecast to reach 90.6 million by 2020. No curative treatment exists today and disease progression can cause blindness. There are several problematic issues with glaucoma. Most patients are unaware of the early changes and only notice symptoms once the disease is in the advanced stage. Further, many patients cease treatment. As a result, early detection and treatment are essential, as is improving the sustainability of any therapeutic regime. The development of more effective therapeutic options is needed to augment ophthalmic solutions and surgery, the current conventional approaches.
The Global Rise in the Incidence of Glaucoma beta-blockers and carbonic anhydrase inhibitors. Many years of experience in the field and specialized medical detailing capabilities have led to the glaucoma area contributing 27% of our overall revenue. We are the leading company in this sector in Japan. In 2014, we further reinforced our position in glaucoma by acquiring the rights to the ophthalmology assets of U.S.-based Merck & Co., Inc. (Merck) in Asia and EMEA. We are currently transferring production technology to enable us to deliver products acquired from Merck from our plants. Producing the products at own plants will enable us to use our patient-friendly Dimple Bottle1 technology, which has been widely praised over the years. Our R&D and sales activities are based on the issues and needs in glaucoma treatment. Leveraging our specialized technical expertise, we have developed preservative-free eye drops, combination drugs, and new surgical methods to treat glaucoma, including medical devices that have generated high expectations among specialists in the field. Going forward, we will contribute to better glaucoma patient care and ophthalmic treatment worldwide, through activities that meet patient and therapeutic frontline needs.
As a specialized pharmaceutical company, Santen regards helping the world’s glaucoma patients as an important mission. We are actively tackling glaucoma as part of our global business activities. Our broad lineup of products in the area of glaucoma includes prostaglandin analogues, nonselective
Contributing to Enhanced Patient Quality of Life (QOL) through Specialized Expertise in Ophthalmics
Early-stage
Late-stage
Vision loss with glaucoma (right eye shown)Glaucoma Causes and Treatment
1. Developed for ease of use, the Dimple Bottle is a container for dispensing medical eye drops. Launched in 2002, the bottle design won a Good Design Award in 2008.
Current Glaucoma Treatment and Santen’s Response to Therapeutic Needs
Intraocular pressure
Optic nerve
Santen Pharmaceutical Co., Ltd. Annual Report 201720
Feature: Contributions to the World’s Glaucoma Patients
Santen is accelerating development of new drugs and devices to satisfy unmet medical needs in the field of glaucoma.
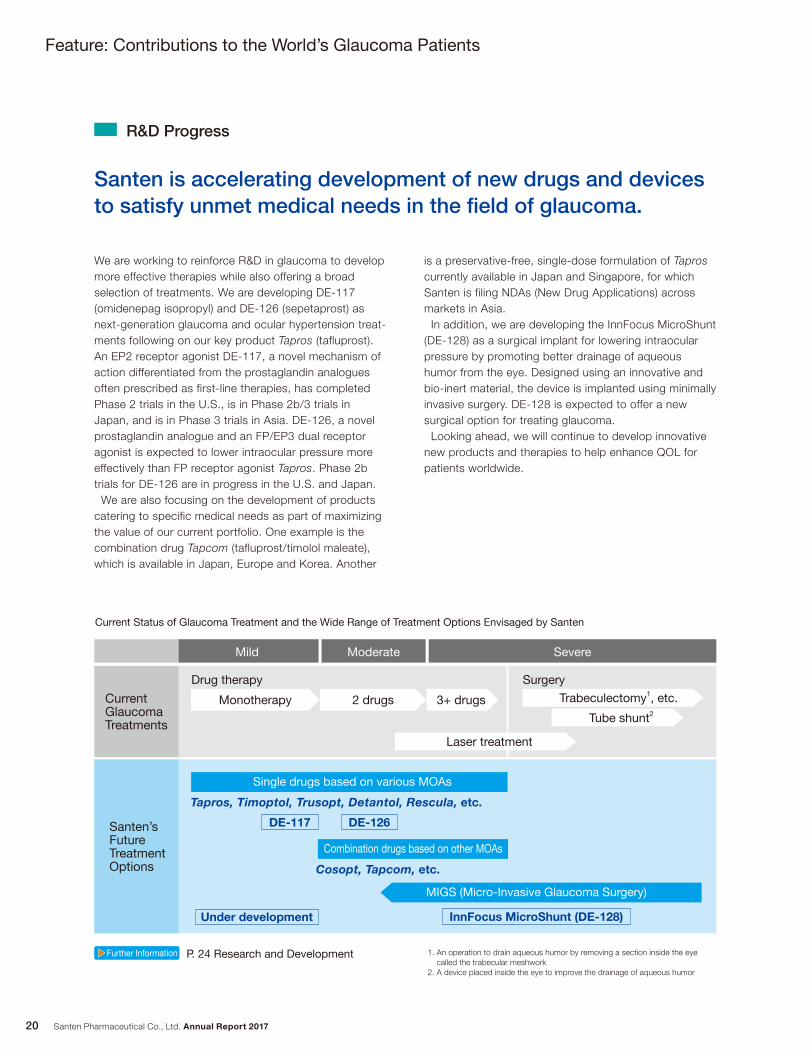
Current Status of Glaucoma Treatment and the Wide Range of Treatment Options Envisaged by Santen
▶▶Further Information P. 24 Research and Development
R&D Progress
We are working to reinforce R&D in glaucoma to develop more effective therapies while also offering a broad selection of treatments. We are developing DE-117 (omidenepag isopropyl) and DE-126 (sepetaprost) as next-generation glaucoma and ocular hypertension treat-ments following on our key product Tapros (tafluprost). An EP2 receptor agonist DE-117, a novel mechanism of action differentiated from the prostaglandin analogues often prescribed as first-line therapies, has completed Phase 2 trials in the U.S., is in Phase 2b/3 trials in Japan, and is in Phase 3 trials in Asia. DE-126, a novel prostaglandin analogue and an FP/EP3 dual receptor agonist is expected to lower intraocular pressure more effectively than FP receptor agonist Tapros. Phase 2b trials for DE-126 are in progress in the U.S. and Japan. We are also focusing on the development of products catering to specific medical needs as part of maximizing the value of our current portfolio. One example is the combination drug Tapcom (tafluprost/timolol maleate), which is available in Japan, Europe and Korea. Another
is a preservative-free, single-dose formulation of Tapros currently available in Japan and Singapore, for which Santen is filing NDAs (New Drug Applications) across markets in Asia. In addition, we are developing the InnFocus MicroShunt (DE-128) as a surgical implant for lowering intraocular pressure by promoting better drainage of aqueous humor from the eye. Designed using an innovative and bio-inert material, the device is implanted using minimally invasive surgery. DE-128 is expected to offer a new surgical option for treating glaucoma. Looking ahead, we will continue to develop innovative new products and therapies to help enhance QOL for patients worldwide.
Mild Moderate Severe
Drug therapyCurrent Glaucoma Treatments
Santen’s FutureTreatmentOptions
SurgeryMonotherapy 2 drugs 3+ drugs
Single drugs based on various MOAs
Combination drugs based on other MOAs
MIGS (Micro-Invasive Glaucoma Surgery)
InnFocus MicroShunt (DE-128)Under development
Tapros, Timoptol, Trusopt, Detantol, Rescula, etc.
Cosopt, Tapcom, etc.
Laser treatment
DE-117 DE-126
Tube shunt2
Trabeculectomy1, etc.
1. An operation to drain aqueous humor by removing a section inside the eye called the trabecular meshwork
2. A device placed inside the eye to improve the drainage of aqueous humor
GlaucomaFocus on
Santen Pharmaceutical Co., Ltd. Annual Report 2017 21
Santen aims to use its uniquely broad product lineup and specialist knowledge to contribute further to patient treatment.
Initiatives in Japan Business
Message
Medical Contribution in the Japan Business
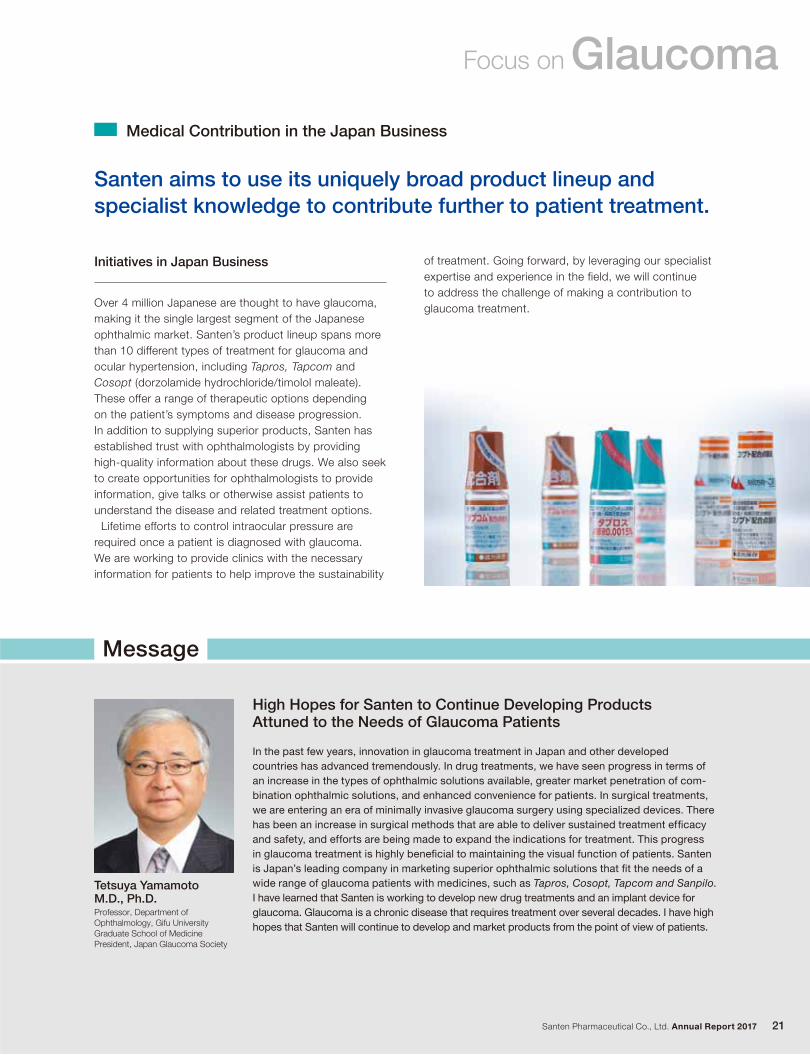
Over 4 million Japanese are thought to have glaucoma, making it the single largest segment of the Japanese ophthalmic market. Santen’s product lineup spans more than 10 different types of treatment for glaucoma and ocular hypertension, including Tapros, Tapcom and Cosopt (dorzolamide hydrochloride/timolol maleate). These offer a range of therapeutic options depending on the patient’s symptoms and disease progression. In addition to supplying superior products, Santen has established trust with ophthalmologists by providing high-quality information about these drugs. We also seek to create opportunities for ophthalmologists to provide information, give talks or otherwise assist patients to understand the disease and related treatment options. Lifetime efforts to control intraocular pressure are required once a patient is diagnosed with glaucoma. We are working to provide clinics with the necessary information for patients to help improve the sustainability
of treatment. Going forward, by leveraging our specialist expertise and experience in the field, we will continue to address the challenge of making a contribution to glaucoma treatment.
Tetsuya Yamamoto M.D., Ph.D.Professor, Department of Ophthalmology, Gifu University Graduate School of MedicinePresident, Japan Glaucoma Society
High Hopes for Santen to Continue Developing Products Attuned to the Needs of Glaucoma Patients
In the past few years, innovation in glaucoma treatment in Japan and other developedcountries has advanced tremendously. In drug treatments, we have seen progress in terms of an increase in the types of ophthalmic solutions available, greater market penetration of com-bination ophthalmic solutions, and enhanced convenience for patients. In surgical treatments, we are entering an era of minimally invasive glaucoma surgery using specialized devices. There has been an increase in surgical methods that are able to deliver sustained treatment effi cacy and safety, and efforts are being made to expand the indications for treatment. This progress in glaucoma treatment is highly benefi cial to maintaining the visual function of patients. Santen is Japan’s leading company in marketing superior ophthalmic solutions that fi t the needs of a wide range of glaucoma patients with medicines, such as Tapros, Cosopt, Tapcom and Sanpilo. I have learned that Santen is working to develop new drug treatments and an implant device for glaucoma. Glaucoma is a chronic disease that requires treatment over several decades. I have high hopes that Santen will continue to develop and market products from the point of view of patients.
TOPICS
Santen Pharmaceutical Co., Ltd. Annual Report 201722
Feature: Contributions to the World’s Glaucoma Patients
Santen provides a range of therapeutic options for glaucoma across Asian and EMEA markets tailored to regional customer needs.
Global Contribution to Treatment of Glaucoma
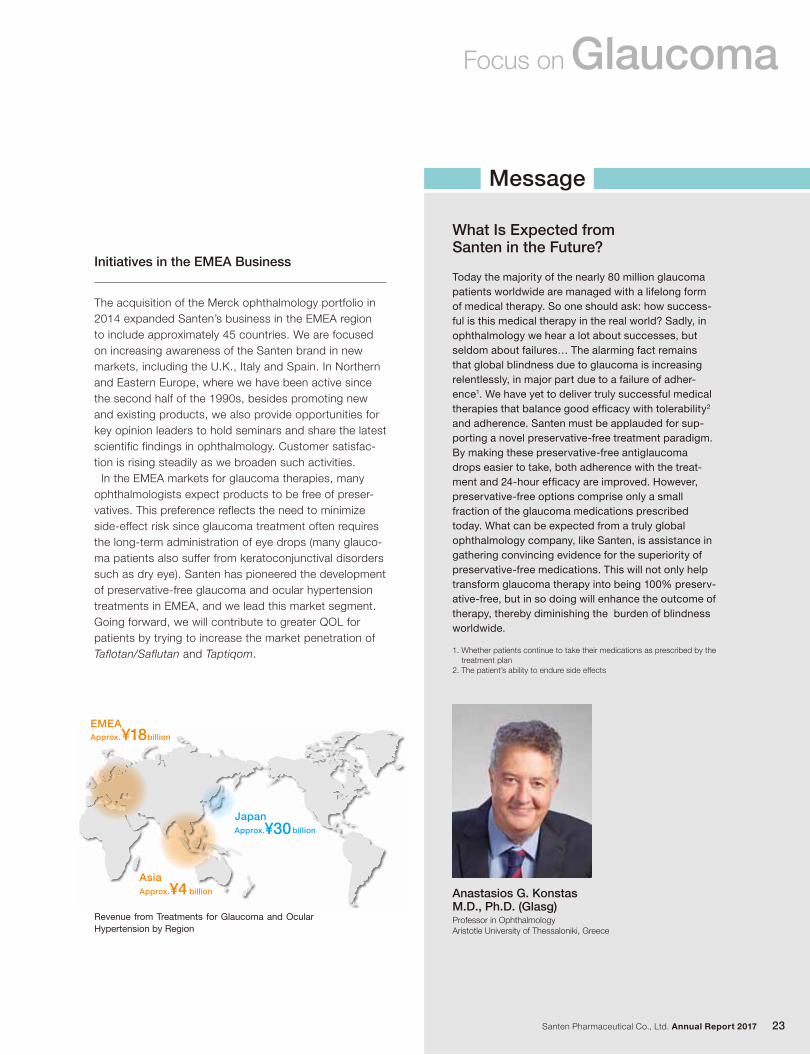
The glaucoma market is growing at an average 5% annually in Thailand, the largest prescription ophthalmic pharmaceu-tical market in the ASEAN region. Glaucoma is the leading segment of ophthalmic pharmaceuticals, accounting for about 40% of this market. Yet there are only around 160 ophthalmologists specialized in glaucoma, therefore they are facing challenges to nurture specialized doctors for the future. We organize the Thailand Glaucoma Camp as an opportunity for ophthalmologists to hear lectures from global opinion lead-ers in the fi eld, and to participate in discussions with the aim of building their glaucoma specialty knowledge and technical expertise. Started in 2015, the three-day program is being held for the third time in September 2017. As the sponsor of
this professional development initiative, we hope to contribute to the development of improved glaucoma treatment in Thailand.
Helping Ophthalmologists Specializing in Glaucoma to Develop ExpertiseSupporting the Thailand Glaucoma Camp
to increase glaucoma awareness. These activities seek to maximize the strengths of Santen, including sharing information from Japan and Korea across the broader region.
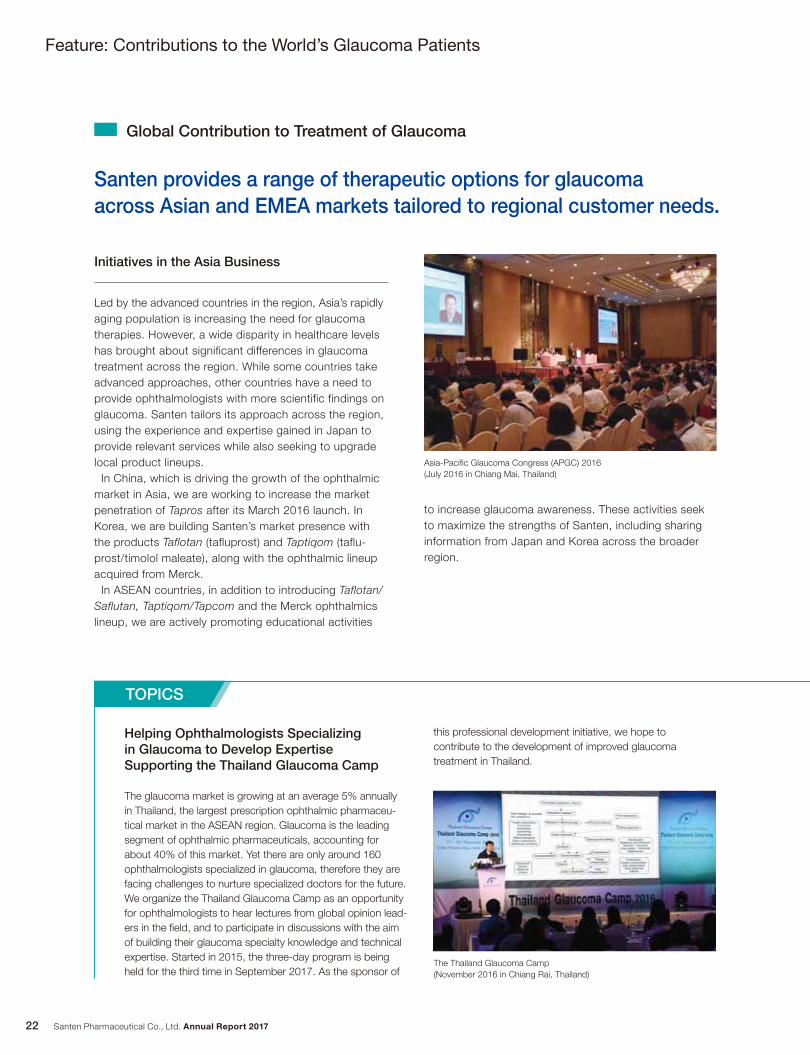
Led by the advanced countries in the region, Asia’s rapidly aging population is increasing the need for glaucoma therapies. However, a wide disparity in healthcare levels has brought about significant differences in glaucoma treatment across the region. While some countries take advanced approaches, other countries have a need to provide ophthalmologists with more scientific findings on glaucoma. Santen tailors its approach across the region, using the experience and expertise gained in Japan to provide relevant services while also seeking to upgrade local product lineups. In China, which is driving the growth of the ophthalmic market in Asia, we are working to increase the market penetration of Tapros after its March 2016 launch. In Korea, we are building Santen’s market presence with the products Taflotan (tafluprost) and Taptiqom (taflu-prost/timolol maleate), along with the ophthalmic lineup acquired from Merck. In ASEAN countries, in addition to introducing Taflotan/Saflutan, Taptiqom/Tapcom and the Merck ophthalmics lineup, we are actively promoting educational activities
Initiatives in the Asia Business
Asia-Pacifi c Glaucoma Congress (APGC) 2016(July 2016 in Chiang Mai, Thailand)
The Thailand Glaucoma Camp (November 2016 in Chiang Rai, Thailand)
GlaucomaFocus on
Santen Pharmaceutical Co., Ltd. Annual Report 2017 23
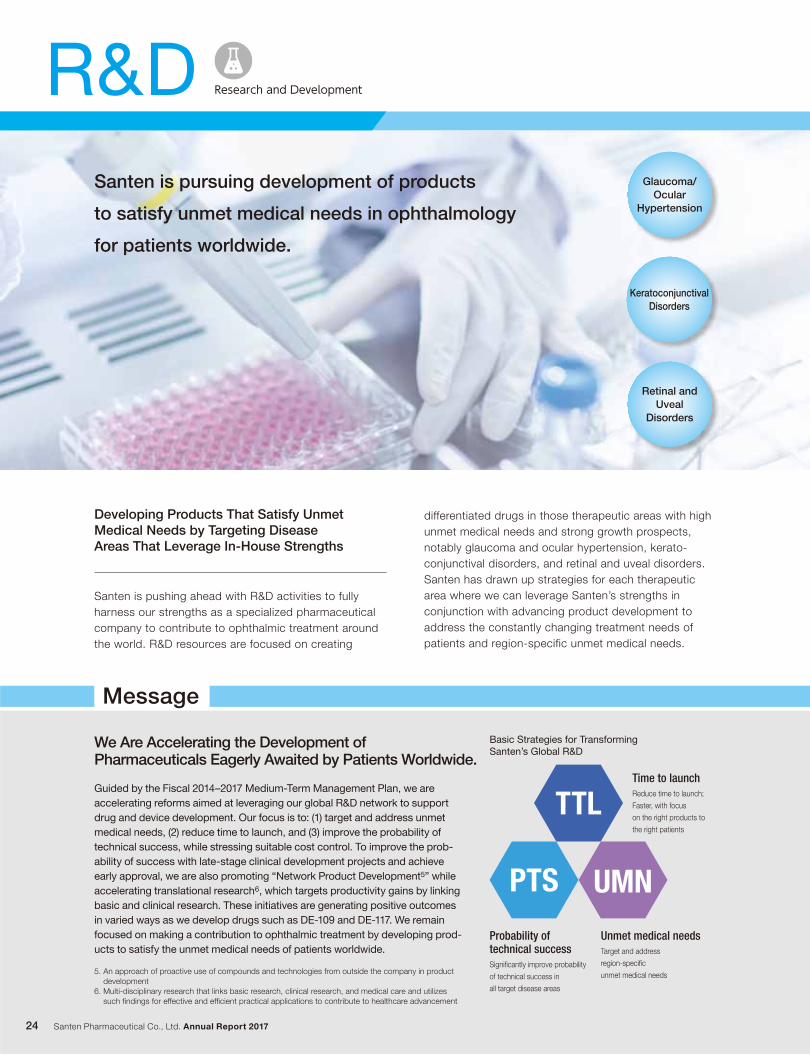
Approx. ¥18 billion
Approx. ¥4 billion
Revenue from Treatments for Glaucoma and Ocular Hypertension by Region
Approx. ¥30 billion
EMEA
Asia
Japan
The acquisition of the Merck ophthalmology portfolio in 2014 expanded Santen’s business in the EMEA region to include approximately 45 countries. We are focused on increasing awareness of the Santen brand in new markets, including the U.K., Italy and Spain. In Northern and Eastern Europe, where we have been active since the second half of the 1990s, besides promoting new and existing products, we also provide opportunities for key opinion leaders to hold seminars and share the latest scientific findings in ophthalmology. Customer satisfac-tion is rising steadily as we broaden such activities. In the EMEA markets for glaucoma therapies, many ophthalmologists expect products to be free of preser-vatives. This preference reflects the need to minimize side-effect risk since glaucoma treatment often requires the long-term administration of eye drops (many glauco-ma patients also suffer from keratoconjunctival disorders such as dry eye). Santen has pioneered the development of preservative-free glaucoma and ocular hypertension treatments in EMEA, and we lead this market segment. Going forward, we will contribute to greater QOL for patients by trying to increase the market penetration of Taflotan/Saflutan and Taptiqom.
Initiatives in the EMEA Business
Message
What Is Expected fromSanten in the Future?
Today the majority of the nearly 80 million glaucoma patients worldwide are managed with a lifelong form of medical therapy. So one should ask: how success-ful is this medical therapy in the real world? Sadly, in ophthalmology we hear a lot about successes, but seldom about failures… The alarming fact remains that global blindness due to glaucoma is increasing relentlessly, in major part due to a failure of adher-ence1. We have yet to deliver truly successful medical therapies that balance good effi cacy with tolerability2 and adherence. Santen must be applauded for sup-porting a novel preservative-free treatment paradigm. By making these preservative-free antiglaucoma drops easier to take, both adherence with the treat-ment and 24-hour effi cacy are improved. However, preservative-free options comprise only a small fraction of the glaucoma medications prescribed today. What can be expected from a truly global ophthalmology company, like Santen, is assistance in gathering convincing evidence for the superiority of preservative-free medications. This will not only help transform glaucoma therapy into being 100% preserv-ative-free, but in so doing will enhance the outcome of therapy, thereby diminishing the burden of blindness worldwide.
Anastasios G. Konstas M.D., Ph.D. (Glasg)Professor in OphthalmologyAristotle University of Thessaloniki, Greece
1. Whether patients continue to take their medications as prescribed by the treatment plan
2. The patient’s ability to endure side effects
Santen Pharmaceutical Co., Ltd. Annual Report 201724
R&D Research and Development
Santen is pursuing development of products
to satisfy unmet medical needs in ophthalmology
for patients worldwide.
differentiated drugs in those therapeutic areas with high unmet medical needs and strong growth prospects, notably glaucoma and ocular hypertension, kerato-conjunctival disorders, and retinal and uveal disorders. Santen has drawn up strategies for each therapeutic area where we can leverage Santen’s strengths in conjunction with advancing product development to address the constantly changing treatment needs of patients and region-specific unmet medical needs.
Santen is pushing ahead with R&D activities to fully harness our strengths as a specialized pharmaceutical company to contribute to ophthalmic treatment around the world. R&D resources are focused on creating
Developing Products That Satisfy Unmet Medical Needs by Targeting Disease Areas That Leverage In-House Strengths
We Are Accelerating the Development of Pharmaceuticals Eagerly Awaited by Patients Worldwide.
Message
Basic Strategies for Transforming Santen’s Global R&D
Significantly improve probability
of technical success in
all target disease areas
Probability oftechnical success Target and address
region-specific
unmet medical needs
Unmet medical needs
PTS UMN
TTL
Keratoconjunctival Disorders
Glaucoma/Ocular
Hypertension
Retinal and Uveal
Disorders
Guided by the Fiscal 2014–2017 Medium-Term Management Plan, we are accelerating reforms aimed at leveraging our global R&D network to support drug and device development. Our focus is to: (1) target and address unmet medical needs, (2) reduce time to launch, and (3) improve the probability of technical success, while stressing suitable cost control. To improve the prob-ability of success with late-stage clinical development projects and achieve early approval, we are also promoting “Network Product Development5” while accelerating translational research6, which targets productivity gains by linking basic and clinical research. These initiatives are generating positive outcomes in varied ways as we develop drugs such as DE-109 and DE-117. We remain focused on making a contribution to ophthalmic treatment by developing prod-ucts to satisfy the unmet medical needs of patients worldwide.
Reduce time to launch;
Faster, with focus
on the right products to
the right patients
Time to launch
5. An approach of proactive use of compounds and technologies from outside the company in product development
6. Multi-disciplinary research that links basic research, clinical research, and medical care and utilizes such findings for effective and efficient practical applications to contribute to healthcare advancement
Santen Pharmaceutical Co., Ltd. Annual Report 2017 25
Establishment of Research Ethics Committee
Respect for Human Rights in R&D
Related CSR Activities
successively launched Ikervis (generic name: ciclosporin, development name: Cyclokat) in European markets since July 2015 for the treatment of severe keratitis in adult patients with dry eye disease, which has not improved despite treatment with tear substitutes. Ikervis is the first prescription pharmaceutical for dry eye treatment marketed by Santen in Europe, and we are working to maximize its market value based on collaborative sales and marketing efforts to increase our regional market penetration. We have also submitted filings for marketing approval in Asia. Regulatory approval was granted in Thailand in November 2016, and in Korea in March 2017. In the field of retinal and uveal disorders, we filed an NDA (New Drug Application) in the U.S. in February 2017 for DE-109 (sirolimus) for the treatment of non-infectious uveitis of the posterior segment, a major cause of blindness (PDUFA regulatory review deadline is December 24, 2017). A number of submissions for marketing approval have been filed in Asia since April 2015, and we also plan to make submissions in Europe in due course.
Glaucoma and ocular hypertension is one of our targeted areas. The aim is to supplement our broad portfolio of current products through the development of differentiated products to offer treatment options for a wider range of patients. The current glaucoma pipeline includes DE-117, DE-126 and DE-128 (InnFocus Micro-Shunt). DE-117, an EP2 receptor agonist with a novel mechanism of action, is in Phase 2b/3 trials in Japan and is in Phase 3 trials in Asia. In the U.S., Phase 2 studies have finished. DE-126, an FP/EP3 dual receptor agonist, began Phase 2b trials in the U.S. and Japan in July 2017. DE-128, a surgical implant, has received a CE Mark4 in Europe, and is currently in Phase 2/3 trials in the U.S. and Europe. In keratoconjunctival disorders, Santen has
Progress on Global R&D
1. Formulation technologies engineered to deliver the right amount of the drug to the right target at the right time
2. Aligning one compound to treatment needs over the long term and augmenting through additional indication, dosage, formulation and combination products to increase product value
3. Indicators that objectively measure and evaluate biometric information to identify medical states including the onset or severity of disease
4. A symbol applied to products exported to EU countries to indicate compliance with EU health and safety directives
We promote business activities with respect for human rights. In our R&D activities, we have established a Research Ethics Committee as a system to ensure that all R&D activities are appropriately conducted in scientifi c and ethical terms. The Research Ethics Committee deliberates whether the appropriateness of research in ethical terms, including the protection of privacy of trial participants and the validity of research contents, and the appropriateness of research in scientifi c terms is assured. To ensure that the deliberation is fairly conducted, the director in charge of compliance serves as the chairperson of the committee, and the committee members comprise employees as well as external members who are professionals in the medical or legal fi elds.
Please refer to the CSR section on the Company’s website for details.
CSR Activities
Naveed Shams M.D., Ph.D.Senior Corporate Offi cer Chief Scientifi c Offi cer (CSO) Head of Global Research and Development
Santen has been accelerating global product development in tandem with strengthening collaboration among R&D bases in Japan, the U.S. and Europe. Moreover, by leveraging Santen’s formulation technology such as the development of preservative-free medicines and drug delivery systems1, we are caring out product life cycle management2 to maximize our current product portfolio’s market value. We are also actively exploring the use of biomarkers3 to promote the development of optimized pharmaceuticals for patients.
http://www.santen.com
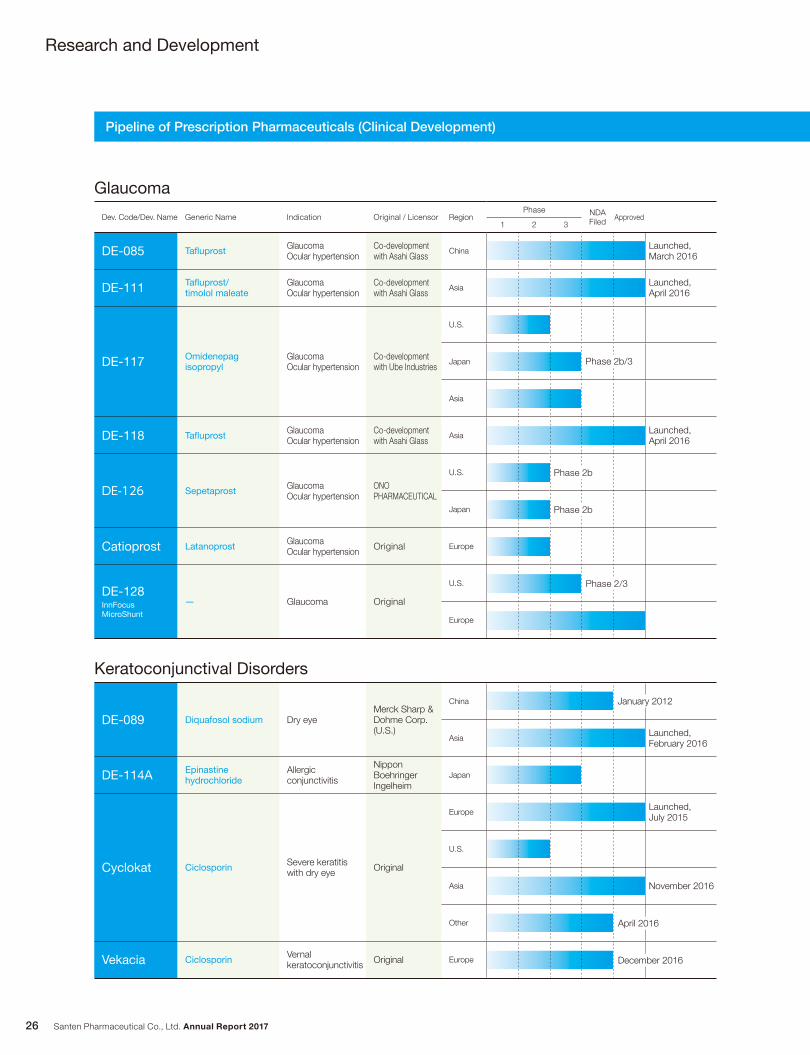
GlaucomaDev. Code/Dev. Name Generic Name Indication Original / Licensor Region
Phase NDA Filed Approved
1 2 3
DE-085 Tafluprost GlaucomaOcular hypertension
Co-developmentwith Asahi Glass
ChinaLaunched, March 2016
DE-111 Tafluprost/timolol maleate
GlaucomaOcular hypertension
Co-developmentwith Asahi Glass
AsiaLaunched, April 2016
DE-117 Omidenepagisopropyl
GlaucomaOcular hypertension
Co-developmentwith Ube Industries
U.S.
Japan
Asia
DE-118 Tafluprost GlaucomaOcular hypertension
Co-developmentwith Asahi Glass
AsiaLaunched, April 2016
DE-126 Sepetaprost GlaucomaOcular hypertension
ONO PHARMACEUTICAL
U.S.
Japan
Catioprost Latanoprost GlaucomaOcular hypertension Original Europe
DE-128InnFocus MicroShunt
― Glaucoma Original
U.S.
Europe
Keratoconjunctival Disorders
DE-089 Diquafosol sodium Dry eyeMerck Sharp &Dohme Corp.(U.S.)
China
AsiaLaunched,February 2016
DE-114A Epinastine hydrochloride
Allergic conjunctivitis
Nippon Boehringer Ingelheim
Japan
Cyclokat Ciclosporin Severe keratitiswith dry eye Original
EuropeLaunched, July 2015
U.S.
Asia November 2016
Other
Vekacia Ciclosporin Vernalkeratoconjunctivitis Original Europe
Santen Pharmaceutical Co., Ltd. Annual Report 201726
Research and Development
Pipeline of Prescription Pharmaceuticals (Clinical Development)
December 2016
April 2016
January 2012
Phase 2b/3
Phase 2b
Phase 2b
Phase 2/3
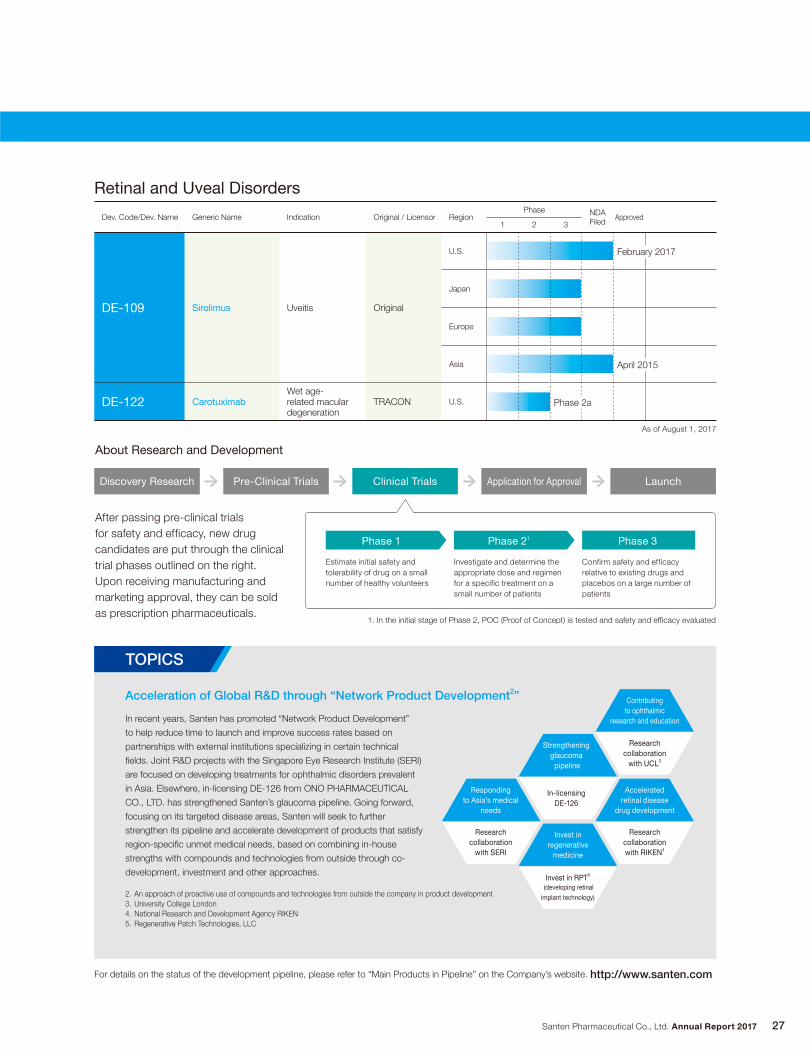
Retinal and Uveal DisordersDev. Code/Dev. Name Generic Name Indication Original / Licensor Region
Phase NDA Filed Approved
1 2 3
DE-109 Sirolimus Uveitis Original
U.S.
Japan
Europe
Asia
DE-122 CarotuximabWet age-related macular degeneration
TRACON U.S.
Santen Pharmaceutical Co., Ltd. Annual Report 2017 27
Discovery Research Pre-Clinical Trials Clinical Trials Application for Approval Launch
About Research and Development
After passing pre-clinical trials for safety and efficacy, new drug candidates are put through the clinical trial phases outlined on the right. Upon receiving manufacturing and marketing approval, they can be sold as prescription pharmaceuticals.
1. In the initial stage of Phase 2, POC (Proof of Concept) is tested and safety and efficacy evaluated
Estimate initial safety and tolerability of drug on a small number of healthy volunteers
Phase 1Investigate and determine the appropriate dose and regimen for a specific treatment on a small number of patients
Phase 21
Confirm safety and efficacy relative to existing drugs and placebos on a large number of patients
Phase 3
February 2017
April 2015
Phase 2a
For details on the status of the development pipeline, please refer to “Main Products in Pipeline” on the Company’s website. http://www.santen.com
TOPICS
As of August 1, 2017
Responding to Asia’s medical
needs
Research collaboration
with SERI
Strengthening glaucoma pipeline
In-licensing DE-126
Contributing to ophthalmic
research and education
Research collaboration
with UCL3
Accelerated retinal disease
drug development
Research collaboration with RIKEN4
Invest in regenerative
medicine
Invest in RPT5
(developing retinal implant technology)
In recent years, Santen has promoted “Network Product Development”
to help reduce time to launch and improve success rates based on
partnerships with external institutions specializing in certain technical
fields. Joint R&D projects with the Singapore Eye Research Institute (SERI)
are focused on developing treatments for ophthalmic disorders prevalent
in Asia. Elsewhere, in-licensing DE-126 from ONO PHARMACEUTICAL
CO., LTD. has strengthened Santen’s glaucoma pipeline. Going forward,
focusing on its targeted disease areas, Santen will seek to further
strengthen its pipeline and accelerate development of products that satisfy
region-specific unmet medical needs, based on combining in-house
strengths with compounds and technologies from outside through co-
development, investment and other approaches.
Acceleration of Global R&D through “Network Product Development2”
2. An approach of proactive use of compounds and technologies from outside the company in product development3. University College London4. National Research and Development Agency RIKEN5. Regenerative Patch Technologies, LLC
Santen Pharmaceutical Co., Ltd. Annual Report 201728
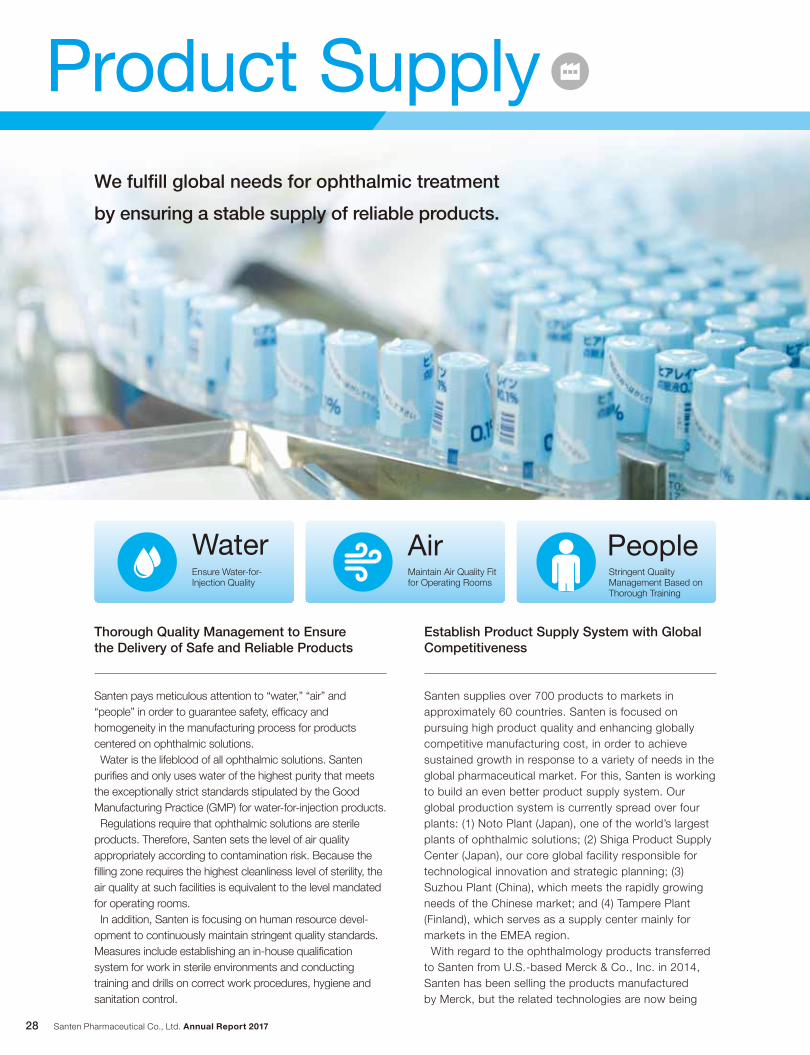
Product SupplyWe fulfill global needs for ophthalmic treatment
by ensuring a stable supply of reliable products.
Thorough Quality Management to Ensure the Delivery of Safe and Reliable Products
Santen pays meticulous attention to “water,” “air” and “people” in order to guarantee safety, effi cacy and homogeneity in the manufacturing process for products centered on ophthalmic solutions. Water is the lifeblood of all ophthalmic solutions. Santen purifi es and only uses water of the highest purity that meets the exceptionally strict standards stipulated by the Good Manufacturing Practice (GMP) for water-for-injection products. Regulations require that ophthalmic solutions are sterile products. Therefore, Santen sets the level of air quality appropriately according to contamination risk. Because the fi lling zone requires the highest cleanliness level of sterility, the air quality at such facilities is equivalent to the level mandated for operating rooms. In addition, Santen is focusing on human resource devel-opment to continuously maintain stringent quality standards. Measures include establishing an in-house qualifi cation system for work in sterile environments and conducting training and drills on correct work procedures, hygiene and sanitation control.
Santen supplies over 700 products to markets in approximately 60 countries. Santen is focused on pursuing high product quality and enhancing globally competitive manufacturing cost, in order to achieve sustained growth in response to a variety of needs in the global pharmaceutical market. For this, Santen is working to build an even better product supply system. Our global production system is currently spread over four plants: (1) Noto Plant (Japan), one of the world’s largest plants of ophthalmic solutions; (2) Shiga Product Supply Center (Japan), our core global facility responsible for technological innovation and strategic planning; (3) Suzhou Plant (China), which meets the rapidly growing needs of the Chinese market; and (4) Tampere Plant (Finland), which serves as a supply center mainly for markets in the EMEA region. With regard to the ophthalmology products transferred to Santen from U.S.-based Merck & Co., Inc. in 2014, Santen has been selling the products manufactured by Merck, but the related technologies are now being
Establish Product Supply System with Global Competitiveness
Ensure Water-for-Injection Quality
Water PeopleAir Maintain Air Quality Fit for Operating Rooms
Stringent Quality Management Based on Thorough Training
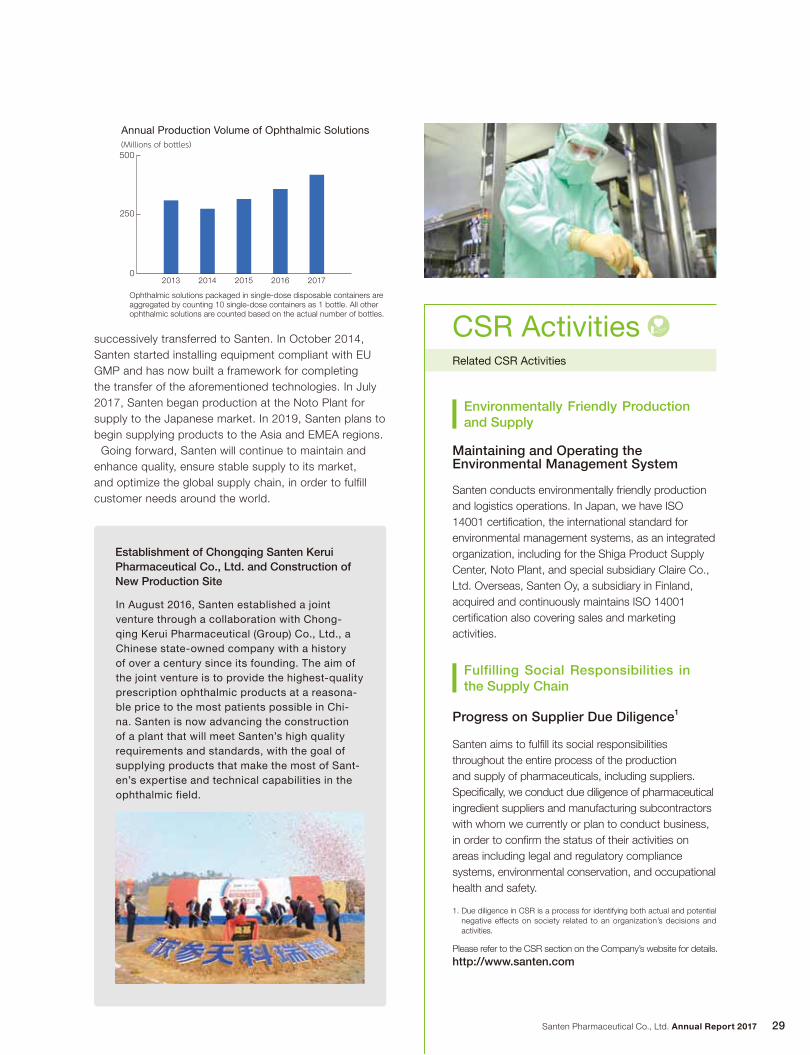
0
500
250
(Millions of bottles)
2013 2014 2015 2016 2017
Santen Pharmaceutical Co., Ltd. Annual Report 2017 29
In August 2016, Santen established a joint venture through a collaboration with Chong-qing Kerui Pharmaceutical (Group) Co., Ltd., a Chinese state-owned company with a history of over a century since its founding. The aim of the joint venture is to provide the highest-quality prescription ophthalmic products at a reasona-ble price to the most patients possible in Chi-na. Santen is now advancing the construction of a plant that will meet Santen’s high quality requirements and standards, with the goal of supplying products that make the most of Sant-en’s expertise and technical capabilities in the ophthalmic field.
Establishment of Chongqing Santen Kerui Pharmaceutical Co., Ltd. and Construction of New Production Site
Maintaining and Operating the Environmental Management System
Santen conducts environmentally friendly production and logistics operations. In Japan, we have ISO 14001 certifi cation, the international standard for environmental management systems, as an integrated organization, including for the Shiga Product Supply Center, Noto Plant, and special subsidiary Claire Co., Ltd. Overseas, Santen Oy, a subsidiary in Finland, acquired and continuously maintains ISO 14001 certifi cation also covering sales and marketing activities.
Environmentally Friendly Production and Supply
Progress on Supplier Due Diligence1
Santen aims to fulfi ll its social responsibilities throughout the entire process of the production and supply of pharmaceuticals, including suppliers. Specifi cally, we conduct due diligence of pharmaceutical ingredient suppliers and manufacturing subcontractors with whom we currently or plan to conduct business, in order to confi rm the status of their activities on areas including legal and regulatory compliance systems, environmental conservation, and occupational health and safety.
Fulfilling Social Responsibilities in the Supply Chain
successively transferred to Santen. In October 2014, Santen started installing equipment compliant with EU GMP and has now built a framework for completing the transfer of the aforementioned technologies. In July 2017, Santen began production at the Noto Plant for supply to the Japanese market. In 2019, Santen plans to begin supplying products to the Asia and EMEA regions. Going forward, Santen will continue to maintain and enhance quality, ensure stable supply to its market, and optimize the global supply chain, in order to fulfill customer needs around the world.
Please refer to the CSR section on the Company’s website for details.http://www.santen.com
1. Due diligence in CSR is a process for identifying both actual and potential negative effects on society related to an organization’s decisions and activities.
Annual Production Volume of Ophthalmic Solutions
Ophthalmic solutions packaged in single-dose disposable containers are aggregated by counting 10 single-dose containers as 1 bottle. All other ophthalmic solutions are counted based on the actual number of bottles.
Related CSR Activities
CSR Activities
Santen Pharmaceutical Co., Ltd. Annual Report 201730
Quality Compliance
Quality Compliance Division
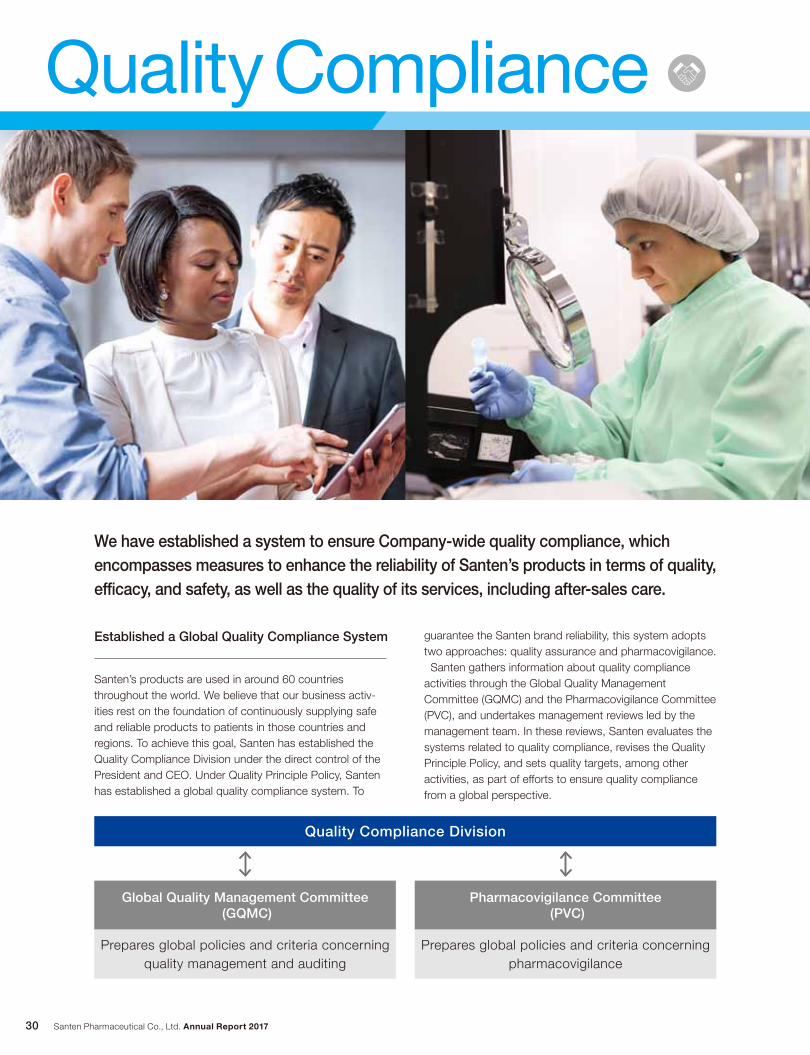
We have established a system to ensure Company-wide quality compliance, which encompasses measures to enhance the reliability of Santen’s products in terms of quality, efficacy, and safety, as well as the quality of its services, including after-sales care.
Established a Global Quality Compliance System
Santen’s products are used in around 60 countries throughout the world. We believe that our business activ-ities rest on the foundation of continuously supplying safe and reliable products to patients in those countries and regions. To achieve this goal, Santen has established the Quality Compliance Division under the direct control of the President and CEO. Under Quality Principle Policy, Santen has established a global quality compliance system. To
guarantee the Santen brand reliability, this system adopts two approaches: quality assurance and pharmacovigilance. Santen gathers information about quality compliance activities through the Global Quality Management Committee (GQMC) and the Pharmacovigilance Committee (PVC), and undertakes management reviews led by the management team. In these reviews, Santen evaluates the systems related to quality compliance, revises the Quality Principle Policy, and sets quality targets, among other activities, as part of efforts to ensure quality compliance from a global perspective.
Global Quality Management Committee (GQMC)
Prepares global policies and criteria concerning quality management and auditing
Pharmacovigilance Committee (PVC)
Prepares global policies and criteria concerning pharmacovigilance
CSR Activities
Santen Pharmaceutical Co., Ltd. Annual Report 2017 31
GLP (Good Laboratory Practice)Standards for Conducting Nonclinical Safety Studies on Drugs
GCP (Good Clinical Practice)Standards for the Conduct of Clinical Trials of Medicinal Products
GQP (Good Quality Practice)Standards for Quality Assurance for Drugs, Quasi-Drugs, Cosmetics and Medical Devices
GMP (Good Manufacturing Practice)Standards for Manufacturing Control and Quality Control for Drugs and Quasi-Drugs
GVP (Good Vigilance Practice)Standards for Post-Marketing Safety Control of Medicinal Products, Quasi Medicinal Products, Cosmetics and Medical Devices
GPSP (Good Post-Marketing Study Practice)Standards for Conducting Post-Marketing Studies on Drugs
GDP (Good Distribution Practice)Standards for the Proper Distribution of Medicinal Products
Pharmaceutical manufacturers must observe rigorous quality control standards stipulated in various regu-lations. Simply observing these regulations, however, is not sufficient to maintain Santen’s brand value and reputation. Santen must continuously supply phar-maceuticals and medical devices that meet changing user requirements as the pharmaceuticals environment evolves with the times. To do so, it is vital to establish “Company-wide quality compliance,” encompassing collaborative measures by every division involved in products, such as R&D, production, and marketing, to enhance the reliability of Santen’s products in terms of quality, efficacy and safety, and the quality of its services, including after-sales care. To this end, Santen’s Quality Compliance Division conducts quality audits in R&D and production processes, along with supporting the quality compliance initiatives of each division. In addition, in step with advances in Santen’s global business activities, Santen is building a quality compliance system in Asia and EMEA while ensuring compliance with the different regulations in each country and region.
Assurance of Reliability throughout Product Life Cycle
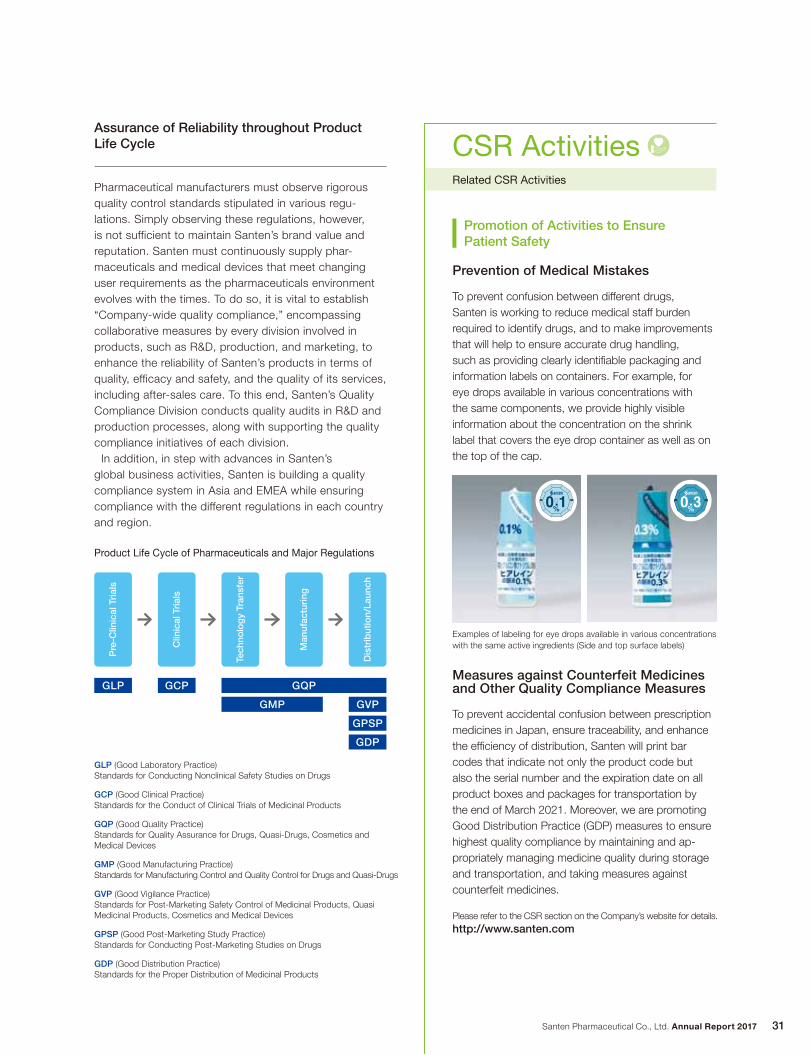
Prevention of Medical Mistakes
To prevent confusion between different drugs,Santen is working to reduce medical staff burden required to identify drugs, and to make improvements that will help to ensure accurate drug handling, such as providing clearly identifi able packaging and information labels on containers. For example, for eye drops available in various concentrations with the same components, we provide highly visible information about the concentration on the shrink label that covers the eye drop container as well as on the top of the cap.
Examples of labeling for eye drops available in various concentrations with the same active ingredients (Side and top surface labels)
Promotion of Activities to Ensure Patient Safety
Product Life Cycle of Pharmaceuticals and Major Regulations
GLP GCP GQP
GMP GVP
GPSP
GDP
Pre
-Clin
ical
Tri
als
Clin
ical
Tri
als
Tech
nolo
gy
Tran
sfer
Man
ufac
turi
ng
Dis
trib
utio
n/La
unch
Related CSR Activities
Measures against Counterfeit Medicines and Other Quality Compliance Measures
To prevent accidental confusion between prescription medicines in Japan, ensure traceability, and enhance the effi ciency of distribution, Santen will print bar codes that indicate not only the product code but also the serial number and the expiration date on all product boxes and packages for transportation by the end of March 2021. Moreover, we are promoting Good Distribution Practice (GDP) measures to ensure highest quality compliance by maintaining and ap-propriately managing medicine quality during storage and transportation, and taking measures against counterfeit medicines.
Please refer to the CSR section on the Company’s website for details.http://www.santen.com

Prescription Ophthalmic Pharmaceuticals
Treatments for Glaucoma
Treatments for Keratoconjunctival Disorders
Treatments for Retinal Disorders
Anti-Allergy Ophthalmics
Anti-Infective Ophthalmics
Others
2014 2015 2016 2017 2018 (forecast)
Medical Devices
Over-the-Counter Pharmaceuticals
Others
0
250
125
(¥ Billion) (¥ Billion)
0
250
125
2014 2015 2016 2017 2018 (forecast)
EMEAAsia North America and Other Regions
Japan
Santen Pharmaceutical Co., Ltd. Annual Report 201732
Revenue by Category and Therapeutic Area Revenue by Region
Santen Revenue Trends and Forecast
Sales & Marketing
We will meet therapeutic needs
in each country by providing
specialist knowledge in the field
of ophthalmology and valuable
products and services.
Santen Pharmaceutical Co., Ltd. Annual Report 2017 33
By Therapeutic Area
By Region
Specialization in Ophthalmology Field and Pursuit of Business Synergies
Santen Group uses its strengths as a specialized pharmaceutical company to promote its business in Japan, Asia and EMEA, supplying products in around 60 countries. We have a strong product lineup to meet different customer needs in each country and region, driving sales growth in all businesses in the fiscal year ended March 31, 2017. In the Japan business, we have retained a strong hold on the top share in the prescription ophthalmic pharmaceutical market for over 20 years by providing differentiated products and highly specialized infor-mation in the field of ophthalmology. Building on the foundation of our strong presence and the strengths we have cultivated, we aim to expand our product lineup with new products and ophthalmology products taken over from U.S.-based Merck & Co., Inc., and to strengthen our business foundation in order to accelerate our growth in the overseas business in Asia and EMEA. In October 2016 we held the First Santen Global Forum in Japan. Sales managers from countries around the world gathered to share factors supporting the Company’s strong presence in the Japan business and insights into diverse operating environments in various countries. We will continue to strengthen links between our businesses to become a “Specialized Pharmaceutical Company with a Global Presence.”
Environment for Ophthalmic Treatment and the Company’s Businesses
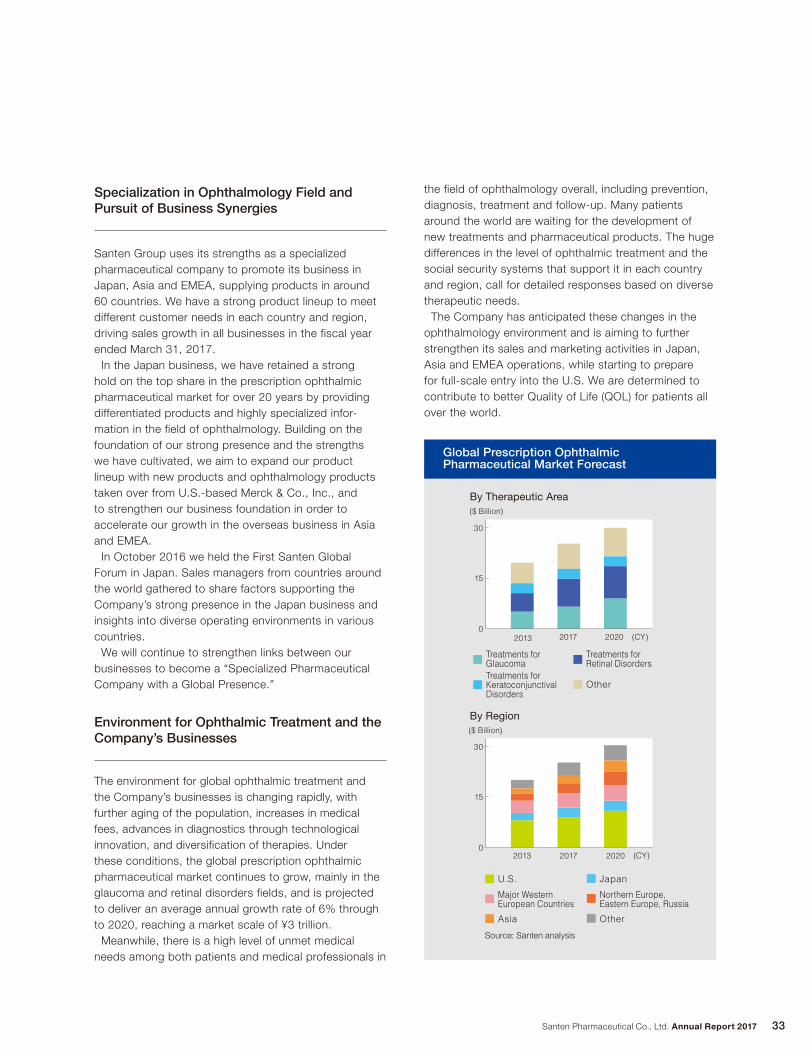
The environment for global ophthalmic treatment and the Company’s businesses is changing rapidly, with further aging of the population, increases in medical fees, advances in diagnostics through technological innovation, and diversification of therapies. Under these conditions, the global prescription ophthalmic pharmaceutical market continues to grow, mainly in the glaucoma and retinal disorders fields, and is projected to deliver an average annual growth rate of 6% through to 2020, reaching a market scale of ¥3 trillion. Meanwhile, there is a high level of unmet medical needs among both patients and medical professionals in
the field of ophthalmology overall, including prevention, diagnosis, treatment and follow-up. Many patients around the world are waiting for the development of new treatments and pharmaceutical products. The huge differences in the level of ophthalmic treatment and the social security systems that support it in each country and region, call for detailed responses based on diverse therapeutic needs. The Company has anticipated these changes in the ophthalmology environment and is aiming to further strengthen its sales and marketing activities in Japan, Asia and EMEA operations, while starting to prepare for full-scale entry into the U.S. We are determined to contribute to better Quality of Life (QOL) for patients all over the world.
Global Prescription Ophthalmic Pharmaceutical Market Forecast
Source: Santen analysis
0
30
15
2013 2017 2020 (CY)
Treatments for GlaucomaTreatments for Keratoconjunctival Disorders
Other
Treatments for Retinal Disorders
($ Billion)
0
30
15
($ Billion)
2013 2017 2020
Other
Japan
Northern Europe, Eastern Europe, Russia
Major Western European Countries
Asia
U.S.
(CY)
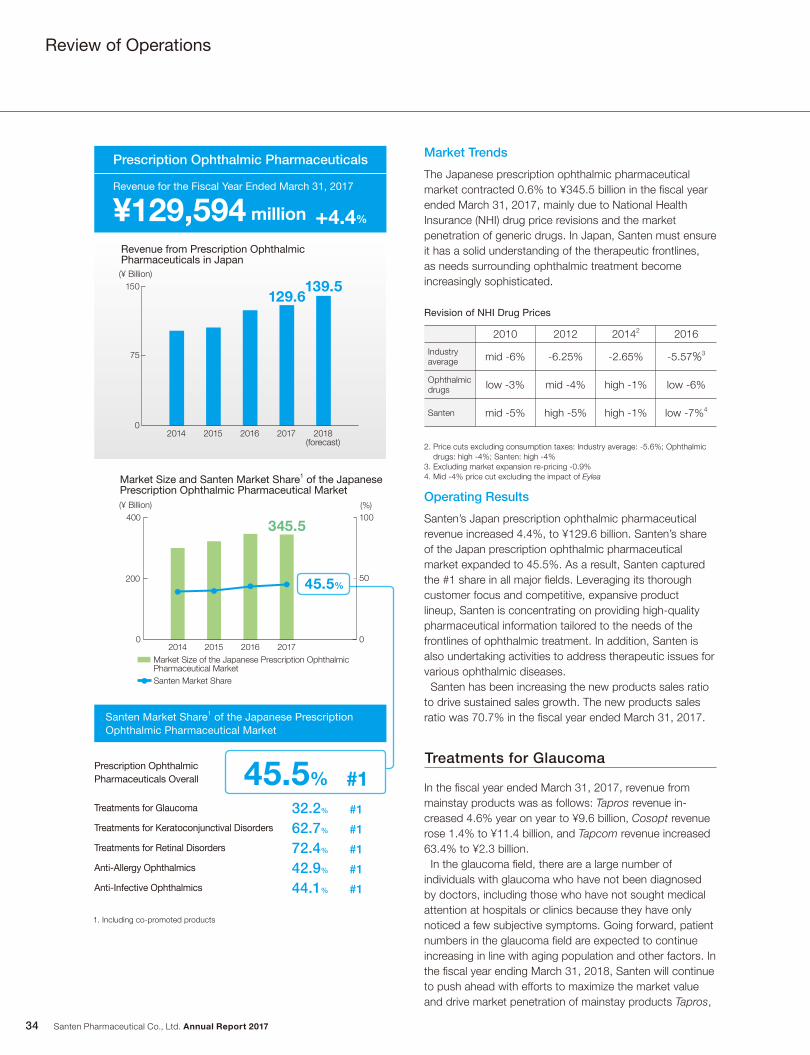
Prescription Ophthalmic Pharmaceuticals
Revenue for the Fiscal Year Ended March 31, 2017
¥129,594 million +4.4%
Santen Pharmaceutical Co., Ltd. Annual Report 201734
Santen Market Share1 of the Japanese Prescription Ophthalmic Pharmaceutical Market
Prescription Ophthalmic Pharmaceuticals Overall 45.5% #1Treatments for Glaucoma
Treatments for Keratoconjunctival Disorders
Treatments for Retinal Disorders
Anti-Allergy Ophthalmics
Anti-Infective Ophthalmics
32.2%
62.7%
72.4%
42.9%
44.1%
#1
#1
#1
#1
#1
Market Trends
The Japanese prescription ophthalmic pharmaceutical market contracted 0.6% to ¥345.5 billion in the fi scal year ended March 31, 2017, mainly due to National Health Insurance (NHI) drug price revisions and the market penetration of generic drugs. In Japan, Santen must ensure it has a solid understanding of the therapeutic frontlines, as needs surrounding ophthalmic treatment become increasingly sophisticated.
0
150
75
(¥ Billion)
139.5129.6
2014 2015 2016 2017 2018(forecast)
Revenue from Prescription Ophthalmic Pharmaceuticals in Japan
Santen’s Japan prescription ophthalmic pharmaceutical revenue increased 4.4%, to ¥129.6 billion. Santen’s share of the Japan prescription ophthalmic pharmaceutical market expanded to 45.5%. As a result, Santen captured the #1 share in all major fi elds. Leveraging its thorough customer focus and competitive, expansive product lineup, Santen is concentrating on providing high-quality pharmaceutical information tailored to the needs of the frontlines of ophthalmic treatment. In addition, Santen is also undertaking activities to address therapeutic issues for various ophthalmic diseases. Santen has been increasing the new products sales ratio to drive sustained sales growth. The new products sales ratio was 70.7% in the fi scal year ended March 31, 2017.
Operating Results
In the fi scal year ended March 31, 2017, revenue from mainstay products was as follows: Tapros revenue in-creased 4.6% year on year to ¥9.6 billion, Cosopt revenue rose 1.4% to ¥11.4 billion, and Tapcom revenue increased 63.4% to ¥2.3 billion. In the glaucoma fi eld, there are a large number of individuals with glaucoma who have not been diagnosed by doctors, including those who have not sought medical attention at hospitals or clinics because they have only noticed a few subjective symptoms. Going forward, patient numbers in the glaucoma fi eld are expected to continue increasing in line with aging population and other factors. In the fi scal year ending March 31, 2018, Santen will continue to push ahead with efforts to maximize the market value and drive market penetration of mainstay products Tapros,
Treatments for Glaucoma
Revision of NHI Drug Prices
1. Including co-promoted products
2010 2012 20142 2016
Industry average mid -6% -6.25% -2.65% -5.57%3
Ophthalmic drugs low -3% mid -4% high -1% low -6%
Santen mid -5% high -5% high -1% low -7%4
Market Size and Santen Market Share1 of the Japanese Prescription Ophthalmic Pharmaceutical Market
0
400
200
0
100
50
(%)
Santen Market Share
Market Size of the Japanese Prescription Ophthalmic Pharmaceutical Market
2014 2015 2016 2017
345.5
45.5%
(¥ Billion)
2. Price cuts excluding consumption taxes: Industry average: -5.6%; Ophthalmic drugs: high -4%; Santen: high -4%
3. Excluding market expansion re-pricing -0.9% 4. Mid -4% price cut excluding the impact of Eylea
Review of Operations
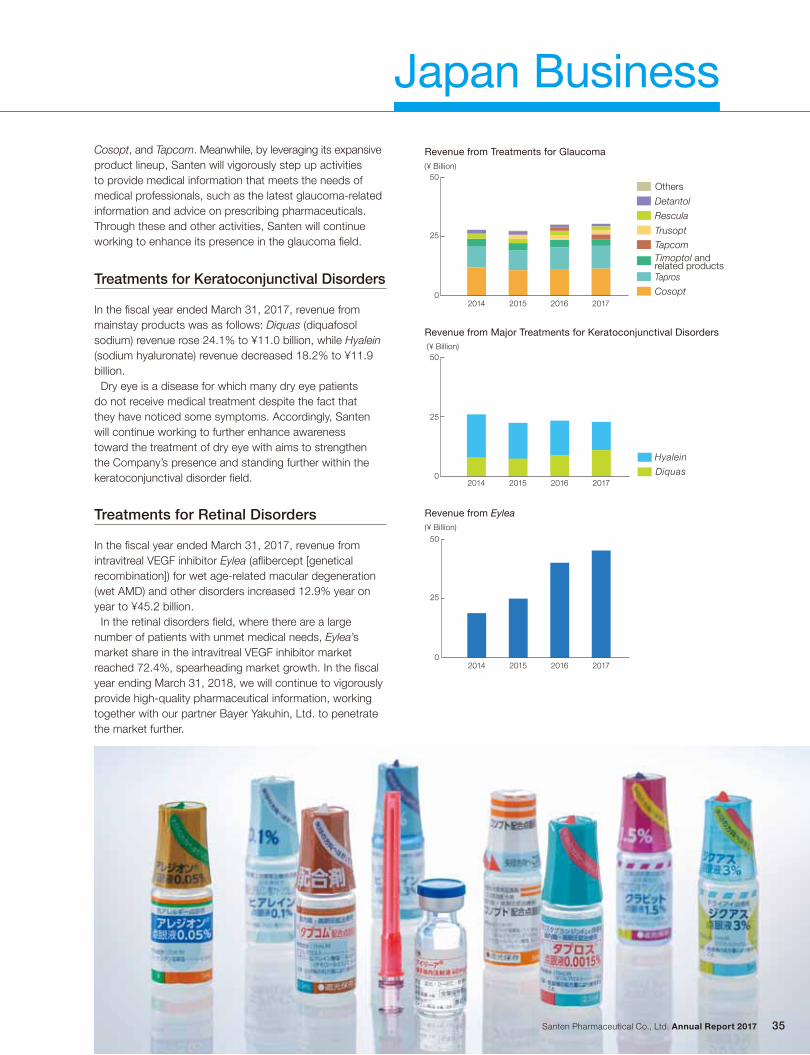
Santen Pharmaceutical Co., Ltd. Annual Report 2017 35
Cosopt, and Tapcom. Meanwhile, by leveraging its expansive product lineup, Santen will vigorously step up activities to provide medical information that meets the needs of medical professionals, such as the latest glaucoma-related information and advice on prescribing pharmaceuticals. Through these and other activities, Santen will continue working to enhance its presence in the glaucoma fi eld.
Revenue from Major Treatments for Keratoconjunctival Disorders
Revenue from Treatments for Glaucoma
Revenue from Eylea
In the fi scal year ended March 31, 2017, revenue from mainstay products was as follows: Diquas (diquafosol sodium) revenue rose 24.1% to ¥11.0 billion, while Hyalein (sodium hyaluronate) revenue decreased 18.2% to ¥11.9 billion. Dry eye is a disease for which many dry eye patients do not receive medical treatment despite the fact that they have noticed some symptoms. Accordingly, Santen will continue working to further enhance awareness toward the treatment of dry eye with aims to strengthen the Company’s presence and standing further within the keratoconjunctival disorder field.
Treatments for Keratoconjunctival Disorders
In the fi scal year ended March 31, 2017, revenue from intravitreal VEGF inhibitor Eylea (afl ibercept [genetical recombination]) for wet age-related macular degeneration (wet AMD) and other disorders increased 12.9% year on year to ¥45.2 billion. In the retinal disorders fi eld, where there are a large number of patients with unmet medical needs, Eylea’s market share in the intravitreal VEGF inhibitor market reached 72.4%, spearheading market growth. In the fiscal year ending March 31, 2018, we will continue to vigorously provide high-quality pharmaceutical information, working together with our partner Bayer Yakuhin, Ltd. to penetrate the market further.
Treatments for Retinal Disorders
0
50
25
2014 2015 2016 2017
Hyalein
Diquas
(¥ Billion)
0
50
25
2014 2015 2016 2017
(¥ Billion)
0
50
25
2014 2015 2016 2017
(¥ Billion)
Timoptol and related products
Others
Detantol
Rescula
Trusopt
Tapcom
Tapros
Cosopt
Japan Business
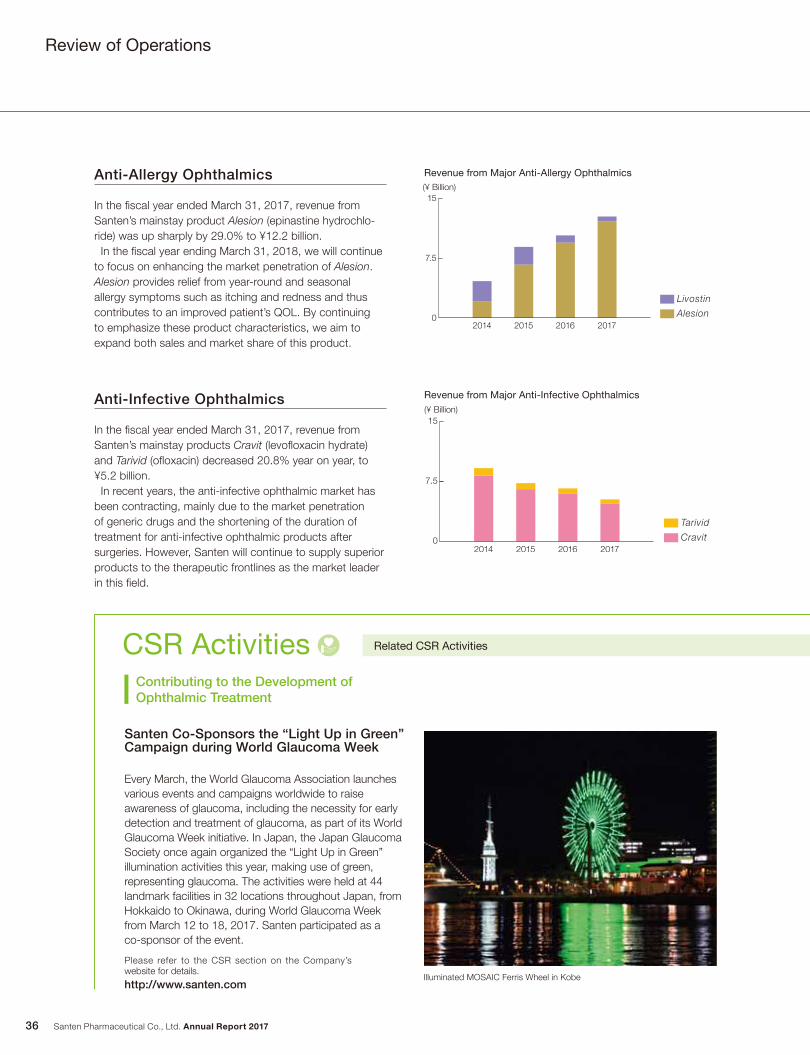
0
15
7.5
2014 2015 2016 2017
Livostin
Alesion
(¥ Billion)
Cravit
Tarivid
0
15
7.5
2014 2015 2016 2017
(¥ Billion)
Santen Pharmaceutical Co., Ltd. Annual Report 201736
Review of Operations
Anti-Allergy Ophthalmics
Anti-Infective Ophthalmics
In the fi scal year ended March 31, 2017, revenue from Santen’s mainstay product Alesion (epinastine hydrochlo-ride) was up sharply by 29.0% to ¥12.2 billion. In the fi scal year ending March 31, 2018, we will continue to focus on enhancing the market penetration of Alesion. Alesion provides relief from year-round and seasonal allergy symptoms such as itching and redness and thus contributes to an improved patient’s QOL. By continuing to emphasize these product characteristics, we aim to expand both sales and market share of this product.
In the fi scal year ended March 31, 2017, revenue from Santen’s mainstay products Cravit (levofl oxacin hydrate) and Tarivid (ofl oxacin) decreased 20.8% year on year, to ¥5.2 billion. In recent years, the anti-infective ophthalmic market has been contracting, mainly due to the market penetration of generic drugs and the shortening of the duration of treatment for anti-infective ophthalmic products after surgeries. However, Santen will continue to supply superior products to the therapeutic frontlines as the market leader in this fi eld.
Revenue from Major Anti-Allergy Ophthalmics
Revenue from Major Anti-Infective Ophthalmics
Every March, the World Glaucoma Association launches various events and campaigns worldwide to raise awareness of glaucoma, including the necessity for early detection and treatment of glaucoma, as part of its World Glaucoma Week initiative. In Japan, the Japan Glaucoma Society once again organized the “Light Up in Green” illumination activities this year, making use of green, representing glaucoma. The activities were held at 44 landmark facilities in 32 locations throughout Japan, from Hokkaido to Okinawa, during World Glaucoma Week from March 12 to 18, 2017. Santen participated as a co-sponsor of the event.
Santen Co-Sponsors the “Light Up in Green” Campaign during World Glaucoma Week
Contributing to the Development of Ophthalmic Treatment
CSR Activities Related CSR Activities
Illuminated MOSAIC Ferris Wheel in Kobe
Please refer to the CSR section on the Company’s website for details.
http://www.santen.com
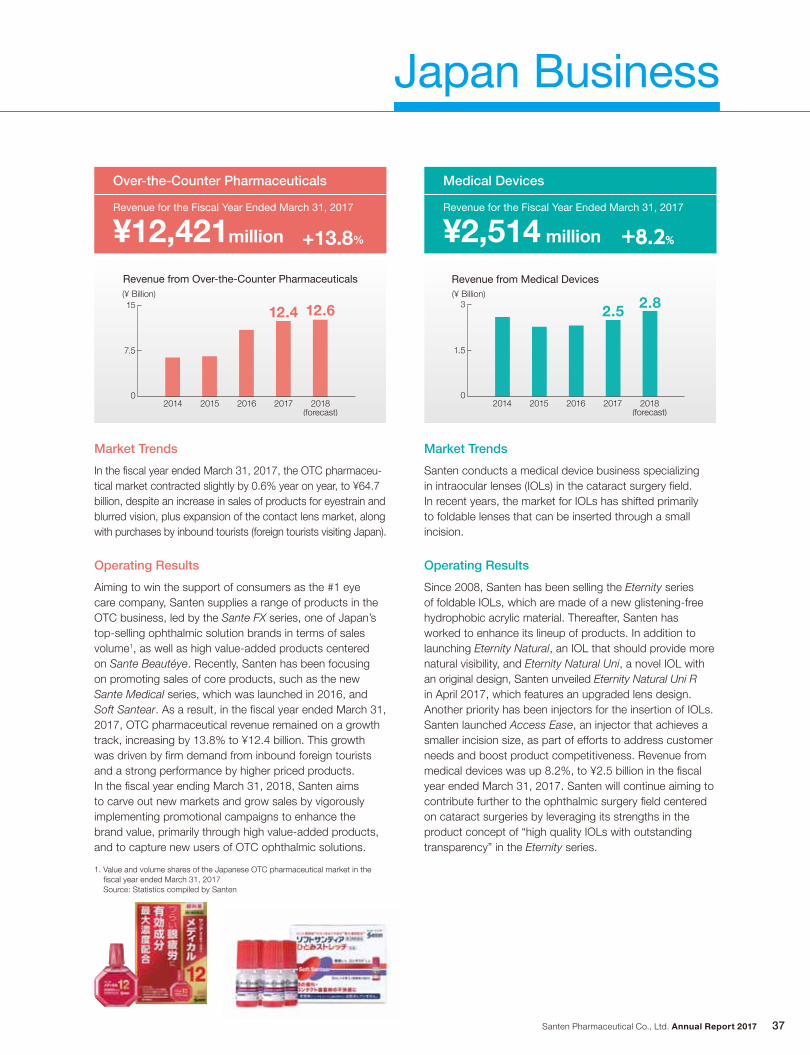
0
15
7.5
12.612.4(¥ Billion)
2014 2015 2016 2017 2018(forecast)
0
3
1.5
2.82.5(¥ Billion)
2014 2015 2016 2017 2018(forecast)
Santen Pharmaceutical Co., Ltd. Annual Report 2017 37
Market Trends Market Trends
In the fi scal year ended March 31, 2017, the OTC pharmaceu-tical market contracted slightly by 0.6% year on year, to ¥64.7 billion, despite an increase in sales of products for eyestrain and blurred vision, plus expansion of the contact lens market, along with purchases by inbound tourists (foreign tourists visiting Japan).
Santen conducts a medical device business specializing in intraocular lenses (IOLs) in the cataract surgery fi eld. In recent years, the market for IOLs has shifted primarily to foldable lenses that can be inserted through a small incision.
Operating Results
Aiming to win the support of consumers as the #1 eye care company, Santen supplies a range of products in the OTC business, led by the Sante FX series, one of Japan’s top-selling ophthalmic solution brands in terms of sales volume1, as well as high value-added products centered on Sante Beautéye. Recently, Santen has been focusing on promoting sales of core products, such as the new Sante Medical series, which was launched in 2016, and Soft Santear. As a result, in the fi scal year ended March 31, 2017, OTC pharmaceutical revenue remained on a growth track, increasing by 13.8% to ¥12.4 billion. This growth was driven by fi rm demand from inbound foreign tourists and a strong performance by higher priced products. In the fi scal year ending March 31, 2018, Santen aims to carve out new markets and grow sales by vigorously implementing promotional campaigns to enhance the brand value, primarily through high value-added products, and to capture new users of OTC ophthalmic solutions.
Operating Results
Since 2008, Santen has been selling the Eternity series of foldable IOLs, which are made of a new glistening-free hydrophobic acrylic material. Thereafter, Santen has worked to enhance its lineup of products. In addition to launching Eternity Natural, an IOL that should provide more natural visibility, and Eternity Natural Uni, a novel IOL with an original design, Santen unveiled Eternity Natural Uni R in April 2017, which features an upgraded lens design. Another priority has been injectors for the insertion of IOLs. Santen launched Access Ease, an injector that achieves a smaller incision size, as part of efforts to address customer needs and boost product competitiveness. Revenue from medical devices was up 8.2%, to ¥2.5 billion in the fi scal year ended March 31, 2017. Santen will continue aiming to contribute further to the ophthalmic surgery fi eld centered on cataract surgeries by leveraging its strengths in the product concept of “high quality IOLs with outstanding transparency” in the Eternity series.
Revenue from Over-the-Counter Pharmaceuticals
Over-the-Counter Pharmaceuticals
Revenue for the Fiscal Year Ended March 31, 2017
¥12,421million +13.8%
Revenue from Medical Devices
Medical Devices
Revenue for the Fiscal Year Ended March 31, 2017
¥2,514 million +8.2%
Japan Business
1. Value and volume shares of the Japanese OTC pharmaceutical market in the fiscal year ended March 31, 2017Source: Statistics compiled by Santen
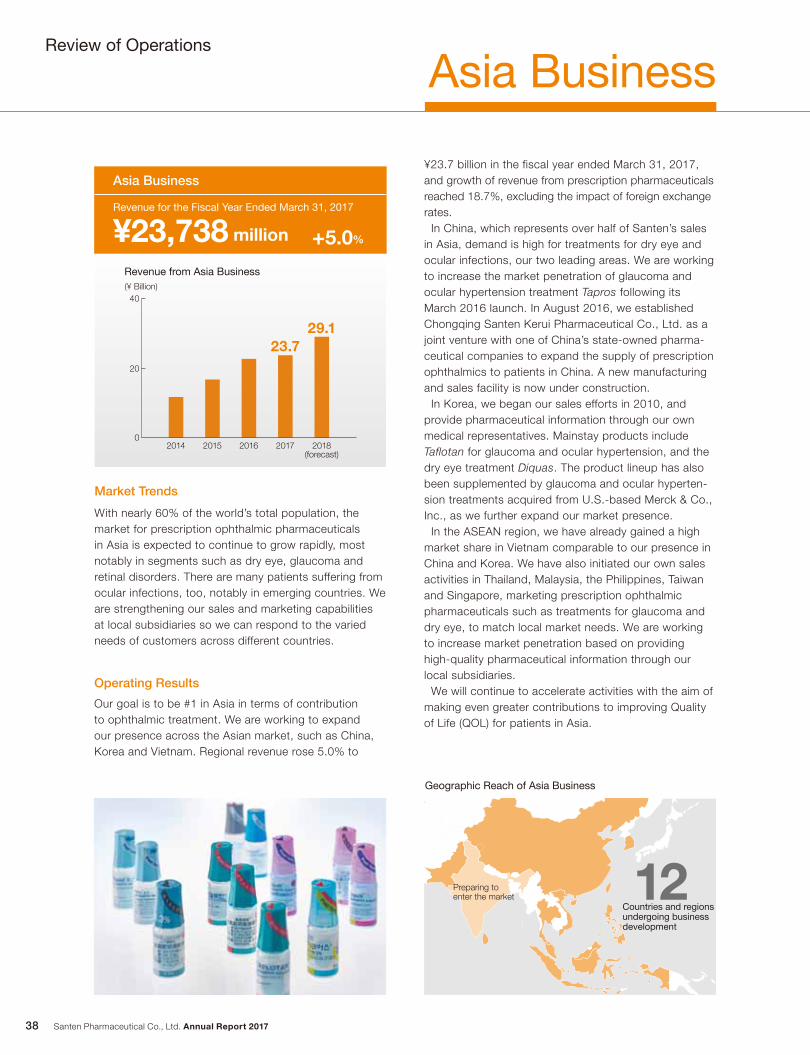
Santen Pharmaceutical Co., Ltd. Annual Report 201738
Market Trends
With nearly 60% of the world’s total population, the market for prescription ophthalmic pharmaceuticals in Asia is expected to continue to grow rapidly, most notably in segments such as dry eye, glaucoma and retinal disorders. There are many patients suffering from ocular infections, too, notably in emerging countries. We are strengthening our sales and marketing capabilities at local subsidiaries so we can respond to the varied needs of customers across different countries.
Operating Results
Our goal is to be #1 in Asia in terms of contribution to ophthalmic treatment. We are working to expand our presence across the Asian market, such as China, Korea and Vietnam. Regional revenue rose 5.0% to
Asia Business
Revenue from Asia Business
Geographic Reach of Asia Business
Countries and regions undergoing business development
12Preparing to enter the market
¥23.7 billion in the fiscal year ended March 31, 2017, and growth of revenue from prescription pharmaceuticals reached 18.7%, excluding the impact of foreign exchange rates. In China, which represents over half of Santen’s sales in Asia, demand is high for treatments for dry eye and ocular infections, our two leading areas. We are working to increase the market penetration of glaucoma and ocular hypertension treatment Tapros following its March 2016 launch. In August 2016, we established Chongqing Santen Kerui Pharmaceutical Co., Ltd. as a joint venture with one of China’s state-owned pharma-ceutical companies to expand the supply of prescription ophthalmics to patients in China. A new manufacturing and sales facility is now under construction. In Korea, we began our sales efforts in 2010, and provide pharmaceutical information through our own medical representatives. Mainstay products include Taflotan for glaucoma and ocular hypertension, and the dry eye treatment Diquas. The product lineup has also been supplemented by glaucoma and ocular hyperten-sion treatments acquired from U.S.-based Merck & Co., Inc., as we further expand our market presence. In the ASEAN region, we have already gained a high market share in Vietnam comparable to our presence in China and Korea. We have also initiated our own sales activities in Thailand, Malaysia, the Philippines, Taiwan and Singapore, marketing prescription ophthalmic pharmaceuticals such as treatments for glaucoma and dry eye, to match local market needs. We are working to increase market penetration based on providing high-quality pharmaceutical information through our local subsidiaries. We will continue to accelerate activities with the aim of making even greater contributions to improving Quality of Life (QOL) for patients in Asia.
Asia Business
Revenue for the Fiscal Year Ended March 31, 2017
¥23,738 million +5.0%
0
40
20
29.123.7
(¥ Billion)
2014 2015 2016 2017 2018(forecast)
Review of Operations
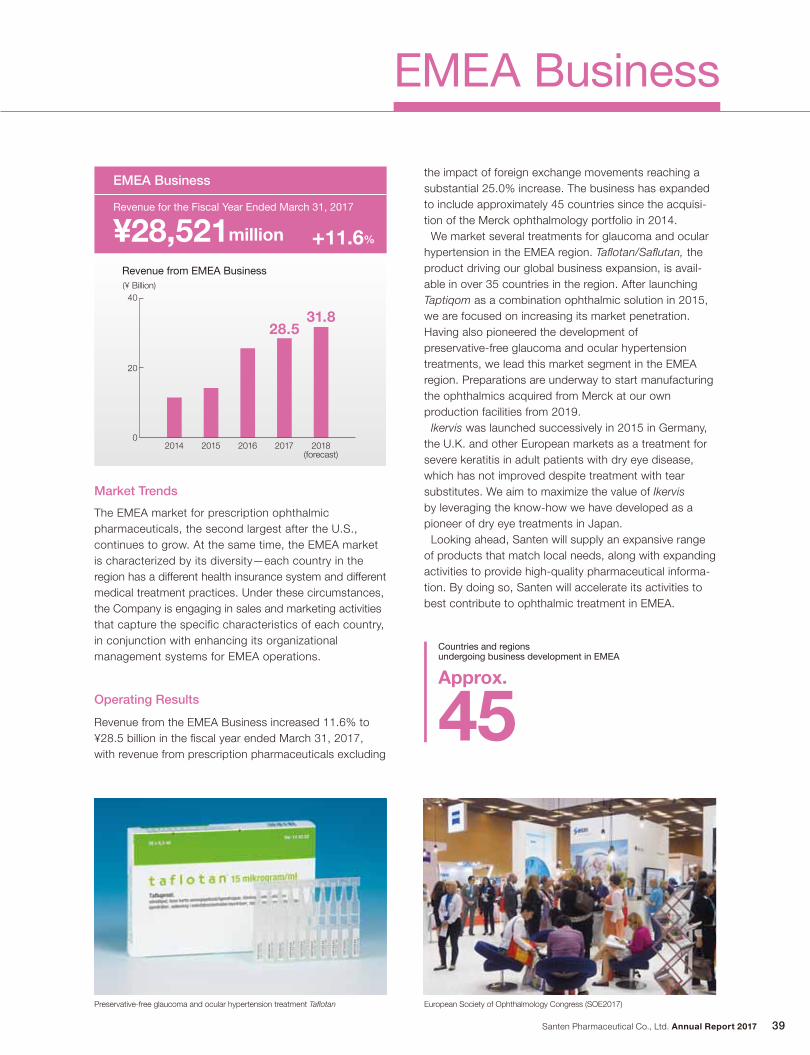
Preservative-free glaucoma and ocular hypertension treatment Taflotan European Society of Ophthalmology Congress (SOE2017)
Countries and regions undergoing business development in EMEA
Approx.
45
Santen Pharmaceutical Co., Ltd. Annual Report 2017 39
EMEA Business
Market Trends
The EMEA market for prescription ophthalmic pharmaceuticals, the second largest after the U.S., continues to grow. At the same time, the EMEA market is characterized by its diversity—each country in the region has a different health insurance system and different medical treatment practices. Under these circumstances, the Company is engaging in sales and marketing activities that capture the specific characteristics of each country, in conjunction with enhancing its organizational management systems for EMEA operations.
Operating Results
Revenue from the EMEA Business increased 11.6% to ¥28.5 billion in the fi scal year ended March 31, 2017, with revenue from prescription pharmaceuticals excluding
Revenue from EMEA Business
the impact of foreign exchange movements reaching a substantial 25.0% increase. The business has expanded to include approximately 45 countries since the acquisi-tion of the Merck ophthalmology portfolio in 2014. We market several treatments for glaucoma and ocular hypertension in the EMEA region. Tafl otan/Safl utan, the product driving our global business expansion, is avail-able in over 35 countries in the region. After launching Taptiqom as a combination ophthalmic solution in 2015, we are focused on increasing its market penetration. Having also pioneered the development of preservative-free glaucoma and ocular hypertension treatments, we lead this market segment in the EMEA region. Preparations are underway to start manufacturing the ophthalmics acquired from Merck at our own production facilities from 2019. Ikervis was launched successively in 2015 in Germany, the U.K. and other European markets as a treatment for severe keratitis in adult patients with dry eye disease, which has not improved despite treatment with tear substitutes. We aim to maximize the value of Ikervis by leveraging the know-how we have developed as a pioneer of dry eye treatments in Japan. Looking ahead, Santen will supply an expansive range of products that match local needs, along with expanding activities to provide high-quality pharmaceutical informa-tion. By doing so, Santen will accelerate its activities to best contribute to ophthalmic treatment in EMEA.
EMEA Business
Revenue for the Fiscal Year Ended March 31, 2017
¥28,521million +11.6%
0
40
20
31.828.5
(¥ Billion)
2018(forecast)
2014 2015 2016 2017
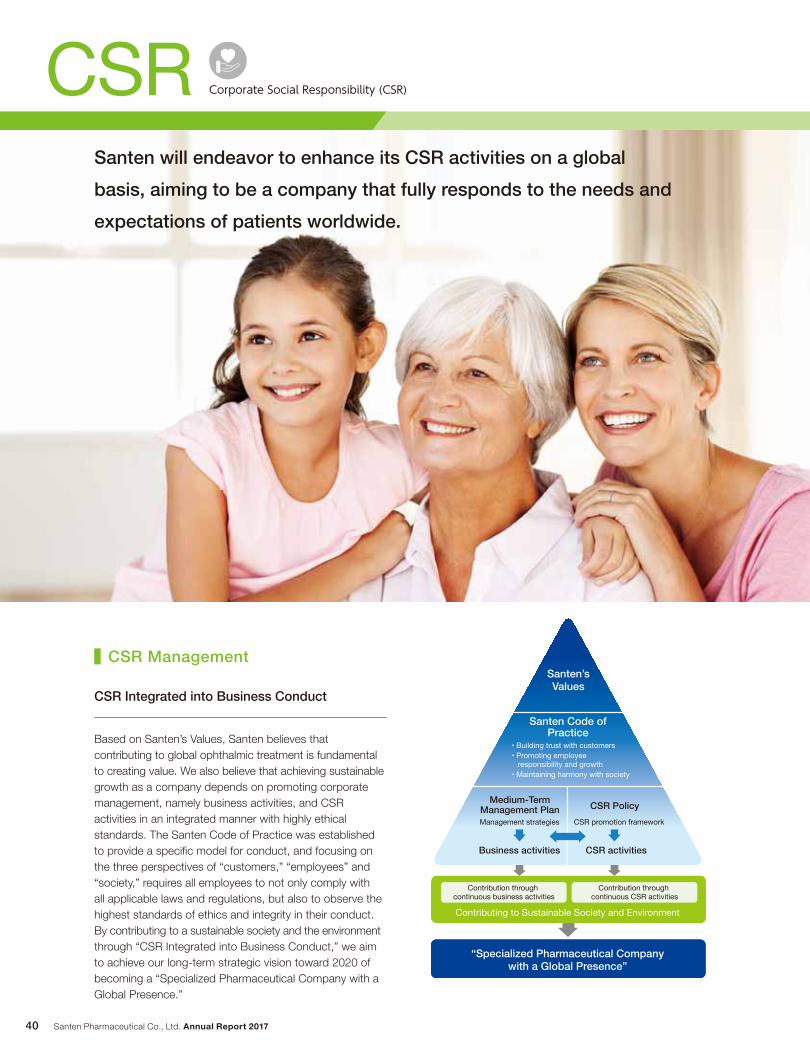
基本理念
参天企業倫理綱領• 顧客との信頼• 社員の責任と成長• 社会との調和
〈中期経営計画〉 〈CSR方針〉
事業活動 CSR活動
経営戦略 CSR推進フレームワーク
継続的な事業活動による貢献 継続的なCSR活動による貢献
持続可能な社会・環境への貢献
世界で存在感のあるスペシャリティ・カンパニーの実現
Santen’sValues
Contribution through continuous business activities
Contribution through continuous CSR activities
Contributing to Sustainable Society and Environment
“Specialized Pharmaceutical Companywith a Global Presence”
Medium-TermManagement Plan
Santen Code ofPractice
Business activities
Management strategies
CSR Policy
CSR activities
CSR promotion framework
responsibility and growth
Santen Pharmaceutical Co., Ltd. Annual Report 201740
Santen will endeavor to enhance its CSR activities on a global
basis, aiming to be a company that fully responds to the needs and
expectations of patients worldwide.
CSR Management
CSR
Based on Santen’s Values, Santen believes that contributing to global ophthalmic treatment is fundamental to creating value. We also believe that achieving sustainable growth as a company depends on promoting corporate management, namely business activities, and CSR activities in an integrated manner with highly ethical standards. The Santen Code of Practice was established to provide a specifi c model for conduct, and focusing on the three perspectives of “customers,” “employees” and “society,” requires all employees to not only comply with all applicable laws and regulations, but also to observe the highest standards of ethics and integrity in their conduct. By contributing to a sustainable society and the environment through “CSR Integrated into Business Conduct,” we aim to achieve our long-term strategic vision toward 2020 of becoming a “Specialized Pharmaceutical Company with a Global Presence.”
CSR Integrated into Business Conduct
Corporate Social Responsibility (CSR)
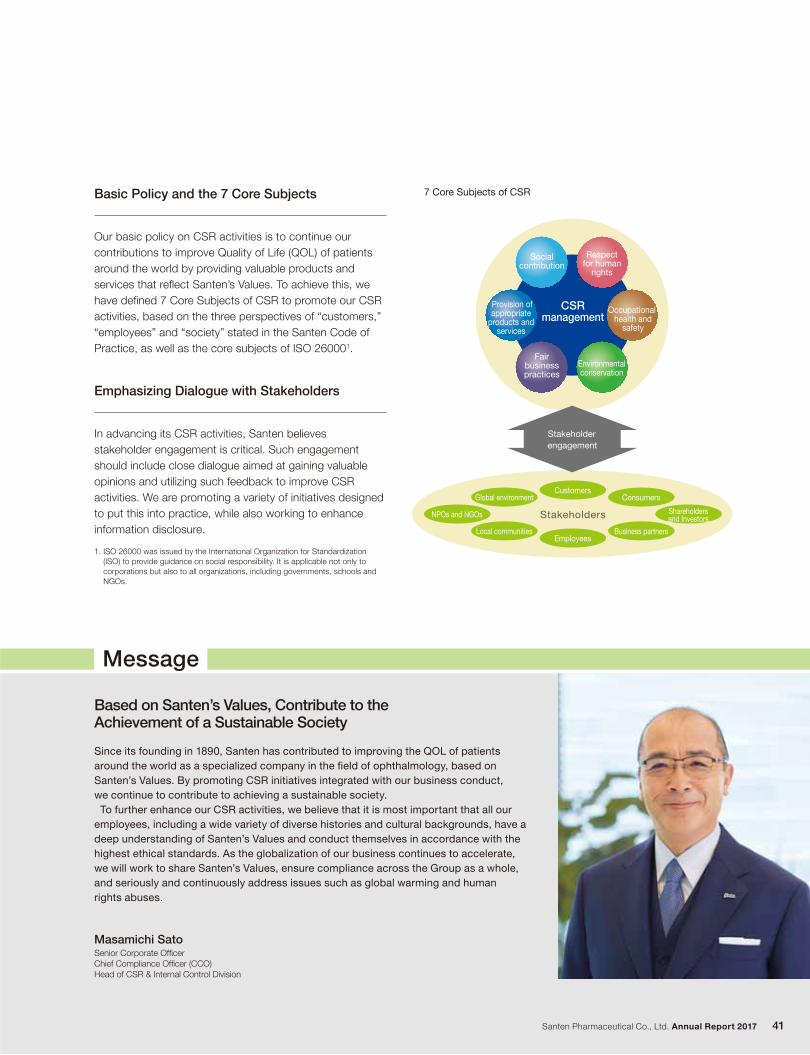
Message
Stakeholders
Customers
Local communities
Global environment Consumers
Business partners
NPOs and NGOs Shareholdersand Investors
Employees
CSRmanagement
Provision ofappropriate
products andservices
Fairbusinesspractices
Respectfor human
rights
Occupational health and
safety
Environmentalconservation
Socialcontribution
Stakeholder engagement
Santen Pharmaceutical Co., Ltd. Annual Report 2017 41
Our basic policy on CSR activities is to continue ourcontributions to improve Quality of Life (QOL) of patients around the world by providing valuable products and services that refl ect Santen’s Values. To achieve this, we have defi ned 7 Core Subjects of CSR to promote our CSR activities, based on the three perspectives of “customers,” “employees” and “society” stated in the Santen Code of Practice, as well as the core subjects of ISO 260001.
1. ISO 26000 was issued by the International Organization for Standardization (ISO) to provide guidance on social responsibility. It is applicable not only to corporations but also to all organizations, including governments, schools and NGOs.
Basic Policy and the 7 Core Subjects
Since its founding in 1890, Santen has contributed to improving the QOL of patients around the world as a specialized company in the fi eld of ophthalmology, based on Santen’s Values. By promoting CSR initiatives integrated with our business conduct, we continue to contribute to achieving a sustainable society. To further enhance our CSR activities, we believe that it is most important that all our employees, including a wide variety of diverse histories and cultural backgrounds, have a deep understanding of Santen’s Values and conduct themselves in accordance with the highest ethical standards. As the globalization of our business continues to accelerate, we will work to share Santen’s Values, ensure compliance across the Group as a whole, and seriously and continuously address issues such as global warming and human rights abuses.
Based on Santen’s Values, Contribute to the Achievement of a Sustainable Society
In advancing its CSR activities, Santen believes stakeholder engagement is critical. Such engagement should include close dialogue aimed at gaining valuable opinions and utilizing such feedback to improve CSR activities. We are promoting a variety of initiatives designed to put this into practice, while also working to enhance information disclosure.
Emphasizing Dialogue with Stakeholders
Masamichi SatoSenior Corporate Offi cerChief Compliance Offi cer (CCO)Head of CSR & Internal Control Division
7 Core Subjects of CSR
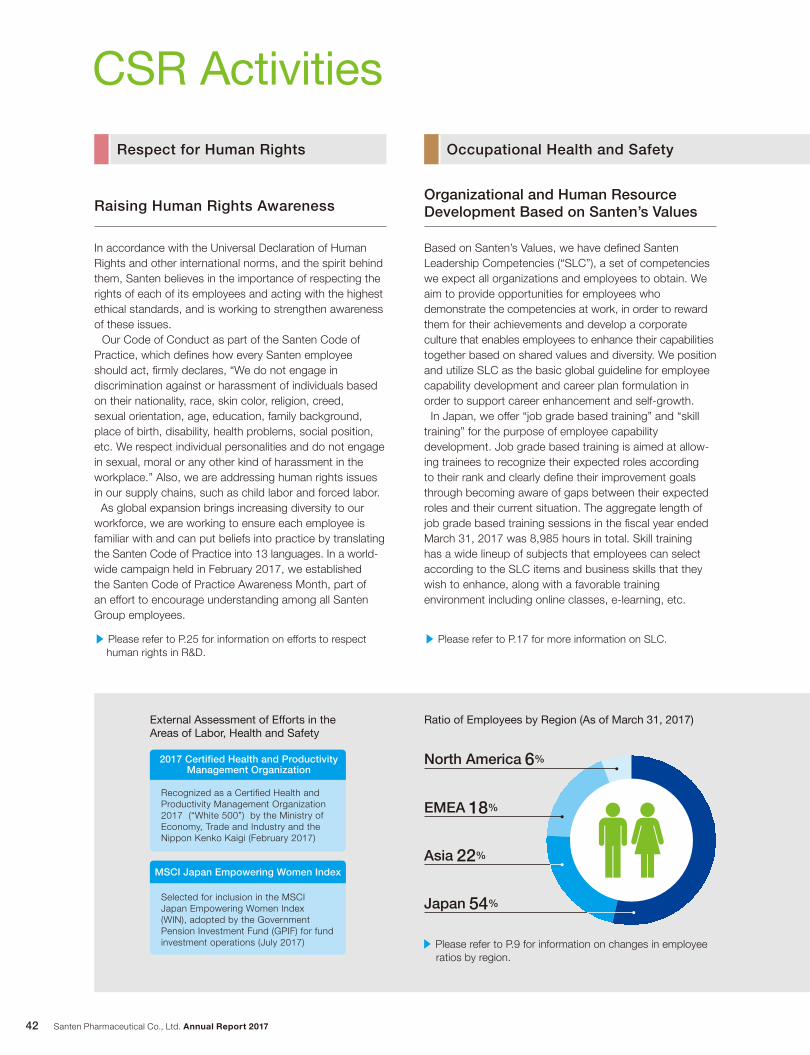
CSR Activities
Santen Pharmaceutical Co., Ltd. Annual Report 201742
Respect for Human Rights Occupational Health and Safety
In accordance with the Universal Declaration of Human Rights and other international norms, and the spirit behind them, Santen believes in the importance of respecting the rights of each of its employees and acting with the highest ethical standards, and is working to strengthen awareness of these issues. Our Code of Conduct as part of the Santen Code of Practice, which defi nes how every Santen employee should act, fi rmly declares, “We do not engage in discrimination against or harassment of individuals based on their nationality, race, skin color, religion, creed, sexual orientation, age, education, family background, place of birth, disability, health problems, social position, etc. We respect individual personalities and do not engage in sexual, moral or any other kind of harassment in the workplace.” Also, we are addressing human rights issues in our supply chains, such as child labor and forced labor. As global expansion brings increasing diversity to our workforce, we are working to ensure each employee is familiar with and can put beliefs into practice by translating the Santen Code of Practice into 13 languages. In a world-wide campaign held in February 2017, we established the Santen Code of Practice Awareness Month, part of an effort to encourage understanding among all Santen Group employees.
Raising Human Rights Awareness
Based on Santen’s Values, we have defi ned Santen Leadership Competencies (“SLC”), a set of competencies we expect all organizations and employees to obtain. We aim to provide opportunities for employees who demonstrate the competencies at work, in order to reward them for their achievements and develop a corporate culture that enables employees to enhance their capabilities together based on shared values and diversity. We position and utilize SLC as the basic global guideline for employee capability development and career plan formulation in order to support career enhancement and self-growth. In Japan, we offer “job grade based training” and “skill training” for the purpose of employee capability development. Job grade based training is aimed at allow-ing trainees to recognize their expected roles according to their rank and clearly defi ne their improvement goals through becoming aware of gaps between their expected roles and their current situation. The aggregate length of job grade based training sessions in the fi scal year ended March 31, 2017 was 8,985 hours in total. Skill training has a wide lineup of subjects that employees can select according to the SLC items and business skills that they wish to enhance, along with a favorable training environment including online classes, e-learning, etc.
Organizational and Human Resource Development Based on Santen’s Values
▶ Please refer to P.17 for more information on SLC.▶ Please refer to P.25 for information on efforts to respect human rights in R&D.
External Assessment of Efforts in the Areas of Labor, Health and Safety
2017 Certified Health and Productivity Management Organization
Recognized as a Certified Health and Productivity Management Organization 2017 (“White 500”) by the Ministry of Economy, Trade and Industry and the Nippon Kenko Kaigi (February 2017)
MSCI Japan Empowering Women Index
Selected for inclusion in the MSCI Japan Empowering Women Index (WIN), adopted by the Government Pension Investment Fund (GPIF) for fund investment operations (July 2017)
Ratio of Employees by Region (As of March 31, 2017)
▶ Please refer to P.9 for information on changes in employee ratios by region.
Japan 54%
Asia 22%
EMEA 18%
North America 6%
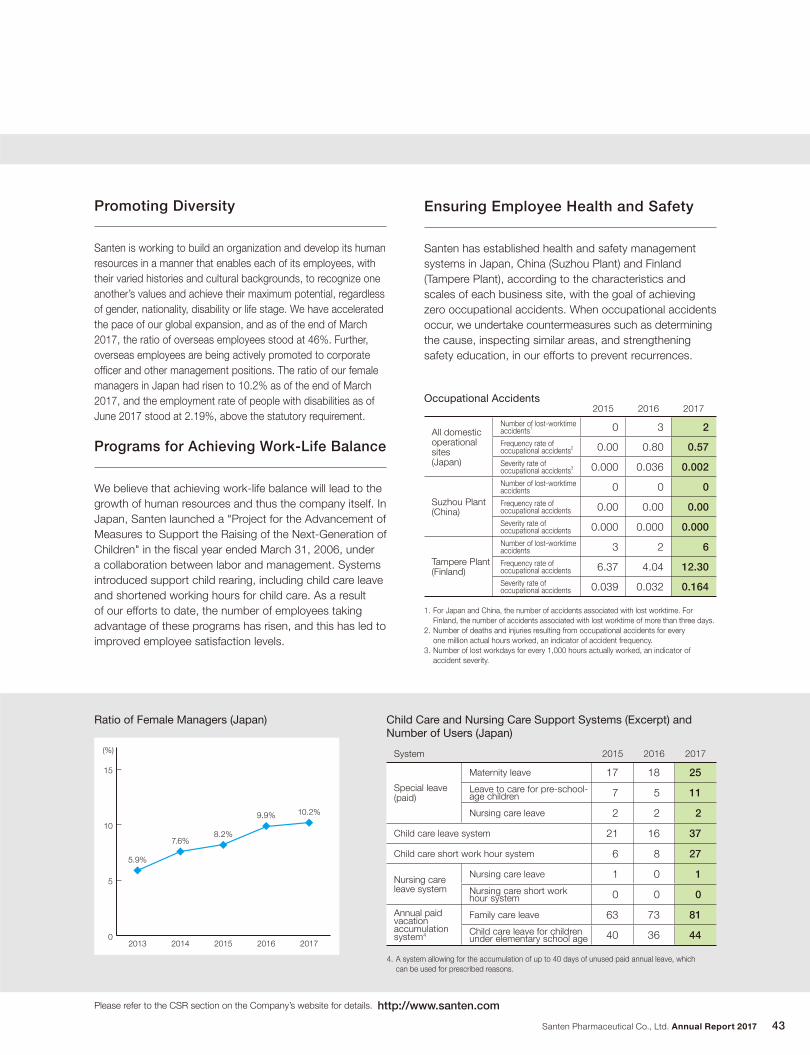
0
5
10
15
20172016201520142013
(%)
5.9%
7.6%8.2%
9.9% 10.2%
Santen Pharmaceutical Co., Ltd. Annual Report 2017 43
Ratio of Female Managers (Japan)
Santen is working to build an organization and develop its human resources in a manner that enables each of its employees, with their varied histories and cultural backgrounds, to recognize one another’s values and achieve their maximum potential, regardless of gender, nationality, disability or life stage. We have accelerated the pace of our global expansion, and as of the end of March 2017, the ratio of overseas employees stood at 46%. Further, overseas employees are being actively promoted to corporate offi cer and other management positions. The ratio of our female managers in Japan had risen to 10.2% as of the end of March 2017, and the employment rate of people with disabilities as of June 2017 stood at 2.19%, above the statutory requirement.
We believe that achieving work-life balance will lead to the growth of human resources and thus the company itself. In Japan, Santen launched a "Project for the Advancement of Measures to Support the Raising of the Next-Generation of Children" in the fi scal year ended March 31, 2006, under a collaboration between labor and management. Systems introduced support child rearing, including child care leave and shortened working hours for child care. As a result of our efforts to date, the number of employees taking advantage of these programs has risen, and this has led to improved employee satisfaction levels.
Promoting Diversity
Programs for Achieving Work-Life Balance
Santen has established health and safety management systems in Japan, China (Suzhou Plant) and Finland (Tampere Plant), according to the characteristics and scales of each business site, with the goal of achieving zero occupational accidents. When occupational accidents occur, we undertake countermeasures such as determining the cause, inspecting similar areas, and strengthening safety education, in our efforts to prevent recurrences.
Ensuring Employee Health and Safety
4. A system allowing for the accumulation of up to 40 days of unused paid annual leave, which can be used for prescribed reasons.
Child Care and Nursing Care Support Systems (Excerpt) and Number of Users (Japan)
System 2015 2016 2017
Special leave (paid)
Maternity leave 17 18 25
Leave to care for pre-school-age children 7 5 11
Nursing care leave 2 2 2
Child care leave system 21 16 37
Child care short work hour system 6 8 27
Nursing care leave system
Nursing care leave 1 0 1
Nursing care short work hour system 0 0 0
Annual paid vacation accumulation system4
Family care leave 63 73 81
Child care leave for children under elementary school age 40 36 44
Occupational Accidents
1. For Japan and China, the number of accidents associated with lost worktime. For Finland, the number of accidents associated with lost worktime of more than three days.
2. Number of deaths and injuries resulting from occupational accidents for every one million actual hours worked, an indicator of accident frequency.
3. Number of lost workdays for every 1,000 hours actually worked, an indicator of accident severity.
2015 2016 2017
All domestic operational sites (Japan)
Number of lost-worktime accidents1 0 3 2 Frequency rate of occupational accidents2 0.00 0.80 0.57 Severity rate of occupational accidents3 0.000 0.036 0.002
Suzhou Plant (China)
Number of lost-worktime accidents 0 0 0 Frequency rate of occupational accidents 0.00 0.00 0.00 Severity rate of occupational accidents 0.000 0.000 0.000
Tampere Plant (Finland)
Number of lost-worktime accidents 3 2 6 Frequency rate of occupational accidents 6.37 4.04 12.30 Severity rate of occupational accidents 0.039 0.032 0.164
Please refer to the CSR section on the Company’s website for details. http://www.santen.com
Santen Pharmaceutical Co., Ltd. Annual Report 201744
CSR ActivitiesEnvironmental Conservation
Santen actively strives to reduce CO2 emissions, and has reduced CO2 emissions per unit of revenue by 40.7% in Japan, from 263 tons per billion yen in the fi scal year ended March 31, 2013 to 156 tons per billion yen in the fi scal year ended March 31, 2017. Since the fi scal year ended March 31, 2014 we have participated in the low-carbon society action plan of the Federation of Pharmaceutical Manufacturers’ Association of Japan, and have been striving to achieve our medium-term target of reducing CO2 emissions in fi scal 2020 by 23% from fi scal 2005. Santen’s CO2 emissions in the fi scal year ended March 31, 2017 were 24,545 tons, 30.6% lower than fi scal 2005, a reduction exceeding the medium-term target.
Santen regularly measures and analyzes a variety of indices at each business site, including air pollution, water contamination, noise levels and vibration, in order to appro-priately control and identify pollution levels according to the regulatory standards stipulated in laws and local regulations. In particular, business sites that handle chemical substances work to maintain strict control over atmospheric emissions and to prevent leaks of waste liquids. Accordingly, systems have been put in place to ensure neighboring areas and the greater environment are not impacted.
Measures Against Global Warming Preventing Environmental Pollution
In Japan, Santen has set a medium-term target of achiev-ing a fi nal waste disposal ratio of 0% by fi scal 2020, and is working to reduce waste by promoting “3R” activities centered on waste reduction, reuse, and recycling. Our fi nal disposal ratio in the fi scal year ended March 31, 2017 was 0.012%.
Viewing water as a precious resource, Santen strives to reduce environmental burden by restricting water consumption and other means. The Santen Group’s consolidated water usage per unit of revenue in Japan in the fi scal year ended March 31, 2017 was 2.9 km3 per billion yen, a reduction of 31.8% from the fi scal year ended March 31, 2013. Santen also engages in forest conser-vation activities, which not only facilitate the absorption of CO2 but also maintain the rich natural environment and headwater conservation capacity, leading to the protection of biodiversity.
Zero-Emission Activities
Water Resource Safety and Forest Protection
Global Warming Countermeasures: Targets and Results Zero-Emission Activities: Targets and Results
Medium-term target (Japan)
Reduce CO2 emissions for fiscal 2020
by 23% from fiscal 2005 level
Medium-term target (Japan)
Achieve a 0% final waste
disposal ratio by fiscal 2020
Results for the fiscal year ended March 31, 2017
Reduced by 30.6%
from fiscal 2005 level
Results for the fiscal year ended March 31, 2017
Final waste disposal ratio
0.012%
▶ Please refer to P.8 for information on changes in CO2 emissions (Japan).
▶ Please refer to P.8 for information on changes in the final waste disposal ratio (Japan).
▶ Please refer to P.9 for changes in water usage (Japan).
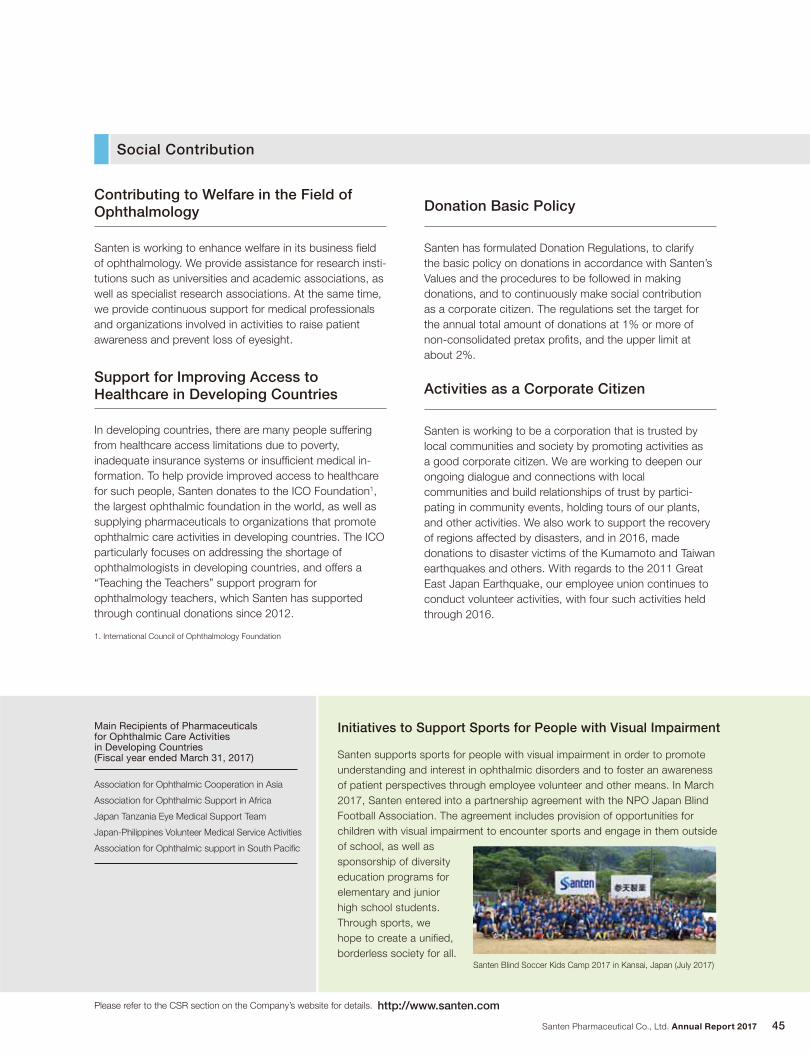
Santen Pharmaceutical Co., Ltd. Annual Report 2017 45
Social Contribution
Santen is working to enhance welfare in its business fi eld of ophthalmology. We provide assistance for research insti-tutions such as universities and academic associations, as well as specialist research associations. At the same time, we provide continuous support for medical professionals and organizations involved in activities to raise patient awareness and prevent loss of eyesight.
Santen has formulated Donation Regulations, to clarify the basic policy on donations in accordance with Santen’s Values and the procedures to be followed in making donations, and to continuously make social contribution as a corporate citizen. The regulations set the target for the annual total amount of donations at 1% or more of non-consolidated pretax profi ts, and the upper limit at about 2%.
Donation Basic PolicyContributing to Welfare in the Field of Ophthalmology
In developing countries, there are many people suffering from healthcare access limitations due to poverty, inadequate insurance systems or insuffi cient medical in-formation. To help provide improved access to healthcare for such people, Santen donates to the ICO Foundation1, the largest ophthalmic foundation in the world, as well as supplying pharmaceuticals to organizations that promote ophthalmic care activities in developing countries. The ICO particularly focuses on addressing the shortage of ophthalmologists in developing countries, and offers a “Teaching the Teachers” support program for ophthalmology teachers, which Santen has supported through continual donations since 2012.
Santen is working to be a corporation that is trusted by local communities and society by promoting activities as a good corporate citizen. We are working to deepen our ongoing dialogue and connections with local communities and build relationships of trust by partici-pating in community events, holding tours of our plants, and other activities. We also work to support the recovery of regions affected by disasters, and in 2016, made donations to disaster victims of the Kumamoto and Taiwan earthquakes and others. With regards to the 2011 Great East Japan Earthquake, our employee union continues to conduct volunteer activities, with four such activities held through 2016.
Support for Improving Access to Healthcare in Developing Countries Activities as a Corporate Citizen
Main Recipients of Pharmaceuticalsfor Ophthalmic Care Activitiesin Developing Countries(Fiscal year ended March 31, 2017) Santen supports sports for people with visual impairment in order to promote
understanding and interest in ophthalmic disorders and to foster an awareness of patient perspectives through employee volunteer and other means. In March 2017, Santen entered into a partnership agreement with the NPO Japan Blind Football Association. The agreement includes provision of opportunities for children with visual impairment to encounter sports and engage in them outside of school, as well as sponsorship of diversity education programs for elementary and junior high school students. Through sports, we hope to create a unifi ed, borderless society for all.
Initiatives to Support Sports for People with Visual Impairment
1. International Council of Ophthalmology Foundation
Santen Blind Soccer Kids Camp 2017 in Kansai, Japan (July 2017)
Association for Ophthalmic Cooperation in Asia
Association for Ophthalmic Support in Africa
Japan Tanzania Eye Medical Support Team
Japan-Philippines Volunteer Medical Service Activities
Association for Ophthalmic support in South Pacific
Please refer to the CSR section on the Company’s website for details. http://www.santen.com
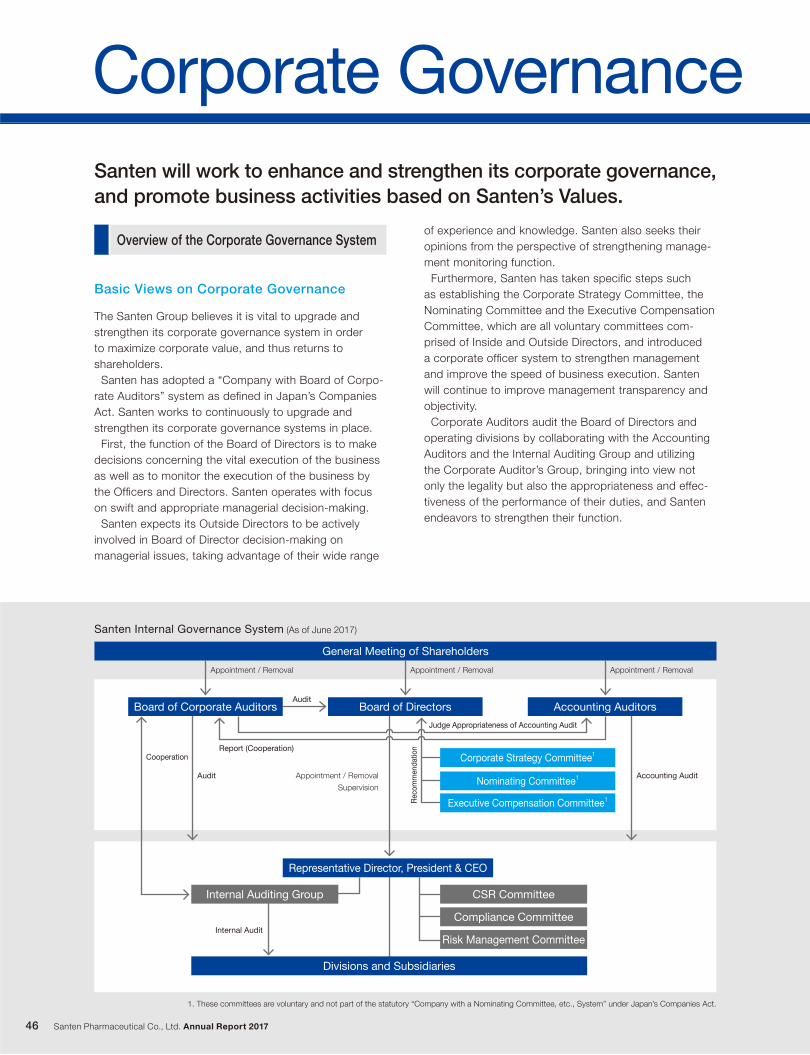
General Meeting of Shareholders
Santen Pharmaceutical Co., Ltd. Annual Report 201746
The Santen Group believes it is vital to upgrade and strengthen its corporate governance system in order to maximize corporate value, and thus returns to shareholders. Santen has adopted a “Company with Board of Corpo-rate Auditors” system as defined in Japan’s Companies Act. Santen works to continuously to upgrade and strengthen its corporate governance systems in place. First, the function of the Board of Directors is to make decisions concerning the vital execution of the business as well as to monitor the execution of the business by the Officers and Directors. Santen operates with focus on swift and appropriate managerial decision-making. Santen expects its Outside Directors to be actively involved in Board of Director decision-making on managerial issues, taking advantage of their wide range
Basic Views on Corporate Governance
of experience and knowledge. Santen also seeks their opinions from the perspective of strengthening manage-ment monitoring function. Furthermore, Santen has taken specific steps such as establishing the Corporate Strategy Committee, the Nominating Committee and the Executive Compensation Committee, which are all voluntary committees com-prised of Inside and Outside Directors, and introduced a corporate officer system to strengthen management and improve the speed of business execution. Santen will continue to improve management transparency and objectivity. Corporate Auditors audit the Board of Directors and operating divisions by collaborating with the Accounting Auditors and the Internal Auditing Group and utilizing the Corporate Auditor’s Group, bringing into view not only the legality but also the appropriateness and effec-tiveness of the performance of their duties, and Santen endeavors to strengthen their function.
Santen Internal Governance System (As of June 2017)
1. These committees are voluntary and not part of the statutory “Company with a Nominating Committee, etc., System” under Japan’s Companies Act.
Cooperation
Audit
Audit
Appointment / Removal
Supervision
Accounting Audit
Appointment / Removal Appointment / Removal Appointment / Removal
Santen will work to enhance and strengthen its corporate governance, and promote business activities based on Santen’s Values.
Report (Cooperation)
Judge Appropriateness of Accounting Audit
Reco
mmen
datio
n
Board of Corporate Auditors Board of Directors Accounting Auditors
Corporate Strategy Committee1
Nominating Committee1
Executive Compensation Committee1
Internal Audit
Representative Director, President & CEO
Internal Auditing Group CSR Committee
Compliance Committee
Risk Management Committee
Divisions and Subsidiaries
Corporate Governance
Overview of the Corporate Governance System
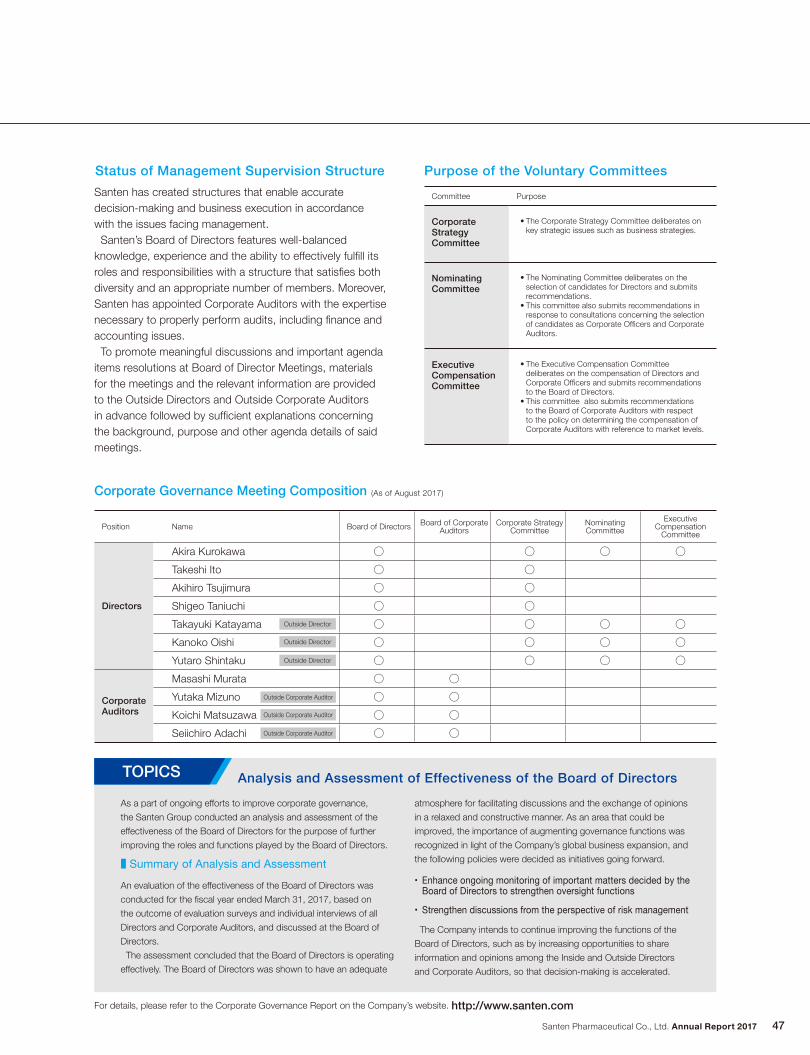
Santen Pharmaceutical Co., Ltd. Annual Report 2017 47
Santen has created structures that enable accurate decision-making and business execution in accordance with the issues facing management. Santen’s Board of Directors features well-balanced knowledge, experience and the ability to effectively fulfill its roles and responsibilities with a structure that satisfies both diversity and an appropriate number of members. Moreover, Santen has appointed Corporate Auditors with the expertise necessary to properly perform audits, including finance and accounting issues. To promote meaningful discussions and important agenda items resolutions at Board of Director Meetings, materials for the meetings and the relevant information are provided to the Outside Directors and Outside Corporate Auditors in advance followed by sufficient explanations concerning the background, purpose and other agenda details of said meetings.
Status of Management Supervision Structure
Corporate Governance Meeting Composition (As of August 2017)
Committee Purpose
Corporate Strategy Committee
• The Corporate Strategy Committee deliberates on key strategic issues such as business strategies.
Nominating Committee
• The Nominating Committee deliberates on the selection of candidates for Directors and submits recommendations.
• This committee also submits recommendations in response to consultations concerning the selection of candidates as Corporate Officers and Corporate Auditors.
Executive Compensation Committee
• The Executive Compensation Committee deliberates on the compensation of Directors and Corporate Officers and submits recommendations to the Board of Directors.
• This committee also submits recommendations to the Board of Corporate Auditors with respect to the policy on determining the compensation of Corporate Auditors with reference to market levels.
Purpose of the Voluntary Committees
For details, please refer to the Corporate Governance Report on the Company’s website. http://www.santen.com
Analysis and Assessment of Effectiveness of the Board of Directors
As a part of ongoing efforts to improve corporate governance,
the Santen Group conducted an analysis and assessment of the
effectiveness of the Board of Directors for the purpose of further
improving the roles and functions played by the Board of Directors.
The Company intends to continue improving the functions of the
Board of Directors, such as by increasing opportunities to share
information and opinions among the Inside and Outside Directors
and Corporate Auditors, so that decision-making is accelerated.
■ Summary of Analysis and AssessmentAn evaluation of the effectiveness of the Board of Directors was
conducted for the fiscal year ended March 31, 2017, based on
the outcome of evaluation surveys and individual interviews of all
Directors and Corporate Auditors, and discussed at the Board of
Directors.
The assessment concluded that the Board of Directors is operating
effectively. The Board of Directors was shown to have an adequate
• Enhance ongoing monitoring of important matters decided by the Board of Directors to strengthen oversight functions
• Strengthen discussions from the perspective of risk management
atmosphere for facilitating discussions and the exchange of opinions
in a relaxed and constructive manner. As an area that could be
improved, the importance of augmenting governance functions was
recognized in light of the Company’s global business expansion, and
the following policies were decided as initiatives going forward.
Position Name Board of Directors Board of Corporate Auditors
Corporate Strategy Committee
Nominating Committee
Executive Compensation
Committee
Directors
Akira Kurokawa ○ ○ ○ ○Takeshi Ito ○ ○Akihiro Tsujimura ○ ○Shigeo Taniuchi ○ ○Takayuki Katayama ○ ○ ○ ○Kanoko Oishi ○ ○ ○ ○Yutaro Shintaku ○ ○ ○ ○
Corporate Auditors
Masashi Murata ○ ○Yutaka Mizuno ○ ○Koichi Matsuzawa ○ ○Seiichiro Adachi ○ ○
Outside Corporate Auditor
Outside Director
Outside Director
Outside Director
Outside Corporate Auditor
Outside Corporate Auditor
TOPICS
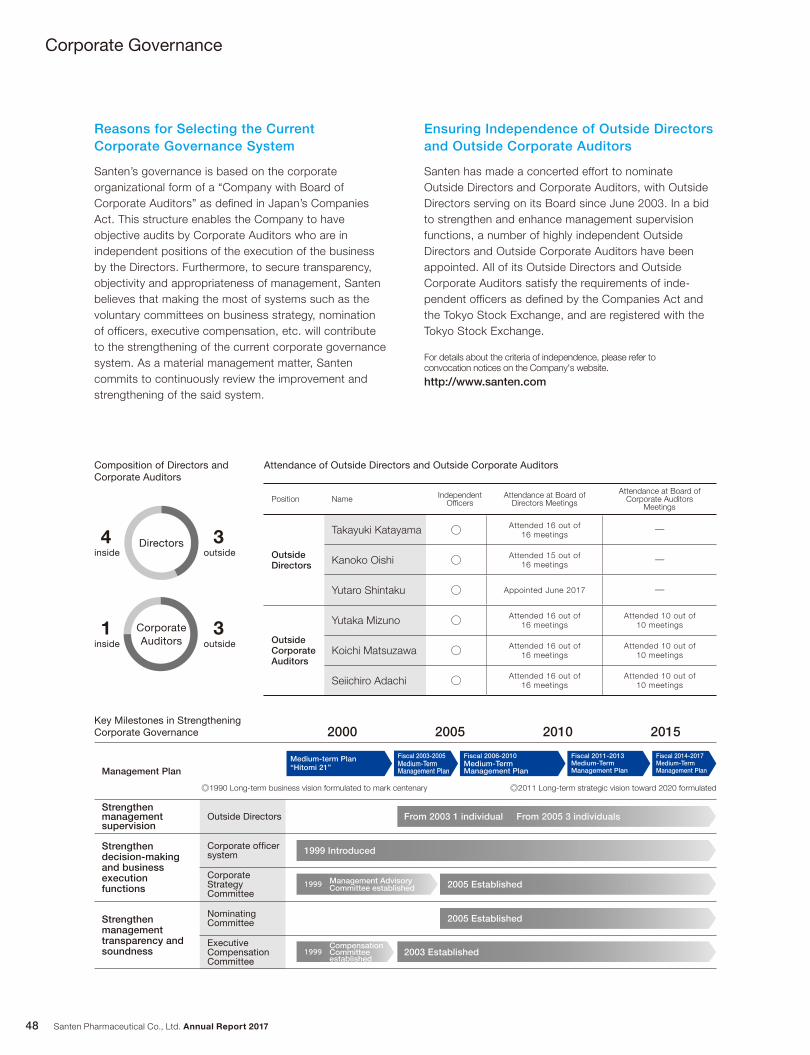
Santen Pharmaceutical Co., Ltd. Annual Report 201748
Attendance of Outside Directors and Outside Corporate Auditors
Position Name Independent Officers
Attendance at Board of Directors Meetings
Attendance at Board of Corporate Auditors
Meetings
Outside Directors
Takayuki Katayama ○ Attended 16 out of 16 meetings ―
Kanoko Oishi ○ Attended 15 out of 16 meetings ―
Yutaro Shintaku ○ Appointed June 2017 ―
Outside Corporate Auditors
Yutaka Mizuno ○ Attended 16 out of 16 meetings
Attended 10 out of 10 meetings
Koichi Matsuzawa ○ Attended 16 out of 16 meetings
Attended 10 out of 10 meetings
Seiichiro Adachi ○ Attended 16 out of 16 meetings
Attended 10 out of 10 meetings
Composition of Directors and Corporate Auditors
4inside
3outside
Directors
1inside
3outside
Corporate Auditors
Santen’s governance is based on the corporate organizational form of a “Company with Board of Corporate Auditors” as defined in Japan’s Companies Act. This structure enables the Company to have objective audits by Corporate Auditors who are in independent positions of the execution of the business by the Directors. Furthermore, to secure transparency, objectivity and appropriateness of management, Santen believes that making the most of systems such as the voluntary committees on business strategy, nomination of officers, executive compensation, etc. will contribute to the strengthening of the current corporate governance system. As a material management matter, Santen commits to continuously review the improvement and strengthening of the said system.
Santen has made a concerted effort to nominate Outside Directors and Corporate Auditors, with Outside Directors serving on its Board since June 2003. In a bid to strengthen and enhance management supervision functions, a number of highly independent Outside Directors and Outside Corporate Auditors have been appointed. All of its Outside Directors and Outside Corporate Auditors satisfy the requirements of inde-pendent officers as defined by the Companies Act and the Tokyo Stock Exchange, and are registered with the Tokyo Stock Exchange.
Reasons for Selecting the Current Corporate Governance System
Ensuring Independence of Outside Directors and Outside Corporate Auditors
2000 2005 2010 2015
Management Plan
Strengthen management supervision
Outside Directors
Strengthen decision-making and business execution functions
Corporate officer system
Corporate Strategy Committee
Strengthen management transparency and soundness
Nominating Committee
Executive Compensation Committee
◎1990 Long-term business vision formulated to mark centenary ◎2011 Long-term strategic vision toward 2020 formulated
Key Milestones in Strengthening Corporate Governance
1999 Introduced
2003 Established
2005 Established
2005 Established
Medium-term Plan “Hitomi 21”
Fiscal 2003-2005Medium-Term Management Plan
Fiscal 2006-2010Medium-Term Management Plan
Fiscal 2011-2013Medium-Term Management Plan
Fiscal 2014-2017Medium-Term Management Plan
From 2003 1 individual From 2005 3 individuals
Corporate Governance
1999 Management Advisory Committee established
1999CompensationCommitteeestablished
For details about the criteria of independence, please refer to convocation notices on the Company's website.
http://www.santen.com
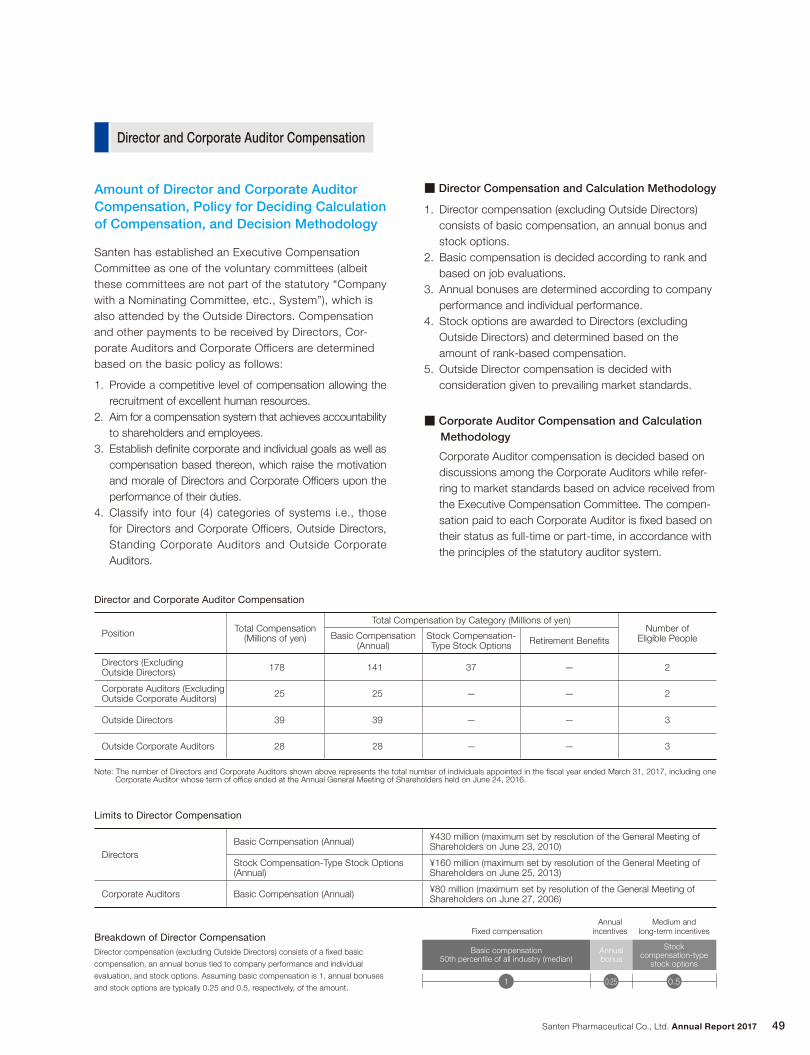
Santen Pharmaceutical Co., Ltd. Annual Report 2017 49
■ Director Compensation and Calculation Methodology
1. Director compensation (excluding Outside Directors) consists of basic compensation, an annual bonus and stock options.
2. Basic compensation is decided according to rank and based on job evaluations.
3. Annual bonuses are determined according to company performance and individual performance.
4. Stock options are awarded to Directors (excluding Outside Directors) and determined based on the amount of rank-based compensation.
5. Outside Director compensation is decided with consideration given to prevailing market standards.
■ Corporate Auditor Compensation and Calculation Methodology
Corporate Auditor compensation is decided based on discussions among the Corporate Auditors while refer-ring to market standards based on advice received from the Executive Compensation Committee. The compen-sation paid to each Corporate Auditor is fi xed based on their status as full-time or part-time, in accordance with the principles of the statutory auditor system.
Santen has established an Executive Compensation Committee as one of the voluntary committees (albeit these committees are not part of the statutory “Company with a Nominating Committee, etc., System”), which is also attended by the Outside Directors. Compensation and other payments to be received by Directors, Cor-porate Auditors and Corporate Officers are determined based on the basic policy as follows:
Amount of Director and Corporate Auditor Compensation, Policy for Deciding Calculation of Compensation, and Decision Methodology
Director and Corporate Auditor Compensation
Note: The number of Directors and Corporate Auditors shown above represents the total number of individuals appointed in the fiscal year ended March 31, 2017, including one Corporate Auditor whose term of office ended at the Annual General Meeting of Shareholders held on June 24, 2016.
Position Total Compensation (Millions of yen)
Total Compensation by Category (Millions of yen)Number of
Eligible PeopleBasic Compensation (Annual)
Stock Compensation-Type Stock Options Retirement Benefits
Directors (Excluding Outside Directors) 178 141 37 — 2
Corporate Auditors (ExcludingOutside Corporate Auditors) 25 25 — — 2
Outside Directors 39 39 — — 3
Outside Corporate Auditors 28 28 — — 3
Limits to Director Compensation
DirectorsBasic Compensation (Annual) ¥430 million (maximum set by resolution of the General Meeting of
Shareholders on June 23, 2010)
Stock Compensation-Type Stock Options (Annual)
¥160 million (maximum set by resolution of the General Meeting of Shareholders on June 25, 2013)
Corporate Auditors Basic Compensation (Annual) ¥80 million (maximum set by resolution of the General Meeting of Shareholders on June 27, 2006)
Breakdown of Director CompensationDirector compensation (excluding Outside Directors) consists of a fixed basic
compensation, an annual bonus tied to company performance and individual
evaluation, and stock options. Assuming basic compensation is 1, annual bonuses
and stock options are typically 0.25 and 0.5, respectively, of the amount.
Fixed compensationAnnual
incentivesMedium and
long-term incentives
Basic compensation 50th percentile of all industry (median)
Annual bonus
Stock compensation-type
stock options
1 0.25 0.5
Director and Corporate Auditor Compensation
1. Provide a competitive level of compensation allowing the recruitment of excellent human resources.
2. Aim for a compensation system that achieves accountability to shareholders and employees.
3. Establish definite corporate and individual goals as well as compensation based thereon, which raise the motivation and morale of Directors and Corporate Officers upon the performance of their duties.
4. Classify into four (4) categories of systems i.e., those for Directors and Corporate Officers, Outside Directors, Standing Corporate Auditors and Outside Corporate Auditors.
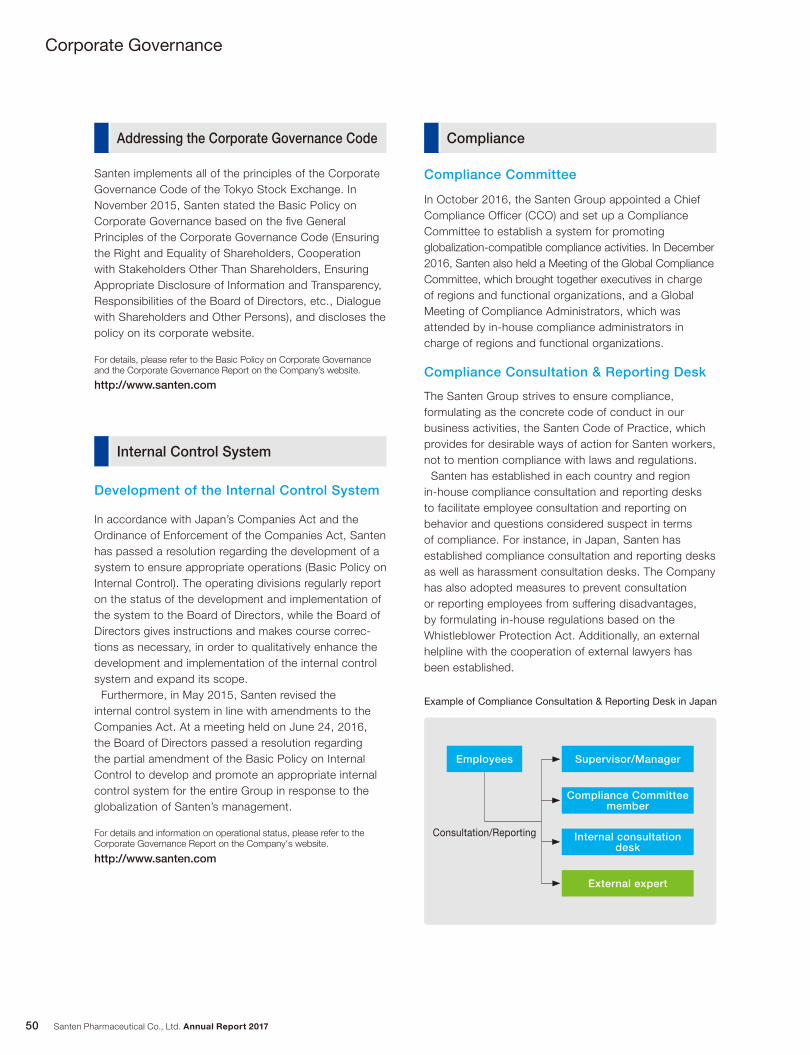
Santen Pharmaceutical Co., Ltd. Annual Report 201750
Corporate Governance
Internal Control System
In accordance with Japan’s Companies Act and the Ordinance of Enforcement of the Companies Act, Santen has passed a resolution regarding the development of a system to ensure appropriate operations (Basic Policy on Internal Control). The operating divisions regularly report on the status of the development and implementation of the system to the Board of Directors, while the Board of Directors gives instructions and makes course correc-tions as necessary, in order to qualitatively enhance the development and implementation of the internal control system and expand its scope. Furthermore, in May 2015, Santen revised the internal control system in line with amendments to the Companies Act. At a meeting held on June 24, 2016, the Board of Directors passed a resolution regarding the partial amendment of the Basic Policy on Internal Control to develop and promote an appropriate internal control system for the entire Group in response to the globalization of Santen’s management.
Development of the Internal Control System
Compliance
In October 2016, the Santen Group appointed a Chief Compliance Officer (CCO) and set up a Compliance Committee to establish a system for promoting globalization-compatible compliance activities. In December 2016, Santen also held a Meeting of the Global Compliance Committee, which brought together executives in charge of regions and functional organizations, and a Global Meeting of Compliance Administrators, which was attended by in-house compliance administrators in charge of regions and functional organizations.
Compliance Committee
The Santen Group strives to ensure compliance, formulating as the concrete code of conduct in our business activities, the Santen Code of Practice, which provides for desirable ways of action for Santen workers, not to mention compliance with laws and regulations. Santen has established in each country and region in-house compliance consultation and reporting desks to facilitate employee consultation and reporting on behavior and questions considered suspect in terms of compliance. For instance, in Japan, Santen has established compliance consultation and reporting desks as well as harassment consultation desks. The Company has also adopted measures to prevent consultation or reporting employees from suffering disadvantages, by formulating in-house regulations based on the Whistleblower Protection Act. Additionally, an external helpline with the cooperation of external lawyers has been established.
Compliance Consultation & Reporting Desk
Example of Compliance Consultation & Reporting Desk in Japan
Employees
Consultation/Reporting
Supervisor/Manager
Compliance Committee member
Internal consultation desk
External expert
Addressing the Corporate Governance Code
Santen implements all of the principles of the Corporate Governance Code of the Tokyo Stock Exchange. In November 2015, Santen stated the Basic Policy on Corporate Governance based on the five General Principles of the Corporate Governance Code (Ensuring the Right and Equality of Shareholders, Cooperation with Stakeholders Other Than Shareholders, Ensuring Appropriate Disclosure of Information and Transparency, Responsibilities of the Board of Directors, etc., Dialogue with Shareholders and Other Persons), and discloses the policy on its corporate website.
For details, please refer to the Basic Policy on Corporate Governance and the Corporate Governance Report on the Company’s website.
http://www.santen.com
http://www.santen.com
For details and information on operational status, please refer to the Corporate Governance Report on the Company's website.
Santen Pharmaceutical Co., Ltd. Annual Report 2017 51
Regarding information control systems, Santen conducts technological and physical protection and training based on in-house rules for basic information security and document control to safely store and control information. Furthermore, Santen has established personal informa-tion protection guidelines and a compliance program regarding personal information protection, which is explained to corporate officers and employees at training events. The Company also works to ensure that they are working properly.
Information Security
Risk Management
Santen has built a system for responding appropriately to major risks related to its global business activities, in accordance with its risk management rules. Santen has established a Risk Management Committee as a system to manage risks in normal circumstances. The Committee cooperates with operating divisions and headquarters to avoid or minimize risk by gathering information and preparing risk management policies and countermeasures for their operations. Further, the Risk Evaluation Committee discusses risk management policies and countermeasures for significant risks that transcend several divisions. An emergency situation affecting Santen beyond a certain level triggers the operation of the Crisis Response Committee headed by a representative director. Based on Santen’s risk management rules, the committee coordinates efforts to minimize any losses or damages and ensure a quick re-covery, and institutes measures to prevent a recurrence. As regards the status of such risk management efforts, the Company has a permanent secretariat in place with designated executives. The secretariat checks the status of risk management efforts from a Company-wide view-point, while the Internal Auditing Group examines them from an independent standpoint. The Company has also stipulated rules for officers and employees to report in the event of an incident that could become a major crisis and established crisis report regulations with the objective of enabling a rapid response to such issues.
Risk Management Promotion Framework
The Santen Group conducts risk assessments every two years to comprehensively ascertain risks facing the Group as a whole, while also working to develop an optimal risk management system in line with advances in the globalization of its businesses. Recently, an assess-ment was conducted by an outside research company of subsidiaries and key business bases worldwide in
Risk Assessment
For details, please refer to the Disclosure Policy on the Company's website.http://www.santen.com
Information Disclosure
The Santen Group discloses information as required by law and regulations, and also makes concerted efforts to fairly disclose accurate information that is easy to understand and not required by law from the standpoint of ensuring transparency and fairness in its decision-making process as well as effective corporate governance. In the Santen Code of Practice, the basic policy on information disclosure states that corporate information shall be properly disclosed in a timely fashion, and that procedures for applying for approval from government entities, filing reports and other applications shall be conducted in a manner that avoids misunderstandings and the appearance of deceit. Santen aggressively discloses information to share-holders and investors based on its Disclosure Policy. The Company has also created rules for transparency in relationships with medical institutions, and rules for transparency in relationships with patient organizations. Information about the provision of funding to medical institutions and relationships with patient groups is broadly disseminated through its website.
Ensuring Proactive Information Disclosure and Transparency
Santen holds quarterly financial results meeting presentations or conference calls for securities analysts and institutional investors after results are announced. Furthermore, Santen conducts individual meetings and small meetings with domestic and overseas investors. Santen actively participates in conferences hosted by securities companies in Japan and overseas as well as conducts presentations for individual investors in Japan. Santen’s website carries a host of information, including performance reports, data books, financial result meeting presentations, and financial result meeting presentation videos. The website also carries annual Japan FSA filings (Japanese language), annual reports, and convocation notices, resolution notices, and other materials for the general meetings of shareholders.
Investor Relations Activities
2015. The survey did not identify any evidence of serious compliance violations or misconduct, and it confirmed that Santen’s corporate culture and environment for preventing those contingencies were largely satisfactory.
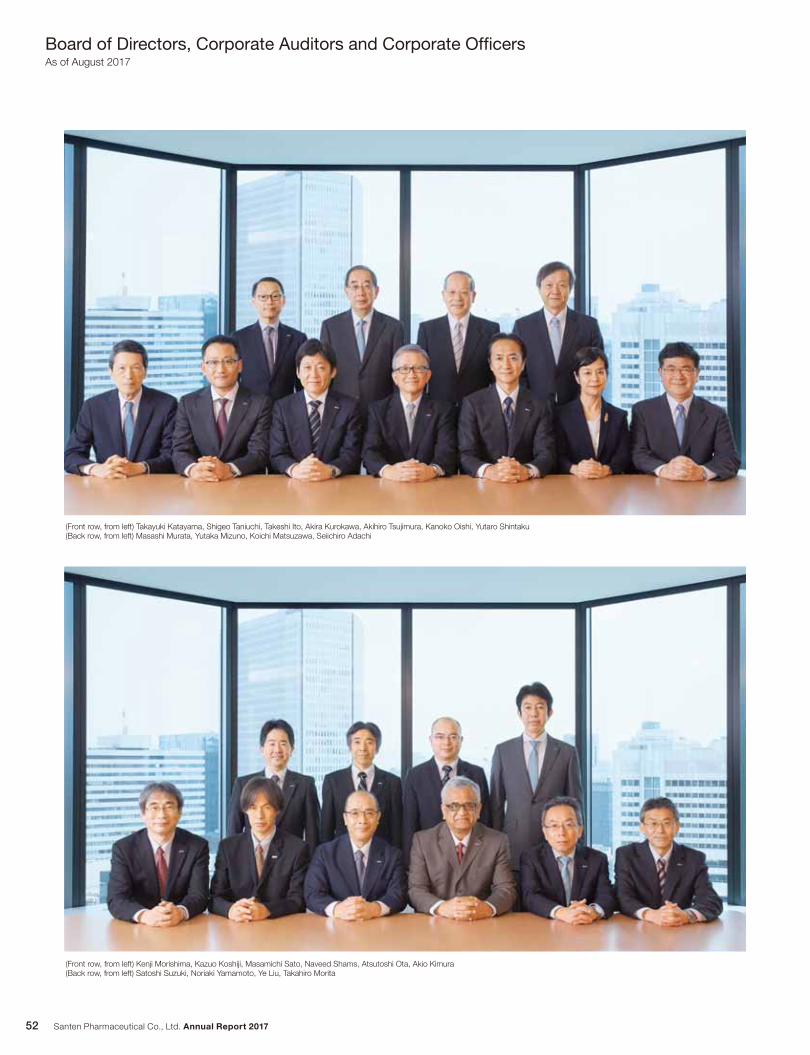
Santen Pharmaceutical Co., Ltd. Annual Report 201752
Board of Directors, Corporate Auditors and Corporate Offi cersAs of August 2017
(Front row, from left) Takayuki Katayama, Shigeo Taniuchi, Takeshi Ito, Akira Kurokawa, Akihiro Tsujimura, Kanoko Oishi, Yutaro Shintaku(Back row, from left) Masashi Murata, Yutaka Mizuno, Koichi Matsuzawa, Seiichiro Adachi
(Front row, from left) Kenji Morishima, Kazuo Koshiji, Masamichi Sato, Naveed Shams, Atsutoshi Ota, Akio Kimura(Back row, from left) Satoshi Suzuki, Noriaki Yamamoto, Ye Liu, Takahiro Morita
Santen Pharmaceutical Co., Ltd. Annual Report 2017 53
Corporate Officers
Directors
Akihiro TsujimuraDirector, Executive Corporate Offi cerAsia and North America Businesses Head of Asia Division President & CEO of Santen Inc.2004 Joined the Company2011 Corporate Officer, COO of Santen Inc.2015 Senior Corporate Officer, Head of Asia Division2016 Executive Corporate Officer, Head of Corporate Development Division, Asia and North America Businesses, and President & CEO of Santen Inc.2017 Director, Executive Corporate Officer, Asia and North America Businesses, Head of Asia Division, President & CEO of Santen Inc. (incumbent)
Kanoko Oishi
1993 Partner, McKinsey & Company, Inc.2000 Established Mediva, Inc. Chief Executive Officer (incumbent)2004 Established Platanus Medical Corporation, COO (incumbent)2015 Outside Director of the Company (incumbent)2015 External Board Member, Ezaki Glico Co., Ltd. (incumbent)2015 Outside Director, SURUGA bank Ltd. (incumbent)2016 External Director, Shiseido Company, Limited (incumbent)
Masashi MurataStanding Corporate Auditor1999 Joined the Company2007 General Manager, Corporate Planning Group2011 Chief Administrative Officer (CAO), Santen Inc.2014 General Manager, Corporate Auditor’s Group 2016 Standing Corporate Auditor (incumbent)
Masamichi SatoSenior Corporate Offi cerChief Compliance Offi cer (CCO) Head of CSR & Internal Control DivisionCEO of Santen Business Service Co., Ltd.
Kenji MorishimaCorporate Offi cerHead of Pharmaceutical Technology Development
Ye LiuCorporate Offi cer General ManagerSanten Pharmaceutical (China) Co., Ltd.
Akio KimuraCorporate Offi cerHead of Global Product Supply
Takahiro MoritaCorporate Offi cerHead of Japan Prescription Pharmaceuticals Sales
Noriaki YamamotoCorporate Offi cerChief Information Offi cer (CIO)Head of Information Systems Division
Satoshi SuzukiCorporate Offi cerHead of CorporateDevelopment Division
Naveed Shams, M.D., Ph.D.Senior Corporate Offi cerChief Scientifi c Offi cer (CSO)Head of Global Research and Development
Atsutoshi OtaSenior Corporate Offi cerHead of Human Resources Development Division
Kazuo KoshijiSenior Corporate Offi cerChief Financial Offi cer (CFO)Head of Finance Division
Yutaka Mizuno
2004 Executive Officer, Matsushita Electric Industrial Co., Ltd. (currently, Panasonic Corporation)2011 Outside Corporate Auditor of the Company (incumbent)2013 Outside Audit & Supervisory Board Member, KOKUYO Co., Ltd.
Koichi Matsuzawa
1996 President & CEO, Kirin Europe GmbH2008 Representative Director & Managing Director, Kirin Holdings Company, Limited2009 President & CEO, Kirin Brewery Company, Limited2014 Outside Corporate Auditor of the Company (incumbent)2017 President & CEO, Meidi-Ya Co., Ltd. (incumbent)
Seiichiro Adachi
2008 Managing Director, Toyota Tsusho Corporation2010 President, NV Toyota Tsusho Europe SA2013 Full-time Audit & Supervisory Board Member, Toyota Tsusho Corporation2015 Advisor, Toyota Tsusho Corporation 2015 Outside Corporate Auditor of the Company (incumbent)2016 Special Appointed Professor Yokohama College of Commerce (incumbent)
Akira KurokawaPresident and Chief Executive Offi cer1977 Joined the Company1997 Director, General Manager, Head of the Office of Sales and Marketing Division, Prescription Pharmaceuticals2001 Corporate Officer, Head of Sales and Marketing Division, Prescription Pharmaceuticals2004 Senior Corporate Officer, Head of Sales and Marketing Division, Prescription Pharmaceuticals2006 President & COO2008 President & CEO (incumbent)
Shigeo TaniuchiDirector, Senior Corporate Offi cer Head of Santen EMEAPresident of Santen Holdings EU B. V.1996 Joined the Company2015 Corporate Officer, Head of Santen Europe (currently EMEA), and President of Santen Holdings EU B.V.2016 Senior Corporate Officer, Head of Santen Europe (currently EMEA), and President of Santen Holdings EU B.V. 2017 Director, Senior Corporate Officer Head of Santen EMEA, President of Santen Holdings EU B. V. (incumbent)
Yutaro Shintaku
2010 Representative Director, President and CEO,Terumo Corporation2017 Outside Director, J-OIL MILLS, Inc. (incumbent)2017 Outside Director of the Company (incumbent)2017 Corporate Advisor, Terumo Corporation (incumbent)
Takeshi ItoDirector, Executive Corporate Offi cer Japan Business, Head of Japan Sales and Marketing, Prescription Pharmaceuticals1982 Joined the Company2012 Corporate Officer, Head of Prescription Pharmaceuticals Sales Department, Sales and Marketing Division, Prescription Pharmaceuticals2014 Senior Corporate Officer, Head of Japan Sales and Marketing, Prescription Pharmaceuticals2016 Executive Corporate Officer, Japan Business, Head of Japan Sales and Marketing, Prescription Pharmaceuticals 2017 Director, Executive Corporate Officer Japan Business, Head of Japan Sales and Marketing, Prescription Pharmaceuticals (incumbent)
Takayuki Katayama
2006 Executive Vice-President and Representative Director, Teijin Limited2011 Senior Advisor to CEO, Teijin Limited (incumbent)2012 Outside Director of the Company (incumbent)2012 Outside Corporate Auditor, Toyo Seikan Group Holdings, Ltd. 2016 Outside Director, Olympus Corporation (incumbent)
Corporate Auditors
(Not including directors who also serve as corporate offi cers)
Outside Director
Outside Corporate Auditor Outside Corporate Auditor Outside Corporate Auditor
Outside Director
Outside Director
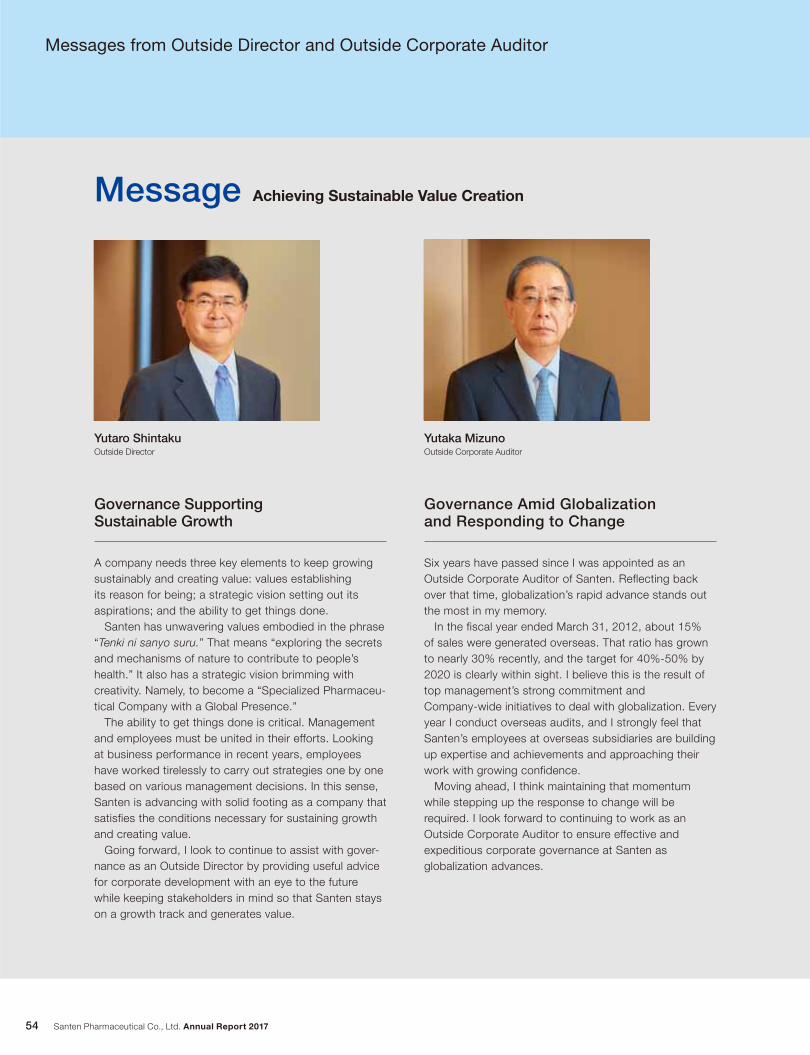
Santen Pharmaceutical Co., Ltd. Annual Report 201754
Messages from Outside Director and Outside Corporate Auditor
A company needs three key elements to keep growing sustainably and creating value: values establishing its reason for being; a strategic vision setting out its aspirations; and the ability to get things done. Santen has unwavering values embodied in the phrase “Tenki ni sanyo suru.” That means “exploring the secrets and mechanisms of nature to contribute to people’s health.” It also has a strategic vision brimming with creativity. Namely, to become a “Specialized Pharmaceu-tical Company with a Global Presence.” The ability to get things done is critical. Management and employees must be united in their efforts. Looking at business performance in recent years, employees have worked tirelessly to carry out strategies one by one based on various management decisions. In this sense, Santen is advancing with solid footing as a company that satisfies the conditions necessary for sustaining growth and creating value. Going forward, I look to continue to assist with gover-nance as an Outside Director by providing useful advice for corporate development with an eye to the future while keeping stakeholders in mind so that Santen stays on a growth track and generates value.
Six years have passed since I was appointed as an Outside Corporate Auditor of Santen. Reflecting back over that time, globalization’s rapid advance stands out the most in my memory. In the fiscal year ended March 31, 2012, about 15% of sales were generated overseas. That ratio has grown to nearly 30% recently, and the target for 40%-50% by 2020 is clearly within sight. I believe this is the result of top management’s strong commitment and Company-wide initiatives to deal with globalization. Every year I conduct overseas audits, and I strongly feel that Santen’s employees at overseas subsidiaries are building up expertise and achievements and approaching their work with growing confidence. Moving ahead, I think maintaining that momentum while stepping up the response to change will be required. I look forward to continuing to work as an Outside Corporate Auditor to ensure effective and expeditious corporate governance at Santen as globalization advances.
Governance Amid Globalization and Responding to Change
Governance Supporting Sustainable Growth
Message Achieving Sustainable Value Creation
Yutaro ShintakuOutside Director
Yutaka MizunoOutside Corporate Auditor
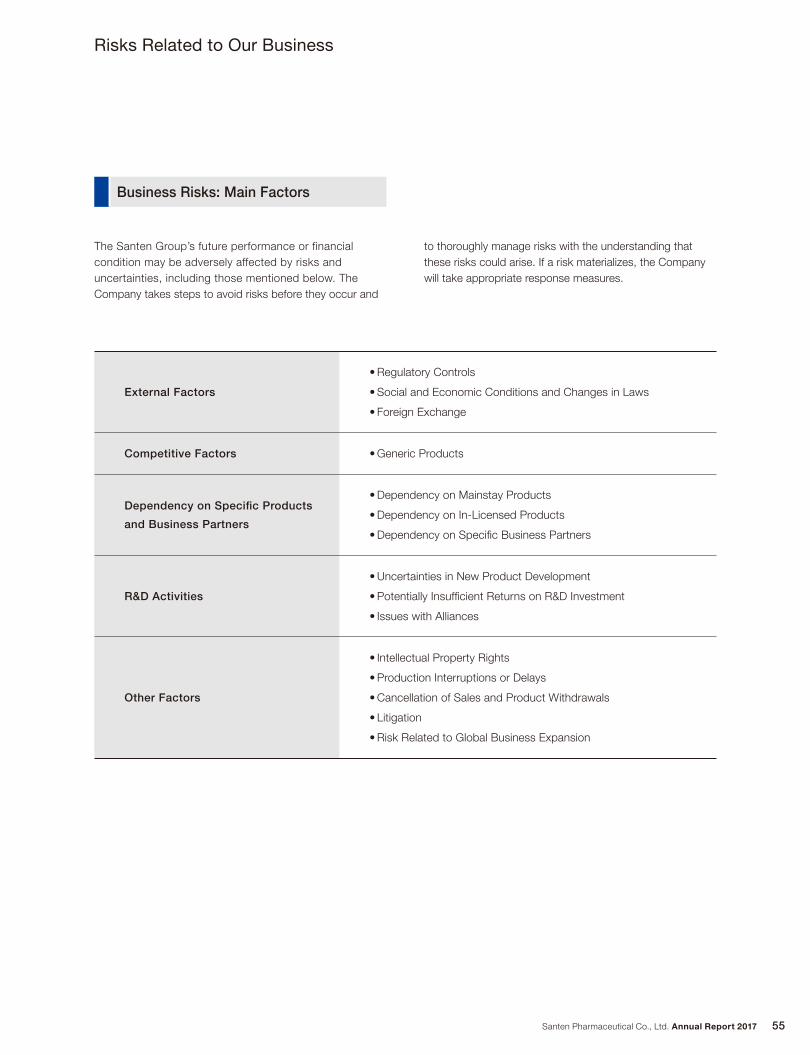
Santen Pharmaceutical Co., Ltd. Annual Report 2017 55
Risks Related to Our Business
The Santen Group’s future performance or financial condition may be adversely affected by risks and uncertainties, including those mentioned below. The Company takes steps to avoid risks before they occur and
to thoroughly manage risks with the understanding that these risks could arise. If a risk materializes, the Company will take appropriate response measures.
External Factors
• Regulatory Controls
• Social and Economic Conditions and Changes in Laws
• Foreign Exchange
Competitive Factors • Generic Products
Dependency on Specific Products
and Business Partners
• Dependency on Mainstay Products
• Dependency on In-Licensed Products
• Dependency on Specific Business Partners
R&D Activities
• Uncertainties in New Product Development
• Potentially Insufficient Returns on R&D Investment
• Issues with Alliances
Other Factors
• Intellectual Property Rights
• Production Interruptions or Delays
• Cancellation of Sales and Product Withdrawals
• Litigation
• Risk Related to Global Business Expansion
Business Risks: Main Factors
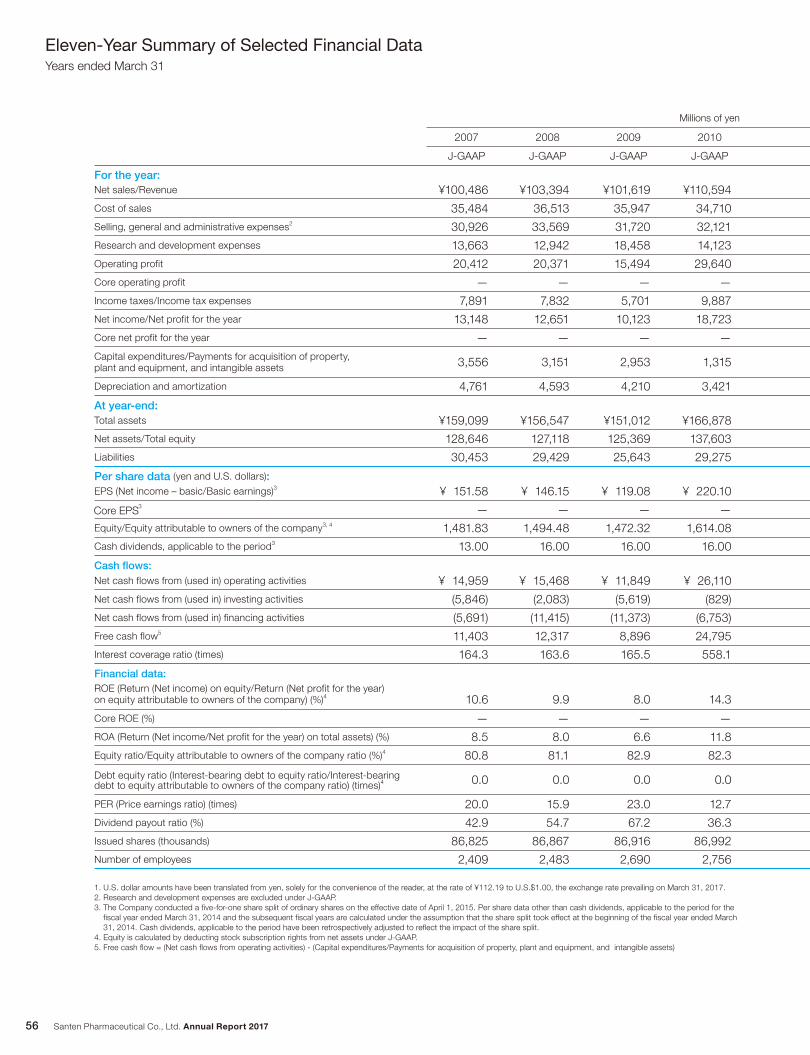
Santen Pharmaceutical Co., Ltd. Annual Report 201756
Eleven-Year Summary of Selected Financial Data
Millions of yen
2007 2008 2009 2010
J-GAAP J-GAAP J-GAAP J-GAAP
For the year:Net sales/Revenue ¥100,486 ¥103,394 ¥101,619 ¥110,594
Cost of sales 35,484 36,513 35,947 34,710
Selling, general and administrative expenses2 30,926 33,569 31,720 32,121
Research and development expenses 13,663 12,942 18,458 14,123
Operating profit 20,412 20,371 15,494 29,640
Core operating profit — — — —
Income taxes/Income tax expenses 7,891 7,832 5,701 9,887
Net income/Net profit for the year 13,148 12,651 10,123 18,723
Core net profit for the year — — — —
Capital expenditures/Payments for acquisition of property, plant and equipment, and intangible assets 3,556 3,151 2,953 1,315
Depreciation and amortization 4,761 4,593 4,210 3,421
At year-end:Total assets ¥159,099 ¥156,547 ¥151,012 ¥166,878Net assets/Total equity 128,646 127,118 125,369 137,603Liabilities 30,453 29,429 25,643 29,275
Per share data (yen and U.S. dollars): EPS (Net income – basic/Basic earnings)3 ¥ 151.58 ¥ 146.15 ¥ 119.08 ¥ 220.10
Core EPS3 — — — —
Equity/Equity attributable to owners of the company3, 4 1,481.83 1,494.48 1,472.32 1,614.08Cash dividends, applicable to the period3 13.00 16.00 16.00 16.00
Cash flows:Net cash flows from (used in) operating activities ¥ 14,959 ¥ 15,468 ¥ 11,849 ¥ 26,110
Net cash flows from (used in) investing activities (5,846) (2,083) (5,619) (829)
Net cash flows from (used in) financing activities (5,691) (11,415) (11,373) (6,753)
Free cash flow5 11,403 12,317 8,896 24,795Interest coverage ratio (times) 164.3 163.6 165.5 558.1
Financial data:ROE (Return (Net income) on equity/Return (Net profit for the year) on equity attributable to owners of the company) (%)4 10.6 9.9 8.0 14.3
Core ROE (%) — — — —
ROA (Return (Net income/Net profit for the year) on total assets) (%) 8.5 8.0 6.6 11.8
Equity ratio/Equity attributable to owners of the company ratio (%)4 80.8 81.1 82.9 82.3
Debt equity ratio (Interest-bearing debt to equity ratio/Interest-bearing debt to equity attributable to owners of the company ratio) (times)4 0.0 0.0 0.0 0.0
PER (Price earnings ratio) (times) 20.0 15.9 23.0 12.7
Dividend payout ratio (%) 42.9 54.7 67.2 36.3
Issued shares (thousands) 86,825 86,867 86,916 86,992Number of employees 2,409 2,483 2,690 2,756
1. U.S. dollar amounts have been translated from yen, solely for the convenience of the reader, at the rate of ¥112.19 to U.S.$1.00, the exchange rate prevailing on March 31, 2017.2. Research and development expenses are excluded under J-GAAP.3. The Company conducted a five-for-one share split of ordinary shares on the effective date of April 1, 2015. Per share data other than cash dividends, applicable to the period for the
fiscal year ended March 31, 2014 and the subsequent fiscal years are calculated under the assumption that the share split took effect at the beginning of the fiscal year ended March 31, 2014. Cash dividends, applicable to the period have been retrospectively adjusted to reflect the impact of the share split.
4. Equity is calculated by deducting stock subscription rights from net assets under J-GAAP.5. Free cash flow = (Net cash flows from operating activities) - (Capital expenditures/Payments for acquisition of property, plant and equipment, and intangible assets)
Years ended March 31
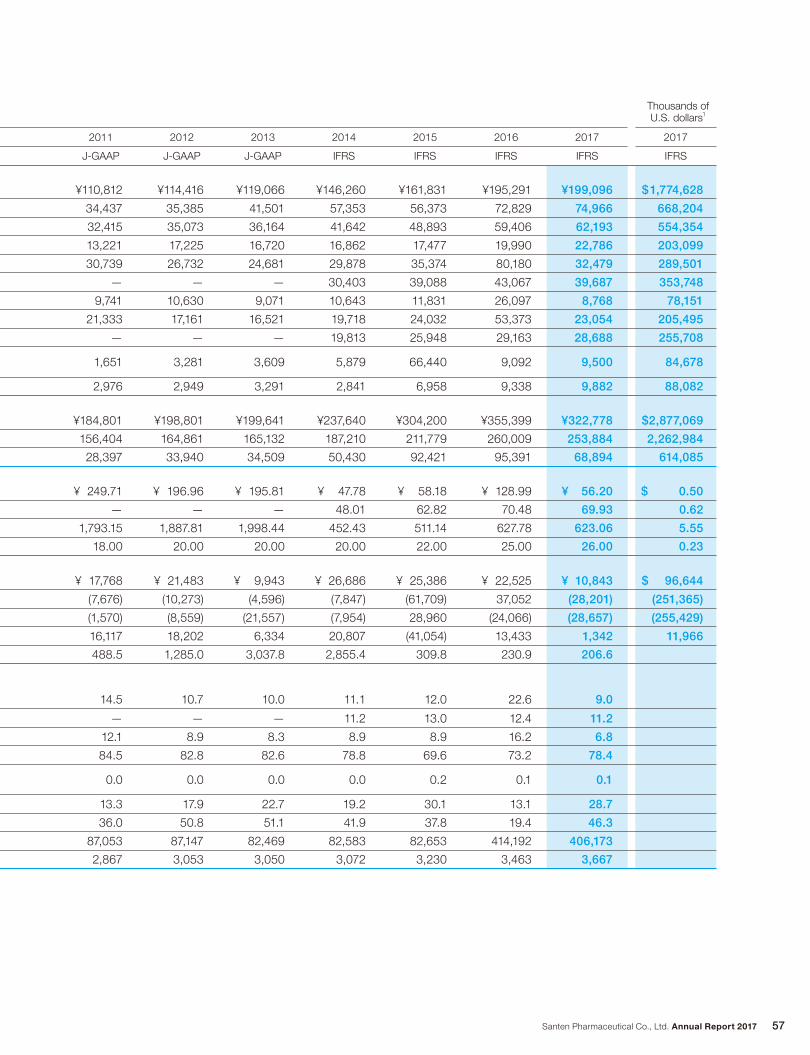
Santen Pharmaceutical Co., Ltd. Annual Report 2017 57
2011 2012 2013 2014 2015 2016 2017 2017
J-GAAP J-GAAP J-GAAP IFRS IFRS IFRS IFRS IFRS
¥110,812 ¥114,416 ¥119,066 ¥146,260 ¥161,831 ¥195,291 ¥199,096 $1,774,628
34,437 35,385 41,501 57,353 56,373 72,829 74,966 668,204
32,415 35,073 36,164 41,642 48,893 59,406 62,193 554,354
13,221 17,225 16,720 16,862 17,477 19,990 22,786 203,099
30,739 26,732 24,681 29,878 35,374 80,180 32,479 289,501
— — — 30,403 39,088 43,067 39,687 353,748
9,741 10,630 9,071 10,643 11,831 26,097 8,768 78,151
21,333 17,161 16,521 19,718 24,032 53,373 23,054 205,495
— — — 19,813 25,948 29,163 28,688 255,708
1,651 3,281 3,609 5,879 66,440 9,092 9,500 84,678
2,976 2,949 3,291 2,841 6,958 9,338 9,882 88,082
¥184,801 ¥198,801 ¥199,641 ¥237,640 ¥304,200 ¥355,399 ¥322,778 $2,877,069
156,404 164,861 165,132 187,210 211,779 260,009 253,884 2,262,984
28,397 33,940 34,509 50,430 92,421 95,391 68,894 614,085
¥ 249.71 ¥ 196.96 ¥ 195.81 ¥ 47.78 ¥ 58.18 ¥ 128.99 ¥ 56.20 $ 0.50
— — — 48.01 62.82 70.48 69.93 0.62
1,793.15 1,887.81 1,998.44 452.43 511.14 627.78 623.06 5.55
18.00 20.00 20.00 20.00 22.00 25.00 26.00 0.23
¥ 17,768 ¥ 21,483 ¥ 9,943 ¥ 26,686 ¥ 25,386 ¥ 22,525 ¥ 10,843 $ 96,644
(7,676) (10,273) (4,596) (7,847) (61,709) 37,052 (28,201) (251,365)
(1,570) (8,559) (21,557) (7,954) 28,960 (24,066) (28,657) (255,429)
16,117 18,202 6,334 20,807 (41,054) 13,433 1,342 11,966
488.5 1,285.0 3,037.8 2,855.4 309.8 230.9 206.6
14.5 10.7 10.0 11.1 12.0 22.6 9.0
— — — 11.2 13.0 12.4 11.2
12.1 8.9 8.3 8.9 8.9 16.2 6.8
84.5 82.8 82.6 78.8 69.6 73.2 78.4
0.0 0.0 0.0 0.0 0.2 0.1 0.1
13.3 17.9 22.7 19.2 30.1 13.1 28.7
36.0 50.8 51.1 41.9 37.8 19.4 46.3
87,053 87,147 82,469 82,583 82,653 414,192 406,173
2,867 3,053 3,050 3,072 3,230 3,463 3,667
Thousands ofU.S. dollars1
Santen Pharmaceutical Co., Ltd. Annual Report 201758
Financial Section
Consolidated Statement of Profit or Loss and Other Comprehensive Income
Consolidated Statement of Financial Position
Consolidated Statement of Changes in Equity
Consolidated Statement of Cash Flows
Notes to Consolidated Financial Statements
Internal Control Report
Independent Auditor’s Report
59
60
61
64
65
106
107
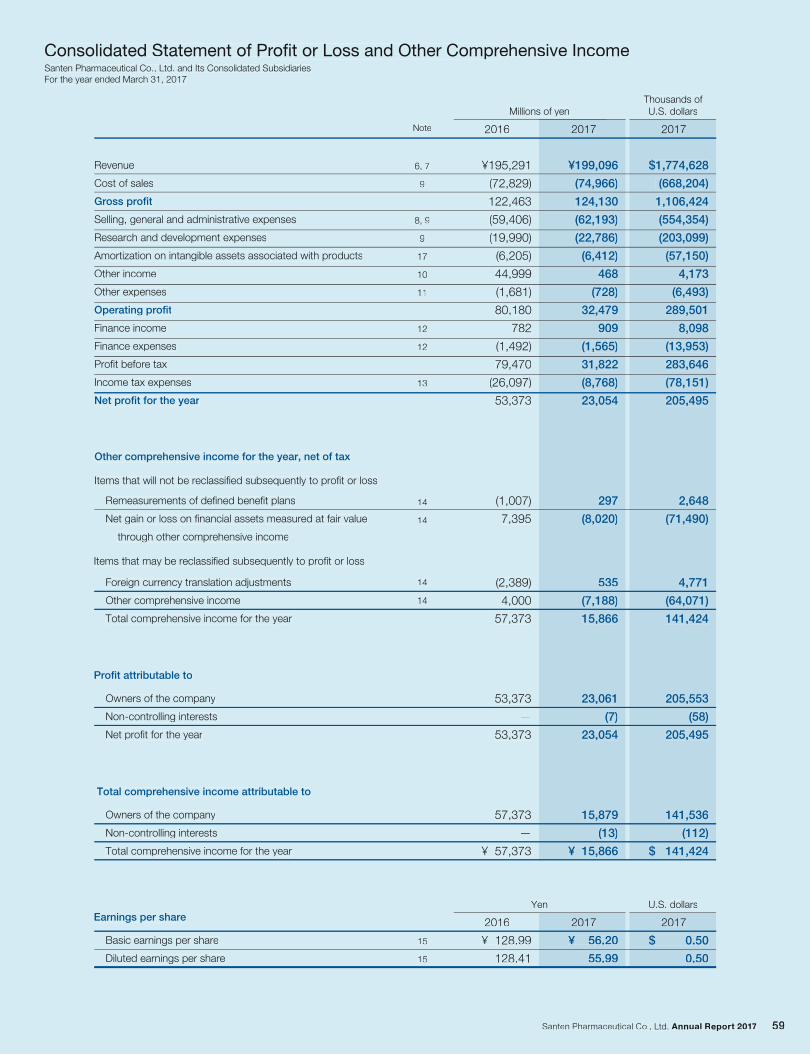
2017
$1,774,628
(668,204)
1,106,424
(554,354)
(203,099)
(57,150)
4,173
(6,493)
289,501
8,098
(13,953)
283,646
(78,151)
205,495
$ 0.50
0.50
2016 2017
Revenue
Cost of sales
Gross profit
Selling, general and administrative expenses
Research and development expenses
Amortization on intangible assets associated with products
Other income
Other expenses
Operating profit
Finance income
Finance expenses
Profit before tax
Income tax expenses
Net profit for the year
¥195,291
(72,829)
122,463
(59,406)
(19,990)
(6,205)
44,999
(1,681)
80,180
782
(1,492)
79,470
(26,097)
53,373
¥199,096
(74,966)
124,130
(62,193)
(22,786)
(6,412)
468
(728)
32,479
909
(1,565)
31,822
(8,768)
23,054
14
14
14
14
2,648
(71,490)
4,771
(64,071)
141,424
205,553
(58)
205,495
141,536
(112)
$ 141,424
Remeasurements of defined benefit plans
Net gain or loss on financial assets measured at fair value
through other comprehensive income
Other comprehensive income for the year, net of tax
Items that will not be reclassified subsequently to profit or loss
(1,007)
7,395
297
(8,020)
Items that may be reclassified subsequently to profit or loss
Foreign currency translation adjustments
Other comprehensive income
Total comprehensive income for the year
(2,389)
4,000
57,373
535
(7,188)
15,866
Profit attributable to
Owners of the company
Non-controlling interests
Net profit for the year
53,373
—
53,373
23,061
(7)
23,054
Total comprehensive income attributable to
Owners of the company
Non-controlling interests
Total comprehensive income for the year
57,373
—
¥ 57,373
15,879
(13)
¥ 15,866
Earnings per share
Basic earnings per share
Diluted earnings per share
¥ 128.99
128.41
15
15
¥ 56.20
55.99
Millions of yenThousands ofU.S. dollars
2016
Yen U.S. dollars
6, 7
9
8, 9
9
17
10
11
12
12
13
Note
Consolidated Statement of Profit or Loss and Other Comprehensive IncomeSanten Pharmaceutical Co., Ltd. and Its Consolidated SubsidiariesFor the year ended March 31, 2017
20172017
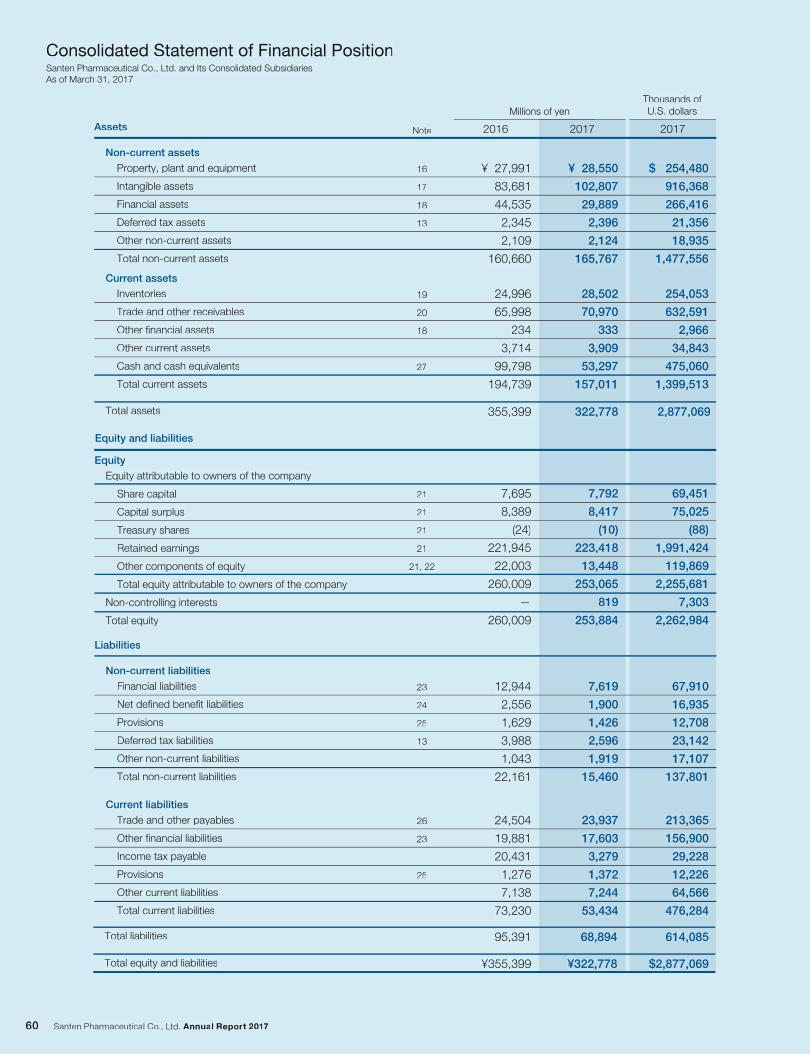
2017
$ 254,480
916,368
266,416
21,356
18,935
1,477,556
254,053
632,591
2,966
34,843
475,060
1,399,513
67,910
16,935
12,708
23,142
17,107
137,801
213,365
156,900
29,228
12,226
64,566
476,284
69,451
75,025
(88)
1,991,424
119,869
2,255,681
7,303
2,262,984
2016 2017
Property, plant and equipment
Intangible assets
Financial assets
Deferred tax assets
Other non-current assets
Total non-current assets
¥ 27,991
83,681
44,535
2,345
2,109
160,660
¥ 28,550
102,807
29,889
2,396
2,124
165,767
Non-current assets
Inventories
Trade and other receivables
Other financial assets
Other current assets
Cash and cash equivalents
Total current assets
Total assets
24,996
65,998
234
3,714
99,798
194,739
19
20
18
27
28,502
70,970
333
3,909
53,297
157,011
355,399 322,778 2,877,069
Current assets
Total liabilities 95,391 68,894
Total equity and liabilities ¥355,399 ¥322,778
614,085
$2,877,069
Financial liabilities
Net defined benefit liabilities
Provisions
Deferred tax liabilities
Other non-current liabilities
Total non-current liabilities
12,944
2,556
1,629
3,988
1,043
22,161
7,619
1,900
1,426
2,596
1,919
15,460
Non-current liabilities
Liabilities
Trade and other payables
Other financial liabilities
Income tax payable
Provisions
Other current liabilities
Total current liabilities
24,504
19,881
20,431
1,276
7,138
73,230
23,937
17,603
3,279
1,372
7,244
53,434
Current liabilities
Equity attributable to owners of the company
Share capital
Capital surplus
Treasury shares
Retained earnings
Other components of equity
Total equity attributable to owners of the company
Non-controlling interests
Total equity
7,695
8,389
(24)
221,945
22,003
260,009
—
260,009
23
24
25
13
26
23
25
21
21
21
21
21, 22
7,792
8,417
(10)
223,418
13,448
253,065
819
253,884
Equity
Millions of yenThousands ofU.S. dollars
16
17
18
13
Assets Note
Equity and liabilities
Consolidated Statement of Financial PositionSanten Pharmaceutical Co., Ltd. and Its Consolidated SubsidiariesAs of March 31, 2017
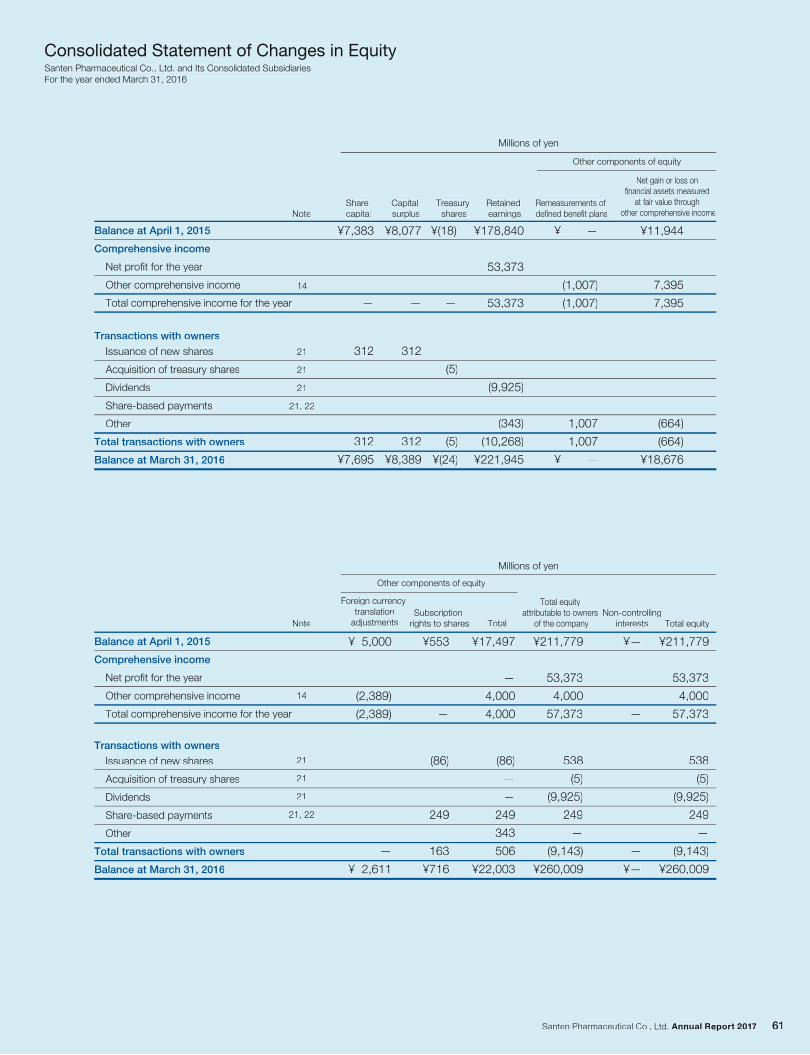
Consolidated Statement of Changes in Equity
Balance at April 1, 2015
Comprehensive income
Net profit for the year
Other comprehensive income
Total comprehensive income for the year
¥7,383
—
¥8,077
—
¥(18)
—
¥178,840
53,373
53,373
¥ —
(1,007)
(1,007)
¥11,944
7,395
7,395
21
21
21
21, 22
14
21
21
21
21, 22
(5)
(5)
¥(24)
(9,925)
(343)
(10,268)
¥221,945
1,007
1,007
¥ —
(664)
(664)
¥18,676
Millions of yen
Share capital
14
Note
Note
Capital surplus
Treasury shares
Retained earnings
Remeasurements of defined benefit plans
Net gain or loss on financial assets measured
at fair value through other comprehensive income
Other components of equity
Issuance of new shares
Acquisition of treasury shares
Dividends
Share-based payments
Other
Total transactions with owners
Balance at March 31, 2016
Transactions with owners
Balance at April 1, 2015
Comprehensive income
Net profit for the year
Other comprehensive income
Total comprehensive income for the year
¥ 5,000
(2,389)
(2,389)
¥553
—
—
¥ 2,611
(86)
249
163
¥716
¥17,497
—
4,000
4,000
¥211,779
53,373
4,000
57,373
¥211,779
53,373
4,000
57,373
Millions of yen
Foreign currency translation
adjustmentsSubscription
rights to shares
Total equity attributable to owners
of the company Total equityNon-controlling
interestsTotal
Other components of equity
Issuance of new shares
Acquisition of treasury shares
Dividends
Share-based payments
Other
Total transactions with owners
Balance at March 31, 2016
Transactions with owners
Santen Pharmaceutical Co., Ltd. and Its Consolidated SubsidiariesFor the year ended March 31, 2016
312
312
¥7,695
312
312
¥8,389
(86)
—
—
249
343
506
¥22,003
538
(5)
(9,925)
249
—
(9,143)
¥260,009
¥—
—
—
¥—
538
(5)
(9,925)
249
—
(9,143)
¥260,009
Consolidated Statement of Changes in Equity
Balance at April 1, 2015
Comprehensive income
Net profit for the year
Other comprehensive income
Total comprehensive income for the year
¥7,383
—
¥8,077
—
¥(18)
—
¥178,840
53,373
53,373
¥ —
(1,007)
(1,007)
¥11,944
7,395
7,395
21
21
21
21, 22
14
21
21
21
21, 22
(5)
(5)
¥(24)
(9,925)
(343)
(10,268)
¥221,945
1,007
1,007
¥ —
(664)
(664)
¥18,676
Millions of yen
Share capital
14
Note
Note
Capital surplus
Treasury shares
Retained earnings
Remeasurements of defined benefit plans
Net gain or loss onfinancial assets measured
at fair value throughother comprehensive income
Other components of equity
Issuance of new shares
Acquisition of treasury shares
Dividends
Share-based payments
Other
Total transactions with owners
Balance at March 31, 2016
Transactions with owners
Balance at April 1, 2015
Comprehensive income
Net profit for the year
Other comprehensive income
Total comprehensive income for the year
¥ 5,000
(2,389)
(2,389)
¥553
—
—
¥ 2,611
(86)
249
163
¥716
¥17,497
—
4,000
4,000
¥211,779
53,373
4,000
57,373
¥211,779
53,373
4,000
57,373
Millions of yen
Foreign currencytranslation
adjustmentsSubscription
rights to shares
Total equity attributable to owners
of the company Total equityNon-controlling
interestsTotal
Other components of equity
Issuance of new shares
Acquisition of treasury shares
Dividends
Share-based payments
Other
Total transactions with owners
Balance at March 31, 2016
Transactions with owners
Santen Pharmaceutical Co., Ltd. and Its Consolidated SubsidiariesFor the year ended March 31, 2016
312
312
¥7,695
312
312
¥8,389
(86)
—
—
249
343
506
¥22,003
538
(5)
(9,925)
249
—
(9,143)
¥260,009
¥—
—
—
¥—
538
(5)
(9,925)
249
—
(9,143)
¥260,009
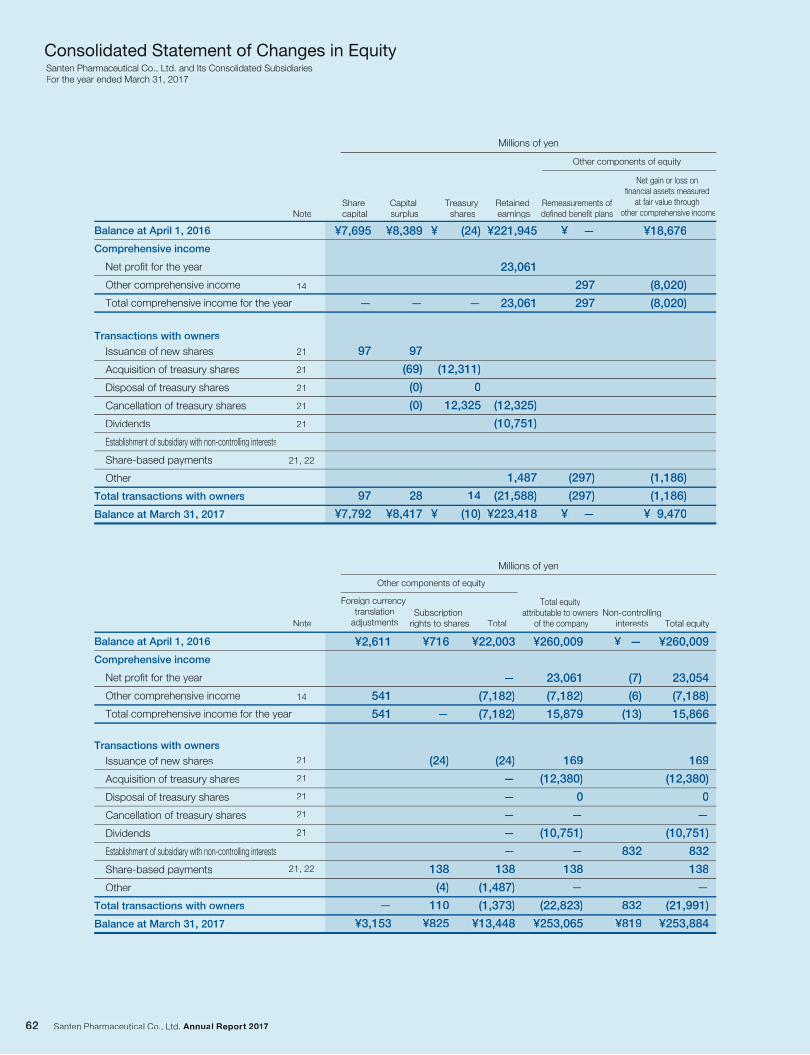
21
21
21
21
21
21, 22
14
Note
21
21
21
21
21
21, 22
14
Note
Balance at April 1, 2016
Comprehensive income
Net profit for the year
Other comprehensive income
Total comprehensive income for the year
¥7,695
—
¥8,389
—
¥ (24)
—
¥221,945
23,061
23,061
¥ —
297
297
¥18,676
(8,020)
(8,020)
97
97
¥7,792
97
(69)
(0)
(0)
28
¥8,417
(12,311)
0
12,325
14
¥ (10)
(12,325)
(10,751)
1,487
(21,588)
¥223,418
(297)
(297)
¥ —
(1,186)
(1,186)
¥ 9,470
Millions of yen
Share capital
Capital surplus
Treasury shares
Retained earnings
Remeasurements ofdefined benefit plans
Net gain or loss on financial assets measured
at fair value through other comprehensive income
Other components of equity
Issuance of new shares
Acquisition of treasury shares
Disposal of treasury shares
Cancellation of treasury shares
Dividends
Establishment of subsidiary with non-controlling interests
Share-based payments
Other
Total transactions with owners
Balance at March 31, 2017
Transactions with owners
Balance at April 1, 2016
Comprehensive income
Net profit for the year
Other comprehensive income
Total comprehensive income for the year
Millions of yen
¥2,611
541
541
—
¥3,153
Foreign currency translation
adjustments
¥716
—
(24)
138
(4)
110
¥825
Subscription rights to shares
¥ —
(7)
(6)
(13)
832
832
¥819
Non-controllinginterests
¥260,009
23,061
(7,182)
15,879
169
(12,380)
0
—
(10,751)
—
138
—
(22,823)
¥253,065
Total equity attributable to owners
of the company
¥260,009
23,054
(7,188)
15,866
169
(12,380)
0
—
(10,751)
832
138
—
(21,991)
¥253,884
Total equity
¥22,003
—
(7,182)
(7,182)
(24)
—
—
—
—
—
138
(1,487)
(1,373)
¥13,448
Total
Other components of equity
Issuance of new shares
Acquisition of treasury shares
Disposal of treasury shares
Cancellation of treasury shares
Dividends
Establishment of subsidiary with non-controlling interests
Share-based payments
Other
Total transactions with owners
Balance at March 31, 2017
Transactions with owners
Santen Pharmaceutical Co., Ltd. and Its Consolidated SubsidiariesFor the year ended March 31, 2017
Consolidated Statement of Changes in Equity
21
21
21
21
21
21, 22
14
Note
21
21
21
21
21
21, 22
14
Note
Balance at April 1, 2016
Comprehensive income
Net profit for the year
Other comprehensive income
Total comprehensive income for the year
¥7,695
—
¥8,389
—
¥ (24)
—
¥221,945
23,061
23,061
¥ —
297
297
¥18,676
(8,020)
(8,020)
97
97
¥7,792
97
(69)
(0)
(0)
28
¥8,417
(12,311)
0
12,325
14
¥ (10)
(12,325)
(10,751)
1,487
(21,588)
¥223,418
(297)
(297)
¥ —
(1,186)
(1,186)
¥ 9,470
Millions of yen
Share capital
Capital surplus
Treasury shares
Retained earnings
Remeasurements ofdefined benefit plans
Net gain or loss onfinancial assets measured
at fair value throughother comprehensive income
Other components of equity
Issuance of new shares
Acquisition of treasury shares
Disposal of treasury shares
Cancellation of treasury shares
Dividends
Establishment of subsidiary with non-controlling interests
Share-based payments
Other
Total transactions with owners
Balance at March 31, 2017
Transactions with owners
Balance at April 1, 2016
Comprehensive income
Net profit for the year
Other comprehensive income
Total comprehensive income for the year
Millions of yen
¥2,611
541
541
—
¥3,153
Foreign currencytranslation
adjustments
¥716
—
(24)
138
(4)
110
¥825
Subscription rights to shares
¥ —
(7)
(6)
(13)
832
832
¥819
Non-controllinginterests
¥260,009
23,061
(7,182)
15,879
169
(12,380)
0
—
(10,751)
—
138
—
(22,823)
¥253,065
Total equity attributable to owners
of the company
¥260,009
23,054
(7,188)
15,866
169
(12,380)
0
—
(10,751)
832
138
—
(21,991)
¥253,884
Total equity
¥22,003
—
(7,182)
(7,182)
(24)
—
—
—
—
—
138
(1,487)
(1,373)
¥13,448
Total
Other components of equity
Issuance of new shares
Acquisition of treasury shares
Disposal of treasury shares
Cancellation of treasury shares
Dividends
Establishment of subsidiary with non-controlling interests
Share-based payments
Other
Total transactions with owners
Balance at March 31, 2017
Transactions with owners
Santen Pharmaceutical Co., Ltd. and Its Consolidated SubsidiariesFor the year ended March 31, 2017
Consolidated Statement of Changes in Equity
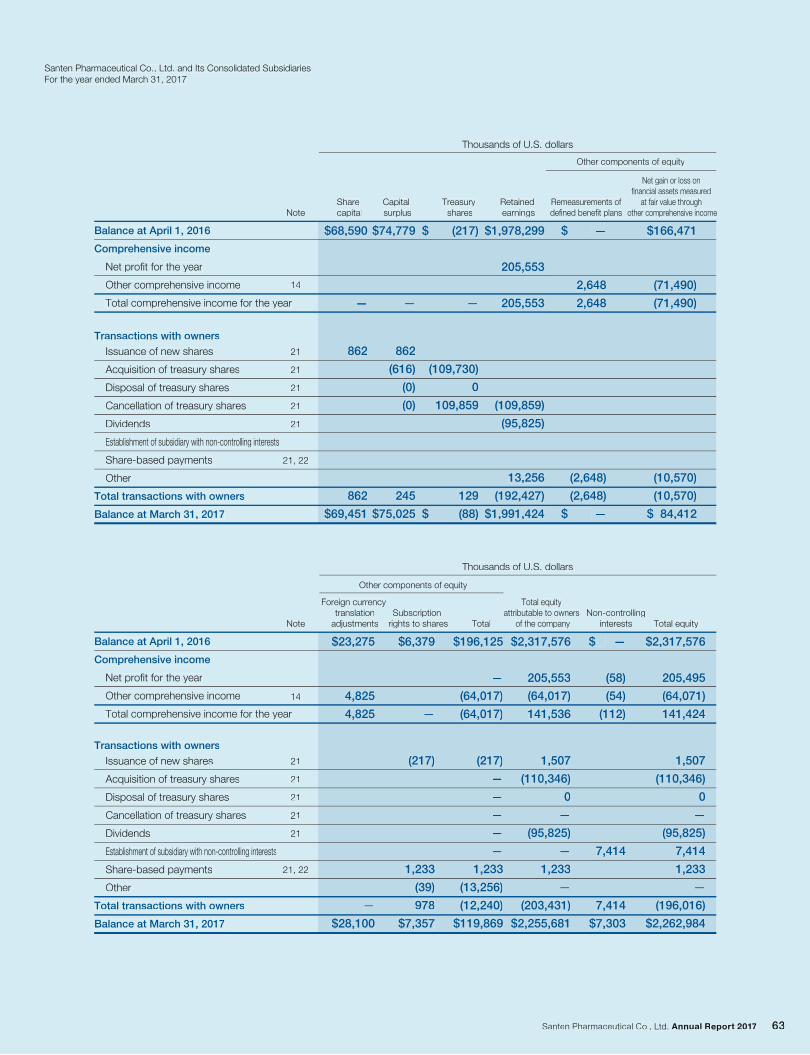
21
21
21
21
21
21, 22
14
Note
14
21
21
21
21
21
21, 22
Note
Balance at April 1, 2016
Comprehensive income
Net profit for the year
Other comprehensive income
Total comprehensive income for the year
$68,590
—
$74,779
—
$ (217)
—
$1,978,299
205,553
205,553
$ —
2,648
2,648
$166,471
(71,490)
(71,490)
862
862
$69,451
862
(616)
(0)
(0)
245
$75,025
(109,730)
0
109,859
129
$ (88)
(109,859)
(95,825)
13,256
(192,427)
$1,991,424
(2,648)
(2,648)
$ —
(10,570)
(10,570)
$ 84,412
Thousands of U.S. dollars
Share capital
Capital surplus
Treasury shares
Retained earnings
Remeasurements ofdefined benefit plans
Net gain or loss on financial assets measured
at fair value through other comprehensive income
Other components of equity
Issuance of new shares
Acquisition of treasury shares
Disposal of treasury shares
Cancellation of treasury shares
Dividends
Establishment of subsidiary with non-controlling interests
Share-based payments
Other
Total transactions with owners
Balance at March 31, 2017
Transactions with owners
Balance at April 1, 2016
Comprehensive income
Net profit for the year
Other comprehensive income
Total comprehensive income for the year
Thousands of U.S. dollars
$23,275
4,825
4,825
—
$28,100
Foreign currency translation
adjustments
$6,379
—
(217)
1,233
(39)
978
$7,357
Subscription rights to shares
$2,317,576
205,553
(64,017)
141,536
1,507
(110,346)
0
—
(95,825)
—
1,233
—
(203,431)
$2,255,681
Total equity attributable to owners
of the company
$ —
(58)
(54)
(112)
7,414
7,414
$7,303
Non-controllinginterests
$2,317,576
205,495
(64,071)
141,424
1,507
(110,346)
0
—
(95,825)
7,414
1,233
—
(196,016)
$2,262,984
Total equity
$196,125
—
(64,017)
(64,017)
(217)
—
—
—
—
—
1,233
(13,256)
(12,240)
$119,869
Total
Other components of equity
Issuance of new shares
Acquisition of treasury shares
Disposal of treasury shares
Cancellation of treasury shares
Dividends
Establishment of subsidiary with non-controlling interests
Share-based payments
Other
Total transactions with owners
Balance at March 31, 2017
Transactions with owners
Santen Pharmaceutical Co., Ltd. and Its Consolidated SubsidiariesFor the year ended March 31, 2017
21
21
21
21
21
21, 22
14
Note
14
21
21
21
21
21
21, 22
Note
Balance at April 1, 2016
Comprehensive income
Net profit for the year
Other comprehensive income
Total comprehensive income for the year
$68,590
—
$74,779
—
$ (217)
—
$1,978,299
205,553
205,553
$ —
2,648
2,648
$166,471
(71,490)
(71,490)
862
862
$69,451
862
(616)
(0)
(0)
245
$75,025
(109,730)
0
109,859
129
$ (88)
(109,859)
(95,825)
13,256
(192,427)
$1,991,424
(2,648)
(2,648)
$ —
(10,570)
(10,570)
$ 84,412
Thousands of U.S. dollars
Share capital
Capital surplus
Treasury shares
Retained earnings
Remeasurements ofdefined benefit plans
Net gain or loss on financial assets measured
at fair value through other comprehensive income
Other components of equity
Issuance of new shares
Acquisition of treasury shares
Disposal of treasury shares
Cancellation of treasury shares
Dividends
Establishment of subsidiary with non-controlling interests
Share-based payments
Other
Total transactions with owners
Balance at March 31, 2017
Transactions with owners
Balance at April 1, 2016
Comprehensive income
Net profit for the year
Other comprehensive income
Total comprehensive income for the year
Thousands of U.S. dollars
$23,275
4,825
4,825
—
$28,100
Foreign currencytranslation
adjustments
$6,379
—
(217)
1,233
(39)
978
$7,357
Subscription rights to shares
$2,317,576
205,553
(64,017)
141,536
1,507
(110,346)
0
—
(95,825)
—
1,233
—
(203,431)
$2,255,681
Total equity attributable to owners
of the company
$ —
(58)
(54)
(112)
7,414
7,414
$7,303
Non-controllinginterests
$2,317,576
205,495
(64,071)
141,424
1,507
(110,346)
0
—
(95,825)
7,414
1,233
—
(196,016)
$2,262,984
Total equity
$196,125
—
(64,017)
(64,017)
(217)
—
—
—
—
—
1,233
(13,256)
(12,240)
$119,869
Total
Other components of equity
Issuance of new shares
Acquisition of treasury shares
Disposal of treasury shares
Cancellation of treasury shares
Dividends
Establishment of subsidiary with non-controlling interests
Share-based payments
Other
Total transactions with owners
Balance at March 31, 2017
Transactions with owners
Santen Pharmaceutical Co., Ltd. and Its Consolidated SubsidiariesFor the year ended March 31, 2017
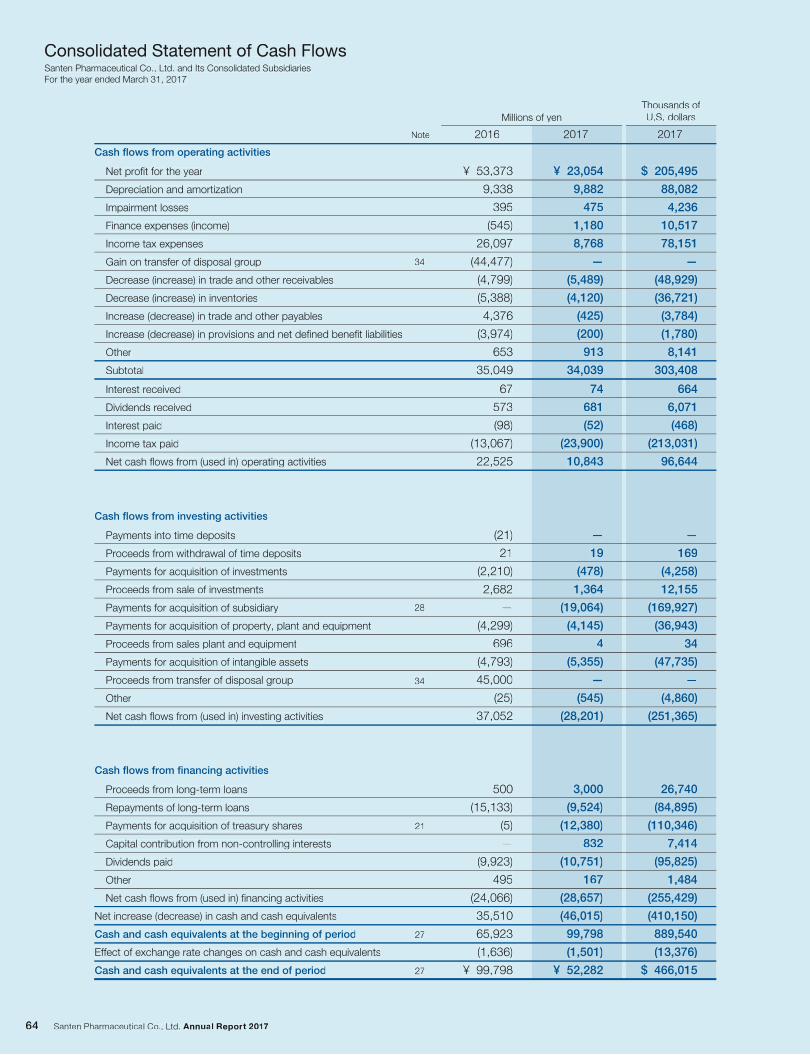
2017
$ 205,495
88,082
4,236
10,517
78,151
—
(48,929)
(36,721)
(3,784)
(1,780)
8,141
303,408
—
169
(4,258)
12,155
(169,927)
(36,943)
34
(47,735)
—
(4,860)
(251,365)
664
6,071
(468)
(213,031)
96,644
26,740
(84,895)
(110,346)
7,414
(95,825)
1,484
(255,429)
(410,150)
889,540
(13,376)
$ 466,015
Santen Pharmaceutical Co., Ltd. and Its Consolidated SubsidiariesFor the year ended March 31, 2017
Cash flows from operating activities
Millions of yen
2016 2017
¥ 53,373
9,338
395
(545)
26,097
(44,477)
(4,799)
(5,388)
4,376
(3,974)
653
35,049
¥ 23,054
9,882
475
1,180
8,768
—
(5,489)
(4,120)
(425)
(200)
913
34,039
Net profit for the year
Depreciation and amortization
Impairment losses
Finance expenses (income)
Income tax expenses
Gain on transfer of disposal group
Decrease (increase) in trade and other receivables
Decrease (increase) in inventories
Increase (decrease) in trade and other payables
Increase (decrease) in provisions and net defined benefit liabilities
Other
Subtotal
Cash flows from investing activities
(21)
21
(2,210)
2,682
—
(4,299)
696
(4,793)
45,000
(25)
37,052
—
19
(478)
1,364
(19,064)
(4,145)
4
(5,355)
—
(545)
(28,201)
Payments into time deposits
Proceeds from withdrawal of time deposits
Payments for acquisition of investments
Proceeds from sale of investments
Payments for acquisition of subsidiary
Payments for acquisition of property, plant and equipment
Proceeds from sales plant and equipment
Payments for acquisition of intangible assets
Proceeds from transfer of disposal group
Other
Net cash flows from (used in) investing activities
67
573
(98)
(13,067)
22,525
74
681
(52)
(23,900)
10,843
Interest received
Dividends received
Interest paid
Income tax paid
Net cash flows from (used in) operating activities
Cash flows from financing activities
Net increase (decrease) in cash and cash equivalents
Cash and cash equivalents at the beginning of period
Effect of exchange rate changes on cash and cash equivalents
Cash and cash equivalents at the end of period
500
(15,133)
(5)
—
(9,923)
495
(24,066)
35,510
65,923
(1,636)
¥ 99,798
3,000
(9,524)
(12,380)
832
(10,751)
167
(28,657)
(46,015)
99,798
(1,501)
¥ 52,282
Proceeds from long-term loans
Repayments of long-term loans
Payments for acquisition of treasury shares
Capital contribution from non-controlling interests
Dividends paid
Other
Net cash flows from (used in) financing activities
21
27
27
Note
Thousands ofU.S. dollars
Consolidated Statement of Cash Flows
34
34
28
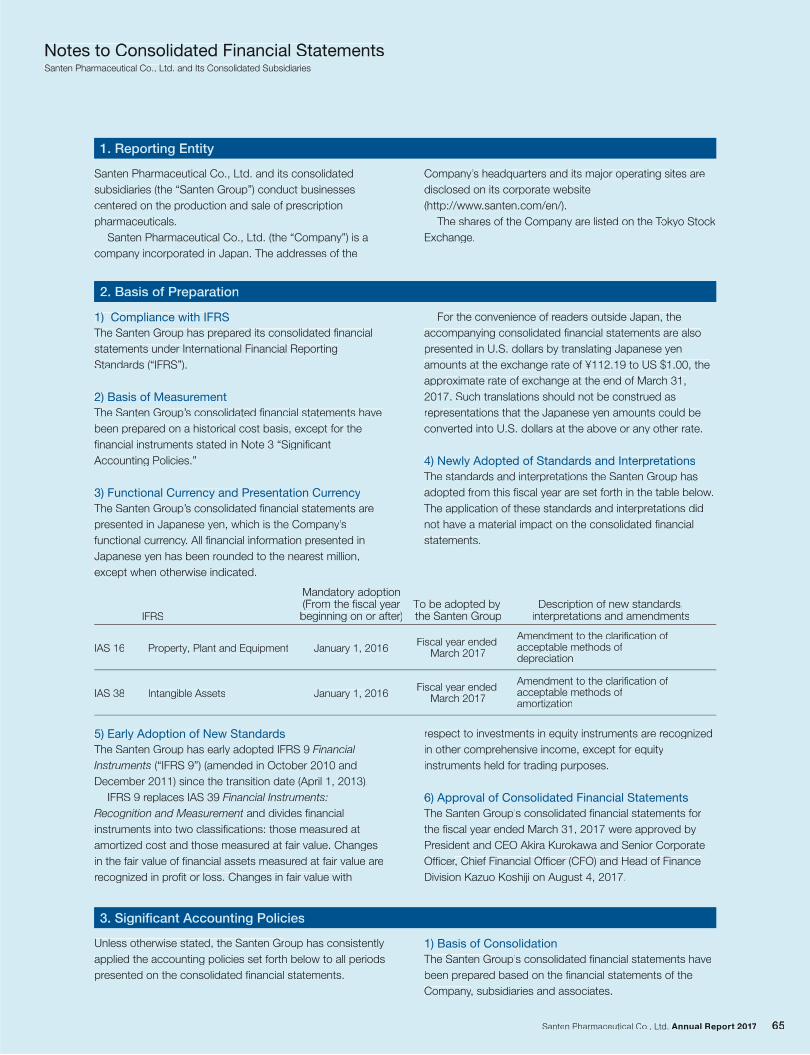
Notes to Consolidated Financial Statements
1. Reporting Entity
2. Basis of Preparation
1) Compliance with IFRS
The Santen Group has prepared its consolidated financial
statements under International Financial Reporting
Standards (“IFRS”).
2) Basis of Measurement
The Santen Group’s consolidated financial statements have
been prepared on a historical cost basis, except for the
financial instruments stated in Note 3 “Significant
Accounting Policies.”
3) Functional Currency and Presentation Currency
The Santen Group’s consolidated financial statements are
presented in Japanese yen, which is the Company’s
functional currency. All financial information presented in
Japanese yen has been rounded to the nearest million,
except when otherwise indicated.
For the convenience of readers outside Japan, the
accompanying consolidated financial statements are also
presented in U.S. dollars by translating Japanese yen
amounts at the exchange rate of ¥112.19 to US $1.00, the
approximate rate of exchange at the end of March 31,
2017. Such translations should not be construed as
representations that the Japanese yen amounts could be
converted into U.S. dollars at the above or any other rate.
4) Newly Adopted of Standards and Interpretations
The standards and interpretations the Santen Group has
adopted from this fiscal year are set forth in the table below.
The application of these standards and interpretations did
not have a material impact on the consolidated financial
statements.
5) Early Adoption of New Standards
The Santen Group has early adopted IFRS 9 Financial Instruments (“IFRS 9”) (amended in October 2010 and
December 2011) since the transition date (April 1, 2013).
IFRS 9 replaces IAS 39 Financial Instruments: Recognition and Measurement and divides financial
instruments into two classifications: those measured at
amortized cost and those measured at fair value. Changes
in the fair value of financial assets measured at fair value are
recognized in profit or loss. Changes in fair value with
respect to investments in equity instruments are recognized
in other comprehensive income, except for equity
instruments held for trading purposes.
6) Approval of Consolidated Financial Statements
The Santen Group’s consolidated financial statements for
the fiscal year ended March 31, 2017 were approved by
President and CEO Akira Kurokawa and Senior Corporate
Officer, Chief Financial Officer (CFO) and Head of Finance
Division Kazuo Koshiji on August 4, 2017.
3. Significant Accounting Policies
Unless otherwise stated, the Santen Group has consistently
applied the accounting policies set forth below to all periods
presented on the consolidated financial statements.
1) Basis of Consolidation
The Santen Group’s consolidated financial statements have
been prepared based on the financial statements of the
Company, subsidiaries and associates.
Santen Pharmaceutical Co., Ltd. and Its Consolidated Subsidiaries
Property, Plant and Equipment
Intangible Assets
January 1, 2016
January 1, 2016
Mandatory adoption(From the fiscal yearbeginning on or after)
Description of new standards,interpretations and amendments
Fiscal year ended March 2017
Fiscal year ended March 2017
Amendment to the clarification of acceptable methods of depreciation
Amendment to the clarification of acceptable methods of amortization
To be adopted by the Santen GroupIFRS
IAS 16
IAS 38
Santen Pharmaceutical Co., Ltd. and its consolidated
subsidiaries (the “Santen Group”) conduct businesses
centered on the production and sale of prescription
pharmaceuticals.
Santen Pharmaceutical Co., Ltd. (the “Company”) is a
company incorporated in Japan. The addresses of the
Company’s headquarters and its major operating sites are
disclosed on its corporate website
(http://www.santen.com/en/).
The shares of the Company are listed on the Tokyo Stock
Exchange.
Notes to Consolidated Financial Statements
1. Reporting Entity
2. Basis of Preparation
1) Compliance with IFRS
The Santen Group has prepared its consolidated financial
statements under International Financial Reporting
Standards (“IFRS”).
2) Basis of Measurement
The Santen Group’s consolidated financial statements have
been prepared on a historical cost basis, except for the
financial instruments stated in Note 3 “Significant
Accounting Policies.”
3) Functional Currency and Presentation Currency
The Santen Group’s consolidated financial statements are
presented in Japanese yen, which is the Company’s
functional currency. All financial information presented in
Japanese yen has been rounded to the nearest million,
except when otherwise indicated.
For the convenience of readers outside Japan, the
accompanying consolidated financial statements are also
presented in U.S. dollars by translating Japanese yen
amounts at the exchange rate of ¥112.19 to US $1.00, the
approximate rate of exchange at the end of March 31,
2017. Such translations should not be construed as
representations that the Japanese yen amounts could be
converted into U.S. dollars at the above or any other rate.
4) Newly Adopted of Standards and Interpretations
The standards and interpretations the Santen Group has
adopted from this fiscal year are set forth in the table below.
The application of these standards and interpretations did
not have a material impact on the consolidated financial
statements.
5) Early Adoption of New Standards
The Santen Group has early adopted IFRS 9 Financial Instruments (“IFRS 9”) (amended in October 2010 and
December 2011) since the transition date (April 1, 2013).
IFRS 9 replaces IAS 39 Financial Instruments:Recognition and Measurement and divides financial
instruments into two classifications: those measured at
amortized cost and those measured at fair value. Changes
in the fair value of financial assets measured at fair value are
recognized in profit or loss. Changes in fair value with
respect to investments in equity instruments are recognized
in other comprehensive income, except for equity
instruments held for trading purposes.
6) Approval of Consolidated Financial Statements
The Santen Group’s consolidated financial statements for
the fiscal year ended March 31, 2017 were approved by
President and CEO Akira Kurokawa and Senior Corporate
Officerff , Chief Financial Officer (CFO) and Head of Financeff
Division Kazuo Koshiji on August 4, 2017.
3. Significant Accounting Policies
Unless otherwise stated, the Santen Group has consistently
applied the accounting policies set forth below to all periods
presented on the consolidated financial statements.
1) Basis of Consolidation
The Santen Group’s consolidated financial statements have
been prepared based on the financial statements of the
Company, subsidiaries and associates.
Santen Pharmaceutical Co., Ltd. and Its Consolidated Subsidiaries
Property, Plant and Equipment
Intangible Assets
January 1, 2016
January 1, 2016
Mandatory adoption(From the fiscal yearbeginning on or after)
Description of new standards,interpretations and amendments
Fiscal year endedMarch 2017
Fiscal year endedMarch 2017
Amendment to the clarification of acceptable methods of depreciation
Amendment to the clarification of acceptable methods of amortization
To be adopted bythe Santen GroupIFRS
IAS 16
IAS 38
Santen Pharmaceutical Co., Ltd. and its consolidated
subsidiaries (the “Santen Group”) conduct businesses
centered on the production and sale of prescription
pharmaceuticals.
Santen Pharmaceutical Co., Ltd. (the “Company”) is a
company incorporated in Japan. The addresses of the
Company’s headquarters and its major operating sites are
disclosed on its corporate website
(http://www.santen.com/en/).
The shares of the Company are listed on the Tokyo Stock TT
Exchange.
A. Subsidiaries
Subsidiaries are entities controlled by the Santen Group.
Control means that the Santen Group has power over
the investee, has exposure to variable returns from
involvement with the investee, and has the ability to use its
power over the investee to affect the amount of the
investors’ returns.
The financial statements of subsidiaries are included in
the consolidated financial statements from the date that
control commences until the date that control is lost. When
the end of the reporting period of a subsidiary is different
from that of the Company, the subsidiary prepares its
financial statements for consolidation purpose based on the
provisional accounting as of the Company’s closing date.
In the case of changes in the ownership interest in
subsidiaries, if the Company retains control over the
subsidiaries, they are accounted for as equity transactions.
Any difference between the adjustment to the
non-controlling interests and the fair value of the
consideration transferred or received is recognized directly
in equity attributable to owners of the company.
All intra-group balances and transactions, and any
unrealized income and expenses arising from intra-group
transactions are eliminated in preparing consolidated
financial statements.
The financial statements of subsidiaries that have
different fiscal year-ends than the Santen Group are
consolidated using financial statements based on a
provisional closing as of the Santen Group’s fiscal year-end.
B. Associates
Associates are entities over which the Santen Group has
significant influence over the financial and operating policies,
but does not have control or joint control over it.
Investments in associates are accounted for using the
equity method, from the date on which the Group obtains
significant influence to the date on which the Santen Group
loses significant influence.
2) Business Combinations
Business combinations are accounted for using the
acquisition method.
The identifiable assets acquired and the liabilities
assumed are measured at the fair values at the acquisition
date.
The Santen Group measures the consideration for an
acquisition as the sum of (1) the consideration transferred in
a business combination, (2) the amount of any
non-controlling interest and (3) in a business combination
achieved in stages, the acquisition-date fair value of the
acquirer’s previously held equity interest in the acquiree. The
Santen Group recognizes goodwill as any excess of this
consideration for acquisition over the net amount of the
identifiable assets acquired and the liabilities assumed at
the acquisition date. If the net amount of the identifiable
assets and liabilities of the acquiree exceeds the
consideration for acquisition, the acquirer recognizes the
excess amount as profit or loss on the acquisition date. The
consideration transferred in the business combination is
calculated as the sum of the acquisition-date fair values of
the assets transferred by the acquirer, the liabilities incurred
by the acquirer to former owners of the acquiree and the
equity interests issued by the acquirer.
Any expenses arising in connection with business
combinations are accounted for as cost when incurred.
3) Foreign Currency Translation
Foreign currency transactions are translated into the
functional currency using exchange rates at the dates of
transactions or rates that approximate the exchange rates
at the dates of the transactions.
Monetary assets and liabilities denominated in foreign
currencies are translated into the functional currency using
the exchange rate at the fiscal year-end, and exchange
differences are recognized as profit or loss.
Assets and liabilities of foreign operations are translated
into the presentation currency using the exchange rate at
the fiscal year-end. Income and expenses of foreign
operations are translated into the presentation currency
using the average exchange rate during the fiscal year,
except for cases of significant exchange rate movements.
Exchange differences are recognized in other
comprehensive income. If a foreign operation is
discontinued, the cumulative exchange differences of the
relevant foreign operation are reclassified to profit or loss
when it is discontinued.
4) Revenue
A. Revenue
Revenue is measured at the fair value of the consideration
received or receivable, less trade discounts, returns and
taxes such as consumption taxes. The Santen Group
primarily recognizes the following as revenue:
i. Sale of goods
Revenue from the sale of goods is recognized when all
the following conditions have been satisfied:
(a) The Santen Group has transferred to the buyer the
significant risks and rewards of ownership of the
goods;
(b) The Santen Group retains neither continuing
managerial involvement to the degree usually
associated with ownership nor effective control over
the goods sold;
(c) The amount of revenue can be measured reliably;
(d) It is probable that the economic benefits associated
with the transaction will flow to the entity;
(e) The costs incurred or to be incurred in respect of the
transaction can be measured reliably.
Notes to Consolidated Financial Statements
A. Subsidiaries
Subsidiaries are entities controlled by the Santen Group.
Control means that the Santen Group has power over
the investee, has exposure to variable returns from
involvement with the investee, and has the ability to use its
power over the investee to affect the amount of theff
investors’ returns.
The financial statements of subsidiaries are included in
the consolidated financial statements from the date that
control commences until the date that control is lost. When
the end of the reporting period of a subsidiary is differff ent
from that of the Company, the subsidiary prepares its
financial statements for consolidation purpose based on the
provisional accounting as of the Company’s closing date.
In the case of changes in the ownership interest in
subsidiaries, if the Company retains control over the
subsidiaries, they are accounted for as equity transactions.
Any differff ence between the adjustment to the
non-controlling interests and the fair value of the
consideration transferred or received is recognized directly
in equity attributable to owners of the company.
All intra-group balances and transactions, and any
unrealized income and expenses arising from intra-group
transactions are eliminated in preparing consolidated
financial statements.
The financial statements of subsidiaries that have
differff ent fiscal year-ends than the Santen Group are
consolidated using financial statements based on a
provisional closing as of the Santen Group’s fiscal year-end.
B. Associates
Associates are entities over which the Santen Group has
significant influence over the financial and operating policies,
but does not have control or joint control over it.
Investments in associates are accounted for using the
equity method, from the date on which the Group obtains
significant influence to the date on which the Santen Group
loses significant influence.
2) Business Combinations
Business combinations are accounted for using the
acquisition method.
The identifiable assets acquired and the liabilities
assumed are measured at the fair values at the acquisition
date.
The Santen Group measures the consideration for an
acquisition as the sum of (1) the consideration transferred in
a business combination, (2) the amount of any
non-controlling interest and (3) in a business combination
achieved in stages, the acquisition-date fair value of the
acquirer’s previously held equity interest in the acquiree. The
Santen Group recognizes goodwill as any excess of this
consideration for acquisition over the net amount of the
identifiable assets acquired and the liabilities assumed at
the acquisition date. If the net amount of the identifiable
assets and liabilities of the acquiree exceeds the
consideration for acquisition, the acquirer recognizes the
excess amount as profit or loss on the acquisition date. The
consideration transferred in the business combination is
calculated as the sum of the acquisition-date fair values of
the assets transferred by the acquirer, the liabilities incurred
by the acquirer to former owners of the acquiree and the
equity interests issued by the acquirer.
Any expenses arising in connection with business
combinations are accounted for as cost when incurred.
3) Foreign Currency TranslationTT
Foreign currency transactions are translated into the
functional currency using exchange rates at the dates of
transactions or rates that approximate the exchange rates
at the dates of the transactions.
Monetary assets and liabilities denominated in foreign
currencies are translated into the functional currency using
the exchange rate at the fiscal year-end, and exchange
differff ences are recognized as profit or loss.
Assets and liabilities of foreign operations are translated
into the presentation currency using the exchange rate at
the fiscal year-end. Income and expenses of foreign
operations are translated into the presentation currency
using the average exchange rate during the fiscal year,
except for cases of significant exchange rate movements.
Exchange differff ences are recognized in other
comprehensive income. If a foreign operation is
discontinued, the cumulative exchange differff ences of the
relevant foreign operation are reclassified to profit or loss
when it is discontinued.
4) Revenue
A. Revenue
Revenue is measured at the fair value of the consideration
received or receivable, less trade discounts, returns and
taxes such as consumption taxes. The Santen Group
primarily recognizes the following as revenue:
i. Sale of goods
Revenue from the sale of goods is recognized when all
the following conditions have been satisfied:
(a) The Santen Group has transferred to the buyer the
significant risks and rewards of ownership of the
goods;
(b) The Santen Group retains neither continuing
managerial involvement to the degree usually
associated with ownership nor effective contrff ol over
the goods sold;
(c) The amount of revenue can be measured reliably;
(d) It is probable that the economic benefits associated
with the transaction will flow to the entity;
(e) The costs incurred or to be incurred in respect of the
transaction can be measured reliably.
Notes to Consolidated Financial Statements
ii. Intellectual property
Revenue from intellectual property is recognized on an
accrual basis in accordance with the substance of the
relevant agreement.
B. Other Income
Revenue that is based on factors other than the
aforementioned revenue and finance income is recognized
as other income.
C. Finance Income
i. Interest
Interest is recognized using the effective interest method.
ii. Dividends
Dividends are recognized when the Group’s right to
receive the dividend is established.
5) Research and Development Expenses
Internally generated development expenses are recognized
as an intangible asset only if capitalization criteria under IAS
38 Intangible Assets (“IAS 38”) are satisfied.
Expenditure on research and development of an internal
project is fully expensed as “Research and development
expenses” when incurred.
6) Government Grants
Government grants are recognized at fair value when there
is a reasonable assurance that the Santen Group will
comply with the conditions attached to them and receive
the grants.
Government grants related to income are recognized in
profit or loss on a systematic basis over the periods in
which the entity recognizes as expenses the related costs
for which the grants are intended to compensate.
Government grants related to assets are recognized as
deferred income that is recognized in profit or loss on a
systematic basis over the useful life of the asset.
7) Income Taxes
Income taxes consist of current income taxes and deferred
taxes.
Current income tax is measured at the amount that is
expected to be paid to or recovered from the taxation
authorities using the tax rates enacted or substantively
enacted at the end of the reporting period. Current income
tax is recognized in profit or loss, except for taxes that arise
from transactions or events that are recognized in other
comprehensive income or directly in equity as well as those
that arise from business combinations.
Deferred taxes are calculated based on the temporary
differences between the carrying amounts for financial
reporting purposes and the amounts used for taxation
purposes at the end of the reporting period. Deferred tax
assets are recognized for deductible temporary differences,
unused tax credits and unused tax losses to the extent that
it is probable that future taxable profit will be available
against which they can be utilized. Deferred tax liabilities are
basically recognized for taxable temporary differences.
Deferred tax assets and deferred tax liabilities are not
recognized for temporary differences on the initial
recognition of assets or liabilities in a transaction that is not
a business combination and affects neither accounting
profit nor taxable profit on the transaction date. Deferred tax
liabilities are not recognized for taxable temporary
differences on initial recognition of goodwill.
Deferred tax liabilities are not recognized for taxable
temporary differences associated with investments in
subsidiaries and associates when the parent company is
able to control the timing of the reversal of the temporary
difference and it is probable that the temporary difference
will not be reversed within the foreseeable future. Moreover,
deferred tax assets are not recognized for deductible
temporary differences when the temporary difference will be
reversed in the foreseeable future or taxable profit will be
available against which the temporary difference can be
utilized.
Deferred tax assets and liabilities are calculated based on
the tax rates that are expected to apply to the period when
the deferred tax assets will be realized or the deferred tax
liabilities will be settled.
Deferred tax assets and deferred tax liabilities are offset
when there is a legally enforceable right to offset current tax
assets and current tax liabilities and the deferred tax assets
and liabilities are related to income taxes levied by the same
taxation authority on the same taxable entity.
8) Property, Plant and Equipment
Property, plant and equipment is recognized at cost, which
includes any costs directly attributable to the acquisition of
the asset and dismantlement, removal and restoration
costs, as well as borrowing costs eligible for capitalization.
After recognition, property, plant, and equipment is
measured by using the cost model and is stated at cost
less accumulated depreciation and accumulated
impairment losses.
Property, plant and equipment other than land are
depreciated using the straight-line method over the
estimated useful lives of each item from the date the assets
are available for use. The estimated useful lives of major
property, plant and equipment are as follows:
The depreciation methods, residual values and estimated
useful lives are reviewed annually and adjusted as
necessary.
Buildings and structures:
Machinery and vehicles:
Tools, furniture and fixtures:
3 to 50 years
3 to 10 years
4 to 10 years
ii. Intellectual property
Revenue from intellectual property is recognized on an
accrual basis in accordance with the substance of the
relevant agreement.
B. Other Income
Revenue that is based on factors other than the
aforementioned revenue and finance income is recognized
as other income.
C. Finance Income
i. Interest
Interest is recognized using the effective interff est method.
ii. Dividends
Dividends are recognized when the Group’s right to
receive the dividend is established.
5) Research and Development Expenses
Internally generated development expenses are recognized
as an intangible asset only if capitalization criteria under IAS
38 Intangible Assets (“IAS 38”) are satisfied.
Expenditure on research and development of an internal
project is fully expensed as “Research and development
expenses” when incurred.
6) Government Grants
Government grants are recognized at fair value when there
is a reasonable assurance that the Santen Group will
comply with the conditions attached to them and receive
the grants.
Government grants related to income are recognized in
profit or loss on a systematic basis over the periods in
which the entity recognizes as expenses the related costs
for which the grants are intended to compensate.
Government grants related to assets are recognized as
deferred income that is recognized in profit or loss on a
systematic basis over the useful life of the asset.
7) Income TaxesTT
Income taxes consist of current income taxes and deferred
taxes.
Current income tax is measured at the amount that is
expected to be paid to or recovered from the taxation
authorities using the tax rates enacted or substantively
enacted at the end of the reporting period. Current income
tax is recognized in profit or loss, except for taxes that arise
from transactions or events that are recognized in other
comprehensive income or directly in equity as well as those
that arise from business combinations.
Deferred taxes are calculated based on the temporary
differff ences between the carrying amounts for financial
reporting purposes and the amounts used for taxation
purposes at the end of the reporting period. Deferred tax
assets are recognized for deductible temporary differff ences,
unused tax credits and unused tax losses to the extent that
it is probable that future taxable profit will be available
against which they can be utilized. Deferred tax liabilities are
basically recognized for taxable temporary differff ences.
Deferred tax assets and deferred tax liabilities are not
recognized for temporary differff ences on the initial
recognition of assets or liabilities in a transaction that is not
a business combination and affects neither accountingff
profit nor taxable profit on the transaction date. Deferred tax
liabilities are not recognized for taxable temporary
differff ences on initial recognition of goodwill.
Deferred tax liabilities are not recognized for taxable
temporary differff ences associated with investments in
subsidiaries and associates when the parent company is
able to control the timing of the reversal of the temporary
differff ence and it is probable that the temporary differff ence
will not be reversed within the foreseeable future. Moreover,
deferred tax assets are not recognized for deductible
temporary differff ences when the temporary differff ence will be
reversed in the foreseeable future or taxable profit will be
available against which the temporary differff ence can be
utilized.
Deferred tax assets and liabilities are calculated based on
the tax rates that are expected to apply to the period when
the deferred tax assets will be realized or the deferred tax
liabilities will be settled.
Deferred tax assets and deferred tax liabilities are offsetff
when there is a legally enforceable right to offset currff ent tax
assets and current tax liabilities and the deferred tax assets
and liabilities are related to income taxes levied by the same
taxation authority on the same taxable entity.
8) Property, Plant and Equipment
Property, plant and equipment is recognized at cost, which
includes any costs directly attributable to the acquisition of
the asset and dismantlement, removal and restoration
costs, as well as borrowing costs eligible for capitalization.
After recognition, property, plant, and equipment is
measured by using the cost model and is stated at cost
less accumulated depreciation and accumulated
impairment losses.
Property, plant and equipment other than land are
depreciated using the straight-line method over the
estimated useful lives of each item from the date the assets
are available for use. The estimated useful lives of major
property, plant and equipment are as follows:
The depreciation methods, residual values and estimated
useful lives are reviewed annually and adjusted as
necessary.
Buildings and structures:
Machinery and vehicles:
Tools, furTT niture and fixtures:
3 to 50 years
3 to 10 years
4 to 10 years
Notes to Consolidated Financial Statements
Impairment losses are stated in “10) Impairment of
Property, Plant and Equipment and Intangible Assets.”
9) Intangible Assets
Intangible assets are identifiable non-monetary assets
without physical substance and have been acquired
individually or through business combinations. The major
intangible assets are goodwill, intangible assets associated
with products, and software.
A. Goodwill
The measurement of goodwill on initial recognition is stated
in “2) Business combinations.” After initial recognition,
goodwill is not amortized and is measured at cost less any
accumulated impairment losses. Goodwill is allocated to the
cash-generating units that are expected to benefit from
synergies derived from business combinations.
B. Intangible Assets Other than Goodwill
Intangible assets other than goodwill that are acquired
individually are recognized at cost, specifically any cost
directly attributable to the acquisition of the asset. Intangible
assets other than goodwill that are acquired through
business combinations are recognized based on the fair
value at the business combination date.
After recognition, intangible assets are measured using
the cost model and are stated at cost less accumulated
amortization and accumulated impairment losses.
These intangible assets are amortized using the
straight-line method over the estimated useful lives (within
approximately 20 years) from the date the assets are
available for use. The estimated useful lives are calculated
based on the term of legal protection or the economical life,
and are regularly reviewed.
Impairment losses are shown in “10) Impairment of
Property, Plant and Equipment and Intangible Assets.”
The treatment of expenditures related to research and
development incurred within the Santen Group is shown in
“5) Research and Development Expenses.”
10) Impairment of Property, Plant and Equipment and
Intangible Assets
At the end of each reporting period, the Santen Group
assesses whether there is any indication of impairment
that property, plant and equipment and intangible assets
available for use may be impaired for each asset or
cash-generating unit. If there is an indication of
impairment, the Santen Group performs impairment test
and assesses the recoverability of each asset or
cash-generating unit.
Goodwill and intangible assets that are not yet available
for use are performed impairment test annually,
irrespective of whether there is any indication of
impairment.
The cash-generating unit is the smallest identifiable
group of assets that generates cash inflows that are largely
independent of the cash inflow from other assets or
groups of assets.
The recoverable amount of an asset or a cash-generating
unit is determined at the higher of its fair value less cost of
disposal or its value in use. In determining the value in use,
the estimated future cash flow is discounted to the present
value using a discount rate that reflects the time value of
money and the risks specific to the asset. If the carrying
amount of the asset or cash-generating unit exceeds the
recoverable amount, impairment loss is recognized in profit
or loss and the carrying amount is reduced to the
recoverable amount.
An asset or a cash-generating unit other than goodwill for
which impairment loss was recognized in prior years is
assessed at the end of the reporting period to determine
whether there is any indication that the impairment loss
recognized in prior periods may no longer exist or may have
decreased. If any such indication exists, the recoverable
amount of the asset or cash-generating unit is estimated. In
cases in which the recoverable amount exceeds the
carrying amount of the asset or cash-generating unit, the
impairment loss is reversed up to the lower of the estimated
recoverable amount or the carrying amount that would have
been determined if no impairment loss had been recognized
in prior years.
11) Leases
Leases are classified as finance leases when substantially all
the risks and rewards incidental to ownership of an asset
are transferred to the lessee. Leases other than finance
leases are classified as operating leases.
At the commencement of the lease term, the Companies
recognize finance leases as assets and liabilities in the
consolidated statement of financial position at amounts
equal to the fair value of the leased property or, if lower, the
present value of the minimum lease payments, each
determined at the inception of the lease. The lease assets
that have been recognized are depreciated on a straight-line
basis over the shorter of the estimated useful life and the
lease term of the asset.
Lease payments under an operating lease shall be
recognized as an expense on a straight-line basis over the
lease term unless another systematic basis is more
representative of the time pattern of the user’s benefit.
12) Financial Instruments
A. Financial Assets
i. Initial recognition and measurement
The Santen Group recognizes financial assets on the
trade date when the Group becomes party to the
contractual provisions of the financial asset.
If the following conditions (a) and (b) are met, the
financial assets that have been initially recognized are
classified as financial assets measured at amortized cost;
otherwise, they are classified as financial assets
measured at fair value. Equity investment other than held
for trading is measured at fair value through other
comprehensive income.
(a) The asset is held within a business model whose
objective is to hold assets in order to collect
contractual cash flows;
(b) The contractual terms of the instrument give rise on
specified dates to cash flows that are solely payments
of principal and interest on the principal amount
outstanding.
Financial assets are initially measured at fair value plus
transaction costs directly attributable to the financial
assets, except for financial assets measured at fair value
through profit or loss.
ii. Subsequent measurement
The financial assets measured at amortized cost are
calculated using the effective interest method.
The financial assets measured at fair value are
measured with any changes in fair value recognized
through profit or loss. In addition, changes in the fair
value of equity instruments other than held for trading are
recognized through other comprehensive income and
presented as “Financial assets measured at fair value
through other comprehensive income” in other
components of equity. The amount of other components
of equity is transferred directly to retained earnings, not
to profit or loss, when the equity investment is
derecognized or the decline in its fair value compared to
its acquisition cost is significant and other than
temporary.
iii. Impairment losses
Financial assets that are measured at amortized cost are
assessed whether there is any objective evidence of
impairment at the end of each reporting period. If there is
objective evidence of impairment, impairment loss is
recognized in profit or loss as the difference between the
financial asset’s carrying amount and the present value of
estimated future cash flows discounted at the financial
asset’s original effective interest rate.
If an impairment loss is reduced by an event occurring
after the recognition of impairment losses, the reduction
in the impairment loss is reversed through profit or loss.
iv. Derecognition
The Santen Group derecognizes a financial asset only
when the contractual right to receive the cash flows
from the asset expires or when the Companies transfer
the financial asset and substantially all the risks and
rewards of ownership of the asset to another entity. On
derecognition of a financial asset, the difference
between the carrying amount and the consideration
received or receivable is recognized in profit or loss, and
the cumulative gain or loss that was previously
accumulated in other comprehensive income (loss) is
reclassified to retained earnings.
B. Financial Liabilities
i. Initial recognition and measurement
The Santen Group recognizes financial liabilities on the
trade date when the Group becomes a party to the
contractual provisions of the financial liability.
Financial liabilities that have been initially recognized
are classified as financial liabilities measured at
amortized cost, except for financial liabilities measured
at fair value through profit or loss.
Financial liabilities except for financial liabilities at fair
value through profit or loss are initially measured at fair
value less transaction costs that are directly attributable
to the issuance.
ii. Subsequent measurement
The financial liabilities measured at amortized cost are
measured using the effective interest method.
The financial liabilities measured at fair value through
profit or loss are measured at fair value and any gains or
losses arising on remeasurement are recognized in
profit or loss.
iii. Derecognition
The Santen Group derecognizes financial liabilities when
the obligation specified in the contract is exempted,
cancelled, or expired.
C. Offsetting of Financial Assets and Financial Liabilities
Financial assets and financial liabilities are offset and the
net amount presented in the statement of financial position
when, and only when, the Santen Group:
(a) Currently has a legally enforceable right to set off the
recognized amounts;
(b) Intends either to settle on a net basis, or realize the
asset and settle the liability simultaneously.
D. Derivatives
The Company utilizes derivatives for hedging the risk
arising from fluctuation in foreign currency exchange rates,
12) Financial Instruments
A. Financial Assets
i. Initial recognition and measurement
The Santen Group recognizes financial assets on the
trade date when the Group becomes party to the
contractual provisions of the financial asset.
If the following conditions (a) and (b) are met, the
financial assets that have been initially recognized are
classified as financial assets measured at amortized cost;
otherwise, they are classified as financial assets
measured at fair value. Equity investment other than held
for trading is measured at fair value through other
comprehensive income.
(a) The asset is held within a business model whose
objective is to hold assets in order to collect
contractual cash flows;
(b) The contractual terms of the instrument give rise on
specified dates to cash flows that are solely payments
of principal and interest on the principal amount
outstanding.
Financial assets are initially measured at fair value plus
transaction costs directly attributable to the financial
assets, except for financial assets measured at fair value
through profit or loss.
ii. Subsequent measurement
The financial assets measured at amortized cost are
calculated using the effective interff est method.
The financial assets measured at fair value are
measured with any changes in fair value recognized
through profit or loss. In addition, changes in the fair
value of equity instruments other than held for trading are
recognized through other comprehensive income and
presented as “Financial assets measured at fair value
through other comprehensive income” in other
components of equity. The amount of other components
of equity is transferred directly to retained earnings, not
to profit or loss, when the equity investment is
derecognized or the decline in its fair value compared to
its acquisition cost is significant and other than
temporary.
iii. Impairment losses
Financial assets that are measured at amortized cost are
assessed whether there is any objective evidence of
impairment at the end of each reporting period. If there is
objective evidence of impairment, impairment loss is
recognized in profit or loss as the differff ence between the
financial asset’s carrying amount and the present value of
estimated future cash flows discounted at the financial
asset’s original effective interff est rate.
If an impairment loss is reduced by an event occurring
after the recognition of impairment losses, the reduction
in the impairment loss is reversed through profit or loss.
iv. Derecognition
The Santen Group derecognizes a financial asset only
when the contractual right to receive the cash flows
from the asset expires or when the Companies transfer
the financial asset and substantially all the risks and
rewards of ownership of the asset to another entity. Onyy
derecognition of a financial asset, the differff ence
between the carrying amount and the consideration
received or receivable is recognized in profit or loss, and
the cumulative gain or loss that was previously
accumulated in other comprehensive income (loss) is
reclassified to retained earnings.
B. Financial Liabilities
i. Initial recognition and measurement
The Santen Group recognizes financial liabilities on the
trade date when the Group becomes a party to the
contractual provisions of the financial liability.
Financial liabilities that have been initially recognized
are classified as financial liabilities measured at
amortized cost, except for financial liabilities measured
at fair value through profit or loss.
Financial liabilities except for financial liabilities at fair
value through profit or loss are initially measured at fair
value less transaction costs that are directly attributable
to the issuance.
ii. Subsequent measurement
The financial liabilities measured at amortized cost are
measured using the effective interff est method.
The financial liabilities measured at fair value through
profit or loss are measured at fair value and any gains or
losses arising on remeasurement are recognized in
profit or loss.
iii.Derecognition
The Santen Group derecognizes financial liabilities when
the obligation specified in the contract is exempted,
cancelled, or expired.
C. Offsetting of Financial Assets and Financial Liabilitiesff
Financial assets and financial liabilities are offset and theff
net amount presented in the statement of financial position
when, and only when, the Santen Group:
(a) Currently has a legally enforceable right to set off theff
recognized amounts;
(b) Intends either to settle on a net basis, or realize the
asset and settle the liability simultaneously.
D. Derivatives
The Company utilizes derivatives for hedging the risk
arising from fluctuation in foreign currency exchange rates,
Notes to Consolidated Financial Statements
interest rates and share price. Derivatives are initially
measured at fair value on the date when the derivative
contracts are entered into and are subsequently
remeasured to fair value at each reporting date. The
Santen Group does not enter into derivatives for trading or
speculative purposes.
E. Hedge Accounting
The Santen Group designates certain derivatives as cash
flow hedges and adopts hedge accounting for the
derivatives.
At the inception of the hedge, the Santen Group
documents the relationship between the hedging
instrument and the hedged item, and the risk management
objectives and strategies for undertaking the hedge. The
Santen Group also assesses whether the derivatives used
in hedging transactions are highly effective in achieving
offsetting changes in cash flows of hedged items both at
the hedge inception and on an ongoing basis. When a
hedging instrument is designated as a cash flow hedge
and meets the criteria for hedge accounting, the effective
portion of the gains or losses on the hedging instrument is
recognized in other comprehensive income. The ineffective
portion of gains or losses on the hedging instrument is
recognized in profit or loss.
The cumulative gain or loss that was previously
recognized in other comprehensive income is reclassified
to profit or loss in the same period when the cash flows of
the hedged items are recognized in profit or loss and at
the same line item in the consolidated statement of profit
or loss and other comprehensive income.
Hedge accounting is discontinued when the Santen
Group revokes the hedge designation, when the hedging
instrument expires or is sold, terminated or exercised, or
when the hedge no longer qualifies for hedge accounting.
13) Inventories
Inventories are measured at the lower of cost and net
realizable value.
The cost of inventories is calculated based on the
weighted-average cost method, including raw materials,
direct labor and other direct costs as well as relevant
overhead expenses. The net realizable value is determined
based on the estimated selling price in the ordinary course
of business less the estimated costs of completion and the
estimated costs necessary to make the sale.
14) Cash and Cash Equivalents
Cash and cash equivalents consist of cash on hand,
demand deposits and short-term highly liquid investments
that are subject to insignificant risk of change in value, due
within three months from the date of acquisition and
readily convertible to known amounts of cash.
15) Assets Held for Sale
The Santen Group classifies a non-current asset or
disposal group which must be available for immediate sale
in its present condition and its sale must be highly
probable as held for sale if its carrying amount will be
recovered principally through a sale transaction rather than
through continuing use.
The Santen Group measures a non-current asset or
disposal group classified as held for sale at the lower of its
carrying amount and fair value less costs to sell.
16) Capital
A. Ordinary Shares
Proceeds from the issuance of ordinary shares are
included in share capital and capital surplus. The
transaction cost (net of tax) of equity transactions is
deducted from capital surplus.
B. Treasury Shares
Treasury shares purchased by the Company are measured
as the amount of the consideration paid for the shares and
are recognized as a deduction from capital. The Company
does not recognize any gains or losses on the acquisition,
sale or cancellation of treasury shares. If the Company
sells treasury shares, any differences between the carrying
amount and the sales amount are recorded under capital
surplus.
17) Share-based Payments
The Santen Group has a share option plan as
equity-settled share-based payments for its directors and
corporate officers. Share options are measured at fair
value on the grant date and the fair value is calculated
using the Black-Scholes model. The fair value of share
options are recognized as expenses and the
corresponding amount as an increase in equity on the
grant date.
18) Employee Benefits
A. Post-employment Benefits
The Santen Group has adopted defined benefit plans and
defined contribution plans as post-employment benefit
plans for employees.
i. Defined benefit plans
The present value of defined benefit obligation and the
related current service costs and past service cost are
calculated based on the projected unit credit method.
Notes to Consolidated Financial Statements
interest rates and share price. Derivatives are initially
measured at fair value on the date when the derivative
contracts are entered into and are subsequently
remeasured to fair value at each reporting date. The
Santen Group does not enter into derivatives for trading or
speculative purposes.
E. Hedge Accounting
The Santen Group designates certain derivatives as cash
flow hedges and adopts hedge accounting for the
derivatives.
At the inception of the hedge, the Santen Group
documents the relationship between the hedging
instrument and the hedged item, and the risk management
objectives and strategies for undertaking the hedge. The
Santen Group also assesses whether the derivatives used
in hedging transactions are highly effective in achievingff
offsetting changes in cash flows of hedged items both atff
the hedge inception and on an ongoing basis. When a
hedging instrument is designated as a cash flow hedge
and meets the criteria for hedge accounting, the effective ff
portion of the gains or losses on the hedging instrument is
recognized in other comprehensive income. The ineffective
portion of gains or losses on the hedging instrument is
recognized in profit or loss.
The cumulative gain or loss that was previously
recognized in other comprehensive income is reclassified
to profit or loss in the same period when the cash flows of
the hedged items are recognized in profit or loss and at
the same line item in the consolidated statement of profit
or loss and other comprehensive income.
Hedge accounting is discontinued when the Santen
Group revokes the hedge designation, when the hedging
instrument expires or is sold, terminated or exercised, or
when the hedge no longer qualifies for hedge accounting.
13) Inventories
Inventories are measured at the lower of cost and net
realizable value.
The cost of inventories is calculated based on the
weighted-average cost method, including raw materials,
direct labor and other direct costs as well as relevant
overhead expenses. The net realizable value is determined
based on the estimated selling price in the ordinary course
of business less the estimated costs of completion and the
estimated costs necessary to make the sale.
14) Cash and Cash Equivalents
Cash and cash equivalents consist of cash on hand,
demand deposits and short-term highly liquid investments
that are subject to insignificant risk of change in value, due
within three months from the date of acquisition and
readily convertible to known amounts of cash.
15) Assets Held for Sale
The Santen Group classifies a non-current asset or
disposal group which must be available for immediate sale
in its present condition and its sale must be highly
probable as held for sale if its carrying amount will be
recovered principally through a sale transaction rather than
through continuing use.
The Santen Group measures a non-current asset or
disposal group classified as held for sale at the lower of its
carrying amount and fair value less costs to sell.
16) Capital
A. Ordinary Shares
Proceeds from the issuance of ordinary shares are
included in share capital and capital surplus. The
transaction cost (net of tax) of equity transactions is
deducted from capital surplus.
B. Treasury Shares
Treasury shares purchased by the Company are measured
as the amount of the consideration paid for the shares and
are recognized as a deduction from capital. The Company
does not recognize any gains or losses on the acquisition,
sale or cancellation of treasury shares. If the Company
sells treasury shares, any differff ences between the carrying
amount and the sales amount are recorded under capital
surplus.
17) Share-based Payments
The Santen Group has a share option plan as
equity-settled share-based payments for its directors and
corporate officers. Sharff e options are measured at fair
value on the grant date and the fair value is calculated
using the Black-Scholes model. The fair value of share
options are recognized as expenses and the
corresponding amount as an increase in equity on the
grant date.
18) Employee Benefits
A. Post-employment Benefits
The Santen Group has adopted defined benefit plans and
defined contribution plans as post-employment benefit
plans for employees.
i. Defined benefit plans
The present value of defined benefit obligation and the
related current service costs and past service cost are
calculated based on the projected unit credit method.
4. Use of Judgments, Estimates and Assumptions
In preparing the Santen Group’s consolidated financial
statements, management makes judgments, estimates and
assumptions that affect the adoption of accounting policies
and the reported amounts of assets and liabilities, and
income and expenses. Actual results may differ from these
estimates.
Judgments, estimates and assumptions made by
management that may have a significant effect on the
amounts recognized in the consolidated financial
statements are as follows:
• Impairment of property, plant and equipment and
intangible assets
• Recoverability of deferred tax assets
• Provisions
• Measurement of defined benefit obligations
• Fair value of financial instruments
• Share-based payments
5. New Standards and Interpretations Not Yet Adopted
The new standards, interpretations and amendments that
have been issued for the consolidated financial statements,
which the Santen Group has not yet adopted as of the
approval date of the consolidated financial statements are
set forth in the table below. The Santen Group is currently
estimating the possible impact the application will have on
the consolidated financial statements.
Revenue from Contracts with Customers
Financial Instruments
Lease
January 1, 2018
January 1, 2018
January 1, 2019
Mandatory adoption(From the fiscal yearbeginning on or after)
Description of new standards,interpretations and amendments
Fiscal year ending March 2019
Fiscal year ending March 2019
Fiscal year ending March 2020
New revenue standards which supersedes IAS 18“Revenue,” IAS 11 “Construction Contracts”and a number of revenue-related interpretations
Amendment to classification, measurement, impairment and hedge accounting of financial instruments
Amendments to accounting treatment for lease arrangements
To be adopted by the Santen GroupIFRS
IFRS 15
IFRS 9
IFRS 16
The discount rates are determined with reference to
the market yields of high-quality corporate bonds at the
end of each reporting period. Service cost and net
interest on the net defined benefit liabilities are
recognized in profit or loss.
Actuarial gains and losses, return on plan assets
excluding amounts included in net interest on the net
defined benefit liabilities, and changes in the effect of
the asset ceiling are recognized in other comprehensive
income and reclassified to retained earnings in the
period in which they are recognized.
ii. Defined contribution plans
Costs for defined contribution plans are recognized as
expenses when they are paid.
B. Short-term Employee Benefits
The undiscounted amount of short-term employee benefits
expected to be paid in exchange for that service are
recognized as expenses when employees have rendered
services to the Santen Group.
19) Provisions
A provision is recognized when the Santen Group has a legal
or constructive obligation as a result of a past event, and it is
probable that an outflow of resources embodying economic
benefits will be required to settle the obligation, and the
amount of the obligations can be estimated reliably. When
the effect of the time value of money is material, the amount
of a provision shall be the present value of the expenditures
expected to be required to settle the obligation.
4. Use of Judgments, Estimates and Assumptions
In preparing the Santen Group’s consolidated financial
statements, management makes judgments, estimates and
assumptions that affect the adoption of accounting policiesff
and the reported amounts of assets and liabilities, and
income and expenses. Actual results may differ frff om these
estimates.
Judgments, estimates and assumptions made by
management that may have a significant effect on theff
amounts recognized in the consolidated financial
statements are as follows:
• Impairment of property, plant and equipment and
intangible assets
• Recoverability of deferred tax assets
• Provisions
• Measurement of defined benefit obligations
• Fair value of financial instruments
• Share-based payments
5. New Standards and Interpretations Not Yet AdoptedYY
The new standards, interpretations and amendments that
have been issued for the consolidated financial statements,
which the Santen Group has not yet adopted as of the
approval date of the consolidated financial statements are
set forth in the table below. The Santen Group is currently
estimating the possible impact the application will have on
the consolidated financial statements.
Revenue from Contractswith Customers
Financial Instruments
Lease
January 1, 2018
January 1, 2018
January 1, 2019
Mandatory adoption(From the fiscal yearbeginning on or after)
Description of new standards,interpretations and amendments
Fiscal year endingMarch 2019
Fiscal year endingMarch 2019
Fiscal year endingMarch 2020
New revenue standards which supersedes IAS 18“Revenue,” IAS 11 “Construction Contracts”and a number of revenue-related interpretations
Amendment to classification, measurement,impairment and hedge accounting of financial instruments
Amendments to accounting treatmentfor lease arrangements
To be adopted bythe Santen GroupIFRS
IFRS 15
IFRS 9
IFRS 16
The discount rates are determined with reference to
the market yields of high-quality corporate bonds at the
end of each reporting period. Service cost and net
interest on the net defined benefit liabilities are
recognized in profit or loss.
Actuarial gains and losses, return on plan assets
excluding amounts included in net interest on the net
defined benefit liabilities, and changes in the effect of ff
the asset ceiling are recognized in other comprehensive
income and reclassified to retained earnings in the
period in which they are recognized.
ii. Defined contribution plans
Costs for defined contribution plans are recognized as
expenses when they are paid.
B. Short-term Employee Benefits
The undiscounted amount of short-term employee benefits
expected to be paid in exchange for that service are
recognized as expenses when employees have rendered
services to the Santen Group.
19) Provisions
A provision is recognized when the Santen Group has a legal
or constructive obligation as a result of a past event, and it is
probable that an outflow of resources embodying economic
benefits will be required to settle the obligation, and the
amount of the obligations can be estimated reliably. When
the effect of the time value of money is material, the amountff
of a provision shall be the present value of the expenditures
expected to be required to settle the obligation.
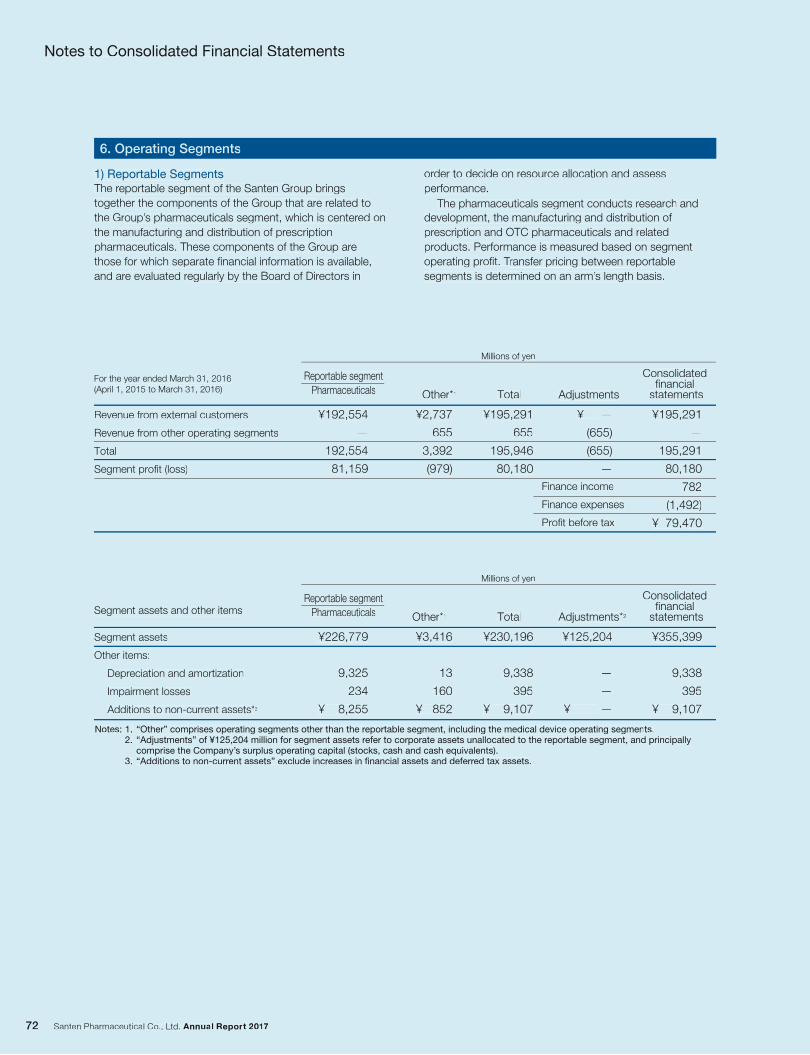
6. Operating Segments
1) Reportable SegmentsThe reportable segment of the Santen Group brings
together the components of the Group that are related to
the Group’s pharmaceuticals segment, which is centered on
the manufacturing and distribution of prescription
pharmaceuticals. These components of the Group are
those for which separate financial information is available,
and are evaluated regularly by the Board of Directors in
order to decide on resource allocation and assess
performance.
The pharmaceuticals segment conducts research and development, the manufacturing and distribution of
prescription and OTC pharmaceuticals and related
products. Performance is measured based on segment
operating profit. Transfer pricing between reportable
segments is determined on an arm’s length basis.
Segment assets
Other items:
Depreciation and amortization
Impairment losses
Additions to non-current assets*3
Millions of yen
Reportable segmentPharmaceuticals
¥226,779
9,325
234
¥ 8,255
Other*1
¥3,416
13
160
¥ 852
Total
¥230,196
9,338
395
¥ 9,107
Adjustments*2
¥125,204
—
—
¥ —
Consolidated financial
statements
¥355,399
9,338
395
¥ 9,107
Segment assets and other items
Notes: 1. “Other” comprises operating segments other than the reportable segment, including the medical device operating segments. 2. “Adjustments” of ¥125,204 million for segment assets refer to corporate assets unallocated to the reportable segment, and principally
comprise the Company’s surplus operating capital (stocks, cash and cash equivalents). 3. “Additions to non-current assets” exclude increases in financial assets and deferred tax assets.
Notes to Consolidated Financial Statements
Revenue from external customers
Revenue from other operating segments
Total
Segment profit (loss)
Millions of yen
Reportable segmentPharmaceuticals
¥192,554
—
192,554
81,159
Other*1
¥2,737
655
3,392
(979)
Total
¥195,291
655
195,946
80,180
Adjustments
¥ —
(655)
(655)
—
Consolidated financial
statements
¥195,291
—
195,291
80,180
782
(1,492)
¥ 79,470
For the year ended March 31, 2016 (April 1, 2015 to March 31, 2016)
Finance income
Finance expenses
Profit before tax
6. Operating Segments
1) Reportable SegmentsThe reportable segment of the Santen Group brings
together the components of the Group that are related to
the Group’s pharmaceuticals segment, which is centered on
the manufacturing and distribution of prescription
pharmaceuticals. These components of the Group are
those for which separate financial information is available,
and are evaluated regularly by the Board of Directors in
order to decide on resource allocation and assess
performance.
The pharmaceuticals segment conducts research anddevelopment, the manufacturing and distribution of
prescription and OTC pharmaceuticals and related
products. Performance is measured based on segment
operating profit. Transfer pricing between rTT eportable
segments is determined on an arm’s length basis.
Segment assets
Other items:
Depreciation and amortization
Impairment losses
Additions to non-current assets*3
Millions of yen
Reportable segmentPharmaceuticals
¥226,779
9,325
234
¥ 8,255
Other*1
¥3,416
13
160
¥ 852
Total
¥230,196
9,338
395
¥ 9,107
Adjustments*2
¥125,204
—
—
¥ —
Consolidatedfinancial
statements
¥355,399
9,338
395
¥ 9,107
Segment assets and other items
Notes: 1. “Other” comprises operating segments other than the reportable segment, including the medical device operating segments.2. “Adjustments” of ¥125,204 million for segment assets refer to corporate assets unallocated to the reportable segment, and principally
comprise the Company’s surplus operating capital (stocks, cash and cash equivalents).3. “Additions to non-current assets” exclude increases in financial assets and deferred tax assets.
Notes to Consolidated Financial Statements
Revenue from external customers
Revenue from other operating segments
Total
Segment profit (loss)
Millions of yen
Reportable segmentPharmaceuticals
¥192,554
—
192,554
81,159
Other*1
¥2,737
655
3,392
(979)
Total
¥195,291
655
195,946
80,180
Adjustments
¥ —
(655)
(655)
—
Consolidatedfinancial
statements
¥195,291
—
195,291
80,180
782
(1,492)
¥ 79,470
For the year ended March 31, 2016 (April 1, 2015 to March 31, 2016)
Finance income
Finance expenses
Profit before tax
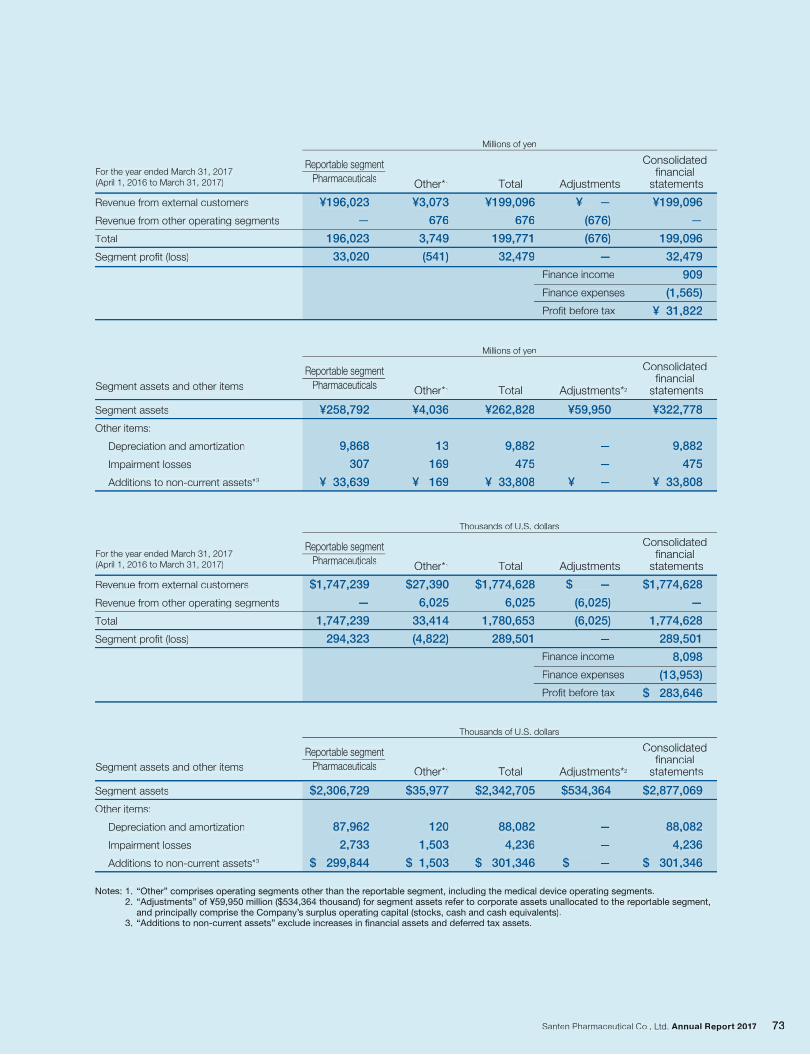
For the year ended March 31, 2017(April 1, 2016 to March 31, 2017)
For the year ended March 31, 2017(April 1, 2016 to March 31, 2017)
Millions of yen
Revenue from external customers
Revenue from other operating segments
Total
Segment profit (loss)
¥196,023
—
196,023
33,020
Other*1
¥3,073
676
3,749
(541)
Total
¥199,096
676
199,771
32,479
Adjustments
¥ —
(676)
(676)
—
Consolidated financial
statements
¥199,096
—
199,096
32,479
909
(1,565)
¥ 31,822
Reportable segmentPharmaceuticals
Millions of yen
Other*1 Total Adjustments*2
Consolidated financial
statements
Reportable segmentPharmaceuticalsSegment assets and other items
Segment assets
Other items:
Depreciation and amortization
Impairment losses
Additions to non-current assets*3
¥258,792
9,868
307
¥ 33,639
¥4,036
13
169
¥ 169
¥262,828
9,882
475
¥ 33,808
¥59,950
—
—
¥ —
¥322,778
9,882
475
¥ 33,808
Thousands of U.S. dollars
Revenue from external customers
Revenue from other operating segments
Total
Segment profit (loss)
$1,747,239
—
1,747,239
294,323
Other*1
$27,390
6,025
33,414
(4,822)
Total
$1,774,628
6,025
1,780,653
289,501
Adjustments
$ —
(6,025)
(6,025)
—
Consolidated financial
statements
$1,774,628
—
1,774,628
289,501
8,098
(13,953)
$ 283,646
Reportable segmentPharmaceuticals
Segment assets and other items
Thousands of U.S. dollars
Other*1 Total Adjustments*2
Consolidated financial
statements
Reportable segmentPharmaceuticals
Notes: 1. “Other” comprises operating segments other than the reportable segment, including the medical device operating segments. 2. “Adjustments” of ¥59,950 million ($534,364 thousand) for segment assets refer to corporate assets unallocated to the reportable segment,
and principally comprise the Company’s surplus operating capital (stocks, cash and cash equivalents). 3. “Additions to non-current assets” exclude increases in financial assets and deferred tax assets.
Segment assets
Other items:
Depreciation and amortization
Impairment losses
Additions to non-current assets*3
$2,306,729
87,962
2,733
$ 299,844
$35,977
120
1,503
$ 1,503
$2,342,705
88,082
4,236
$ 301,346
$534,364
—
—
$ —
$2,877,069
88,082
4,236
$ 301,346
Finance income
Finance expenses
Profit before tax
Finance income
Finance expenses
Profit before tax
For the year ended March 31, 2017(April 1, 2016 to March 31, 2017)
For the year ended March 31, 2017(April 1, 2016 to March 31, 2017)
Millions of yen
Revenue from external customers
Revenue from other operating segments
Total
Segment profit (loss)
¥196,023
—
196,023
33,020
Other*1
¥3,073
676
3,749
(541)
Total
¥199,096
676
199,771
32,479
Adjustments
¥ —
(676)
(676)
—
Consolidatedfinancial
statements
¥199,096
—
199,096
32,479
909
(1,565)
¥ 31,822
Reportable segmentPharmaceuticals
Millions of yen
Other*1 Total Adjustments*2
Consolidatedfinancial
statements
Reportable segmentPharmaceuticalsSegment assets and other items
Segment assets
Other items:
Depreciation and amortization
Impairment losses
Additions to non-current assets*3
¥258,792
9,868
307
¥ 33,639
¥4,036
13
169
¥ 169
¥262,828
9,882
475
¥ 33,808
¥59,950
—
—
¥ —
¥322,778
9,882
475
¥ 33,808
Thousands of U.S. dollars
Revenue from external customers
Revenue from other operating segments
Total
Segment profit (loss)
$1,747,239
—
1,747,239
294,323
Other*1
$27,390
6,025
33,414
(4,822)
Total
$1,774,628
6,025
1,780,653
289,501
Adjustments
$ —
(6,025)
(6,025)
—
Consolidatedfinancial
statements
$1,774,628
—
1,774,628
289,501
8,098
(13,953)
$ 283,646
Reportable segmentPharmaceuticals
Segment assets and other items
Thousands of U.S. dollars
Other*1 Total Adjustments*2
Consolidatedfinancial
statements
Reportable segmentPharmaceuticals
Notes: 1. “Other” comprises operating segments other than the reportable segment, including the medical device operating segments.2. “Adjustments” of ¥59,950 million ($534,364 thousand) for segment assets refer to corporate assets unallocated to the reportable segment,
and principally comprise the Company’s surplus operating capital (stocks, cash and cash equivalents).3. “Additions to non-current assets” exclude increases in financial assets and deferred tax assets.
Segment assets
Other items:
Depreciation and amortization
Impairment losses
Additions to non-current assets*3
$2,306,729
87,962
2,733
$ 299,844
$35,977
120
1,503
$ 1,503
$2,342,705
88,082
4,236
$ 301,346
$534,364
—
—
$ —
$2,877,069
88,082
4,236
$ 301,346
Finance income
Finance expenses
Profit before tax
Finance income
Finance expenses
Profit before tax
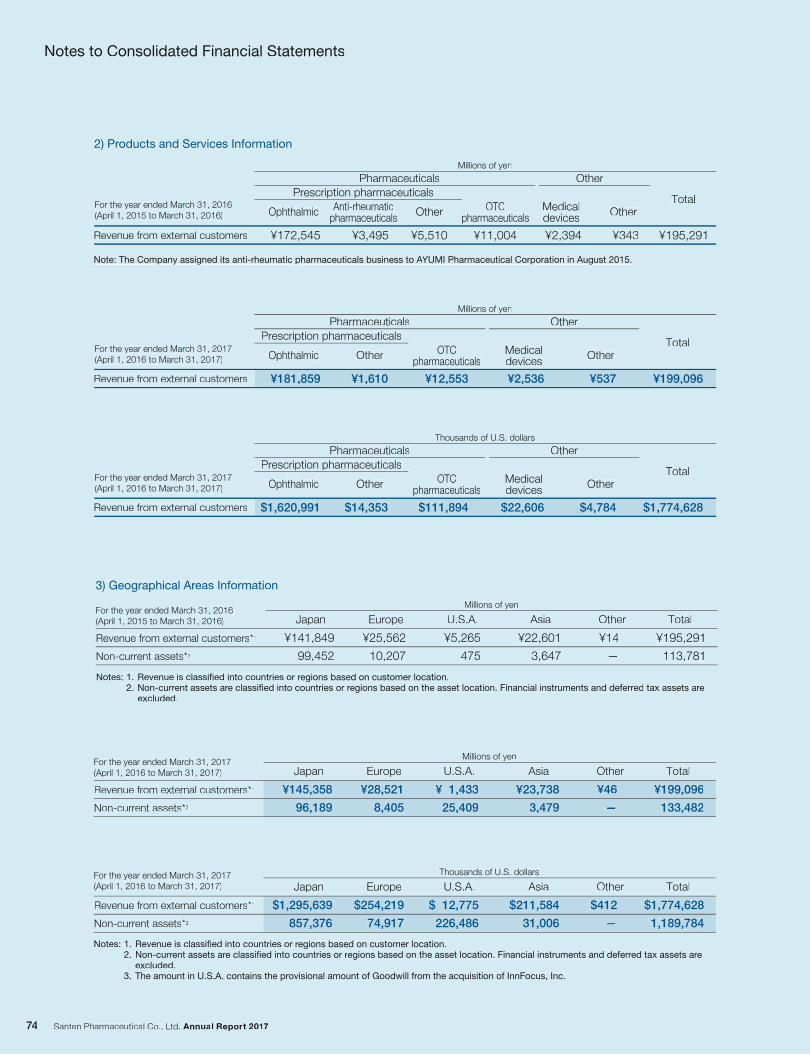
2) Products and Services Information
For the year ended March 31, 2016 (April 1, 2015 to March 31, 2016)
Millions of yen
¥195,291¥343¥2,394¥11,004¥5,510¥3,495¥172,545
TotalOtherMedical
devicesOTC
pharmaceuticalsOther
Prescription pharmaceuticalsAnti-rheumatic
pharmaceuticals
OtherPharmaceuticals
Ophthalmic
Revenue from external customers
For the year ended March 31, 2017 (April 1, 2016 to March 31, 2017)
Millions of yen
¥199,096¥537¥2,536¥12,553¥1,610¥181,859
TotalOtherMedical
devicesOTC
pharmaceuticalsOther
Prescription pharmaceuticalsOtherPharmaceuticals
Ophthalmic
Revenue from external customers
For the year ended March 31, 2017 (April 1, 2016 to March 31, 2017)
$1,774,628$4,784$22,606$111,894$14,353$1,620,991
TotalOtherMedical
devicesOTC
pharmaceuticalsOther
Prescription pharmaceuticalsOtherPharmaceuticals
Ophthalmic
Revenue from external customers
Note: The Company assigned its anti-rheumatic pharmaceuticals business to AYUMI Pharmaceutical Corporation in August 2015.
Thousands of U.S. dollars
Notes to Consolidated Financial Statements
3) Geographical Areas Information
For the year ended March 31, 2016 (April 1, 2015 to March 31, 2016)
Millions of yen
¥195,291
113,781
¥14
—
¥22,601
3,647
¥5,265
475
¥25,562
10,207
¥141,849
99,452
Revenue from external customers*1
Non-current assets*2
TotalOtherAsiaU.S.A.EuropeJapan
Notes: 1. Revenue is classified into countries or regions based on customer location. 2. Non-current assets are classified into countries or regions based on the asset location. Financial instruments and deferred tax assets are
excluded. 3. The amount in U.S.A. contains the provisional amount of Goodwill from the acquisition of InnFocus, Inc.
For the year ended March 31, 2017 (April 1, 2016 to March 31, 2017)
For the year ended March 31, 2017 (April 1, 2016 to March 31, 2017)
Millions of yen
¥199,096
133,482
¥46
—
¥23,738
3,479
¥ 1,433
25,409
¥28,521
8,405
¥145,358
96,189
Revenue from external customers*1
Non-current assets*2
TotalOtherAsiaU.S.A.EuropeJapan
Thousands of U.S. dollars
$1,774,628
1,189,784
$412
—
$211,584
31,006
$ 12,775
226,486
$254,219
74,917
$1,295,639
857,376
Revenue from external customers*1
Non-current assets*2
TotalOtherAsiaU.S.A.EuropeJapan
Notes: 1. Revenue is classified into countries or regions based on customer location. 2. Non-current assets are classified into countries or regions based on the asset location. Financial instruments and deferred tax assets are
excluded.
2) Products and Services Information
For the year ended March 31, 2016 (April 1, 2015 to March 31, 2016)
Millions of yen
¥195,291¥343¥2,394¥11,004¥5,510¥3,495¥172,545
TotalOtherMedical
devicesOTC
pharmaceuticalsOther
Prescription pharmaceuticalsAnti-rheumatic
pharmaceuticals
OtherPharmaceuticals
Ophthalmic
Revenue from external customers
For the year ended March 31, 2017 (April 1, 2016 to March 31, 2017)
Millions of yen
¥199,096¥537¥2,536¥12,553¥1,610¥181,859
TotalOtherMedical
devicesOTC
pharmaceuticalsOther
Prescription pharmaceuticalsOtherPharmaceuticals
Ophthalmic
Revenue from external customers
For the year ended March 31, 2017 (April 1, 2016 to March 31, 2017)
$1,774,628$4,784$22,606$111,894$14,353$1,620,991
TotalOtherMedical
devicesOTC
pharmaceuticalsOther
Prescription pharmaceuticalsOtherPharmaceuticals
Ophthalmic
Revenue from external customers
Note: The Company assigned its anti-rheumatic pharmaceuticals business to AYUMI Pharmaceutical Corporation in August 2015. AA
Thousands of U.S. dollars
Notes to Consolidated Financial Statements
3) Geographical Areas Information
For the year ended March 31, 2016 (April 1, 2015 to March 31, 2016)
Millions of yen
¥195,291
113,781
¥14
—
¥22,601
3,647
¥5,265
475
¥25,562
10,207
¥141,849
99,452
Revenue from external customers*1
Non-current assets*2
TotalOtherAsiaU.S.A.EuropeJapan
Notes: 1. Revenue is classified into countries or regions based on customer location.2. Non-current assets are classified into countries or regions based on the asset location. Financial instruments and deferred tax assets are
excluded.3. The amount in U.S.A. contains the provisional amount of Goodwill from the acquisition of InnFocus, Inc.
For the year ended March 31, 2017 (April 1, 2016 to March 31, 2017)
For the year ended March 31, 2017 (April 1, 2016 to March 31, 2017)
Millions of yen
¥199,096
133,482
¥46
—
¥23,738
3,479
¥ 1,433
25,409
¥28,521
8,405
¥145,358
96,189
Revenue from external customers*1
Non-current assets*2
TotalOtherAsiaU.S.A.EuropeJapan
Thousands of U.S. dollars
$1,774,628
1,189,784
$412
—
$211,584
31,006
$ 12,775
226,486
$254,219
74,917
$1,295,639
857,376
Revenue from external customers*1
Non-current assets*2
TotalOtherAsiaU.S.A.EuropeJapan
Notes: 1. Revenue is classified into countries or regions based on customer location.2. Non-current assets are classified into countries or regions based on the asset location. Financial instruments and deferred tax assets are
excluded.
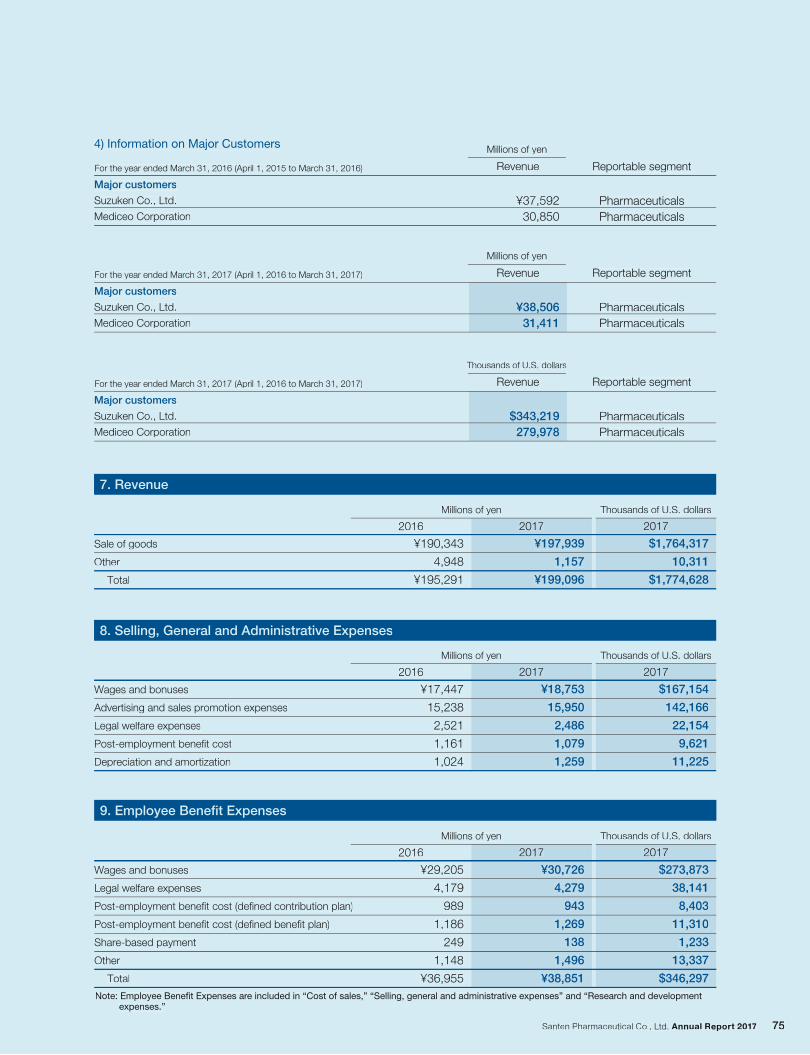
Millions of yen Thousands of U.S. dollars
20172016 2017
$1,764,317
10,311
$1,774,628
¥190,343
4,948
¥195,291
¥197,939
1,157
¥199,096
Millions of yen Thousands of U.S. dollars
20172016 2017
$167,154
142,166
22,154
9,621
11,225
¥17,447
15,238
2,521
1,161
1,024
¥18,753
15,950
2,486
1,079
1,259
Millions of yen Thousands of U.S. dollars
20172016 2017
$273,873
38,141
8,403
11,310
1,233
13,337
$346,297
¥29,205
4,179
989
1,186
249
1,148
¥36,955
¥30,726
4,279
943
1,269
138
1,496
¥38,851
9. Employee Benefit Expenses
Wages and bonuses
Legal welfare expenses
Post-employment benefit cost (defined contribution plan)
Post-employment benefit cost (defined benefit plan)
Share-based payment
Other
Total
7. Revenue
Sale of goods
Other
Total
8. Selling, General and Administrative Expenses
Wages and bonuses
Advertising and sales promotion expenses
Legal welfare expenses
Post-employment benefit cost
Depreciation and amortization
4) Information on Major Customers Millions of yen
For the year ended March 31, 2016 (April 1, 2015 to March 31, 2016)
Major customers
Suzuken Co., Ltd.
Mediceo Corporation
¥37,592
30,850
Revenue Reportable segment
Pharmaceuticals
Pharmaceuticals
Millions of yen
For the year ended March 31, 2017 (April 1, 2016 to March 31, 2017)
Major customers
Suzuken Co., Ltd.
Mediceo Corporation
¥38,506
31,411
Revenue Reportable segment
Pharmaceuticals
Pharmaceuticals
Thousands of U.S. dollars
For the year ended March 31, 2017 (April 1, 2016 to March 31, 2017)
Major customers
Suzuken Co., Ltd.
Mediceo Corporation
$343,219
279,978
Revenue Reportable segment
Pharmaceuticals
Pharmaceuticals
Note: Employee Benefit Expenses are included in “Cost of sales,” “Selling, general and administrative expenses” and “Research and development expenses.”
Millions of yen Thousands of U.S. dollars
20172016 2017
$1,764,317
10,311
$1,774,628
¥190,343
4,948
¥195,291
¥197,939
1,157
¥199,096
Millions of yen Thousands of U.S. dollars
20172016 2017
$167,154
142,166
22,154
9,621
11,225
¥17,447
15,238
2,521
1,161
1,024
¥18,753
15,950
2,486
1,079
1,259
Millions of yen Thousands of U.S. dollars
20172016 2017
$273,873
38,141
8,403
11,310
1,233
13,337
$346,297
¥29,205
4,179
989
1,186
249
1,148
¥36,955
¥30,726
4,279
943
1,269
138
1,496
¥38,851
9. Employee Benefit Expenses
Wages and bonuses
Legal welfare expenses
Post-employment benefit cost (defined contribution plan)
Post-employment benefit cost (defined benefit plan)
Share-based payment
Other
Total
7. Revenue
Sale of goods
Other
Total
8. Selling, General and Administrative Expenses
Wages and bonuses
Advertising and sales promotion expenses
Legal welfare expenses
Post-employment benefit cost
Depreciation and amortization
4) Information on Major Customers Millions of yen
For the year ended March 31, 2016 (April 1, 2015 to March 31, 2016)
Major customers
Suzuken Co., Ltd.
Mediceo Corporation
¥37,592
30,850
Revenue Reportable segment
Pharmaceuticals
Pharmaceuticals
Millions of yen
For the year ended March 31, 2017 (April 1, 2016 to March 31, 2017)
Major customers
Suzuken Co., Ltd.
Mediceo Corporation
¥38,506
31,411
Revenue Reportable segment
Pharmaceuticals
Pharmaceuticals
Thousands of U.S. dollars
For the year ended March 31, 2017 (April 1, 2016 to March 31, 2017)
Major customers
Suzuken Co., Ltd.
Mediceo Corporation
$343,219
279,978
Revenue Reportable segment
Pharmaceuticals
Pharmaceuticals
Note: Employee Benefit Expenses are included in “Cost of sales,” “Selling, general and administrative expenses” and “Research and developmentexpenses.”
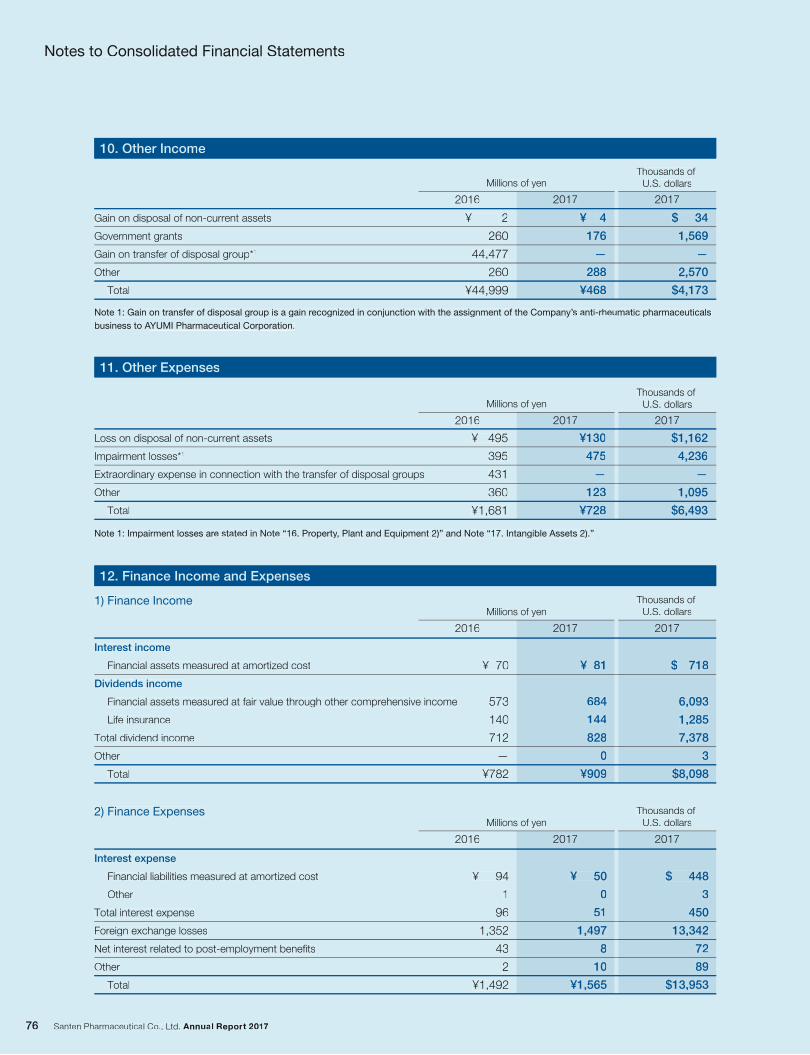
10. Other Income
11. Other Expenses
Note 1: Impairment losses are stated in Note “16. Property, Plant and Equipment 2)” and Note “17. Intangible Assets 2).”
Note 1: Gain on transfer of disposal group is a gain recognized in conjunction with the assignment of the Company’s anti-rheumatic pharmaceuticals
business to AYUMI Pharmaceutical Corporation.
Millions of yenThousands of
U.S. dollars
Millions of yenThousands of
U.S. dollars
Loss on disposal of non-current assets
Impairment losses*1
Extraordinary expense in connection with the transfer of disposal groups
Other
Total
12. Finance Income and Expenses
1) Finance Income
2) Finance Expenses
Millions of yenThousands of
U.S. dollars
Interest income
Financial assets measured at amortized cost
Dividends income
Financial assets measured at fair value through other comprehensive income
Life insurance
Total dividend income
Other
Total
20172016 2017
Millions of yenThousands of
U.S. dollars
Interest expense
Financial liabilities measured at amortized cost
Other
Total interest expense
Foreign exchange losses
Net interest related to post-employment benefits
Other
Total
Notes to Consolidated Financial Statements
2017
$ 34
1,569
—
2,570
$4,173
2016
¥ 2
260
44,477
260
¥44,999
2017
¥ 4
176
—
288
¥468
Gain on disposal of non-current assets
Government grants
Gain on transfer of disposal group*1
Other
Total
2017
$1,162
4,236
—
1,095
$6,493
2016
¥ 495
395
431
360
¥1,681
2017
¥130
475
—
123
¥728
2017
$ 718
6,093
1,285
7,378
3
$8,098
2016
¥ 70
573
140
712
—
¥782
2017
¥ 81
684
144
828
0
¥909
$ 448
3
450
13,342
72
89
$13,953
¥ 50
0
51
1,497
8
10
¥1,565
¥ 94
1
96
1,352
43
2
¥1,492
10. Other Income
11. Other Expenses
Note 1: Impairment losses are stated in Note “16. Property, Plant and Equipment 2)” and Note “17. Intangible Assets 2).”
Note 1: Gain on transfer of disposal group is a gain recognized in conjunction with the assignment of the Company’s anti-rheumatic pharmaceuticals
business to AYUMI Pharmaceutical Corporation.AA
Millions of yenThousands of
U.S. dollars
Millions of yenThousands of
U.S. dollars
Loss on disposal of non-current assets
Impairment losses*1
Extraordinary expense in connection with the transfer of disposal groups
Other
Total
12. Finance Income and Expenses
1) Finance Income
2) Finance Expenses
Millions of yenThousands of
U.S. dollars
Interest income
Financial assets measured at amortized cost
Dividends income
Financial assets measured at fair value through other comprehensive income
Life insurance
Total dividend income
Other
Total
20172016 2017
Millions of yenThousands of
U.S. dollars
Interest expense
Financial liabilities measured at amortized cost
Other
Total interest expense
Foreign exchange losses
Net interest related to post-employment benefits
Other
Total
Notes to Consolidated Financial Statements
2017
$ 34
1,569
—
2,570
$4,173
2016
¥ 2
260
44,477
260
¥44,999
2017
¥ 4
176
—
288
¥468
Gain on disposal of non-current assets
Government grants
Gain on transfer of disposal group*1
Other
Total
2017
$1,162
4,236
—
1,095
$6,493
2016
¥ 495
395
431
360
¥1,681
2017
¥130
475
—
123
¥728
2017
$ 718
6,093
1,285
7,378
3
$8,098
2016
¥ 70
573
140
712
—
¥782
2017
¥ 81
684
144
828
0
¥909
$ 448
3
450
13,342
72
89
$13,953
¥ 50
0
51
1,497
8
10
¥1,565
¥ 94
1
96
1,352
43
2
¥1,492
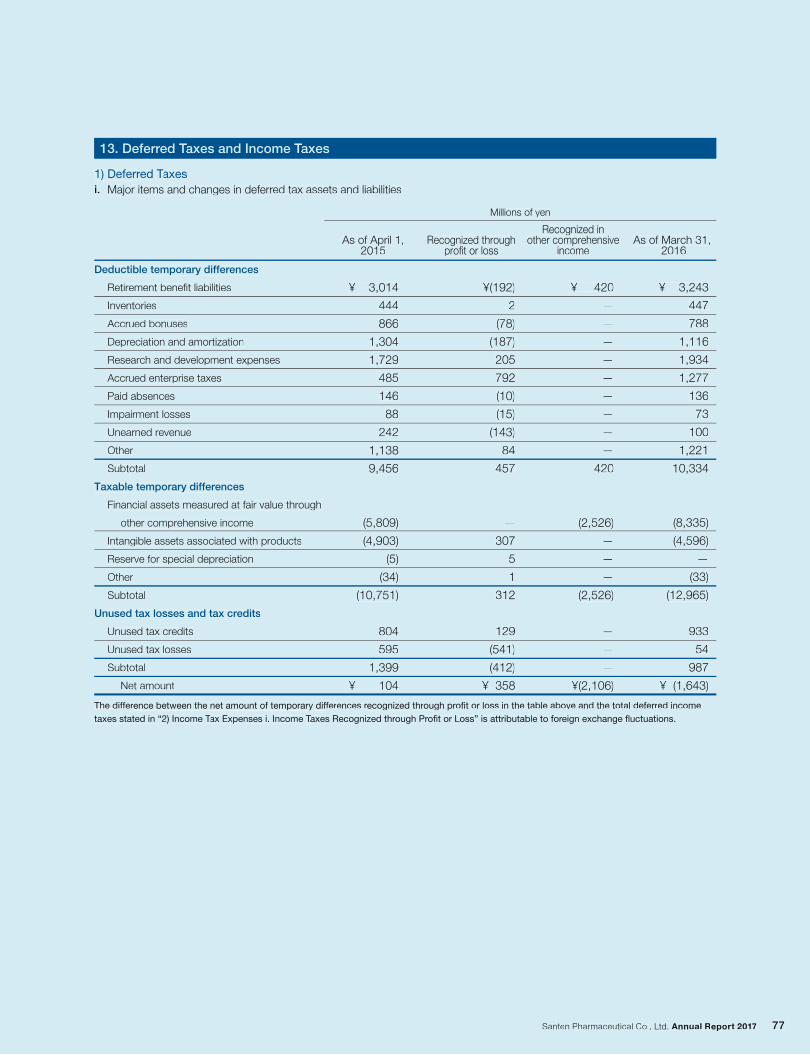
13. Deferred Taxes and Income Taxes
1) Deferred Taxes
i. Major items and changes in deferred tax assets and liabilities
The difference between the net amount of temporary differences recognized through profit or loss in the table above and the total deferred income
taxes stated in “2) Income Tax Expenses i. Income Taxes Recognized through Profit or Loss” is attributable to foreign exchange fluctuations.
Deductible temporary differences
Retirement benefit liabilities
Inventories
Accrued bonuses
Depreciation and amortization
Research and development expenses
Accrued enterprise taxes
Paid absences
Impairment losses
Unearned revenue
Other
Subtotal
Taxable temporary differences
Financial assets measured at fair value through
other comprehensive income
Intangible assets associated with products
Reserve for special depreciation
Other
Subtotal
Unused tax losses and tax credits
Unused tax credits
Unused tax losses
Subtotal
Net amount
¥ 420
—
—
—
—
—
—
—
—
—
420
(2,526)
—
—
—
(2,526)
—
—
—
¥(2,106)
¥(192)
2
(78)
(187)
205
792
(10)
(15)
(143)
84
457
—
307
5
1
312
129
(541)
(412)
¥ 358
As of March 31, 2016
¥ 3,243
447
788
1,116
1,934
1,277
136
73
100
1,221
10,334
(8,335)
(4,596)
—
(33)
(12,965)
933
54
987
¥ (1,643)
Millions of yen
Recognized throughprofit or loss
Recognized inother comprehensive
income
¥ 3,014
444
866
1,304
1,729
485
146
88
242
1,138
9,456
(5,809)
(4,903)
(5)
(34)
(10,751)
804
595
1,399
¥ 104
As of April 1,2015
13. Deferred Taxes and Income TTT axesTT
1) Deferred TaxesTT
i. Major items and changes in deferred tax assets and liabilities
The differff ence between the net amount of temporary differff ences recognized through profit or loss in the table above and the total deferred income
taxes stated in “2) Income Tax Expenses i. Income TTT axes Recognized thrTT ough Profit or Loss” is attributable to foreign exchange fluctuations.
Deductible temporary differences
Retirement benefit liabilities
Inventories
Accrued bonuses
Depreciation and amortization
Research and development expenses
Accrued enterprise taxes
Paid absences
Impairment losses
Unearned revenue
Other
Subtotal
Taxable temporary differences
Financial assets measured at fair value through
other comprehensive income
Intangible assets associated with products
Reserve for special depreciation
Other
Subtotal
Unused tax losses and tax credits
Unused tax credits
Unused tax losses
Subtotal
Net amount
¥ 420
—
—
—
—
—
—
—
—
—
420
(2,526)
—
—
—
(2,526)
—
—
—
¥(2,106)
¥(192)
2
(78)
(187)
205
792
(10)
(15)
(143)
84
457
—
307
5
1
312
129
(541)
(412)
¥ 358
As of March 31,2016
¥ 3,243
447
788
1,116
1,934
1,277
136
73
100
1,221
10,334
(8,335)
(4,596)
—
(33)
(12,965)
933
54
987
¥ (1,643)
Millions of yen
Recognized throughprofit or loss
Recognized inother comprehensive
income
¥ 3,014
444
866
1,304
1,729
485
146
88
242
1,138
9,456
(5,809)
(4,903)
(5)
(34)
(10,751)
804
595
1,399
¥ 104
As of April 1,2015
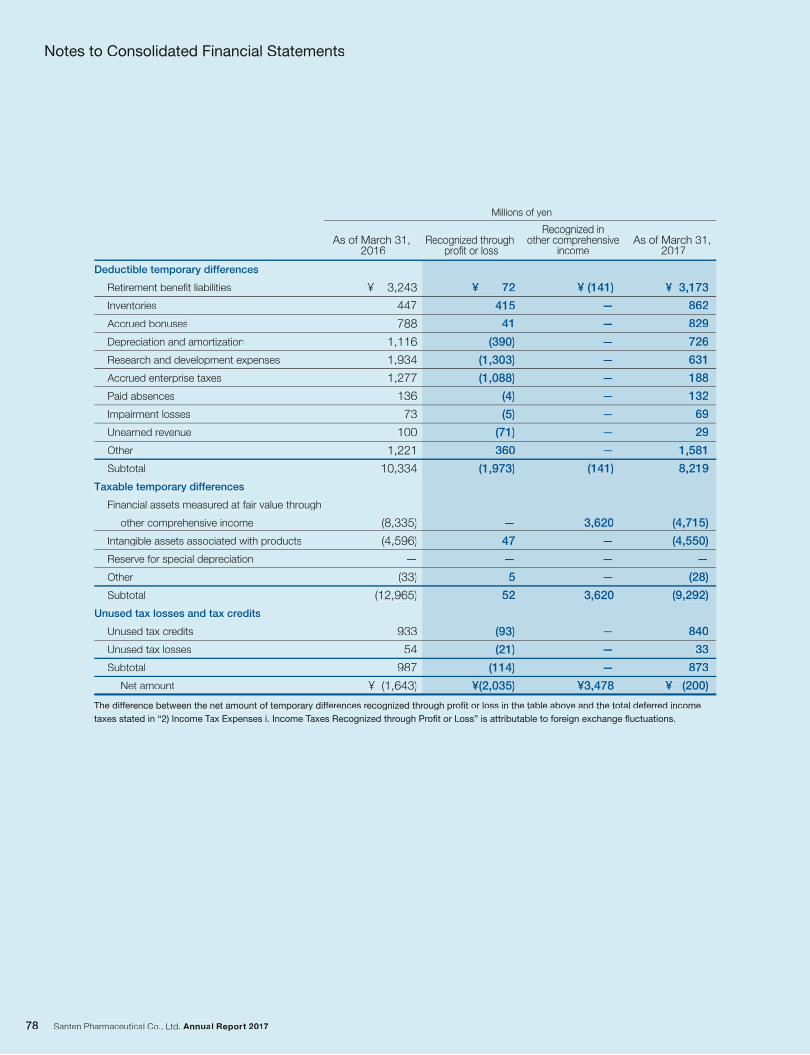
The difference between the net amount of temporary differences recognized through profit or loss in the table above and the total deferred income
taxes stated in “2) Income Tax Expenses i. Income Taxes Recognized through Profit or Loss” is attributable to foreign exchange fluctuations.
Millions of yen
Deductible temporary differences
Retirement benefit liabilities
Inventories
Accrued bonuses
Depreciation and amortization
Research and development expenses
Accrued enterprise taxes
Paid absences
Impairment losses
Unearned revenue
Other
Subtotal
Taxable temporary differences
Financial assets measured at fair value through
other comprehensive income
Intangible assets associated with products
Reserve for special depreciation
Other
Subtotal
Unused tax losses and tax credits
Unused tax credits
Unused tax losses
Subtotal
Net amount
¥ (141)
—
—
—
—
—
—
—
—
—
(141)
3,620
—
—
—
3,620
—
—
—
¥3,478
¥ 72
415
41
(390)
(1,303)
(1,088)
(4)
(5)
(71)
360
(1,973)
—
47
—
5
52
(93)
(21)
(114)
¥(2,035)
As of March 31, 2017
¥ 3,173
862
829
726
631
188
132
69
29
1,581
8,219
(4,715)
(4,550)
—
(28)
(9,292)
840
33
873
¥ (200)
Recognized through profit or loss
Recognized inother comprehensive
income
¥ 3,243
447
788
1,116
1,934
1,277
136
73
100
1,221
10,334
(8,335)
(4,596)
—
(33)
(12,965)
933
54
987
¥ (1,643)
As of March 31, 2016
Notes to Consolidated Financial Statements
The differff ence between the net amount of temporary differff ences recognized through profit or loss in the table above and the total deferred income
taxes stated in “2) Income Tax Expenses i. Income TTT axes Recognized thrTT ough Profit or Loss” is attributable to foreign exchange fluctuations.
Millions of yen
Deductible temporary differences
Retirement benefit liabilities
Inventories
Accrued bonuses
Depreciation and amortization
Research and development expenses
Accrued enterprise taxes
Paid absences
Impairment losses
Unearned revenue
Other
Subtotal
Taxable temporary differences
Financial assets measured at fair value through
other comprehensive income
Intangible assets associated with products
Reserve for special depreciation
Other
Subtotal
Unused tax losses and tax credits
Unused tax credits
Unused tax losses
Subtotal
Net amount
¥ (141)
—
—
—
—
—
—
—
—
—
(141)
3,620
—
—
—
3,620
—
—
—
¥3,478
¥ 72
415
41
(390)
(1,303)
(1,088)
(4)
(5)
(71)
360
(1,973)
—
47
—
5
52
(93)
(21)
(114)
¥(2,035)
As of March 31,2017
¥ 3,173
862
829
726
631
188
132
69
29
1,581
8,219
(4,715)
(4,550)
—
(28)
(9,292)
840
33
873
¥ (200)
Recognized through profit or loss
Recognized inother comprehensive
income
¥ 3,243
447
788
1,116
1,934
1,277
136
73
100
1,221
10,334
(8,335)
(4,596)
—
(33)
(12,965)
933
54
987
¥ (1,643)
As of March 31,2016
Notes to Consolidated Financial Statements
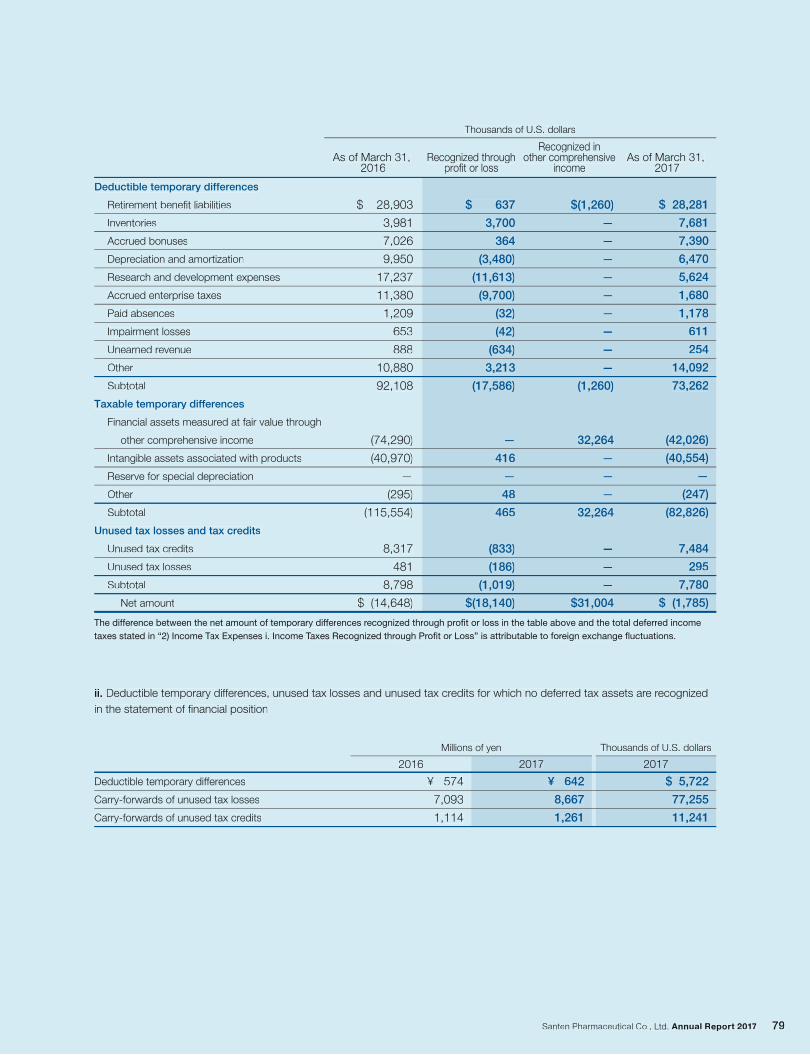
Millions of yen Thousands of U.S. dollars
20172016 2017
$ 5,722
77,255
11,241
¥ 574
7,093
1,114
¥ 642
8,667
1,261
Deductible temporary differences
Retirement benefit liabilities
Inventories
Accrued bonuses
Depreciation and amortization
Research and development expenses
Accrued enterprise taxes
Paid absences
Impairment losses
Unearned revenue
Other
Subtotal
Taxable temporary differences
Financial assets measured at fair value through
other comprehensive income
Intangible assets associated with products
Reserve for special depreciation
Other
Subtotal
Unused tax losses and tax credits
Unused tax credits
Unused tax losses
Subtotal
Net amount
Thousands of U.S. dollars
ii. Deductible temporary differences, unused tax losses and unused tax credits for which no deferred tax assets are recognized
in the statement of financial position
Deductible temporary differences
Carry-forwards of unused tax losses
Carry-forwards of unused tax credits
$(1,260)
—
—
—
—
—
—
—
—
—
(1,260)
32,264
—
—
—
32,264
—
—
—
$31,004
$ 637
3,700
364
(3,480)
(11,613)
(9,700)
(32)
(42)
(634)
3,213
(17,586)
—
416
—
48
465
(833)
(186)
(1,019)
$(18,140)
As of March 31, 2017
$ 28,281
7,681
7,390
6,470
5,624
1,680
1,178
611
254
14,092
73,262
(42,026)
(40,554)
—
(247)
(82,826)
7,484
295
7,780
$ (1,785)
Recognized throughprofit or loss
Recognized inother comprehensive
income
$ 28,903
3,981
7,026
9,950
17,237
11,380
1,209
653
888
10,880
92,108
(74,290)
(40,970)
—
(295)
(115,554)
8,317
481
8,798
$ (14,648)
As of March 31, 2016
The difference between the net amount of temporary differences recognized through profit or loss in the table above and the total deferred income
taxes stated in “2) Income Tax Expenses i. Income Taxes Recognized through Profit or Loss” is attributable to foreign exchange fluctuations.
Millions of yen Thousands of U.S. dollars
20172016 2017
$ 5,722
77,255
11,241
¥ 574
7,093
1,114
¥ 642
8,667
1,261
Deductible temporary differences
Retirement benefit liabilities
Inventories
Accrued bonuses
Depreciation and amortization
Research and development expenses
Accrued enterprise taxes
Paid absences
Impairment losses
Unearned revenue
Other
Subtotal
Taxable temporary differences
Financial assets measured at fair value through
other comprehensive income
Intangible assets associated with products
Reserve for special depreciation
Other
Subtotal
Unused tax losses and tax credits
Unused tax credits
Unused tax losses
Subtotal
Net amount
Thousands of U.S. dollars
ii. Deductible temporary differff ences, unused tax losses and unused tax credits for which no deferred tax assets are recognized
in the statement of financial position
Deductible temporary differences
Carry-forwards of unused tax losses
Carry-forwards of unused tax credits
$(1,260)
—
—
—
—
—
—
—
—
—
(1,260)
32,264
—
—
—
32,264
—
—
—
$31,004
$ 637
3,700
364
(3,480)
(11,613)
(9,700)
(32)
(42)
(634)
3,213
(17,586)
—
416
—
48
465
(833)
(186)
(1,019)
$(18,140)
As of March 31,2017
$ 28,281
7,681
7,390
6,470
5,624
1,680
1,178
611
254
14,092
73,262
(42,026)
(40,554)
—
(247)
(82,826)
7,484
295
7,780
$ (1,785)
Recognized throughprofit or loss
Recognized inother comprehensive
income
$ 28,903
3,981
7,026
9,950
17,237
11,380
1,209
653
888
10,880
92,108
(74,290)
(40,970)
—
(295)
(115,554)
8,317
481
8,798
$ (14,648)
As of March 31,2016
The differff ence between the net amount of temporary differff ences recognized through profit or loss in the table above and the total deferred income
taxes stated in “2) Income Tax Expenses i. Income TTT axes Recognized thrTT ough Profit or Loss” is attributable to foreign exchange fluctuations.
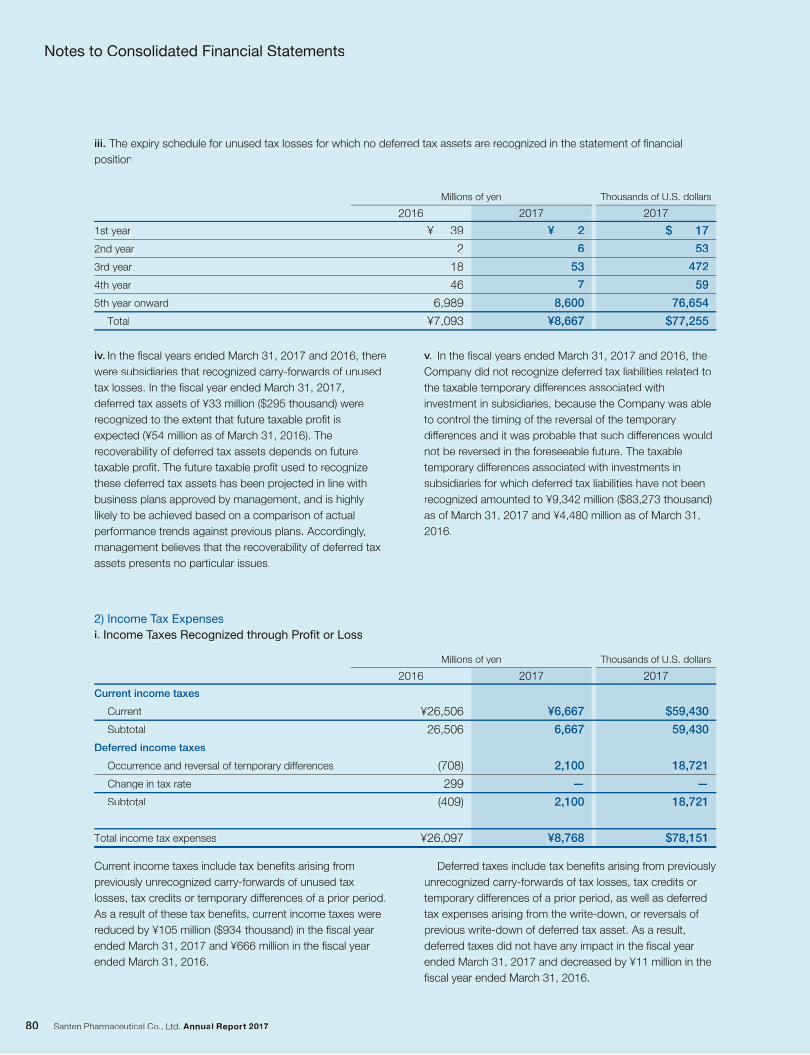
Millions of yen Thousands of U.S. dollars
20172016 2017
iii. The expiry schedule for unused tax losses for which no deferred tax assets are recognized in the statement of financial
position
1st year
2nd year
3rd year
4th year
5th year onward
Total
Current income taxes include tax benefits arising from
previously unrecognized carry-forwards of unused tax
losses, tax credits or temporary differences of a prior period.
As a result of these tax benefits, current income taxes were
reduced by ¥105 million ($934 thousand) in the fiscal year
ended March 31, 2017 and ¥666 million in the fiscal year
ended March 31, 2016.
Deferred taxes include tax benefits arising from previously
unrecognized carry-forwards of tax losses, tax credits or
temporary differences of a prior period, as well as deferred
tax expenses arising from the write-down, or reversals of
previous write-down of deferred tax asset. As a result,
deferred taxes did not have any impact in the fiscal year
ended March 31, 2017 and decreased by ¥11 million in the
fiscal year ended March 31, 2016.
iv. In the fiscal years ended March 31, 2017 and 2016, there
were subsidiaries that recognized carry-forwards of unused
tax losses. In the fiscal year ended March 31, 2017,
deferred tax assets of ¥33 million ($295 thousand) were
recognized to the extent that future taxable profit is
expected (¥54 million as of March 31, 2016). The
recoverability of deferred tax assets depends on future
taxable profit. The future taxable profit used to recognize
these deferred tax assets has been projected in line with
business plans approved by management, and is highly
likely to be achieved based on a comparison of actual
performance trends against previous plans. Accordingly,
management believes that the recoverability of deferred tax
assets presents no particular issues.
v. In the fiscal years ended March 31, 2017 and 2016, the
Company did not recognize deferred tax liabilities related to
the taxable temporary differences associated with
investment in subsidiaries, because the Company was able
to control the timing of the reversal of the temporary
differences and it was probable that such differences would
not be reversed in the foreseeable future. The taxable
temporary differences associated with investments in
subsidiaries for which deferred tax liabilities have not been
recognized amounted to ¥9,342 million ($83,273 thousand)
as of March 31, 2017 and ¥4,480 million as of March 31,
2016.
2) Income Tax Expenses
i. Income Taxes Recognized through Profit or Loss
Millions of yen Thousands of U.S. dollars
Current income taxes
Current
Subtotal
Deferred income taxes
Occurrence and reversal of temporary differences
Change in tax rate
Subtotal
Total income tax expenses
Notes to Consolidated Financial Statements
$ 17
53
472
59
76,654
$77,255
¥ 39
2
18
46
6,989
¥7,093
¥ 2
6
53
7
8,600
¥8,667
2017
$59,430
59,430
18,721
—
18,721
$78,151
2016
¥26,506
26,506
(708)
299
(409)
¥26,097
2017
¥6,667
6,667
2,100
—
2,100
¥8,768
Millions of yen Thousands of U.S. dollars
20172016 2017
iii. The expiry schedule for unused tax losses for which no deferred tax assets are recognized in the statement of financial
position
1st year
2nd year
3rd year
4th year
5th year onward
Total
Current income taxes include tax benefits arising from
previously unrecognized carry-forwards of unused tax
losses, tax credits or temporary differff ences of a prior period.
As a result of these tax benefits, current income taxes were
reduced by ¥105 million ($934 thousand) in the fiscal year
ended March 31, 2017 and ¥666 million in the fiscal year
ended March 31, 2016.
Deferred taxes include tax benefits arising from previously
unrecognized carry-forwards of tax losses, tax credits or
temporary differff ences of a prior period, as well as deferred
tax expenses arising from the write-down, or reversals of
previous write-down of deferred tax asset. As a result,
deferred taxes did not have any impact in the fiscal year
ended March 31, 2017 and decreased by ¥11 million in the
fiscal year ended March 31, 2016.
iv. In the fiscal years ended March 31, 2017 and 2016, there
were subsidiaries that recognized carry-forwards of unused
tax losses. In the fiscal year ended March 31, 2017,
deferred tax assets of ¥33 million ($295 thousand) were
recognized to the extent that future taxable profit is
expected (¥54 million as of March 31, 2016). The
recoverability of deferred tax assets depends on future
taxable profit. The future taxable profit used to recognize
these deferred tax assets has been projected in line with
business plans approved by management, and is highly
likely to be achieved based on a comparison of actual
performance trends against previous plans. Accordingly,
management believes that the recoverability of deferred tax
assets presents no particular issues.
v. In the fiscal years ended March 31, 2017 and 2016, the
Company did not recognize deferred tax liabilities related to
the taxable temporary differff ences associated with
investment in subsidiaries, because the Company was able
to control the timing of the reversal of the temporary
differff ences and it was probable that such differff ences would
not be reversed in the foreseeable future. The taxable
temporary differff ences associated with investments in
subsidiaries for which deferred tax liabilities have not been
recognized amounted to ¥9,342 million ($83,273 thousand)
as of March 31, 2017 and ¥4,480 million as of March 31,
2016.
2) Income Tax ExpensesTT
i. Income Taxes Recognized thrTT ough Profit or Loss
Millions of yen Thousands of U.S. dollars
Current income taxes
Current
Subtotal
Deferred income taxes
Occurrence and reversal of temporary differences
Change in tax rate
Subtotal
Total income tax expenses
Notes to Consolidated Financial Statements
$ 17
53
472
59
76,654
$77,255
¥ 39
2
18
46
6,989
¥7,093
¥ 2
6
53
7
8,600
¥8,667
2017
$59,430
59,430
18,721
—
18,721
$78,151
2016
¥26,506
26,506
(708)
299
(409)
¥26,097
2017
¥6,667
6,667
2,100
—
2,100
¥8,768
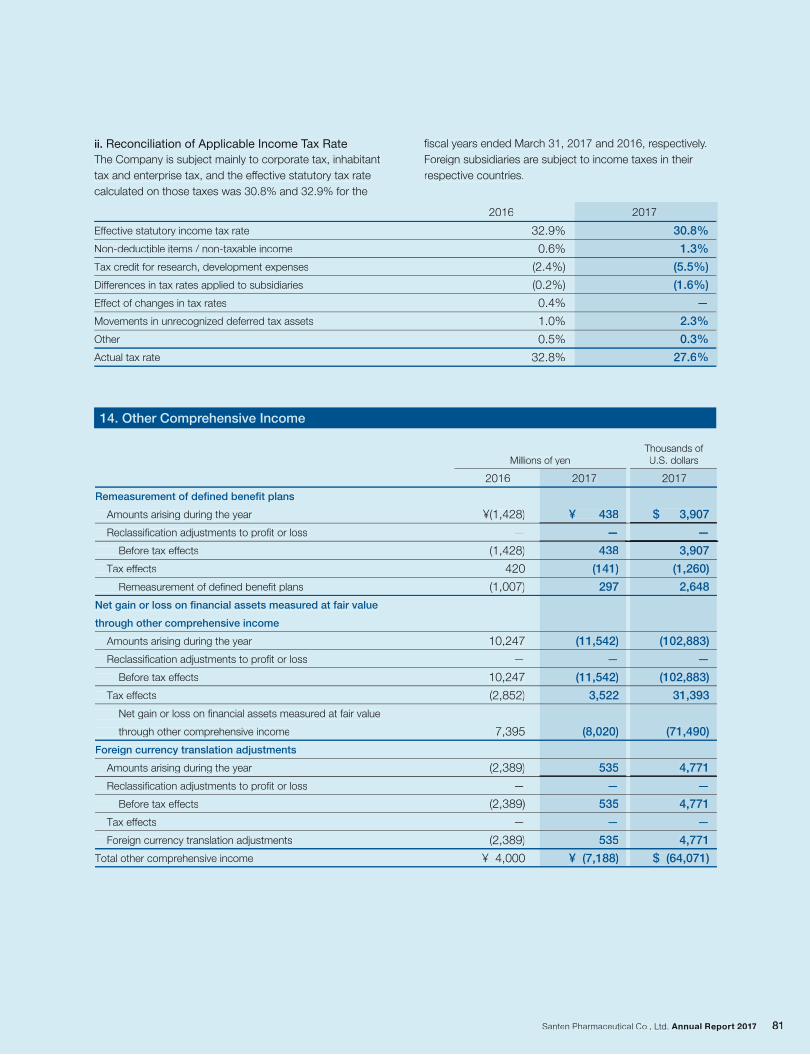
14. Other Comprehensive Income
ii. Reconciliation of Applicable Income Tax Rate
The Company is subject mainly to corporate tax, inhabitant
tax and enterprise tax, and the effective statutory tax rate
calculated on those taxes was 30.8% and 32.9% for the
fiscal years ended March 31, 2017 and 2016, respectively.
Foreign subsidiaries are subject to income taxes in their
respective countries.
32.9%
0.6%
(2.4%)
(0.2%)
0.4%
1.0%
0.5%
32.8%
30.8%
1.3%
(5.5%)
(1.6%)
—
2.3%
0.3%
27.6%
2016 2017
Effective statutory income tax rate
Non-deductible items / non-taxable income
Tax credit for research, development expenses
Differences in tax rates applied to subsidiaries
Effect of changes in tax rates
Movements in unrecognized deferred tax assets
Other
Actual tax rate
Remeasurement of defined benefit plans
Amounts arising during the year
Reclassification adjustments to profit or loss
Before tax effects
Tax effects
Remeasurement of defined benefit plans
Net gain or loss on financial assets measured at fair value
through other comprehensive income
Amounts arising during the year
Reclassification adjustments to profit or loss
Before tax effects
Tax effects
Net gain or loss on financial assets measured at fair value
through other comprehensive income
Foreign currency translation adjustments
Amounts arising during the year
Reclassification adjustments to profit or loss
Before tax effects
Tax effects
Foreign currency translation adjustments
Total other comprehensive income
Millions of yenThousands ofU.S. dollars
2017
$ 3,907
—
3,907
(1,260)
2,648
(102,883)
—
(102,883)
31,393
(71,490)
4,771
—
4,771
—
4,771
$ (64,071)
2016 2017
¥(1,428)
—
(1,428)
420
(1,007)
10,247
—
10,247
(2,852)
7,395
(2,389)
—
(2,389)
—
(2,389)
¥ 4,000
¥ 438
—
438
(141)
297
(11,542)
—
(11,542)
3,522
(8,020)
535
—
535
—
535
¥ (7,188)
14. Other Comprehensive Income
ii. Reconciliation of Applicable Income Tax RateTT
The Company is subject mainly to corporate tax, inhabitant
tax and enterprise tax, and the effective statutory tax rateff
calculated on those taxes was 30.8% and 32.9% for the
fiscal years ended March 31, 2017 and 2016, respectively.
Foreign subsidiaries are subject to income taxes in their
respective countries.
32.9%
0.6%
(2.4%)
(0.2%)
0.4%
1.0%
0.5%
32.8%
30.8%
1.3%
(5.5%)
(1.6%)
—
2.3%
0.3%
27.6%
2016 2017
Effective statutory income tax rate
Non-deductible items / non-taxable income
Tax credit for research, development expenses
Differences in tax rates applied to subsidiaries
Effect of changes in tax rates
Movements in unrecognized deferred tax assets
Other
Actual tax rate
Remeasurement of defined benefit plans
Amounts arising during the year
Reclassification adjustments to profit or loss
Before tax effects
Tax effects
Remeasurement of defined benefit plans
Net gain or loss on financial assets measured at fair value
through other comprehensive income
Amounts arising during the year
Reclassification adjustments to profit or loss
Before tax effects
Tax effects
Net gain or loss on financial assets measured at fair value
through other comprehensive income
Foreign currency translation adjustments
Amounts arising during the year
Reclassification adjustments to profit or loss
Before tax effects
Tax effects
Foreign currency translation adjustments
Total other comprehensive income
Millions of yenThousands ofU.S. dollars
2017
$ 3,907
—
3,907
(1,260)
2,648
(102,883)
—
(102,883)
31,393
(71,490)
4,771
—
4,771
—
4,771
$ (64,071)
2016 2017
¥(1,428)
—
(1,428)
420
(1,007)
10,247
—
10,247
(2,852)
7,395
(2,389)
—
(2,389)
—
(2,389)
¥ 4,000
¥ 438
—
438
(141)
297
(11,542)
—
(11,542)
3,522
(8,020)
535
—
535
—
535
¥ (7,188)
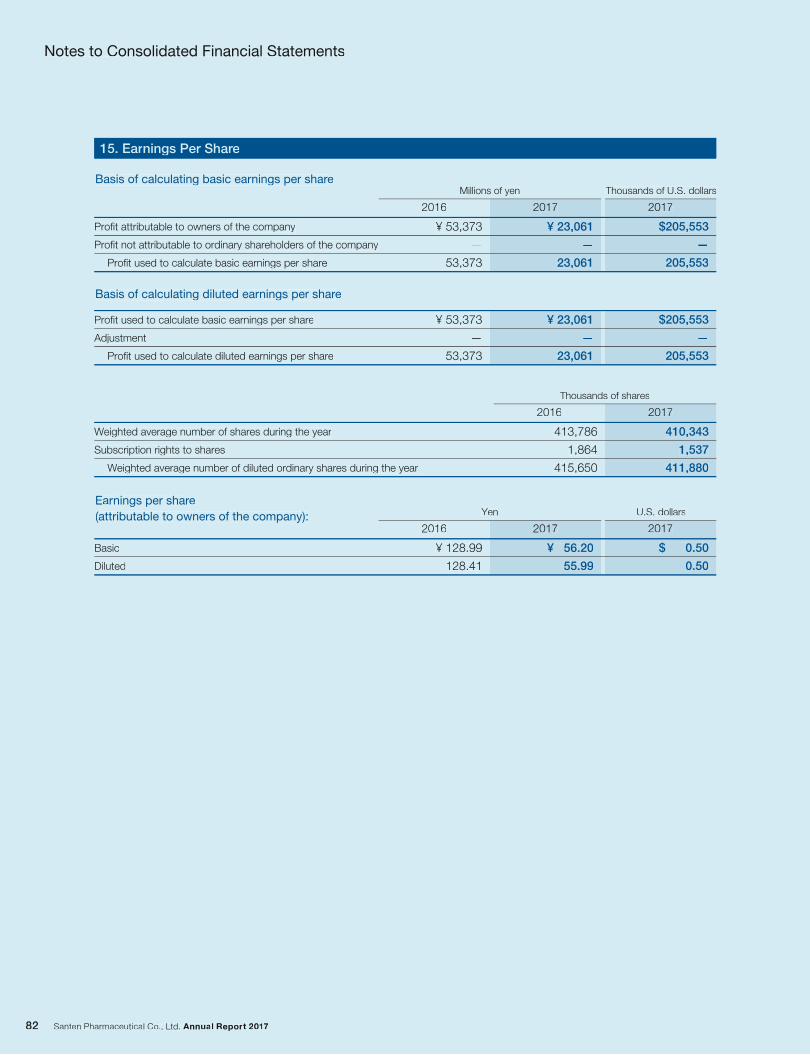
15. Earnings Per Share
Profit attributable to owners of the company
Profit not attributable to ordinary shareholders of the company
Profit used to calculate basic earnings per share
Millions of yen Thousands of U.S. dollarsBasis of calculating basic earnings per share
Earnings per share
(attributable to owners of the company):
Basic
Diluted
Yen U.S. dollars
Weighted average number of shares during the year
Subscription rights to shares
Weighted average number of diluted ordinary shares during the year
Thousands of shares
Profit used to calculate basic earnings per share
Adjustment
Profit used to calculate diluted earnings per share
Basis of calculating diluted earnings per share
Notes to Consolidated Financial Statements
2017
¥ 23,061
—
23,061
2016
¥ 53,373
—
53,373
2017
$205,553
—
205,553
2017
¥ 56.20
55.99
2016
¥ 128.99
128.41
2017
$ 0.50
0.50
2017
410,343
1,537
411,880
2016
413,786
1,864
415,650
¥ 23,061
—
23,061
¥ 53,373
—
53,373
$205,553
—
205,553
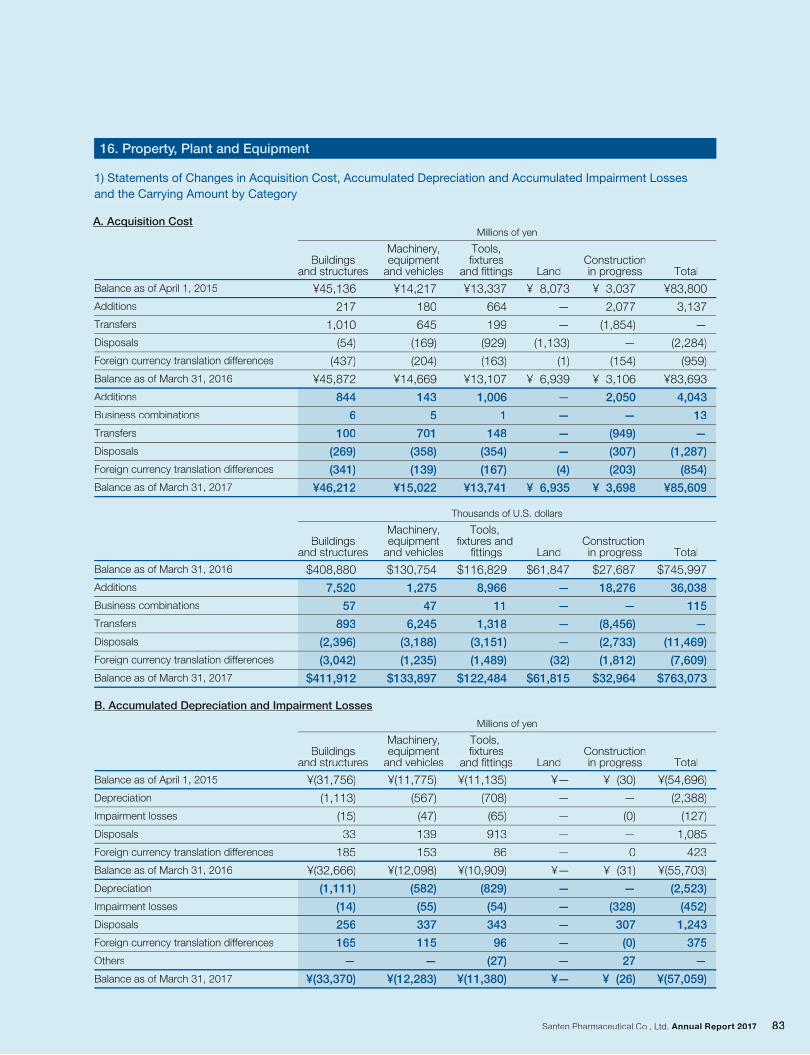
16. Property, Plant and Equipment
1) Statements of Changes in Acquisition Cost, Accumulated Depreciation and Accumulated Impairment Losses
and the Carrying Amount by Category
Millions of yen
¥83,800
3,137
—
(2,284)
(959)
¥83,693
4,043
13
—
(1,287)
(854)
¥85,609
Total
¥13,337
664
199
(929)
(163)
¥13,107
1,006
1
148
(354)
(167)
¥13,741
Tools,fixtures
and fittings
¥ 3,037
2,077
(1,854)
—
(154)
¥ 3,106
2,050
—
(949)
(307)
(203)
¥ 3,698
Constructionin progress
¥ 8,073
—
—
(1,133)
(1)
¥ 6,939
—
—
—
—
(4)
¥ 6,935
Land
¥14,217
180
645
(169)
(204)
¥14,669
143
5
701
(358)
(139)
¥15,022
Machinery,equipment
and vehicles
¥45,136
217
1,010
(54)
(437)
¥45,872
844
6
100
(269)
(341)
¥46,212
Buildingsand structures
Balance as of April 1, 2015
Additions
Transfers
Disposals
Foreign currency translation differences
Balance as of March 31, 2016
Additions
Business combinations
Transfers
Disposals
Foreign currency translation differences
Balance as of March 31, 2017
Thousands of U.S. dollars
$745,997
36,038
115
—
(11,469)
(7,609)
$763,073
Total
$116,829
8,966
11
1,318
(3,151)
(1,489)
$122,484
Tools, fixtures and
fittings
$27,687
18,276
—
(8,456)
(2,733)
(1,812)
$32,964
Construction in progress
$61,847
—
—
—
—
(32)
$61,815
Land
$130,754
1,275
47
6,245
(3,188)
(1,235)
$133,897
Machinery,equipment
and vehicles
$408,880
7,520
57
893
(2,396)
(3,042)
$411,912
Buildingsand structures
Balance as of March 31, 2016
Additions
Business combinations
Transfers
Disposals
Foreign currency translation differences
Balance as of March 31, 2017
Millions of yen
¥(54,696)
(2,388)
(127)
1,085
423
¥(55,703)
(2,523)
(452)
1,243
375
—
¥(57,059)
Total
¥(11,135)
(708)
(65)
913
86
¥(10,909)
(829)
(54)
343
96
(27)
¥(11,380)
Tools, fixtures
and fittings
¥ (30)
—
(0)
—
0
¥ (31)
—
(328)
307
(0)
27
¥ (26)
Constructionin progress
¥—
—
—
—
—
¥—
—
—
—
—
—
¥—
Land
¥(11,775)
(567)
(47)
139
153
¥(12,098)
(582)
(55)
337
115
—
¥(12,283)
Machinery,equipment
and vehicles
¥(31,756)
(1,113)
(15)
33
185
¥(32,666)
(1,111)
(14)
256
165
—
¥(33,370)
Buildingsand structures
Balance as of April 1, 2015
Depreciation
Impairment losses
Disposals
Foreign currency translation differences
Balance as of March 31, 2016
Depreciation
Impairment losses
Disposals
Foreign currency translation differences
Others
Balance as of March 31, 2017
A. Acquisition Cost
B. Accumulated Depreciation and Impairment Losses
16. Property, Plant and Equipmentyy
1) Statements of Changes in Acquisition Cost, Accumulated Depreciation and Accumulated Impairment Losses
and the Carrying Amount by Category
Millions of yen
¥83,800
3,137
—
(2,284)
(959)
¥83,693
4,043
13
—
(1,287)
(854)
¥85,609
Total
¥13,337
664
199
(929)
(163)
¥13,107
1,006
1
148
(354)
(167)
¥13,741
Tools,fixtures
and fittings
¥ 3,037
2,077
(1,854)
—
(154)
¥ 3,106
2,050
—
(949)
(307)
(203)
¥ 3,698
Constructionin progress
¥ 8,073
—
—
(1,133)
(1)
¥ 6,939
—
—
—
—
(4)
¥ 6,935
Land
¥14,217
180
645
(169)
(204)
¥14,669
143
5
701
(358)
(139)
¥15,022
Machinery,equipment
and vehicles
¥45,136
217
1,010
(54)
(437)
¥45,872
844
6
100
(269)
(341)
¥46,212
Buildingsand structures
Balance as of April 1, 2015
Additions
Transfers
Disposals
Foreign currency translation differences
Balance as of March 31, 2016
Additions
Business combinations
Transfers
Disposals
Foreign currency translation differences
Balance as of March 31, 2017
Thousands of U.S. dollars
$745,997
36,038
115
—
(11,469)
(7,609)
$763,073
Total
$116,829
8,966
11
1,318
(3,151)
(1,489)
$122,484
Tools,fixtures and
fittings
$27,687
18,276
—
(8,456)
(2,733)
(1,812)
$32,964
Constructionin progress
$61,847
—
—
—
—
(32)
$61,815
Land
$130,754
1,275
47
6,245
(3,188)
(1,235)
$133,897
Machinery,equipment
and vehicles
$408,880
7,520
57
893
(2,396)
(3,042)
$411,912
Buildingsand structures
Balance as of March 31, 2016
Additions
Business combinations
Transfers
Disposals
Foreign currency translation differences
Balance as of March 31, 2017
Millions of yen
¥(54,696)
(2,388)
(127)
1,085
423
¥(55,703)
(2,523)
(452)
1,243
375
—
¥(57,059)
Total
¥(11,135)
(708)
(65)
913
86
¥(10,909)
(829)
(54)
343
96
(27)
¥(11,380)
Tools,fixtures
and fittings
¥ (30)
—
(0)
—
0
¥ (31)
—
(328)
307
(0)
27
¥ (26)
Constructionin progress
¥—
—
—
—
—
¥—
—
—
—
—
—
¥—
Land
¥(11,775)
(567)
(47)
139
153
¥(12,098)
(582)
(55)
337
115
—
¥(12,283)
Machinery,equipment
and vehicles
¥(31,756)
(1,113)
(15)
33
185
¥(32,666)
(1,111)
(14)
256
165
—
¥(33,370)
Buildingsand structures
Balance as of April 1, 2015
Depreciation
Impairment losses
Disposals
Foreign currency translation differences
Balance as of March 31, 2016
Depreciation
Impairment losses
Disposals
Foreign currency translation differences
Others
Balance as of March 31, 2017
A. Acquisition Cost
B. Accumulated Depreciation and Impairment Losses
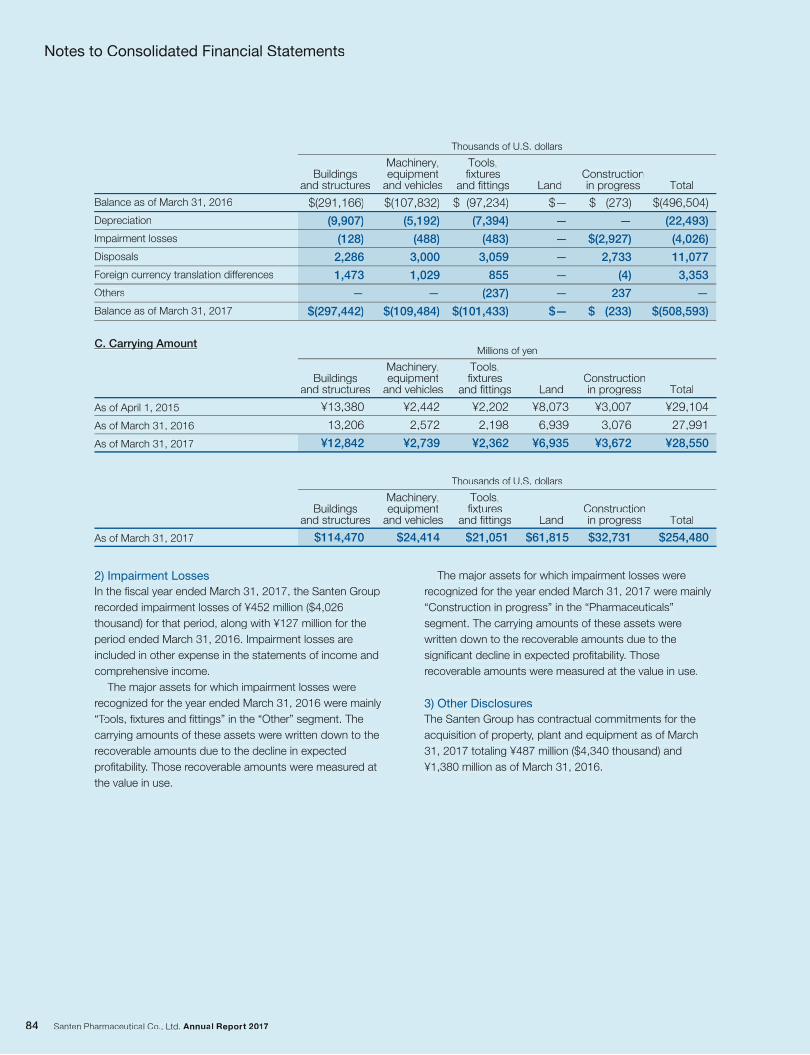
2) Impairment Losses
In the fiscal year ended March 31, 2017, the Santen Group
recorded impairment losses of ¥452 million ($4,026
thousand) for that period, along with ¥127 million for the
period ended March 31, 2016. Impairment losses are
included in other expense in the statements of income and
comprehensive income.
The major assets for which impairment losses were
recognized for the year ended March 31, 2016 were mainly
“Tools, fixtures and fittings” in the “Other” segment. The
carrying amounts of these assets were written down to the
recoverable amounts due to the decline in expected
profitability. Those recoverable amounts were measured at
the value in use.
The major assets for which impairment losses were
recognized for the year ended March 31, 2017 were mainly
“Construction in progress” in the “Pharmaceuticals”
segment. The carrying amounts of these assets were
written down to the recoverable amounts due to the
significant decline in expected profitability. Those
recoverable amounts were measured at the value in use.
3) Other Disclosures
The Santen Group has contractual commitments for the
acquisition of property, plant and equipment as of March
31, 2017 totaling ¥487 million ($4,340 thousand) and
¥1,380 million as of March 31, 2016.
Thousands of U.S. dollars
$(496,504)
(22,493)
(4,026)
11,077
3,353
—
$(508,593)
Total
$ (97,234)
(7,394)
(483)
3,059
855
(237)
$(101,433)
Tools,fixtures
and fittings
$ (273)
—
$(2,927)
2,733
(4)
237
$ (233)
Constructionin progress
$—
—
—
—
—
—
$—
Land
$(107,832)
(5,192)
(488)
3,000
1,029
—
$(109,484)
Machinery,equipment
and vehicles
$(291,166)
(9,907)
(128)
2,286
1,473
—
$(297,442)
Buildingsand structures
Balance as of March 31, 2016
Depreciation
Impairment losses
Disposals
Foreign currency translation differences
Others
Balance as of March 31, 2017
Millions of yen
¥29,104
27,991
¥28,550
Total
¥2,202
2,198
¥2,362
Tools,fixtures
and fittings
¥3,007
3,076
¥3,672
Constructionin progress
¥8,073
6,939
¥6,935
Land
¥2,442
2,572
¥2,739
Machinery,equipment
and vehicles
¥13,380
13,206
¥12,842
Buildingsand structures
As of April 1, 2015
As of March 31, 2016
As of March 31, 2017
Thousands of U.S. dollars
$254,480
Total
$21,051
Tools,fixtures
and fittings
$32,731
Constructionin progress
$61,815
Land
$24,414
Machinery,equipment
and vehicles
$114,470
Buildingsand structures
As of March 31, 2017
C. Carrying Amount
Notes to Consolidated Financial Statements
2) Impairment Losses
In the fiscal year ended March 31, 2017, the Santen Group
recorded impairment losses of ¥452 million ($4,026
thousand) for that period, along with ¥127 million for the
period ended March 31, 2016. Impairment losses are
included in other expense in the statements of income and
comprehensive income.
The major assets for which impairment losses were
recognized for the year ended March 31, 2016 were mainly
“Tools, fixturTT es and fittings” in the “Other” segment. The
carrying amounts of these assets were written down to the
recoverable amounts due to the decline in expected
profitability. Those recoverable amounts were measured at
the value in use.
The major assets for which impairment losses were
recognized for the year ended March 31, 2017 were mainly
“Construction in progress” in the “Pharmaceuticals”
segment. The carrying amounts of these assets were
written down to the recoverable amounts due to the
significant decline in expected profitability. Those
recoverable amounts were measured at the value in use.
3) Other Disclosures
The Santen Group has contractual commitments for the
acquisition of property, plant and equipment as of March
31, 2017 totaling ¥487 million ($4,340 thousand) and
¥1,380 million as of March 31, 2016.
Thousands of U.S. dollars
$(496,504)
(22,493)
(4,026)
11,077
3,353
—
$(508,593)
Total
$ (97,234)
(7,394)
(483)
3,059
855
(237)
$(101,433)
Tools,fixtures
and fittings
$ (273)
—
$(2,927)
2,733
(4)
237
$ (233)
Constructionin progress
$—
—
—
—
—
—
$—
Land
$(107,832)
(5,192)
(488)
3,000
1,029
—
$(109,484)
Machinery,equipment
and vehicles
$(291,166)
(9,907)
(128)
2,286
1,473
—
$(297,442)
Buildingsand structures
Balance as of March 31, 2016
Depreciation
Impairment losses
Disposals
Foreign currency translation differences
Others
Balance as of March 31, 2017
Millions of yen
¥29,104
27,991
¥28,550
Total
¥2,202
2,198
¥2,362
Tools,fixtures
and fittings
¥3,007
3,076
¥3,672
Constructionin progress
¥8,073
6,939
¥6,935
Land
¥2,442
2,572
¥2,739
Machinery,equipment
and vehicles
¥13,380
13,206
¥12,842
Buildingsand structures
As of April 1, 2015
As of March 31, 2016
As of March 31, 2017
Thousands of U.S. dollars
$254,480
Total
$21,051
Tools,fixtures
and fittings
$32,731
Constructionin progress
$61,815
Land
$24,414
Machinery,equipment
and vehicles
$114,470
Buildingsand structures
As of March 31, 2017
C. Carrying Amount
Notes to Consolidated Financial Statements
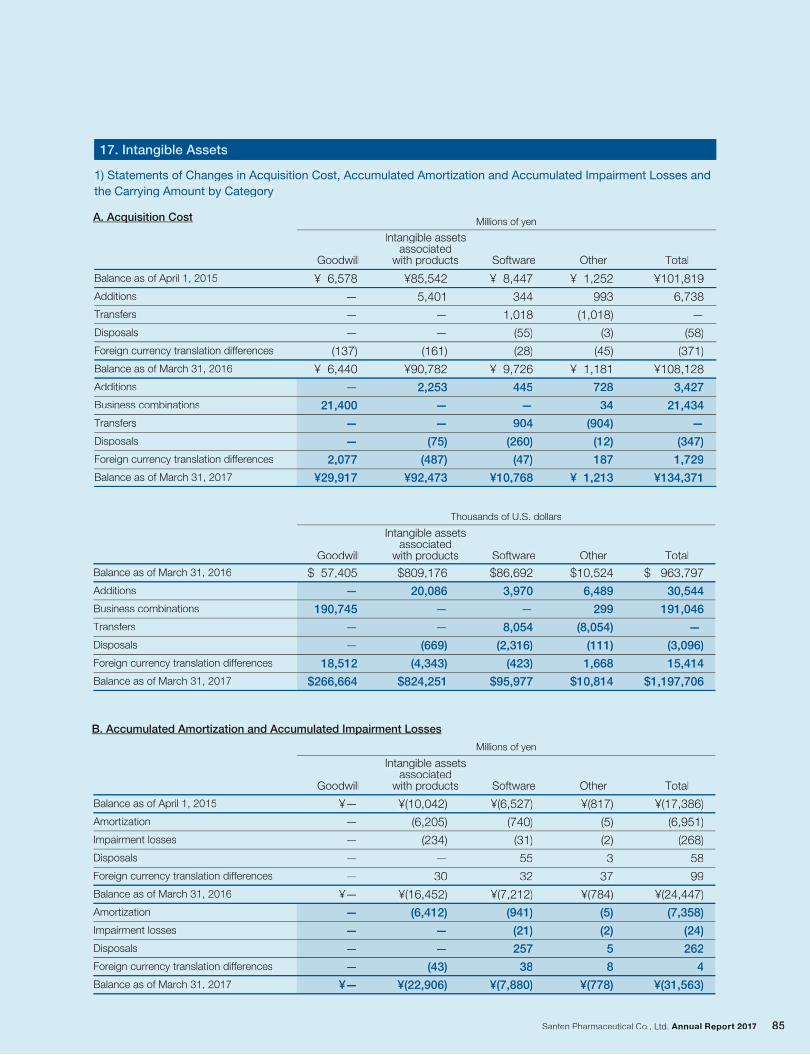
Total
17. Intangible Assets
1) Statements of Changes in Acquisition Cost, Accumulated Amortization and Accumulated Impairment Losses and
the Carrying Amount by Category
Thousands of U.S. dollars
$ 963,797
30,544
191,046
—
(3,096)
15,414
$1,197,706
Total
$86,692
3,970
—
8,054
(2,316)
(423)
$95,977
Software
$10,524
6,489
299
(8,054)
(111)
1,668
$10,814
Other
$809,176
20,086
—
—
(669)
(4,343)
$824,251
Intangible assetsassociated
with products
$ 57,405
—
190,745
—
—
18,512
$266,664
Goodwill
TotalSoftware Other
Intangible assetsassociated
with productsGoodwill
Balance as of March 31, 2016
Additions
Business combinations
Transfers
Disposals
Foreign currency translation differences
Balance as of March 31, 2017
Millions of yen
¥101,819
6,738
—
(58)
(371)
¥108,128
3,427
21,434
—
(347)
1,729
¥134,371
¥ 1,252
993
(1,018)
(3)
(45)
¥ 1,181
728
34
(904)
(12)
187
¥ 1,213
¥ 8,447
344
1,018
(55)
(28)
¥ 9,726
445
—
904
(260)
(47)
¥10,768
¥85,542
5,401
—
—
(161)
¥90,782
2,253
—
—
(75)
(487)
¥92,473
¥ 6,578
—
—
—
(137)
¥ 6,440
—
21,400
—
—
2,077
¥29,917
Balance as of April 1, 2015
Additions
Transfers
Disposals
Foreign currency translation differences
Balance as of March 31, 2016
Additions
Business combinations
Transfers
Disposals
Foreign currency translation differences
Balance as of March 31, 2017
Millions of yen
Software Other
Intangible assetsassociated
with productsGoodwill
¥(17,386)
(6,951)
(268)
58
99
¥(24,447)
(7,358)
(24)
262
4
¥(31,563)
¥(817)
(5)
(2)
3
37
¥(784)
(5)
(2)
5
8
¥(778)
¥(6,527)
(740)
(31)
55
32
¥(7,212)
(941)
(21)
257
38
¥(7,880)
¥(10,042)
(6,205)
(234)
—
30
¥(16,452)
(6,412)
—
—
(43)
¥(22,906)
¥—
—
—
—
—
¥—
—
—
—
—
¥—
Balance as of April 1, 2015
Amortization
Impairment losses
Disposals
Foreign currency translation differences
Balance as of March 31, 2016
Amortization
Impairment losses
Disposals
Foreign currency translation differences
Balance as of March 31, 2017
A. Acquisition Cost
B. Accumulated Amortization and Accumulated Impairment Losses
Total
17. Intangible Assets
1) Statements of Changes in Acquisition Cost, Accumulated Amortization and Accumulated Impairment Losses and
the Carrying Amount by Category
Thousands of U.S. dollars
$ 963,797
30,544
191,046
—
(3,096)
15,414
$1,197,706
Total
$86,692
3,970
—
8,054
(2,316)
(423)
$95,977
Software
$10,524
6,489
299
(8,054)
(111)
1,668
$10,814
Other
$809,176
20,086
—
—
(669)
(4,343)
$824,251
Intangible assetsassociated
with products
$ 57,405
—
190,745
—
—
18,512
$266,664
Goodwill
TotalSoftware Other
Intangible assetsassociated
with productsGoodwill
Balance as of March 31, 2016
Additions
Business combinations
Transfers
Disposals
Foreign currency translation differences
Balance as of March 31, 2017
Millions of yen
¥101,819
6,738
—
(58)
(371)
¥108,128
3,427
21,434
—
(347)
1,729
¥134,371
¥ 1,252
993
(1,018)
(3)
(45)
¥ 1,181
728
34
(904)
(12)
187
¥ 1,213
¥ 8,447
344
1,018
(55)
(28)
¥ 9,726
445
—
904
(260)
(47)
¥10,768
¥85,542
5,401
—
—
(161)
¥90,782
2,253
—
—
(75)
(487)
¥92,473
¥ 6,578
—
—
—
(137)
¥ 6,440
—
21,400
—
—
2,077
¥29,917
Balance as of April 1, 2015
Additions
Transfers
Disposals
Foreign currency translation differences
Balance as of March 31, 2016
Additions
Business combinations
Transfers
Disposals
Foreign currency translation differences
Balance as of March 31, 2017
Millions of yen
Software Other
Intangible assetsassociated
with productsGoodwill
¥(17,386)
(6,951)
(268)
58
99
¥(24,447)
(7,358)
(24)
262
4
¥(31,563)
¥(817)
(5)
(2)
3
37
¥(784)
(5)
(2)
5
8
¥(778)
¥(6,527)
(740)
(31)
55
32
¥(7,212)
(941)
(21)
257
38
¥(7,880)
¥(10,042)
(6,205)
(234)
—
30
¥(16,452)
(6,412)
—
—
(43)
¥(22,906)
¥—
—
—
—
—
¥—
—
—
—
—
¥—
Balance as of April 1, 2015
Amortization
Impairment losses
Disposals
Foreign currency translation differences
Balance as of March 31, 2016
Amortization
Impairment losses
Disposals
Foreign currency translation differences
Balance as of March 31, 2017
A. Acquisition Cost
B. Accumulated Amortization and Accumulated Impairment Losses
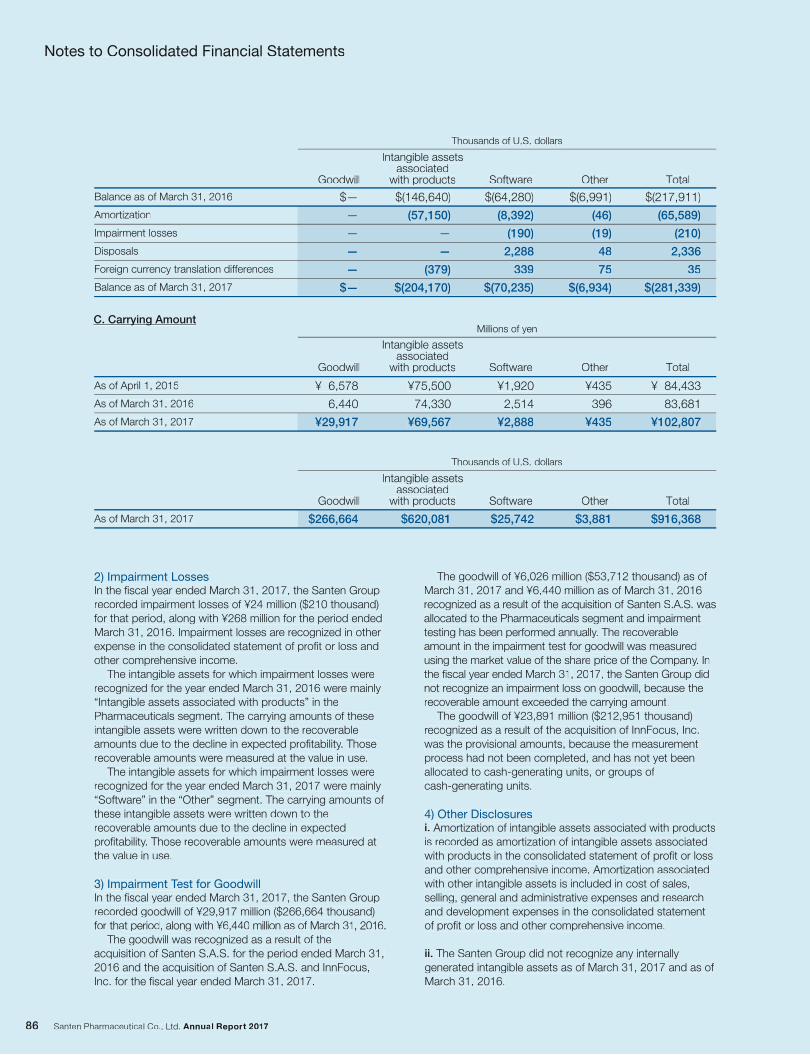
2) Impairment LossesIn the fiscal year ended March 31, 2017, the Santen Group recorded impairment losses of ¥24 million ($210 thousand) for that period, along with ¥268 million for the period ended March 31, 2016. Impairment losses are recognized in other expense in the consolidated statement of profit or loss and other comprehensive income. The intangible assets for which impairment losses were recognized for the year ended March 31, 2016 were mainly “Intangible assets associated with products” in the Pharmaceuticals segment. The carrying amounts of these intangible assets were written down to the recoverable amounts due to the decline in expected profitability. Those recoverable amounts were measured at the value in use. The intangible assets for which impairment losses were recognized for the year ended March 31, 2017 were mainly “Software” in the “Other” segment. The carrying amounts of these intangible assets were written down to the recoverable amounts due to the decline in expected profitability. Those recoverable amounts were measured at the value in use.
3) Impairment Test for GoodwillIn the fiscal year ended March 31, 2017, the Santen Group recorded goodwill of ¥29,917 million ($266,664 thousand) for that period, along with ¥6,440 million as of March 31, 2016. The goodwill was recognized as a result of the acquisition of Santen S.A.S. for the period ended March 31, 2016 and the acquisition of Santen S.A.S. and InnFocus, Inc. for the fiscal year ended March 31, 2017.
The goodwill of ¥6,026 million ($53,712 thousand) as of March 31, 2017 and ¥6,440 million as of March 31, 2016 recognized as a result of the acquisition of Santen S.A.S. was allocated to the Pharmaceuticals segment and impairment testing has been performed annually. The recoverable amount in the impairment test for goodwill was measured using the market value of the share price of the Company. In the fiscal year ended March 31, 2017, the Santen Group did not recognize an impairment loss on goodwill, because the recoverable amount exceeded the carrying amount. The goodwill of ¥23,891 million ($212,951 thousand) recognized as a result of the acquisition of InnFocus, Inc. was the provisional amounts, because the measurement process had not been completed, and has not yet been allocated to cash-generating units, or groups of cash-generating units.
4) Other Disclosuresi. Amortization of intangible assets associated with products is recorded as amortization of intangible assets associated with products in the consolidated statement of profit or loss and other comprehensive income. Amortization associated with other intangible assets is included in cost of sales, selling, general and administrative expenses and research and development expenses in the consolidated statement of profit or loss and other comprehensive income.
ii. The Santen Group did not recognize any internally generated intangible assets as of March 31, 2017 and as of March 31, 2016.
Thousands of U.S. dollars
$(217,911)
(65,589)
(210)
2,336
35
$(281,339)
Total
$(64,280)
(8,392)
(190)
2,288
339
$(70,235)
Software
$(6,991)
(46)
(19)
48
75
$(6,934)
Other
$(146,640)
(57,150)
—
—
(379)
$(204,170)
Intangible assetsassociated
with products
$—
—
—
—
—
$—
Goodwill
Balance as of March 31, 2016
Amortization
Impairment losses
Disposals
Foreign currency translation differences
Balance as of March 31, 2017
Millions of yen
TotalSoftware Other
Intangible assetsassociated
with productsGoodwill
¥ 84,433
83,681
¥102,807
¥435
396
¥435
¥1,920
2,514
¥2,888
¥75,500
74,330
¥69,567
¥ 6,578
6,440
¥29,917
As of April 1, 2015
As of March 31, 2016
As of March 31, 2017
Thousands of U.S. dollars
TotalSoftware Other
Intangible assetsassociated
with productsGoodwill
$916,368$3,881$25,742$620,081$266,664As of March 31, 2017
C. Carrying Amount
Notes to Consolidated Financial Statements
2) Impairment LossesIn the fiscal year ended March 31, 2017, the Santen Grouprecorded impairment losses of ¥24 million ($210 thousand)for that period, along with ¥268 million for the period endedMarch 31, 2016. Impairment losses are recognized in otherexpense in the consolidated statement of profit or loss andother comprehensive income.
The intangible assets for which impairment losses wererecognized for the year ended March 31, 2016 were mainly“Intangible assets associated with products” in thePharmaceuticals segment. The carrying amounts of theseintangible assets were written down to the recoverableamounts due to the decline in expected profitability. Thoserecoverable amounts were measured at the value in use.
The intangible assets for which impairment losses wererecognized for the year ended March 31, 2017 were mainly“Software” in the “Other” segment. The carrying amounts of these intangible assets were written down to therecoverable amounts due to the decline in expectedprofitability. Those recoverable amounts were measured atthe value in use.
3) Impairment Test for GoodwillTTIn the fiscal year ended March 31, 2017, the Santen Grouprecorded goodwill of ¥29,917 million ($266,664 thousand)for that period, along with ¥6,440 million as of March 31, 2016.
The goodwill was recognized as a result of theacquisition of Santen S.A.S. for the period ended March 31,2016 and the acquisition of Santen S.A.S. and InnFocus,Inc. for the fiscal year ended March 31, 2017.
The goodwill of ¥6,026 million ($53,712 thousand) as of March 31, 2017 and ¥6,440 million as of March 31, 2016recognized as a result of the acquisition of Santen S.A.S. wasallocated to the Pharmaceuticals segment and impairmenttesting has been performed annually. y The recoverableamount in the impairment test for goodwill was measuredusing the market value of the share price of the Company. Inthe fiscal year ended March 31, 2017, the Santen Group didnot recognize an impairment loss on goodwill, because therecoverable amount exceeded the carrying amount.
The goodwill of ¥23,891 million ($212,951 thousand)recognized as a result of the acquisition of InnFocus, Inc.was the provisional amounts, because the measurementprocess had not been completed, and has not yet beenallocated to cash-generating units, or groups of cash-generating units.
4) Other Disclosuresi. Amortization of intangible assets associated with productsis recorded as amortization of intangible assets associatedwith products in the consolidated statement of profit or lossand other comprehensive income. Amortization associatedwith other intangible assets is included in cost of sales,selling, general and administrative expenses and researchand development expenses in the consolidated statementof profit or loss and other comprehensive income.
ii. The Santen Group did not recognize any internallygenerated intangible assets as of March 31, 2017 and as of March 31, 2016.
Thousands of U.S. dollars
$(217,911)
(65,589)
(210)
2,336
35
$(281,339)
Total
$(64,280)
(8,392)
(190)
2,288
339
$(70,235)
Software
$(6,991)
(46)
(19)
48
75
$(6,934)
Other
$(146,640)
(57,150)
—
—
(379)
$(204,170)
Intangible assetsassociated
with products
$—
—
—
—
—
$—
Goodwill
Balance as of March 31, 2016
Amortization
Impairment losses
Disposals
Foreign currency translation differences
Balance as of March 31, 2017
Millions of yen
TotalSoftware Other
Intangible assetsassociated
with productsGoodwill
¥ 84,433
83,681
¥102,807
¥435
396
¥435
¥1,920
2,514
¥2,888
¥75,500
74,330
¥69,567
¥ 6,578
6,440
¥29,917
As of April 1, 2015
As of March 31, 2016
As of March 31, 2017
Thousands of U.S. dollars
TotalSoftware Other
Intangible assetsassociated
with productsGoodwill
$916,368$3,881$25,742$620,081$266,664As of March 31, 2017
C. Carrying Amount
Notes to Consolidated Financial Statements
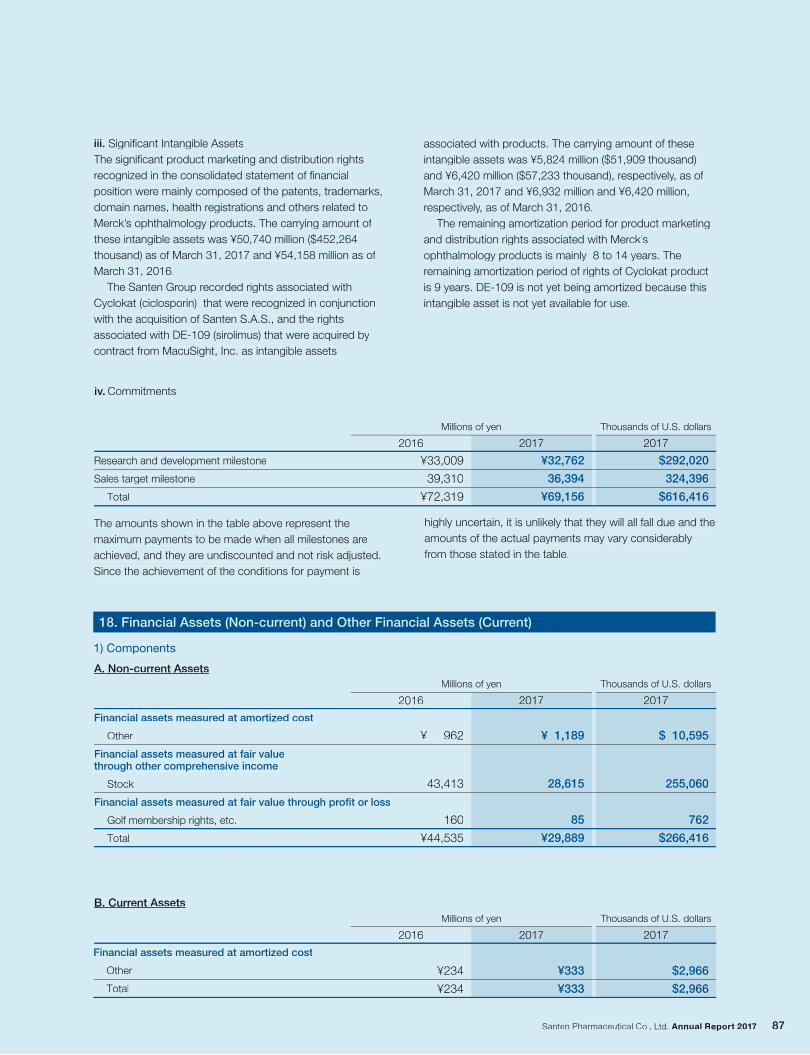
Millions of yen Thousands of U.S. dollars
20172016 2017
$2,966
$2,966
¥234
¥234
¥333
¥333
Millions of yen Thousands of U.S. dollars
20172016 2017
$ 10,595
255,060
762
$266,416
¥ 962
43,413
160
¥44,535
¥ 1,189
28,615
85
¥29,889
Millions of yen Thousands of U.S. dollars
20172016 2017
$292,020
324,396
$616,416
¥33,009
39,310
¥72,319
¥32,762
36,394
¥69,156
18. Financial Assets (Non-current) and Other Financial Assets (Current)
B. Current Assets
Financial assets measured at amortized cost
Other
Total
iii. Significant Intangible Assets
The significant product marketing and distribution rights
recognized in the consolidated statement of financial
position were mainly composed of the patents, trademarks,
domain names, health registrations and others related to
Merck’s ophthalmology products. The carrying amount of
these intangible assets was ¥50,740 million ($452,264
thousand) as of March 31, 2017 and ¥54,158 million as of
March 31, 2016.
The Santen Group recorded rights associated with
Cyclokat (ciclosporin) that were recognized in conjunction
with the acquisition of Santen S.A.S., and the rights
associated with DE-109 (sirolimus) that were acquired by
contract from MacuSight, Inc. as intangible assets
associated with products. The carrying amount of these
intangible assets was ¥5,824 million ($51,909 thousand)
and ¥6,420 million ($57,233 thousand), respectively, as of
March 31, 2017 and ¥6,932 million and ¥6,420 million,
respectively, as of March 31, 2016.
The remaining amortization period for product marketing
and distribution rights associated with Merck’s
ophthalmology products is mainly 8 to 14 years. The
remaining amortization period of rights of Cyclokat product
is 9 years. DE-109 is not yet being amortized because this
intangible asset is not yet available for use.
iv. Commitments
Research and development milestone
Sales target milestone
Total
The amounts shown in the table above represent the
maximum payments to be made when all milestones are
achieved, and they are undiscounted and not risk adjusted.
Since the achievement of the conditions for payment is
highly uncertain, it is unlikely that they will all fall due and the
amounts of the actual payments may vary considerably
from those stated in the table.
Financial assets measured at amortized cost
Other
Financial assets measured at fair value through other comprehensive income
Stock
Financial assets measured at fair value through profit or loss
Golf membership rights, etc.
Total
1) Components
A. Non-current Assets
Millions of yen Thousands of U.S. dollars
20172016 2017
$2,966
$2,966
¥234
¥234
¥333
¥333
Millions of yen Thousands of U.S. dollars
20172016 2017
$ 10,595
255,060
762
$266,416
¥ 962
43,413
160
¥44,535
¥ 1,189
28,615
85
¥29,889
Millions of yen Thousands of U.S. dollars
20172016 2017
$292,020
324,396
$616,416
¥33,009
39,310
¥72,319
¥32,762
36,394
¥69,156
18. Financial Assets (Non-current) and Other Financial Assets (Current)
B. Current Assets
Financial assets measured at amortized cost
Other
Total
iii. Significant Intangible Assets
The significant product marketing and distribution rights
recognized in the consolidated statement of financial
position were mainly composed of the patents, trademarks,
domain names, health registrations and others related to
Merck’s ophthalmology products. The carrying amount of
these intangible assets was ¥50,740 million ($452,264
thousand) as of March 31, 2017 and ¥54,158 million as of
March 31, 2016.
The Santen Group recorded rights associated with
Cyclokat (ciclosporin) that were recognized in conjunction
with the acquisition of Santen S.A.S., and the rights
associated with DE-109 (sirolimus) that were acquired by
contract from MacuSight, Inc. as intangible assets
associated with products. The carrying amount of these
intangible assets was ¥5,824 million ($51,909 thousand)
and ¥6,420 million ($57,233 thousand), respectively, as of
March 31, 2017 and ¥6,932 million and ¥6,420 million,
respectively, as of March 31, 2016.
The remaining amortization period for product marketing
and distribution rights associated with Merck’s
ophthalmology products is mainly 8 to 14 years. The
remaining amortization period of rights of Cyclokat product
is 9 years. DE-109 is not yet being amortized because this
intangible asset is not yet available for use.
iv. Commitments
Research and development milestone
Sales target milestone
Total
The amounts shown in the table above represent the
maximum payments to be made when all milestones are
achieved, and they are undiscounted and not risk adjusted.
Since the achievement of the conditions for payment is
highly uncertain, it is unlikely that they will all fall due and the
amounts of the actual payments may vary considerably
from those stated in the table.
Financial assets measured at amortized cost
Other
Financial assets measured at fair valuethrough other comprehensive income
Stock
Financial assets measured at fair value through profit or loss
Golf membership rights, etc.
Total
1) Components
A. Non-current Assets
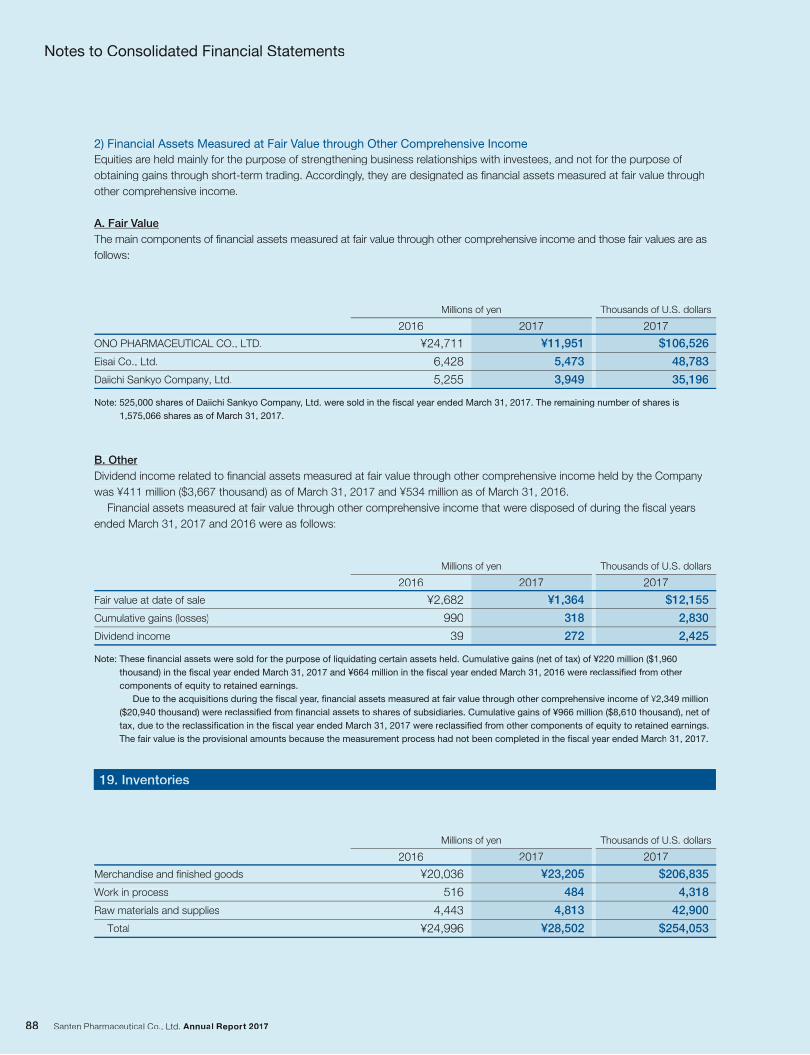
Millions of yen Thousands of U.S. dollars
20172016 2017
$106,526
48,783
35,196
¥24,711
6,428
5,255
¥11,951
5,473
3,949
Millions of yen Thousands of U.S. dollars
20172016 2017
$12,155
2,830
2,425
¥2,682
990
39
¥1,364
318
272
2) Financial Assets Measured at Fair Value through Other Comprehensive Income
Equities are held mainly for the purpose of strengthening business relationships with investees, and not for the purpose of
obtaining gains through short-term trading. Accordingly, they are designated as financial assets measured at fair value through
other comprehensive income.
A. Fair Value
The main components of financial assets measured at fair value through other comprehensive income and those fair values are as
follows:
B. Other
Dividend income related to financial assets measured at fair value through other comprehensive income held by the Company
was ¥411 million ($3,667 thousand) as of March 31, 2017 and ¥534 million as of March 31, 2016.
Financial assets measured at fair value through other comprehensive income that were disposed of during the fiscal years
ended March 31, 2017 and 2016 were as follows:
Note: These financial assets were sold for the purpose of liquidating certain assets held. Cumulative gains (net of tax) of ¥220 million ($1,960
thousand) in the fiscal year ended March 31, 2017 and ¥664 million in the fiscal year ended March 31, 2016 were reclassified from other
components of equity to retained earnings.
Due to the acquisitions during the fiscal year, financial assets measured at fair value through other comprehensive income of ¥2,349 million
($20,940 thousand) were reclassified from financial assets to shares of subsidiaries. Cumulative gains of ¥966 million ($8,610 thousand), net of
tax, due to the reclassification in the fiscal year ended March 31, 2017 were reclassified from other components of equity to retained earnings.
The fair value is the provisional amounts because the measurement process had not been completed in the fiscal year ended March 31, 2017.
Fair value at date of sale
Cumulative gains (losses)
Dividend income
19. Inventories
Notes to Consolidated Financial Statements
ONO PHARMACEUTICAL CO., LTD.
Eisai Co., Ltd.
Daiichi Sankyo Company, Ltd.
Merchandise and finished goods
Work in process
Raw materials and supplies
Total
Millions of yen Thousands of U.S. dollars
20172016 2017
$206,835
4,318
42,900
$254,053
¥20,036
516
4,443
¥24,996
¥23,205
484
4,813
¥28,502
Note: 525,000 shares of Daiichi Sankyo Company, Ltd. were sold in the fiscal year ended March 31, 2017. The remaining number of shares is
1,575,066 shares as of March 31, 2017.
Millions of yen Thousands of U.S. dollars
20172016 2017
$106,526
48,783
35,196
¥24,711
6,428
5,255
¥11,951
5,473
3,949
Millions of yen Thousands of U.S. dollars
20172016 2017
$12,155
2,830
2,425
¥2,682
990
39
¥1,364
318
272
2) Financial Assets Measured at Fair Value thrVV ough Other Comprehensive Income
Equities are held mainly for the purpose of strengthening business relationships with investees, and not for the purpose of
obtaining gains through short-term trading. Accordingly, they are designated as financial assets measured at fair value through
other comprehensive income.
A. Fair ValueVV
The main components of financial assets measured at fair value through other comprehensive income and those fair values are as
follows:
B. Other
Dividend income related to financial assets measured at fair value through other comprehensive income held by the Company
was ¥411 million ($3,667 thousand) as of March 31, 2017 and ¥534 million as of March 31, 2016.
Financial assets measured at fair value through other comprehensive income that were disposed of during the fiscal years
ended March 31, 2017 and 2016 were as follows:
Note: These financial assets were sold for the purpose of liquidating certain assets held. Cumulative gains (net of tax) of ¥220 million ($1,960
thousand) in the fiscal year ended March 31, 2017 and ¥664 million in the fiscal year ended March 31, 2016 were reclassified from other
components of equity to retained earnings.
Due to the acquisitions during the fiscal year, financial assets measurrr ed at fair value through other comprehensive income of ¥2,349 million
($20,940 thousand) were reclassified from financial assets to shares of subsidiaries. Cumulative gains of ¥966 million ($8,610 thousand), net of
tax, due to the reclassification in the fiscal year ended March 31, 2017 were reclassified from other components of equity to retained earnings.
The fair value is the provisional amounts because the measurement process had not been completed in the fiscal year ended March 31, 2017.
Fair value at date of sale
Cumulative gains (losses)
Dividend income
19. Inventories
Notes to Consolidated Financial Statements
ONO PHARMACEUTICAL CO., LTD.
Eisai Co., Ltd.
Daiichi Sankyo Company, Ltd.
Merchandise and finished goods
Work in process
Raw materials and supplies
Total
Millions of yen Thousands of U.S. dollars
20172016 2017
$206,835
4,318
42,900
$254,053
¥20,036
516
4,443
¥24,996
¥23,205
484
4,813
¥28,502
Note: 525,000 shares of Daiichi Sankyo Company, Ltd. were sold in the fiscal year ended March 31, 2017. The remaining number of sharf es is
1,575,066 shares as of March 31, 2017.
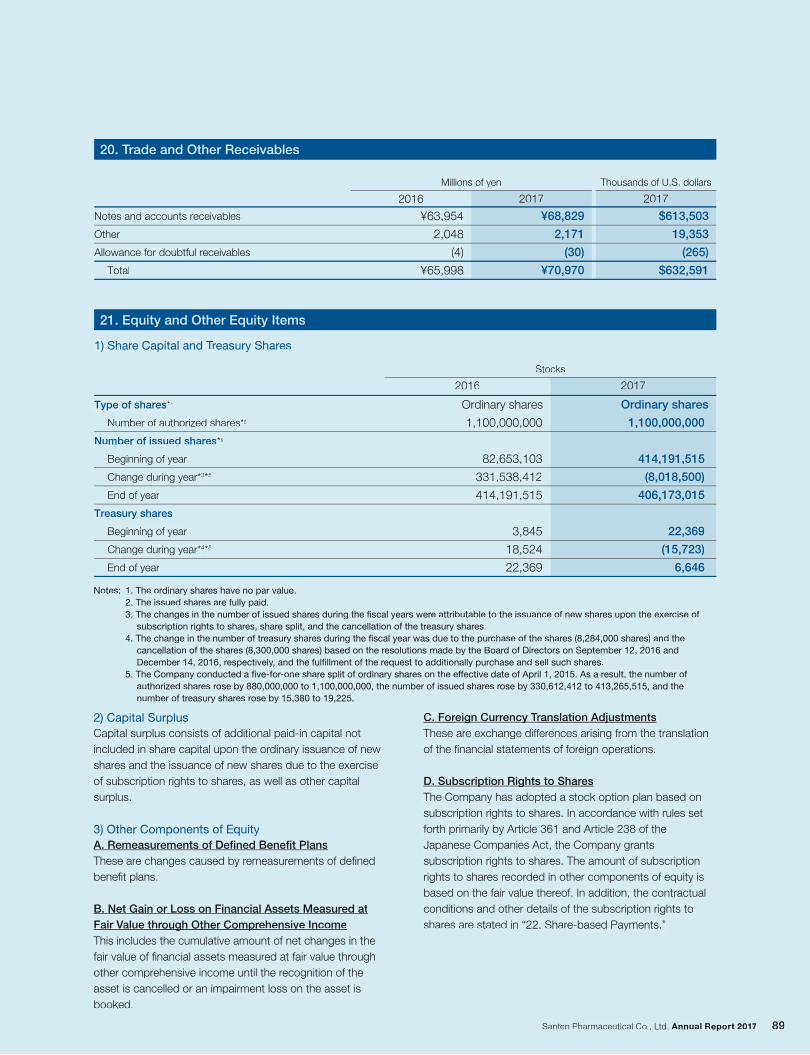
Millions of yen Thousands of U.S. dollars
20172016 2017
$613,503
19,353
(265)
$632,591
¥63,954
2,048
(4)
¥65,998
¥68,829
2,171
(30)
¥70,970
1) Share Capital and Treasury Shares
Notes: 1. The ordinary shares have no par value.
2. The issued shares are fully paid.
3. The changes in the number of issued shares during the fiscal years were attributable to the issuance of new shares upon the exercise of
subscription rights to shares, share split, and the cancellation of the treasury shares.
4. The change in the number of treasury shares during the fiscal year was due to the purchase of the shares (8,284,000 shares) and the
cancellation of the shares (8,300,000 shares) based on the resolutions made by the Board of Directors on September 12, 2016 and
December 14, 2016, respectively, and the fulfillment of the request to additionally purchase and sell such shares.
5. The Company conducted a five-for-one share split of ordinary shares on the effective date of April 1, 2015. As a result, the number of
authorized shares rose by 880,000,000 to 1,100,000,000, the number of issued shares rose by 330,612,412 to 413,265,515, and the
number of treasury shares rose by 15,380 to 19,225.
2) Capital Surplus
Capital surplus consists of additional paid-in capital not
included in share capital upon the ordinary issuance of new
shares and the issuance of new shares due to the exercise
of subscription rights to shares, as well as other capital
surplus.
3) Other Components of Equity
A. Remeasurements of Defined Benefit Plans
These are changes caused by remeasurements of defined
benefit plans.
B. Net Gain or Loss on Financial Assets Measured at
Fair Value through Other Comprehensive Income
This includes the cumulative amount of net changes in the
fair value of financial assets measured at fair value through
other comprehensive income until the recognition of the
asset is cancelled or an impairment loss on the asset is
booked.
C. Foreign Currency Translation Adjustments
These are exchange differences arising from the translation
of the financial statements of foreign operations.
D. Subscription Rights to Shares
The Company has adopted a stock option plan based on
subscription rights to shares. In accordance with rules set
forth primarily by Article 361 and Article 238 of the
Japanese Companies Act, the Company grants
subscription rights to shares. The amount of subscription
rights to shares recorded in other components of equity is
based on the fair value thereof. In addition, the contractual
conditions and other details of the subscription rights to
shares are stated in “22. Share-based Payments.”
2016
1,100,000,000
82,653,103
331,538,412
414,191,515
3,845
18,524
22,369
Ordinary shares
2017
1,100,000,000
414,191,515
(8,018,500)
406,173,015
22,369
(15,723)
6,646
Ordinary shares
Stocks
Type of shares*1
Number of authorized shares*5
Number of issued shares*2
Beginning of year
Change during year*3*5
End of year
Treasury shares
Beginning of year
Change during year*4*5
End of year
21. Equity and Other Equity Items
20. Trade and Other Receivables
Notes and accounts receivables
Other
Allowance for doubtful receivables
Total
Millions of yen Thousands of U.S. dollars
20172016 2017
$613,503
19,353
(265)
$632,591
¥63,954
2,048
(4)
¥65,998
¥68,829
2,171
(30)
¥70,970
1) Share Capital and Treasury Shares
Notes: 1. The ordinary shares have no par value.
2. The issued shares are fully paid.
3. The changes in the number of issued shares during the fiscal years were attributable to the issuance of new shares upon the exercise of
subscription rights to shares, share split, and the cancellation of the treasury shares.
4. The change in the number of treasury shares during the fiscal year was due to the purchase of the shares (8,284,000 shares) and the
cancellation of the shares (8,300,000 shares) based on the resolutions made by the Board of Directors on September 12, 2016 and
December 14, 2016, respectively, and the fulfillment of the request to additionally purchase and sell such shares.
5. The Company conducted a five-for-one sharrr e split of ordinary shares on the effective date of April 1, 2015. As a rff esult, the number of
authorized shares rose by 880,000,000 to 1,100,000,000, the number of issued shares rose by 330,612,412 to 413,265,515, and the
number of treasury shares rose by 15,380 to 19,225.
2) Capital Surplus
Capital surplus consists of additional paid-in capital not
included in share capital upon the ordinary issuance of new
shares and the issuance of new shares due to the exercise
of subscription rights to shares, as well as other capital
surplus.
3) Other Components of Equity
A. Remeasurements of Defined Benefit Plans
These are changes caused by remeasurements of defined
benefit plans.
B. Net Gain or Loss on Financial Assets Measured at
Fair Value thrVV ough Other Comprehensive Income
This includes the cumulative amount of net changes in the
fair value of financial assets measured at fair value through
other comprehensive income until the recognition of the
asset is cancelled or an impairment loss on the asset is
booked.
C. Foreign Currency T jranslation AdjustmentsTT
These are exchange differff ences arising from the translation
of the financial statements of foreign operations.
D. Subscription Rights to Shares
The Company has adopted a stock option plan based on
subscription rights to shares. In accordance with rules set
forth primarily by Article 361 and Article 238 of the
Japanese Companies Act, the Company grants
subscription rights to shares. The amount of subscription
rights to shares recorded in other components of equity is
based on the fair value thereof. In addition, the contractual
conditions and other details of the subscription rights to
shares are stated in “22. Share-based Payments.”
2016
1,100,000,000
82,653,103
331,538,412
414,191,515
3,845
18,524
22,369
Ordinary shares
2017
1,100,000,000
414,191,515
(8,018,500)
406,173,015
22,369
(15,723)
6,646
Ordinary shares
Stocks
Type of shares*1
Number of authorized shares*5
Number of issued shares*2
Beginning of year
Change during year*3*5
End of year
Treasury shares
Beginning of year
Change during year*4*5
End of year
21. Equity and Other Equity Items
20. Trade and Other ReceivablesTT
Notes and accounts receivables
Other
Allowance for doubtful receivables
Total
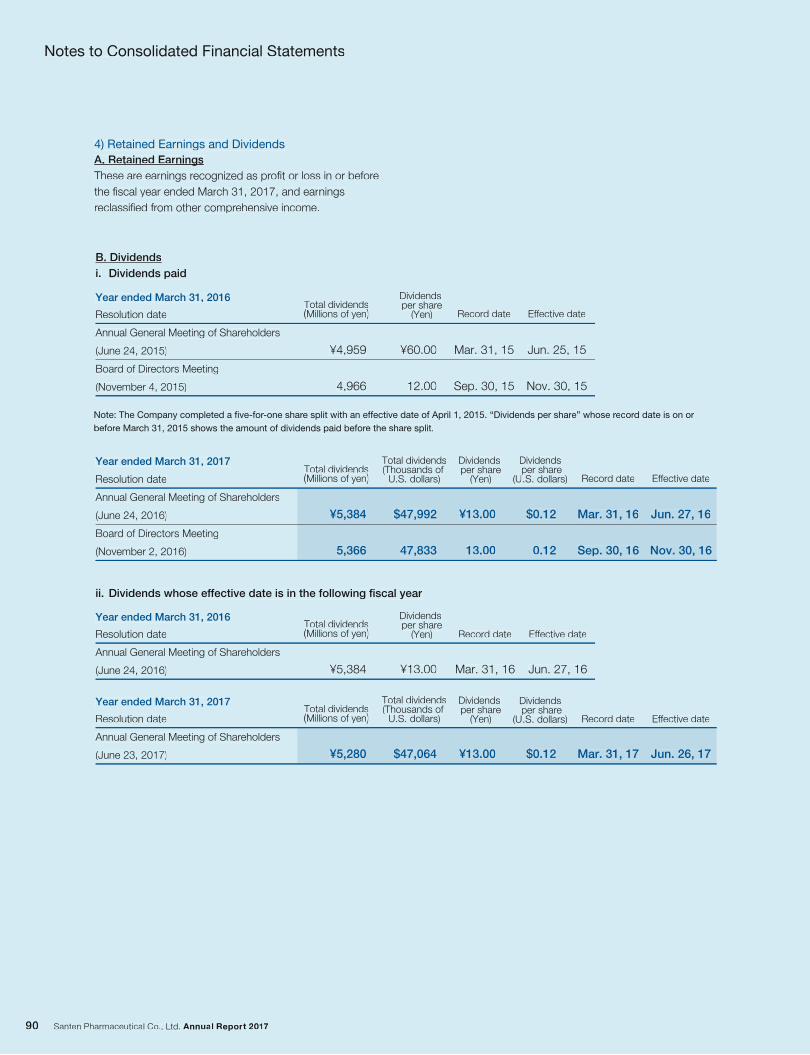
Notes to Consolidated Financial Statements
B. Dividends
i. Dividends paid
Resolution date
Annual General Meeting of Shareholders
(June 24, 2015)
Board of Directors Meeting
(November 4, 2015)
Jun. 25, 15
Nov. 30, 15
Mar. 31, 15
Sep. 30, 15
¥4,959
4,966
Year ended March 31, 2016
Resolution date
Annual General Meeting of Shareholders
(June 24, 2016)
Board of Directors Meeting
(November 2, 2016)
Effective date
Jun. 27, 16
Nov. 30, 16
Record date
Mar. 31, 16
Sep. 30, 16
$47,992
47,833
¥13.00
13.00
$0.12
0.12
Total dividends(Thousands of
U.S. dollars)
Dividends per share
(Yen)
Dividendsper share
(U.S. dollars)
¥60.00
12.00
¥5,384
5,366
Total dividends(Millions of yen)
Effective dateRecord date
Dividends per share
(Yen)Total dividends(Millions of yen)
Year ended March 31, 2017
4) Retained Earnings and Dividends
A. Retained Earnings
These are earnings recognized as profit or loss in or before
the fiscal year ended March 31, 2017, and earnings
reclassified from other comprehensive income.
Effective dateRecord date
Dividends per share
(Yen)
Dividendsper share
(U.S. dollars)
Jun. 27, 16
Effective dateRecord date
Mar. 31, 16¥13.00
ii. Dividends whose effective date is in the following fiscal year
Resolution date
Annual General Meeting of Shareholders
(June 23, 2017) Jun. 26, 17Mar. 31, 17$47,064 ¥13.00 $0.12
Total dividends(Thousands of
U.S. dollars)
¥5,280
Total dividends(Millions of yen)
Dividends per share
(Yen) Effective dateRecord dateTotal dividends(Millions of yen)
Year ended March 31, 2017
Resolution date
Annual General Meeting of Shareholders
(June 24, 2016) ¥5,384
Year ended March 31, 2016
Note: The Company completed a five-for-one share split with an effective date of April 1, 2015. “Dividends per share” whose record date is on or
before March 31, 2015 shows the amount of dividends paid before the share split.
Notes to Consolidated Financial Statements
B. Dividends
i. Dividends paid
Resolution date
Annual General Meeting of Shareholders
(June 24, 2015)
Board of Directors Meeting
(November 4, 2015)
Jun. 25, 15
Nov. 30, 15
Mar. 31, 15
Sep. 30, 15
¥4,959
4,966
Year ended March 31, 2016
Resolution date
Annual General Meeting of Shareholders
(June 24, 2016)
Board of Directors Meeting
(November 2, 2016)
Effective date
Jun. 27, 16
Nov. 30, 16
Record date
Mar. 31, 16
Sep. 30, 16
$47,992
47,833
¥13.00
13.00
$0.12
0.12
Total dividends(Thousands of
U.S. dollars)
Dividends per share
(Yen)
Dividendsper share
(U.S. dollars)
¥60.00
12.00
¥5,384
5,366
Total dividends(Millions of yen)
Effective dateRecord date
Dividends per share
(Yen)Total dividends(Millions of yen)
Year ended March 31, 2017
4) Retained Earnings and Dividends
A. Retained Earnings
These are earnings recognized as profit or loss in or before
the fiscal year ended March 31, 2017, and earnings
reclassified from other comprehensive income.
Dividends per share
(Yen)
Dividendsper share
(U.S. dollars)
Jun. 27, 16
Effective dateRecord date
Mar. 31, 16¥13.00
ii. Dividends whose effective date is in the following fiscal yearff
Resolution date
Annual General Meeting of Shareholders
(June 23, 2017) Jun. 26, 17Mar. 31, 17$47,064 ¥13.00 $0.12
Total dividends(Thousands of
U.S. dollars)
¥5,280
Total dividends(Millions of yen)
Dividends per share
(Yen) Effective dateRecord dateTotal dividends(Millions of yen)
Year ended March 31, 2017
Resolution date
Annual General Meeting of Shareholders
(June 24, 2016) ¥5,384
Year ended March 31, 2016
Note: The Company completed a five-for-one sharrr e split with an effective date of April 1, 2015. “Dividends per sharff e” whose record date is on or
before March 31, 2015 shows the amount of dividends paid before the share split.
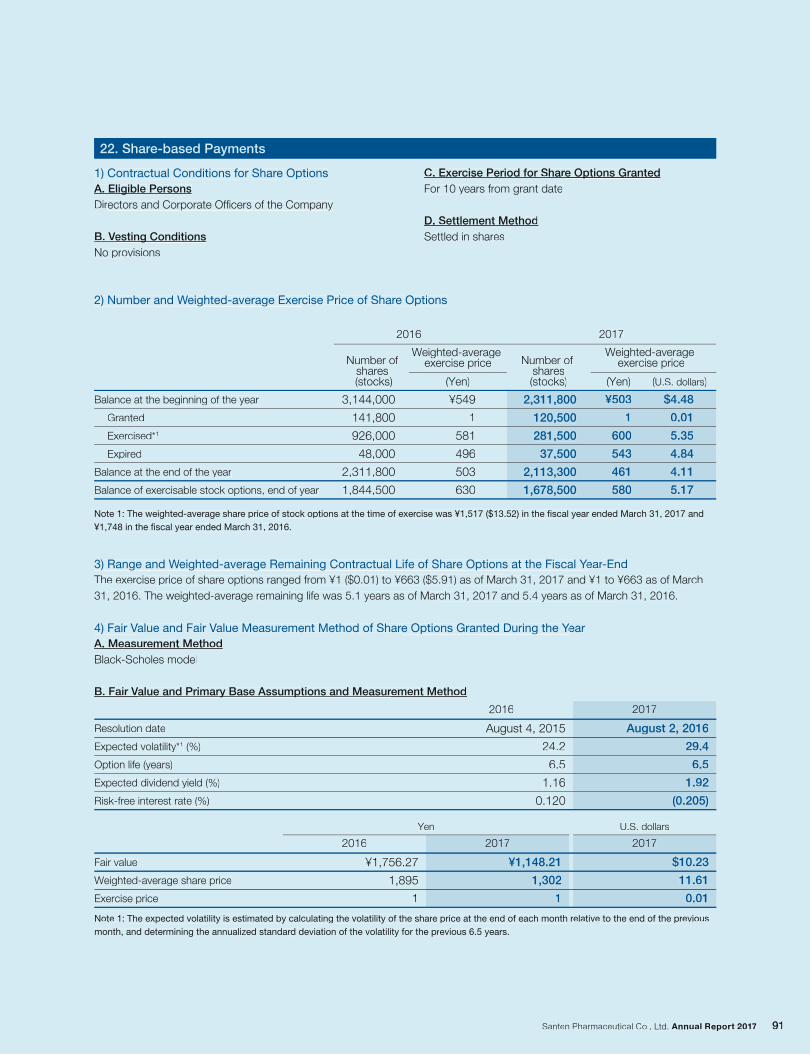
22. Share-based Payments
1) Contractual Conditions for Share Options
A. Eligible Persons
Directors and Corporate Officers of the Company
B. Vesting Conditions
No provisions
C. Exercise Period for Share Options Granted
For 10 years from grant date
D. Settlement Method
Settled in shares
2) Number and Weighted-average Exercise Price of Share Options
3) Range and Weighted-average Remaining Contractual Life of Share Options at the Fiscal Year-End
The exercise price of share options ranged from ¥1 ($0.01) to ¥663 ($5.91) as of March 31, 2017 and ¥1 to ¥663 as of March
31, 2016. The weighted-average remaining life was 5.1 years as of March 31, 2017 and 5.4 years as of March 31, 2016.
4) Fair Value and Fair Value Measurement Method of Share Options Granted During the Year
A. Measurement Method
Black-Scholes model
B. Fair Value and Primary Base Assumptions and Measurement Method
Note 1: The weighted-average share price of stock options at the time of exercise was ¥1,517 ($13.52) in the fiscal year ended March 31, 2017 and
¥1,748 in the fiscal year ended March 31, 2016.
2016 2017
Number of shares(stocks)
Weighted-average exercise priceNumber of
shares (stocks)
Weighted-average exercise price
Balance at the beginning of the year
Granted
Exercised*1
Expired
Balance at the end of the year
Balance of exercisable stock options, end of year
Note 1: The expected volatility is estimated by calculating the volatility of the share price at the end of each month relative to the end of the previous
month, and determining the annualized standard deviation of the volatility for the previous 6.5 years.
2016 2017
Resolution date
Expected volatility*1 (%)
Option life (years)
Expected dividend yield (%)
Risk-free interest rate (%)
Fair value
Weighted-average share price
Exercise price
(Yen) (Yen) (U.S. dollars)
Yen U.S. dollars
2,311,800
120,500
281,500
37,500
2,113,300
1,678,500
¥549
1
581
496
503
630
3,144,000
141,800
926,000
48,000
2,311,800
1,844,500
¥503
1
600
543
461
580
$4.48
0.01
5.35
4.84
4.11
5.17
$10.23
11.61
0.01
2016
¥1,756.27
1,895
1
2017
¥1,148.21
1,302
1
2017
August 4, 2015
24.2
6.5
1.16
0.120
August 2, 2016
29.4
6.5
1.92
(0.205)
22. Share-based Payments
1) Contractual Conditions for Share Options
A. Eligible Persons
Directors and Corporate Officers of the Companyff
B. Vesting ConditionsVV
No provisions
C. Exercise Period for Share Options Granted
For 10 years from grant date
D. Settlement Method
Settled in shares
2) Number and Weighted-average ExerWW cise Price of Share Options
3) Range and Weighted-average Remaining Contractual Life of SharWW e Options at the Fiscal YearYY -Endrr
The exercise price of share options ranged from ¥1 ($0.01) to ¥663 ($5.91) as of March 31, 2017 and ¥1 to ¥663 as of March
31, 2016. The weighted-average remaining life was 5.1 years as of March 31, 2017 and 5.4 years as of March 31, 2016.
4) Fair Value and Fair VVV alue MeasurVV ement Method of Share Options Granted During the YearYY
A. Measurement Method
Black-Scholes model
B. Fair Value and Primary Base Assumptions and MeasurVV ement Method
Note 1: The weighted-average share price of stock options at the time of exercise was ¥1,517 ($13.52) in the fiscal year ended March 31, 2017 and
¥1,748 in the fiscal year ended March 31, 2016.
2016 2017
Number of shares(stocks)
Weighted-averageexercise priceNumber of
shares(stocks)
Weighted-averageexercise price
Balance at the beginning of the year
Granted
Exercised*1
Expired
Balance at the end of the year
Balance of exercisable stock options, end of year
Note 1: The expected volatility is estimated by calculating the volatility of the share price at the end of each month relative to the end of the previous
month, and determining the annualized standard deviation of the volatility for the previous 6.5 years.
2016 2017
Resolution date
Expected volatility*1 (%)
Option life (years)
Expected dividend yield (%)
Risk-free interest rate (%)
Fair value
Weighted-average share price
Exercise price
(Yen) (Yen) (U.S. dollars)
Yen U.S. dollars
2,311,800
120,500
281,500
37,500
2,113,300
1,678,500
¥549
1
581
496
503
630
3,144,000
141,800
926,000
48,000
2,311,800
1,844,500
¥503
1
600
543
461
580
$4.48
0.01
5.35
4.84
4.11
5.17
$10.23
11.61
0.01
2016
¥1,756.27
1,895
1
2017
¥1,148.21
1,302
1
2017
August 4, 2015
24.2
6.5
1.16
0.120
August 2, 2016
29.4
6.5
1.92
(0.205)
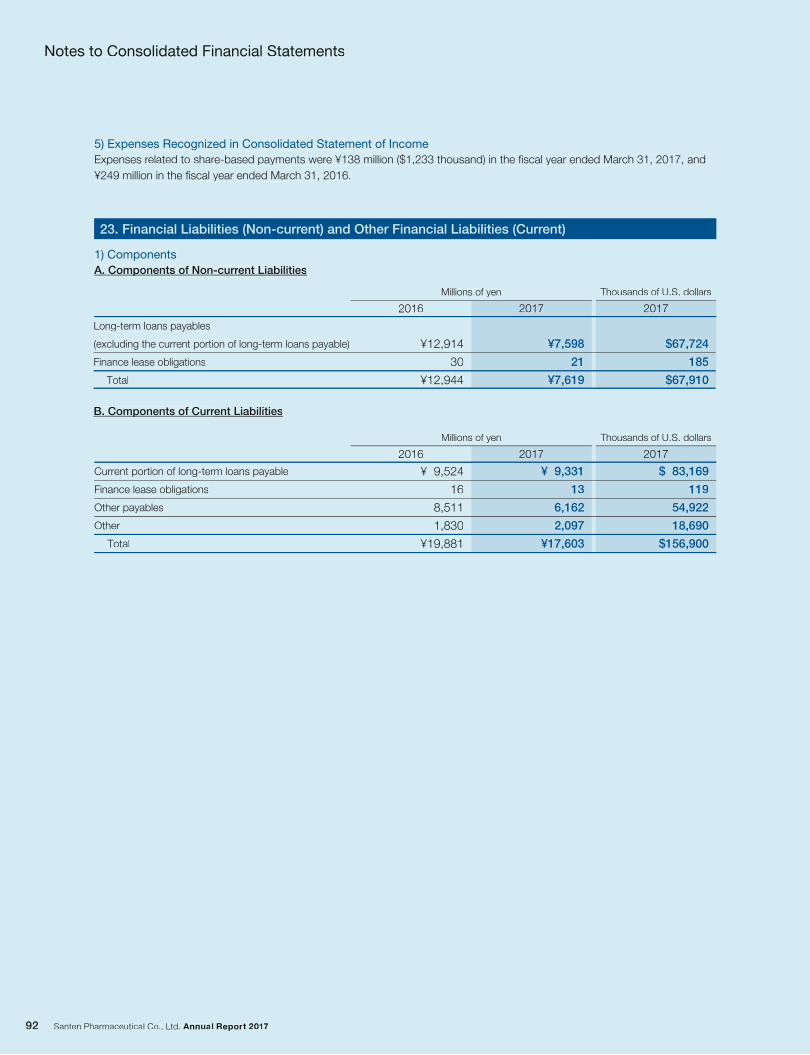
Notes to Consolidated Financial Statements
Millions of yen Thousands of U.S. dollars
20172016 2017
$67,724
185
$67,910
¥12,914
30
¥12,944
¥7,598
21
¥7,619
Millions of yen Thousands of U.S. dollars
20172016 2017
$ 83,169
119
54,922
18,690
$156,900
¥ 9,524
16
8,511
1,830
¥19,881
¥ 9,331
13
6,162
2,097
¥17,603
B. Components of Current Liabilities
Long-term loans payables
(excluding the current portion of long-term loans payable)
Finance lease obligations
Total
5) Expenses Recognized in Consolidated Statement of Income
Expenses related to share-based payments were ¥138 million ($1,233 thousand) in the fiscal year ended March 31, 2017, and
¥249 million in the fiscal year ended March 31, 2016.
23. Financial Liabilities (Non-current) and Other Financial Liabilities (Current)
1) Components
A. Components of Non-current Liabilities
Current portion of long-term loans payable
Finance lease obligations
Other payables
Other
Total
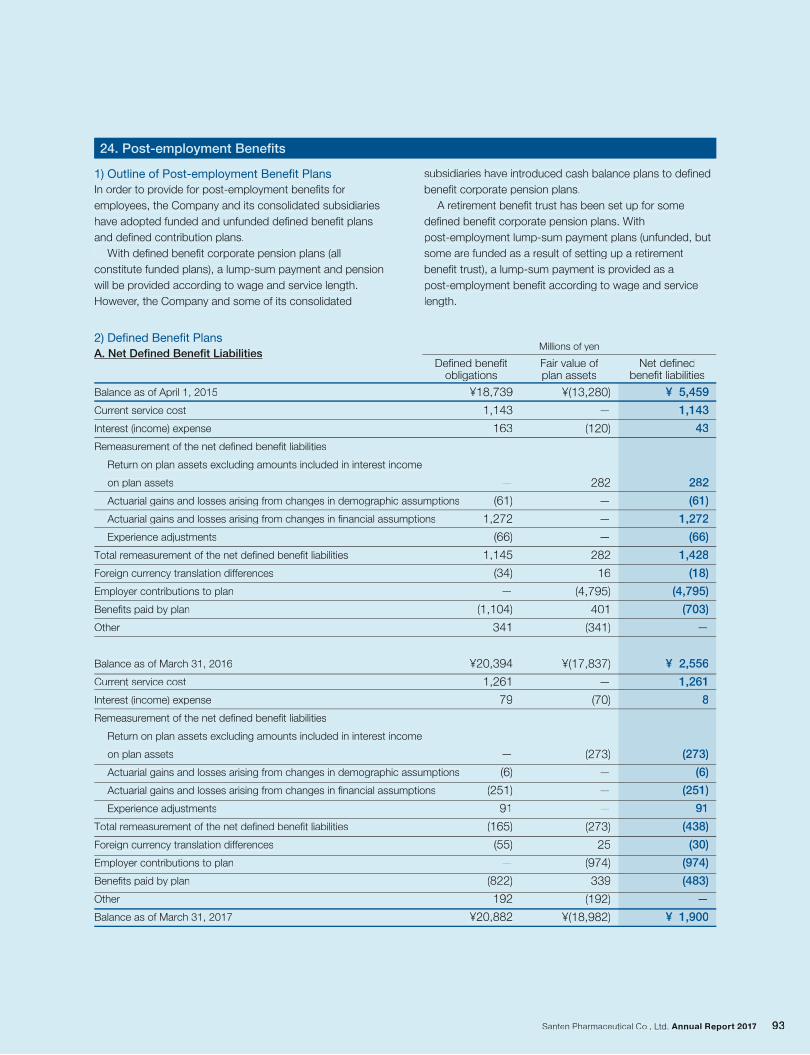
24. Post-employment Benefits
1) Outline of Post-employment Benefit Plans
In order to provide for post-employment benefits for
employees, the Company and its consolidated subsidiaries
have adopted funded and unfunded defined benefit plans
and defined contribution plans.
With defined benefit corporate pension plans (all
constitute funded plans), a lump-sum payment and pension
will be provided according to wage and service length.
However, the Company and some of its consolidated
subsidiaries have introduced cash balance plans to defined
benefit corporate pension plans.
A retirement benefit trust has been set up for some
defined benefit corporate pension plans. With
post-employment lump-sum payment plans (unfunded, but
some are funded as a result of setting up a retirement
benefit trust), a lump-sum payment is provided as a
post-employment benefit according to wage and service
length.
2) Defined Benefit Plans
A. Net Defined Benefit LiabilitiesFair value ofplan assets
Defined benefitobligations
Net definedbenefit liabilities
Balance as of April 1, 2015
Current service cost
Interest (income) expense
Remeasurement of the net defined benefit liabilities
Return on plan assets excluding amounts included in interest income
on plan assets
Actuarial gains and losses arising from changes in demographic assumptions
Actuarial gains and losses arising from changes in financial assumptions
Experience adjustments
Total remeasurement of the net defined benefit liabilities
Foreign currency translation differences
Employer contributions to plan
Benefits paid by plan
Other
Balance as of March 31, 2016
Current service cost
Interest (income) expense
Remeasurement of the net defined benefit liabilities
Return on plan assets excluding amounts included in interest income
on plan assets
Actuarial gains and losses arising from changes in demographic assumptions
Actuarial gains and losses arising from changes in financial assumptions
Experience adjustments
Total remeasurement of the net defined benefit liabilities
Foreign currency translation differences
Employer contributions to plan
Benefits paid by plan
Other
Balance as of March 31, 2017
Millions of yen
¥(13,280)
—
(120)
282
—
—
—
282
16
(4,795)
401
(341)
¥(17,837)
—
(70)
(273)
—
—
—
(273)
25
(974)
339
(192)
¥(18,982)
¥ 5,459
1,143
43
282
(61)
1,272
(66)
1,428
(18)
(4,795)
(703)
—
¥ 2,556
1,261
8
(273)
(6)
(251)
91
(438)
(30)
(974)
(483)
—
¥ 1,900
¥18,739
1,143
163
—
(61)
1,272
(66)
1,145
(34)
—
(1,104)
341
¥20,394
1,261
79
—
(6)
(251)
91
(165)
(55)
—
(822)
192
¥20,882
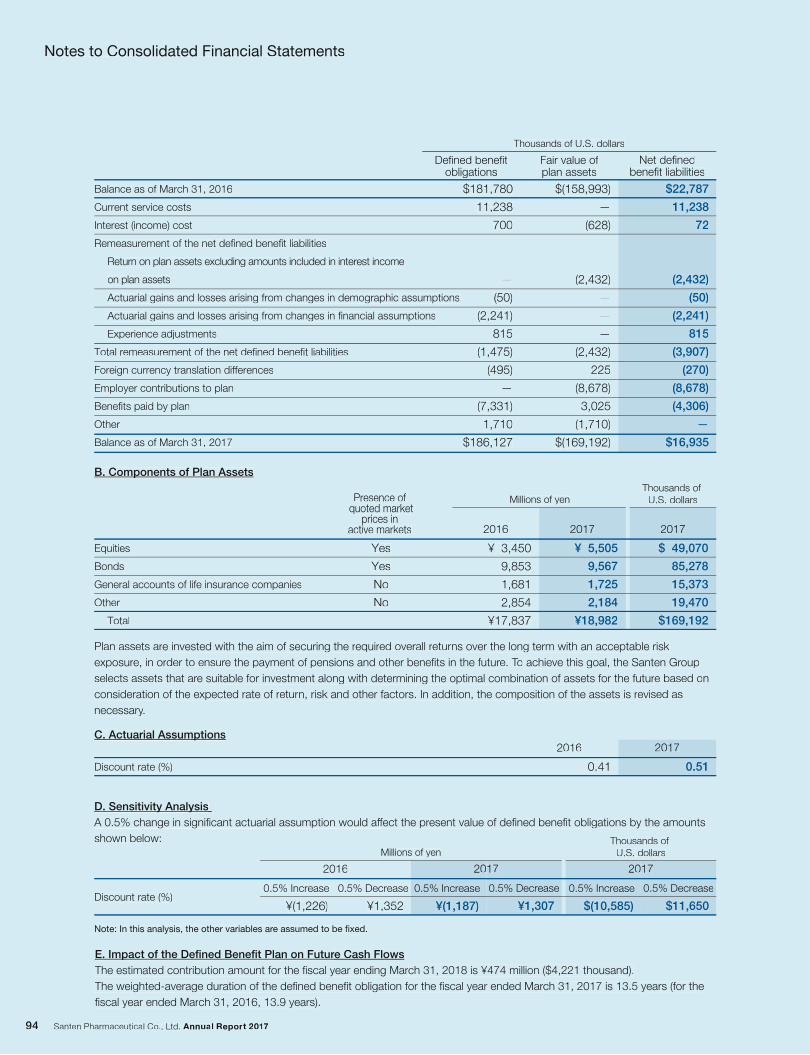
Notes to Consolidated Financial Statements
Fair value ofplan assets
$(158,993)
—
(628)
(2,432)
—
—
—
(2,432)
225
(8,678)
3,025
(1,710)
$(169,192)
Defined benefitobligations
$181,780
11,238
700
—
(50)
(2,241)
815
(1,475)
(495)
—
(7,331)
1,710
$186,127
Net definedbenefit liabilities
$22,787
11,238
72
(2,432)
(50)
(2,241)
815
(3,907)
(270)
(8,678)
(4,306)
—
$16,935
Balance as of March 31, 2016
Current service costs
Interest (income) cost
Remeasurement of the net defined benefit liabilities
Return on plan assets excluding amounts included in interest income
on plan assets
Actuarial gains and losses arising from changes in demographic assumptions
Actuarial gains and losses arising from changes in financial assumptions
Experience adjustments
Total remeasurement of the net defined benefit liabilities
Foreign currency translation differences
Employer contributions to plan
Benefits paid by plan
Other
Balance as of March 31, 2017
Thousands of U.S. dollars
B. Components of Plan Assets
Plan assets are invested with the aim of securing the required overall returns over the long term with an acceptable risk
exposure, in order to ensure the payment of pensions and other benefits in the future. To achieve this goal, the Santen Group
selects assets that are suitable for investment along with determining the optimal combination of assets for the future based on
consideration of the expected rate of return, risk and other factors. In addition, the composition of the assets is revised as
necessary.
D. Sensitivity Analysis
A 0.5% change in significant actuarial assumption would affect the present value of defined benefit obligations by the amounts
shown below:
Note: In this analysis, the other variables are assumed to be fixed.
C. Actuarial Assumptions
2016
¥ 3,450
9,853
1,681
2,854
¥17,837
Presence of quoted market
prices in active markets
Yes
Yes
No
No
2017
¥ 5,505
9,567
1,725
2,184
¥18,982
Equities
Bonds
General accounts of life insurance companies
Other
Total
Millions of yen
2017
$ 49,070
85,278
15,373
19,470
$169,192
Thousands of U.S. dollars
2016
0.41
2017
0.51Discount rate (%)
0.5% Increase
¥(1,226) ¥(1,187)
0.5% Increase
¥1,307
0.5% Decrease
2016 2017
¥1,352
0.5% DecreaseDiscount rate (%)
Millions of yen
$(10,585)
0.5% Increase
$11,650
0.5% Decrease
2017
Thousands of U.S. dollars
E. Impact of the Defined Benefit Plan on Future Cash Flows
The estimated contribution amount for the fiscal year ending March 31, 2018 is ¥474 million ($4,221 thousand).
The weighted-average duration of the defined benefit obligation for the fiscal year ended March 31, 2017 is 13.5 years (for the
fiscal year ended March 31, 2016, 13.9 years).
Notes to Consolidated Financial Statements
Fair value ofplan assets
$(158,993)
—
(628)
(2,432)
—
—
—
(2,432)
225
(8,678)
3,025
(1,710)
$(169,192)
Defined benefitobligations
$181,780
11,238
700
—
(50)
(2,241)
815
(1,475)
(495)
—
(7,331)
1,710
$186,127
Net definedbenefit liabilities
$22,787
11,238
72
(2,432)
(50)
(2,241)
815
(3,907)
(270)
(8,678)
(4,306)
—
$16,935
Balance as of March 31, 2016
Current service costs
Interest (income) cost
Remeasurement of the net defined benefit liabilities
Return on plan assets excluding amounts included in interest income
on plan assets
Actuarial gains and losses arising from changes in demographic assumptions
Actuarial gains and losses arising from changes in financial assumptions
Experience adjustments
Total remeasurement of the net defined benefit liabilities
Foreign currency translation differences
Employer contributions to plan
Benefits paid by plan
Other
Balance as of March 31, 2017
Thousands of U.S. dollars
B. Components of Plan Assets
Plan assets are invested with the aim of securing the required overall returns over the long term with an acceptable risk
exposure, in order to ensure the payment of pensions and other benefits in the future. To achieve this goal, the Santen Group
selects assets that are suitable for investment along with determining the optimal combination of assets for the future based on
consideration of the expected rate of return, risk and other factors. In addition, the composition of the assets is revised as
necessary.
D. Sensitivity Analysis
A 0.5% change in significant actuarial assumption would affect the prff esent value of defined benefit obligations by the amounts
shown below:
Note: In this analysis, the other variables are assumed to be fixed.
C. Actuarial Assumptions
2016
¥ 3,450
9,853
1,681
2,854
¥17,837
Presence of quoted market
prices in active markets
Yes
Yes
No
No
2017
¥ 5,505
9,567
1,725
2,184
¥18,982
Equities
Bonds
General accounts of life insurance companies
Other
Total
Millions of yen
2017
$ 49,070
85,278
15,373
19,470
$169,192
Thousands of U.S. dollars
2016
0.41
2017
0.51Discount rate (%)
0.5% Increase
¥(1,226) ¥(1,187)
0.5% Increase
¥1,307
0.5% Decrease
2016 2017
¥1,352
0.5% DecreaseDiscount rate (%)
Millions of yen
$(10,585)
0.5% Increase
$11,650
0.5% Decrease
2017
Thousands of U.S. dollars
E. Impact of the Defined Benefit Plan on Future Cash Flows
The estimated contribution amount for the fiscal year ending March 31, 2018 is ¥474 million ($4,221 thousand).
The weighted-average duration of the defined benefit obligation for the fiscal year ended March 31, 2017 is 13.5 years (for the
fiscal year ended March 31, 2016, 13.9 years).
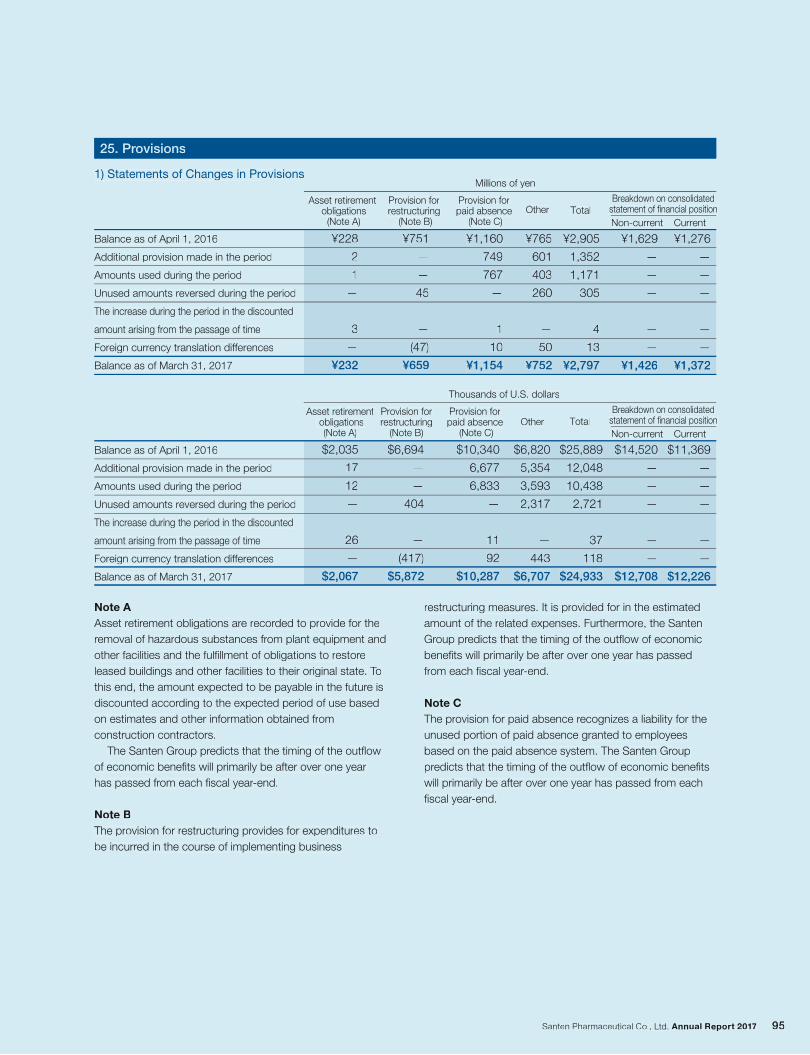
25. Provisions
1) Statements of Changes in Provisions
Note AAsset retirement obligations are recorded to provide for the
removal of hazardous substances from plant equipment and
other facilities and the fulfillment of obligations to restore
leased buildings and other facilities to their original state. To
this end, the amount expected to be payable in the future is
discounted according to the expected period of use based
on estimates and other information obtained from
construction contractors.
The Santen Group predicts that the timing of the outflow
of economic benefits will primarily be after over one year
has passed from each fiscal year-end.
Note B
The provision for restructuring provides for expenditures to
be incurred in the course of implementing business
restructuring measures. It is provided for in the estimated
amount of the related expenses. Furthermore, the Santen
Group predicts that the timing of the outflow of economic
benefits will primarily be after over one year has passed
from each fiscal year-end.
Note CThe provision for paid absence recognizes a liability for the
unused portion of paid absence granted to employees
based on the paid absence system. The Santen Group
predicts that the timing of the outflow of economic benefits
will primarily be after over one year has passed from each
fiscal year-end.
Current
Breakdown on consolidated statement of financial position
Non-currentTotalOther
Provision for paid absence
(Note C)
Provision for restructuring
(Note B)
Asset retirement obligations
(Note A)
Balance as of April 1, 2016
Additional provision made in the period
Amounts used during the period
Unused amounts reversed during the period
The increase during the period in the discounted
amount arising from the passage of time
Foreign currency translation differences
Balance as of March 31, 2017
Millions of yen
Current
Breakdown on consolidated statement of financial position
Non-currentTotalOther
Provision for paid absence
(Note C)
Provision forrestructuring
(Note B)
Asset retirement obligations
(Note A)
Balance as of April 1, 2016
Additional provision made in the period
Amounts used during the period
Unused amounts reversed during the period
The increase during the period in the discounted
amount arising from the passage of time
Foreign currency translation differences
Balance as of March 31, 2017
Thousands of U.S. dollars
¥1,276
—
—
—
—
—
¥1,372
¥1,629
—
—
—
—
—
¥1,426
¥2,905
1,352
1,171
305
4
13
¥2,797
¥765
601
403
260
—
50
¥752
¥1,160
749
767
—
1
10
¥1,154
¥751
—
—
45
—
(47)
¥659
¥228
2
1
—
3
—
¥232
$11,369
—
—
—
—
—
$12,226
$14,520
—
—
—
—
—
$12,708
$25,889
12,048
10,438
2,721
37
118
$24,933
$6,820
5,354
3,593
2,317
—
443
$6,707
$10,340
6,677
6,833
—
11
92
$10,287
$6,694
—
—
404
—
(417)
$5,872
$2,035
17
12
—
26
—
$2,067
25. Provisions
1) Statements of Changes in Provisions
Note AAsset retirement obligations are recorded to provide for the
removal of hazardous substances from plant equipment and
other facilities and the fulfillment of obligations to restore
leased buildings and other facilities to their original state. To
this end, the amount expected to be payable in the future is
discounted according to the expected period of use based
on estimates and other information obtained from
construction contractors.
The Santen Group predicts that the timing of the outflow
of economic benefits will primarily be after over one year
has passed from each fiscal year-end.
Note BThe provision for restructuring provides for expenditures to
be incurred in the course of implementing business
restructuring measures. It is provided for in the estimated
amount of the related expenses. Furthermore, the Santen
Group predicts that the timing of the outflow of economic
benefits will primarily be after over one year has passed
from each fiscal year-end.
Note CThe provision for paid absence recognizes a liability for the
unused portion of paid absence granted to employees
based on the paid absence system. The Santen Group
predicts that the timing of the outflow of economic benefits
will primarily be after over one year has passed from each
fiscal year-end.
Current
Breakdown on consolidatedstatement of financial position
Non-currentTotalOther
Provision forpaid absence
(Note C)
Provision forrestructuring
(Note B)
Asset retirementobligations
(Note A)
Balance as of April 1, 2016
Additional provision made in the period
Amounts used during the period
Unused amounts reversed during the period
The increase during the period in the discounted
amount arising from the passage of time
Foreign currency translation differences
Balance as of March 31, 2017
Millions of yen
Current
Breakdown on consolidatedstatement of financial position
Non-currentTotalOther
Provision forpaid absence
(Note C)
Provision forrestructuring
(Note B)
Asset retirementobligations(Note A)
Balance as of April 1, 2016
Additional provision made in the period
Amounts used during the period
Unused amounts reversed during the period
The increase during the period in the discounted
amount arising from the passage of time
Foreign currency translation differences
Balance as of March 31, 2017
Thousands of U.S. dollars
¥1,276
—
—
—
—
—
¥1,372
¥1,629
—
—
—
—
—
¥1,426
¥2,905
1,352
1,171
305
4
13
¥2,797
¥765
601
403
260
—
50
¥752
¥1,160
749
767
—
1
10
¥1,154
¥751
—
—
45
—
(47)
¥659
¥228
2
1
—
3
—
¥232
$11,369
—
—
—
—
—
$12,226
$14,520
—
—
—
—
—
$12,708
$25,889
12,048
10,438
2,721
37
118
$24,933
$6,820
5,354
3,593
2,317
—
443
$6,707
$10,340
6,677
6,833
—
11
92
$10,287
$6,694
—
—
404
—
(417)
$5,872
$2,035
17
12
—
26
—
$2,067
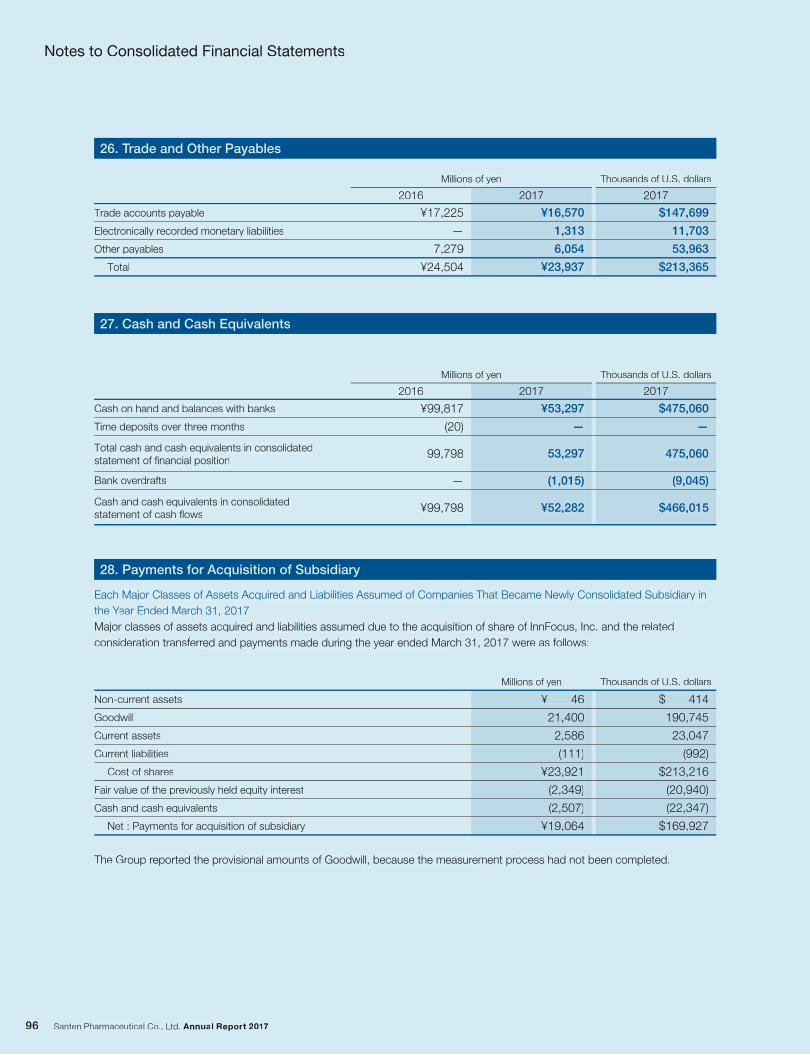
Notes to Consolidated Financial Statements
Millions of yen Thousands of U.S. dollars
20172016 2017
Millions of yen Thousands of U.S. dollars
$147,699
11,703
53,963
$213,365
¥17,225
—
7,279
¥24,504
¥16,570
1,313
6,054
¥23,937
26. Trade and Other Payables
Trade accounts payable
Electronically recorded monetary liabilities
Other payables
Total
Millions of yen Thousands of U.S. dollars
20172016 2017
$475,060
—
475,060
(9,045)
$466,015
¥99,817
(20)
99,798
—
¥99,798
¥53,297
—
53,297
(1,015)
¥52,282
27. Cash and Cash Equivalents
Cash on hand and balances with banks
Time deposits over three months
Bank overdrafts
Total cash and cash equivalents in consolidated statement of financial position
Cash and cash equivalents in consolidated statement of cash flows
¥ 46
21,400
2,586
(111)
¥23,921
(2,349)
(2,507)
¥19,064
$ 414
190,745
23,047
(992)
$213,216
(20,940)
(22,347)
$169,927
Non-current assets
Goodwill
Current assets
Current liabilities
Cost of shares
Fair value of the previously held equity interest
Cash and cash equivalents
Net : Payments for acquisition of subsidiary
28. Payments for Acquisition of Subsidiary
Each Major Classes of Assets Acquired and Liabilities Assumed of Companies That Became Newly Consolidated Subsidiary in
the Year Ended March 31, 2017
Major classes of assets acquired and liabilities assumed due to the acquisition of share of InnFocus, Inc. and the related
consideration transferred and payments made during the year ended March 31, 2017 were as follows:
The Group reported the provisional amounts of Goodwill, because the measurement process had not been completed.
Notes to Consolidated Financial Statements
Millions of yen Thousands of U.S. dollars
20172016 2017
Millions of yen Thousands of U.S. dollars
$147,699
11,703
53,963
$213,365
¥17,225
—
7,279
¥24,504
¥16,570
1,313
6,054
¥23,937
26. Trade and Other PayablesTT
Trade accounts payable
Electronically recorded monetary liabilities
Other payables
Total
Millions of yen Thousands of U.S. dollars
20172016 2017
$475,060
—
475,060
(9,045)
$466,015
¥99,817
(20)
99,798
—
¥99,798
¥53,297
—
53,297
(1,015)
¥52,282
27. Cash and Cash Equivalents
Cash on hand and balances with banks
Time deposits over three months
Bank overdrafts
Total cash and cash equivalents in consolidatedstatement of financial position
Cash and cash equivalents in consolidatedstatement of cash flows
¥ 46
21,400
2,586
(111)
¥23,921
(2,349)
(2,507)
¥19,064
$ 414
190,745
23,047
(992)
$213,216
(20,940)
(22,347)
$169,927
Non-current assets
Goodwill
Current assets
Current liabilities
Cost of shares
Fair value of the previously held equity interest
Cash and cash equivalents
Net : Payments for acquisition of subsidiary
28. Payments for Acquisition of Subsidiary
Each Major Classes of Assets Acquired and Liabilities Assumed of Companies That Became Newly Consolidated Subsidiary in
the Year Ended MarYY ch 31, 2017
Major classes of assets acquired and liabilities assumed due to the acquisition of share of InnFocus, Inc. and the related
consideration transferred and payments made during the year ended March 31, 2017 were as follows:
The Group reported the provisional amounts of Goodwill, because the measurement process had not been completed.
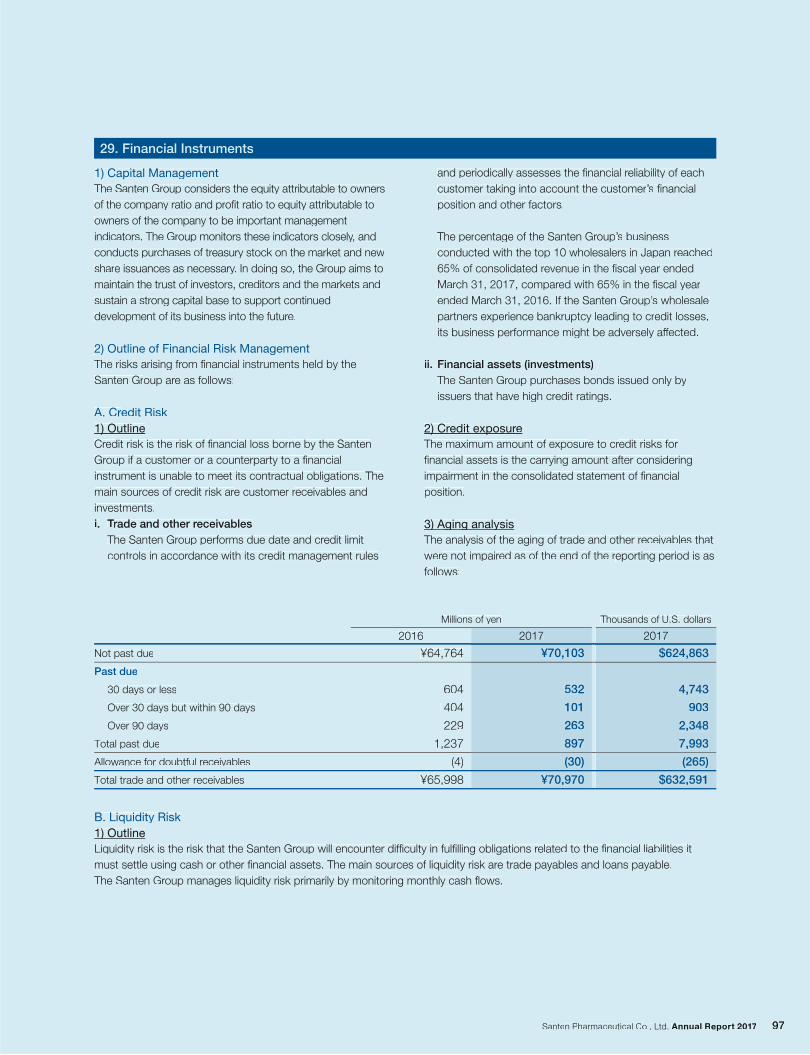
Millions of yen Thousands of U.S. dollars
20172016 2017
$624,863
4,743
903
2,348
7,993
(265)
$632,591
¥64,764
604
404
229
1,237
(4)
¥65,998
¥70,103
532
101
263
897
(30)
¥70,970
29. Financial Instruments
1) Capital Management
The Santen Group considers the equity attributable to owners
of the company ratio and profit ratio to equity attributable to
owners of the company to be important management
indicators. The Group monitors these indicators closely, and
conducts purchases of treasury stock on the market and new
share issuances as necessary. In doing so, the Group aims to
maintain the trust of investors, creditors and the markets and
sustain a strong capital base to support continued
development of its business into the future.
2) Outline of Financial Risk Management
The risks arising from financial instruments held by the
Santen Group are as follows:
A. Credit Risk
1) Outline
Credit risk is the risk of financial loss borne by the Santen
Group if a customer or a counterparty to a financial
instrument is unable to meet its contractual obligations. The
main sources of credit risk are customer receivables and
investments.
i. Trade and other receivables
The Santen Group performs due date and credit limit
controls in accordance with its credit management rules
and periodically assesses the financial reliability of each
customer taking into account the customer’s financial
position and other factors.
The percentage of the Santen Group’s business
conducted with the top 10 wholesalers in Japan reached
65% of consolidated revenue in the fiscal year ended
March 31, 2017, compared with 65% in the fiscal year
ended March 31, 2016. If the Santen Group’s wholesale
partners experience bankruptcy leading to credit losses,
its business performance might be adversely affected.
ii. Financial assets (investments)
The Santen Group purchases bonds issued only by
issuers that have high credit ratings.
2) Credit exposure
The maximum amount of exposure to credit risks for
financial assets is the carrying amount after considering
impairment in the consolidated statement of financial
position.
3) Aging analysis
The analysis of the aging of trade and other receivables that
were not impaired as of the end of the reporting period is as
follows:
B. Liquidity Risk
1) Outline
Liquidity risk is the risk that the Santen Group will encounter difficulty in fulfilling obligations related to the financial liabilities it
must settle using cash or other financial assets. The main sources of liquidity risk are trade payables and loans payable.
The Santen Group manages liquidity risk primarily by monitoring monthly cash flows.
Not past due
Past due
30 days or less
Over 30 days but within 90 days
Over 90 days
Total past due
Allowance for doubtful receivables
Total trade and other receivables
Millions of yen Thousands of U.S. dollars
20172016 2017
$624,863
4,743
903
2,348
7,993
(265)
$632,591
¥64,764
604
404
229
1,237
(4)
¥65,998
¥70,103
532
101
263
897
(30)
¥70,970
29. Financial Instruments
1) Capital Management
The Santen Group considers the equity attributable to owners
of the company ratio and profit ratio to equity attributable to
owners of the company to be important management
indicators. The Group monitors these indicators closely, andyy
conducts purchases of treasury stock on the market and new
share issuances as necessary. In doing so, the Gryy oup aims to
maintain the trust of investors, creditors and the markets and
sustain a strong capital base to support continued
development of its business into the future.
2) Outline of Financial Risk Management
The risks arising from financial instruments held by the
Santen Group are as follows:
A. Credit Risk
1) Outline
Credit risk is the risk of financial loss borne by the Santen
Group if a customer or a counterparty to a financial
instrument is unable to meet its contractual obligations. The
main sources of credit risk are customer receivables and
investments.
i. Trade and other rTT eceivables
The Santen Group performs due date and credit limit
controls in accordance with its credit management rules
and periodically assesses the financial reliability of each
customer taking into account the customer’s financial
position and other factors.
The percentage of the Santen Group’s business
conducted with the top 10 wholesalers in Japan reached
65% of consolidated revenue in the fiscal year ended
March 31, 2017, compared with 65% in the fiscal year
ended March 31, 2016. If the Santen Group’s wholesale
partners experience bankruptcy leading to credit losses,
its business performance might be adversely affected.ff
ii. Financial assets (investments)
The Santen Group purchases bonds issued only by
issuers that have high credit ratings.
2) Credit exposure
The maximum amount of exposure to credit risks for
financial assets is the carrying amount after considering
impairment in the consolidated statement of financial
position.
3) Aging analysis
The analysis of the aging of trade and other receivables that
were not impaired as of the end of the reporting period is as
follows:
B. Liquidity Risk
1) Outline
Liquidity risk is the risk that the Santen Group will encounter difficulty in fulfilling obligations rff elated to the financial liabilities it
must settle using cash or other financial assets. The main sources of liquidity risk are trade payables and loans payable.
The Santen Group manages liquidity risk primarily by monitoring monthly cash flows.
Not past due
Past due
30 days or less
Over 30 days but within 90 days
Over 90 days
Total past due
Allowance for doubtful receivables
Total trade and other receivables
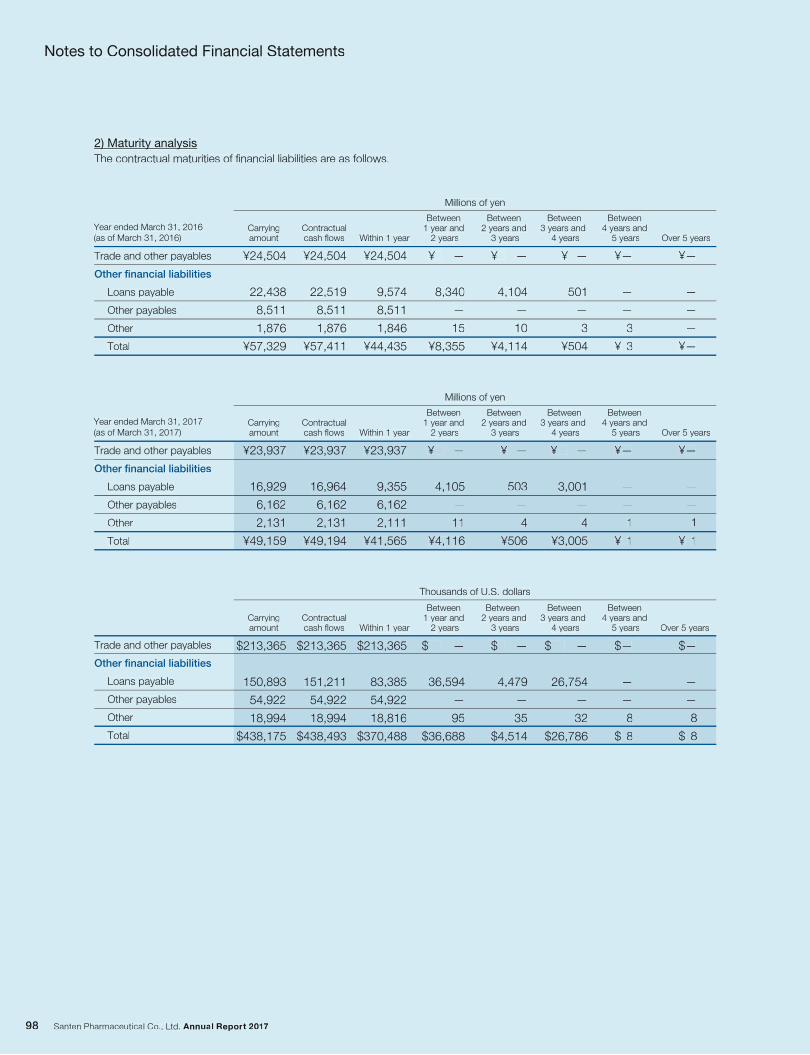
2) Maturity analysis
The contractual maturities of financial liabilities are as follows.
Between 4 years and
5 years
Between 3 years and
4 years
Between 2 years and
3 years
Between 1 year and
2 yearsWithin 1 yearContractualcash flows
Carryingamount Over 5 years
Millions of yen
Trade and other payables
Other financial liabilities
Loans payable
Other payables
Other
Total
Year ended March 31, 2017 (as of March 31, 2017)
Between 4 years and
5 years
¥—
—
—
3
¥ 3
Between 3 years and
4 years
¥ —
501
—
3
¥504
Between 2 years and
3 years
¥ —
4,104
—
10
¥4,114
Between 1 year and
2 years
¥ —
8,340
—
15
¥8,355
Within 1 year
¥24,504
9,574
8,511
1,846
¥44,435
Contractualcash flows
¥24,504
22,519
8,511
1,876
¥57,411
Carryingamount
¥24,504
22,438
8,511
1,876
¥57,329
Over 5 years
¥—
—
—
—
¥—
Millions of yen
Trade and other payables
Other financial liabilities
Loans payable
Other payables
Other
Total
Year ended March 31, 2016(as of March 31, 2016)
Between 4 years and
5 years
Between 3 years and
4 years
Between 2 years and
3 years
Between 1 year and
2 yearsWithin 1 yearContractualcash flows
Carryingamount Over 5 years
Thousands of U.S. dollars
Trade and other payables
Other financial liabilities
Loans payable
Other payables
Other
Total
Notes to Consolidated Financial Statements
¥23,937
9,355
6,162
2,111
¥41,565
¥23,937
16,964
6,162
2,131
¥49,194
¥23,937
16,929
6,162
2,131
¥49,159
¥—
—
—
1
¥ 1
¥ —
3,001
—
4
¥3,005
¥ —
503
—
4
¥506
¥ —
4,105
—
11
¥4,116
¥—
—
—
1
¥ 1
$213,365
83,385
54,922
18,816
$370,488
$213,365
151,211
54,922
18,994
$438,493
$213,365
150,893
54,922
18,994
$438,175
$—
—
—
8
$ 8
$ —
26,754
—
32
$26,786
$ —
4,479
—
35
$4,514
$ —
36,594
—
95
$36,688
$—
—
—
8
$ 8
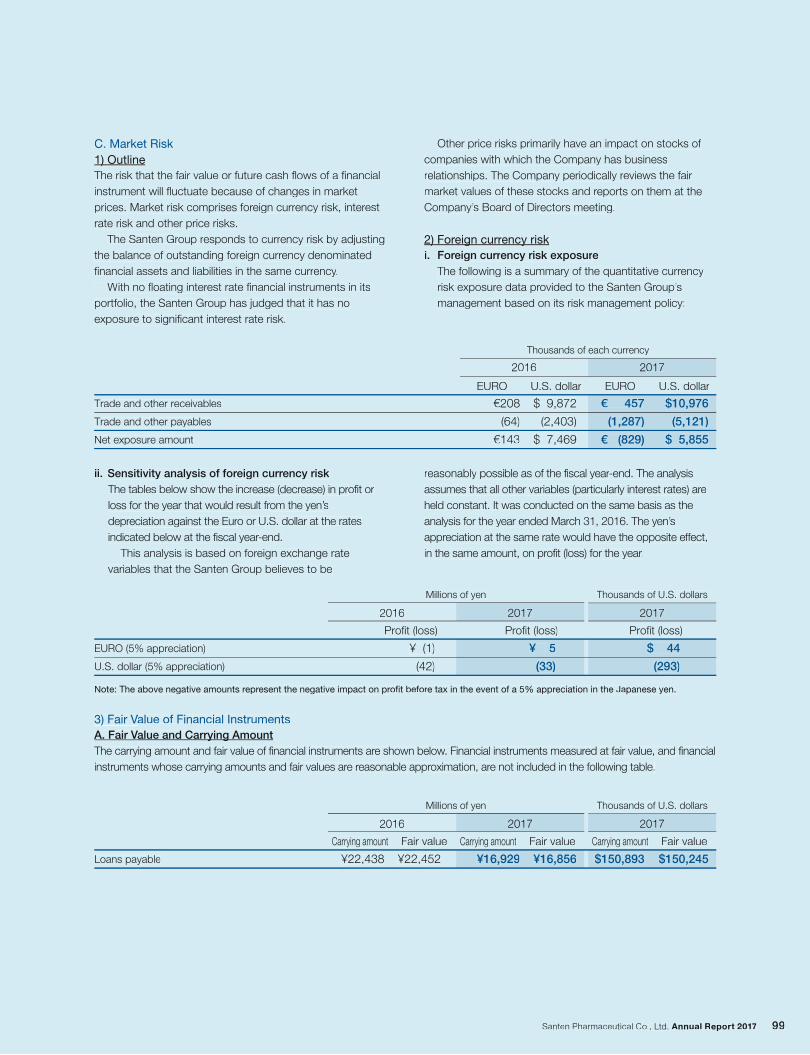
C. Market Risk
1) Outline
The risk that the fair value or future cash flows of a financial
instrument will fluctuate because of changes in market
prices. Market risk comprises foreign currency risk, interest
rate risk and other price risks.
The Santen Group responds to currency risk by adjusting
the balance of outstanding foreign currency denominated
financial assets and liabilities in the same currency.
With no floating interest rate financial instruments in its
portfolio, the Santen Group has judged that it has no
exposure to significant interest rate risk.
Other price risks primarily have an impact on stocks of
companies with which the Company has business
relationships. The Company periodically reviews the fair
market values of these stocks and reports on them at the
Company’s Board of Directors meeting.
2) Foreign currency risk
i. Foreign currency risk exposure
The following is a summary of the quantitative currency
risk exposure data provided to the Santen Group’s
management based on its risk management policy:
ii. Sensitivity analysis of foreign currency risk
The tables below show the increase (decrease) in profit or
loss for the year that would result from the yen’s
depreciation against the Euro or U.S. dollar at the rates
indicated below at the fiscal year-end.
This analysis is based on foreign exchange rate
variables that the Santen Group believes to be
reasonably possible as of the fiscal year-end. The analysis
assumes that all other variables (particularly interest rates) are
held constant. It was conducted on the same basis as the
analysis for the year ended March 31, 2016. The yen’s
appreciation at the same rate would have the opposite effect,
in the same amount, on profit (loss) for the year.
Trade and other receivables
Trade and other payables
Net exposure amount
Thousands of each currency
3) Fair Value of Financial Instruments
A. Fair Value and Carrying Amount
The carrying amount and fair value of financial instruments are shown below. Financial instruments measured at fair value, and financial
instruments whose carrying amounts and fair values are reasonable approximation, are not included in the following table.
Carrying amountFair valueCarrying amount Fair value Carrying amount Fair value
Loans payable
Millions of yen Thousands of U.S. dollars
$ 9,872
(2,403)
$ 7,469
€208
(64)
€143
2016
EURO U.S. dollar EURO U.S. dollar
$10,976
(5,121)
$ 5,855
€ 457
(1,287)
€ (829)
¥22,452 ¥16,929¥22,438
2016 2017
¥16,856 $150,893
2017
$150,245
Millions of yen Thousands of U.S. dollars
2016 2017 2017
EURO (5% appreciation)
U.S. dollar (5% appreciation)
Profit (loss)
¥ 5
(33)
¥ (1)
(42)
Profit (loss) Profit (loss)
$ 44
(293)
2017
Note: The above negative amounts represent the negative impact on profit before tax in the event of a 5% appreciation in the Japanese yen.
C. Market Risk
1) Outline
The risk that the fair value or future cash flows of a financial
instrument will fluctuate because of changes in market
prices. Market risk comprises foreign currency risk, interest
rate risk and other price risks.
The Santen Group responds to currency risk by adjusting
the balance of outstanding foreign currency denominated
financial assets and liabilities in the same currency.
With no floating interest rate financial instruments in its
portfolio, the Santen Group has judged that it has no
exposure to significant interest rate risk.
Other price risks primarily have an impact on stocks of
companies with which the Company has business
relationships. The Company periodically reviews the fair
market values of these stocks and reports on them at the
Company’s Board of Directors meeting.
2) Foreign currency risk
i. Foreign currency risk exposure
The following is a summary of the quantitative currency
risk exposure data provided to the Santen Group’s
management based on its risk management policy:
ii. Sensitivity analysis of foreign currency risk
The tables below show the increase (decrrr ease) in prrr ofit or rr
loss for the year that would result frrr om the yen’rr s’
depreciation against the Eurrr o or U.S. dollar at the ratesrr
indicated below at the fiscal year-end.rr
This analysis is based on foreign exchange rate
variables that the Santen Group believes to be
reasonably possible as of the fiscal year-end. The analysisrr
assumes that all other variables (particularly interest rates) arrr e rr
held constant. It was conducted on the same basis as the
analysis for the year ended March 31, 2016. The yen’rr s ’
appreciation at the same rate would have the opposite efrr fect,ff
in the same amount, on profit (loss) for the yearrr .rr
Trade and other receivables
Trade and other payables
Net exposure amount
Thousands of each currency
3) Fair Value of Financial InstrumentsVV
A. Fair Value and Carrying AmountVV
The carrying amount and fair value of financial instruments are shown belowrr . Financial instruments measured at fair value, andrr financial
instruments whose carrying amounts and fair values are rrr easonable apprrr oximation, arrr e not included in the following table.rr
Carrying amountFair valueCarrying amount Fair value Carrying amount Fair value
Loans payable
Millions of yen Thousands of U.S. dollars
$ 9,872
(2,403)
$ 7,469
€208
(64)
€143
2016
EURO U.S. dollar EURO U.S. dollar
$10,976
(5,121)
$ 5,855
€ 457
(1,287)
€ (829)
¥22,452 ¥16,929¥22,438
2016 2017
¥16,856 $150,893
2017
$150,245
Millions of yen Thousands of U.S. dollars
2016 2017 2017
EURO (5% appreciation)
U.S. dollar (5% appreciation)
Profit (loss)
¥ 5
(33)
¥ (1)
(42)
Profit (loss) Profit (loss)
$ 44
(293)
2017
Note: The above negative amounts represent the negative impact on profit before tax in the event of a 5% appreciation in the Japanese yen.
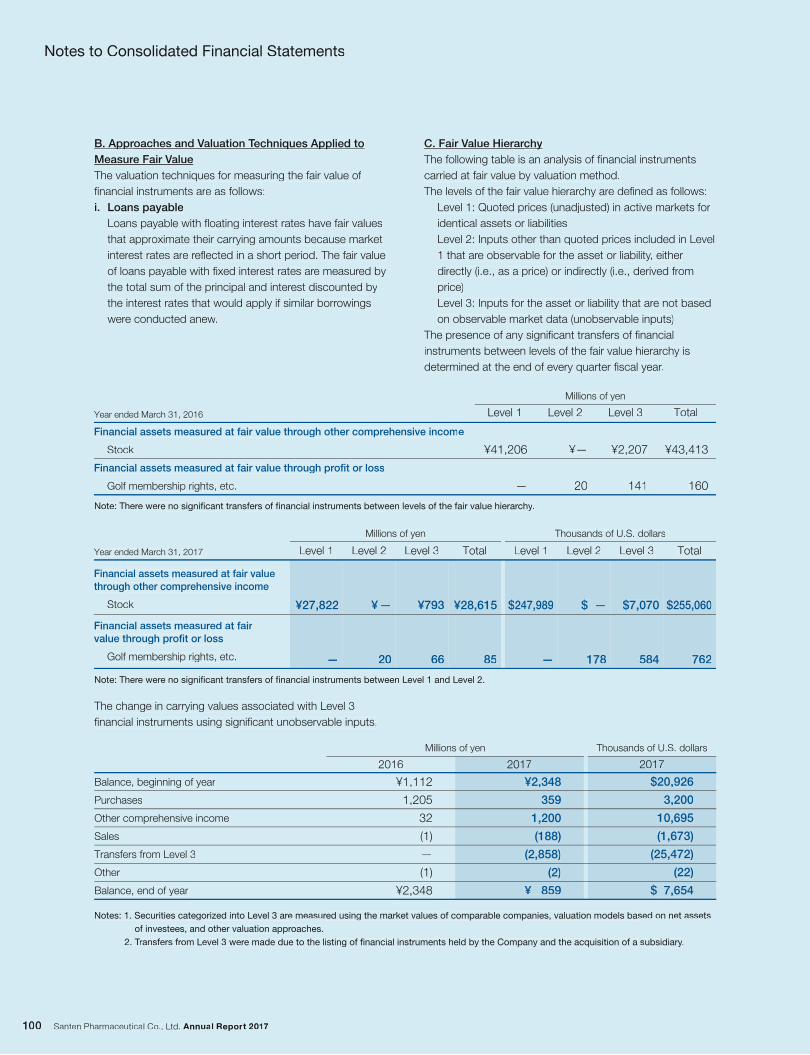
The change in carrying values associated with Level 3
financial instruments using significant unobservable inputs.
Total
¥43,413
160
Level 3
¥2,207
141
Level 2
¥—
20
Level 1
¥41,206
—
Millions of yen
Financial assets measured at fair value through other comprehensive income
Stock
Financial assets measured at fair value through profit or loss
Golf membership rights, etc.
Year ended March 31, 2016
Total
$255,060
762
Level 3
$7,070
584
Level 2
$ —
178
Level 1
$247,989
—
Thousands of U.S. dollars
Total
¥28,615
85
Level 3
¥793
66
Level 2
¥ —
20
Level 1
¥27,822
—
Millions of yen
Financial assets measured at fair valuethrough other comprehensive income
Stock
Financial assets measured at fair value through profit or loss
Golf membership rights, etc.
Year ended March 31, 2017
Balance, beginning of year
Purchases
Other comprehensive income
Sales
Transfers from Level 3
Other
Balance, end of year
Millions of yen Thousands of U.S. dollars
B. Approaches and Valuation Techniques Applied to
Measure Fair Value
The valuation techniques for measuring the fair value of
financial instruments are as follows:
i. Loans payable
Loans payable with floating interest rates have fair values
that approximate their carrying amounts because market
interest rates are reflected in a short period. The fair value
of loans payable with fixed interest rates are measured by
the total sum of the principal and interest discounted by
the interest rates that would apply if similar borrowings
were conducted anew.
C. Fair Value Hierarchy
The following table is an analysis of financial instruments
carried at fair value by valuation method.
The levels of the fair value hierarchy are defined as follows:
Level 1: Quoted prices (unadjusted) in active markets for
identical assets or liabilities
Level 2: Inputs other than quoted prices included in Level
1 that are observable for the asset or liability, either
directly (i.e., as a price) or indirectly (i.e., derived from
price)
Level 3: Inputs for the asset or liability that are not based
on observable market data (unobservable inputs)
The presence of any significant transfers of financial
instruments between levels of the fair value hierarchy is
determined at the end of every quarter fiscal year.
Notes to Consolidated Financial Statements
¥2,348
359
1,200
(188)
(2,858)
(2)
¥ 859
¥1,112
1,205
32
(1)
—
(1)
¥2,348
$20,926
3,200
10,695
(1,673)
(25,472)
(22)
$ 7,654
20172016 2017
Note: There were no significant transfers of financial instruments between levels of the fair value hierarchy.
Note: There were no significant transfers of financial instruments between Level 1 and Level 2.
Notes: 1. Securities categorized into Level 3 are measured using the market values of comparable companies, valuation models based on net assets
of investees, and other valuation approaches.
2. Transfers from Level 3 were made due to the listing of financial instruments held by the Company and the acquisition of a subsidiary.
The change in carrying values associated with Level 3
financial instruments using significant unobservable inputs.
Total
¥43,413
160
Level 3
¥2,207
141
Level 2
¥—
20
Level 1
¥41,206
—
Millions of yen
Financial assets measured at fair value through other comprehensive income
Stock
Financial assets measured at fair value through profit or loss
Golf membership rights, etc.
Year ended March 31, 2016
Total
$255,060
762
Level 3
$7,070
584
Level 2
$ —
178
Level 1
$247,989
—
Thousands of U.S. dollars
Total
¥28,615
85
Level 3
¥793
66
Level 2
¥—
20
Level 1
¥27,822
—
Millions of yen
Financial assets measured at fair valuethrough other comprehensive income
Stock
Financial assets measured at fair value through profit or loss
Golf membership rights, etc.
Year ended March 31, 2017
Balance, beginning of year
Purchases
Other comprehensive income
Sales
Transfers from Level 3
Other
Balance, end of year
Millions of yen Thousands of U.S. dollars
B. Approaches and Valuation TVV echniques Applied toTT
Measure Fair ValueVV
The valuation techniques for measuring the fair value of
financial instruments are as follows:
i. Loans payable
Loans payable with floating interest rates have fair values
that approximate their carrying amounts because market
interest rates are reflected in a short period. The fair value
of loans payable with fixed interest rates are measured by
the total sum of the principal and interest discounted by
the interest rates that would apply if similar borrowings
were conducted anew.
C. Fair Value HierarVV chy
The following table is an analysis of financial instruments
carried at fair value by valuation method.
The levels of the fair value hierarchy are defined as follows:
Level 1: Quoted prices (unadjusted) in active markets for
identical assets or liabilities
Level 2: Inputs other than quoted prices included in Level
1 that are observable for the asset or liability, either
directly (i.e., as a price) or indirectly (i.e., derived from
price)
Level 3: Inputs for the asset or liability that are not based
on observable market data (unobservable inputs)
The presence of any significant transfers of financial
instruments between levels of the fair value hierarchy is
determined at the end of every quarter fiscal year.
Notes to Consolidated Financial Statements
¥2,348
359
1,200
(188)
(2,858)
(2)
¥ 859
¥1,112
1,205
32
(1)
—
(1)
¥2,348
$20,926
3,200
10,695
(1,673)
(25,472)
(22)
$ 7,654
20172016 2017
Note: There were no significant transfers of financial instruments between levels of the fair value hierarchy.
Note: There were no significant transfers of financial instruments between Level 1 and Level 2.
Notes: 1. Securities categorized into Level 3 are measured using the market values of comparable companies, valuation models based on net assets
of investees, and other valuation approaches.
2. Transfers frTT om Level 3 were made due to the listing of financial instruments held by the Company and the acquisition of a subsidiary.
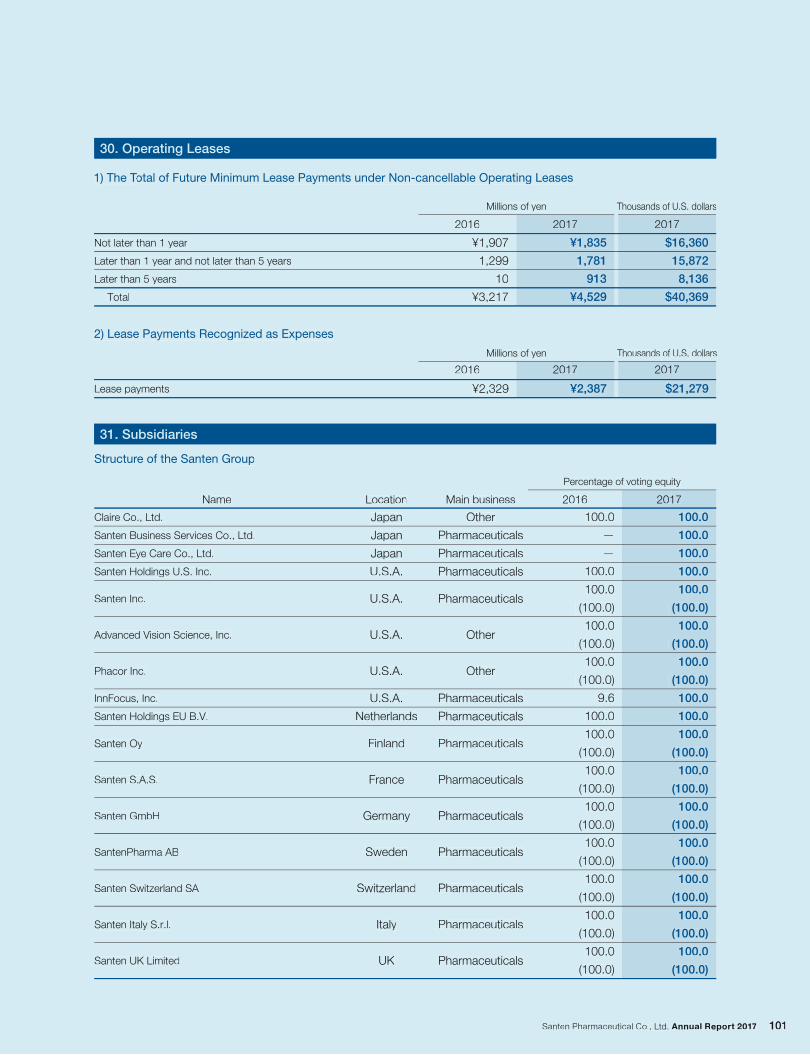
30. Operating Leases
2) Lease Payments Recognized as Expenses
Not later than 1 year
Later than 1 year and not later than 5 years
Later than 5 years
Total
Millions of yen
Millions of yen Thousands of U.S. dollars
Lease payments
1) The Total of Future Minimum Lease Payments under Non-cancellable Operating Leases
31. Subsidiaries
Structure of the Santen Group
Thousands of U.S. dollars
2016
¥1,907
1,299
10
¥3,217
2017
¥1,835
1,781
913
¥4,529
2017
$16,360
15,872
8,136
$40,369
2016
¥2,329
2017
¥2,387
2017
$21,279
Other
Pharmaceuticals
Pharmaceuticals
Pharmaceuticals
Pharmaceuticals
Other
Other
Pharmaceuticals
Pharmaceuticals
Pharmaceuticals
Pharmaceuticals
Pharmaceuticals
Pharmaceuticals
Pharmaceuticals
Pharmaceuticals
Pharmaceuticals
Japan
Japan
Japan
U.S.A.
U.S.A.
U.S.A.
U.S.A.
U.S.A.
Netherlands
Finland
France
Germany
Sweden
Switzerland
Italy
UK
100.0
—
—
100.0
100.0
(100.0)
100.0
(100.0)
100.0
(100.0)
9.6
100.0
100.0
(100.0)
100.0
(100.0)
100.0
(100.0)
100.0
(100.0)
100.0
(100.0)
100.0
(100.0)
100.0
(100.0)
Claire Co., Ltd.
Santen Business Services Co., Ltd.
Santen Eye Care Co., Ltd.
Santen Holdings U.S. Inc.
Santen Inc.
Advanced Vision Science, Inc.
Phacor Inc.
InnFocus, Inc.
Santen Holdings EU B.V.
Santen Oy
Santen S.A.S.
Santen GmbH
SantenPharma AB
Santen Switzerland SA
Santen Italy S.r.l.
Santen UK Limited
Percentage of voting equity
20172016Main businessLocationName
100.0
100.0
100.0
100.0
100.0
(100.0)
100.0
(100.0)
100.0
(100.0)
100.0
100.0
100.0
(100.0)
100.0
(100.0)
100.0
(100.0)
100.0
(100.0)
100.0
(100.0)
100.0
(100.0)
100.0
(100.0)
30. Operating Leases
2) Lease Payments Recognized as Expenses
Not later than 1 year
Later than 1 year and not later than 5 years
Later than 5 years
Total
Millions of yen
Millions of yen Thousands of U.S. dollars
Lease payments
1) The Total of FuturTT e Minimum Lease Payments under Non-cancellable Operating Leases
31. Subsidiaries
Structure of the Santen Group
Thousands of U.S. dollars
2016
¥1,907
1,299
10
¥3,217
2017
¥1,835
1,781
913
¥4,529
2017
$16,360
15,872
8,136
$40,369
2016
¥2,329
2017
¥2,387
2017
$21,279
Other
Pharmaceuticals
Pharmaceuticals
Pharmaceuticals
Pharmaceuticals
Other
Other
Pharmaceuticals
Pharmaceuticals
Pharmaceuticals
Pharmaceuticals
Pharmaceuticals
Pharmaceuticals
Pharmaceuticals
Pharmaceuticals
Pharmaceuticals
Japan
Japan
Japan
U.S.A.
U.S.A.
U.S.A.
U.S.A.
U.S.A.
Netherlands
Finland
France
Germany
Sweden
Switzerland
Italy
UK
100.0
—
—
100.0
100.0
(100.0)
100.0
(100.0)
100.0
(100.0)
9.6
100.0
100.0
(100.0)
100.0
(100.0)
100.0
(100.0)
100.0
(100.0)
100.0
(100.0)
100.0
(100.0)
100.0
(100.0)
Claire Co., Ltd.
Santen Business Services Co., Ltd.
Santen Eye Care Co., Ltd.
Santen Holdings U.S. Inc.
Santen Inc.
Advanced Vision Science, Inc.
Phacor Inc.
InnFocus, Inc.
Santen Holdings EU B.V.
Santen Oy
Santen S.A.S.
Santen GmbH
SantenPharma AB
Santen Switzerland SA
Santen Italy S.r.l.
Santen UK Limited
Percentage of voting equity
20172016Main businessLocationName
100.0
100.0
100.0
100.0
100.0
(100.0)
100.0
(100.0)
100.0
(100.0)
100.0
100.0
100.0
(100.0)
100.0
(100.0)
100.0
(100.0)
100.0
(100.0)
100.0
(100.0)
100.0
(100.0)
100.0
(100.0)
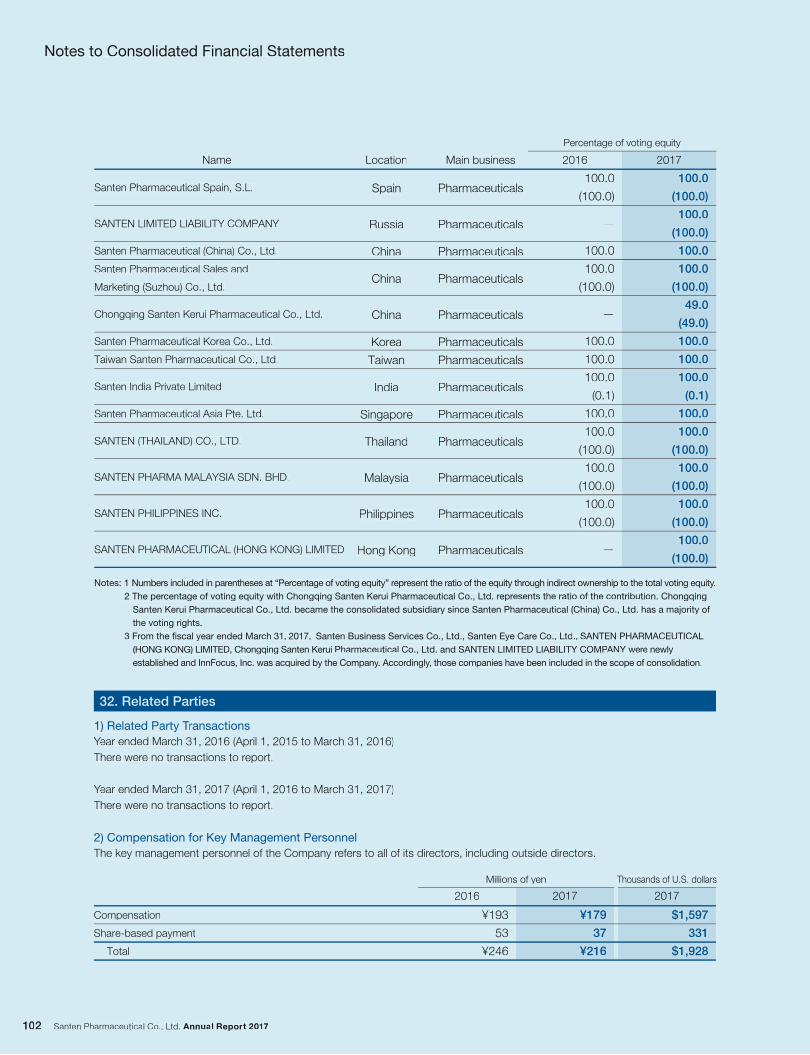
Notes to Consolidated Financial Statements
32. Related Parties
1) Related Party Transactions
Year ended March 31, 2016 (April 1, 2015 to March 31, 2016)
There were no transactions to report.
Year ended March 31, 2017 (April 1, 2016 to March 31, 2017)
There were no transactions to report.
2) Compensation for Key Management Personnel
The key management personnel of the Company refers to all of its directors, including outside directors.
Millions of yen Thousands of U.S. dollars
Compensation
Share-based payment
Total
2017
$1,597
331
$1,928
2016
¥193
53
¥246
2017
¥179
37
¥216
Pharmaceuticals
Pharmaceuticals
Pharmaceuticals
Pharmaceuticals
Pharmaceuticals
Pharmaceuticals
Pharmaceuticals
Pharmaceuticals
Pharmaceuticals
Pharmaceuticals
Pharmaceuticals
Pharmaceuticals
Pharmaceuticals
Spain
Russia
China
China
China
Korea
Taiwan
India
Singapore
Thailand
Malaysia
Philippines
Hong Kong
100.0
(100.0)
—
100.0
100.0
(100.0)
—
100.0
100.0
100.0
(0.1)
100.0
100.0
(100.0)
100.0
(100.0)
100.0
(100.0)
—
Santen Pharmaceutical Spain, S.L.
SANTEN LIMITED LIABILITY COMPANY
Santen Pharmaceutical (China) Co., Ltd.
Santen Pharmaceutical Sales and
Marketing (Suzhou) Co., Ltd.
Chongqing Santen Kerui Pharmaceutical Co., Ltd.
Santen Pharmaceutical Korea Co., Ltd.
Taiwan Santen Pharmaceutical Co., Ltd.
Santen India Private Limited
Santen Pharmaceutical Asia Pte. Ltd.
SANTEN (THAILAND) CO., LTD.
SANTEN PHARMA MALAYSIA SDN. BHD.
SANTEN PHILIPPINES INC.
SANTEN PHARMACEUTICAL (HONG KONG) LIMITED
Percentage of voting equity
20172016Main businessLocationName
100.0
(100.0)
100.0
(100.0)
100.0
100.0
(100.0)
49.0
(49.0)
100.0
100.0
100.0
(0.1)
100.0
100.0
(100.0)
100.0
(100.0)
100.0
(100.0)
100.0
(100.0)
Notes: 1 Numbers included in parentheses at “Percentage of voting equity” represent the ratio of the equity through indirect ownership to the total voting equity.
2 The percentage of voting equity with Chongqing Santen Kerui Pharmaceutical Co., Ltd. represents the ratio of the contribution. Chongqing
Santen Kerui Pharmaceutical Co., Ltd. became the consolidated subsidiary since Santen Pharmaceutical (China) Co., Ltd. has a majority of
the voting rights.
3 From the fiscal year ended March 31, 2017, Santen Business Services Co., Ltd., Santen Eye Care Co., Ltd., SANTEN PHARMACEUTICAL
(HONG KONG) LIMITED, Chongqing Santen Kerui Pharmaceutical Co., Ltd. and SANTEN LIMITED LIABILITY COMPANY were newly
established and InnFocus, Inc. was acquired by the Company. Accordingly, those companies have been included in the scope of consolidation.
Notes to Consolidated Financial Statements
32. Related Parties
1) Related Party TransactionsTT
Year ended MarYY ch 31, 2016 (April 1, 2015 to March 31, 2016)
There were no transactions to report.
Year ended MarYY ch 31, 2017 (April 1, 2016 to March 31, 2017)
There were no transactions to report.
2) Compensation for Key Management Personnel
The key management personnel of the Company refers to all of its directors, including outside directors.
Millions of yen Thousands of U.S. dollars
Compensation
Share-based payment
Total
2017
$1,597
331
$1,928
2016
¥193
53
¥246
2017
¥179
37
¥216
Pharmaceuticals
Pharmaceuticals
Pharmaceuticals
Pharmaceuticals
Pharmaceuticals
Pharmaceuticals
Pharmaceuticals
Pharmaceuticals
Pharmaceuticals
Pharmaceuticals
Pharmaceuticals
Pharmaceuticals
Pharmaceuticals
Spain
Russia
China
China
China
Korea
Taiwan
India
Singapore
Thailand
Malaysia
Philippines
Hong Kong
100.0
(100.0)
—
100.0
100.0
(100.0)
—
100.0
100.0
100.0
(0.1)
100.0
100.0
(100.0)
100.0
(100.0)
100.0
(100.0)
—
Santen Pharmaceutical Spain, S.L.
SANTEN LIMITED LIABILITY COMPANY
Santen Pharmaceutical (China) Co., Ltd.
Santen Pharmaceutical Sales and
Marketing (Suzhou) Co., Ltd.
Chongqing Santen Kerui Pharmaceutical Co., Ltd.
Santen Pharmaceutical Korea Co., Ltd.
Taiwan Santen Pharmaceutical Co., Ltd.
Santen India Private Limited
Santen Pharmaceutical Asia Pte. Ltd.
SANTEN (THAILAND) CO., LTD.
SANTEN PHARMA MALAYSIA SDN. BHD.
SANTEN PHILIPPINES INC.
SANTEN PHARMACEUTICAL (HONG KONG) LIMITED
Percentage of voting equity
20172016Main businessLocationName
100.0
(100.0)
100.0
(100.0)
100.0
100.0
(100.0)
49.0
(49.0)
100.0
100.0
100.0
(0.1)
100.0
100.0
(100.0)
100.0
(100.0)
100.0
(100.0)
100.0
(100.0)
Notes: 1 Numbers included in parentheses at “Perrr centage of voting equity” rrr eprrr esent the ratio of the equity thrrr ough indirrr ect ownershiprr to the total voting equity.yy
2 The percentage of voting equity with Chongqing Santen Kerui Pharmaceutical Co., Ltd. represents the ratio of the contribution. Chongqing
Santen Kerui Pharmaceutical Co., Ltd. became the consolidated subsidiary since Santen Pharmaceutical (China) Co., Ltd. has a majority of
the voting rights.
3 From the fiscal year ended March 31, 2017, Santen Business Services Co., Ltd., Santen Eye Care Co., Ltd., SANTEN PHARMACEUTICAL
(HONG KONG) LIMITED, Chongqing Santen Kerui Pharmaceutical Co., Ltd. and SANTEN LIMITED LIABILITY COMPANYPP wererr newly
established and InnFocus, Inc. was acquired by the Companyrr . Accoryy dinglyr , those companies have been included in the scope of conyy solidation.
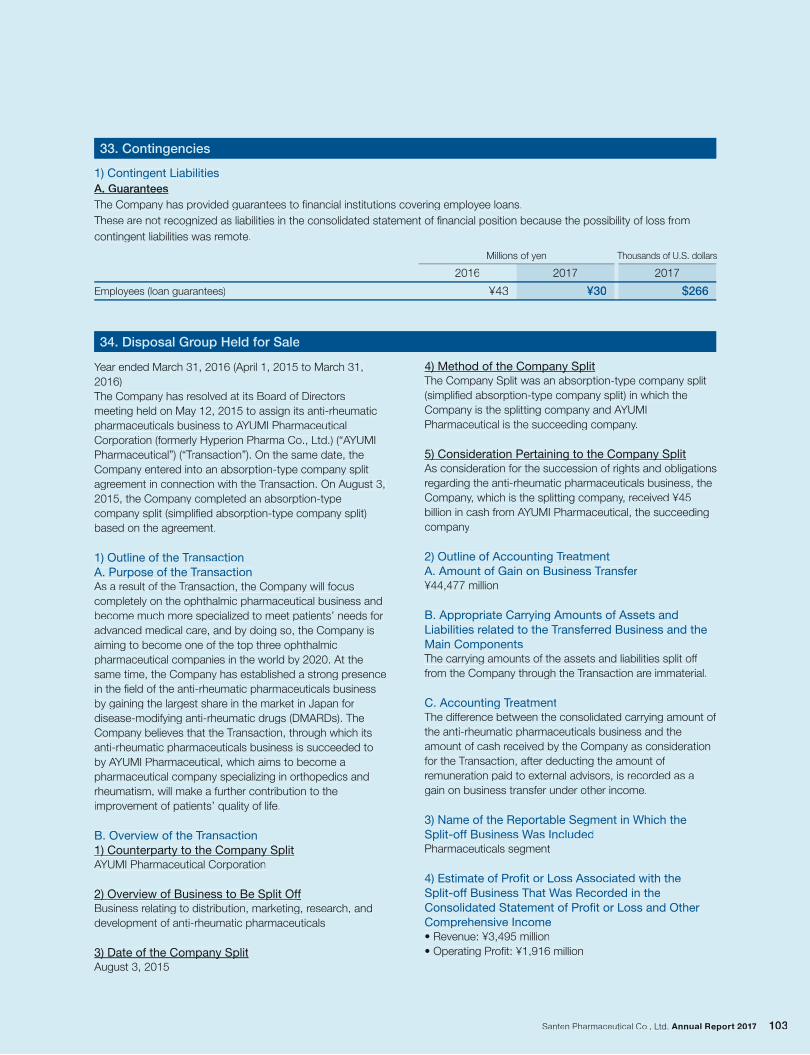
33. Contingencies
1) Contingent Liabilities
A. Guarantees
The Company has provided guarantees to financial institutions covering employee loans.
These are not recognized as liabilities in the consolidated statement of financial position because the possibility of loss from
contingent liabilities was remote.
Employees (loan guarantees)
Millions of yen
2016
¥43
2017
¥30
2017
$266
Thousands of U.S. dollars
34. Disposal Group Held for Sale
Year ended March 31, 2016 (April 1, 2015 to March 31,
2016)
The Company has resolved at its Board of Directors
meeting held on May 12, 2015 to assign its anti-rheumatic
pharmaceuticals business to AYUMI Pharmaceutical
Corporation (formerly Hyperion Pharma Co., Ltd.) (“AYUMI
Pharmaceutical”) (“Transaction”). On the same date, the
Company entered into an absorption-type company split
agreement in connection with the Transaction. On August 3,
2015, the Company completed an absorption-type
company split (simplified absorption-type company split)
based on the agreement.
1) Outline of the TransactionA. Purpose of the TransactionAs a result of the Transaction, the Company will focus
completely on the ophthalmic pharmaceutical business and
become much more specialized to meet patients’ needs for
advanced medical care, and by doing so, the Company is
aiming to become one of the top three ophthalmic
pharmaceutical companies in the world by 2020. At the
same time, the Company has established a strong presence
in the field of the anti-rheumatic pharmaceuticals business
by gaining the largest share in the market in Japan for
disease-modifying anti-rheumatic drugs (DMARDs). The
Company believes that the Transaction, through which its
anti-rheumatic pharmaceuticals business is succeeded to
by AYUMI Pharmaceutical, which aims to become a
pharmaceutical company specializing in orthopedics and
rheumatism, will make a further contribution to the
improvement of patients’ quality of life.
B. Overview of the Transaction1) Counterparty to the Company SplitAYUMI Pharmaceutical Corporation
2) Overview of Business to Be Split OffBusiness relating to distribution, marketing, research, and
development of anti-rheumatic pharmaceuticals
3) Date of the Company SplitAugust 3, 2015
4) Method of the Company SplitThe Company Split was an absorption-type company split
(simplified absorption-type company split) in which the
Company is the splitting company and AYUMI
Pharmaceutical is the succeeding company.
5) Consideration Pertaining to the Company SplitAs consideration for the succession of rights and obligations
regarding the anti-rheumatic pharmaceuticals business, the
Company, which is the splitting company, received ¥45
billion in cash from AYUMI Pharmaceutical, the succeeding
company.
2) Outline of Accounting TreatmentA. Amount of Gain on Business Transfer¥44,477 million
B. Appropriate Carrying Amounts of Assets and Liabilities related to the Transferred Business and the Main ComponentsThe carrying amounts of the assets and liabilities split off
from the Company through the Transaction are immaterial.
C. Accounting TreatmentThe difference between the consolidated carrying amount of
the anti-rheumatic pharmaceuticals business and the
amount of cash received by the Company as consideration
for the Transaction, after deducting the amount of
remuneration paid to external advisors, is recorded as a
gain on business transfer under other income.
3) Name of the Reportable Segment in Which the Split-off Business Was IncludedPharmaceuticals segment
4) Estimate of Profit or Loss Associated with the Split-off Business That Was Recorded in the Consolidated Statement of Profit or Loss and Other Comprehensive Income• Revenue: ¥3,495 million
• Operating Profit: ¥1,916 million
33. Contingencies
1) Contingent Liabilities
A. Guarantees
The Company has provided guarantees to financial institutions covering employee loans.
These are not recognized as liabilities in the consolidated statement of financial position because the possibility of loss from
contingent liabilities was remote.
Employees (loan guarantees)
Millions of yen
2016
¥43
2017
¥30
2017
$266
Thousands of U.S. dollars
34. Disposal Group Held for Sale
Year ended MarYY ch 31, 2016 (April 1, 2015 to March 31,
2016)
The Company has resolved at its Board of Directors
meeting held on May 12, 2015 to assign its anti-rheumatic
pharmaceuticals business to AYUMI PharmaceuticalAA
Corporation (formerly Hyperion Pharma Co., Ltd.) (“AYUMIAA
Pharmaceutical”) (“Transaction”). On the same date, theTT
Company entered into an absorption-type company split
agreement in connection with the Transaction. On August 3,TT
2015, the Company completed an absorption-type
company split (simplified absorption-type company split)
based on the agreement.
1) Outline of the TransactionTTA. Purpose of the TransactionTTAs a result of the Transaction, the Company will focusTT
completely on the ophthalmic pharmaceutical business and
become much more specialized to meet patients’ needs for
advanced medical care, and by doing so, the Company is
aiming to become one of the top three ophthalmic
pharmaceutical companies in the world by 2020. At the
same time, the Company has established a strong presence
in the field of the anti-rheumatic pharmaceuticals business
by gaining the largest share in the market in Japan for
disease-modifying anti-rheumatic drugs (DMARDs). The
Company believes that the Transaction, thrTT ough which its
anti-rheumatic pharmaceuticals business is succeeded to
by AYUMI Pharmaceutical, which aims to become aAA
pharmaceutical company specializing in orthopedics and
rheumatism, will make a further contribution to the
improvement of patients’ quality of life.
B. Overview of the TransactionTT1) Counterparty to the Company SplitAYUMI Pharmaceutical CorporationAA
2) Overview of Business to Be Split OffffBusiness relating to distribution, marketing, research, and
development of anti-rheumatic pharmaceuticals
3) Date of the Company SplitAugust 3, 2015
4) Method of the Company SplitThe Company Split was an absorption-type company split
(simplified absorption-type company split) in which the
Company is the splitting company and AYUMIAA
Pharmaceutical is the succeeding company.
5) Consideration Pertaining to the Company SplitAs consideration for the succession of rights and obligations
regarding the anti-rheumatic pharmaceuticals business, the
Company, which is the splitting company, received ¥45
billion in cash from AYUMI Pharmaceutical, the succeedingAA
company.
2) Outline of Accounting TreatmentA. Amount of Gain on Business TransfeTT r¥44,477 million
B. Appropriate Carrying Amounts of Assets and Liabilities related to the TransferrTT ed Business and the Main ComponentsThe carrying amounts of the assets and liabilities split offff
from the Company through the Transaction arTT e immaterial.
C. Accounting TreatmentThe differff ence between the consolidated carrying amount of
the anti-rheumatic pharmaceuticals business and the
amount of cash received by the Company as consideration
for the Transaction, after deducting the amount of TT
remuneration paid to external advisors, is recorded as a
gain on business transfer under other income.
3) Name of the Reportable Segment in Which the Split-off Business Wff as IncludedPharmaceuticals segment
4) Estimate of Profit or Loss Associated with the Split-off Business That Wff as Recorded in the Consolidated Statement of Profit or Loss and Other Comprehensive Income• Revenue: ¥3,495 million
• Operating Profit: ¥1,916 million
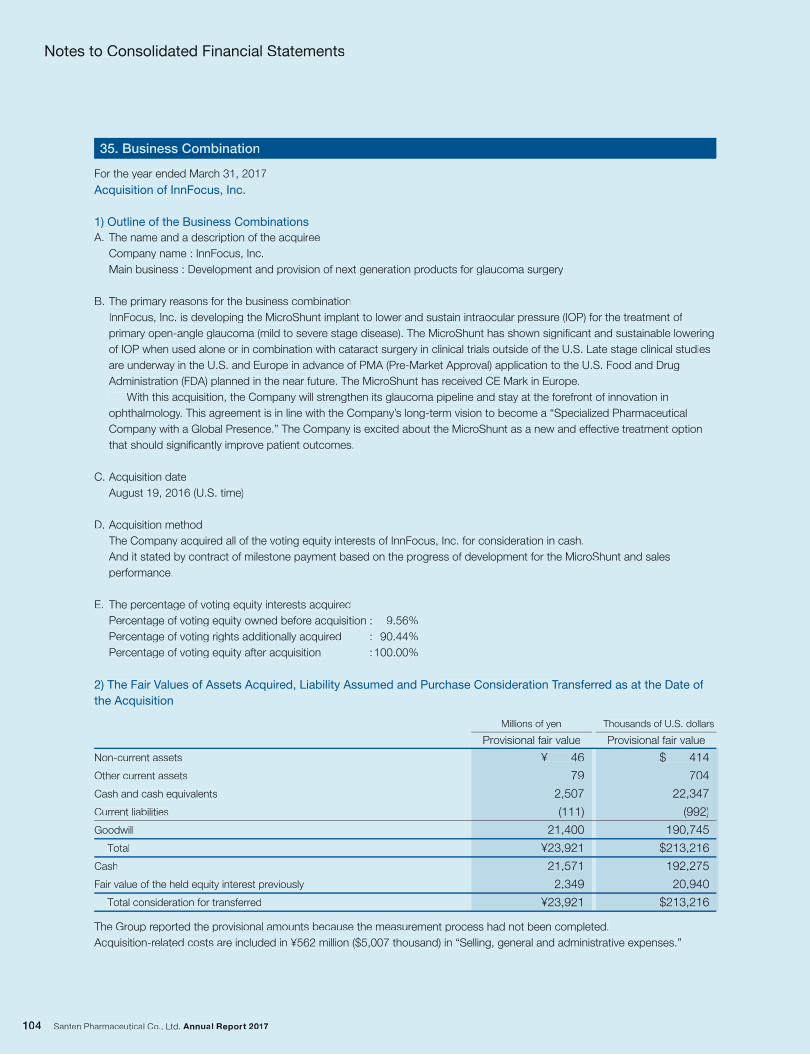
35. Business Combination
For the year ended March 31, 2017
Acquisition of InnFocus, Inc.
1) Outline of the Business Combinations
A. The name and a description of the acquiree
Company name : InnFocus, Inc.
Main business : Development and provision of next generation products for glaucoma surgery
B. The primary reasons for the business combination
InnFocus, Inc. is developing the MicroShunt implant to lower and sustain intraocular pressure (IOP) for the treatment of
primary open-angle glaucoma (mild to severe stage disease). The MicroShunt has shown significant and sustainable lowering
of IOP when used alone or in combination with cataract surgery in clinical trials outside of the U.S. Late stage clinical studies
are underway in the U.S. and Europe in advance of PMA (Pre-Market Approval) application to the U.S. Food and Drug
Administration (FDA) planned in the near future. The MicroShunt has received CE Mark in Europe.
With this acquisition, the Company will strengthen its glaucoma pipeline and stay at the forefront of innovation in
ophthalmology. This agreement is in line with the Company’s long-term vision to become a “Specialized Pharmaceutical
Company with a Global Presence.” The Company is excited about the MicroShunt as a new and effective treatment option
that should significantly improve patient outcomes.
C. Acquisition date
August 19, 2016 (U.S. time)
D. Acquisition method
The Company acquired all of the voting equity interests of InnFocus, Inc. for consideration in cash.
And it stated by contract of milestone payment based on the progress of development for the MicroShunt and sales
performance.
E. The percentage of voting equity interests acquired
Percentage of voting equity owned before acquisition : 9.56%
Percentage of voting rights additionally acquired : 90.44%
Percentage of voting equity after acquisition : 100.00%
2) The Fair Values of Assets Acquired, Liability Assumed and Purchase Consideration Transferred as at the Date of
the Acquisition
The Group reported the provisional amounts because the measurement process had not been completed.
Acquisition-related costs are included in ¥562 million ($5,007 thousand) in “Selling, general and administrative expenses.”
Notes to Consolidated Financial Statements
Non-current assets
Other current assets
Cash and cash equivalents
Current liabilities
Goodwill
Total
Cash
Fair value of the held equity interest previously
Total consideration for transferred
¥ 46
79
2,507
(111)
21,400
¥23,921
21,571
2,349
¥23,921
$ 414
704
22,347
(992)
190,745
$213,216
192,275
20,940
$213,216
Millions of yen Thousands of U.S. dollars
Provisional fair valueProvisional fair value
35. Business Combination
For the year ended March 31, 2017
Acquisition of InnFocus, Inc.
1) Outline of the Business Combinations
A. The name and a description of the acquiree
Company name : InnFocus, Inc.
Main business : Development and provision of next generation products for glaucoma surgery
B. The primary reasons for the business combination
InnFocus, Inc. is developing the MicroShunt implant to lower and sustain intraocular pressure (IOP) for the treatment of
primary open-angle glaucoma (mild to severe stage disease). The MicroShunt has shown significant and sustainable lowering
of IOP when used alone or in combination with cataract surgery in clinical trials outside of the U.S. Late stage clinical studies
are underway in the U.S. and Europe in advance of PMA (Pre-Market Approval) application to the U.S. Food and Drug
Administration (FDA) planned in the near future. The MicroShunt has received CE Mark in Europe.
With this acquisition, the Company will strengthen its glaucoma pipeline and stay at the forefront of innovation in
ophthalmology. This agreement is in line with the Company’s long-term vision to become a “Specialized Pharmaceutical
Company with a Global Presence.” The Company is excited about the MicroShunt as a new and effective trff eatment option
that should significantly improve patient outcomes.
C. Acquisition date
August 19, 2016 (U.S. time)
D. Acquisition method
The Company acquired all of the voting equity interests of InnFocus, Inc. for consideration in cash.
And it stated by contract of milestone payment based on the progress of development for the MicroShunt and sales
performance.
E. The percentage of voting equity interests acquired
Percentage of voting equity owned before acquisition : 9.56%
Percentage of voting rights additionally acquired : 90.44%
Percentage of voting equity after acquisition :100.00%
2) The Fair Values of Assets AcquirVV ed, Liability Assumed and Purchase Consideration TransferrTT ed as at the Date of
the Acquisition
The Group reported the provisional amounts because the measurement process had not been completed.
Acquisition-related costs are included in ¥562 million ($5,007 thousand) in “Selling, general and administrative expenses.”
Notes to Consolidated Financial Statements
Non-current assets
Other current assets
Cash and cash equivalents
Current liabilities
Goodwill
Total
Cash
Fair value of the held equity interest previously
Total consideration for transferred
¥ 46
79
2,507
(111)
21,400
¥23,921
21,571
2,349
¥23,921
$ 414
704
22,347
(992)
190,745
$213,216
192,275
20,940
$213,216
Millions of yen Thousands of U.S. dollars
Provisional fair valueProvisional fair value
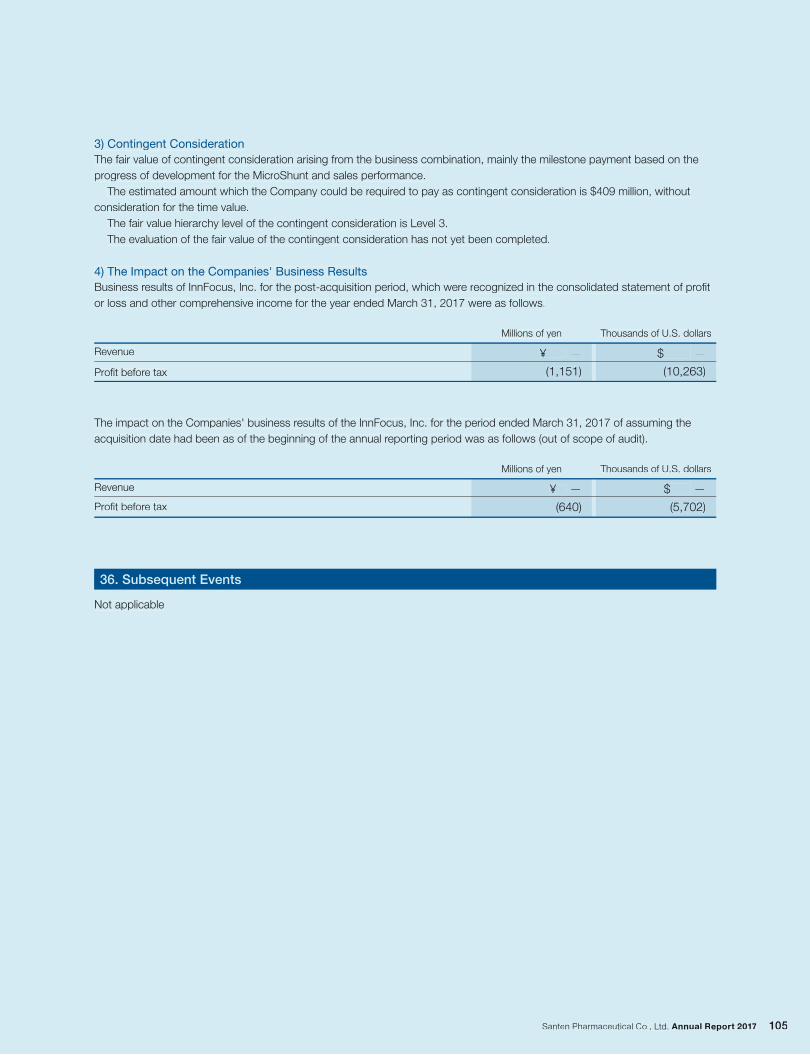
$ —
(5,702)
¥ —
(640)
The impact on the Companies' business results of the InnFocus, Inc. for the period ended March 31, 2017 of assuming the
acquisition date had been as of the beginning of the annual reporting period was as follows (out of scope of audit).
36. Subsequent Events
Not applicable
3) Contingent Consideration
The fair value of contingent consideration arising from the business combination, mainly the milestone payment based on the
progress of development for the MicroShunt and sales performance.
The estimated amount which the Company could be required to pay as contingent consideration is $409 million, without
consideration for the time value.
The fair value hierarchy level of the contingent consideration is Level 3.
The evaluation of the fair value of the contingent consideration has not yet been completed.
4) The Impact on the Companies' Business Results
Business results of InnFocus, Inc. for the post-acquisition period, which were recognized in the consolidated statement of profit
or loss and other comprehensive income for the year ended March 31, 2017 were as follows.
Revenue
Profit before tax
Millions of yen Thousands of U.S. dollars
Millions of yen Thousands of U.S. dollars
Revenue
Profit before tax
$ —
(10,263)
¥ —
(1,151)
$ —
(5,702)
¥ —
(640)
The impact on the Companies' business results of the InnFocus, Inc. for the period ended March 31, 2017 of assuming the
acquisition date had been as of the beginning of the annual reporting period was as follows (out of scope of audit).
36. Subsequent Events
Not applicable
3) Contingent Consideration
The fair value of contingent consideration arising from the business combination, mainly the milestone payment based on the
progress of development for the MicroShunt and sales performance.
The estimated amount which the Company could be required to pay as contingent consideration is $409 million, without
consideration for the time value.
The fair value hierarchy level of the contingent consideration is Level 3.
The evaluation of the fair value of the contingent consideration has not yet been completed.
4) The Impact on the Companies' Business Results
Business results of InnFocus, Inc. for the post-acquisition period, which were recognized in the consolidated statement of profit
or loss and other comprehensive income for the year ended March 31, 2017 were as follows.
Revenue
Profit before tax
Millions of yen Thousands of U.S. dollars
Millions of yen Thousands of U.S. dollars
Revenue
Profit before tax
$ —
(10,263)
¥ —
(1,151)
Internal Control Report
Akira KurokawaPresident & CEO
Kazuo KoshijiCFO
August 4, 2017
1 Framework of internal control over financial reportingWe, as President and CEO of Santen Pharmaceutical Co., Ltd. (the Company) and CFO of the Company, are responsible for the designand operation of internal controls over financial reporting (“ICOFR”) and establishing and maintaining an ICOFR based on the framework of ICOFR in Japan in accordance with “On the Setting of the Standards and Practice Standards for Management Assessment and Auditconcerning Internal Control Over Financial Report (Business Accounting Council (Council Opinions), February 15, 2007).”
Internal control aims at achieving the objectives to a reasonable extent with the organized and integrated function of individualcomponent as a whole. Therefore ICOFR does not provide an absolute assurance for preventing and detecting all errors to consolidated financial statements.
2 Assessment Scope, Timing and ProceduresBasis of Presenting Internal Control ReportThe report on ICOFR of the consolidated financial statements of the Company (“Internal Control Report”) is prepared on the basis of generally accepted assessment standards of internal control over financial reporting in Japan (“Assessment Standards”) and is compiledfrom the Internal Control Report prepared by the Company as required by the Financial Instruments and Exchange Law of Japan (“Law”).
The Assessment Standards require management to assess ICOFR, which consists of the internal controls over the consolidated financial statements included in the Annual Securities Report filed under the Law and the internal control over disclosure information andothers included in the Annual Securities Report that materially affects the reliability of the financial statements.
The scope of management’s assessment of ICOFR in this annual report is different from the scope required by the Assessment Standards. Management assessment of ICOFR in this annual report covers the ICOFR with respect to the accompanying consolidated financial statements only. In addition, the accompanying consolidated financial statements are reclassified and modified from theconsolidated financial statements prepared for the purpose of the Law. Supplementary information is also added to the consolidatedfinancial statements. The process of making reclassifications and modifications and the addition of certain information is for theconvenience of readers outside Japan. Management voluntarily includes the process in its assessment of ICOFR, even though it isoutside the scope of the Assessment Standards.
Scope of AssessmentManagement’s assessment of ICOFR was conducted as of March 31, 2017 in accordance with the Assessment Standards.
In evaluating internal controls, management first assessed internal controls that have a material impact on overall consolidated financial reporting (“company-level controls”) and, based on the results, selected business process to be assessed. For assessment of process level controls management analyzed the selected business processes, identified a key control that would have a materialimpact on the reliability of financial reporting, and assessed effectiveness of internal controls through assessing design and operation of the key controls.
Management assessed the effectiveness of the ICOFR applicable for the Company and its subsidiaries, to extent necessary in light of their degree of impact on the reliability of financial reporting. Management determined materiality for reliability of financial reporting in light of their degree of quantitative and qualitative impact on financial reporting. From the results of the company-level controls assessment of the Company and two subsidiaries, management determined a reasonable scope for process level controls to be assessed.
Management selected the Pharmaceuticals business unit of the Company as the significant business unit for assessing process level controls, as its revenue was more than 2/3 of the previous fiscal year’s consolidated revenue. The process related to revenue, account receivables and inventories from the Pharmaceuticals business unit of the Company was selected for process level control assessment as they have significant relation to the business objectives of the Company. Apart from selected significant business units, including other business units, processes whose accounts were determined to have a high risk of misstatement and involves significant use of management estimate and projection, and processes whose businesses or operations included high risk transactions were additionally selected for controls assessment.
3 Results of assessmentBased on our assessment procedures noted above, we concluded the Company’s internal control over financial reporting was effective as of March 31, 2017.
4 Supplementary informationNo subsequent events have arisen that has caused to materially affect our evaluation of the effectiveness on the internal control over financial reporting as of March 31, 2017.
5 OtherNone.
Internal Control Report
Akira KurokawaPresident & CEO
Kazuo KoshijiCFO
August 4, 2017
1 Framework of internal control over financial reportingWe, as President and CEO of Santen Pharmaceutical Co., Ltd. (the Company)yy and CFO of the Company, are responsible for the designand operation of internal controls over financial reporting (“ICOFR”) and establishing and maintaining an ICOFR based on the frameworkof ICOFR in Japan in accordance with “On the Setting of the Standards and Practice Standards for Management Assessment and Auditconcerning Internal Control Over Financial Report (Business Accounting Council (Council Opinions), February 15, 2007).”
Internal control aims at achieving the objectives to a reasonable extent with the organized and integrated function of individualcomponent as a whole. Therefore ICOFR does not provide an absolute assurance for preventing and detecting all errors to consolidatedfinancial statements.
2 Assessment Scope, Timing and ProceduresBasis of Presenting Internal Control ReportThe report on ICOFR of the consolidated financial statements of the Company (“Internal Control Report”) is prepared on the basis ofgenerally accepted assessment standards of internal control over financial reporting in Japan (“Assessment Standards”) and is compiledfrom the Internal Control Report prepared by the Company as required by the Financial Instruments and Exchange Law of Japan (“Law”).
The Assessment Standards require management to assess ICOFR, which consists of the internal controls over the consolidatedfinancial statements included in the Annual Securities Report filed under the Law and the internal control over disclosure information andothers included in the Annual Securities Report that materially affects the rff eliability of the financial statements.
The scope of management’s assessment of ICOFR in this annual report is differff ent from the scope required by the AssessmentStandards. Management assessment of ICOFR in this annual report covers the ICOFR with respect to the accompanying consolidatedfinancial statements only. In addition, the accompanying consolidated financial statements are reclassified and modified from theconsolidated financial statements prepared for the purpose of the Law. Supplementaryrr information is also added to the consolidatedyfinancial statements. The process of maf king reclassifications and modifications and the addition of certaf in information is for theconvenience of readers outside Japan. Management voluntarily includes the process in its assessment of ICOFR, even though it isoutside the scope of the Assessment Standards.
Scope of AssessmentManagement’s assessment of ICOFR was conducted as of March 31, 2017 in accordance with the Assessment Standards.
In evaluating internal controls, management first assessed internal controls that have a material impact on overall consolidatedfinancial reporting (“company-level controls”) and, based on the results, selected business process to be assessed. For assessment of process level controls management analyzed the selected business processes, identified a key control that would have a materialimpact on the reliability of financial reporting, and assessed effectiveness of interff nal controls through assessing design and operation of the key controls.
Management assessed the effectiveness of theff ICOFR applicable for the Company and its subsidiaries, to extent necessary in light of their degree of impact on the reliability of financial reporting. Management determined materiality for reliability of financial reporting in light of their degree of quantf itative and qualitative impact on financial reporting. From the results of the company-level controls assessment ofthe Company and two subsidiaries, management determined a reasonable scope for process level controls to be assessed.
Management selected the Pharmaceuticals business unit of the Company as the significant business unit for assessing process levelcontrols, as its revenue was more than 2/3 of the previous fiscal year’s consolidated revenue. The process related to revenue, accountreceivables and inventories from the Pharmaceuticals business unit of the Company was selected for process level control assessmentas they have significant relation to the business objectives of the Company. Apart from selected significant business units, includingother business units, processes whose accounts were determined to have a high risk of misstatement and involves significant use ofmanagement estimate and projection, and processes whose businesses or operations included high risk transactions were additionallyselected for controls assessment.
3 Results of assessmentBased on our assessment procedures noted above, we concluded the Company’s internal control over financial reporting was effectiff veas of March 31, 2017.
4 Supplementaryrr informationNo subsequent events have arisen that has caused to materially affect our evaluation of the effectiveness on the internal control overfinancial reporting as of March 31, 2017.
5 OtherNone.
Santen Pharmaceutical Co., Ltd. Annual Report 2017 107
Independent Auditor’s Report
We have audited the accompanying consolidated financial statements of Santen Pharmaceutical Co., Ltd. and its consolidated subsidiaries, which comprise the consolidated statement of profit or loss and other comprehensive income, statement of financial position, statement of changes in equity andstatement of cash flows for the year ended March 31, 2017, and a summary of significant accounting policies and other explanatory information.
Management’s Responsibility for the Consolidated Financial StatementsManagement is responsible for the preparation and fair presentation of these consolidated financial statements in accordance with International Financial Reporting Standards, and for such internal control as management determines is necessary to enable the preparation of consolidated financial statements that are free from material misstatement, whether due to fraud or error.
Auditor’s ResponsibilityOur responsibility is to express an opinion on these consolidated financial statements based on our audit. We conducted our audit in accordance with auditing standards generally accepted in Japan. Those standards require that we comply with ethical requirements and plan and perform the audit to obtainreasonable assurance about whether the consolidated financial statements are free from material misstatement. An audit involves performing procedures to obtain audit evidence about the amounts and disclosures in the consolidated financial statements. The procedures selected depend on our judgement, including the assessment of the risks of material misstatement of the consolidated financial statements,whether due to fraud or error. In making those risk assessments, we consider internal control relevant to the entity’s preparation and fair presentation of the consolidated financial statements in order to design audit procedures that are appropriate in the circumstances, while the objective of the financial statement audit is not for the purpose of expressing an opinion on the effectiveness of the entity’s internal control. An audit also includes evaluating the appropriateness of accounting policies used and the reasonableness of accounting estimates made by management, as well as evaluating the overall presentation of the consolidated financial statements. We believe that the audit evidence we have obtained is sufficient and appropriate to provide a basis for our audit opinion.
OpinionIn our opinion, the consolidated financial statements present fairly, in all material respects, the financial position of Santen Pharmaceutical Co., Ltd. and its consolidated subsidiaries as at March 31, 2017, and their financial performance and cash flows for the year then ended in accordance with InternationalFinancial Reporting Standards.
Convenience TranslationThe U.S. dollar amounts in the accompanying consolidated financial statements with respect to the year ended March 31, 2017 are presented solely for convenience. Our audit also included the translation of yen amounts into U.S. dollar amounts and, in our opinion, such translation has been made on the basis described in Note 2 to the consolidated financial statements.
Report on the Internal Control ReportWe also have audited the accompanying report on internal control over financial reporting of the consolidated financial statements of Santen Pharmaceutical Co., Ltd. as at March 31, 2017 (“Internal Control Report”).
Management’s Responsibility for the Internal Control ReportManagement is responsible for the design and operation of internal control over financial reporting and the preparation and fair presentation of the internalcontrol report in conformity with assessment standards for internal control over financial reporting generally accepted in Japan. Internal control over financial reporting may not completely prevent or detect financial statement misstatements.
Auditor’s Responsibility Our responsibility is to express an opinion on the internal control report based on our internal control audit. We conducted our internal control audit inaccordance with auditing standards for internal control over financial reporting generally accepted in Japan. Those standards require that we comply with ethical requirements and plan and perform the audit to obtain reasonable assurance about whether the Internal Control Report is free from material misstatement. An internal control audit involves performing procedures to obtain audit evidence about the assessment of internal control over financial reporting in the Internal Control Report. The procedures selected depend on the auditor’s judgement, including significance of effect on the reliability of financial reporting. Also, an internal control audit includes evaluating the appropriateness of the scope, procedures and result of the assessment determined and presented by management, and the overall internal control report presentation. We believe that the audit evidence we have obtained is sufficient and appropriate toprovide a basis for our opinion.
OpinionIn our opinion, the Internal Control Report, in which Santen Pharmaceutical Co., Ltd. states that internal control over financial reporting was effective as at March 31, 2017, presents fairly, in all material respects, the assessment of internal control over financial reporting in conformity with assessment standards for internal control over financial reporting generally accepted in Japan.
August 4, 2017Osaka, Japan
To the Board of Directors of Santen Pharmaceutical Co., Ltd.:
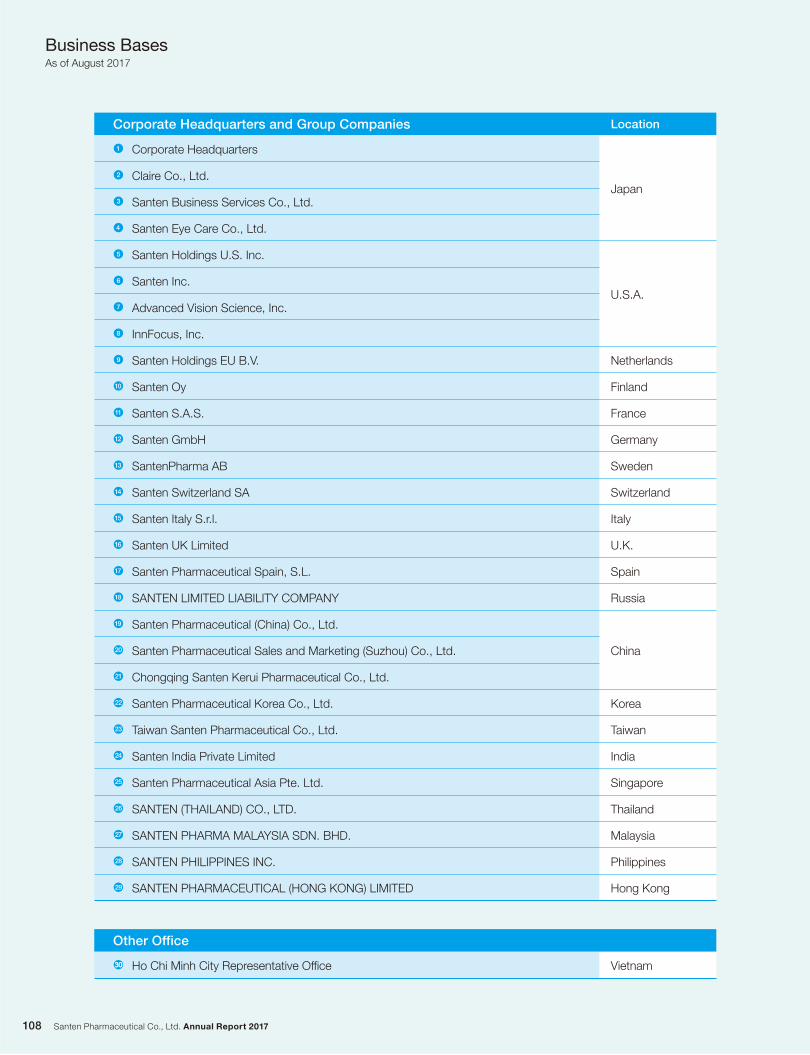
Santen Pharmaceutical Co., Ltd. Annual Report 2017108
Business BasesAs of August 2017
Corporate Headquarters and Group Companies Location
● Corporate Headquarters
Japan● Claire Co., Ltd.
● Santen Business Services Co., Ltd.
● Santen Eye Care Co., Ltd.
● Santen Holdings U.S. Inc.
U.S.A.● Santen Inc.
● Advanced Vision Science, Inc.
● InnFocus, Inc.
● Santen Holdings EU B.V. Netherlands
● Santen Oy Finland
● Santen S.A.S. France
● Santen GmbH Germany
● SantenPharma AB Sweden
● Santen Switzerland SA Switzerland
● Santen Italy S.r.l. Italy
● Santen UK Limited U.K.
● Santen Pharmaceutical Spain, S.L. Spain
● SANTEN LIMITED LIABILITY COMPANY Russia
● Santen Pharmaceutical (China) Co., Ltd.
China● Santen Pharmaceutical Sales and Marketing (Suzhou) Co., Ltd.
● Chongqing Santen Kerui Pharmaceutical Co., Ltd.
● Santen Pharmaceutical Korea Co., Ltd. Korea
● Taiwan Santen Pharmaceutical Co., Ltd. Taiwan
● Santen India Private Limited India
● Santen Pharmaceutical Asia Pte. Ltd. Singapore
● SANTEN (THAILAND) CO., LTD. Thailand
● SANTEN PHARMA MALAYSIA SDN. BHD. Malaysia
● SANTEN PHILIPPINES INC. Philippines
● SANTEN PHARMACEUTICAL (HONG KONG) LIMITED Hong Kong
Other Office
● Ho Chi Minh City Representative Office Vietnam
1
2
10
17
6
14
21
4
12
19
8
16
23
3
11
18
7
15
22
5
13
20
9
24
25
26
27
28
29
3030
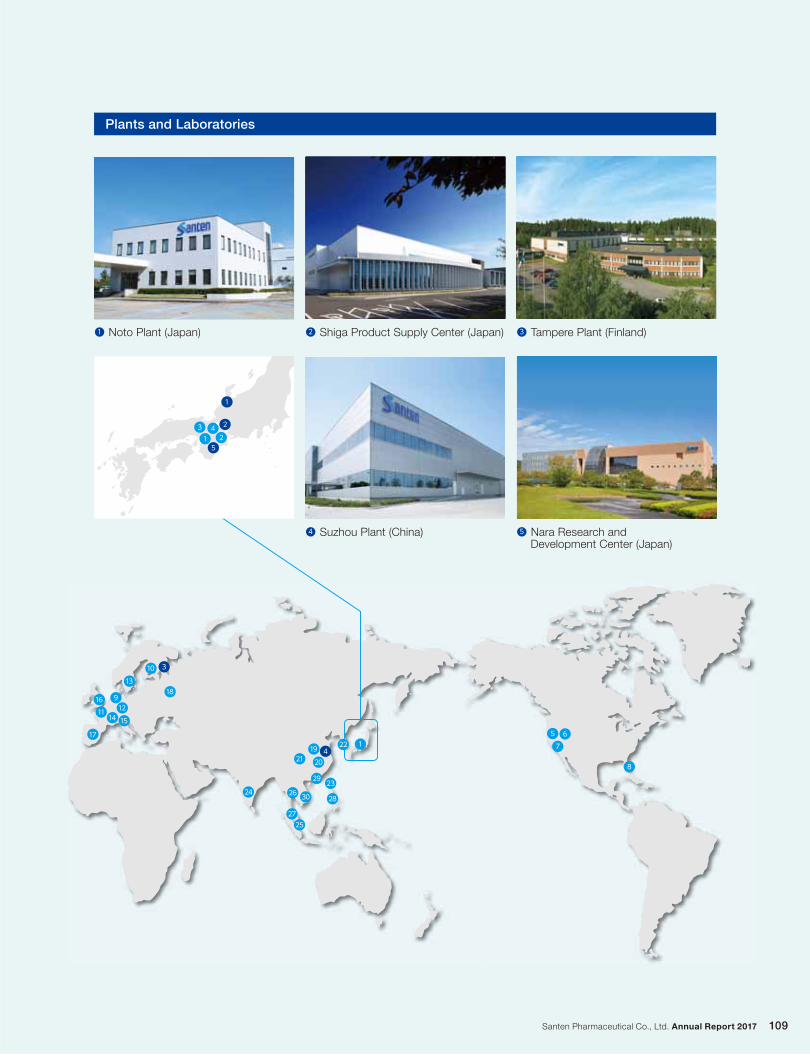
Santen Pharmaceutical Co., Ltd. Annual Report 2017 109
Plants and Laboratories
● Noto Plant (Japan)1 ● Shiga Product Supply Center (Japan)2
● Suzhou Plant (China)4
● Tampere Plant (Finland)3
● Nara Research and Development Center (Japan)5
1
1
2
23 4
5
1
12
24
617
30
13
25
719
3
14
26
9
204
15
27
10
5
16
28
8
18
21
29
11
23
22
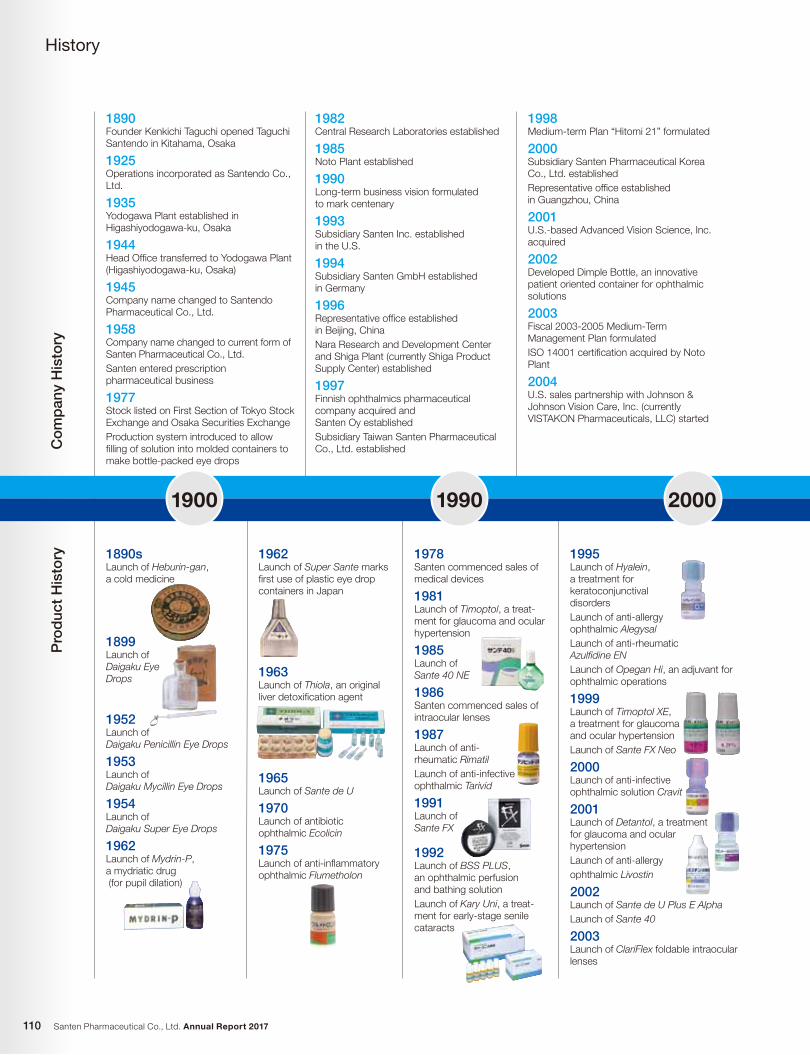
Santen Pharmaceutical Co., Ltd. Annual Report 2017110
History
1890Founder Kenkichi Taguchi opened Taguchi Santendo in Kitahama, Osaka
1925Operations incorporated as Santendo Co., Ltd.
1935Yodogawa Plant established in Higashiyodogawa-ku, Osaka
1944Head Offi ce transferred to Yodogawa Plant (Higashiyodogawa-ku, Osaka)
1945Company name changed to Santendo Pharmaceutical Co., Ltd.
1958Company name changed to current form of Santen Pharmaceutical Co., Ltd.Santen entered prescription pharmaceutical business
1977Stock listed on First Section of Tokyo Stock Exchange and Osaka Securities ExchangeProduction system introduced to allow fi lling of solution into molded containers to make bottle-packed eye drops
1890sLaunch of Heburin-gan, a cold medicine
1899Launch of Daigaku EyeDrops
1952Launch of Daigaku Penicillin Eye Drops
1953Launch of Daigaku Mycillin Eye Drops
1954Launch of Daigaku Super Eye Drops
1962Launch of Mydrin-P, a mydriatic drug (for pupil dilation)
1962 Launch of Super Sante marks fi rst use of plastic eye drop containers in Japan
1963Launch of Thiola, an original liver detoxifi cation agent
1965Launch of Sante de U
1970Launch of antibiotic ophthalmic Ecolicin
1975Launch of anti-infl ammatory ophthalmic Flumetholon
1978Santen commenced sales of medical devices
1981Launch of Timoptol, a treat-ment for glaucoma and ocular hypertension
1985Launch of Sante 40 NE
1986Santen commenced sales of intraocular lenses
1987Launch of anti-rheumatic RimatilLaunch of anti-infectiveophthalmic Tarivid
1991Launch of Sante FX
1992Launch of BSS PLUS, an ophthalmic perfusion and bathing solutionLaunch of Kary Uni, a treat-ment for early-stage senilecataracts
1995Launch of Hyalein, a treatment for keratoconjunctival disordersLaunch of anti-allergy ophthalmic AlegysalLaunch of anti-rheumatic Azulfi dine ENLaunch of Opegan Hi, an adjuvant for ophthalmic operations
1999Launch of Timoptol XE, a treatment for glaucomaand ocular hypertensionLaunch of Sante FX Neo
2000Launch of anti-infective ophthalmic solution Cravit
2001Launch of Detantol, a treatment for glaucoma and ocularhypertensionLaunch of anti-allergy ophthalmic Livostin
2002Launch of Sante de U Plus E AlphaLaunch of Sante 40
2003Launch of ClariFlex foldable intraocular lenses
1982Central Research Laboratories established
1985Noto Plant established
1990Long-term business vision formulated to mark centenary
1993Subsidiary Santen Inc. established in the U.S.
1994Subsidiary Santen GmbH established in Germany
1996Representative offi ce established in Beijing, ChinaNara Research and Development Center and Shiga Plant (currently Shiga Product Supply Center) established
1997Finnish ophthalmics pharmaceutical company acquired and Santen Oy establishedSubsidiary Taiwan Santen Pharmaceutical Co., Ltd. established
1998Medium-term Plan “Hitomi 21” formulated
2000Subsidiary Santen Pharmaceutical Korea Co., Ltd. establishedRepresentative offi ce established in Guangzhou, China
2001U.S.-based Advanced Vision Science, Inc. acquired
2002Developed Dimple Bottle, an innovative patient oriented container for ophthalmic solutions
2003Fiscal 2003-2005 Medium-Term Management Plan formulatedISO 14001 certifi cation acquired by Noto Plant
2004U.S. sales partnership with Johnson & Johnson Vision Care, Inc. (currently VISTAKON Pharmaceuticals, LLC) started
1900 1990 2000
Co
mp
any
His
tory
Pro
duc
t H
isto
ry
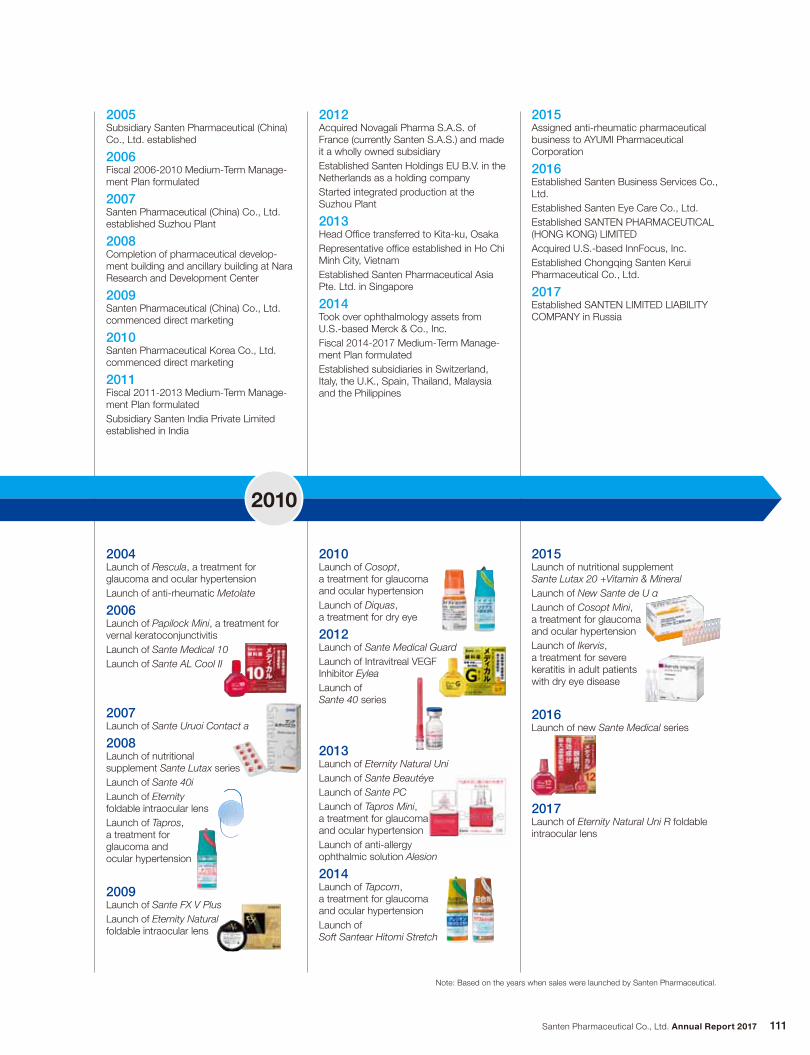
Santen Pharmaceutical Co., Ltd. Annual Report 2017 111
2004Launch of Rescula, a treatment for glaucoma and ocular hypertensionLaunch of anti-rheumatic Metolate
2006Launch of Papilock Mini, a treatment for vernal keratoconjunctivitisLaunch of Sante Medical 10Launch of Sante AL Cool II
2007Launch of Sante Uruoi Contact a
2008Launch of nutritional supplement Sante Lutax seriesLaunch of Sante 40iLaunch of Eternity foldable intraocular lensLaunch of Tapros, a treatment for glaucoma and ocular hypertension
2009Launch of Sante FX V PlusLaunch of Eternity Natural foldable intraocular lens
2010Launch of Cosopt, a treatment for glaucoma and ocular hypertensionLaunch of Diquas, a treatment for dry eye
2012Launch of Sante Medical GuardLaunch of Intravitreal VEGFInhibitor EyleaLaunch of Sante 40 series
2013Launch of Eternity Natural UniLaunch of Sante BeautéyeLaunch of Sante PCLaunch of Tapros Mini, a treatment for glaucomaand ocular hypertensionLaunch of anti-allergy ophthalmic solution Alesion
2014Launch of Tapcom, a treatment for glaucoma and ocular hypertensionLaunch of Soft Santear Hitomi Stretch
2015Launch of nutritional supplement Sante Lutax 20 +Vitamin & MineralLaunch of New Sante de U αLaunch of Cosopt Mini, a treatment for glaucoma and ocular hypertensionLaunch of Ikervis, a treatment for severe keratitis in adult patients with dry eye disease
2016Launch of new Sante Medical series
2017Launch of Eternity Natural Uni R foldable intraocular lens
2005Subsidiary Santen Pharmaceutical (China) Co., Ltd. established
2006Fiscal 2006-2010 Medium-Term Manage-ment Plan formulated
2007Santen Pharmaceutical (China) Co., Ltd. established Suzhou Plant
2008Completion of pharmaceutical develop-ment building and ancillary building at Nara Research and Development Center
2009Santen Pharmaceutical (China) Co., Ltd. commenced direct marketing
2010Santen Pharmaceutical Korea Co., Ltd. commenced direct marketing
2011Fiscal 2011-2013 Medium-Term Manage-ment Plan formulatedSubsidiary Santen India Private Limited established in India
2012Acquired Novagali Pharma S.A.S. of France (currently Santen S.A.S.) and made it a wholly owned subsidiaryEstablished Santen Holdings EU B.V. in the Netherlands as a holding companyStarted integrated production at the Suzhou Plant
2013Head Offi ce transferred to Kita-ku, OsakaRepresentative offi ce established in Ho ChiMinh City, VietnamEstablished Santen Pharmaceutical AsiaPte. Ltd. in Singapore
2014Took over ophthalmology assets from U.S.-based Merck & Co., Inc.Fiscal 2014-2017 Medium-Term Manage-ment Plan formulatedEstablished subsidiaries in Switzerland, Italy, the U.K., Spain, Thailand, Malaysia and the Philippines
2015Assigned anti-rheumatic pharmaceutical business to AYUMI Pharmaceutical Corporation
2016Established Santen Business Services Co., Ltd.Established Santen Eye Care Co., Ltd.Established SANTEN PHARMACEUTICAL (HONG KONG) LIMITEDAcquired U.S.-based InnFocus, Inc.Established Chongqing Santen Kerui Pharmaceutical Co., Ltd.
2017Established SANTEN LIMITED LIABILITY COMPANY in Russia
2010
Note: Based on the years when sales were launched by Santen Pharmaceutical.
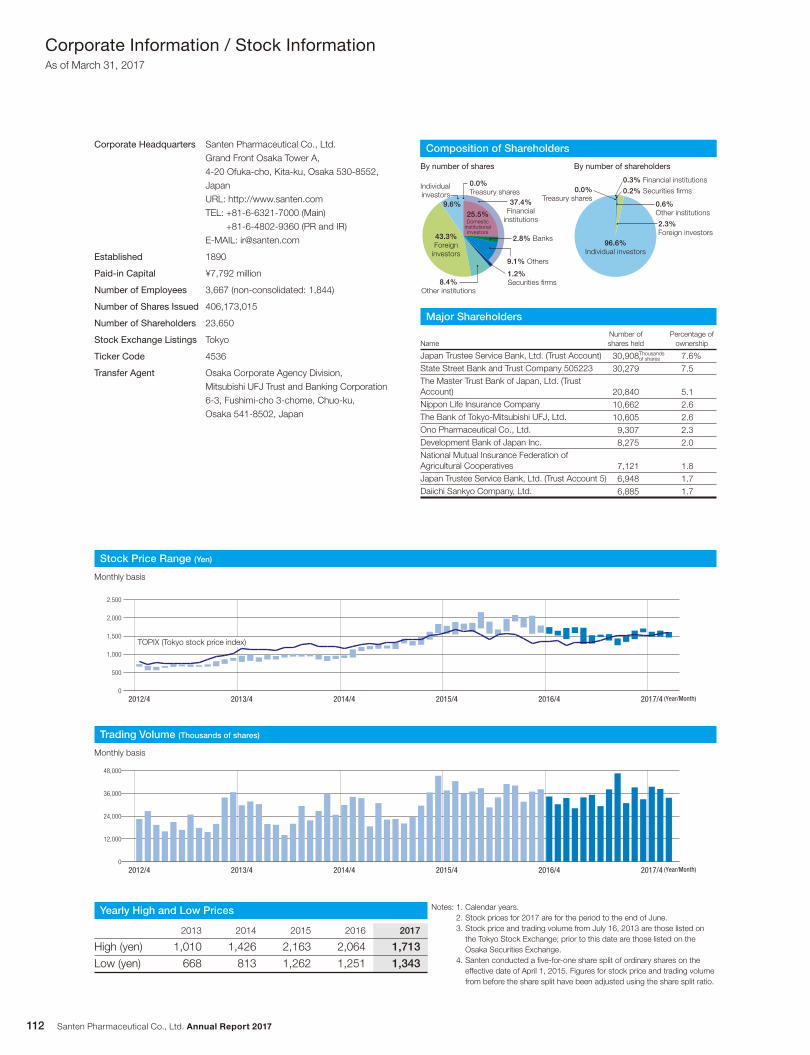
Corporate Headquarters Santen Pharmaceutical Co., Ltd.
Grand Front Osaka Tower A,
4-20 Ofuka-cho, Kita-ku, Osaka 530-8552,
Japan
URL: http://www.santen.com
TEL: +81-6-6321-7000 (Main)
+81-6-4802-9360 (PR and IR)
E-MAIL: [email protected]
Established 1890
Paid-in Capital ¥7,792 million
Number of Employees 3,667 (non-consolidated: 1,844)
Number of Shares Issued 406,173,015
Number of Shareholders 23,650
Stock Exchange Listings Tokyo
Ticker Code 4536
Transfer Agent Osaka Corporate Agency Division,
Mitsubishi UFJ Trust and Banking Corporation
6-3, Fushimi-cho 3-chome, Chuo-ku,
Osaka 541-8502, Japan
Major Shareholders
NameNumber of shares held
Percentage of ownership
Japan Trustee Service Bank, Ltd. (Trust Account) 30,908 7.6%
State Street Bank and Trust Company 505223 30,279 7.5
The Master Trust Bank of Japan, Ltd. (Trust Account) 20,840 5.1
Nippon Life Insurance Company 10,662 2.6
The Bank of Tokyo-Mitsubishi UFJ, Ltd. 10,605 2.6
Ono Pharmaceutical Co., Ltd. 9,307 2.3
Development Bank of Japan Inc. 8,275 2.0
National Mutual Insurance Federation of Agricultural Cooperatives 7,121 1.8
Japan Trustee Service Bank, Ltd. (Trust Account 5) 6,948 1.7
Daiichi Sankyo Company, Ltd. 6,885 1.7
Composition of Shareholders
By number of shares By number of shareholders
Thousands of shares
Notes: 1. Calendar years.
2. Stock prices for 2017 are for the period to the end of June.
3. Stock price and trading volume from July 16, 2013 are those listed on
the Tokyo Stock Exchange; prior to this date are those listed on the
Osaka Securities Exchange.
4. Santen conducted a five-for-one share split of ordinary shares on the
effective date of April 1, 2015. Figures for stock price and trading volume
from before the share split have been adjusted using the share split ratio.
Yearly High and Low Prices
2013 2014 2015 2016 2017
High (yen) 1,010 1,426 2,163 2,064 1,713
Low (yen) 668 813 1,262 1,251 1,343
Trading Volume (Thousands of shares)
Monthly basis
12,000
0
24,000
48,000
36,000
2017/4 (Year/Month)2016/42015/42014/42013/42012/4
500
0
1,000
2,500
2,000
1,500
2017/4 (Year/Month)2016/42015/42014/42013/42012/4
Stock Price Range (Yen)
Monthly basis
TOPIX (Tokyo stock price index)
Corporate Information / Stock InformationAs of March 31, 2017
0.0% Treasury shares
43.3% Foreign
investors
37.4% Financial
institutions
9.1% Others
2.8% Banks
1.2% Securities firms8.4%
Other institutions
0.0% Treasury shares
Individualinvestors
25.5%Domestic
institutionalinvestors
0.6% Other institutions
2.3% Foreign investors
0.3% Financial institutions
0.2% Securities firms
96.6% Individual investors
Santen Pharmaceutical Co., Ltd. Annual Report 2017112
9.6%
Annual Report 2017
Ophthalmology Is Our Singular Focus Year Ended March 31, 2017
Annual Report 2017
Santen Pharmaceutical Co., Ltd. Annual Report 2017 113
Santen strives to widely disclose information to a broad range of stakeholders through various disclosure materials.
Comprehensive Disclosure of Value Creation Initiatives Based on Santen’s Values
The Santen Group has adopted a policy to integrate its Annual and CSR reports into an integrated report that provides a view of overall business activities based on Santen’s Values. The new report is intended to provide customers and society an understanding of Company values and includes comprehensive coverage of financial information as well as non-financial information such as management strategies, review of operations and CSR activities. Santen strives to supply clear and concise content based on the International Integrated Reporting Council (IIRC)’s integrated reporting framework, in order to facilitate the understanding from a broad range of stakeholders, beginning with shareholders and other investors.
Annual Report 2017 (Integrated)
Disclosure of Corporate Information and Useful Information on Eye Health
Santen presents detailed financial and non-financial information on its corporate website in order to foster a deeper understanding of its business activities as a specialized pharmaceutical company. The Company’s website for shareholders and other investors also provides various materials useful to investors, including financial reports and presentation materials. Moreover, Santen is also working to enhance the disclosure of useful information on eye health for the general public and information on ophthalmic treatment for medical professionals.
Corporate Website
http://www.santen.com
Detailed Disclosure of Santen’s CSR Initiatives
Santen’s CSR website provides detailed information on CSR activities based on Santen’s Values. CSR initiatives are presented based on the “7 Core Subjects of CSR,” including environmental conservation, respect for human rights, diversity, compliance, and social contribution. The CSR website also presents information related to the environment, as well as employment and human resources.
CSR Website (“CSR” on Santen’s Corporate Website)
http://www.santen.com/en/csr
Santen’s Disclosure Materials
This report is printed with vegetable oil ink. Printed in Japan