ANNUAL REPORT 2013 - Kathmandu Holdings...KATHMANDU ANNUAL REPORT 2013 3available to Kathmandu. The...
84
ANNUAL REPORT 2013
Transcript of ANNUAL REPORT 2013 - Kathmandu Holdings...KATHMANDU ANNUAL REPORT 2013 3available to Kathmandu. The...
ANNUAL REPORT 2013

KATHMANDU ANNUAL REPORT 2013 1
contents
Chairman’s Report 2Highlights For The Year 4Chief Executive’s Report 6Board 12Management 13Directors’ Report 15Corporate Governance 25Financial Statements 29Statutory Information 75 Share Registry 80
NOTICE OF ANNUAL GENERAL MEETING
11:00am Wednesday20 November 2013Stamford Plaza Hotel22-26 Albert StAuckland 1010New Zealand

2 ANNUAL REPORT 2013 KATHMANDU
chairman’s report
John HarveyChairman
Kathmandu Holdings Ltd achieved record sales and earnings in FY2013. Net profit increased by 26.6% to $44.2m, following strong same store sales increases in both Australia and New Zealand in tandem with the sales uplift achieved from the 17 permanent new stores opened during the year. Profit growth over the four years since our IPO in 2009 has been founded upon consistently strong yearly sales increases, as we continue to maintain our leadership of the outdoor, travel and adventure categories in Australia and New Zealand. Our growth strategies, underpinned by a substantial capital investment programme, are expected to continue to deliver increasing profits in future years, given reasonable market conditions for outdoor, travel and adventure retailers.
MARKET OVERVIEW The challenging economic environment prevalent since the start of the global financial crisis in 2008 has not shown any substantial signs of easing to date. Nevertheless, despite this environment, demand in the outdoor, travel and adventure categories has proven more resilient than in other consumer discretionary spend categories. In this period, Kathmandu’s success, the substantial growth in the number of competitor outlets, and the increase of over 1.5 million / 25% in short term overseas trips by Australians, are just a few of the indicators of this resilience. Only recently have signs of a slowdown in Australia associated with the resources sector, suggested there may be a pullback in consumer spending growth rates that could impact our categories. Your Board continues to have confidence in the resilience of our markets to support our investment in the Kathmandu business and our core growth strategies.
FINANCIAL RESULTS The key financial highlights for the year ended 31 July 2013 were:
Growth in sales by 10.6% to $384.0m;
Gross profit margin of 63.0% (FY2012: 63.2%);
Increase in earnings before interest and tax of 11.2% from NZ$57.0m to NZ$63.4m
Earnings per share of 22.1 cents per share, up 27.0%.
We achieved solid same store sales growth in both Australia (6.7%) and New Zealand (4.4%). Gross profit margin was slightly down compared to FY2012 but comfortably within the Company’s long term targets. Operating costs reduced as a % of sales, and the primary reasons for this were carefully managed advertising spend, and efficient management of head
office and distribution costs enabled by continued investment in improved technology. Overall EBITDA and EBIT margins increased slightly.
GROWTH STRATEGIES Kathmandu continues to develop and deliver the following key growth strategies:
New store rollout in Australia and New Zealand;
Optimise the existing store network;
Enhance product offering;
Grow our Summit Club Loyalty Programme; and
Develop and grow online and digital channel capabilities.
We have recently achieved the milestone of 1 million active Summit Club customers. The size and effectiveness of our customer loyalty programme is a cornerstone of our Australasian business. The real value attached to membership will result in increasing sales in the future. This will be enhanced further by the successful execution of our other growth strategies, as every year we offer new and innovative products to our customers in an expanding network of quality stores and enhanced online capabilities. Our growth strategies are also supported by the commitment we have made to sustainability which we recognise has particular significance to many of our customers, as well as being directly relevant to the future for the wider outdoor, travel and adventure sector.
Our store network is one of a number of available channels to market. Developing the capability of our online platform, and continuously improving our business systems, is critical to our capability to pursue the wider international sales opportunities
KATHMANDU ANNUAL REPORT 2013 3
available to Kathmandu. The starting point for this is our re-organised UK business, where we are focused on online selling and the introduction of Kathmandu product to the market in other web based channels rather than further store rollout. Our experience in the UK and the performance of that business unit will be an important benchmark for your Board in the pathway to further expansion of the Kathmandu brand globally.
CAPITAL INVESTMENT We are continuing to budget for a substantial capital expenditure programme with a focus on delivering our store network plan, including a planned programme for store refurbishment and replenishment, along with investment in systems improvements. Over the past year we completed a record number of new and re-located store projects, and we have invested in the capability to continue this pace of store network expansion as we work towards a target of at least 170 stores in Australia and New Zealand. Additionally, we have a substantial investment continuing in systems development, in particular on the retail platform, to integrate with compatible applications such as our online engine. Our planning and prioritisation for systems upgrades will place us in a strong position to pursue strategic expansion opportunities for the Kathmandu brand.
DIVIDEND The Directors have declared an increase in the final dividend to 9 cents per share, which with the 3 cents interim dividend makes a total payout for the year of 12 cents per share, a 20% increase on the previous year. The final dividend will be fully imputed for New Zealand shareholders, and fully franked for Australian shareholders.
This dividend reflects the growth in earnings per share, and represents a payout ratio of over 54%, which is in the middle of the payout range previously advised by the Board.
PEOPLE Whilst it is pleasing to be writing this report after such a successful year, it is also very sad to recognise that it coincided with the tragic loss of our founding Chairman,
James Strong AO. James died in March 2013 and the recognition he received from the business, sporting, arts and the wider community reflected his position as an outstanding Australasian of his generation. Kathmandu was very privileged to have had his leadership and guidance during our formative years as a listed company. In May, we were very pleased to announce the James Strong Memorial Project in his honour, which will provide additional education funding to benefit children in the Solu Khumbu, one of the most remote parts of Nepal. This project is being initiated in association with the Australian Himalayan Foundation, an organisation that James and Kathmandu have worked with in recognition of the source of our heritage as an outdoor brand.
I have had the privilege to act as Interim Chairman for the period since James’ death, and your Board expects to be in a position to announce the appointment of an additional independent Director at our Annual General Meeting. The Board again thanks Kathmandu’s Chief Executive Officer, Peter Halkett, and his team for the results achieved by the Company in FY2013. The Kathmandu team successfully support and deliver the growth opportunities we target year after year, in a working and business environment where change is the norm rather than the exception. This reflects their capabilities and commitment to the long term success of our brand.
OUTLOOK Your Board believes there are sound reasons to remain confident about Kathmandu’s prospects for continued growth. The New Zealand economy is in relatively good shape, and despite the recent slow-down in the Australian economy, we consider most Australian consumers spending money in our category are still benefitting from a relatively strong exchange rate and they retain reasonable confidence in general. Economic indicators globally are more positive than a year ago, even if that improvement is relatively small.
We believe that the Kathmandu brand has the opportunity and genuine potential to develop a significant global presence in the outdoor, travel and adventure market. However we are still very clear that the short term key growth strategy remains to invest and grow Kathmandu’s business and brand in the Australasian market. We anticipate a solid performance again next year as Kathmandu maintains its pre-eminent position as the brand of choice for outdoor, travel and adventure customers in Australia and New Zealand.
John HarveyChairman
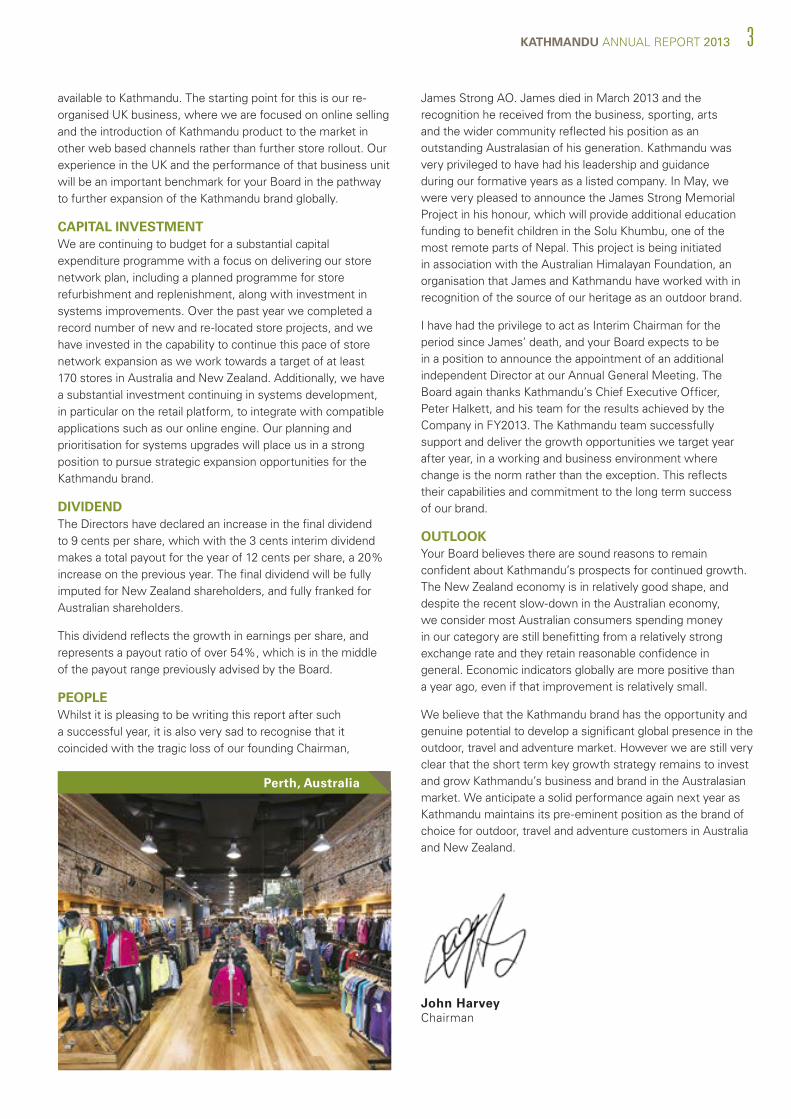
Perth, Australia

4 ANNUAL REPORT 2013 KATHMANDU4 ANNUAL REPORT 2013 KATHMANDU
highlights
for the year
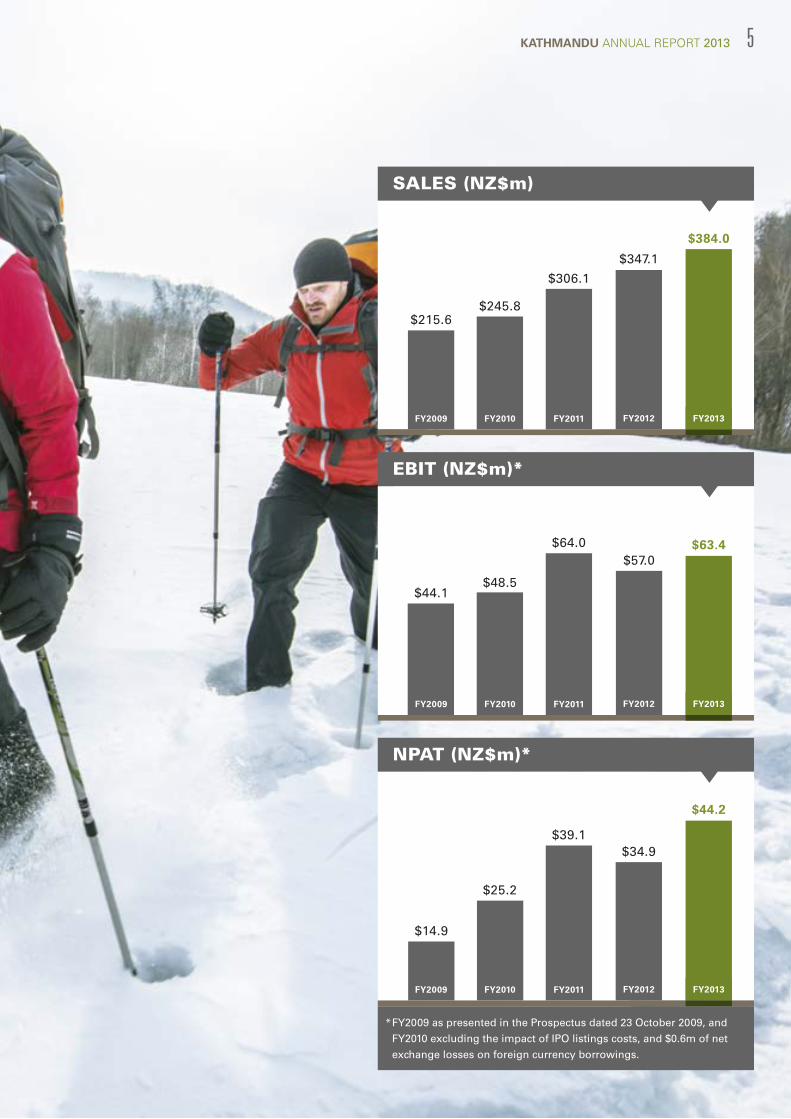
SALES UP 10.6%
RECORD PROFIT AT $44.2M
STORE COUNT UP TO 136
SUMMIT CLUB MEMBERSHIP
OVER 1 MILLION
KATHMANDU ANNUAL REPORT 2013 5KATHMANDU ANNUAL REPORT 2013 5
$245.8$215.6
FY2009 FY2010
$306.1
FY2011
$347.1
FY2012
$384.0
FY2013
SALES (NZ$m)
$63.4
FY2013
EBIT (NZ$m)*
FY2009 FY2010 FY2011 FY2012
$44.1$48.5
$64.0$57.0
NPAT (NZ$m)*
$44.2
FY2013FY2009 FY2010 FY2011 FY2012
$14.9
$25.2
$39.1$34.9
* FY2009 as presented in the Prospectus dated 23 October 2009, and
FY2010 excluding the impact of IPO listings costs, and $0.6m of net
exchange losses on foreign currency borrowings.
6 ANNUAL REPORT 2013 KATHMANDU
KEY HIGHLIGHTS
Sales increased 10.6% to $384.0m.
Same store sales growth of 5.6% at constant exchange rates.
Strong gross profit margins.
Online sales grew by 55% and are now over $15.0m per annum.
Summit club membership exceeds 1 million customers.
chief executive’s report
Peter HalkettManaging Director and Chief Executive Officer
UK business re-organisation completed.
Australian distribution centre floor space
extended by 50%.
17 permanent new stores opened.
Record earnings result; net profit after tax
$44.2m, up 26.6%; improved EBIT margin
and earnings per share.
RESULT OVERVIEW Kathmandu’s FY2013 sales and profit result was very pleasing, with strong same store sales growth in both New Zealand and Australia underpinning a substantial increase in earnings. Gross profit margins achieved during the year were little changed from FY2012, and the resulting increase in gross profit coupled with improved operating expense leverage, lifted Group earnings to record levels. This result was achieved despite tough market conditions for discretionary retailers, and the continuing expansion of both local and international competitors through more store fronts and online sales channels.
The sales performance in FY2013 warrants particular mention. It is always challenging in an economic environment characterised by low levels of growth and consumer confidence, to achieve the combination of acceptable same store sales growth whilst maintaining gross profit margins. A very small reduction in gross profit margin did occur, down 20 bps over the full year, but this was primarily a reflection of product mix and timing. We continued to effectively maintain Kathmandu’s retail price points and value proposition in a period of aggressive promotional activity from our major competitors. Kathmandu’s sales grew 19.5% in Australia and 8.6% in New Zealand, as we improved our market penetration and brand awareness in Australia, coupled with strong support for key promotions in both countries from our growing Summit Club membership base.
Our FY2013 sales included excellent results from a number of newly opened small format stores in prime retail locations in Australia, which immediately met or exceeded our initial sales expectations. We opened 17 permanent new stores, and overall we were trading in 137 locations at 31 July (including one short term lease). Most new stores were Australian mall stores, usually utilising our latest small format concept.
Additionally, our online sales channel continued to deliver excellent sales growth, up 55% year-on-year. In both Australia and New Zealand, we achieved a positive same store sales increase from our bricks and mortar stores.
Operating expenses continued to be well controlled, and reduced by 30 bps as a % of sales. The increasing portion of expenses being incurred in our Australian retail stores where operating costs are structurally highest, will continue to counterbalance leverage obtained from the relative lower rate of increase in the operating costs of other areas of the business.
Kathmandu’s excellent overall performance this year reflects the successful execution of our key growth strategies that we have regularly communicated to our shareholders since our IPO in 2009. Throughout this period, a key strategy has been the enhancement of our customer loyalty programme. We now have more than 1 million active Summit Club members, and we plan to further enhance the benefits for members in the future. We are confident our evolving product range and store network, in tandem with the loyalty that our core customers have for the Kathmandu brand, will continue to support further growth.
BUSINESS OVERVIEWTHE KATHMANDU BUSINESS MODEL The completion of our brand identity upgrade project is an appropriate milestone to reflect upon the success of the Kathmandu business model. We are first and foremost a brand, and then a retailer. Kathmandu branded product can still only be bought today through our wholly owned store network and our websites. The majority of our customers are Summit Club members rather than off the street consumers, and they strongly support a long-established promotional model that has
KATHMANDU ANNUAL REPORT 2013 7
three major sales events per year. This vertical business model has been the foundation of Kathmandu’s growth in Australasia for the past 15 years, and we have continued to improve and adapt over this period. Our successful execution of this model, coupled with growing brand recognition, and product loyalty that Kathmandu commands in its key markets, has seen Group sales increase by over $165m or 75% in the four years since our IPO.
The same period of time has seen the spectacular growth of the internet as a platform for social and consumer interaction. Kathmandu, as a vertically integrated brand business with strong margins in a growing category, is well placed to take advantage of this opportunity, both locally and internationally.
We continue to build on our existing business, primarily through store rollout in Australia, where we still see many opportunities to increase Australian brand awareness and market penetration relative to the level achieved in New Zealand. In tandem with continuing to execute the model we know well, the online opportunity will continue to get an increasing share of our management attention and strategic investment.
PRODUCT RANGE AND INVENTORY Product is a key to our success. Ensuring we are bringing to market innovative, well designed, high quality and competitively priced products that meet the needs of our customers is essential to our future success. Over the last seven years we have invested in our product team and recruited many new skills and capabilities into the business. Capability in areas such as design, quality and fabric R&D have all been added, and their impact on product development will be seen in the seasons ahead.
We intend to increase our return from each sku in our product range, through revenue growth and reduced cost to market ratios, relative to the absolute level of inventory investment and the costs associated with new product development. Assortment range planning is a key medium term enhancement required from our systems upgrade project, which will enable us to maximise our performance in this area.
Inventory levels were well managed throughout the year, and the total value of inventory, $80.0m at 31 July 2013, was an 9.1% increase on the prior year. One-third of this increase was the year-on-year change in goods in transit for the summer season in FY2014, so after excluding this amount, the value of stock on hand at 31 July was less than $5m higher than a year earlier, a 4.3% reduction when measured on a per store basis. This was an excellent outcome given the growth in both sales and store numbers, and it was further reflected in reduced volumes of clearance stock, especially in the second half of the year. We do expect a slightly higher rate of inventory growth in FY2014, as we are focused on maintaining adequate range depth in key product groups planned to support key promotional events across the year, as well as further improving our seasonal range availability in regions with major climatic variations.
ONLINE AND DIGITAL Our investment in information systems infrastructure and software continues to be a critical part of our business improvement strategy. During FY2013 we made the strategic decision to follow the development path provided by Microsoft Dynamics AX for Retail in a number of core operational areas of the business. We have already gone live with modules relating to Customer Relationship and Product Information Management, and our Forecasting and Planning software will be live early in FY2014. There is a clear pathway for Kathmandu to substantially upgrade its core systems utilising the AX suite of applications, and replacement of our current Point Of Sale software during the second half of FY2014 is the next stage of our development plan.
In FY2014 our online platform will continue to be enhanced as we progress with building systems infrastructure capable of supporting both our current Australasian business growth, and the future development of new multichannel retail options. Potential opportunities for the Kathmandu brand internationally, outside our core markets, cannot be effectively pursued until we have implemented a tier one software platform which properly integrates our retail stores and websites globally.
STORE NETWORK The makeup of Kathmandu’s store network and our strategy for the location and sizing of new stores has continued to evolve through our four years as a listed company, especially in Australia which remains our key growth opportunity for ongoing store rollout. As we previewed in last year’s annual report, our store network plan has been further developed to focus on small format site opportunities (stores of 350m2 or less). In Australia, this store format has become our standard in mall locations, aligning well with the planned growth we are achieving from more lifestyle orientated apparel categories.
We are confident that the Kathmandu store network when fully rolled out across New Zealand and Australia will number at least 170 stores. All current Kathmandu stores in Australasia make a positive contribution to group earnings.
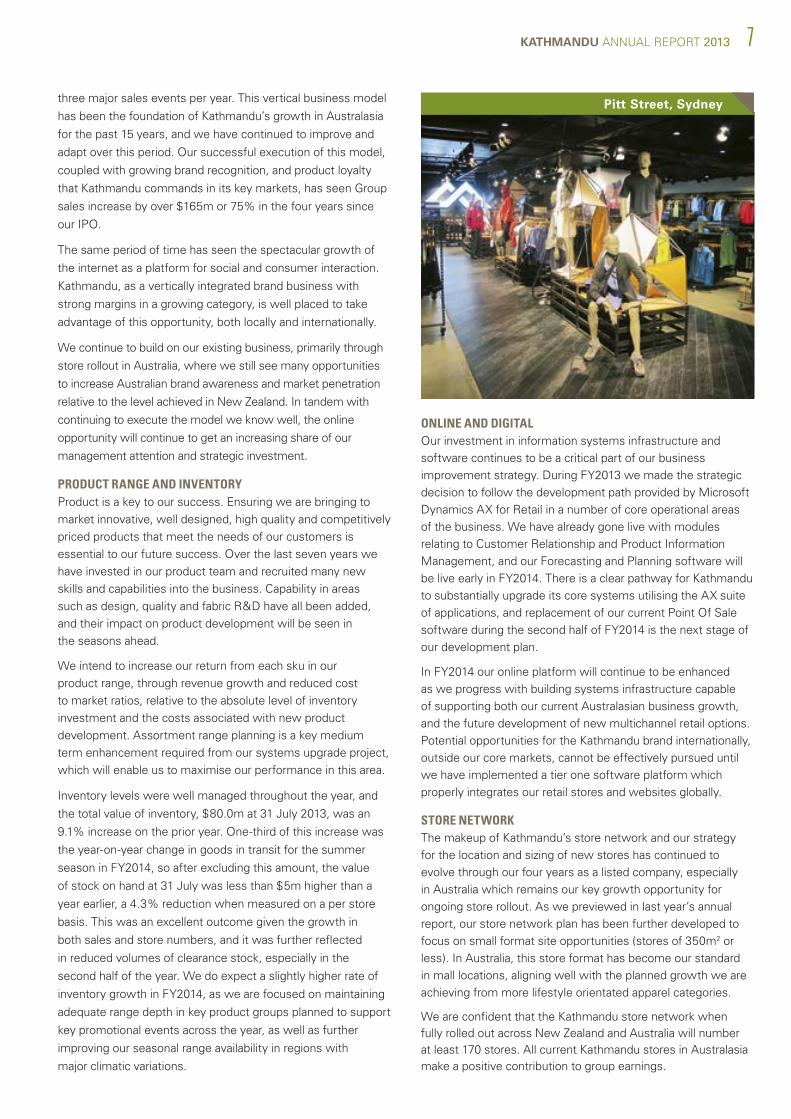
Pitt Street, Sydney
8 ANNUAL REPORT 2013 KATHMANDU
Permanent store numbers totalled 136 as at 31 July: New Zealand 44, Australia 87 and UK 5. Since balance date we have closed our Westfield White City store in the UK. We continue to trade successfully in a temporary site in the Christchurch Re-start precinct.
The permanent new stores opened during the year were:
Australia: Carindale (Brisbane), Fountain Gate (Melbourne), Tuggerah (NSW), Robina (QLD), Morley Galleria (Perth), Pitt St (Sydney), Mackay (QLD), Coffs Harbour (NSW), Casuarina (Darwin), The Glen (Melbourne), Eastgardens (Sydney), Hobart CBD (TAS), Penrith (Sydney), Nunawading Brand Smart (Melbourne). Moonee Ponds in Melbourne was originally opened in FY2012 as a temporary site, but is now a permanent store.
New Zealand: Pukekohe and Westgate (Auckland).
United Kingdom: Kensington High St (London).
We closed our Berners St (London) and Brighton stores during the year as part of the re-organisation of our UK business detailed later in this report.
There was an uplift of earnings from the new stores opened in the last year, relative to the comparable group opened in FY2012. In FY2014, we have seven new store leases currently confirmed; five of these are expected to open by the end of 2013. This is a slightly slower rate of opening than in the first half of FY2013, but we are confident that we will achieve our target of 15 new stores again in FY2014.
Re-investment in our existing store portfolio will continue to be very important with regard to sustaining strong same store sales growth over the medium and long term. In FY2013, we relocated our flagship store in the Perth CBD. We also relocated our Richmond (Melbourne), and Nelson and Invercargill stores in New Zealand to larger and more visible premises. These relocations were all opportunities to move to better located and larger sites appropriate for maximising sales growth in those markets. Major refurbishments were carried out at the Highpoint and Knox City stores in Melbourne, our Bondi Junction store in Sydney, and our Covent Garden store in London. Investment in projects of this type will be increasingly important in future years as we maintain our market leadership position.
UK BUSINESS We undertook substantial work re-organising the UK business and store portfolio in FY2013. Most of this work and the associated planned capital expenditure has now been completed. Only the refurbishment of our Spitalfields store remained in progress, and this store re-opened in September. The 18 month re-alignment of the UK business has involved:
In FY2012, closure of our UK regional office and warehouse and shifting to an outsourced distribution service.
In FY2013;
• Re-aligning our London store portfolio to position these in appropriate locations for outdoor and travel apparel and equipment retailing. We closed our Berners Street and White City stores, and opened a new store in Kensington High Street. This store, along
with our Covent Garden and Spitalfield stores are all in close proximity to major competitors in the UK market.
• Refurbishing the London stores with the new Kathmandu branding and fixtures.
• Placing all ongoing customer services and UK support functions in our Bristol store, which is our only regional location following the closure of our Brighton store.
The UK market remains challenging. It is a weakened economy post the GFC, and daily competitive retail price points are more critical than ever. There is relatively less affinity with the outdoor and travel category in the UK compared to Australasia, and a much stronger uptake of shopping online rather than in retail stores. It is this last aspect of consumer buying behaviour in the UK market that is our key future focus. We plan for our reduced store network to support a more aggressive online based selling strategy across the UK. Our future investment in the UK is intended to grow Kathmandu brand awareness and support year-round competitive promotional activity, in both our own and other relevant online channels.
INFRASTRUCTURE FY2013 was generally a year of consolidation in our office and distribution infrastructure. We completed the planned enlargement of our Melbourne Distribution Centre. In FY2012 we ended the previous sublet of one-third of the premises, and in the first half of FY2013 we completely re-worked the internal layout of the warehouse to better cater for current and projected growth in activity levels. Apart from this project, there was a limited requirement for expenditure on infrastructure assets to support the store network. The exception to this was our continuing investment in systems improvement. We expect a similar scenario to apply in FY2014.
FINANCIAL PERFORMANCE Group sales $384.0m increased by 10.6% over the previous year. The increase in same store sales, by 1.8% overall and 5.6% at constant exchange rates, was a good outcome given market conditions. Country by country change in same store sales was as follows:
Australia 6.7%
New Zealand 4.4%
UK (6.5%).
Total gross profit increased by $22.5m (10.3%). The gross margins achieved continue to sit comfortably within our long term target range of 62% to 64%, and generally match the levels achieved last year. Gross margins were up 10bps in New Zealand and down 60 bps in Australia. As previously noted, the relatively small gross margin variations in FY2013 compared to the prior year were primarily attributable to the product mix sold and the timing of sales during our key promotional periods. Weather, particularly in winter, can influence our gross profit outcome, however in Australia and New Zealand we assess the weather impact was neutral overall in FY2013. Also, the hedging rates we received on USD purchasing in FY2013 and the impact
KATHMANDU ANNUAL REPORT 2013 9
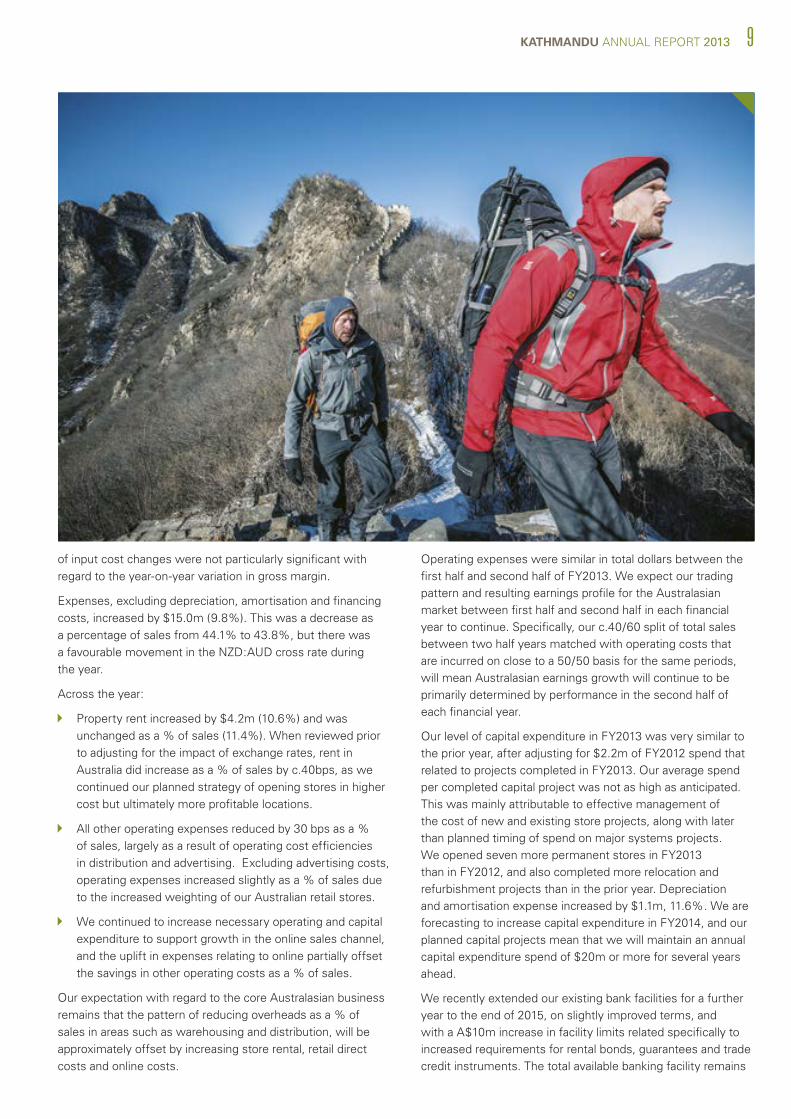
of input cost changes were not particularly significant with regard to the year-on-year variation in gross margin.
Expenses, excluding depreciation, amortisation and financing costs, increased by $15.0m (9.8%). This was a decrease as a percentage of sales from 44.1% to 43.8%, but there was a favourable movement in the NZD:AUD cross rate during the year.
Across the year:
Property rent increased by $4.2m (10.6%) and was unchanged as a % of sales (11.4%). When reviewed prior to adjusting for the impact of exchange rates, rent in Australia did increase as a % of sales by c.40bps, as we continued our planned strategy of opening stores in higher cost but ultimately more profitable locations.
All other operating expenses reduced by 30 bps as a % of sales, largely as a result of operating cost efficiencies in distribution and advertising. Excluding advertising costs, operating expenses increased slightly as a % of sales due to the increased weighting of our Australian retail stores.
We continued to increase necessary operating and capital expenditure to support growth in the online sales channel, and the uplift in expenses relating to online partially offset the savings in other operating costs as a % of sales.
Our expectation with regard to the core Australasian business remains that the pattern of reducing overheads as a % of sales in areas such as warehousing and distribution, will be approximately offset by increasing store rental, retail direct costs and online costs.
Operating expenses were similar in total dollars between the first half and second half of FY2013. We expect our trading pattern and resulting earnings profile for the Australasian market between first half and second half in each financial year to continue. Specifically, our c.40/60 split of total sales between two half years matched with operating costs that are incurred on close to a 50/50 basis for the same periods, will mean Australasian earnings growth will continue to be primarily determined by performance in the second half of each financial year.
Our level of capital expenditure in FY2013 was very similar to the prior year, after adjusting for $2.2m of FY2012 spend that related to projects completed in FY2013. Our average spend per completed capital project was not as high as anticipated. This was mainly attributable to effective management of the cost of new and existing store projects, along with later than planned timing of spend on major systems projects. We opened seven more permanent stores in FY2013 than in FY2012, and also completed more relocation and refurbishment projects than in the prior year. Depreciation and amortisation expense increased by $1.1m, 11.6%. We are forecasting to increase capital expenditure in FY2014, and our planned capital projects mean that we will maintain an annual capital expenditure spend of $20m or more for several years ahead.
We recently extended our existing bank facilities for a further year to the end of 2015, on slightly improved terms, and with a A$10m increase in facility limits related specifically to increased requirements for rental bonds, guarantees and trade credit instruments. The total available banking facility remains
10 ANNUAL REPORT 2013 KATHMANDU
sufficient to meet our capital expenditure requirements in tandem with Kathmandu’s working capital cycle. Facility fees and interest expense in FY2013 were down by over $1.4m compared to the prior year, and the better terms attached to the facility agreements now in place were the major reason for this year-on-year reduction.
Net profit after tax increased by $9.3m after a favourable taxation expense outcome for the year. Total tax expense of $14.8m includes the benefit of the reduced tax charge in the Australian trading company (Kathmandu Pty Ltd) arising from the annual revaluation of its NZD denominated loan from Kathmandu Ltd. This loan primarily arises from the amount due by our Australian subsidiary for the purchase of the IP and rights to use the Kathmandu brand in Australia, based on the valuation determined at the time of the IPO in 2009. Because it is NZD denominated, exchange rate conversion gains (or as
in this year losses) on the value of the loan at each balance date are taxable in the Australian company. Whilst this loan remains outstanding, this one-off benefit in FY2013 could reverse in a future year when the AUD:NZD exchange rate strengthens.
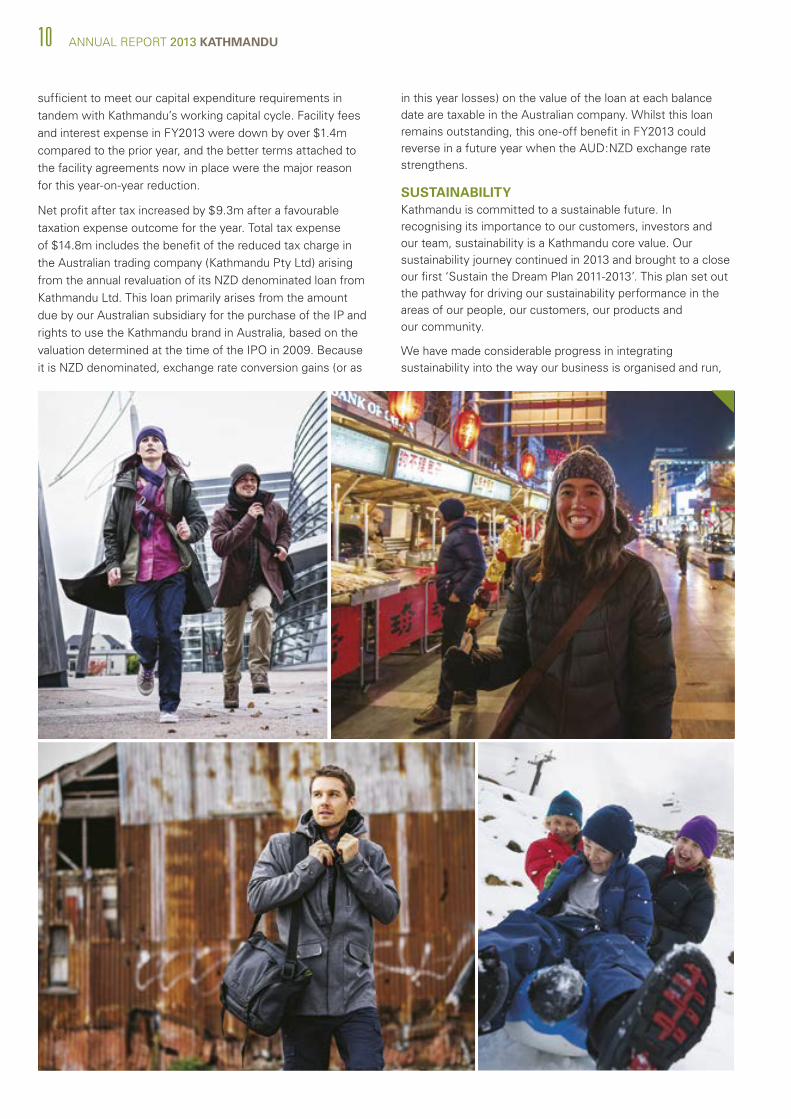
SUSTAINABILITY Kathmandu is committed to a sustainable future. In recognising its importance to our customers, investors and our team, sustainability is a Kathmandu core value. Our sustainability journey continued in 2013 and brought to a close our first ‘Sustain the Dream Plan 2011-2013’. This plan set out the pathway for driving our sustainability performance in the areas of our people, our customers, our products and our community.
We have made considerable progress in integrating sustainability into the way our business is organised and run,
KATHMANDU ANNUAL REPORT 2013 11
and have developed a new two-year sustainability plan for 2014 - 2015. Our goal is to deliver value to our stakeholders through sustainability, while positioning Kathmandu as a leader in this area.
A full account of our achievements is in our annual 2013 sustainability report, prepared in accordance with the Global Reporting Initiative guidelines.
OUR TEAM Employee numbers as at 31 July 2013 increased from 1,722 last year to 1,920 this year, in line with our continuing growth in store numbers. Approximately 69% of the total workforce is full time or part time permanent employees. We have made a substantial investment in training and development capability during the year. It remains important to our success, that Kathmandu’s staff continue to maintain their positive view of us as their preferred employer, and that we provide a career pathway to leadership roles within our business and the wider retail sector. On a personal note I want to thank my Executive management team for the support and leadership they provided in delivering an excellent result, in particular during my period of absence from the business during the second half of FY2013.
MARKET OVERVIEW AND FUTURE OUTLOOK Kathmandu faces strong and growing competition from local and international outdoor and travel brands and retailers. The latter group are increasingly moving, in whole or in part, to operating the same vertical business model as Kathmandu. Overall this model appears to be the most successful and resilient retail model in our current markets, and it aligns effectively with online sales channels. The outdoor category remains an attractive sector for investment, hence there continues to be both local and global merger and acquisition opportunity for good outdoor businesses and brands. The sustained growth in category store numbers over a number of years in both New Zealand and Australia reinforces our assessment of the relatively strong outlook for the category. This contrasts with other retail sectors dependent on discretionary consumer spend that have been much less resilient since the 2008 GFC.
GROWTH OPPORTUNITIES We continue to develop our store network plan to ensure our target of 170+ stores in Australia and New Zealand is aligned with our continuously evolving analysis of the optimal footprint and location for each prospective new site, and in due course numerous current sites that we will relocate. In conjunction with this, to further maximise store-by-store profitability, our product development and ranging strategy will continue to link closely into store planning.
We now have 1 million active members in our Summit Club programme. Our improved customer relationship management platform will further enhance our ability to target the right offers to these core customers. Summit Club fits well with the opportunity for growth in online sales, in both current and future markets.
Just as in our retail stores, retention of customers in the online space will be strongly influenced by how well we utilise customer analytics, and how we engage with those customers through channels such as social media and unique online only deals. Customer relationship management is critical to us in building the Summit Club through all channels we sell in.
We have confidence that the Kathmandu brand and its product range can have wider growth potential internationally, and we are going to test this going forward with greater focus in the UK market initially. Our development of a path for global growth of the Kathmandu brand requires us to learn from the re-organised UK business, now a relatively low cost and low risk aspect of the business.
We intend to take up on a structured basis the opportunities that online and digital technology provide, and the quality and effectiveness of our systems must be adequate to enable us to operate globally in a multichannel environment. We have recently launched a selected range of Kathmandu product on Amazon UK, and plan to explore other similar marketplace opportunities. Development is underway to enhance our capability to transact with customers via mobile devices, providing functionality for flexible ordering and customer product collection. These are all steps in developing the systems required to support growth initiatives available to Kathmandu outside our current business model.
Kathmandu’s future continues to look positive, with opportunities for growth continuing to be identified, prioritised and implemented. We believe our competitive advantage, and a profitable core business, will enable us to grow our brand’s market reach.
Peter HalkettManaging Director and Chief Executive Officer

12 ANNUAL REPORT 2013 KATHMANDU
board
left to right - John Holland, Christine Cross, Peter Halkett, John Harvey, Sandra McPhee and Mark Todd.
John HarveyChairman
Mr Harvey is a professional Director with a background in accounting and professional services, including 23 years as a partner of PricewaterhouseCoopers where he also held a number of leadership and governance roles. Mr Harvey has extensive experience in financial reporting, governance, information systems and processes, business evaluation, acquisition, merger and takeover reviews.
Mr Harvey is currently a non-Executive Director of DNZ Property Fund, Heartland Bank, Ballance Agri-Nutrients, Port Otago and NZ Opera.
Peter HalkettManaging Director and Chief Executive Officer
Mr Halkett joined Kathmandu in 2006 and has directed the growth strategy for the business throughout the period of current ownership.
Mr Halkett has had a management career with extensive retail experience including Chief Executive Officer roles in New Zealand and the United Kingdom. The companies he has led include two that were publicly listed, in particular Pacific Retail Group.
Mark ToddFinance Director and Chief Financial Officer
Mr Todd joined Kathmandu in 1998, following previous financial management experience in both the apparel and retail sectors.
Mr Todd has been Kathmandu’s senior financial executive throughout his 15 years with the Group, a Director of various Group companies and manager of the New Zealand business from 2004-2006.
Mr Todd is the Company Secretary.
Mr Todd is currently a non-Executive Director of City Care.
John HollandNon-Executive Director
Mr Holland is a partner in the national New Zealand law firm Chapman Tripp and specialises in general corporate and commercial law. Mr Holland’s securities law experience includes acting on initial public offerings, advising on employee share schemes and in the private equity area.
Mr Holland is is currently a non-Executive Director of Southbase Construction, a member of the Financial Markets Authority Capital Markets Disclosure Consideration Panel, having previously been a member of the Securities Commission of New Zealand and is an accredited director of the New Zealand Institute of Directors.
Sandra McPhee AMNon-Executive Director
Ms McPhee is an experienced executive and non-Executive Director in consumer facing sectors including aviation, retail, energy and media. She held a range of senior international executive roles in the aviation industry, most recently with Qantas Airways Limited.
Ms McPhee is currently a non-Executive Director of Fairfax Media, AGL Energy, Westfield Retail Trust, Tourism Australia and Vice President of the Art Gallery of NSW. She is also a member of the JP Morgan Advisory Council, MMC Advisory Board and President of St Vincents and Mater Health Sydney Community Advisory Council.
Christine CrossNon-Executive Director
Ms Cross has extensive experience in the international retail and consumer goods sector including 14 years as a Director on the operating board of Tesco Plc.
Ms Cross currently runs a retail advisory consultancy focusing on international best practice in customer led business planning and value chain management. Ms Cross also has Non-Executive Directorships with Woolworths, Next plc, Sonae Group plc and Plantasjen. In addition Ms Cross is an advisor to several private equity funds and private companies.

KATHMANDU ANNUAL REPORT 2013 13
management
Mark Todd Finance Director and Chief Financial Officer
Refer to Page 12.
Peter Halkett Managing Director and Chief Executive Officer
Refer to Page 12.
Matthew Watts GM, Retail (Australia)
Joined Kathmandu in 2011, with over 10 years multi site management experience in zone and national roles with Coles and Coles Express.
Michelle Adams GM, Product Joined Kathmandu in 2009 following extensive product and brand management experience with Pacific Brands and Canterbury.
Grant Taylor Chief Information Officer
Joined Kathmandu in August 2010 with 15 years experience in senior IT roles, including CIO at Otago and Southland District Health Boards and Group IT Manager for PGG Wrightson.
Tamalin Morton GM, Marketing Joined Kathmandu in 2007, with extensive experience in marketing management and brand strategy gained through senior marketing roles with Coles Group and Bass plc (UK).
Caleb Nicolson GM, Supply Chain Joined Kathmandu in 2007, after eight years with The Warehouse, where he had responsibility for delivering change across the supply chain and the merchandise function.
Paul Stern GM,Business Development & Sustainability
Joined Kathmandu in January 2010 with over 18 years experience in senior Retail and Marketing roles, including at Kmart, A.S. Watson (Hong Kong), and Cadbury Schweppes.
Brandon Beveridge GM, Retail (New Zealand)
Joined Kathmandu in 2007, with an extensive retail management background in multi site, proprietorship and national roles. Prior to Kathmandu, he was 15 years with Pacific Retail Group.

14 ANNUAL REPORT 2013 KATHMANDU
KATHMANDU ANNUAL REPORT 2013 15
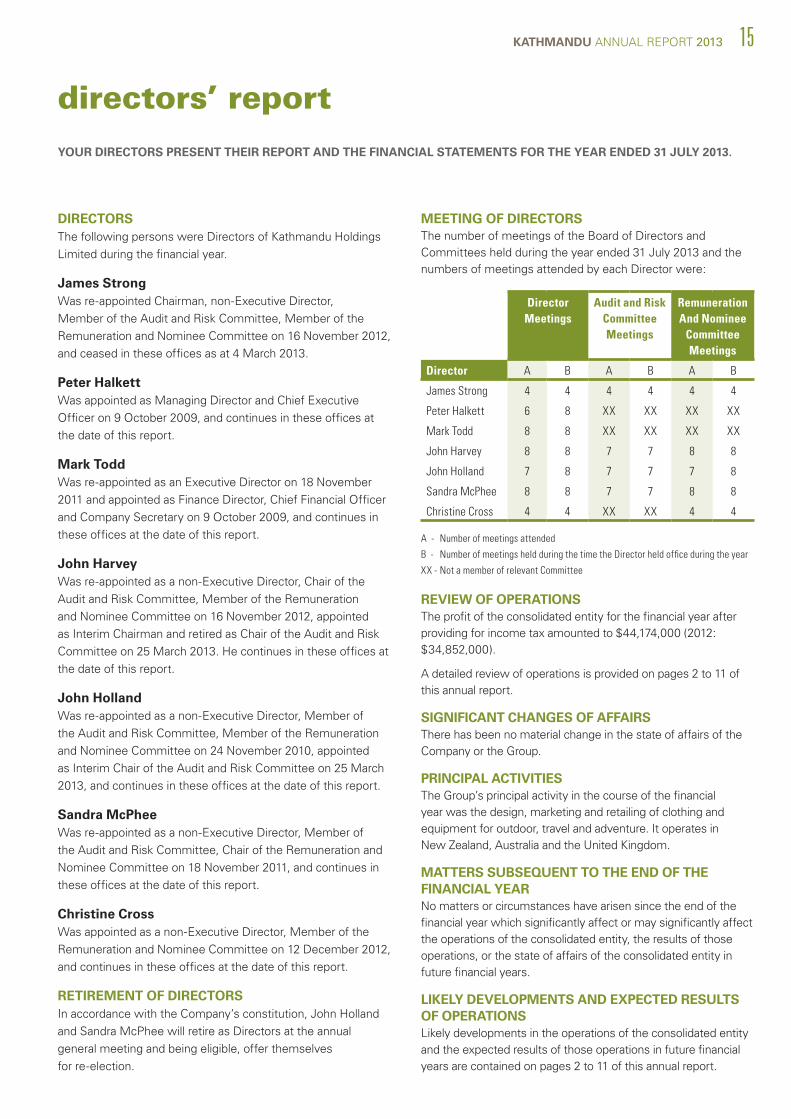
directors’ reportYOUR DIRECTORS PRESENT THEIR REPORT AND THE FINANCIAL STATEMENTS FOR THE YEAR ENDED 31 JULY 2013.
Director Meetings
Audit and Risk Committee Meetings
Remuneration And Nominee
Committee Meetings
Director A B A B A B
James Strong 4 4 4 4 4 4
Peter Halkett 6 8 XX XX XX XX
Mark Todd 8 8 XX XX XX XX
John Harvey 8 8 7 7 8 8
John Holland 7 8 7 7 7 8
Sandra McPhee 8 8 7 7 8 8
Christine Cross 4 4 XX XX 4 4
A - Number of meetings attended
B - Number of meetings held during the time the Director held office during the year
XX - Not a member of relevant Committee
DIRECTORS The following persons were Directors of Kathmandu Holdings Limited during the financial year.
James Strong Was re-appointed Chairman, non-Executive Director, Member of the Audit and Risk Committee, Member of the Remuneration and Nominee Committee on 16 November 2012, and ceased in these offices as at 4 March 2013.
Peter Halkett Was appointed as Managing Director and Chief Executive Officer on 9 October 2009, and continues in these offices at the date of this report.
Mark Todd Was re-appointed as an Executive Director on 18 November 2011 and appointed as Finance Director, Chief Financial Officer and Company Secretary on 9 October 2009, and continues in these offices at the date of this report.
John Harvey Was re-appointed as a non-Executive Director, Chair of the Audit and Risk Committee, Member of the Remuneration and Nominee Committee on 16 November 2012, appointed as Interim Chairman and retired as Chair of the Audit and Risk Committee on 25 March 2013. He continues in these offices at the date of this report.
John Holland Was re-appointed as a non-Executive Director, Member of the Audit and Risk Committee, Member of the Remuneration and Nominee Committee on 24 November 2010, appointed as Interim Chair of the Audit and Risk Committee on 25 March 2013, and continues in these offices at the date of this report.
Sandra McPhee Was re-appointed as a non-Executive Director, Member of the Audit and Risk Committee, Chair of the Remuneration and Nominee Committee on 18 November 2011, and continues in these offices at the date of this report.
Christine Cross Was appointed as a non-Executive Director, Member of the Remuneration and Nominee Committee on 12 December 2012, and continues in these offices at the date of this report.
RETIREMENT OF DIRECTORS In accordance with the Company’s constitution, John Holland and Sandra McPhee will retire as Directors at the annual general meeting and being eligible, offer themselves for re-election.
MEETING OF DIRECTORS The number of meetings of the Board of Directors and Committees held during the year ended 31 July 2013 and the numbers of meetings attended by each Director were:
REVIEW OF OPERATIONS The profit of the consolidated entity for the financial year after providing for income tax amounted to $44,174,000 (2012: $34,852,000).
A detailed review of operations is provided on pages 2 to 11 of this annual report.
SIGNIFICANT CHANGES OF AFFAIRS There has been no material change in the state of affairs of the Company or the Group.
PRINCIPAL ACTIVITIES The Group’s principal activity in the course of the financial year was the design, marketing and retailing of clothing and equipment for outdoor, travel and adventure. It operates in New Zealand, Australia and the United Kingdom.
MATTERS SUBSEQUENT TO THE END OF THE FINANCIAL YEAR No matters or circumstances have arisen since the end of the financial year which significantly affect or may significantly affect the operations of the consolidated entity, the results of those operations, or the state of affairs of the consolidated entity in future financial years.
LIKELY DEVELOPMENTS AND EXPECTED RESULTS OF OPERATIONS Likely developments in the operations of the consolidated entity and the expected results of those operations in future financial years are contained on pages 2 to 11 of this annual report.
16 ANNUAL REPORT 2013 KATHMANDU
ENVIRONMENTAL REGULATION The consolidated entity's operations are not regulated by any significant environmental regulation under a law of the Commonwealth or of a State or Territory of Australia, or of New Zealand.
DIVIDENDS Since the end of the financial year the Directors have declared the payment of a final ordinary dividend of NZ 9.0 cents per share. Dividends will carry full New Zealand imputation credits and full Australian franking credits. The dividend will be paid on 22 November 2013.
The Company does not currently have an active dividend re-investment plan.
INSURANCE OF OFFICERS The Company has entered into deeds of indemnity, insurance and access with each Director which confirms each person’s right of access to certain books and records of the Company for a period of seven years after the Director ceases to hold office. This seven year period can be extended where certain proceedings or investigations commence before the seven years expires. The deed also requires the Company to provide an indemnity for liability incurred as an officer of the Company, to the maximum extent permitted by law.
Indemnification: Pursuant to the Constitution, the Company is required to indemnify all Directors and employees, past and present against all liabilities allowed under law. The Company has entered into an agreement with each Director to indemnify those parties against all liabilities to another person that may arise from their position as Director or other officer of the Company or its controlled entities to the extent permitted by law. The deed stipulates that the Company will meet the full amount of any such liabilities, including reasonable legal costs and expenses.
Insurance: Pursuant to the Constitution, the Company may arrange and maintain Directors’ and officers’ insurance during each Director’s period of office, and for a period of seven years after a Director ceases to hold office. This seven year period can be extended where certain proceedings or investigations commence before the seven years expires.
REMUNERATION REPORT
The remuneration report is set out in the following sections:
A PRINCIPLES USED TO DETERMINE THE NATURE AND AMOUNT OF REMUNERATION
B DETAILS OF REMUNERATION
C SERVICE AGREEMENTS
D DETAILS OF SHARE-BASED COMPENSATION
E ADDITIONAL INFORMATION, PERFORMANCE RIGHTS VESTING
The information provided in this remuneration report has not been audited as Kathmandu Holdings Limited is a foreign company in terms of the Corporations Act 2001 (Australia). However, the report provided generally follows the same principles applied by Australian companies listed on the ASX,
and the audited remuneration disclosures contained in note 9 of the financial statements generally comply with those required under the Corporations Act 2001 (Australia).
A PRINCIPLES USED TO DETERMINE THE NATURE AND AMOUNT OF REMUNERATION The Company’s Remuneration and Nomination Committee is the primary body that determines the quantum and framework of Directors and Executive remuneration. The composition, role and responsibility of the Committee is outlined in the Corporate Governance Statement on page 26 of this annual report. The Committee adopts a series of principles in determining remuneration related decisions. The principles used are:
Remuneration (quantum and/or structures) whether measured at base or total level, should be market competitive, and generally account for key relevant internal and external factors such as employee level of responsibility and place of domicile, Company commercial circumstances, and market practice;
Those employees with the ability to influence the achievement of the Company’s strategic objectives and business plans (“key management and senior management personnel”) should be rewarded by way of performance based rewards structured to reflect achievement against those objectives and plans;
The alignment and mix of remuneration should not be based primarily upon cash incentives earned from Company short term profit performance. The remuneration framework recognises the varying Executive roles, remunerates these accordingly and has an incentive structure that has a reduced and appropriate proportion of total remuneration that is cash based;
The opportunity to participate in equity based rewards should be a component of the reward structure for key management personnel, both to align their reward with the creation of shareholder value, and to encourage their ongoing participation in and retention by the Company;
Key management personnel includes all Executives, which are personnel who are reporting directly to the Chief Executive Officer or Chief Financial Officer, designated as an Executive by the CEO and with responsibility and authority for management of a significant profit or cost centre. Executives should have a substantial portion (as a target no less than one-third) of their total remuneration aligned with reward for creating shareholder value. This should generally be achieved through the application of appropriate and measureable performance hurdles to be met as criteria for receiving incentive based remuneration by way of cash or equity;
The Executive Directors (Chief Executive Officer and Chief Financial Officer) should, relative to other Executives have
• a greater proportion of total remuneration (at least 45%) that is “at risk”, i.e. contingent upon the achievement of performance hurdles, and
KATHMANDU ANNUAL REPORT 2013 17
• a greater proportion of “at risk” remuneration weighted towards equity based rewards rather than cash,
because of their role in establishing and delivering achievement of medium and long term Company strategic objectives and business plans, and increasing shareholder value over that period.
The opportunity to participate in equity based rewards should be a component of remuneration for all key and senior management personnel.
The audited consolidated financial results for the Group are the basis for measuring achievement against the financial performance target.
Non-Executive Directors’ remuneration should enable the Company to attract and retain high quality Directors with the relevant experience. In order to maintain independence and impartiality, non-Executive Directors should not receive performance based remuneration.
The Board uses discretion when setting remuneration levels, taking into account the current market environment.
REMUNERATION REVIEW 31 JULY 2013 The Board on the advice of the Committee has accountability to set all Executive remuneration. Recognising the principles above, the current prevailing market conditions and the reported performance of the Company, the committee determined the following in relation to the 31 July 2013 review of base remuneration:
Board Directors, 3% increase;
Executive Directors, no increase in base salary for Chief Financial Officer. Chief Executive Officer remuneration detailed below;
Executives, base salary increase 2% in New Zealand, 2.5% in Australia;
There was no increase in any of the base remuneration levels in the 31 July 2012 review of remuneration.
The structure and levels of available short and long term incentives for FY2014 have been reviewed. In considering the total remuneration opportunity made available, the Board on the advice of the Committee have determined it is appropriate to increase the quantum of incentive based earnings available for Executives and Executive Directors. This will enable higher total remuneration to be earned by these employees, but only in conjunction with the Group achieving appropriate financial performance targets for the relevant future period of performance management.
EXECUTIVE REWARDS The Company’s objective is to provide a remuneration framework whereby every incentive payment over and above an Executive’s fixed pay, whether in the form of cash or equity, is appropriate for the results delivered by the Company and the employee and is based on reward for performance. The Board, through the Committee undertakes its governance role in establishing Executive remuneration including, where required, use of external independent remuneration consultants
and/or available market information, with reference to both total remuneration and its various components.
The Executive remuneration framework (currently applying to 9 Executives including the 2 Executive Directors) has four components:
1. Base salary and benefits;
2. Short term cash incentives;
3. Short term equity incentives with associated requirements relating to continuing employment with the Company, and
4. Long term incentives via participation in the Company’s Option and Long Term Incentive plans.
The combination of these comprises the Executives’ total remuneration. Other senior management personnel have a remuneration framework incorporating components 1. to 3.
1. Base salary and benefits Executive base salaries are structured as part of a total employment remuneration package which is delivered as a mix of cash and non-monetary benefits determined by negotiation with the Executive.
Executives are offered a competitive base salary that comprises the fixed component of pay and rewards. External independent remuneration consultants provide analysis and advice to assess whether base salary as well as total remuneration reflects the market positioning for a comparable role. Base salary for Executives is reviewed annually to provide competitiveness with the market but there are no guaranteed base salary increases in any Executive’s contracts, except as specifically stated in this report. An Executive’s remuneration is also reviewed on promotion.
Executive benefits made available are superannuation contributions made in accordance with the legislation specific to each country in which the employee is resident, and for some Executives leasing and/or reimbursement of vehicle running costs, and medical insurance. Key management and senior management personnel who relocate their place of working between countries may be assisted in the cost of such relocation.
2. Short term cash incentives Executives including the Executive Directors are eligible to participate in an annual short term cash incentive which delivers rewards by way of cash bonuses, subject to the achievement of Group financial performance targets and individual KPI’s.
Group Earnings before interest, tax, depreciation and amortisation (EBITDA) has been determined as the appropriate financial performance target to trigger payment of short term cash incentives. This criterion excludes depreciation and amortisation expenses arising from the substantial capital investment programme approved and overseen by the Board over the medium term. The programme dollar spend and number of projects, means substantial variability in the depreciation and amortisation expense arising year by year is possible. This could be both within and beyond Executive
18 ANNUAL REPORT 2013 KATHMANDU
control given the nature and mix of the Group’s capital assets and leases, and the structure of the Group Executive whereby the bulk of the capital investment programme is determined and approved by the Chief Executive Officer and/or the Chief Financial Officer.
The amount of any short term cash incentive paid in a year is dependent upon:
the level of over performance achieved against the Group’s financial performance target (EBITDA) for the year; and
if financial performance targets have been met or exceeded, the achievement of individual KPI’s.
For the year ended 31 July 2013 the Group’s financial performance targets were not met and the annual short term cash incentive was not paid. A smaller discretionary cash bonus was paid to key and senior management personnel including Executives in recognition of the EBITDA result for the year being very close to the annual performance target once the adverse impact of non-controllable exchange rate (AUD to NZD) translation was adjusted for.
For the year ended 31 July 2012 the Group’s financial performance targets were not met and no short term cash incentives were paid.
3. Short term equity incentives with performance conditions The shareholder approved long term incentive plan enables the Board to offer equity incentives as part of short and long term remuneration. Key and senior management personnel including Executives participate in short term equity incentives.
Executives excluding the Executive Directors have 50% of the total value of their annual short term incentive equity based, with rewards delivered by way of nil cost performance rights. The entitlement to the short term equity incentive will be subject to the achievement of the same Group financial performance and individual KPI’s as for the short term cash incentive.
Executive Directors annual short term incentive is a lower % of their base salary than for other Executives, and all of their annual short term incentive is cash based.
Senior management personnel also have an annual short term incentive that is equity based, generally up to 15% of base salary, with rewards delivered by way of nil cost performance rights. The entitlement to the short term equity incentive is also subject to the achievement of Group’s financial performance target for the year (EBITDA).
If the Group financial performance targets and individual KPI’s are achieved, vesting of the performance rights granted under this incentive will generally require:
the Executive staff member to remain employed by the Group for a period of two years after the end of the financial year in which Group financial performance that determines entitlement to the rights is measured, or
the senior management staff member to remain employed by the Group for a period of one year after the end of the financial year in which Group financial performance that determines entitlement to the rights is measured.
For the years ended 31 July 2013 and 2012 the Group’s financial performance targets (EBITDA) were not met and consequently no short term equity incentives granted to Executives (including the Executive Directors) or senior management personnel in relation to this period will vest.
4. Long Term Incentive Plans
Options Plan 2009 The Company implemented the Employee Option plan on 16 October 2009, and it was developed in the lead in to the Company’s IPO in order to provide an incentive scheme for selected senior employees in conjunction with the public listing of the Company. An initial grant of options was made in conjunction with the IPO to seven Executives of the Company (five of these Executives are still employed as at 31 July 2013). Vesting of the options is subject to the Company achieving a compound annual growth in Total Shareholder Return (TSR) of 15% for the period applying to each tested period of performance measurement. TSR was determined as the criterion for performance measurement based on research against the market, and advice from external independent remuneration consultants with reference to the approach considered appropriate for a Company undertaking an IPO of shares.
Subject to achievement of this condition and Executives remaining in employment with the Company at the vesting date, the options granted to each Executive as detailed below vest progressively in three equal tranches on the test dates of 1 October 2010, 2011 and 2012. If the TSR performance condition has not been achieved on the applicable test date there will be re-testing of this condition on 1 October 2011, 2012 and 2013. All options have an expiry date five years from their date of grant.
The Board do not intend to grant any further options under the existing plan. The Board are of the view that the existing plan no longer represents an appropriate on-going long term incentive structure for the Company post the IPO.
Long-term incentive plan November 2010 Shareholders approved the current long term incentive plan at the Company’s 2010 Annual General Meeting based on the granting of nil cost performance rights. Rights have been offered each year since the plan was approved. Vesting of the rights are dependent upon the Company achieving Earnings per Share (EPS) and /or relative TSR targets over a 2, 3 and 4 year performance period, with 50% of the value of rights allocated under each target.
EPS is measured on a compound annual growth basis and TSR is measured on a relative basis against similar sized Australian and New Zealand listed retail organisations. Performance measurement under either criterion is at the end of each applicable performance period with no ability to re-test. Fifty percent of the relevant portion of the award vests for achievement of targets and a further fifty percent vests for the achievement of aspirational targets. A sliding scale operates between target and aspirational performance levels.
This long-term incentive is intended to focus performance on achievement of key long-term performance metrics. The selected performance measures provide an appropriate balance between relative and absolute Company performance. The

KATHMANDU ANNUAL REPORT 2013 19
BASE FEES AUD $
Chairman 216,000
Other non-Executive Directors 113,000
Actual fees paid in year ended 31 July 2013 (converted to reporting currency)
NZD $
Chairman 267,876
Other non-Executive Directors 140,139
Committee considers this plan will best support and facilitate the growth in shareholder value over the long term.
From 2011 onwards, the Committee resolved to grant only Executive Directors with nil cost performance rights that will require achievement of EPS and relative TSR targets over the 2, 3 and 4 year periods. These grants are subject to shareholder approval.
NON-EXECUTIVE DIRECTORS’ FEES The current aggregate limit for non-Executive Directors’ fees is $A800,000 per annum. In FY2013 the base fee payable (including superannuation if applicable) to the Chairman of $A206,000 and to a non-Executive Director currently of $A103,000 per annum. Additionally $A10,000 per annum is paid for sub-committee attendances. These amounts were increased by 3% with effect from 1 August 2013.
The Managing Director and Finance Director do not receive Directors’ fees. The amounts approved for Directors’ fees are expressed in AUD given the specific requirements for remuneration reporting applying to ASX listed companies, however all amounts reported in the tables within this report are specified in NZD, being the reporting currency of the Company.
It remains the Board’s intention that Directors’ fees will be reviewed annually; with external independent remuneration consultants providing advice to ensure fees reflect market rates. There are no guaranteed annual increases in any Director’s fees.
Non-Executive Directors do not participate in the Company short or long term incentive schemes.
The following fees apply per annum, including sub-committee attendance fees:
B DETAILS OF REMUNERATION
The following Executives along with the Directors are
identified as key management personnel with the authority
and responsibility for planning, directing and controlling the
activities of the Group, directly or indirectly, during the
financial year:
Peter Halkett - Chief Executive Officer
Mark Todd - Chief Financial Officer
Tamalin Morton - General Manager, Marketing
Michelle Adams - General Manager, Product
Caleb Nicolson - General Manager, Supply Chain
Paul Stern - General Manager, Business Development and Sustainability
Grant Taylor - Chief Information Officer
Matthew Watts - General Manager, Retail Australia (from 1 March 2012)
Brandon Beveridge - General Manager, Retail New Zealand (from 1 March 2012)
All of the above persons were employed by the Group and were key management personnel for the full years ended 31 July 2013 and 2012, unless otherwise stated. Mark Todd, Michelle Adams, Caleb Nicolson, Grant Taylor and Brandon Beveridge are employees of Kathmandu Limited (New Zealand domiciled), and Peter Halkett, Tamalin Morton, Paul Stern and Matthew Watts, are employees of Kathmandu Pty Limited (Australian domiciled).
Details of the remuneration of the Directors and total remuneration of other key management personnel of the Group, for the current and prior financial years are set out in note 9 of the financial statements.
For the year ended 31 July 2013 the Group’s financial performance targets were not met and thus the annual short term cash and equity incentives were not paid. A smaller discretionary cash bonus was paid to key and senior management personnel in recognition of the EBITDA outcome for the year being very close to the financial performance target once the adverse impact of non-controllable exchange rate AUD to NZD translation was adjusted for.
COST OF CHIEF EXECUTIVE OFFICER’S CHANGE OF TAX RESIDENCY In the second half of FY2013 the Board reviewed the appropriate primary workplace of the Chief Executive Officer, and in conjunction with its taxation advisors also assessed his associated current and historical residency for taxation purposes. As Peter Halkett has been required to operate primarily out of our Melbourne office in the period following the Christchurch earthquake in February 2011, it has been determined that since May 2011 he has been primarily tax resident in Australia. The Board and Chief Executive Officer have negotiated a sharing of the expenses including personal income tax and other associated deductions for the period from May 2011 to July 2013 arising from this required change of taxation residency. This expense is reported in his remuneration in note 9c of the financial statements. The Board and the Chief Executive Officer have also entered into a new employment agreement recognising this new residency circumstance that is effective from FY2014 onwards. The Chief Executive Officer’s new remuneration under this agreement is detailed in the Notice of Annual General Meeting for 2013.
C SERVICE AGREEMENTS All Executives are on employment terms consistent with the remuneration framework outlined in this report. Each of the agreements has an open term, and the period of notice to be given by the employee is three months. The agreements provide for three months base salary inclusive of any applicable superannuation to be paid in the event of a redundancy.
20 ANNUAL REPORT 2013 KATHMANDU
Year Ended 31 July 2010
Options grant date
Options granted during the year
First vesting date
Last vesting date
Total fair value of options at grant date $
Options vested during the year
Executive Directors
Peter Halkett 18 Nov 2009 186,218 1 Oct 2010 1 Oct 2013 78,925 -
Peter Halkett 18 Nov 2009 186,218 1 Oct 2011 1 Oct 2013 88,912 -
Peter Halkett 18 Nov 2009 186,218 1 Oct 2012 1 Oct 2013 90,841 -
Mark Todd 18 Nov 2009 53,377 1 Oct 2010 1 Oct 2013 22,623 -
Mark Todd 18 Nov 2009 53,377 1 Oct 2011 1 Oct 2013 25,485 -
Mark Todd 18 Nov 2009 53,377 1 Oct 2012 1 Oct 2013 26,038 -
Other Key Management Personnel
Michelle Adams 18 Nov 2009 26,755 1 Oct 2010 1 Oct 2013 11,340 -
Michelle Adams 18 Nov 2009 26,755 1 Oct 2011 1 Oct 2013 12,774 -
Michelle Adams 18 Nov 2009 26,756 1 Oct 2012 1 Oct 2013 13,052 -
Tamalin Morton 18 Nov 2009 36,932 1 Oct 2010 1 Oct 2013 15,653 -
Tamalin Morton 18 Nov 2009 36,932 1 Oct 2011 1 Oct 2013 17,634 -
Tamalin Morton 18 Nov 2009 36,933 1 Oct 2012 1 Oct 2013 18,017 -
Caleb Nicolson 18 Nov 2009 15,518 1 Oct 2010 1 Oct 2013 6,577 -
Caleb Nicolson 18 Nov 2009 15,518 1 Oct 2011 1 Oct 2013 7,409 -
Caleb Nicolson 18 Nov 2009 15,518 1 Oct 2012 1 Oct 2013 7,570 -
Total 956,402 442,850 -
D DETAILS OF SHARE-BASED COMPENSATION
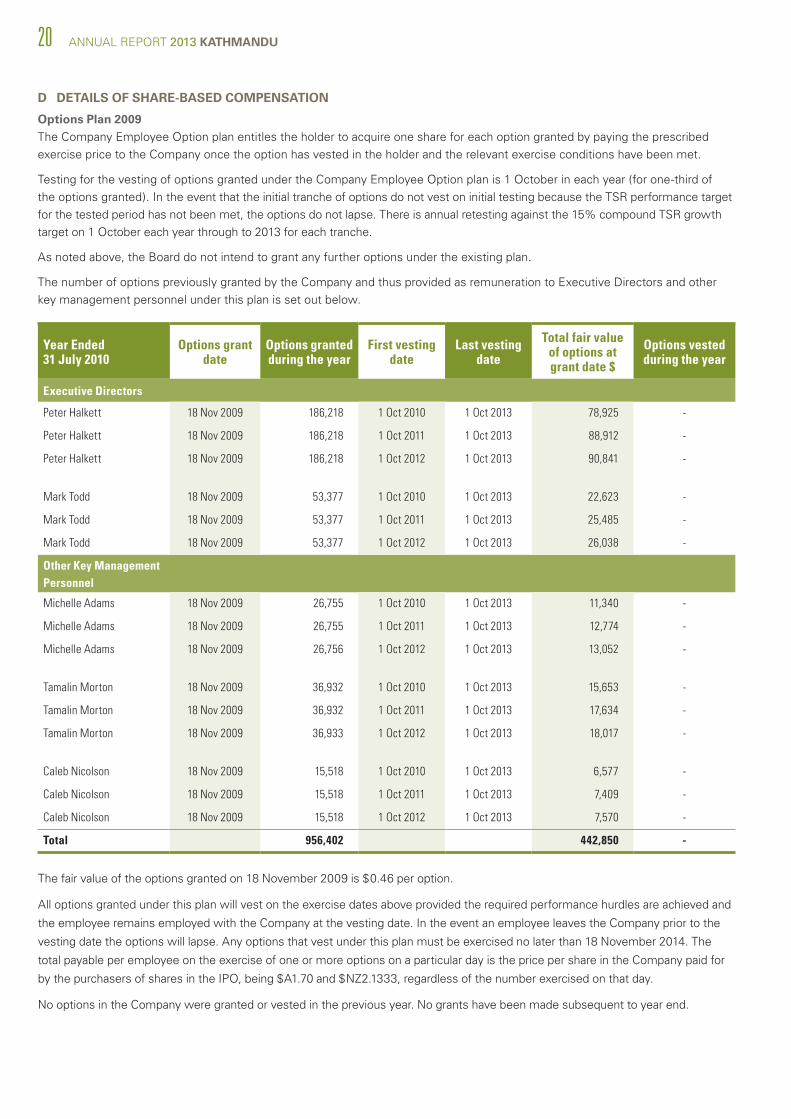
Options Plan 2009 The Company Employee Option plan entitles the holder to acquire one share for each option granted by paying the prescribed exercise price to the Company once the option has vested in the holder and the relevant exercise conditions have been met.
Testing for the vesting of options granted under the Company Employee Option plan is 1 October in each year (for one-third of the options granted). In the event that the initial tranche of options do not vest on initial testing because the TSR performance target for the tested period has not been met, the options do not lapse. There is annual retesting against the 15% compound TSR growth target on 1 October each year through to 2013 for each tranche.
As noted above, the Board do not intend to grant any further options under the existing plan.
The number of options previously granted by the Company and thus provided as remuneration to Executive Directors and other key management personnel under this plan is set out below.
The fair value of the options granted on 18 November 2009 is $0.46 per option.
All options granted under this plan will vest on the exercise dates above provided the required performance hurdles are achieved and
the employee remains employed with the Company at the vesting date. In the event an employee leaves the Company prior to the
vesting date the options will lapse. Any options that vest under this plan must be exercised no later than 18 November 2014. The
total payable per employee on the exercise of one or more options on a particular day is the price per share in the Company paid for
by the purchasers of shares in the IPO, being $A1.70 and $NZ2.1333, regardless of the number exercised on that day.
No options in the Company were granted or vested in the previous year. No grants have been made subsequent to year end.
KATHMANDU ANNUAL REPORT 2013 21
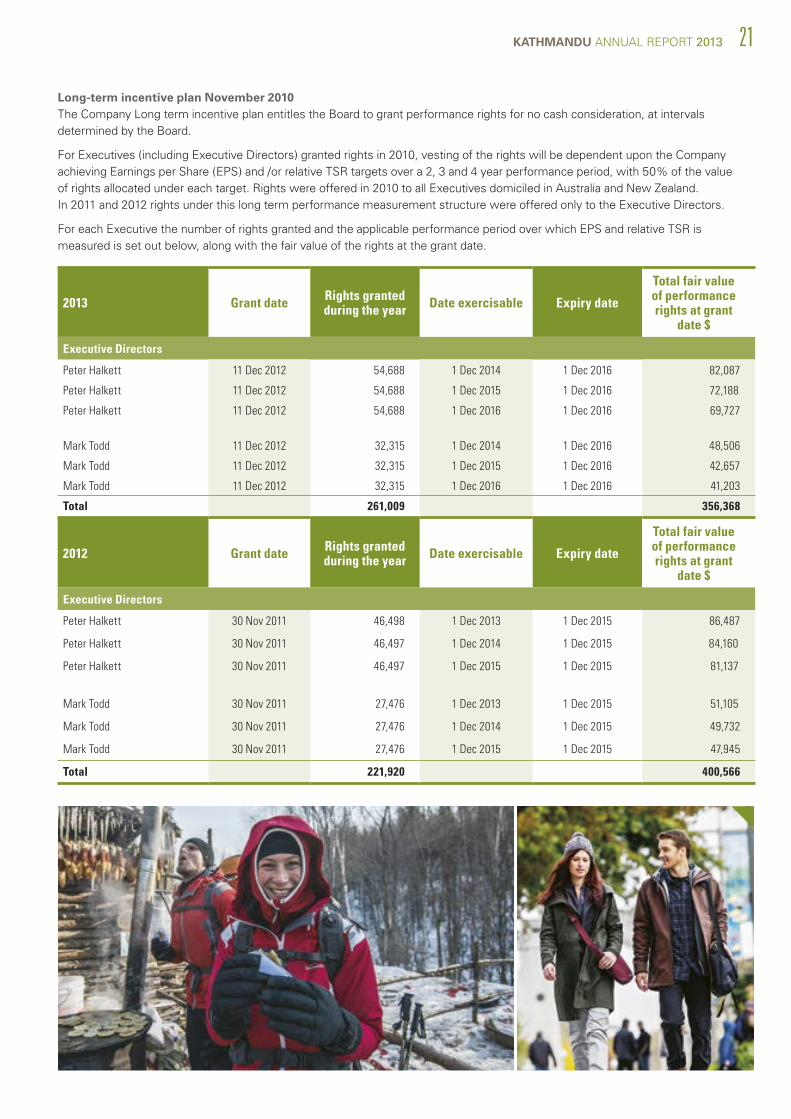
2013 Grant date Rights granted during the year Date exercisable Expiry date
Total fair value of performance rights at grant
date $
Executive Directors
Peter Halkett 11 Dec 2012 54,688 1 Dec 2014 1 Dec 2016 82,087
Peter Halkett 11 Dec 2012 54,688 1 Dec 2015 1 Dec 2016 72,188))
Peter Halkett 11 Dec 2012 54,688 1 Dec 2016 1 Dec 2016 69,727
Mark Todd 11 Dec 2012 32,315 1 Dec 2014 1 Dec 2016 48,506
Mark Todd 11 Dec 2012 32,315 1 Dec 2015 1 Dec 2016 42,657
Mark Todd 11 Dec 2012 32,315 1 Dec 2016 1 Dec 2016 41,203
Total 261,009 356,368
2012 Grant date Rights granted during the year Date exercisable Expiry date
Total fair value of performance rights at grant
date $
Executive Directors
Peter Halkett 30 Nov 2011 46,498 1 Dec 2013 1 Dec 2015 86,487
Peter Halkett 30 Nov 2011 46,497 1 Dec 2014 1 Dec 2015 84,160))
Peter Halkett 30 Nov 2011 46,497 1 Dec 2015 1 Dec 2015 81,137))
Mark Todd 30 Nov 2011 27,476 1 Dec 2013 1 Dec 2015 51,105))
Mark Todd 30 Nov 2011 27,476 1 Dec 2014 1 Dec 2015 49,732
Mark Todd 30 Nov 2011 27,476 1 Dec 2015 1 Dec 2015 47,945
Total 221,920 400,566
Long-term incentive plan November 2010 The Company Long term incentive plan entitles the Board to grant performance rights for no cash consideration, at intervals determined by the Board.
For Executives (including Executive Directors) granted rights in 2010, vesting of the rights will be dependent upon the Company achieving Earnings per Share (EPS) and /or relative TSR targets over a 2, 3 and 4 year performance period, with 50% of the value of rights allocated under each target. Rights were offered in 2010 to all Executives domiciled in Australia and New Zealand. In 2011 and 2012 rights under this long term performance measurement structure were offered only to the Executive Directors.
For each Executive the number of rights granted and the applicable performance period over which EPS and relative TSR is measured is set out below, along with the fair value of the rights at the grant date.
22 ANNUAL REPORT 2013 KATHMANDU
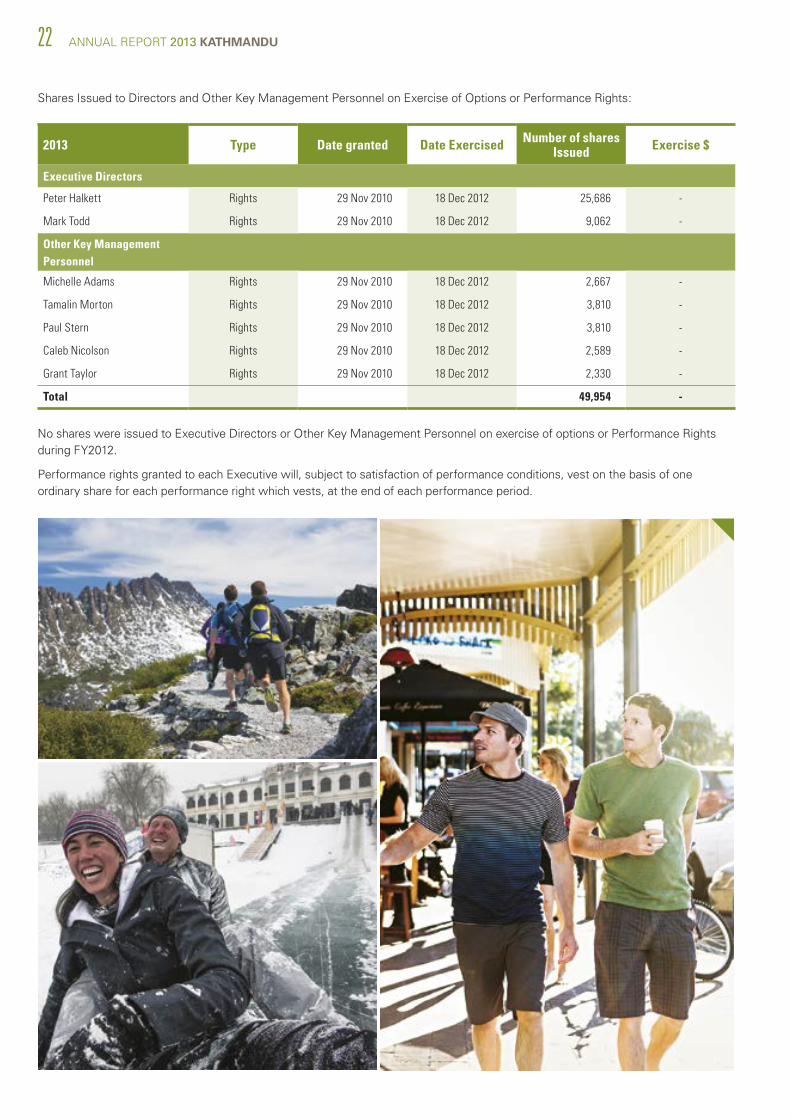
Shares Issued to Directors and Other Key Management Personnel on Exercise of Options or Performance Rights:
2013 Type Date granted Date Exercised Number of shares Issued Exercise $
Executive Directors
Peter Halkett Rights 29 Nov 2010 18 Dec 2012 25,686 -
Mark Todd Rights 29 Nov 2010 18 Dec 2012 9,062 -
Other Key Management Personnel
Michelle Adams Rights 29 Nov 2010 18 Dec 2012 2,667 -
Tamalin Morton Rights 29 Nov 2010 18 Dec 2012 3,810 -
Paul Stern Rights 29 Nov 2010 18 Dec 2012 3,810 -
Caleb Nicolson Rights 29 Nov 2010 18 Dec 2012 2,589 -
Grant Taylor Rights 29 Nov 2010 18 Dec 2012 2,330 -
Total 49,954 -
No shares were issued to Executive Directors or Other Key Management Personnel on exercise of options or Performance Rights during FY2012.
Performance rights granted to each Executive will, subject to satisfaction of performance conditions, vest on the basis of one ordinary share for each performance right which vests, at the end of each performance period.
KATHMANDU ANNUAL REPORT 2013 23
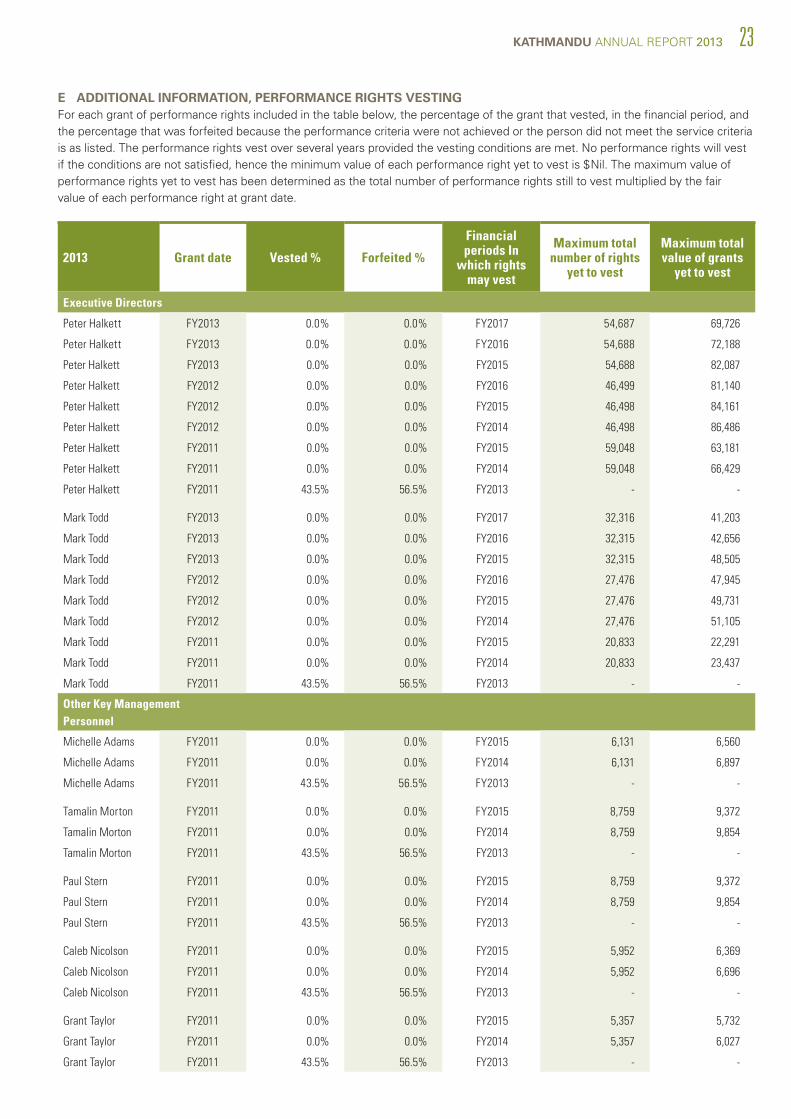
E ADDITIONAL INFORMATION, PERFORMANCE RIGHTS VESTING For each grant of performance rights included in the table below, the percentage of the grant that vested, in the financial period, and the percentage that was forfeited because the performance criteria were not achieved or the person did not meet the service criteria is as listed. The performance rights vest over several years provided the vesting conditions are met. No performance rights will vest if the conditions are not satisfied, hence the minimum value of each performance right yet to vest is $Nil. The maximum value of performance rights yet to vest has been determined as the total number of performance rights still to vest multiplied by the fair value of each performance right at grant date.
2013 Grant date Vested % Forfeited %
Financial periods In
which rights may vest
Maximum total number of rights
yet to vest
Maximum total value of grants
yet to vest
Executive Directors
Peter Halkett FY2013 0.0% 0.0% FY2017 54,687 69,726
Peter Halkett FY2013 0.0% 0.0% FY2016 54,688 72,188
Peter Halkett FY2013 0.0% 0.0% FY2015 54,688 82,087
Peter Halkett FY2012 0.0% 0.0% FY2016 46,499 81,140
Peter Halkett FY2012 0.0% 0.0% FY2015 46,498 84,161
Peter Halkett FY2012 0.0% 0.0% FY2014 46,498 86,486
Peter Halkett FY2011 0.0% 0.0% FY2015 59,048 63,181
Peter Halkett FY2011 0.0% 0.0% FY2014 59,048 66,429
Peter Halkett FY2011 43.5% 56.5% FY2013 - -
Mark Todd FY2013 0.0% 0.0% FY2017 32,316 41,203
Mark Todd FY2013 0.0% 0.0% FY2016 32,315 42,656
Mark Todd FY2013 0.0% 0.0% FY2015 32,315 48,505
Mark Todd FY2012 0.0% 0.0% FY2016 27,476 47,945
Mark Todd FY2012 0.0% 0.0% FY2015 27,476 49,731
Mark Todd FY2012 0.0% 0.0% FY2014 27,476 51,105
Mark Todd FY2011 0.0% 0.0% FY2015 20,833 22,291
Mark Todd FY2011 0.0% 0.0% FY2014 20,833 23,437
Mark Todd FY2011 43.5% 56.5% FY2013 - -
Other Key Management Personnel
Michelle Adams FY2011 0.0% 0.0% FY2015 6,131 6,560
Michelle Adams FY2011 0.0% 0.0% FY2014 6,131 6,897
Michelle Adams FY2011 43.5% 56.5% FY2013 - -
Tamalin Morton FY2011 0.0% 0.0% FY2015 8,759 9,372
Tamalin Morton FY2011 0.0% 0.0% FY2014 8,759 9,854
Tamalin Morton FY2011 43.5% 56.5% FY2013 - -
Paul Stern FY2011 0.0% 0.0% FY2015 8,759 9,372
Paul Stern FY2011 0.0% 0.0% FY2014 8,759 9,854
Paul Stern FY2011 43.5% 56.5% FY2013 - -
Caleb Nicolson FY2011 0.0% 0.0% FY2015 5,952 6,369
Caleb Nicolson FY2011 0.0% 0.0% FY2014 5,952 6,696
Caleb Nicolson FY2011 43.5% 56.5% FY2013 - -
Grant Taylor FY2011 0.0% 0.0% FY2015 5,357 5,732
Grant Taylor FY2011 0.0% 0.0% FY2014 5,357 6,027
Grant Taylor FY2011 43.5% 56.5% FY2013 - -
24 ANNUAL REPORT 2013 KATHMANDU
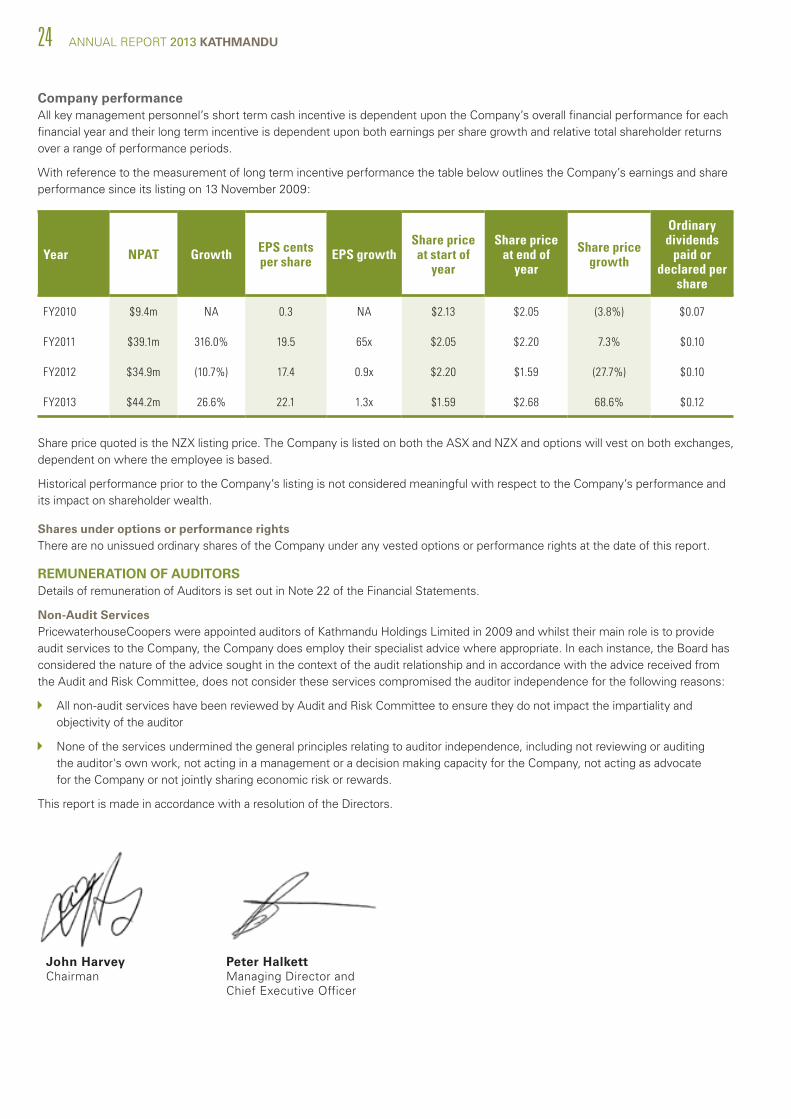
Company performance All key management personnel’s short term cash incentive is dependent upon the Company’s overall financial performance for each financial year and their long term incentive is dependent upon both earnings per share growth and relative total shareholder returns over a range of performance periods.
With reference to the measurement of long term incentive performance the table below outlines the Company’s earnings and share performance since its listing on 13 November 2009:
Peter HalkettManaging Director and Chief Executive Officer
John HarveyChairman
Year NPAT Growth EPS cents per share EPS growth
Share price at start of
year
Share price at end of
year
Share price growth
Ordinary dividends
paid or declared per
share
FY2010 $9.4m NA 0.3 NA $2.13 $2.05 (3.8%) $0.07
FY2011 $39.1m 316.0% 19.5 65x $2.05 $2.20 7.3% $0.10
FY2012 $34.9m (10.7%) 17.4 0.9x $2.20 $1.59 (27.7%) $0.10
FY2013 $44.2m 26.6% 22.1 1.3x $1.59 $2.68 68.6% $0.12
Share price quoted is the NZX listing price. The Company is listed on both the ASX and NZX and options will vest on both exchanges, dependent on where the employee is based.
Historical performance prior to the Company’s listing is not considered meaningful with respect to the Company’s performance and its impact on shareholder wealth.
Shares under options or performance rights There are no unissued ordinary shares of the Company under any vested options or performance rights at the date of this report.
REMUNERATION OF AUDITORS Details of remuneration of Auditors is set out in Note 22 of the Financial Statements.
Non-Audit Services PricewaterhouseCoopers were appointed auditors of Kathmandu Holdings Limited in 2009 and whilst their main role is to provide audit services to the Company, the Company does employ their specialist advice where appropriate. In each instance, the Board has considered the nature of the advice sought in the context of the audit relationship and in accordance with the advice received from the Audit and Risk Committee, does not consider these services compromised the auditor independence for the following reasons:
All non-audit services have been reviewed by Audit and Risk Committee to ensure they do not impact the impartiality and objectivity of the auditor
None of the services undermined the general principles relating to auditor independence, including not reviewing or auditing the auditor's own work, not acting in a management or a decision making capacity for the Company, not acting as advocate for the Company or not jointly sharing economic risk or rewards.
This report is made in accordance with a resolution of the Directors.

KATHMANDU ANNUAL REPORT 2013 25
BOARD, MANAGEMENT AND CORPORATE GOVERNANCEcorporate governanceThe Board and management of the Company are committed to ensuring that the Company adheres to best practice governance principles and maintains the highest ethical standards. The Board is responsible for the overall corporate governance of the Company, including adopting the appropriate policies and procedures and seeking to ensure Directors, management and employees fulfil their functions effectively and responsibly. The Company is listed on both the New Zealand and Australian stock exchanges. Corporate governance principles and guidelines have been introduced in both countries. These include the Australian Securities Exchange (ASX) Corporate Governance Council Corporate Governance Principles and Recommendations, the New Zealand Stock Exchange Listing Rules relating to corporate governance, the NZX Corporate Governance Best Practice Code, and the New Zealand Securities Commission’s Corporate Governance Principles and Guidelines (collectively, the Principles). The Board considers that the Company’s corporate governance practices and procedures substantially reflect the principles. The full content of the Company’s Corporate Governance policies, practices and procedures can be found on the Company’s website (www.kathmanduholdings.com).
The main policies and practices adopted by the Company are summarised below.
BOARD CHARTERS OF DIRECTORS AND ITS COMMITTEES The Board has adopted a written charter to provide a framework for the effective operation of the Board. The charter addresses the following matters and responsibilities of the Board:
enhancing Shareholder value;
oversight of the Company, including its control and accountability systems;
appointing and removing the Managing Director (or equivalent) and the Chief Financial Officer;
ratifying the appointment, and where appropriate, the removal of the senior executives;
input into and approval of corporate strategy and performance objectives;
reviewing and ratifying systems of risk management and internal compliance and control, codes of conduct and legal compliance;
monitoring senior management’s performance and implementation strategy, and seeking to ensure appropriate resources are available;
approving and monitoring the progress of major capital expenditure, capital management and acquisitions and divestitures;
approving budgets; and
approving and monitoring financial and other reporting.
BOARD COMPOSITION At present, there are six Directors on the Board. Four out of the six Directors are non-Executive Directors. Peter Halkett, (Managing Director and Chief Executive Officer), and Mark Todd (Finance Director and Chief Financial Officer) are the only Executive Directors on the Board. The Chairman of the Board is John Harvey. The biography of each Board member, including each Director’s skills, experience, expertise and the term of office held by each Director at the date of this Annual Report is set out in the “Board of Directors” section of this Annual Report.
INDEPENDENCE OF DIRECTORS The factors that the Company will take into account when assessing the independence of its Directors are set out in its Charter, a copy of which is available on the Company’s website (www.kathmanduholdings.com).
The Managing Director (Peter Halkett) and Finance Director (Mark Todd) are employed by the Company or another Group member in an executive capacity and are not considered to be independent Directors based on the criteria set out in the Board Charter. All remaining Directors satisfy the criteria and are considered independent Directors, namely John Harvey, John Holland, Sandra McPhee and Christine Cross.
BOARD COMMITTEES The Board may from time to time establish appropriate committees to assist in the discharge of its responsibilities. The Board has established the Audit and Risk Committee and the Remuneration and Nomination Committee. Other committees may be established by the Board as and when required. Membership of Board committees will be based on the needs of the Company, relevant legislative and other requirements and the skills and experience of individual Directors.
Audit and Risk Committee Under its charter, this committee must have at least three members, a majority of whom must be independent Directors and all of whom must be non-Executive Directors. Currently, all the non-Executive Directors, other than Christine Cross are members of this committee. John Holland is Chair of the committee.
The primary role of this committee includes:
overseeing the process of financial reporting, internal control, continuous disclosure, financial and non-financial risk management and compliance and external audit;
monitoring Kathmandu’s compliance with laws and regulations and Kathmandu’s own codes of conduct and ethics;
encouraging effective relationships with, and communication between, the Board, Management and Kathmandu’s external auditor; and
26 ANNUAL REPORT 2013 KATHMANDU
evaluating the adequacy of processes and controls established to identify and manage areas of potential risk and to seek to safeguard the Company’s assets.
Under the charter it is the policy of the Company that its external auditing firm must be independent of the Company. The committee will review and assess the independence of the external auditor on an annual basis.
Remuneration and Nomination Committee Under its charter, this committee must have at least three members, a majority of whom must be independent Directors and all of whom must be non-Executive Directors. Currently, all the non-Executive Directors are members of this committee. Sandra McPhee is Chair of the committee. The main functions of the committee, are to assist the Board with a view to establishing a Board of effective composition, size, expertise and commitment to adequately discharge its responsibilities and duties, and assist the Board with a view to discharging its responsibilities to Shareholders and other stakeholders to seek to ensure that the Company:
has coherent remuneration policies and practices which enable the Company to attract and retain Executives and Directors who will create value for Shareholders;
fairly and responsibly remunerates Directors and Executives, having regard to the performance of the Company, the performance of the Executives and the general remuneration environment; and
has effective policies and procedures to attract, motivate and retain appropriately skilled persons to meet the Company’s needs.
RISK MANAGEMENT POLICY The identification and proper management of the Company’s risk are an important priority of the Board. The Company has a risk management policy appropriate for its business. This policy highlights the risks relevant to the Company’s operations, and the Company’s commitment to designing and implementing systems and methods appropriate to minimise and control its risk. The Audit and Risk Committee is responsible for monitoring risk management and establishing procedures which seek to provide assurance that major business risks are identified, consistently assessed and appropriately addressed.
CONTINUOUS DISCLOSURE POLICY The Company is committed to observing its disclosure obligations under the Listing Rules. The Company has a policy
KATHMANDU ANNUAL REPORT 2013 27
which establishes procedures which are aimed at ensuring that Directors and Management are aware of and fulfil their obligations in relation to the timely disclosure of material price-sensitive information.
SECURITIES TRADING POLICY The Company has guidelines for dealing in securities which are intended to explain the prohibited type of conduct in relation to dealings in securities under the Corporations Act 2001 (Australia) and the Securities Markets Act 1988 (NZ) and to establish a best practice procedure in relation to Directors’, management’s and employees’ dealings in Shares in the Company. Subject to the overriding restriction that persons may not deal in Shares while they are in possession of material price sensitive information, Directors and management will only be permitted to deal in Shares during certain ‘window periods’, following the release of the Company’s full and half year financial results or the release of a disclosure document offering shares in the Company. Outside of these periods, Directors and management must receive clearance for any proposed dealing in Shares.
CODE OF CONDUCT The Board recognises the need to observe the highest standards of corporate practice and business conduct. Accordingly, the Board has a formal code of conduct, to be followed by all employees and officers. The key aspects of this code are to:
act with honesty, integrity and fairness and in the best interest of the Company;
act in accordance with all applicable laws, regulations, policies and procedures; and
use Company resources and property properly.
DIVERSITY POLICY Our employees are a vital resource and play a key role in the success of the company. The skills and expertise of Kathmandu’s employees drive innovation throughout the business.
Kathmandu aspires to appoint the best people to do the best job. In seeking to achieve this objective, the importance of employee diversity is recognised in our commitment to recruit, develop and promote employees on merit, at all levels across the company, without any form of discrimination. The benefits of diversity will continue to be tested and re-affirmed with reference to our team composition.
Kathmandu has established a Diversity Policy in accordance with ASX CGC Corporate Governance Principles and Recommendations. A copy of this Policy can be obtained from the Company Website.
We consider our current level of employee gender diversity to be effective; however we will continue to be vigilant in the review of measureable diversity objectives in accordance with Recommendation 3.3 of the ASX CGC Corporate Governance Principles and Recommendations.
GENDER DIVERSITY In accordance with ASX CGC Corporate Governance Principles and Recommendations, Recommendation 3.4; the proportion of females employed by Kathmandu as at 31 July 2013 was as follows:
Board: 33% being 2 female of 6 Directors
Executive Management: Total 9 = 7 males (78%), 2 females (22%)
Senior Management (Wider Leadership Team): Total 43 = 25 Male (58%), 18 Female (42%)
Total Employees New Zealand: Total 714 = 266 Male (37%) and 448 Female (63%)
Total Employees Australia: Total 1159 = 551 Male (47.5%) and 608 Female (52.5%)
Total Employees United Kingdom: Total 47 = 30 Male (64%) and 17 Female (36%)
Total Kathmandu Group: Total 1920 = 847 Males (44%) and 1073 Females (56%)
Kathmandu considers our current employee gender diversity as a strength and we will continue to support strategies and initiatives that address any significant changes in diversity ratios through employee turnover. Kathmandu is also proud of its ethnic diversity which reflects the diversity of its customers; business partners and community. Return to work and flexible working arrangements which facilitate gender diversity will be expanded to provide further provision to the retention of our team.
A study of employee pay parity was conducted and audited as part of the company annual salary review process, to consider whether any employee gender pay disparity existed. Based upon the results there is little evidence of any disparity between male and female employees. A review of gender pay parity will continue to be an on-going focus for the company.
COMMUNICATIONS WITH SHAREHOLDERS The Company is committed to keeping Shareholders informed of all major developments affecting the Company’s state of affairs relevant to Shareholders in accordance with all applicable laws. Information is communicated to Shareholders through the lodgement of all relevant financial and other information with ASX and NZX and publishing information on the Company’s website (www.kathmanduholdings.com). In particular, the Company’s website will contain information about the Company, including media releases,key policies and the terms of reference of the Company’s Board Committees.
All relevant announcements made to the market and any other relevant information will be posted on the Company’s website as soon as they have been released to ASX and NZX.

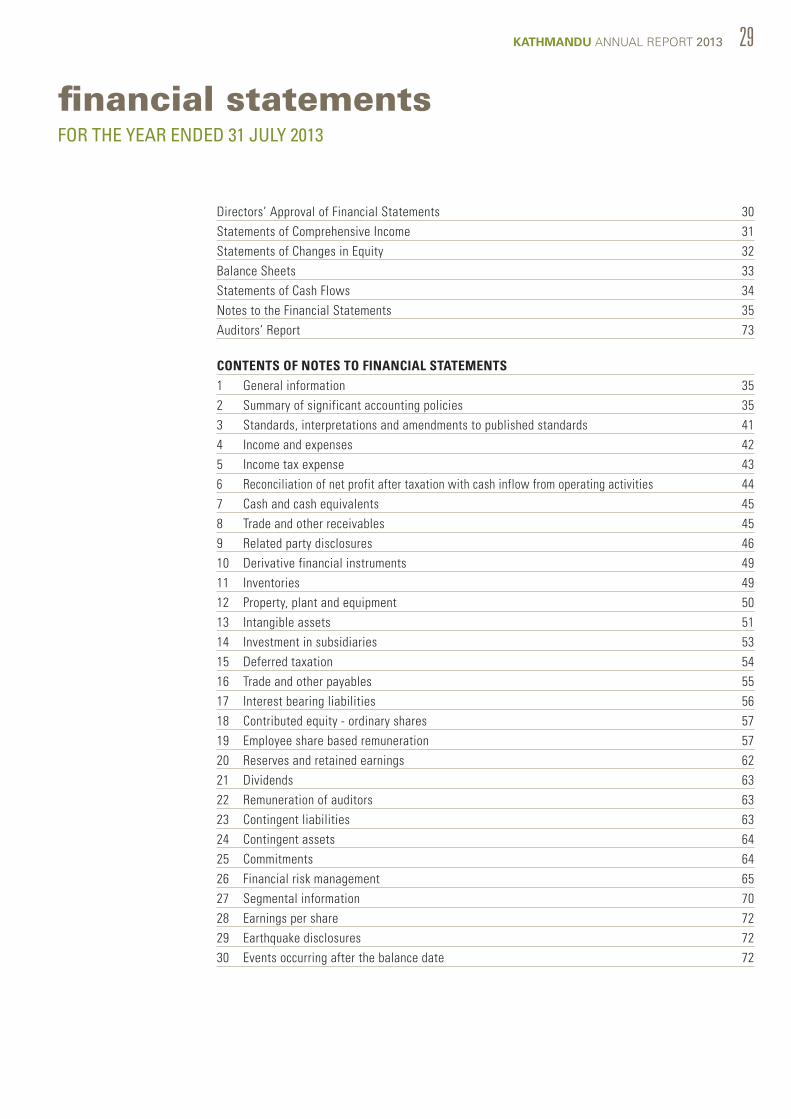
KATHMANDU ANNUAL REPORT 2013 29
financial statementsFOR THE YEAR ENDED 31 JULY 2013
Directors’ Approval of Financial Statements 30Statements of Comprehensive Income 31Statements of Changes in Equity 32Balance Sheets 33Statements of Cash Flows 34Notes to the Financial Statements 35Auditors’ Report 73 CONTENTS OF NOTES TO FINANCIAL STATEMENTS1 General information 352 Summary of significant accounting policies 353 Standards, interpretations and amendments to published standards 414 Income and expenses 425 Income tax expense 436 Reconciliation of net profit after taxation with cash inflow from operating activities 447 Cash and cash equivalents 458 Trade and other receivables 459 Related party disclosures 4610 Derivative financial instruments 4911 Inventories 4912 Property, plant and equipment 5013 Intangible assets 5114 Investment in subsidiaries 5315 Deferred taxation 5416 Trade and other payables 5517 Interest bearing liabilities 5618 Contributed equity - ordinary shares 5719 Employee share based remuneration 5720 Reserves and retained earnings 6221 Dividends 6322 Remuneration of auditors 6323 Contingent liabilities 6324 Contingent assets 6425 Commitments 6426 Financial risk management 6527 Segmental information 7028 Earnings per share 7229 Earthquake disclosures 7230 Events occurring after the balance date 72

30 ANNUAL REPORT 2013 KATHMANDU
Authorisation for Issue
The Board of Directors authorised the issue of these Financial Statements on 24 September 2013.
Approval by Directors
The Directors are pleased to present the Financial Statements of Kathmandu Holdings Limited for the year ended 31 July 2013 on pages 31 to 72.
Director Date: 24 September 2013
Director Date: 24 September 2013
For and on behalf of the Board of Directors
directors’ approval of financial statementsFOR THE YEAR ENDED 31 JULY 2013
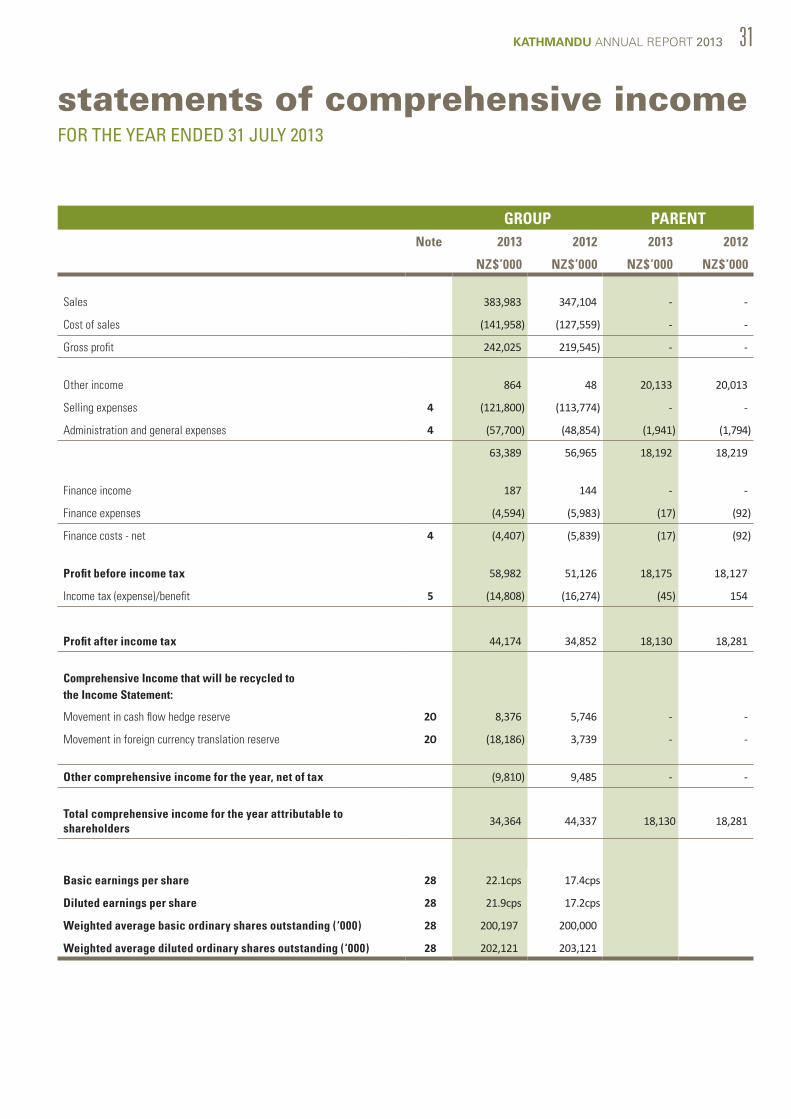
KATHMANDU ANNUAL REPORT 2013 31
statements of comprehensive incomeFOR THE YEAR ENDED 31 JULY 2013
GROUP PARENTNote 2013 2012 2013 2012
NZ$’000 NZ$’000 NZ$’000 NZ$’000
Sales 383,983) 347,104) -) -
Cost of sales (141,958) (127,559) -) -
Gross profit 242,025) 219,545) -) -
Other income 864) 48) 20,133) 20,013)
Selling expenses 4 (121,800) (113,774) -) -
Administration and general expenses 4 (57,700) (48,854) (1,941) (1,794)
63,389) 56,965) 18,192) 18,219)
Finance income 187) 144) -) -
Finance expenses (4,594) (5,983) (17) (92)
Finance costs - net 4 (4,407) (5,839) (17) (92)
Profit before income tax 58,982) 51,126) 18,175) 18,127)
Income tax (expense)/benefit 5 (14,808) (16,274) (45) 154)
Profit after income tax 44,174) 34,852) 18,130) 18,281)
Comprehensive Income that will be recycled to the Income Statement:
Movement in cash flow hedge reserve 20 8,376) 5,746) -) -
Movement in foreign currency translation reserve 20 (18,186) 3,739) -) -
Other comprehensive income for the year, net of tax (9,810) 9,485) -) -
Total comprehensive income for the year attributable to shareholders
34,364) 44,337) 18,130 18,281)
Basic earnings per share 28 22.1cps) 17.4cps
Diluted earnings per share 28 21.9cps) 17.2cps
Weighted average basic ordinary shares outstanding (‘000) 28 200,197)) 200,000)
Weighted average diluted ordinary shares outstanding (‘000) 28 202,121)) 203,121)

32 ANNUAL REPORT 2013 KATHMANDU
statements of changes in equityFOR THE YEAR ENDED 31 JULY 2013
GROUPShare
Capital
Cash Flow Hedge
Reserve
Foreign Currency
Translation Reserve
Share Based
Payments Reserve
Retained Earnings Total Equity
NZ$’000 NZ$’000 NZ$’000 NZ$’000 NZ$’000 NZ$’000
Balance as at 31 July 2011 197,049) (9,055) 3,889) 625)) 62,418) 254,926
Total comprehensive income -) 5,746)) 3,739) -) 34,852) 44,337
Dividends paid -) -) -) -) (20,000) (20,000)
Issue of share capital 249) -) -) (249) - -)
Share Options / Performance Rights lapsed -) -) -) (8) 8) -)
Share based payment expense -) -) -) 371)) - 371
Balance as at 31 July 2012 197,298) (3,309) 7,628) 739)) 77,278) 279,634
Total comprehensive income -) 8,376)) (18,186) -) 44,174 34,364
Dividends paid -) -) - -) (20,018) (20,018)
Issue of share capital 72) -) - (72) - -
Share Options / Performance Rights lapsed -) -) - (53) 53) -
Share based payment expense -) -) - 209)) - 209
Balance as at 31 July 2013 197,370) 5,067)) (10,558) 823)) 101,487 294,189
PARENTShare
Capital
Cash Flow Hedge
Reserve
Foreign Currency
Translation Reserve
Share Based
Payments Reserve
Retained Earnings Total Equity
NZ$’000 NZ$’000 NZ$’000 NZ$’000 NZ$’000 NZ$’000
Balance as at 31 July 2011 422,137 - - 625 (13,943) 408,819
Total comprehensive income - - - - 18,281 18,281
Dividends paid - - - - (20,000) (20,000)
Issue of share capital 249 - - (249) - -
Share Options / Performance Rights lapsed - - - (8) 8 -
Share based payment expense - - - 371 - 371
Balance as at 31 July 2012 422,386 - - 739 (15,654) 407,471
Total comprehensive income - - - - 18,130 18,130
Dividends paid - - - - (20,018) (20,018)
Issue of share capital 72 - - (72) - -
Share Options / Performance Rights lapsed - - - (53) 53 -
Share based payment expense - - - 209 - 209
Balance as at 31 July 2013 422,458 - - 823 (17,489) 405,792
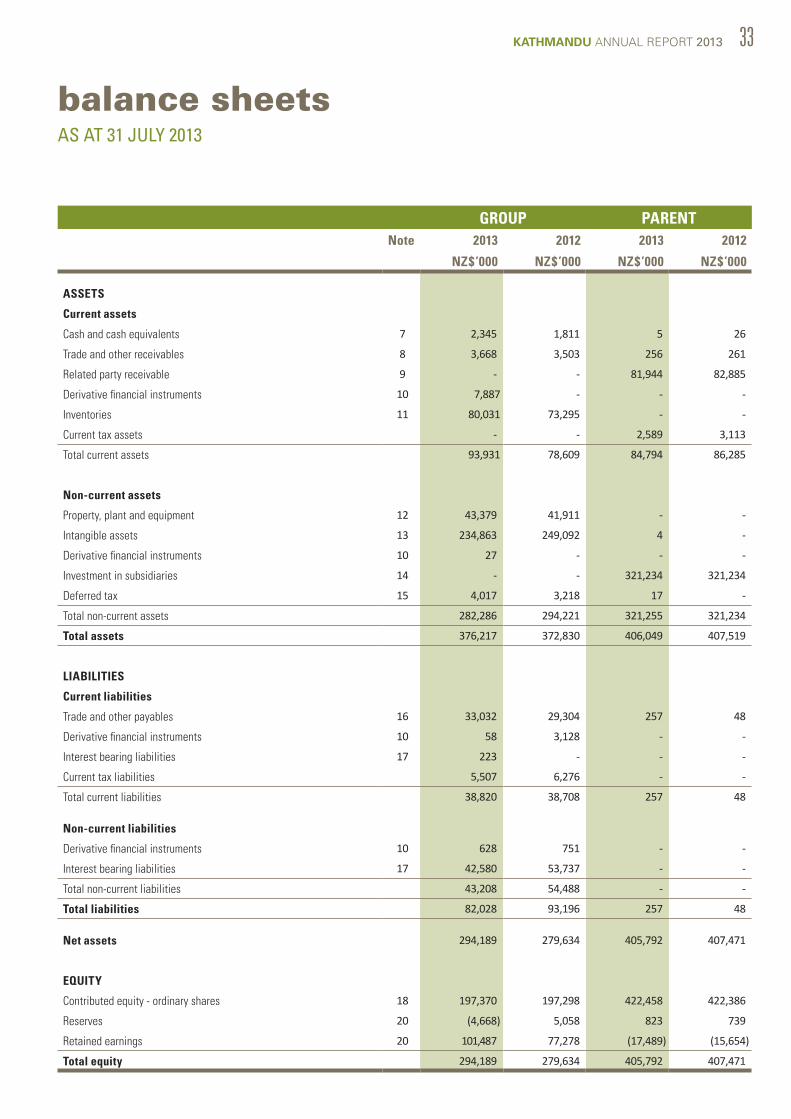
KATHMANDU ANNUAL REPORT 2013 33
balance sheetsAS AT 31 JULY 2013
GROUP PARENTNote 2013 2012 2013 2012
NZ$’000 NZ$’000 NZ$’000 NZ$’000
ASSETS
Current assets
Cash and cash equivalents 7 2,345 1,811 5 26
Trade and other receivables 8 3,668 3,503 256 261
Related party receivable 9 - - 81,944 82,885
Derivative financial instruments 10 7,887 - - -
Inventories 11 80,031 73,295 - -
Current tax assets - - 2,589 3,113
Total current assets 93,931 78,609 84,794 86,285
Non-current assets
Property, plant and equipment 12 43,379 41,911 - -
Intangible assets 13 234,863 249,092 4 -
Derivative financial instruments 10 27 - - -
Investment in subsidiaries 14 - - 321,234 321,234
Deferred tax 15 4,017 3,218 17 -
Total non-current assets 282,286 294,221 321,255 321,234
Total assets 376,217 372,830 406,049 407,519
LIABILITIES
Current liabilities
Trade and other payables 16 33,032 29,304 257 48
Derivative financial instruments 10 58 3,128 - -
Interest bearing liabilities 17 223 - - -
Current tax liabilities 5,507 6,276 - -
Total current liabilities 38,820 38,708 257 48
Non-current liabilities
Derivative financial instruments 10 628 751 - -
Interest bearing liabilities 17 42,580 53,737 - -
Total non-current liabilities 43,208 54,488 - -
Total liabilities 82,028 93,196 257 48
Net assets 294,189 279,634 405,792 407,471
EQUITY
Contributed equity - ordinary shares 18 197,370 197,298 422,458 422,386
Reserves 20 (4,668) 5,058 823 739
Retained earnings 20 101,487 77,278 (17,489) (15,654)
Total equity 294,189 279,634 405,792 407,471
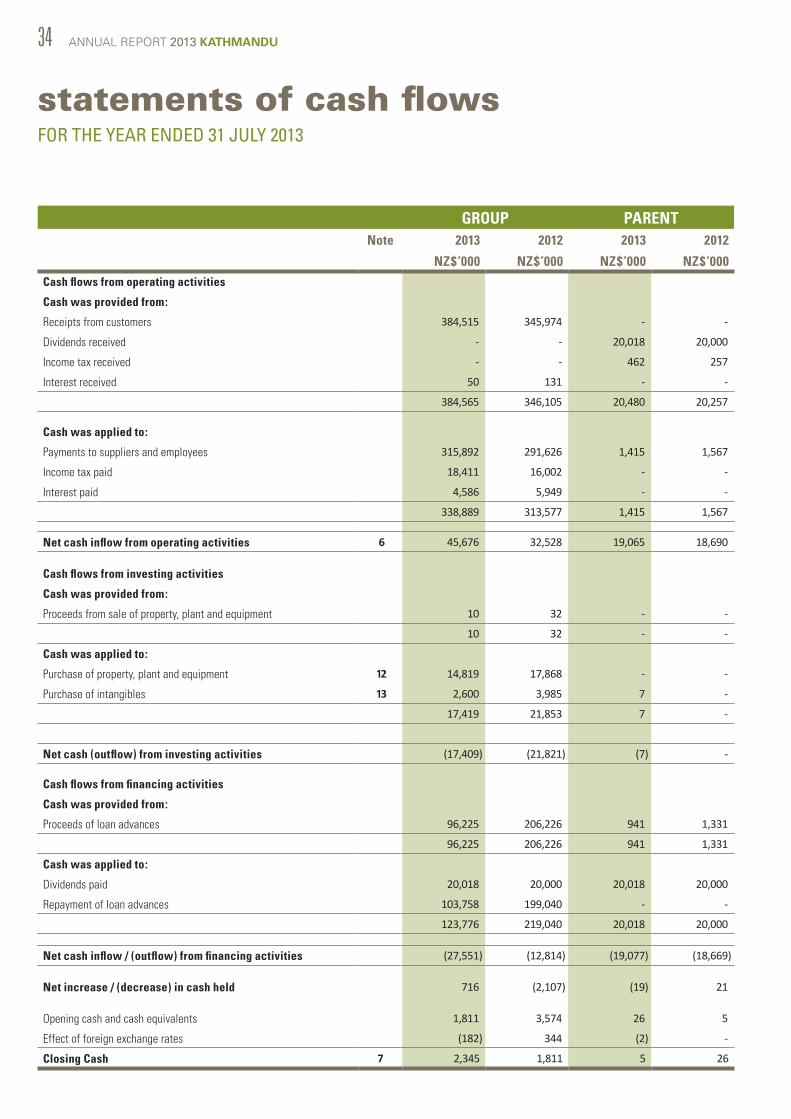
34 ANNUAL REPORT 2013 KATHMANDU
statements of cash flowsFOR THE YEAR ENDED 31 JULY 2013
GROUP PARENTNote 2013 2012 2013 2012
NZ$’000 NZ$’000 NZ$’000 NZ$’000Cash flows from operating activities
Cash was provided from:
Receipts from customers 384,515 345,974 - -
Dividends received - - 20,018 20,000
Income tax received - - 462 257
Interest received 50 131 - -
384,565 346,105 20,480 20,257
Cash was applied to:
Payments to suppliers and employees 315,892 291,626 1,415 1,567
Income tax paid 18,411 16,002 - -
Interest paid 4,586 5,949 - -
338,889 313,577 1,415 1,567
Net cash inflow from operating activities 6 45,676 32,528 19,065 18,690
Cash flows from investing activities
Cash was provided from:
Proceeds from sale of property, plant and equipment 10 32 - -
10 32 - -
Cash was applied to:
Purchase of property, plant and equipment 12 14,819 17,868 - -
Purchase of intangibles 13 2,600 3,985 7 -
17,419 21,853 7 -
Net cash (outflow) from investing activities (17,409) (21,821) (7) -
Cash flows from financing activities
Cash was provided from:
Proceeds of loan advances 96,225 206,226 941 1,331
96,225 206,226 941 1,331
Cash was applied to:
Dividends paid 20,018 20,000 20,018 20,000
Repayment of loan advances 103,758 199,040 - -
123,776 219,040 20,018 20,000
Net cash inflow / (outflow) from financing activities (27,551) (12,814) (19,077) (18,669)
Net increase / (decrease) in cash held 716 (2,107) (19) 21
Opening cash and cash equivalents 1,811 3,574 26 5
Effect of foreign exchange rates (182) 344 (2) -
Closing Cash 7 2,345 1,811 5 26
KATHMANDU ANNUAL REPORT 2013 35
notes to the financial statements1 GENERAL INFORMATION
Kathmandu Holdings Limited (the Company) and its subsidiaries (together the Group) is a designer, marketer and retailer of clothing and equipment for travel and adventure. It operates in New Zealand, Australia and the United Kingdom.
The Company is a limited liability company incorporated and domiciled in New Zealand. The address of its registered office is 11 Mary Muller Drive, Heathcote, Christchurch.
The Company is listed on the NZX and ASX.
These audited consolidated financial statements have been approved for issue by the Board of Directors on 24 September 2013.
2 SUMMARY OF SIGNIFICANT ACCOUNTING POLICIES
These financial statements have been prepared in accordance with Generally Accepted Accounting Practice in New Zealand. They comply with the New Zealand Equivalents to International Financial Reporting Standards (NZ IFRS) and other applicable Financial Reporting Standards, as appropriate for profit-oriented entities. The financial statements also comply with International Financial Reporting Standards (IFRS).
The reporting currency used in the preparation of these consolidated financial statements is New Zealand dollars, rounded where necessary to the nearest thousand dollars.
(A) BASIS OF PREPARATION
The principal accounting policies adopted in the preparation of the financial statements are set out below. These policies have been consistently applied to all periods presented, unless otherwise stated.
Entities reporting
The financial statements for the “Parent” are for Kathmandu Holdings Limited as a separate legal entity.
The consolidated financial statements for the “Group” are for the economic entity comprising Kathmandu Holdings Limited and its subsidiaries. The Company and Group are designated as profit oriented entities for financial reporting purposes.
Statutory base
Kathmandu Holdings Limited is a company registered under the Companies Act 1993.
The financial statements have been prepared in accordance with the requirements of the Financial Reporting Act 1993 and the Companies Act 1993.
Historical cost convention
These financial statements have been prepared under the
historical cost convention, as modified by the revaluation of certain assets as identified in specific accounting policies below.
Critical accounting estimates
The Group makes estimates and assumptions concerning the future. The resulting accounting estimates will, by definition, seldom equal the related actual results. The estimates and assumptions that have a significant risk of causing a material adjustment to the carrying amounts of assets and liabilities within the next financial year are discussed below.
(i) Estimated impairment of goodwill and brands
The group tests annually whether goodwill and brands have suffered any impairment in accordance with the accounting policy stated in note 2 (q) (i) & (ii). The recoverable amounts of cash-generating units have been determined based on the fair value less cost to sell calculation. These calculations require the use of estimates (note 13).
(ii) Stock obsolescence
The Group assesses the likely residual value of inventory. A stock provision is recognised for stock which is selling for less than cost. Any increase in these provisions is taken as a reduction to inventory on the balance sheet and expensed into gross profit on the income statement.
(B) PRINCIPLES OF CONSOLIDATION
(i) Subsidiaries
Subsidiaries are all entities (including special purpose entities) over which the Group has the power to govern the financial and operating policies generally accompanying a shareholding of more than one half of the voting rights. The existence and effect of potential voting rights that are currently exercisable or convertible are considered when assessing whether the Group controls another entity. Subsidiaries are fully consolidated from the date on which control is transferred to the Group. They are de-consolidated from the date that control ceases.
The acquisition method of accounting is used to account for business combinations by the Group. The consideration transferred for the acquisition of a subsidiary is the fair values of the assets transferred, the liabilities incurred and the equity interests issued by the Group. The consideration transferred includes the fair value of any asset or liability resulting from a contingent consideration arrangement. Acquisition-related costs are expensed as incurred. Identifiable assets acquired and liabilities and contingent liabilities assumed in a business combination are measured initially at their fair values at the acquisition date. On an acquisition-by-acquisition basis, the Group recognises any non-controlling interest in the acquiree either at fair value or at the non-controlling interest’s proportionate share of the acquiree’s net assets.
36 ANNUAL REPORT 2013 KATHMANDU
The excess of the consideration transferred over the amount of any non-controlling interest in the acquiree and the acquisition date fair value of any previous equity interest in the acquiree over the fair value of the Group’s share of the identifiable net assets acquired is recorded as goodwill. If this is less than the fair value of the net assets of the subsidiary acquired in the case of a bargain purchase, the difference is recognised directly in the income statement.
Inter-company transactions, balances and unrealised gains on transactions between Group companies are eliminated. Unrealised losses are also eliminated. Accounting policies of subsidiaries have been changed where necessary to ensure consistency with the policies adopted by the Group.
(ii) Transactions and non-controlling interests
The Group treats transactions with non-controlling interests as transactions with equity owners of the Group. For purchases from non-controlling interests, the difference between any consideration paid and the relevant share acquired of the carrying value of net assets of the subsidiary is recorded in equity. Gains or losses on disposals to non-controlling interests are also recorded in equity.
(C) SEGMENT REPORTING
An operating segment is a component of an entity that engages in business activities which earns revenue and incurs expenses and where the chief decision maker reviews the operating results on a regular basis and makes decisions on resource allocation. The Group is organised into three operating segments, depicting the three geographical regions the Group operates in.
(D) FOREIGN CURRENCY TRANSLATION
(i) Functional and presentation currency
Items included in the financial statements of each of the subsidiaries’ operations are measured using the currency of the primary economic environment in which it operates (‘functional currency’). The financial statements are presented in New Zealand dollars, which is the Company’s functional currency and Group’s presentation currency.
Foreign currency transactions are translated into the functional currency using the exchange rates prevailing at the dates of the transaction. Foreign exchange gains and losses resulting from the settlement of such transactions and from the translation at year end exchange rates of monetary assets and liabilities denominated in foreign currencies are recognised in the income statement, except when deferred in equity as qualifying cash flow hedges. Translation differences on monetary financial assets and liabilities are reported as part of the fair value gain or loss.
(ii) Group companies
The results and financial position of all the Group entities (none of which has the currency of a hyper-inflationary economy) that have a functional currency different from the presentation currency are translated into the presentation currency as follows:
Assets and liabilities for each balance sheet presented are translated at the closing rate at the date of that balance sheet;
Income and expenses for each income statement are translated at average exchange rates (unless this average is not a reasonable approximation of the cumulative effect of the rates prevailing on the transaction dates, in which case income and expenses are translated at the rate on the dates of the transactions); and
All resulting exchange differences are recognised as a separate component of equity.
On consolidation, exchange differences arising from the translation of the net investment in foreign operations, and of borrowings and other currency instruments designated as hedges of such investments, are taken to shareholders’ equity. When a foreign operation is partially disposed of or sold, exchange differences that were recorded in equity are recognised in the income statement as part of the gain or loss on sale.
Goodwill and fair value adjustments arising on the acquisition of a foreign entity are treated as assets and liabilities of the foreign entity and translated at the closing rate.
(E) REVENUE RECOGNITION
Revenue comprises the fair value of the consideration received or receivable for the sale of goods and services, excluding Goods and Services Tax, rebates and discounts and after eliminating sales within the Group. Revenue is recognised as follows:
(i) Sales of goods
Sales of goods are recognised when a Group entity has delivered a product to the customer. Retail sales are usually in cash or by credit card. The recorded revenue is the gross amount of sale (excluding GST), including credit card fees payable for the transaction. Such fees are included in selling expenses.
(ii) Sales of services
Management fees are recognised in the accounting period in which the services are rendered.
(iii) Interest income
Interest income is recognised on a time-portion basis using the effective interest method.
(iv) Dividend income
Dividend income is recognised when the right to receive payment is established.
(F) CURRENT AND DEFERRED INCOME TAX
The tax expense for the year comprises current and deferred tax. Tax is recognised in the income statement, except to the extent that it relates to items recognised directly in equity. In this case, the tax is also recognised in equity.
KATHMANDU ANNUAL REPORT 2013 37
The current income tax charge is calculated on the basis of the tax laws enacted or substantively enacted at the balance sheet date in the countries where the Company’s subsidiaries operate and generate taxable income. Management periodically evaluates positions taken in tax returns with respect to situations in which applicable tax regulations are subject to interpretation and establishes provisions where appropriate on the basis of amounts expected to be paid to the tax authorities.
Deferred income tax is provided in full, using the liability method, on temporary differences arising between tax bases of assets and liabilities and their carrying amounts in the consolidated financial statements. However, the deferred income tax is not accounted for if it arises from initial recognition of an asset or liability in a transaction other than a business combination that at the time of the transaction affects neither accounting nor taxable profit or loss. Deferred income tax is determined using tax rates (and laws) that have been enacted or substantially enacted by the balance sheet date and are expected to apply when the related deferred income tax asset is realised or the deferred income tax liability is settled.
Deferred income tax assets are recognised to the extent that it is probable that future taxable profit will be available against which the temporary differences can be utilised.
Deferred income tax is provided on temporary differences arising on investments in subsidiaries and associates, except where the timing of the reversal of the temporary difference is controlled by the Group and it is probable that the temporary difference will not reverse in the foreseeable future.
(G) GOODS AND SERVICES TAX (GST)
The income statement and the cash flow statement have been prepared so that all components are stated exclusive of GST. All items in the balance sheet are stated net of GST, with the exception of receivables and payables, which include GST invoiced.
(H) LEASES
The Group is the lessee
Leases in which a significant portion of the risks and rewards of ownership are retained by the lessor are classified as operating leases. Payments made under operating leases (net of any incentives received from the lessor) are charged to the income statement on a straight-line basis over the period of the lease.
(I) IMPAIRMENT OF NON-FINANCIAL ASSETS
Assets are reviewed for impairment whenever events or changes in circumstances indicate that the carrying amount may not be recoverable. Intangible assets that have an indefinite useful life, including goodwill, are not subject to amortisation and are tested annually for impairment irrespective of whether any circumstances identifying a possible impairment have been identified. An impairment loss is recognised for the amount by which the asset’s carrying amount exceeds its recoverable
amount. The recoverable amount is the higher of an asset’s fair value less costs to sell and value in use.
For the purposes of assessing impairment, assets are grouped at the lowest levels for which there are separately identifiable cash flows (cash generating units).
(J) CASH AND CASH EQUIVALENTS
Cash and cash equivalents includes cash on hand, deposits held at call with financial institutions, other short-term highly liquid investments with original maturities of three months or less that are readily convertible to known amounts of cash and which are subject to an insignificant risk of changes in value, and bank overdrafts. Bank overdrafts are shown within borrowings in current liabilities on the balance sheet.
(K) TRADE RECEIVABLES
Trade receivables are recognised initially at fair value and subsequently measured at amortised cost, less provision for doubtful debts.
The collectability of trade receivables is reviewed on an on-going basis. Debts, which are known to be uncollectible, are written off. A provision for doubtful receivables is established when there is objective evidence that the Group will not be able to collect all amounts due according to the original terms of receivables. Significant financial difficulties of the debtor, probability that the debtor will enter bankruptcy or financial reorganisation, and default or delinquency in payments are considered indicators that the trade receivable is impaired. The amount of the provision is the difference between the asset’s carrying amount and the present value of estimated future cash flows, discounted at the effective interest rate. The amount of the provision is recognised in the income statement.
(L) INVENTORIES
Inventories are stated at the lower of cost and net realisable value. Cost is determined on a weighted average cost method and includes expenditure incurred in acquiring the inventories and bringing them to their existing location and condition. Net realisable value is the estimated selling price in the ordinary course of business, less applicable variable selling expenses.
(M) INVESTMENTS AND OTHER FINANCIAL ASSETS
The Group classifies its investments in the following categories: loans and receivables, and financial assets at fair value through profit or loss. The classification depends on the purpose for which the investments were acquired. Regular purchases and sales of financial assets are recognised on the trade date - the date on which the Group commits to purchase or sell the asset. Management determines the classification of its investments at the initial recognition and re-evaluates this designation at every reporting date.
38 ANNUAL REPORT 2013 KATHMANDU
(i) Loans and receivables
Loans and receivables are non-derivative financial assets with fixed or determinable payments that are not quoted in an active market. They arise when the Group provides money, goods or services directly to a debtor with no intention of selling the receivable. They are included in current assets, except for those with maturities greater than 12 months after the balance sheet date which are classified as non-current assets.
(ii) Financial assets at fair value through profit or loss
Financial assets at fair value through profit or loss are financial assets held for trading. A financial asset is classified in this category if acquired principally for the purpose of selling in the short-term. Derivatives are also categorised as held for trading unless they are designated as hedges. Assets in this category are classified as current assets.
Financial assets carried at fair value through profit or loss are initially recognised at fair value, and transaction costs are expensed in the income statement. Financial assets are derecognised when the rights to receive cash flows from the investments have expired or have been transferred and the Group has transferred substantially all risks and rewards of ownership. Loans and receivables are carried at amortised cost using the effective interest method.
Gains or losses arising from changes in the fair value of ‘financial assets at fair value through profit or loss’ are presented in the income statement, except for foreign exchange movements on monetary assets, which are recognised in the income statement within ‘finance costs – net’. Dividend income from financial assets at fair value through profit or loss is recognised in the income statement as part of other income when the Group’s right to receive payments is established.
The Group assesses at each balance sheet date whether there is objective evidence that a financial asset or a group of financial assets is impaired.
(N) DERIVATIVES
Derivatives are initially recognised at fair value on the date a derivative contract is entered into and are subsequently re-measured to their fair value. The method of recognising the resulting gain or loss depends on whether the derivative is designated as a hedging instrument, and if so, the nature of the item being hedged. The Group designates certain derivatives as either; (1) hedges of the fair value of recognised assets or liabilities or a firm commitment (fair value hedge); or (2) hedges of highly probable forecast transactions (cash flow hedges).
The Group documents, at the inception of the transaction, the relationship between hedging instruments and hedged items, as well as its risk management objective and strategy for undertaking various hedge transactions. The Group also documents its assessment, both at hedge inception and on an on-going basis, of whether the derivatives that are used in hedging transactions have been and will continue to be highly
effective in offsetting changes in fair values or cash flows of hedged items.
(i) Fair value hedge
Changes in the fair value of derivatives that are designated and qualify as fair value hedges are recorded in the income statement, together with any changes in the fair value of the hedged asset or liability that are attributable to the hedged risk.
If the hedge no longer meets the criteria for hedge accounting, the adjustment to the carrying amount of a hedged item for which the effective interest method is used is amortised to profit and loss over the period of maturity.
(ii) Cash flow hedge
The effective portion of changes in the fair value of derivatives that are designated and qualify as cash flow hedges is recognised in equity in the hedging reserve. The gain or loss relating to the ineffective portion is recognised immediately in the income statement. Amounts accumulated in equity are recycled in the income statement in the periods when the hedged item will affect profit or loss (for instance when the forecast sale that is hedged takes place). However, when the forecast transaction that is hedged results in the recognition of a non-financial asset (for example, inventory) or a non-financial liability, the gains and losses previously deferred in equity are transferred from equity and included in the measurement of the initial cost or carrying amount of the asset or liability.
When a hedging instrument expires or is sold or terminated, or when a hedge no longer meets the criteria for hedge accounting, any cumulative gain or loss existing in equity at that time remains in equity and is recognised when the forecast transaction is ultimately recognised in the income statement. When a forecast transaction is no longer expected to occur, the cumulative gain or loss that was reported in equity is immediately transferred to the income statement.
(iii) Derivatives that do not qualify for hedge accounting
Certain derivative instruments do not qualify for hedge accounting or hedge accounting has not been adopted. Changes in the fair value of these derivative instruments are recognised immediately in the income statement within ‘finance costs – net’.
(O) FAIR VALUE ESTIMATION
The fair value of financial assets and financial liabilities must be estimated for recognition and measurement or for disclosure purposes.
The fair value of financial instruments that are not traded in an active market (for example, over-the-counter derivatives) is determined using valuation techniques. The fair value of forward exchange contracts is determined using forward exchange market rates at the balance sheet date.
Quoted market prices or dealer quotes for similar instruments are used for long-term debt. Other techniques, such as estimated

KATHMANDU ANNUAL REPORT 2013 39
discounted cash flows, are used to determine fair value for the remaining financial instruments. The fair value of interest rate swaps is calculated as the present value of the estimated future cash flows. The fair value of forward foreign exchange contracts is determined using quoted forward exchange rates at the balance sheet date.
The carrying value less impairment provision of trade receivables and payables are assumed to approximate their fair values.
(P) PROPERTY, PLANT AND EQUIPMENT
All property, plant and equipment are stated at historical cost less depreciation and impairment. Historical cost includes expenditure that is directly attributable to the acquisition of the items. Cost may also include transfers from equity of any gains/losses on qualifying cash flow hedges of foreign currency purchases of property, plant and equipment.
Subsequent costs are included in the asset’s carrying amount or recognised as a separate asset, as appropriate, only when it is probable that future economic benefits associated with the item will flow to the Group and the cost of the item can be measured reliably. All other repairs and maintenance are charged to the income statement during the financial period in which they are incurred.
Depreciation of property, plant and equipment is calculated using diminishing value method so as to expense the cost of the assets over their useful lives. The rates are as follows:
Leasehold Improvements 8 – 50 %Office, Plant and Equipment 8 – 80 %Furniture and Fittings 6 – 60 %Computer Equipment 6 – 67%Motor Vehicles 15 – 30%
The assets’ residual value and useful lives are reviewed and adjusted if appropriate at each balance sheet date.
Capital work in progress is not depreciated until available for use.
An asset’s carrying amount is written down immediately to its recoverable amount if the asset’s carrying amount is greater than its estimated recoverable amount.
Gains and losses on disposals are determined by comparing proceeds with carrying amount. These are included in the income statement.
(Q) INTANGIBLE ASSETS
(i) Goodwill
Goodwill arises on the acquisition of subsidiaries. Goodwill represents the excess of the cost of the acquisition over the Group’s interest in the net fair value of the assets and liabilities of the acquiree. Separately recognised goodwill is tested annually for impairment and carried at cost less accumulated impairment losses. Impairment losses on goodwill are not reversed.
Goodwill is allocated to cash-generating units for the purpose of impairment testing. The allocation is made to those cash-generating units or groups of cash-generating units that are
expected to benefit from the business combination in which the goodwill arose.
(ii) Brand
Acquired brands are carried at original cost based on independent valuation obtained at the date of acquisition. The brand represents the price paid to acquire the rights to use the Kathmandu brand. The brand is not amortised. Instead the brand is tested for impairment annually or more frequently if events or changes in circumstances indicate that it might be impaired, and is carried at cost less accumulated impairment losses.
(iii) Software costs
Software costs have a finite useful life. Software costs are capitalised and written off over the useful economic life using diminishing value method and rates of 10-60%.
Costs associated with developing or maintaining computer software programs are recognised as an expense as incurred. Costs that are directly associated with the production of identifiable and unique software products controlled by the Group, and that will probably generate economic benefits exceeding costs beyond one year, are recognised as intangible assets. Direct costs include the costs of software development employees.
(R) TRADE AND OTHER PAYABLES
These amounts represent liabilities for goods and services provided to the Group prior to the end of financial year which are unpaid. The amounts are unsecured and are usually paid by the 30th of the month following recognition. Trade payables are recognised initially at fair value and subsequently measured at amortised cost using the effective interest method.
(S) PROVISIONS
A provision is recognised if, as a result of a past event, the Group has a present legal or constructive obligation that can be estimated reliably, and it is probable that an outflow of economic benefits will be required to settle the obligation. Provisions are determined by discounting the expected future cash flows at a pre-tax rate that reflects current market assessments of the time value of money and the risks specific to the liability.
(T) BORROWINGS
Borrowings are initially recognised at fair value, net of transaction costs incurred. Borrowings are subsequently measured at amortised cost. Any difference between the proceeds (net of transaction costs) and the redemption amount is recognised in the income statement over the period of the borrowings using the effective interest method.
Borrowings are classified as current liabilities unless the Group
has an unconditional right to defer settlement of the liability for
at least 12 months after the balance sheet date.
40 ANNUAL REPORT 2013 KATHMANDU
(U) SHARE CAPITAL
Ordinary shares are classified as equity.
Incremental costs directly attributable to the issue of new shares are shown in equity as a deduction, net of tax, from the proceeds.
Where any Group company purchases the Company’s equity share capital (treasury shares), the consideration paid, including any directly attributable incremental costs (net of income taxes) is deducted from equity attributable to the Company’s equity holders until the shares are cancelled or reissued. Where such shares are subsequently reissued, any consideration received net of any directly attributable incremental transaction costs and the related income tax effects, is included in equity attributable to the Company’s equity holders.
(V) EMPLOYEE BENEFITS
(i) Wages and salaries, annual leave and sick leave
Liabilities for wages and salaries, including non-monetary benefits, annual leave, and accumulating sick leave expected to be settled within 12 months of the reporting date are recognised in other payables in respect of employees’ services up to the reporting date and are measured at the amounts expected to be paid when the liabilities are settled. Liabilities for non-accumulating sick leave are recognised when the leave is taken and measured at the rates paid or payable. The liability for employee entitlements is carried at the present value of the estimated future cash flows.
(ii) Long service leave
The liability for long service leave is recognised in the provision for employee benefits and measured as the present value of expected future payments to be made in respect of services provided by employees up to the reporting date using the projected unit credit method. Consideration is given to expected future wage and salary levels, experience of employee departures and periods of service. Expected future payments are discounted using market yields at the reporting date on national government bonds with terms to maturity and currency that match, as closely as possible, the estimated future cash flows.
(iii) Equity settled share option plan
The Employee Share Option Plan allows Group employees to acquire shares of the Company. The fair value of options granted is recognised as an employee expense in the Income Statement with a corresponding increase in the employee share based payments reserve. The fair value is measured at grant date and spread over the vesting periods. The fair value of the options granted is measured using the Monte Carlo simulation approach, taking into account the terms and conditions upon which the options are granted. When options are exercised the amount in the share option reserve relating to those options, together with the exercise price paid by the employee, is transferred to share capital. When any vested options lapse, upon employee
termination or unexercised options reaching maturity, the amount in the share based payments reserve relating to those options is transferred to retained earnings.
(iv) Equity settled long term incentive plan
The Executive and Senior Management Long Term Incentive plan grants Group employees performance rights subject to performance hurdles being met. The fair value of rights granted is recognised as an employee expense in the Income Statement with a corresponding increase in the employee share based payments reserve. The fair value is measured at grant date and amortised over the vesting periods. The fair value of the rights granted is measured using the Kathmandu Holdings Limited share price as at the grant date less the present value of the dividends forecast to be paid prior to the each vesting date. When performance rights vest, the amount in the share based payments reserve relating to those rights are transferred to share capital. When any vested performance rights lapse upon employee termination, the amount in the share based payments reserve relating to those rights is transferred to retained earnings.
(W) DIVIDENDS
Dividend distribution to the Company shareholders is recognised as a liability in the Company’s and Group’s financial statements in the period in which the dividends are approved by the Company’s shareholders.
(X) CASH FLOW STATEMENT
The following are definitions of the terms used in the Cash Flow Statement:
a. Cash comprises: cash at bank, cash on hand and overdraft balances;
b. Investing activities are those activities relating to the acquisition, holding and disposal of property, plant and equipment and of investments. Investments can include securities not falling within the definition of cash;
c. Financing activities are those activities which result in changes in the size and composition of the capital structure of the Company;
d. Operating activities include all transactions and other events that are not investing or financing activities.
(Y) CHANGES IN ACCOUNTING POLICIES
There were no changes in the accounting policies during the period.
KATHMANDU ANNUAL REPORT 2013 41
3 STANDARDS, INTERPRETATIONS AND AMENDMENTS TO PUBLISHED STANDARDS
The following new standards and amendments to standards were applied during the period;
NZ IAS 1 Amendments Presentation of Items of Other Comprehensive Income (effective 1 July 2012):
The amendment requires entities to separate items presented in other comprehensive income into two groups, based on whether they may be recycled to profit or loss in the future. This will not affect the measurement of any of the items recognised in the balance sheet or the profit or loss in the current period.
Standards, interpretations and amendments to published standards that are not yet effective:
NZ IFRS 9: Financial Instruments (effective for annual reporting periods beginning on or after 1 January 2015)
This standard replaces the parts of NZ IAS 39 Financial Instruments: Recognition and Measurement that relates to the classification and measurement of financial instruments.
All financial assets are required to be classified into two measurement categories: at fair value and at amortised cost. The determination is based on the entity’s business model for managing the financial assets and the contractual cash flow characteristics of the financial asset.
For financial liabilities, the standard retains most of the NZ IAS 39 requirements. An additional presentational requirement has been added for liabilities designated at fair value through profit and loss. Where the fair value option is taken, the part of a fair value change due to an entity’s own credit risk is recorded in other comprehensive income.
NZ IFRS 10 Consolidated Financial Statements (effective 1 January 2013), revised NZ IAS 27 Separate Financial Statements
NZ IFRS 10 replaces all of the guidance on control and consolidation in NZ IAS 27 Consolidated and Separate Financial Statements, and NZ IFRIC 12 Consolidation – Special Purpose Entities. The core principle that a consolidated entity presents a parent and its subsidiaries as if they are a single economic entity remains unchanged, as do the mechanics of consolidation. However, the standard introduces a single definition of control that applies to all entities. It focuses on the need to have both power and rights or exposure to variable returns before control is present. Power is the current ability to direct the activities that significantly influence returns. Returns must vary and can be positive, negative or both. There is also new guidance on participating and protective rights and on agent/principal relationships. While the Group does not expect the new standard to have a significant impact on its composition, it has yet to perform a detailed analysis of the new guidance in the context of its various investees that may or may not be controlled under the new rules.
NZ IAS 27 is renamed Separate Financial Statements and is now a standard dealing solely with separate financial statements. Application of this standard by the group and parent entity will not affect any of the amounts recognised in the financial statements, but may impact the type of information disclosed in relation to the parent’s investments in the separate parent entity financial statements.
NZ IFRS 13 Fair Value Measurement (effective 1 January 2013)
NZ IFRS 13 explains how to measure fair value and aims to enhance fair value disclosures. The Group has yet to determine which, if any, of its current measurement techniques will have to change as a result of the new guidance. It is therefore not possible to state the impact, if any, of the new rules on any of the amounts recognised in the financial statements. However, application of the new standard will impact the type of information disclosed in the notes to the financial statements.
The Group does not intend to adopt the new standards before their operative date, which means that all of the above new standards would be first applied in the annual reporting period ending 31 July 2014, with the exception of NZ IFRS 9 that will be applied in the annual period ending 31 July 2016.
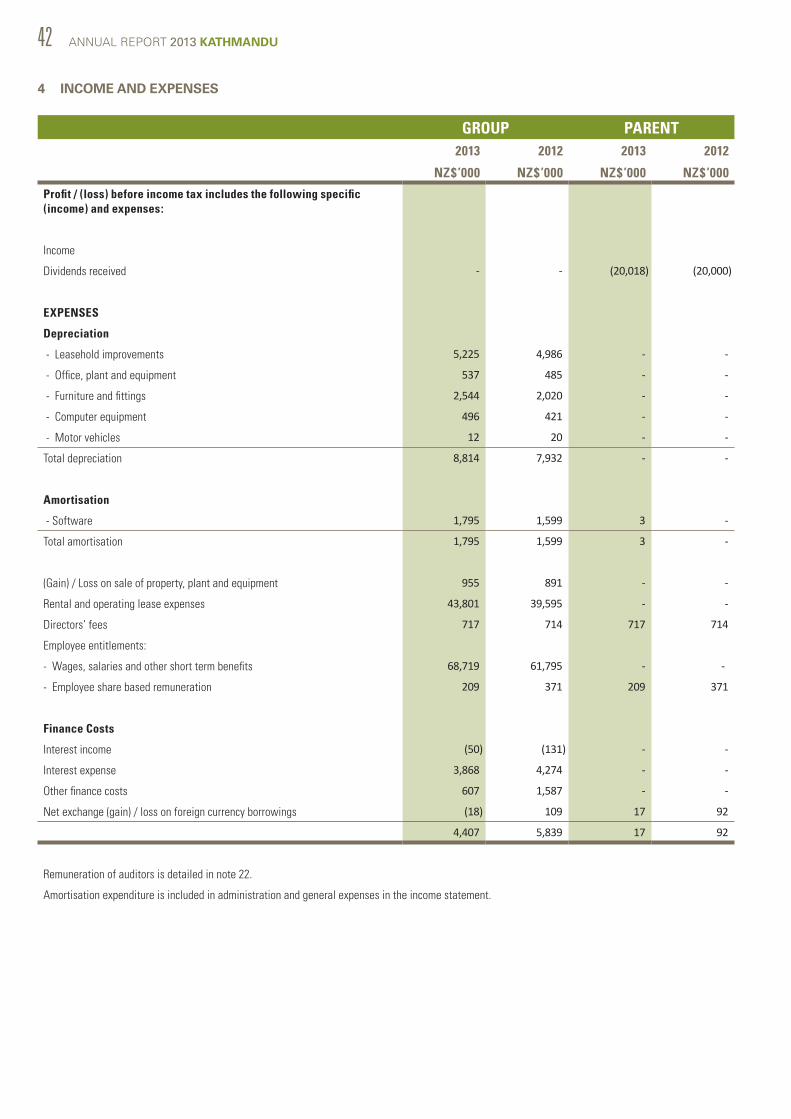
42 ANNUAL REPORT 2013 KATHMANDU
4 INCOME AND EXPENSES
GROUP PARENT2013 2012 2013 2012
NZ$’000 NZ$’000 NZ$’000 NZ$’000
Profit / (loss) before income tax includes the following specific (income) and expenses:
Income
Dividends received - - (20,018) (20,000)
EXPENSES
Depreciation
- Leasehold improvements 5,225 4,986 - -
- Office, plant and equipment 537 485 - -
- Furniture and fittings 2,544 2,020 - -
- Computer equipment 496 421 - -
- Motor vehicles 12 20 - -
Total depreciation 8,814 7,932 - -
Amortisation
- Software 1,795 1,599 3 -
Total amortisation 1,795 1,599 3 -
(Gain) / Loss on sale of property, plant and equipment 955 891 - -
Rental and operating lease expenses 43,801 39,595 - -
Directors’ fees 717 714 717 714
Employee entitlements:
- Wages, salaries and other short term benefits 68,719 61,795 - -
- Employee share based remuneration 209 371 209 371
Finance Costs
Interest income (50) (131) - -
Interest expense 3,868 4,274 - -
Other finance costs 607 1,587 - -
Net exchange (gain) / loss on foreign currency borrowings (18) 109 17 92
4,407 5,839 17 92
Remuneration of auditors is detailed in note 22.
Amortisation expenditure is included in administration and general expenses in the income statement.
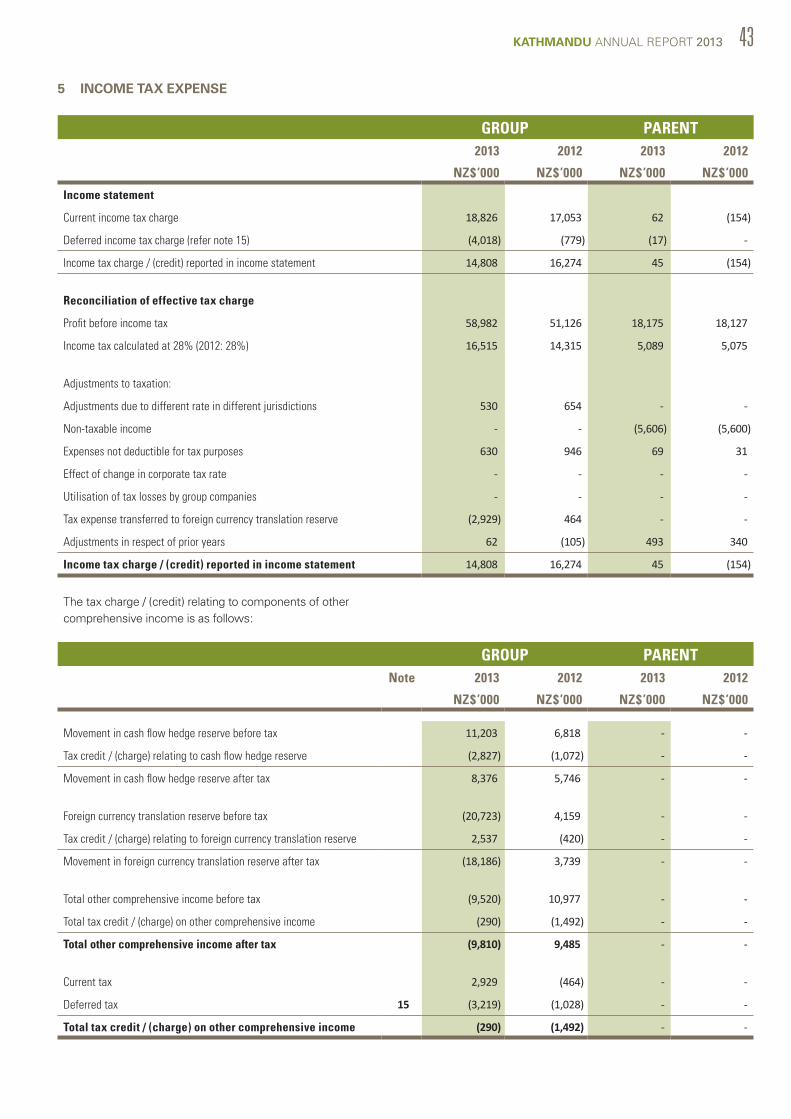
KATHMANDU ANNUAL REPORT 2013 43
5 INCOME TAX EXPENSE
GROUP PARENT2013 2012 2013 2012
NZ$’000 NZ$’000 NZ$’000 NZ$’000
Income statement
Current income tax charge 18,826 17,053 62 (154)
Deferred income tax charge (refer note 15) (4,018) (779) (17) -
Income tax charge / (credit) reported in income statement 14,808 16,274 45 (154)
Reconciliation of effective tax charge
Profit before income tax 58,982 51,126 18,175 18,127
Income tax calculated at 28% (2012: 28%) 16,515 14,315 5,089 5,075
Adjustments to taxation:
Adjustments due to different rate in different jurisdictions 530 654 - -
Non-taxable income - - (5,606) (5,600)
Expenses not deductible for tax purposes 630 946 69 31
Effect of change in corporate tax rate - - - -
Utilisation of tax losses by group companies - - - -
Tax expense transferred to foreign currency translation reserve (2,929) 464 - -
Adjustments in respect of prior years 62 (105) 493 340
Income tax charge / (credit) reported in income statement 14,808 16,274 45 (154)
The tax charge / (credit) relating to components of other comprehensive income is as follows:
GROUP PARENTNote 2013 2012 2013 2012
NZ$’000 NZ$’000 NZ$’000 NZ$’000
Movement in cash flow hedge reserve before tax 11,203) 6,818) -) -)
Tax credit / (charge) relating to cash flow hedge reserve (2,827) (1,072) -) -)
Movement in cash flow hedge reserve after tax 8,376) 5,746 - -)
Foreign currency translation reserve before tax (20,723) 4,159) -) -)
Tax credit / (charge) relating to foreign currency translation reserve 2,537) (420) -) -)
Movement in foreign currency translation reserve after tax (18,186) 3,739) - -)
Total other comprehensive income before tax (9,520) 10,977) -) -)
Total tax credit / (charge) on other comprehensive income (290) (1,492) -) -)
Total other comprehensive income after tax (9,810) 9,485) - -)
Current tax 2,929) (464) -) -)
Deferred tax 15 (3,219) (1,028) -) -)
Total tax credit / (charge) on other comprehensive income (290) (1,492) - -)
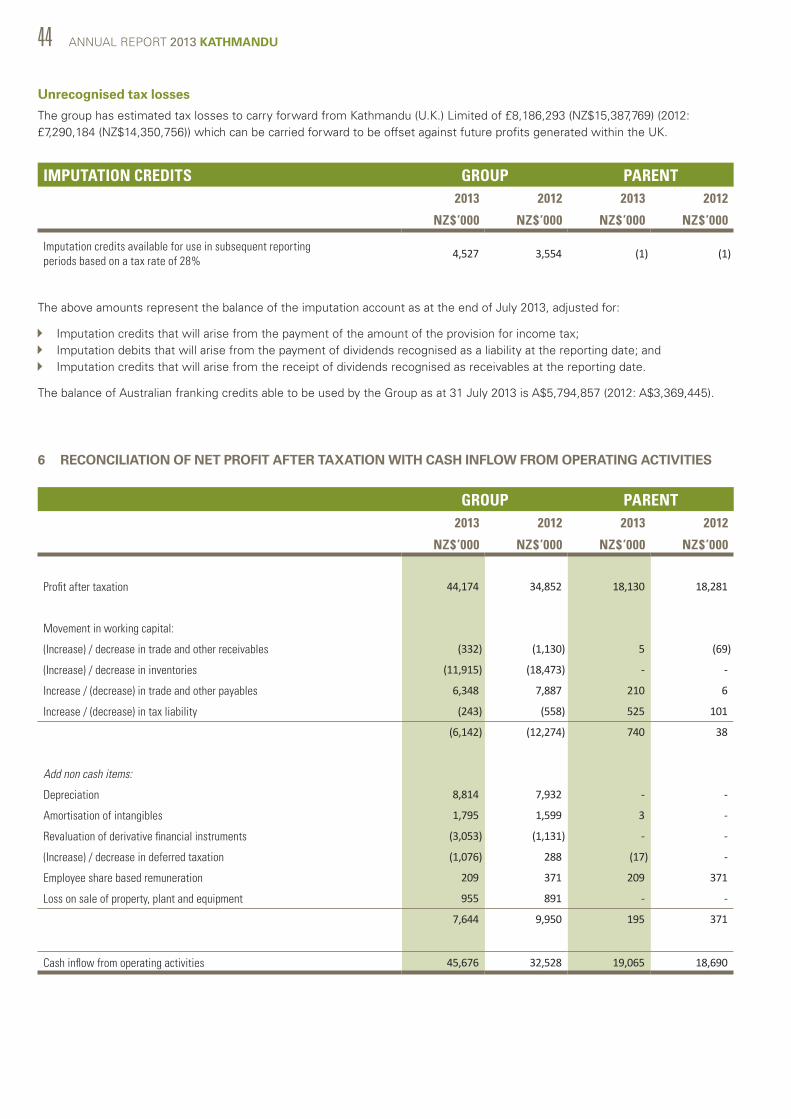
44 ANNUAL REPORT 2013 KATHMANDU
6 RECONCILIATION OF NET PROFIT AFTER TAXATION WITH CASH INFLOW FROM OPERATING ACTIVITIES
GROUP PARENT2013 2012 2013 2012
NZ$’000 NZ$’000 NZ$’000 NZ$’000
Profit after taxation 44,174 34,852 18,130 18,281
Movement in working capital:
(Increase) / decrease in trade and other receivables (332) (1,130) 5 (69)
(Increase) / decrease in inventories (11,915) (18,473) - -
Increase / (decrease) in trade and other payables 6,348 7,887 210 6
Increase / (decrease) in tax liability (243) (558) 525 101
(6,142) (12,274) 740 38
Add non cash items:
Depreciation 8,814 7,932 - -
Amortisation of intangibles 1,795 1,599 3 -
Revaluation of derivative financial instruments (3,053) (1,131) - -
(Increase) / decrease in deferred taxation (1,076) 288 (17) -
Employee share based remuneration 209 371 209 371
Loss on sale of property, plant and equipment 955 891 - -
7,644 9,950 195 371
Cash inflow from operating activities 45,676 32,528 19,065 18,690
Unrecognised tax losses
The group has estimated tax losses to carry forward from Kathmandu (U.K.) Limited of £8,186,293 (NZ$15,387,769) (2012: £7,290,184 (NZ$14,350,756)) which can be carried forward to be offset against future profits generated within the UK.
IMPUTATION CREDITS GROUP PARENT2013 2012 2013 2012
NZ$’000 NZ$’000 NZ$’000 NZ$’000
Imputation credits available for use in subsequent reporting periods based on a tax rate of 28%
4,527 3,554 (1) (1)
The above amounts represent the balance of the imputation account as at the end of July 2013, adjusted for:
Imputation credits that will arise from the payment of the amount of the provision for income tax; Imputation debits that will arise from the payment of dividends recognised as a liability at the reporting date; and Imputation credits that will arise from the receipt of dividends recognised as receivables at the reporting date.
The balance of Australian franking credits able to be used by the Group as at 31 July 2013 is A$5,794,857 (2012: A$3,369,445).
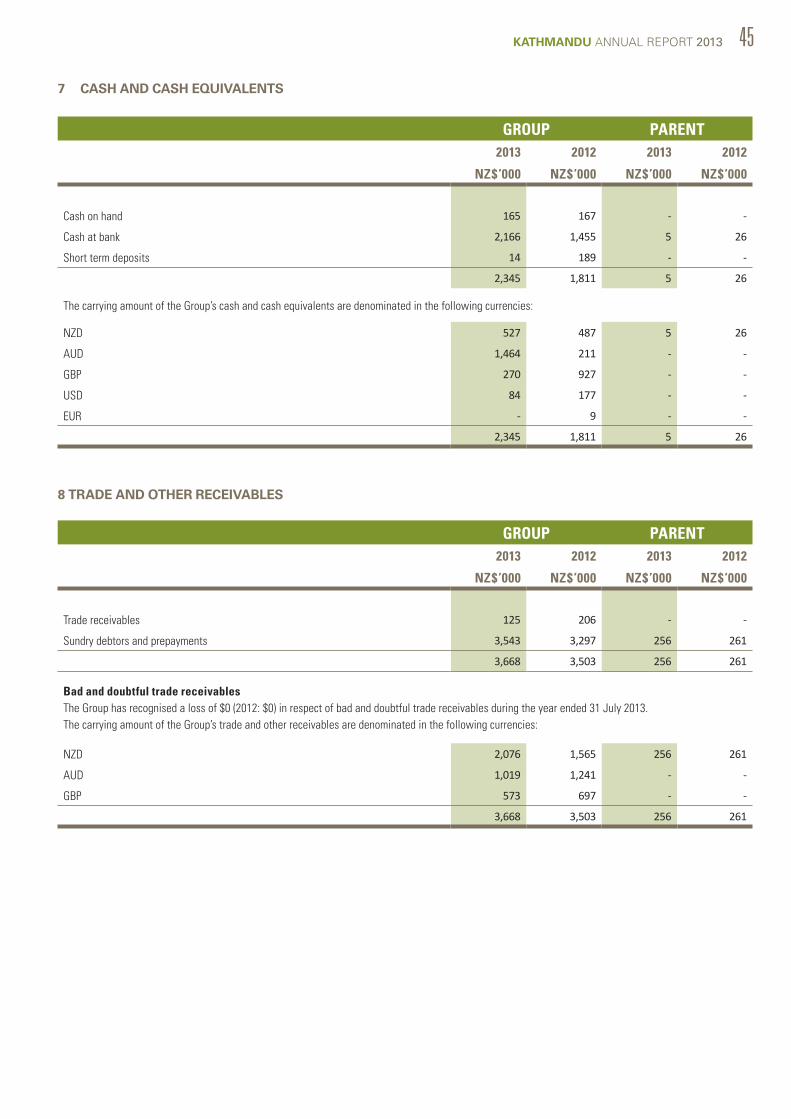
KATHMANDU ANNUAL REPORT 2013 45
7 CASH AND CASH EQUIVALENTS
GROUP PARENT2013 2012 2013 2012
NZ$’000 NZ$’000 NZ$’000 NZ$’000
Cash on hand 165 167 - -
Cash at bank 2,166 1,455 5 26
Short term deposits 14 189 - -
2,345 1,811 5 26
The carrying amount of the Group’s cash and cash equivalents are denominated in the following currencies:
NZD 527 487 5 26
AUD 1,464 211 - -
GBP 270 927 - -
USD 84 177 - -
EUR - 9 - -
2,345 1,811 5 26
8 TRADE AND OTHER RECEIVABLES
GROUP PARENT2013 2012 2013 2012
NZ$’000 NZ$’000 NZ$’000 NZ$’000
Trade receivables 125 206 - -
Sundry debtors and prepayments 3,543 3,297 256 261
3,668 3,503 256 261
Bad and doubtful trade receivablesThe Group has recognised a loss of $0 (2012: $0) in respect of bad and doubtful trade receivables during the year ended 31 July 2013. The carrying amount of the Group’s trade and other receivables are denominated in the following currencies:
NZD 2,076 1,565 256 261
AUD 1,019 1,241 - -
GBP 573 697 - -
3,668 3,503 256 261
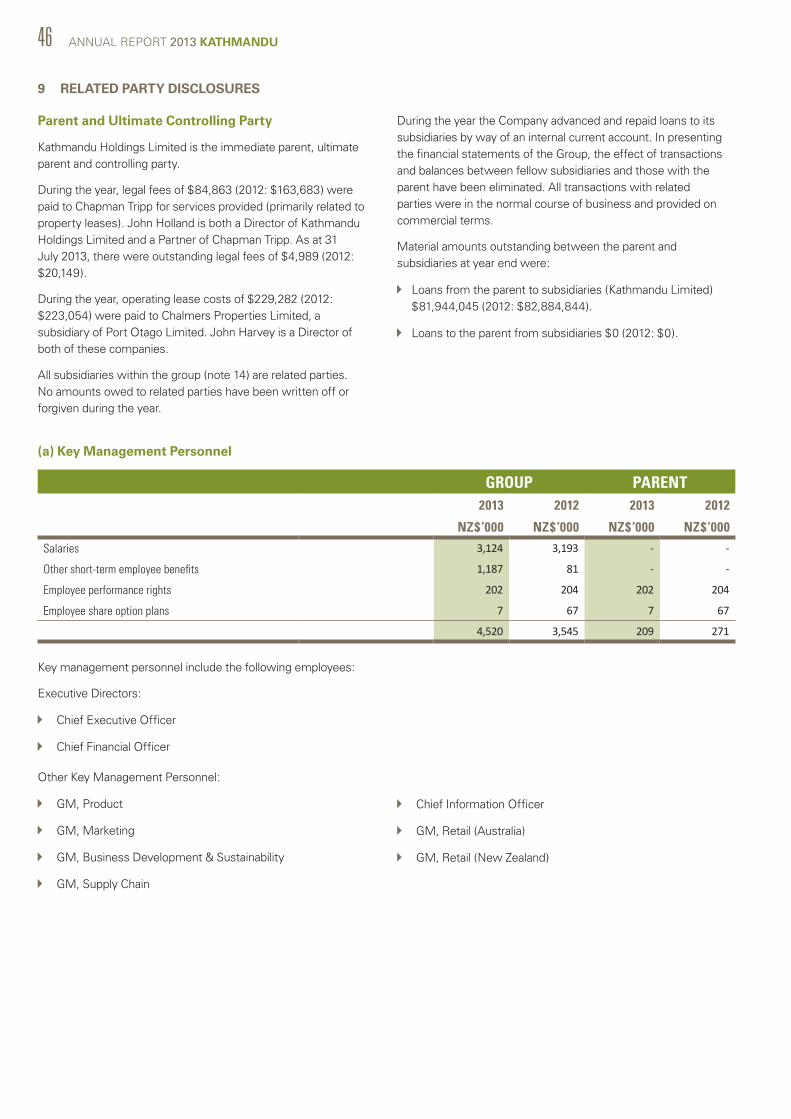
46 ANNUAL REPORT 2013 KATHMANDU
9 RELATED PARTY DISCLOSURES
Parent and Ultimate Controlling Party
Kathmandu Holdings Limited is the immediate parent, ultimate parent and controlling party.
During the year, legal fees of $84,863 (2012: $163,683) were paid to Chapman Tripp for services provided (primarily related to property leases). John Holland is both a Director of Kathmandu Holdings Limited and a Partner of Chapman Tripp. As at 31 July 2013, there were outstanding legal fees of $4,989 (2012: $20,149).
During the year, operating lease costs of $229,282 (2012: $223,054) were paid to Chalmers Properties Limited, a subsidiary of Port Otago Limited. John Harvey is a Director of both of these companies.
All subsidiaries within the group (note 14) are related parties. No amounts owed to related parties have been written off or forgiven during the year.
During the year the Company advanced and repaid loans to its subsidiaries by way of an internal current account. In presenting the financial statements of the Group, the effect of transactions and balances between fellow subsidiaries and those with the parent have been eliminated. All transactions with related parties were in the normal course of business and provided on commercial terms.
Material amounts outstanding between the parent and subsidiaries at year end were:
Loans from the parent to subsidiaries (Kathmandu Limited) $81,944,045 (2012: $82,884,844).
Loans to the parent from subsidiaries $0 (2012: $0).
(a) Key Management Personnel
GROUP PARENT2013 2012 2013 2012
NZ$’000 NZ$’000 NZ$’000 NZ$’000
Salaries 3,124) 3,193 - -
Other short-term employee benefits 1,187) 81 - -
Employee performance rights 202) 204 202 204
Employee share option plans 7) 67 7 67
4,520 3,545 209 271
Key management personnel include the following employees:
Executive Directors:
Chief Executive Officer
Chief Financial Officer
Other Key Management Personnel:
GM, Product
GM, Marketing
GM, Business Development & Sustainability
GM, Supply Chain
Chief Information Officer
GM, Retail (Australia)
GM, Retail (New Zealand)
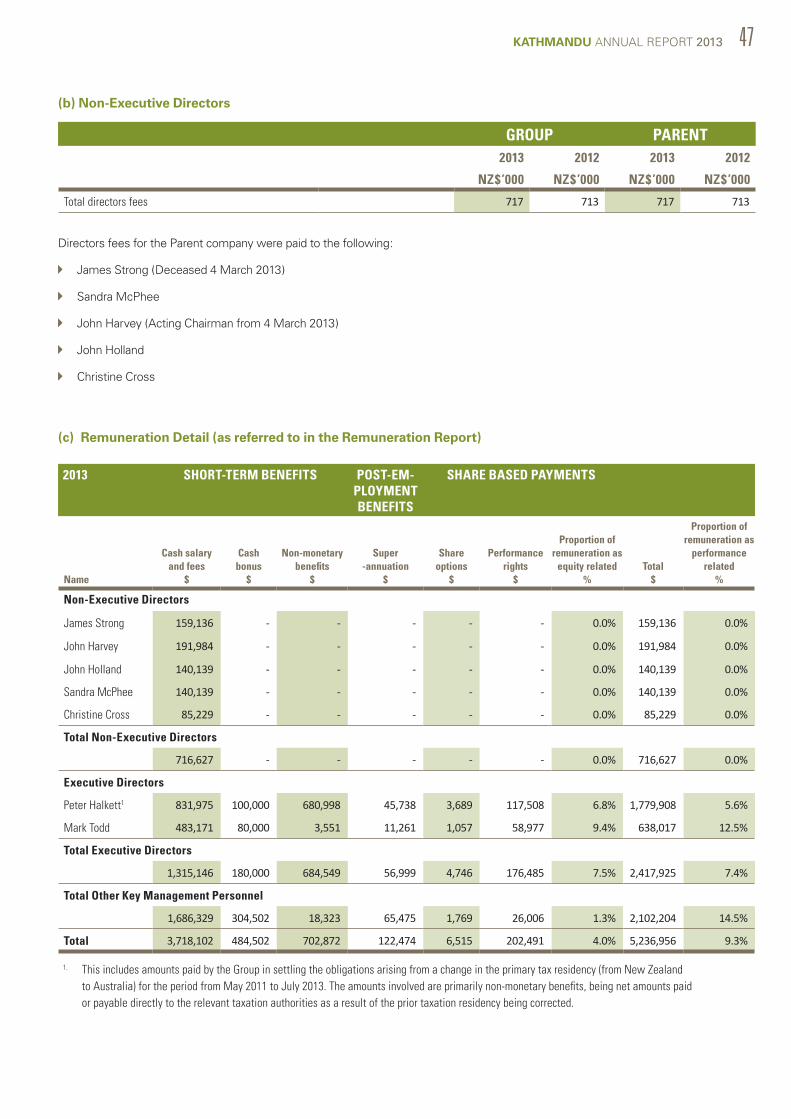
KATHMANDU ANNUAL REPORT 2013 47
(c) Remuneration Detail (as referred to in the Remuneration Report)
Directors fees for the Parent company were paid to the following:
James Strong (Deceased 4 March 2013)
Sandra McPhee
John Harvey (Acting Chairman from 4 March 2013)
John Holland
Christine Cross
2013 SHORT-TERM BENEFITS POST-EM-PLOYMENT BENEFITS
SHARE BASED PAYMENTS
Name
Cash salary and fees
$
Cash bonus
$
Non-monetary benefits
$
Super -annuation
$
Share options
$
Performance rights
$
Proportion of remuneration as
equity related%
Total $
Proportion of remuneration as
performance related
%
Non-Executive Directors
James Strong 159,136 - - - - - 0.0% 159,136 0.0%
John Harvey 191,984 - - - - - 0.0% 191,984 0.0%
John Holland 140,139 - - - - - 0.0% 140,139 0.0%
Sandra McPhee 140,139 - - - - - 0.0% 140,139 0.0%
Christine Cross 85,229 - - - - - 0.0% 85,229 0.0%
Total Non-Executive Directors
716,627 - - - - - 0.0% 716,627 0.0%
Executive Directors
Peter Halkett1 831,975 100,000 680,998) 45,738 3,689 117,508 6.8% 1,779,908 5.6%
Mark Todd 483,171 80,000 3,551 11,261 1,057 58,977 9.4% 638,017 12.5%
Total Executive Directors
1,315,146 180,000 684,549) 56,999 4,746 176,485 7.5% 2,417,925) 7.4%
Total Other Key Management Personnel
1,686,329 304,502 18,323 65,475 1,769 26,006 1.3% 2,102,204 14.5%
Total 3,718,102 484,502 702,872 122,474 6,515 202,491 4.0% 5,236,956 9.3%
1. This includes amounts paid by the Group in settling the obligations arising from a change in the primary tax residency (from New Zealand to Australia) for the period from May 2011 to July 2013. The amounts involved are primarily non-monetary benefits, being net amounts paid or payable directly to the relevant taxation authorities as a result of the prior taxation residency being corrected.
(b) Non-Executive Directors
GROUP PARENT2013 2012 2013 2012
NZ$’000 NZ$’000 NZ$’000 NZ$’000
Total directors fees 717 713 717 713
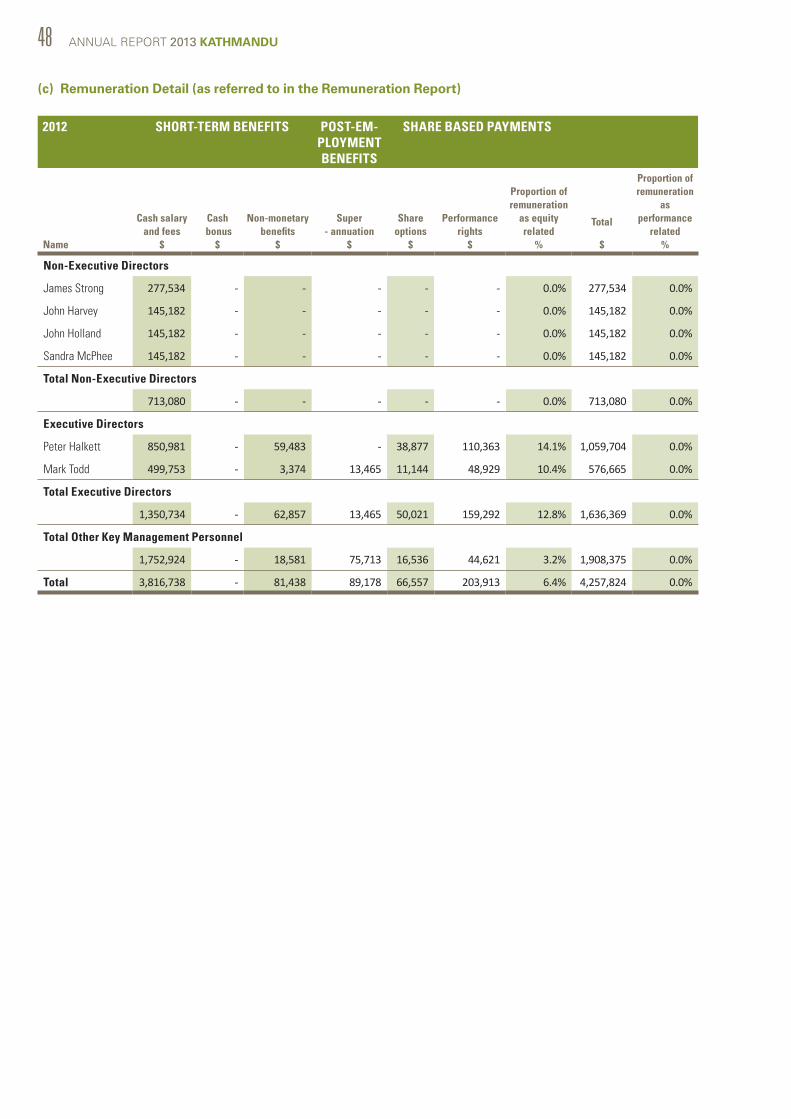
48 ANNUAL REPORT 2013 KATHMANDU
(c) Remuneration Detail (as referred to in the Remuneration Report)
2012 SHORT-TERM BENEFITS POST-EM-PLOYMENT BENEFITS
SHARE BASED PAYMENTS
Name
Cash salary and fees
$
Cash bonus
$
Non-monetary benefits
$
Super - annuation
$
Share options
$
Performance rights
$
Proportion of remuneration
as equity related
%
Total
$
Proportion of remuneration
as performance
related%
Non-Executive Directors
James Strong 277,534 - - - - - 0.0% 277,534 0.0%
John Harvey 145,182 - - - - - 0.0% 145,182 0.0%
John Holland 145,182 - - - - - 0.0% 145,182 0.0%
Sandra McPhee 145,182 - - - - - 0.0% 145,182 0.0%
Total Non-Executive Directors
713,080 - - - - - 0.0% 713,080 0.0%
Executive Directors
Peter Halkett 850,981 - 59,483 - 38,877 110,363 14.1% 1,059,704 0.0%
Mark Todd 499,753 - 3,374 13,465 11,144 48,929 10.4% 576,665 0.0%
Total Executive Directors
1,350,734 - 62,857 13,465 50,021 159,292 12.8% 1,636,369 0.0%
Total Other Key Management Personnel
1,752,924 - 18,581 75,713 16,536 44,621 3.2% 1,908,375 0.0%
Total 3,816,738 - 81,438 89,178 66,557 203,913 6.4% 4,257,824 0.0%
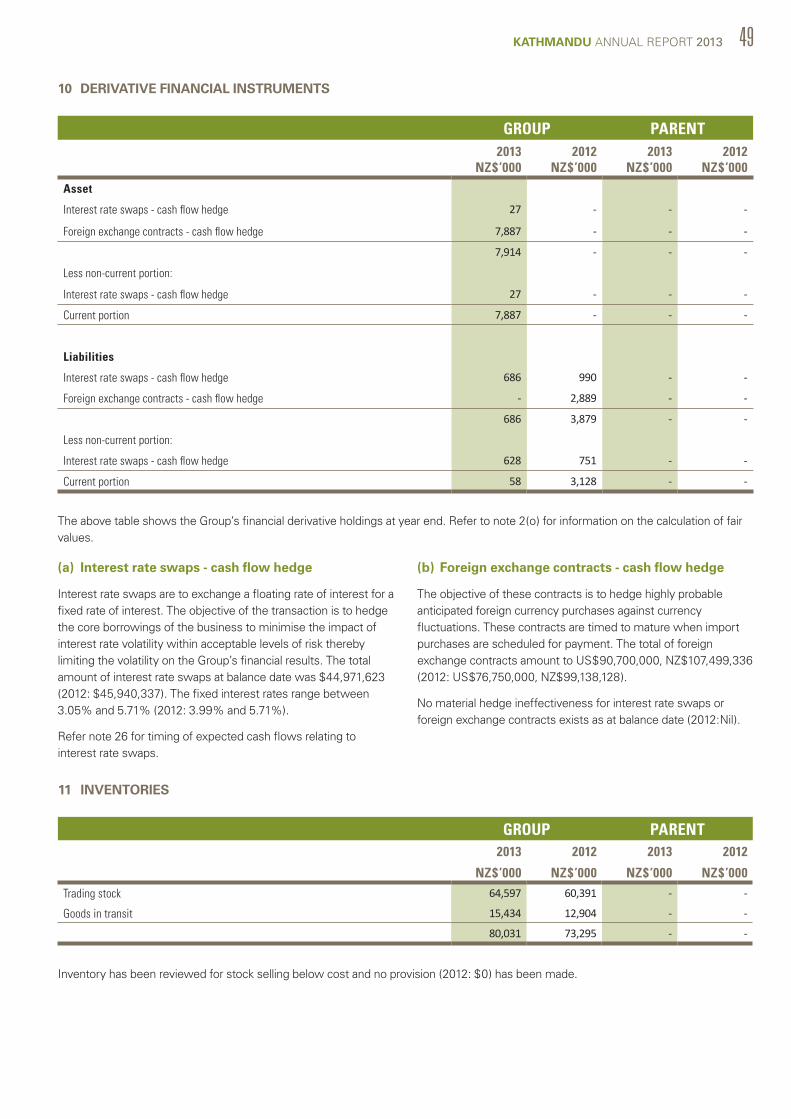
KATHMANDU ANNUAL REPORT 2013 49
10 DERIVATIVE FINANCIAL INSTRUMENTS
11 INVENTORIES
GROUP PARENT2013
NZ$’0002012
NZ$’0002013
NZ$’0002012
NZ$’000
Asset
Interest rate swaps - cash flow hedge 27 - - -
Foreign exchange contracts - cash flow hedge 7,887 - - -
7,914 - - -
Less non-current portion:
Interest rate swaps - cash flow hedge 27 - - -
Current portion 7,887 - - -
Liabilities
Interest rate swaps - cash flow hedge 686 990 - -
Foreign exchange contracts - cash flow hedge - 2,889 - -
686 3,879 - -
Less non-current portion:
Interest rate swaps - cash flow hedge 628 751 - -
Current portion 58 3,128 - -
The above table shows the Group’s financial derivative holdings at year end. Refer to note 2(o) for information on the calculation of fair values.
GROUP PARENT2013 2012 2013 2012
NZ$’000 NZ$’000 NZ$’000 NZ$’000Trading stock 64,597 60,391 - -
Goods in transit 15,434 12,904 - -
80,031 73,295 - -
Inventory has been reviewed for stock selling below cost and no provision (2012: $0) has been made.
(a) Interest rate swaps - cash flow hedge
Interest rate swaps are to exchange a floating rate of interest for a fixed rate of interest. The objective of the transaction is to hedge the core borrowings of the business to minimise the impact of interest rate volatility within acceptable levels of risk thereby limiting the volatility on the Group’s financial results. The total amount of interest rate swaps at balance date was $44,971,623 (2012: $45,940,337). The fixed interest rates range between 3.05% and 5.71% (2012: 3.99% and 5.71%).
Refer note 26 for timing of expected cash flows relating to interest rate swaps.
(b) Foreign exchange contracts - cash flow hedge
The objective of these contracts is to hedge highly probable anticipated foreign currency purchases against currency fluctuations. These contracts are timed to mature when import purchases are scheduled for payment. The total of foreign exchange contracts amount to US$90,700,000, NZ$107,499,336 (2012: US$76,750,000, NZ$99,138,128).
No material hedge ineffectiveness for interest rate swaps or foreign exchange contracts exists as at balance date (2012:Nil).
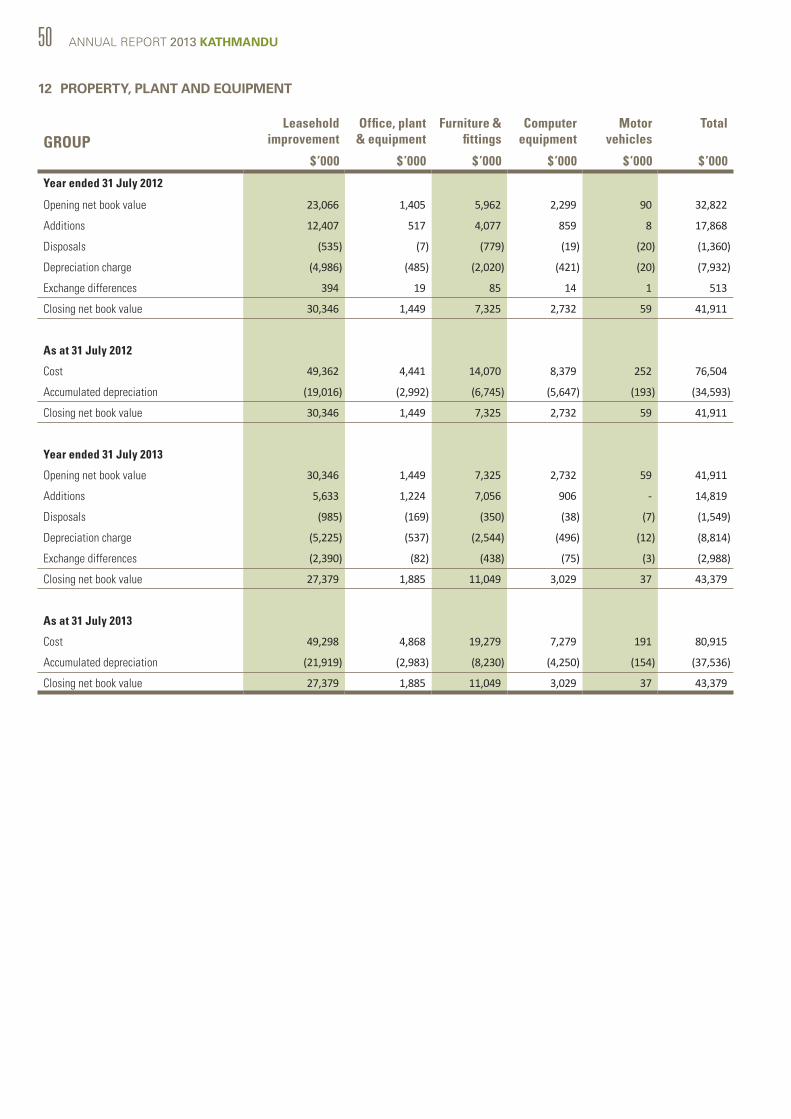
50 ANNUAL REPORT 2013 KATHMANDU
12 PROPERTY, PLANT AND EQUIPMENT
GROUPLeasehold
improvementOffice, plant & equipment
Furniture & fittings
Computer equipment
Motor vehicles
Total
$’000 $’000 $’000 $’000 $’000 $’000
Year ended 31 July 2012
Opening net book value 23,066 1,405 5,962 2,299 90 32,822
Additions 12,407 517 4,077 859 8 17,868
Disposals (535) (7) (779) (19) (20) (1,360)
Depreciation charge (4,986) (485) (2,020) (421) (20) (7,932)
Exchange differences 394 19 85 14 1 513
Closing net book value 30,346 1,449 7,325 2,732 59 41,911
As at 31 July 2012
Cost 49,362 4,441 14,070 8,379 252 76,504
Accumulated depreciation (19,016) (2,992) (6,745) (5,647) (193) (34,593)
Closing net book value 30,346 1,449 7,325 2,732 59 41,911
Year ended 31 July 2013
Opening net book value 30,346 1,449 7,325 2,732 59 41,911
Additions 5,633 1,224 7,056 906 - 14,819
Disposals (985) (169) (350) (38) (7) (1,549)
Depreciation charge (5,225) (537) (2,544) (496) (12) (8,814)
Exchange differences (2,390) (82) (438) (75) (3) (2,988)
Closing net book value 27,379 1,885 11,049 3,029 37 43,379
As at 31 July 2013
Cost 49,298 4,868 19,279 7,279 191 80,915
Accumulated depreciation (21,919) (2,983) (8,230) (4,250) (154) (37,536)
Closing net book value 27,379 1,885 11,049 3,029 37 43,379
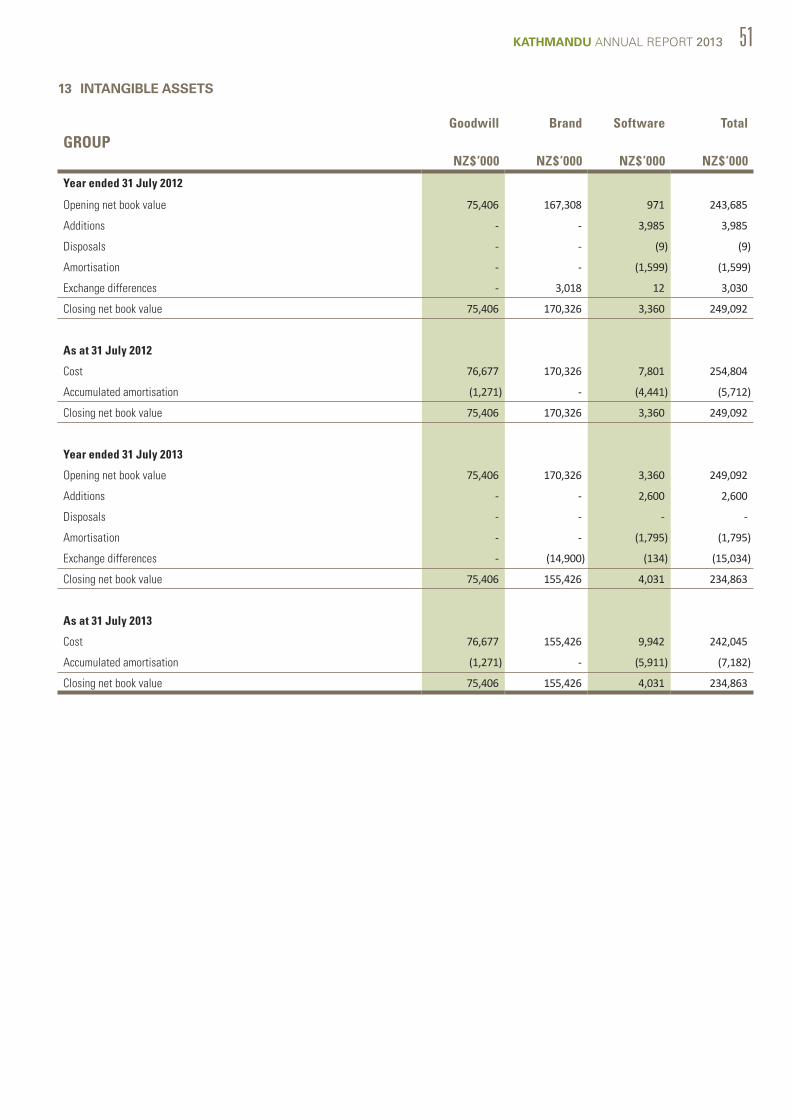
KATHMANDU ANNUAL REPORT 2013 51
13 INTANGIBLE ASSETS
GROUP Goodwill Brand Software Total
NZ$’000 NZ$’000 NZ$’000 NZ$’000
Year ended 31 July 2012
Opening net book value 75,406 167,308 971 243,685
Additions - - 3,985 3,985
Disposals - - (9) (9)
Amortisation - - (1,599) (1,599)
Exchange differences - 3,018 12 3,030
Closing net book value 75,406 170,326 3,360 249,092
As at 31 July 2012
Cost 76,677 170,326 7,801 254,804
Accumulated amortisation (1,271) - (4,441) (5,712)
Closing net book value 75,406 170,326 3,360 249,092
Year ended 31 July 2013
Opening net book value 75,406 170,326 3,360 249,092
Additions - - 2,600 2,600
Disposals - - - -
Amortisation - - (1,795) (1,795)
Exchange differences - (14,900) (134) (15,034)
Closing net book value 75,406 155,426 4,031 234,863
As at 31 July 2013
Cost 76,677 155,426 9,942 242,045
Accumulated amortisation (1,271) - (5,911) (7,182)
Closing net book value 75,406 155,426 4,031 234,863

52 ANNUAL REPORT 2013 KATHMANDU
PARENT Goodwill Brand Software Total
NZ$’000 NZ$’000 NZ$’000 NZ$’000
Year ended 31 July 2012
Opening net book value - - - -
Additions - - - -
Disposals - - - -
Amortisation - - - -
Exchange differences - - - -
Closing net book value - - - -
As at 31 July 2012
Cost - - - -
Accumulated amortisation - - - -
Closing net book value - - - -
Year ended 31 July 2013
Opening net book value - - - -
Additions - - 7 7
Disposals - - - -
Amortisation - - (3) (3)
Exchange differences - - - -
Closing net book value - - 4 4
As at 31 July 2013
Cost - - 7 7
Accumulated amortisation - - (3) (3)
Closing net book value - - 4 4
Impairment tests for goodwill and brand
The aggregate carrying amounts of goodwill and brand allocated to each unit are as follows:
GROUP GOODWILL BRAND2013 2012 2013 2012
NZ$’000 NZ$’000 NZ$’000 NZ$’000
New Zealand 28,654 28,654 51,000 51,000
Australia 46,752 46,752 104,426 119,326
75,406 75,406 155,426 170,326
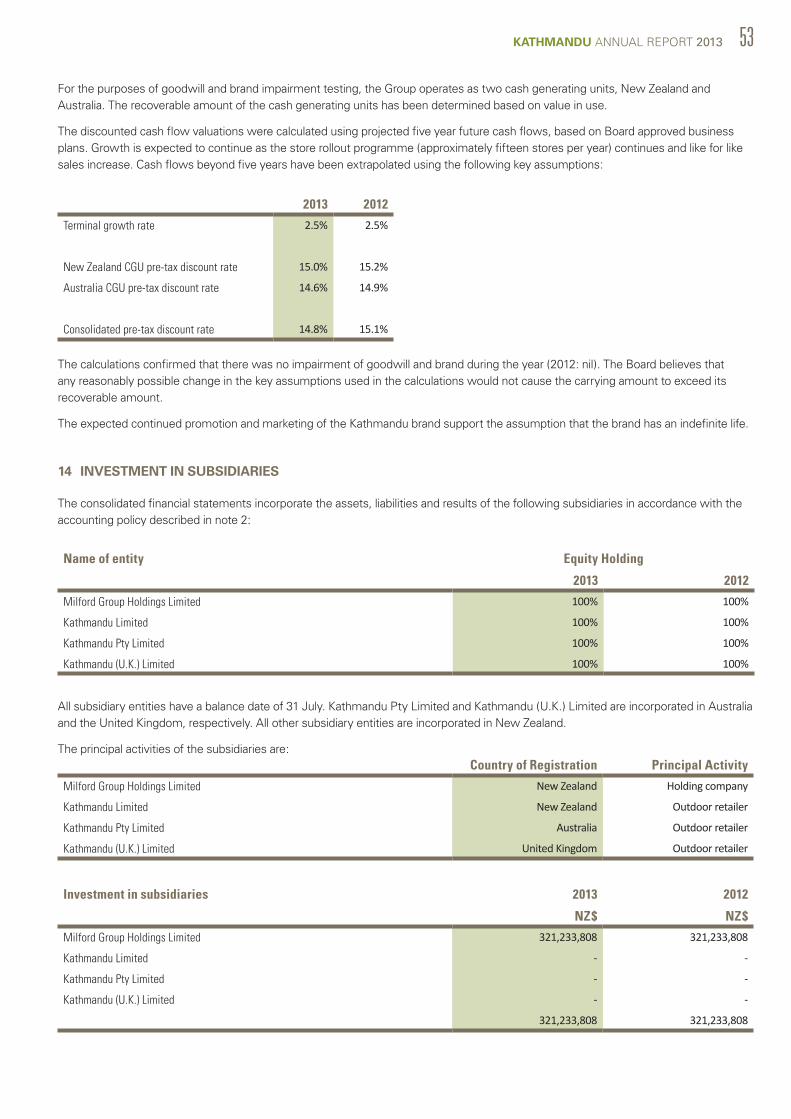
KATHMANDU ANNUAL REPORT 2013 53
For the purposes of goodwill and brand impairment testing, the Group operates as two cash generating units, New Zealand and Australia. The recoverable amount of the cash generating units has been determined based on value in use.
The discounted cash flow valuations were calculated using projected five year future cash flows, based on Board approved business plans. Growth is expected to continue as the store rollout programme (approximately fifteen stores per year) continues and like for like sales increase. Cash flows beyond five years have been extrapolated using the following key assumptions:
All subsidiary entities have a balance date of 31 July. Kathmandu Pty Limited and Kathmandu (U.K.) Limited are incorporated in Australia and the United Kingdom, respectively. All other subsidiary entities are incorporated in New Zealand.
The principal activities of the subsidiaries are:
The consolidated financial statements incorporate the assets, liabilities and results of the following subsidiaries in accordance with the accounting policy described in note 2:
The calculations confirmed that there was no impairment of goodwill and brand during the year (2012: nil). The Board believes that any reasonably possible change in the key assumptions used in the calculations would not cause the carrying amount to exceed its recoverable amount.
The expected continued promotion and marketing of the Kathmandu brand support the assumption that the brand has an indefinite life.
2013 2012
Terminal growth rate 2.5% 2.5%
New Zealand CGU pre-tax discount rate 15.0% 15.2%
Australia CGU pre-tax discount rate 14.6% 14.9%
Consolidated pre-tax discount rate 14.8% 15.1%
14 INVESTMENT IN SUBSIDIARIES
Name of entity Equity Holding
2013 2012
Milford Group Holdings Limited 100% 100%
Kathmandu Limited 100% 100%
Kathmandu Pty Limited 100% 100%
Kathmandu (U.K.) Limited 100% 100%
Country of Registration Principal Activity
Milford Group Holdings Limited New Zealand Holding company
Kathmandu Limited New Zealand Outdoor retailer
Kathmandu Pty Limited Australia Outdoor retailer
Kathmandu (U.K.) Limited United Kingdom Outdoor retailer
Investment in subsidiaries 2013 2012
NZ$ NZ$
Milford Group Holdings Limited 321,233,808 321,233,808
Kathmandu Limited - -
Kathmandu Pty Limited - -
Kathmandu (U.K.) Limited - -
321,233,808 321,233,808

54 ANNUAL REPORT 2013 KATHMANDU
15 DEFERRED TAXATION
The following are the major deferred taxation liabilities and assets recognised by the Group and movements thereon during the current and prior year.
Certain deferred taxation assets and liabilities have been offset. The following is the analysis of the deferred taxation balances (after offset) for financial reporting purposes:
GROUPTax
depreciationEmployee
obligations LossesOther timing differences Reserves Total
NZ$’000 NZ$’000 NZ$’000 NZ$’000 NZ$’000 NZ$’000
As at 31 July 2011 68 931 1 853 1,614 3,467
Charge / (credit) to the income statement 19 (94) - 854 - 779
Charge / (credit) to other comprehensive income
- - - 44 (1,072) (1,028)
As at 31 July 2012 87 837 1 1,751 542 3,218
Charge / (credit) to the income statement 125 285 - 3,608 - 4,018
Charge / (credit) to other comprehensive income
- - - (392) (2,827) (3,219)
As at 31 July 2013 212 1,122 1 4,967 (2,285) 4,017
PARENTTax
depreciationEmployee
obligations LossesOther timing differences Reserves Total
NZ$’000 NZ$’000 NZ$’000 NZ$’000 NZ$’000 NZ$’000
As at 31 July 2011 - - - - - -
Charge / (credit) to the income statement - - - - - -
As at 31 July 2012 - - - - - -
Charge / (credit) to the income statement - - - 17 - 17
As at 31 July 2013 - - - 17 - 17
GROUP PARENT2013 2012 2013 2012
NZ$’000 NZ$’000 NZ$’000 NZ$’000
Deferred taxation assets:
- Deferred tax asset to be recovered after more than 12 months 1,705 1,461 - -
- Deferred tax asset to be recovered within 12 months 2,803 1,779 17 -
Deferred taxation liabilities:
- Deferred tax liability to be recovered after more than 12 months (342) (1) - -
- Deferred tax liability to be recovered within 12 months (149) (21) - -
4,017 3,218 17 -
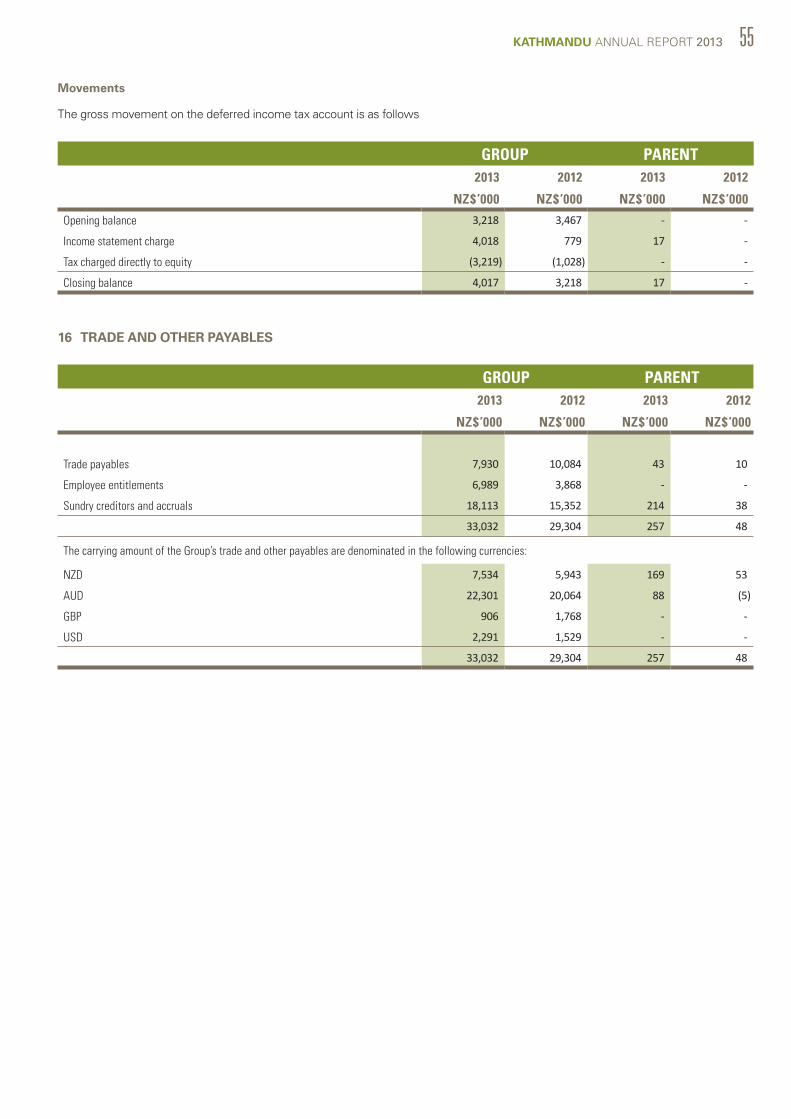
KATHMANDU ANNUAL REPORT 2013 55
16 TRADE AND OTHER PAYABLES
Movements
The gross movement on the deferred income tax account is as follows
GROUP PARENT2013 2012 2013 2012
NZ$’000 NZ$’000 NZ$’000 NZ$’000
Opening balance 3,218 3,467 - -
Income statement charge 4,018 779 17 -
Tax charged directly to equity (3,219) (1,028) - -
Closing balance 4,017 3,218 17 -
GROUP PARENT2013 2012 2013 2012
NZ$’000 NZ$’000 NZ$’000 NZ$’000
Trade payables 7,930 10,084 43 10
Employee entitlements 6,989 3,868 - -
Sundry creditors and accruals 18,113 15,352 214 38
33,032 29,304 257 48
The carrying amount of the Group’s trade and other payables are denominated in the following currencies:
NZD 7,534 5,943 169 53
AUD 22,301 20,064 88 (5)
GBP 906 1,768 - -
USD 2,291 1,529 - -
33,032 29,304 257 48
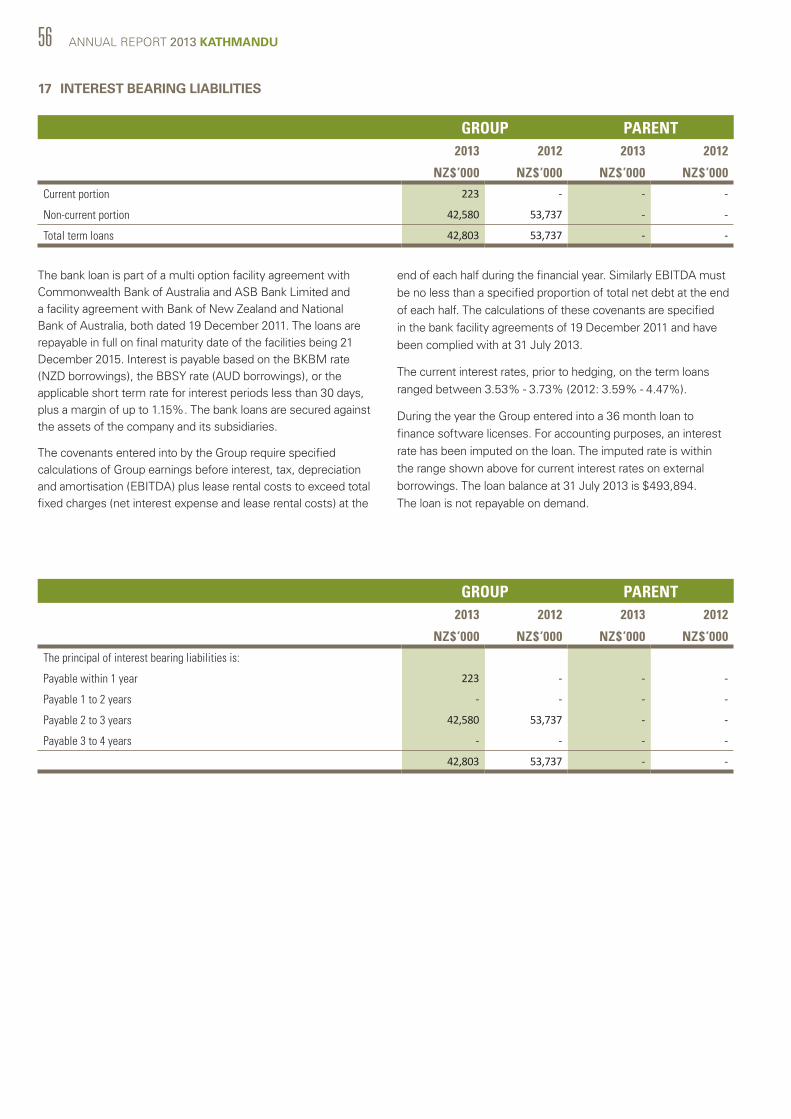
56 ANNUAL REPORT 2013 KATHMANDU
17 INTEREST BEARING LIABILITIES
GROUP PARENT2013 2012 2013 2012
NZ$’000 NZ$’000 NZ$’000 NZ$’000
Current portion 223 - - -
Non-current portion 42,580 53,737 - -
Total term loans 42,803 53,737 - -
The bank loan is part of a multi option facility agreement with Commonwealth Bank of Australia and ASB Bank Limited and a facility agreement with Bank of New Zealand and National Bank of Australia, both dated 19 December 2011. The loans are repayable in full on final maturity date of the facilities being 21 December 2015. Interest is payable based on the BKBM rate (NZD borrowings), the BBSY rate (AUD borrowings), or the applicable short term rate for interest periods less than 30 days, plus a margin of up to 1.15%. The bank loans are secured against the assets of the company and its subsidiaries.
The covenants entered into by the Group require specified calculations of Group earnings before interest, tax, depreciation and amortisation (EBITDA) plus lease rental costs to exceed total fixed charges (net interest expense and lease rental costs) at the
end of each half during the financial year. Similarly EBITDA must be no less than a specified proportion of total net debt at the end of each half. The calculations of these covenants are specified in the bank facility agreements of 19 December 2011 and have been complied with at 31 July 2013.
The current interest rates, prior to hedging, on the term loans ranged between 3.53% - 3.73% (2012: 3.59% - 4.47%).
During the year the Group entered into a 36 month loan to finance software licenses. For accounting purposes, an interest rate has been imputed on the loan. The imputed rate is within the range shown above for current interest rates on external borrowings. The loan balance at 31 July 2013 is $493,894. The loan is not repayable on demand.
GROUP PARENT2013 2012 2013 2012
NZ$’000 NZ$’000 NZ$’000 NZ$’000
The principal of interest bearing liabilities is:
Payable within 1 year 223 - - -
Payable 1 to 2 years - - - -
Payable 2 to 3 years 42,580 53,737 - -
Payable 3 to 4 years - - - -
42,803 53,737 - -
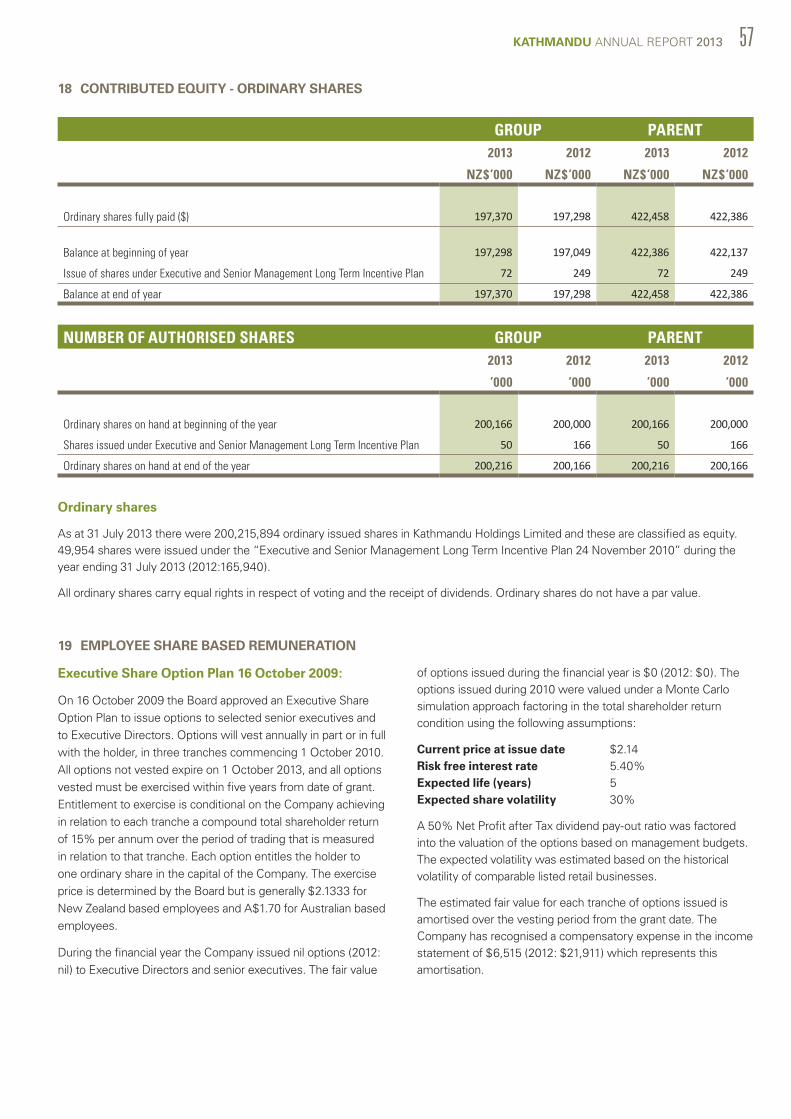
KATHMANDU ANNUAL REPORT 2013 57
18 CONTRIBUTED EQUITY - ORDINARY SHARES
Ordinary shares
As at 31 July 2013 there were 200,215,894 ordinary issued shares in Kathmandu Holdings Limited and these are classified as equity. 49,954 shares were issued under the “Executive and Senior Management Long Term Incentive Plan 24 November 2010” during the year ending 31 July 2013 (2012:165,940).
All ordinary shares carry equal rights in respect of voting and the receipt of dividends. Ordinary shares do not have a par value.
GROUP PARENT2013 2012 2013 2012
NZ$’000 NZ$’000 NZ$’000 NZ$’000
Ordinary shares fully paid ($) 197,370 197,298 422,458 422,386
Balance at beginning of year 197,298 197,049 422,386 422,137
Issue of shares under Executive and Senior Management Long Term Incentive Plan 72 249 72 249
Balance at end of year 197,370 197,298 422,458 422,386
NUMBER OF AUTHORISED SHARES GROUP PARENT2013 2012 2013 2012
’000 ’000 ’000 ’000
Ordinary shares on hand at beginning of the year 200,166 200,000 200,166 200,000
Shares issued under Executive and Senior Management Long Term Incentive Plan 50 166 50 166
Ordinary shares on hand at end of the year 200,216 200,166 200,216 200,166
19 EMPLOYEE SHARE BASED REMUNERATION
Executive Share Option Plan 16 October 2009:
On 16 October 2009 the Board approved an Executive Share Option Plan to issue options to selected senior executives and to Executive Directors. Options will vest annually in part or in full with the holder, in three tranches commencing 1 October 2010. All options not vested expire on 1 October 2013, and all options vested must be exercised within five years from date of grant. Entitlement to exercise is conditional on the Company achieving in relation to each tranche a compound total shareholder return of 15% per annum over the period of trading that is measured in relation to that tranche. Each option entitles the holder to one ordinary share in the capital of the Company. The exercise price is determined by the Board but is generally $2.1333 for New Zealand based employees and A$1.70 for Australian based employees.
During the financial year the Company issued nil options (2012: nil) to Executive Directors and senior executives. The fair value
of options issued during the financial year is $0 (2012: $0). The options issued during 2010 were valued under a Monte Carlo simulation approach factoring in the total shareholder return condition using the following assumptions:
Current price at issue date $2.14Risk free interest rate 5.40%Expected life (years) 5Expected share volatility 30%
A 50% Net Profit after Tax dividend pay-out ratio was factored into the valuation of the options based on management budgets. The expected volatility was estimated based on the historical volatility of comparable listed retail businesses.
The estimated fair value for each tranche of options issued is amortised over the vesting period from the grant date. The Company has recognised a compensatory expense in the income statement of $6,515 (2012: $21,911) which represents this amortisation.
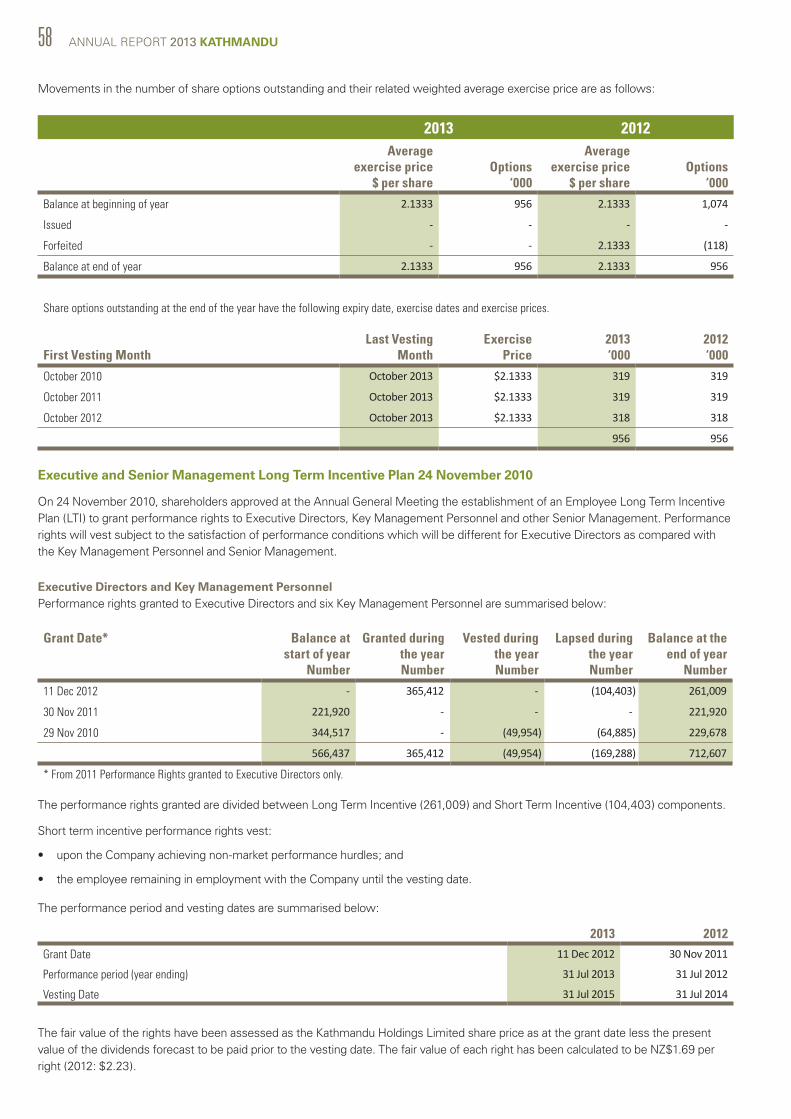
58 ANNUAL REPORT 2013 KATHMANDU
Movements in the number of share options outstanding and their related weighted average exercise price are as follows:
2013 2012 Average
exercise price $ per share
Options ‘000
Average exercise price
$ per shareOptions
‘000
Balance at beginning of year 2.1333 956 2.1333 1,074
Issued - - - -
Forfeited - - 2.1333 (118)
Balance at end of year 2.1333 956 2.1333 956
Share options outstanding at the end of the year have the following expiry date, exercise dates and exercise prices.
First Vesting MonthLast Vesting
MonthExercise
Price2013 ‘000
2012 ‘000
October 2010 October 2013 $2.1333 319 319
October 2011 October 2013 $2.1333 319 319
October 2012 October 2013 $2.1333 318 318
956 956
Executive and Senior Management Long Term Incentive Plan 24 November 2010
On 24 November 2010, shareholders approved at the Annual General Meeting the establishment of an Employee Long Term Incentive Plan (LTI) to grant performance rights to Executive Directors, Key Management Personnel and other Senior Management. Performance rights will vest subject to the satisfaction of performance conditions which will be different for Executive Directors as compared with the Key Management Personnel and Senior Management.
Executive Directors and Key Management PersonnelPerformance rights granted to Executive Directors and six Key Management Personnel are summarised below:
Grant Date* Balance at start of year
Number
Granted during the year Number
Vested during the year Number
Lapsed during the year Number
Balance at the end of year
Number
11 Dec 2012 - 365,412 - (104,403) 261,009
30 Nov 2011 221,920 - - - 221,920
29 Nov 2010 344,517 - (49,954) (64,885) 229,678
566,437 365,412 (49,954) (169,288) 712,607
* From 2011 Performance Rights granted to Executive Directors only.
2013 2012Grant Date 11 Dec 2012 30 Nov 2011
Performance period (year ending) 31 Jul 2013 31 Jul 2012
Vesting Date 31 Jul 2015 31 Jul 2014
The fair value of the rights have been assessed as the Kathmandu Holdings Limited share price as at the grant date less the present value of the dividends forecast to be paid prior to the vesting date. The fair value of each right has been calculated to be NZ$1.69 per right (2012: $2.23).
The performance rights granted are divided between Long Term Incentive (261,009) and Short Term Incentive (104,403) components.
Short term incentive performance rights vest:
• upon the Company achieving non-market performance hurdles; and
• the employee remaining in employment with the Company until the vesting date.
The performance period and vesting dates are summarised below:
The performance period and vesting dates are summarised below:
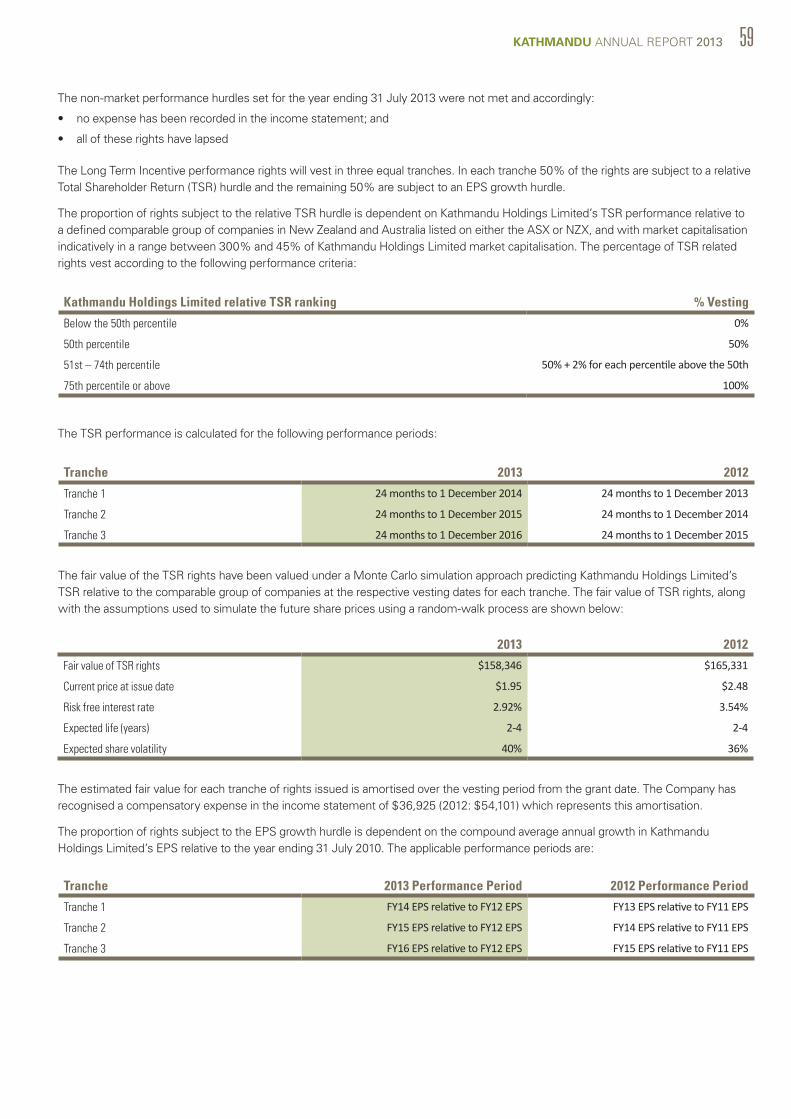
KATHMANDU ANNUAL REPORT 2013 59
Kathmandu Holdings Limited relative TSR ranking % Vesting
Below the 50th percentile 0%
50th percentile 50%
51st – 74th percentile 50% + 2% for each percentile above the 50th
75th percentile or above 100%
Tranche 2013 2012
Tranche 1 24 months to 1 December 2014 24 months to 1 December 2013
Tranche 2 24 months to 1 December 2015 24 months to 1 December 2014
Tranche 3 24 months to 1 December 2016 24 months to 1 December 2015
The fair value of the TSR rights have been valued under a Monte Carlo simulation approach predicting Kathmandu Holdings Limited’s TSR relative to the comparable group of companies at the respective vesting dates for each tranche. The fair value of TSR rights, along with the assumptions used to simulate the future share prices using a random-walk process are shown below:
The estimated fair value for each tranche of rights issued is amortised over the vesting period from the grant date. The Company has recognised a compensatory expense in the income statement of $36,925 (2012: $54,101) which represents this amortisation.
The proportion of rights subject to the EPS growth hurdle is dependent on the compound average annual growth in Kathmandu Holdings Limited’s EPS relative to the year ending 31 July 2010. The applicable performance periods are:
2013 2012
Fair value of TSR rights $158,346 $165,331
Current price at issue date $1.95 $2.48
Risk free interest rate 2.92% 3.54%
Expected life (years) 2-4 2-4
Expected share volatility 40% 36%
Tranche 2013 Performance Period 2012 Performance Period
Tranche 1 FY14 EPS relative to FY12 EPS FY13 EPS relative to FY11 EPS
Tranche 2 FY15 EPS relative to FY12 EPS FY14 EPS relative to FY11 EPS
Tranche 3 FY16 EPS relative to FY12 EPS FY15 EPS relative to FY11 EPS
The non-market performance hurdles set for the year ending 31 July 2013 were not met and accordingly:
• no expense has been recorded in the income statement; and
• all of these rights have lapsed
The Long Term Incentive performance rights will vest in three equal tranches. In each tranche 50% of the rights are subject to a relative Total Shareholder Return (TSR) hurdle and the remaining 50% are subject to an EPS growth hurdle.
The proportion of rights subject to the relative TSR hurdle is dependent on Kathmandu Holdings Limited’s TSR performance relative to a defined comparable group of companies in New Zealand and Australia listed on either the ASX or NZX, and with market capitalisation indicatively in a range between 300% and 45% of Kathmandu Holdings Limited market capitalisation. The percentage of TSR related rights vest according to the following performance criteria:
The TSR performance is calculated for the following performance periods:
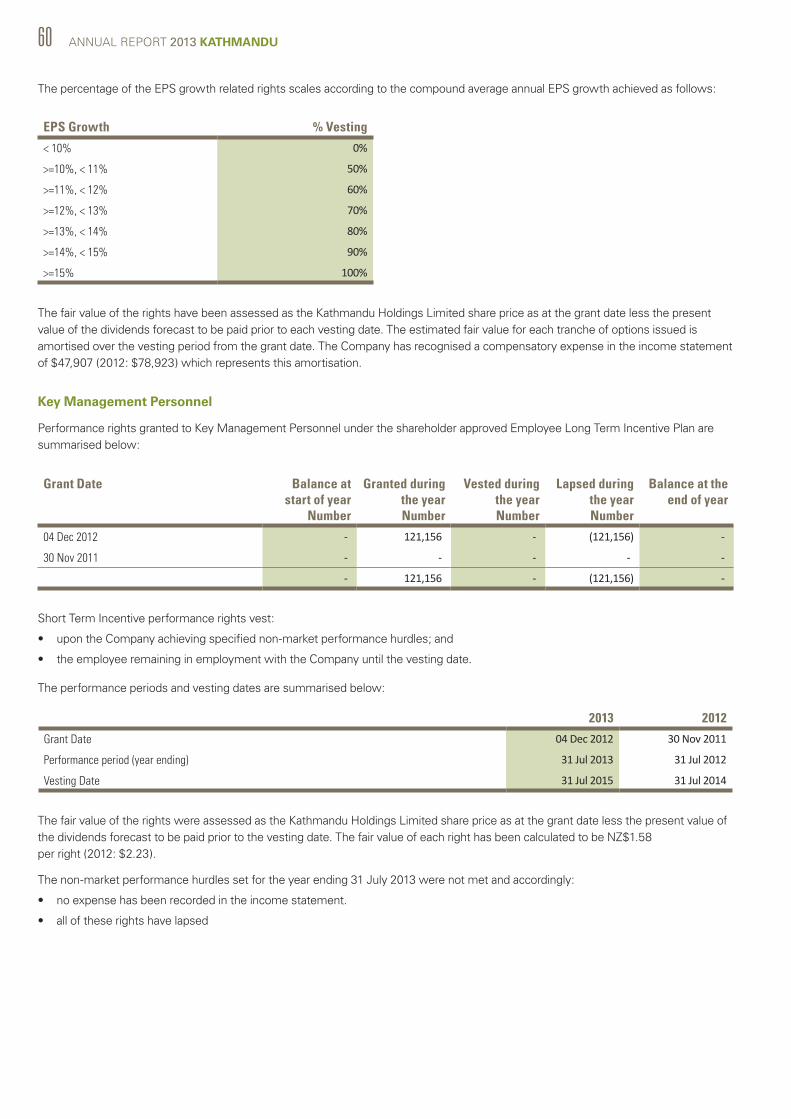
60 ANNUAL REPORT 2013 KATHMANDU
The percentage of the EPS growth related rights scales according to the compound average annual EPS growth achieved as follows:
EPS Growth % Vesting
< 10% 0%
>=10%, < 11% 50%
>=11%, < 12% 60%
>=12%, < 13% 70%
>=13%, < 14% 80%
>=14%, < 15% 90%
>=15% 100%
The fair value of the rights have been assessed as the Kathmandu Holdings Limited share price as at the grant date less the present value of the dividends forecast to be paid prior to each vesting date. The estimated fair value for each tranche of options issued is amortised over the vesting period from the grant date. The Company has recognised a compensatory expense in the income statement of $47,907 (2012: $78,923) which represents this amortisation.
Key Management Personnel
Performance rights granted to Key Management Personnel under the shareholder approved Employee Long Term Incentive Plan are summarised below:
The fair value of the rights were assessed as the Kathmandu Holdings Limited share price as at the grant date less the present value of the dividends forecast to be paid prior to the vesting date. The fair value of each right has been calculated to be NZ$1.58 per right (2012: $2.23).
The non-market performance hurdles set for the year ending 31 July 2013 were not met and accordingly:
• no expense has been recorded in the income statement.
• all of these rights have lapsed
Grant Date Balance at start of year
Number
Granted during the year Number
Vested during the year Number
Lapsed during the year Number
Balance at the end of year
04 Dec 2012 - 121,156 - (121,156) -
30 Nov 2011 - - - - -
- 121,156 - (121,156) -
2013 2012
Grant Date 04 Dec 2012 30 Nov 2011
Performance period (year ending) 31 Jul 2013 31 Jul 2012
Vesting Date 31 Jul 2015 31 Jul 2014
Short Term Incentive performance rights vest:
• upon the Company achieving specified non-market performance hurdles; and
• the employee remaining in employment with the Company until the vesting date.
The performance periods and vesting dates are summarised below:
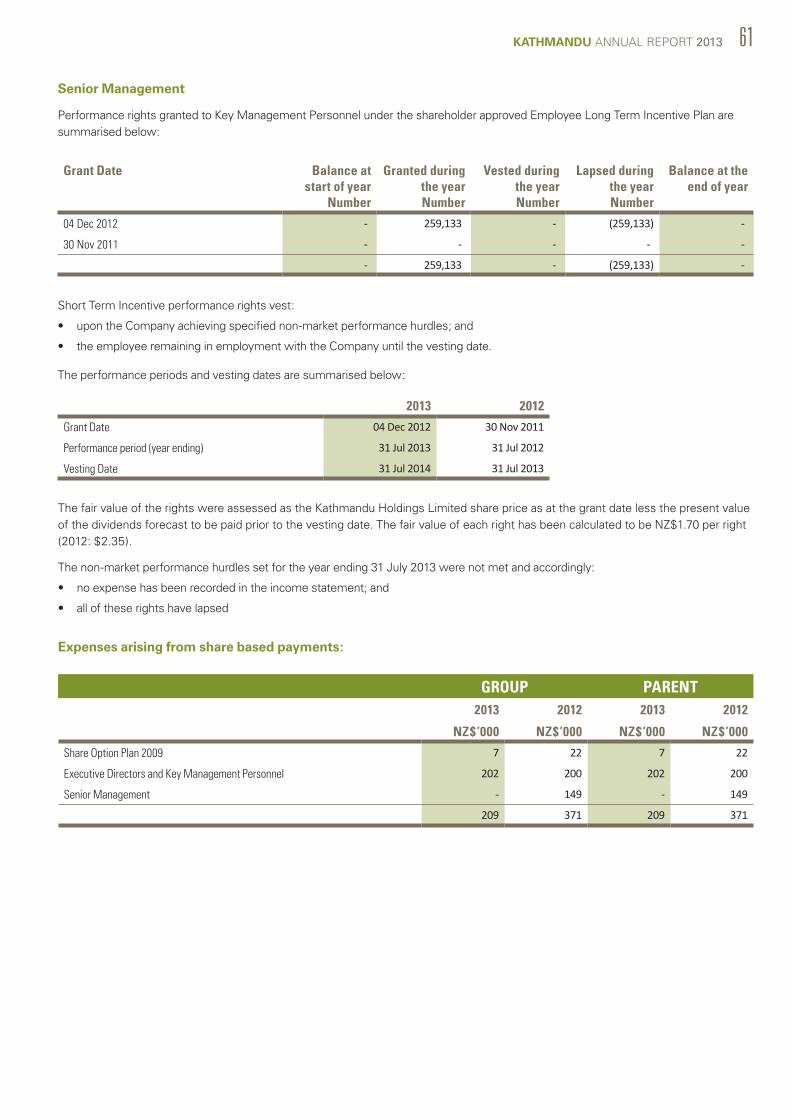
KATHMANDU ANNUAL REPORT 2013 61
Short Term Incentive performance rights vest:
• upon the Company achieving specified non-market performance hurdles; and
• the employee remaining in employment with the Company until the vesting date.
The performance periods and vesting dates are summarised below:
The fair value of the rights were assessed as the Kathmandu Holdings Limited share price as at the grant date less the present value of the dividends forecast to be paid prior to the vesting date. The fair value of each right has been calculated to be NZ$1.70 per right (2012: $2.35).
The non-market performance hurdles set for the year ending 31 July 2013 were not met and accordingly:
• no expense has been recorded in the income statement; and
• all of these rights have lapsed
Expenses arising from share based payments:
Senior Management
Performance rights granted to Key Management Personnel under the shareholder approved Employee Long Term Incentive Plan are summarised below:
Grant Date Balance at start of year
Number
Granted during the year Number
Vested during the year Number
Lapsed during the year Number
Balance at the end of year
04 Dec 2012 - 259,133 - (259,133) -
30 Nov 2011 - - - - -
- 259,133 - (259,133) -
2013 2012
Grant Date 04 Dec 2012 30 Nov 2011
Performance period (year ending) 31 Jul 2013 31 Jul 2012
Vesting Date 31 Jul 2014 31 Jul 2013
GROUP PARENT2013 2012 2013 2012
NZ$’000 NZ$’000 NZ$’000 NZ$’000
Share Option Plan 2009 7 22 7 22
Executive Directors and Key Management Personnel 202 200 202 200
Senior Management - 149 - 149
209 371 209 371
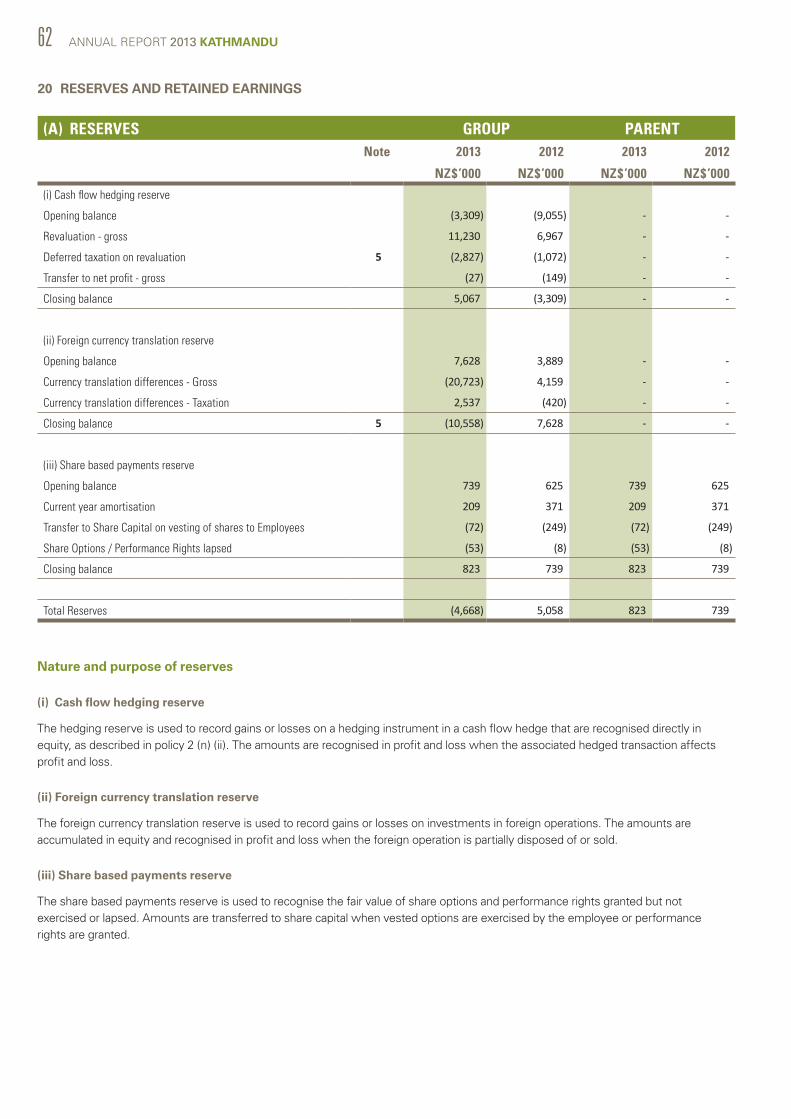
62 ANNUAL REPORT 2013 KATHMANDU
20 RESERVES AND RETAINED EARNINGS
(A) RESERVES GROUP PARENTNote 2013 2012 2013 2012
NZ$’000 NZ$’000 NZ$’000 NZ$’000
(i) Cash flow hedging reserve
Opening balance (3,309) (9,055) - -
Revaluation - gross 11,230 6,967 - -
Deferred taxation on revaluation 5 (2,827) (1,072) - -
Transfer to net profit - gross (27) (149) - -
Closing balance 5,067 (3,309) - -
(ii) Foreign currency translation reserve
Opening balance 7,628) 3,889 - -
Currency translation differences - Gross (20,723) 4,159 - -
Currency translation differences - Taxation 2,537) (420) - -
Closing balance 5 (10,558) 7,628 - -
(iii) Share based payments reserve
Opening balance 739 625 739 625
Current year amortisation 209 371 209 371
Transfer to Share Capital on vesting of shares to Employees (72) (249) (72) (249)
Share Options / Performance Rights lapsed (53) (8) (53) (8)
Closing balance 823 739 823 739
Total Reserves (4,668) 5,058 823 739
Nature and purpose of reserves
(i) Cash flow hedging reserve
The hedging reserve is used to record gains or losses on a hedging instrument in a cash flow hedge that are recognised directly in equity, as described in policy 2 (n) (ii). The amounts are recognised in profit and loss when the associated hedged transaction affects profit and loss.
(ii) Foreign currency translation reserve
The foreign currency translation reserve is used to record gains or losses on investments in foreign operations. The amounts are accumulated in equity and recognised in profit and loss when the foreign operation is partially disposed of or sold.
(iii) Share based payments reserve
The share based payments reserve is used to recognise the fair value of share options and performance rights granted but not exercised or lapsed. Amounts are transferred to share capital when vested options are exercised by the employee or performance rights are granted.
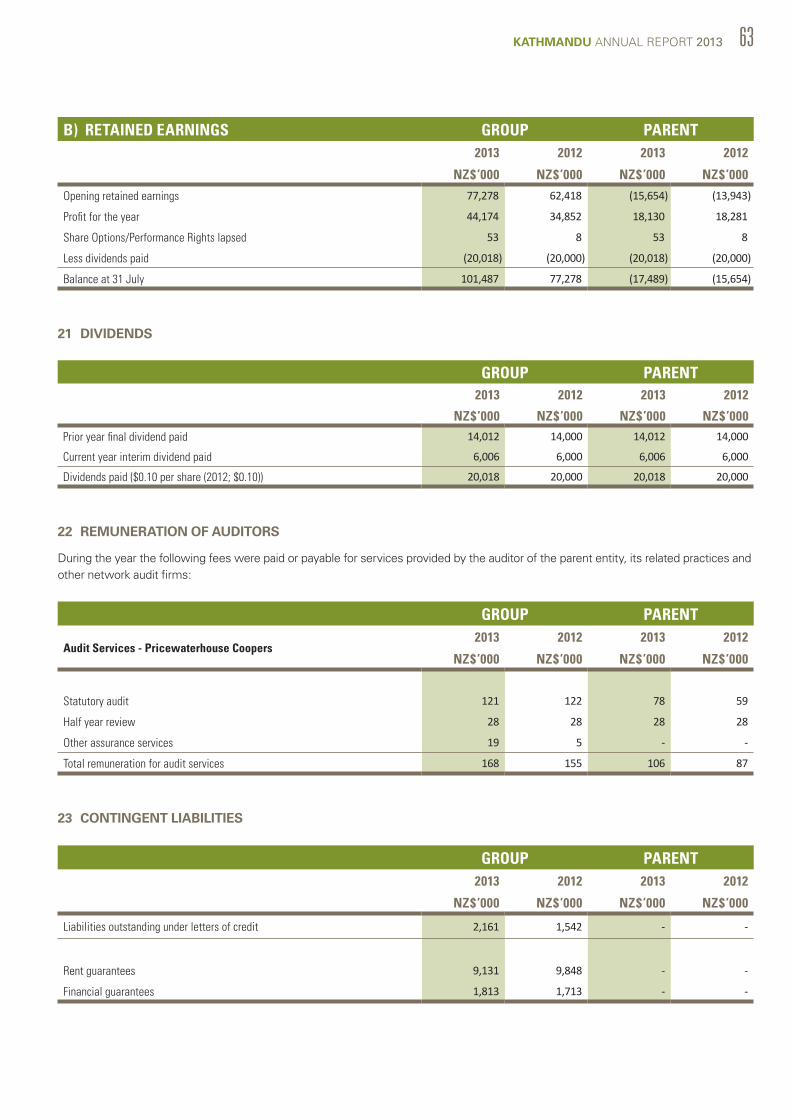
KATHMANDU ANNUAL REPORT 2013 63
21 DIVIDENDS
22 REMUNERATION OF AUDITORS
During the year the following fees were paid or payable for services provided by the auditor of the parent entity, its related practices and other network audit firms:
23 CONTINGENT LIABILITIES
B) RETAINED EARNINGS GROUP PARENT2013 2012 2013 2012
NZ$’000 NZ$’000 NZ$’000 NZ$’000
Opening retained earnings 77,278 62,418 (15,654) (13,943)
Profit for the year 44,174 34,852 18,130 18,281
Share Options/Performance Rights lapsed 53 8 53 8
Less dividends paid (20,018) (20,000) (20,018) (20,000)
Balance at 31 July 101,487 77,278 (17,489) (15,654)
GROUP PARENT2013 2012 2013 2012
NZ$’000 NZ$’000 NZ$’000 NZ$’000Prior year final dividend paid 14,012 14,000 14,012 14,000
Current year interim dividend paid 6,006 6,000 6,006 6,000
Dividends paid ($0.10 per share (2012; $0.10)) 20,018 20,000 20,018 20,000
GROUP PARENT
Audit Services - Pricewaterhouse Coopers2013 2012 2013 2012
NZ$’000 NZ$’000 NZ$’000 NZ$’000
Statutory audit 121 122 78 59
Half year review 28 28 28 28
Other assurance services 19 5 - -
Total remuneration for audit services 168 155 106 87
GROUP PARENT2013 2012 2013 2012
NZ$’000 NZ$’000 NZ$’000 NZ$’000
Liabilities outstanding under letters of credit 2,161 1,542 - -
Rent guarantees 9,131 9,848 - -
Financial guarantees 1,813 1,713 - -

64 ANNUAL REPORT 2013 KATHMANDU
24 CONTINGENT ASSETS
There are no contingent assets in 2013 (2012: nil).
25 COMMITMENTS
(a) Capital commitments
Capital commitments contracted for at balance date are:
(b) Operating lease commitments
Group company as lessee:
Rent expenses reported in these financial statements relate to non-cancellable operating leases. The future commitments on these leases are as follows:
Some of the existing lease agreements have right of renewal options for varying terms.
The Group leases various properties under non-cancellable lease agreements. These leases are generally between 1 - 10 years.
GROUP PARENT2013 2012 2013 2012
NZ$’000 NZ$’000 NZ$’000 NZ$’000
Property, plant and equipment 479 1,680 - -
Intangible assets 720 1,183 - -
1,199 2,863 - -
GROUP PARENT2013 2012 2013 2012
NZ$’000 NZ$’000 NZ$’000 NZ$’000
Due within 1 year 43,618 39,193 - -
Due within 1-2 years 38,618 34,446 - -
Due within 2-5 years 70,916 73,580 - -
Due after 5 years 16,159 20,048 - -
169,311 167,267 - -
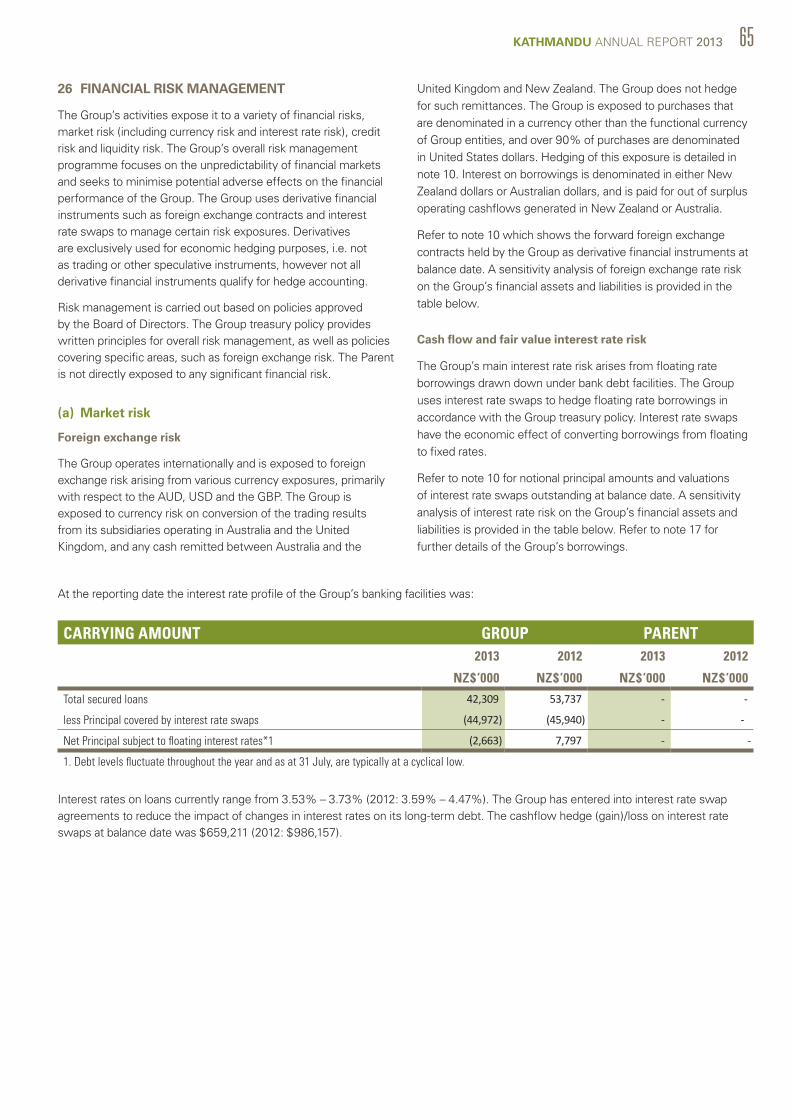
KATHMANDU ANNUAL REPORT 2013 65
Interest rates on loans currently range from 3.53% – 3.73% (2012: 3.59% – 4.47%). The Group has entered into interest rate swap agreements to reduce the impact of changes in interest rates on its long-term debt. The cashflow hedge (gain)/loss on interest rate swaps at balance date was $659,211 (2012: $986,157).
At the reporting date the interest rate profile of the Group’s banking facilities was:
26 FINANCIAL RISK MANAGEMENT
The Group’s activities expose it to a variety of financial risks, market risk (including currency risk and interest rate risk), credit risk and liquidity risk. The Group’s overall risk management programme focuses on the unpredictability of financial markets and seeks to minimise potential adverse effects on the financial performance of the Group. The Group uses derivative financial instruments such as foreign exchange contracts and interest rate swaps to manage certain risk exposures. Derivatives are exclusively used for economic hedging purposes, i.e. not as trading or other speculative instruments, however not all derivative financial instruments qualify for hedge accounting.
Risk management is carried out based on policies approved by the Board of Directors. The Group treasury policy provides written principles for overall risk management, as well as policies covering specific areas, such as foreign exchange risk. The Parent is not directly exposed to any significant financial risk.
(a) Market risk
Foreign exchange risk
The Group operates internationally and is exposed to foreign exchange risk arising from various currency exposures, primarily with respect to the AUD, USD and the GBP. The Group is exposed to currency risk on conversion of the trading results from its subsidiaries operating in Australia and the United Kingdom, and any cash remitted between Australia and the
United Kingdom and New Zealand. The Group does not hedge for such remittances. The Group is exposed to purchases that are denominated in a currency other than the functional currency of Group entities, and over 90% of purchases are denominated in United States dollars. Hedging of this exposure is detailed in note 10. Interest on borrowings is denominated in either New Zealand dollars or Australian dollars, and is paid for out of surplus operating cashflows generated in New Zealand or Australia.
Refer to note 10 which shows the forward foreign exchange contracts held by the Group as derivative financial instruments at balance date. A sensitivity analysis of foreign exchange rate risk on the Group’s financial assets and liabilities is provided in the table below.
Cash flow and fair value interest rate risk
The Group’s main interest rate risk arises from floating rate borrowings drawn down under bank debt facilities. The Group uses interest rate swaps to hedge floating rate borrowings in accordance with the Group treasury policy. Interest rate swaps have the economic effect of converting borrowings from floating to fixed rates.
Refer to note 10 for notional principal amounts and valuations of interest rate swaps outstanding at balance date. A sensitivity analysis of interest rate risk on the Group’s financial assets and liabilities is provided in the table below. Refer to note 17 for further details of the Group’s borrowings.
CARRYING AMOUNT GROUP PARENT2013 2012 2013 2012
NZ$’000 NZ$’000 NZ$’000 NZ$’000
Total secured loans 42,309 53,737 - -
less Principal covered by interest rate swaps (44,972) (45,940) - -
Net Principal subject to floating interest rates*1 (2,663) 7,797 - -
1. Debt levels fluctuate throughout the year and as at 31 July, are typically at a cyclical low.
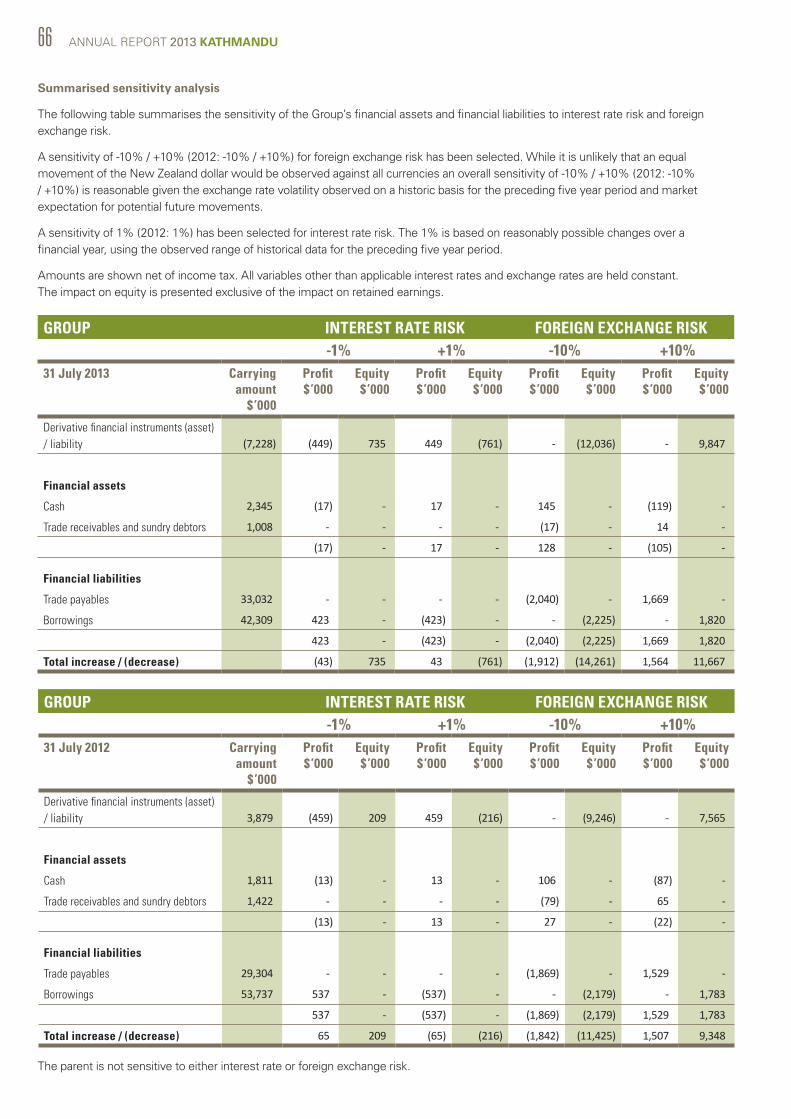
66 ANNUAL REPORT 2013 KATHMANDU
Summarised sensitivity analysis
The following table summarises the sensitivity of the Group’s financial assets and financial liabilities to interest rate risk and foreign exchange risk.
A sensitivity of -10% / +10% (2012: -10% / +10%) for foreign exchange risk has been selected. While it is unlikely that an equal movement of the New Zealand dollar would be observed against all currencies an overall sensitivity of -10% / +10% (2012: -10% / +10%) is reasonable given the exchange rate volatility observed on a historic basis for the preceding five year period and market expectation for potential future movements.
A sensitivity of 1% (2012: 1%) has been selected for interest rate risk. The 1% is based on reasonably possible changes over a financial year, using the observed range of historical data for the preceding five year period.
Amounts are shown net of income tax. All variables other than applicable interest rates and exchange rates are held constant. The impact on equity is presented exclusive of the impact on retained earnings.
The parent is not sensitive to either interest rate or foreign exchange risk.
GROUP INTEREST RATE RISK FOREIGN EXCHANGE RISK-1% +1% -10% +10%
31 July 2013 Carrying amount
$’000
Profit $’000
Equity $’000
Profit $’000
Equity $’000
Profit $’000
Equity $’000
Profit $’000
Equity $’000
Derivative financial instruments (asset) / liability
(7,228)
(449)
735
449
(761)
-
(12,036)
-
9,847
Financial assets
Cash 2,345 (17) - 17 - 145 - (119) -
Trade receivables and sundry debtors 1,008 - - - - (17) - 14 -
(17) - 17 - 128 - (105) -
Financial liabilities
Trade payables 33,032 - - - - (2,040) - 1,669 -
Borrowings 42,309 423 - (423) - - (2,225) - 1,820
423 - (423) - (2,040) (2,225) 1,669 1,820
Total increase / (decrease) (43) 735 43 (761) (1,912) (14,261) 1,564 11,667
GROUP INTEREST RATE RISK FOREIGN EXCHANGE RISK-1% +1% -10% +10%
31 July 2012 Carrying amount
$’000
Profit $’000
Equity $’000
Profit $’000
Equity $’000
Profit $’000
Equity $’000
Profit $’000
Equity $’000
Derivative financial instruments (asset) / liability
3,879
(459)
209
459
(216)
-
(9,246)
-
7,565
Financial assets
Cash 1,811 (13) - 13 - 106 - (87) -
Trade receivables and sundry debtors 1,422 - - - - (79) - 65 -
(13) - 13 - 27 - (22) -
Financial liabilities
Trade payables 29,304 - - - - (1,869) - 1,529 -
Borrowings 53,737 537 - (537) - - (2,179) - 1,783
537 - (537) - (1,869) (2,179) 1,529 1,783
Total increase / (decrease) 65 209 (65) (216) (1,842) (11,425) 1,507 9,348
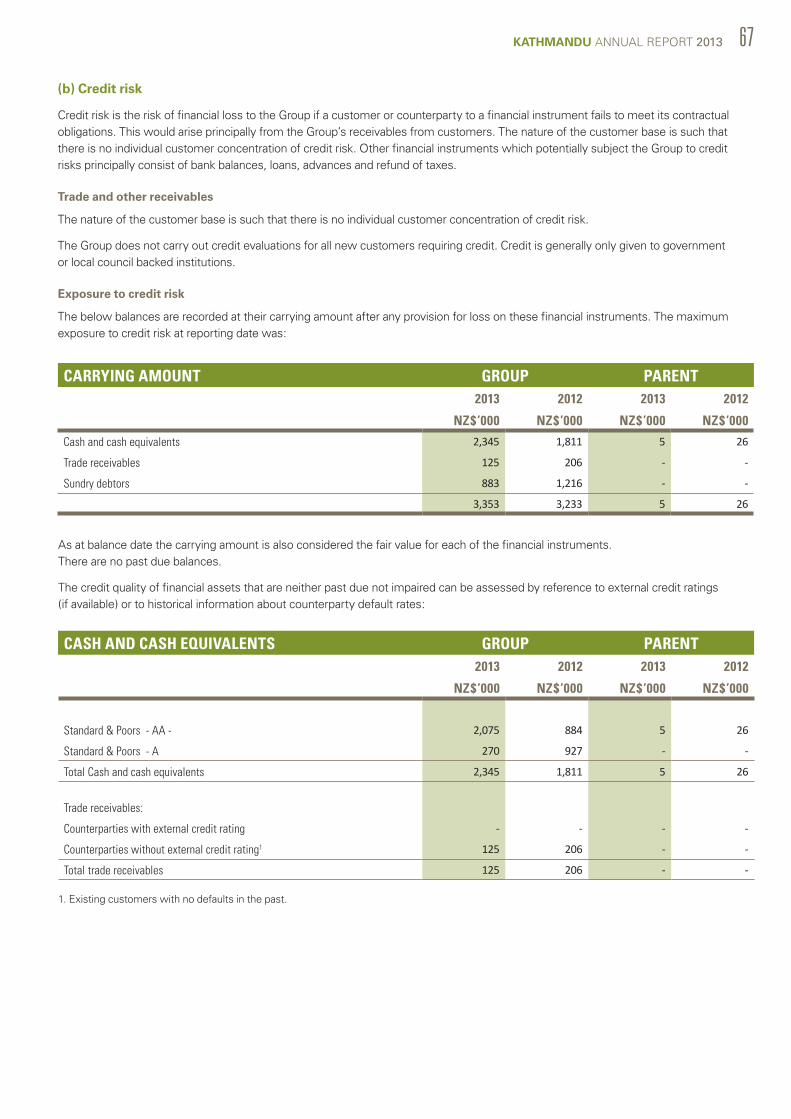
KATHMANDU ANNUAL REPORT 2013 67
(b) Credit risk
Credit risk is the risk of financial loss to the Group if a customer or counterparty to a financial instrument fails to meet its contractual obligations. This would arise principally from the Group’s receivables from customers. The nature of the customer base is such that there is no individual customer concentration of credit risk. Other financial instruments which potentially subject the Group to credit risks principally consist of bank balances, loans, advances and refund of taxes.
Trade and other receivables
The nature of the customer base is such that there is no individual customer concentration of credit risk.
The Group does not carry out credit evaluations for all new customers requiring credit. Credit is generally only given to government or local council backed institutions.
Exposure to credit risk
The below balances are recorded at their carrying amount after any provision for loss on these financial instruments. The maximum exposure to credit risk at reporting date was:
CARRYING AMOUNT GROUP PARENT2013 2012 2013 2012
NZ$’000 NZ$’000 NZ$’000 NZ$’000
Cash and cash equivalents 2,345 1,811 5 26
Trade receivables 125 206 - -
Sundry debtors 883 1,216 - -
3,353 3,233 5 26
As at balance date the carrying amount is also considered the fair value for each of the financial instruments. There are no past due balances.
The credit quality of financial assets that are neither past due not impaired can be assessed by reference to external credit ratings (if available) or to historical information about counterparty default rates:
CASH AND CASH EQUIVALENTS GROUP PARENT2013 2012 2013 2012
NZ$’000 NZ$’000 NZ$’000 NZ$’000
Standard & Poors - AA - 2,075 884 5 26
Standard & Poors - A 270 927 - -
Total Cash and cash equivalents 2,345 1,811 5 26
Trade receivables:
Counterparties with external credit rating - - - -
Counterparties without external credit rating1 125 206 - -
Total trade receivables 125 206 - -
1. Existing customers with no defaults in the past.

68 ANNUAL REPORT 2013 KATHMANDU
The table below analyses the Group’s derivative financial instruments that will be settled on a gross basis into relevant maturity groupings based on the remaining period at the balance date to the contractual maturity date. The amounts disclosed in the table are the contractual undiscounted cash flows. They are expected to occur and affect the profit or loss at various dates between balance date and the following five years.
Less than 1 year
NZ$’000
Between 1 and 2 years
NZ$’000
Between 2 and 5 years
NZ$’000
At 31 July 2013
Forward foreign exchange contracts
-Inflow 115,386 - -
-Outflow (107,499) - -
Net Inflow / (Outflow) 7,887 - -
Net settled derivatives – interest rate swaps
Net Inflow / (Outflow) (470) (270) (102)
At 31 July 2012
Forward foreign exchange contracts
-Inflow 96,243 - -
-Outflow (99,138) - -
Net Inflow / (Outflow) (2,895) - -
Net settled derivatives – interest rate swaps
Net Inflow / (Outflow) (606) (300) (83)
Less than 1 year
NZ$’000
Between 1 and 2 years
NZ$’000
Between 2 and 5 years
NZ$’000
Over 5 years
NZ$’000Group 2013
Trade and other payables 33,032 - - -
Guarantees 13,105 - - -
Borrowings 1,542 1,542 42,914 -47,679 1,542 42,914 -
Group 2012
Trade and other payables 29,304 - - -
Guarantees 13,103 - - -
Borrowings 3,128 3,128 54,932 -45,535 3,128 54,932 -
The Group enters into forward exchange contracts to manage the risks associated with the purchase of foreign currency denominated products.
(c) Liquidity risk
Liquidity risk is the risk that an unforeseen event or miscalculation in the required liquidity level will result in the Group foregoing investment opportunities or not being able to meet its obligations in a timely manner, and therefore gives rise to lower investment income or to higher borrowing costs than normal. Prudent liquidity risk management includes maintaining sufficient cash, and ensuring the availability of funding from adequate amounts of credit facilities.
The Group’s liquidity exposure is managed by ensuring sufficient levels of liquid assets and committed facilities are maintained
based on regular monitoring of cash flow forecasts. The Group
has lending facilities of $130,533,485 / $115,000,000 AUD (2012:
$142,671,855 / $110,000,000 AUD) and operates well within this
facility. This includes short term bank overdraft requirements, and
at balance date no bank accounts were in overdraft.
The table below analyses the Group’s financial liabilities and
net-settled derivative financial liabilities into relevant maturity
groupings based on the remaining period at the balance date to
the contractual maturity date. The amounts disclosed in the table
are the contractual undiscounted cash flows.
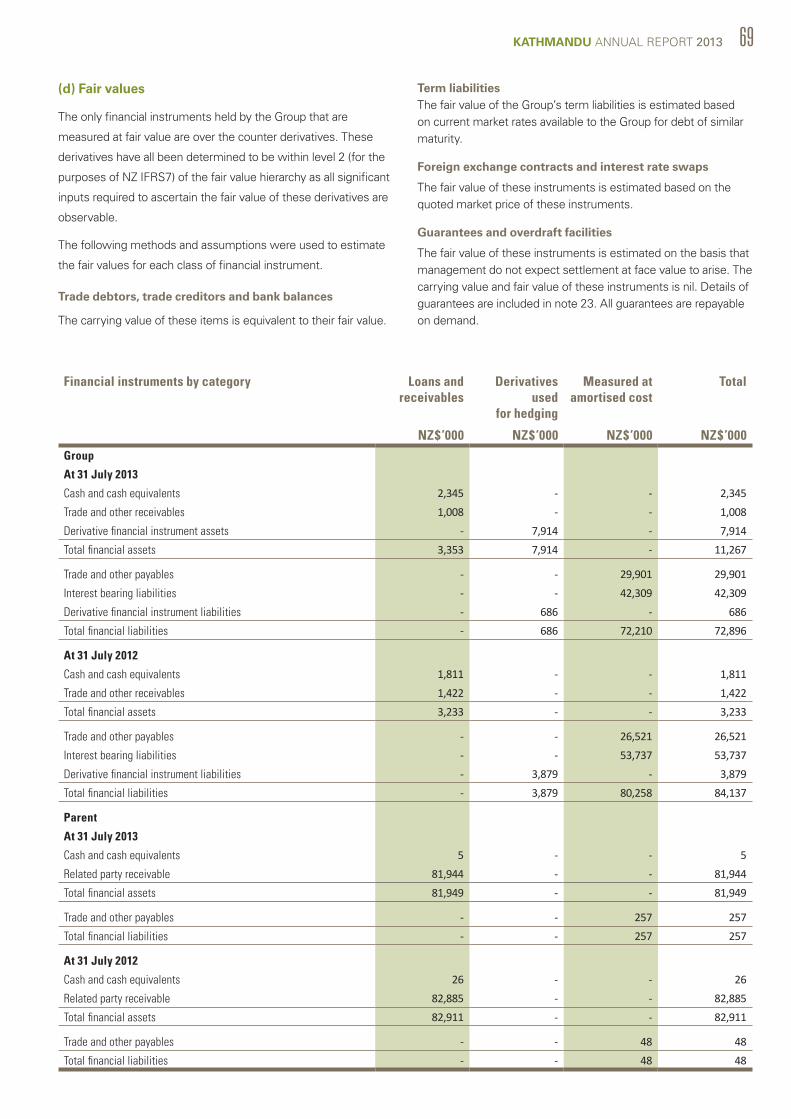
KATHMANDU ANNUAL REPORT 2013 69
Financial instruments by category Loans and receivables
Derivatives used
for hedging
Measured at amortised cost
Total
NZ$’000 NZ$’000 NZ$’000 NZ$’000Group
At 31 July 2013
Cash and cash equivalents 2,345 - - 2,345
Trade and other receivables 1,008 - - 1,008
Derivative financial instrument assets - 7,914 - 7,914
Total financial assets 3,353 7,914 - 11,267
Trade and other payables - - 29,901 29,901
Interest bearing liabilities - - 42,309 42,309
Derivative financial instrument liabilities - 686 - 686
Total financial liabilities - 686 72,210 72,896
At 31 July 2012
Cash and cash equivalents 1,811 - - 1,811
Trade and other receivables 1,422 - - 1,422
Total financial assets 3,233 - - 3,233
Trade and other payables - - 26,521 26,521
Interest bearing liabilities - - 53,737 53,737
Derivative financial instrument liabilities - 3,879 - 3,879
Total financial liabilities - 3,879 80,258 84,137
Parent
At 31 July 2013
Cash and cash equivalents 5 - - 5
Related party receivable 81,944 - - 81,944
Total financial assets 81,949 - - 81,949
Trade and other payables - - 257 257
Total financial liabilities - - 257 257
At 31 July 2012
Cash and cash equivalents 26 - - 26
Related party receivable 82,885 - - 82,885
Total financial assets 82,911 - - 82,911
Trade and other payables - - 48 48
Total financial liabilities - - 48 48
(d) Fair values
The only financial instruments held by the Group that are
measured at fair value are over the counter derivatives. These
derivatives have all been determined to be within level 2 (for the
purposes of NZ IFRS7) of the fair value hierarchy as all significant
inputs required to ascertain the fair value of these derivatives are
observable.
The following methods and assumptions were used to estimate
the fair values for each class of financial instrument.
Trade debtors, trade creditors and bank balances
The carrying value of these items is equivalent to their fair value.
Term liabilitiesThe fair value of the Group’s term liabilities is estimated based on current market rates available to the Group for debt of similar maturity.
Foreign exchange contracts and interest rate swaps
The fair value of these instruments is estimated based on the quoted market price of these instruments.
Guarantees and overdraft facilities
The fair value of these instruments is estimated on the basis that management do not expect settlement at face value to arise. The carrying value and fair value of these instruments is nil. Details of guarantees are included in note 23. All guarantees are repayable on demand.
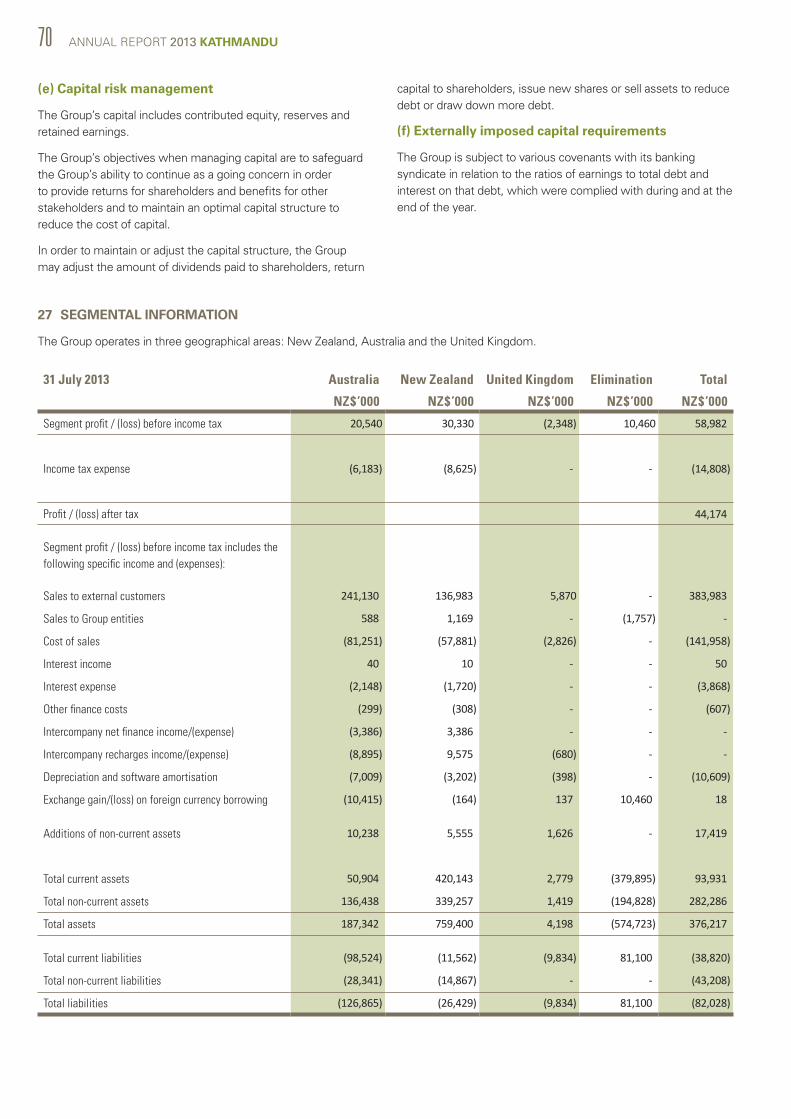
70 ANNUAL REPORT 2013 KATHMANDU
(e) Capital risk management
The Group’s capital includes contributed equity, reserves and retained earnings.
The Group’s objectives when managing capital are to safeguard the Group’s ability to continue as a going concern in order to provide returns for shareholders and benefits for other stakeholders and to maintain an optimal capital structure to reduce the cost of capital.
In order to maintain or adjust the capital structure, the Group may adjust the amount of dividends paid to shareholders, return
capital to shareholders, issue new shares or sell assets to reduce debt or draw down more debt.
(f) Externally imposed capital requirements
The Group is subject to various covenants with its banking syndicate in relation to the ratios of earnings to total debt and interest on that debt, which were complied with during and at the end of the year.
27 SEGMENTAL INFORMATION
The Group operates in three geographical areas: New Zealand, Australia and the United Kingdom.
31 July 2013 Australia New Zealand United Kingdom Elimination Total
NZ$’000 NZ$’000 NZ$’000 NZ$’000 NZ$’000
Segment profit / (loss) before income tax 20,540 30,330 (2,348) 10,460 58,982)
Income tax expense (6,183) (8,625) - - (14,808)
Profit / (loss) after tax 44,174)
Segment profit / (loss) before income tax includes the following specific income and (expenses):
Sales to external customers 241,130 136,983 5,870 - 383,983
Sales to Group entities 588 1,169 - (1,757) -
Cost of sales (81,251) (57,881) (2,826) - (141,958)
Interest income 40 10 - - 50
Interest expense (2,148) (1,720) - - (3,868)
Other finance costs (299) (308) - - (607)
Intercompany net finance income/(expense) (3,386) 3,386 - - -
Intercompany recharges income/(expense) (8,895) 9,575 (680) - -
Depreciation and software amortisation (7,009) (3,202) (398) - (10,609)
Exchange gain/(loss) on foreign currency borrowing (10,415) (164) 137 10,460 18
Additions of non-current assets 10,238 5,555 1,626 - 17,419
Total current assets 50,904 420,143 2,779 (379,895) 93,931
Total non-current assets 136,438 339,257 1,419 (194,828) 282,286
Total assets 187,342 759,400 4,198 (574,723) 376,217
Total current liabilities (98,524) (11,562) (9,834) 81,100 (38,820)
Total non-current liabilities (28,341) (14,867) - - (43,208)
Total liabilities (126,865) (26,429) (9,834) 81,100 (82,028)
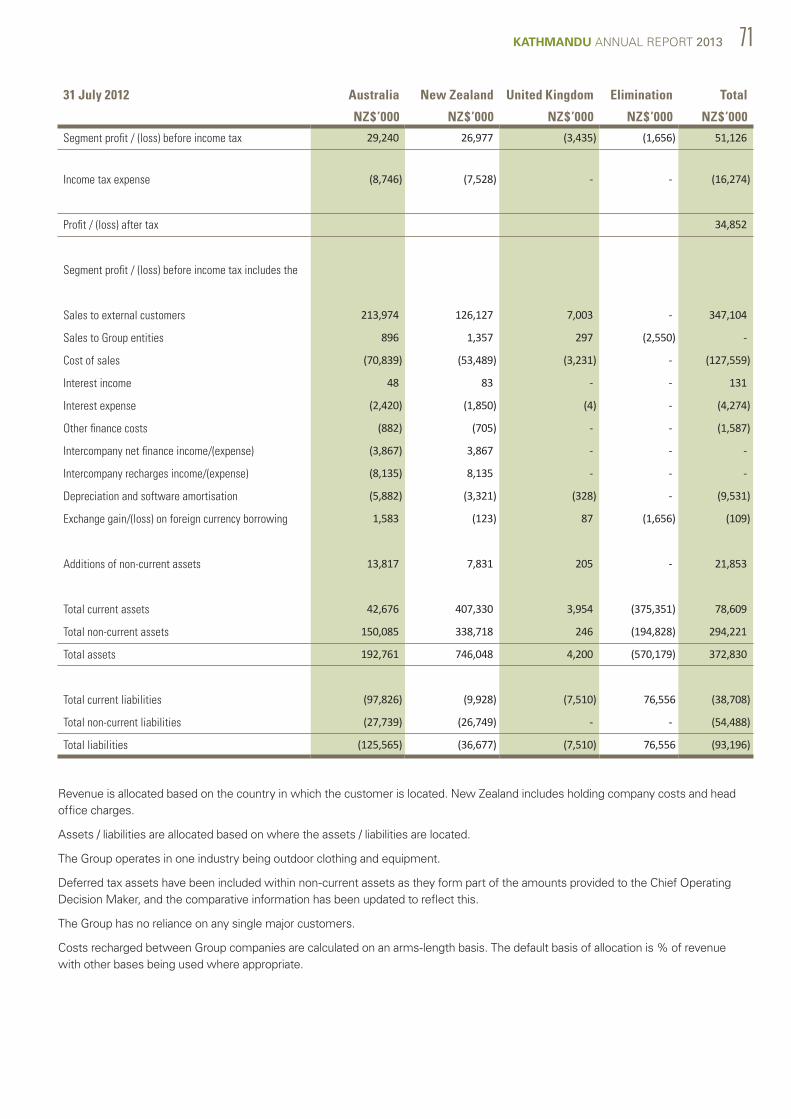
KATHMANDU ANNUAL REPORT 2013 71
31 July 2012 Australia New Zealand United Kingdom Elimination Total
NZ$’000 NZ$’000 NZ$’000 NZ$’000 NZ$’000
Segment profit / (loss) before income tax 29,240 26,977 (3,435) (1,656) 51,126
Income tax expense (8,746) (7,528) - - (16,274)
Profit / (loss) after tax 34,852
Segment profit / (loss) before income tax includes the
Sales to external customers 213,974 126,127 7,003 - 347,104
Sales to Group entities 896 1,357 297 (2,550) -
Cost of sales (70,839) (53,489) (3,231) - (127,559)
Interest income 48 83 - - 131
Interest expense (2,420) (1,850) (4) - (4,274)
Other finance costs (882) (705) - - (1,587)
Intercompany net finance income/(expense) (3,867) 3,867 - - -
Intercompany recharges income/(expense) (8,135) 8,135 - - -
Depreciation and software amortisation (5,882) (3,321) (328) - (9,531)
Exchange gain/(loss) on foreign currency borrowing 1,583 (123) 87 (1,656) (109)
Additions of non-current assets 13,817 7,831 205 - 21,853
Total current assets 42,676 407,330 3,954 (375,351) 78,609
Total non-current assets 150,085 338,718 246 (194,828) 294,221
Total assets 192,761 746,048 4,200 (570,179) 372,830
Total current liabilities (97,826) (9,928) (7,510) 76,556 (38,708)
Total non-current liabilities (27,739) (26,749) - - (54,488)
Total liabilities (125,565) (36,677) (7,510) 76,556 (93,196)
Revenue is allocated based on the country in which the customer is located. New Zealand includes holding company costs and head office charges.
Assets / liabilities are allocated based on where the assets / liabilities are located.
The Group operates in one industry being outdoor clothing and equipment.
Deferred tax assets have been included within non-current assets as they form part of the amounts provided to the Chief Operating Decision Maker, and the comparative information has been updated to reflect this.
The Group has no reliance on any single major customers.
Costs recharged between Group companies are calculated on an arms-length basis. The default basis of allocation is % of revenue with other bases being used where appropriate.
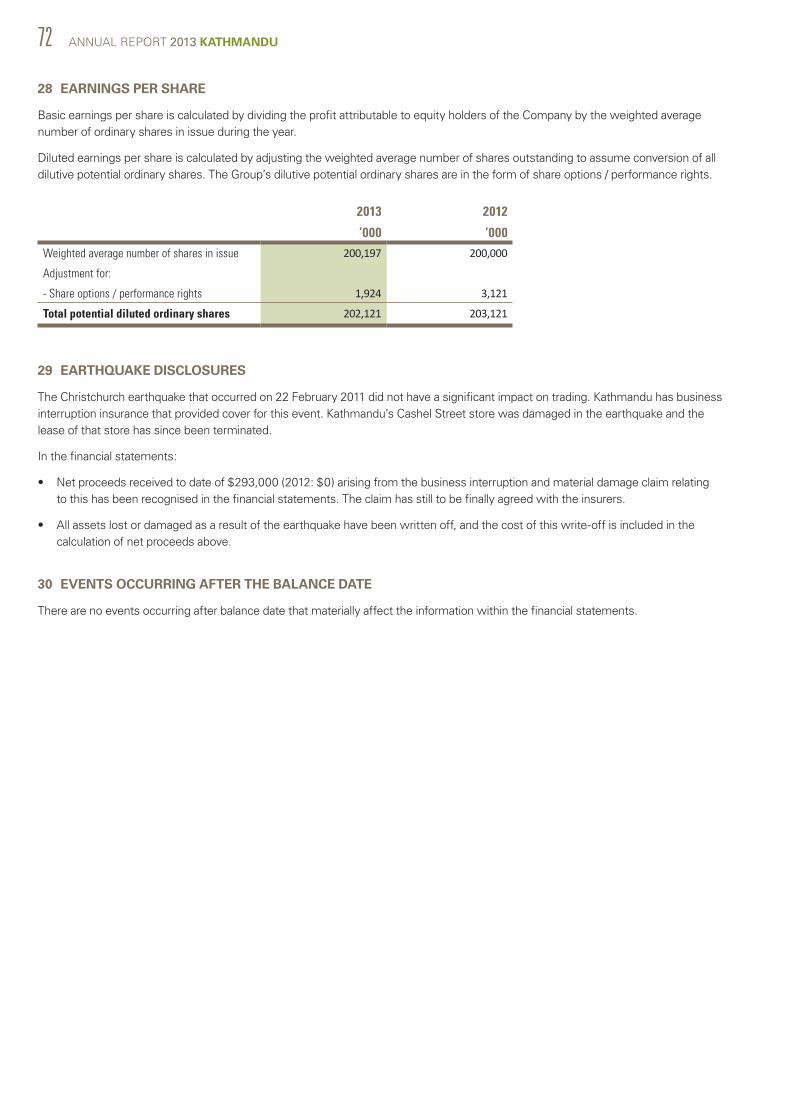
72 ANNUAL REPORT 2013 KATHMANDU
28 EARNINGS PER SHARE
Basic earnings per share is calculated by dividing the profit attributable to equity holders of the Company by the weighted average number of ordinary shares in issue during the year.
Diluted earnings per share is calculated by adjusting the weighted average number of shares outstanding to assume conversion of all dilutive potential ordinary shares. The Group’s dilutive potential ordinary shares are in the form of share options / performance rights.
29 EARTHQUAKE DISCLOSURES
The Christchurch earthquake that occurred on 22 February 2011 did not have a significant impact on trading. Kathmandu has business interruption insurance that provided cover for this event. Kathmandu’s Cashel Street store was damaged in the earthquake and the lease of that store has since been terminated.
In the financial statements:
• Net proceeds received to date of $293,000 (2012: $0) arising from the business interruption and material damage claim relating to this has been recognised in the financial statements. The claim has still to be finally agreed with the insurers.
• All assets lost or damaged as a result of the earthquake have been written off, and the cost of this write-off is included in the calculation of net proceeds above.
30 EVENTS OCCURRING AFTER THE BALANCE DATE
There are no events occurring after balance date that materially affect the information within the financial statements.
2013 2012
’000 ’000Weighted average number of shares in issue 200,197 200,000
Adjustment for:
- Share options / performance rights 1,924 3,121
Total potential diluted ordinary shares 202,121 203,121
KATHMANDU ANNUAL REPORT 2013 73
74 ANNUAL REPORT 2013 KATHMANDU
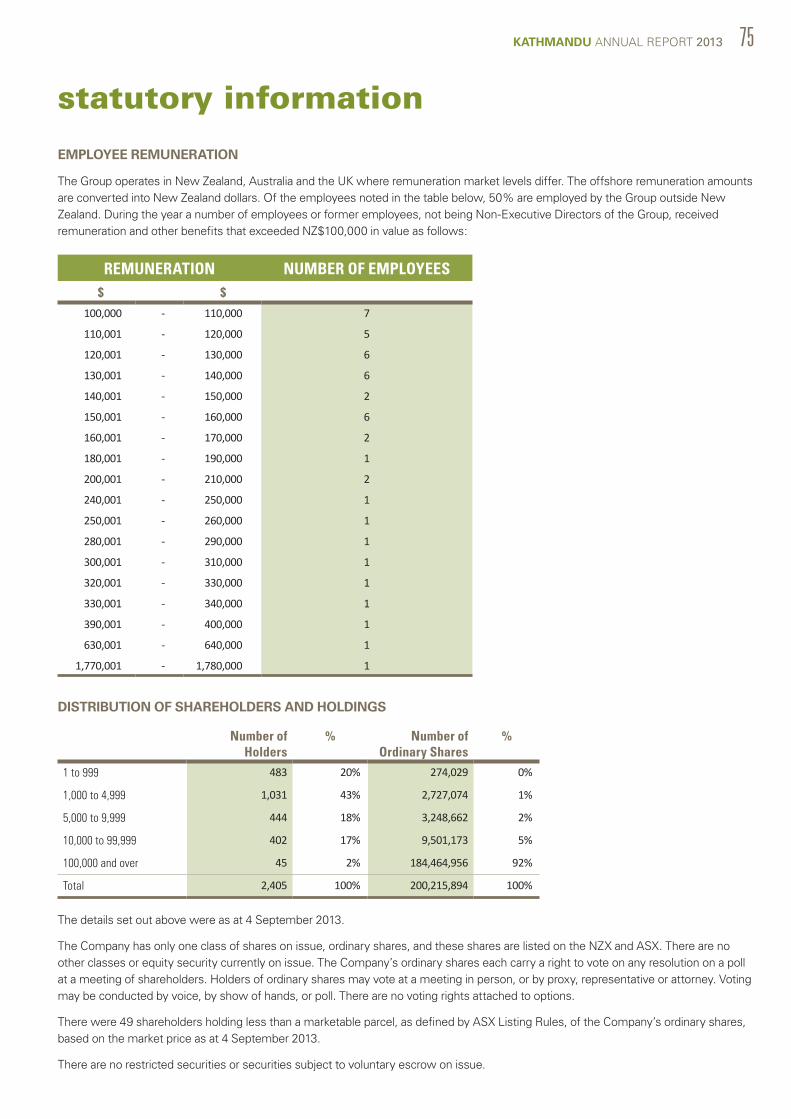
KATHMANDU ANNUAL REPORT 2013 75
statutory information
REMUNERATION NUMBER OF EMPLOYEES $ $
100,000 - 110,000 7
110,001 - 120,000 5
120,001 - 130,000 6
130,001 - 140,000 6
140,001 - 150,000 2
150,001 - 160,000 6
160,001 - 170,000 2
180,001 - 190,000 1
200,001 - 210,000 2
240,001 - 250,000 1
250,001 - 260,000 1
280,001 - 290,000 1
300,001 - 310,000 1
320,001 - 330,000 1
330,001 - 340,000 1
390,001 - 400,000 1
630,001 - 640,000 1
1,770,001 - 1,780,000 1
DISTRIBUTION OF SHAREHOLDERS AND HOLDINGS
Number of Holders
% Number of Ordinary Shares
%
1 to 999 483 20% 274,029 0%
1,000 to 4,999 1,031 43% 2,727,074 1%
5,000 to 9,999 444 18% 3,248,662 2%
10,000 to 99,999 402 17% 9,501,173 5%
100,000 and over 45 2% 184,464,956 92%
Total 2,405 100% 200,215,894 100%
EMPLOYEE REMUNERATION
The Group operates in New Zealand, Australia and the UK where remuneration market levels differ. The offshore remuneration amounts are converted into New Zealand dollars. Of the employees noted in the table below, 50% are employed by the Group outside New Zealand. During the year a number of employees or former employees, not being Non-Executive Directors of the Group, received remuneration and other benefits that exceeded NZ$100,000 in value as follows:
The details set out above were as at 4 September 2013.
The Company has only one class of shares on issue, ordinary shares, and these shares are listed on the NZX and ASX. There are no other classes or equity security currently on issue. The Company’s ordinary shares each carry a right to vote on any resolution on a poll at a meeting of shareholders. Holders of ordinary shares may vote at a meeting in person, or by proxy, representative or attorney. Voting may be conducted by voice, by show of hands, or poll. There are no voting rights attached to options.
There were 49 shareholders holding less than a marketable parcel, as defined by ASX Listing Rules, of the Company’s ordinary shares, based on the market price as at 4 September 2013.
There are no restricted securities or securities subject to voluntary escrow on issue.

76 ANNUAL REPORT 2013 KATHMANDU
LIMITATIONS ON THE ACQUISITION OF SECURITIES
The Company is not subject to Chapters 6, 6A, 6B and 6C of the Corporations Act 2001 (Australia) dealing with the acquisition of shares (i.e. substantial holdings and takeovers).
Limitations on the acquisition of the securities imposed by the jurisdiction in which the Company is incorporated (New Zealand) are:
a. In general, securities in the Company are freely transferable and the only significant restrictions or limitations in relation to the acquisition of securities are those imposed by New Zealand laws relating to takeovers, overseas investment and competition.
b. The New Zealand Takeovers Code creates a general rule under which the acquisition of 20% or more of the voting rights in the Company or the increase of an existing holding of 20% or more of the voting rights of the Company can only occur in certain permitted ways. These include a full takeover offer in accordance with the Takeovers Code, a partial takeover offer in accordance with the Takeovers Code, an acquisition approved by an ordinary resolution, an allotment approved by an ordinary resolution, a creeping acquisition (in certain circumstances) or compulsory acquisition of a shareholder holds 90% or more of the shares of the Company.
c. The New Zealand Overseas Investment Act 2005 and Overseas Investment Regulations 2005 (New Zealand) regulate certain investments in New Zealand by overseas persons. In general terms, the consent of the New Zealand Overseas Investment Office is likely to be required where an “overseas person” acquires shares in the Company that amount to 25% or more of the shares issued by the Company, or if the overseas person already holds 25% or more, the acquisition increases that holding.
d. The New Zealand Commerce Act 1986 is likely to prevent a person from acquiring shares in the Company if the acquisition would have, or would be likely to have, the effect of substantially lessening competition in the market.
SUBSTANTIAL SECURITY HOLDERS
According to notices given under the Securities Markets Act 1988 (New Zealand), the substantial security holders in ordinary shares (being the only class of listed voting securities) of the Company and their relevant interests according to the substantial security holder file as at 4 September 2013, were as follows:
Ordinary shares %
Commonwealth Bank of Australia (8 April 2013) 16,609,706 8.3%
National Australia Bank (9 July 2013) 13,050,566 6.5%
Accident Compensation Corporation (4 September 2013) 11,970,983 6.0%
Milford Asset Management Limited (3 September 2013) 11,698,194 5.8%
FMR LLC and FIL Limited (11 April 2013) 11,287,339 5.6%
Fisher Funds Management Limited (9 July 2013) 10,447,023 5.2%
AMP (4 September 2013) 10,113,837 5.1%
Australian Super Pty Limited (5 July 2013) 10,110,349 5.0%
As at 4 September 2013, the Company had 200,215,894 ordinary shares on issue.

KATHMANDU ANNUAL REPORT 2013 77
Name Ordinary Shares %
1 NEW ZEALAND CENTRAL SECURITIES DEPOSITORY LIMITED 63,639,562 31.79%
2 J P MORGAN NOMINEES AUSTRALIA LIMITED 37,998,867 18.98%
3 NATIONAL NOMINEES LIMITED 35,689,764 17.83%
4 CITICORP NOMINEES PTY LIMITED 12,981,895 6.48%
5 HSBC CUSTODY NOMINEES (AUSTRALIA) LIMITED 6,607,257 3.30%
6 J P MORGAN NOMINEES AUSTRALIA LIMITED 4,083,395 2.04%
7 CITICORP NOMINEES PTY LIMITED 3,404,614 1.70%
8 RBC INVESTOR SERVICES – AUSTRALIA NOMINEES PTY LIMITED 3,345,901 1.67%
9 BNP PARIBAS NOMS PTY LTD 2,387,090 1.19%
10 FNZ CUSTODIANS LIMITED 1,733,685 0.87%
11 BNP PARIBAS NOMS (NZ) LTD 1,674,561 0.84%
12 PETER HALKETT 1,485,518 0.72%
13 NEW ZEALAND DEPOSITORY NOMINEE LIMITED 949,575 0.47%
14 INVESTMENT CUSTODIAL SERVICES LIMITED 908,902 0.45%
15 RBC INVESTOR SERVICES – AUSTRALIA NOMINEES PTY LIMITED 841,252 0.42%
16 FRANED PTY LIMITED 717,600 0.36%
17 GOLDMAN SACHS AUSTRALIA PTY LTD 428,819 0.21%
18 QIC LIMITED 407,790 0.20%
19 BAINPRO NOMINEES PTY LIMITED 341,374 0.17%
20 ABN AMRO CLEARING SYDNEY – NOMINEES PTY LIMITED 338,261 0.17%
DIRECTORS’ SHAREHOLDINGS
Directors held interests in the following shares of the Company at 31 July 2013:
Peter Halkett beneficially owned 1,485,518
Mark Todd beneficially owned 370,480
not beneficially owned 43,437
John Harvey beneficially owned 51,563
John Holland beneficially owned 102,033
Sandra McPhee beneficially owned 58,823
PRINCIPAL SHAREHOLDERS
The names and holdings of the twenty largest shareholders as at 4 September 2013 were:
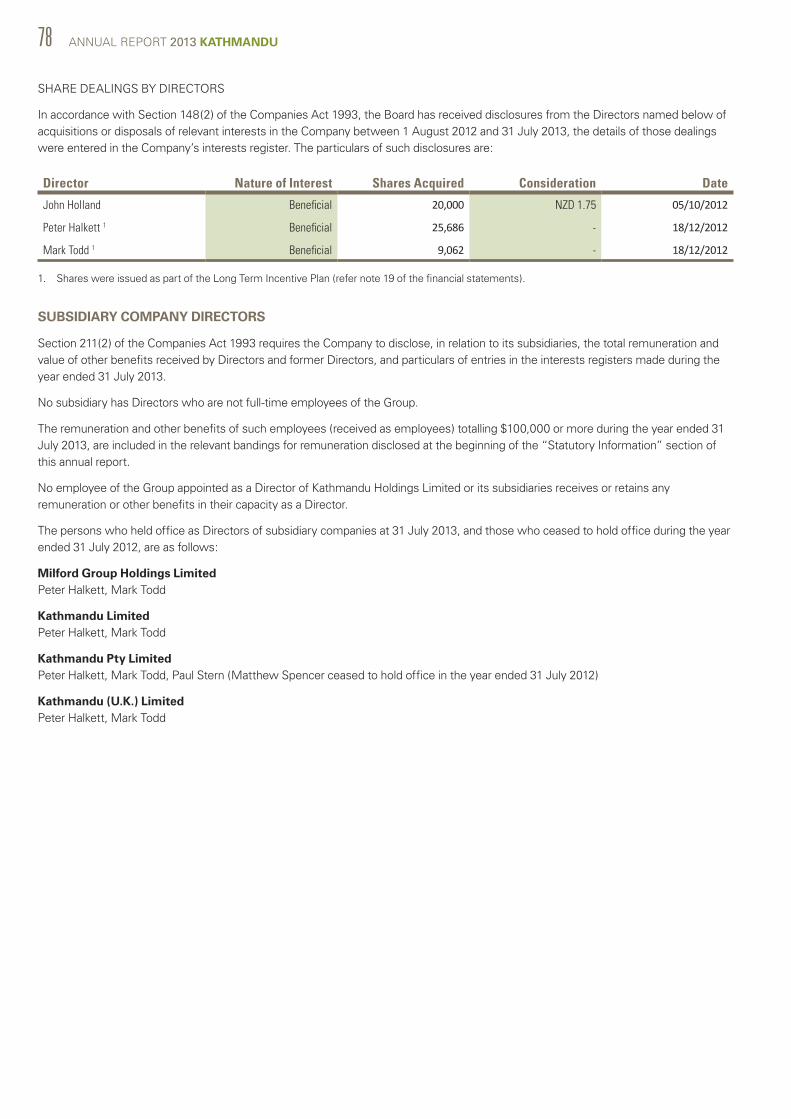
78 ANNUAL REPORT 2013 KATHMANDU
SHARE DEALINGS BY DIRECTORS
In accordance with Section 148(2) of the Companies Act 1993, the Board has received disclosures from the Directors named below of acquisitions or disposals of relevant interests in the Company between 1 August 2012 and 31 July 2013, the details of those dealings were entered in the Company’s interests register. The particulars of such disclosures are:
Director Nature of Interest Shares Acquired Consideration Date
John Holland Beneficial 20,000 NZD 1.75 05/10/2012
Peter Halkett 1 Beneficial 25,686 - 18/12/2012
Mark Todd 1 Beneficial 9,062 - 18/12/2012
1. Shares were issued as part of the Long Term Incentive Plan (refer note 19 of the financial statements).
SUBSIDIARY COMPANY DIRECTORS
Section 211(2) of the Companies Act 1993 requires the Company to disclose, in relation to its subsidiaries, the total remuneration and value of other benefits received by Directors and former Directors, and particulars of entries in the interests registers made during the year ended 31 July 2013.
No subsidiary has Directors who are not full-time employees of the Group.
The remuneration and other benefits of such employees (received as employees) totalling $100,000 or more during the year ended 31 July 2013, are included in the relevant bandings for remuneration disclosed at the beginning of the “Statutory Information” section of this annual report.
No employee of the Group appointed as a Director of Kathmandu Holdings Limited or its subsidiaries receives or retains any remuneration or other benefits in their capacity as a Director.
The persons who held office as Directors of subsidiary companies at 31 July 2013, and those who ceased to hold office during the year ended 31 July 2012, are as follows:
Milford Group Holdings Limited Peter Halkett, Mark Todd
Kathmandu Limited Peter Halkett, Mark Todd
Kathmandu Pty Limited Peter Halkett, Mark Todd, Paul Stern (Matthew Spencer ceased to hold office in the year ended 31 July 2012)
Kathmandu (U.K.) Limited Peter Halkett, Mark Todd
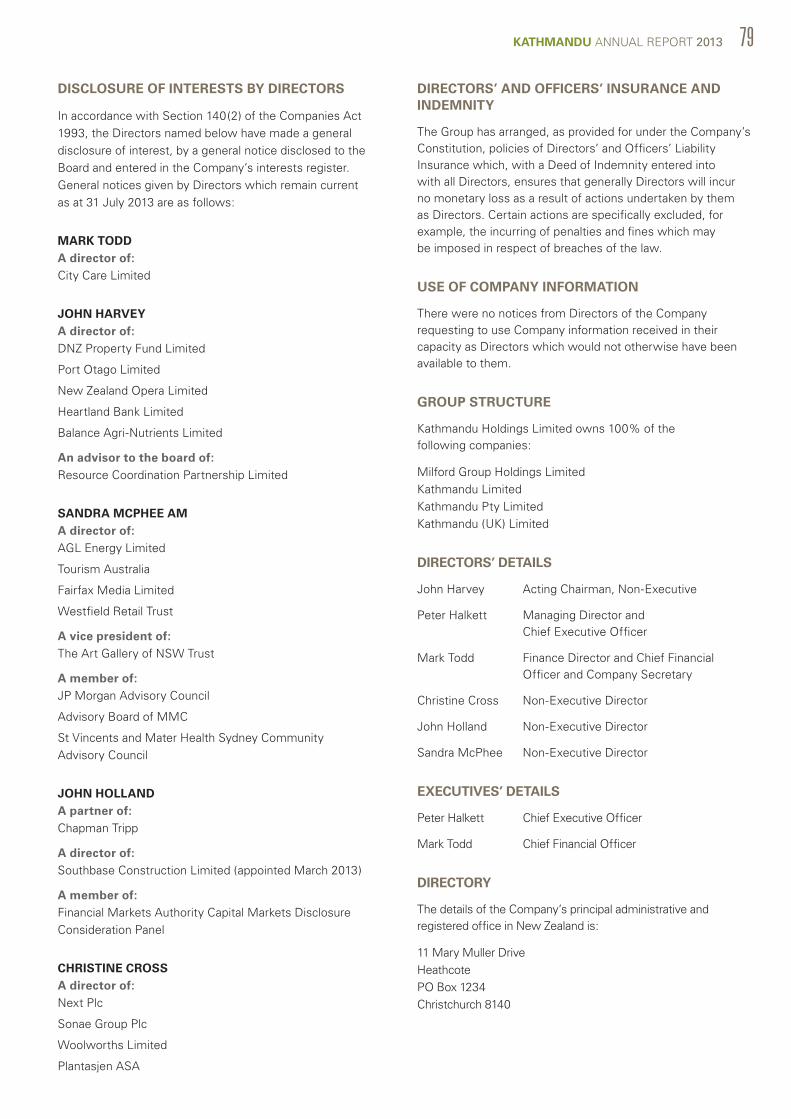
KATHMANDU ANNUAL REPORT 2013 79
DISCLOSURE OF INTERESTS BY DIRECTORS
In accordance with Section 140(2) of the Companies Act 1993, the Directors named below have made a general disclosure of interest, by a general notice disclosed to the Board and entered in the Company’s interests register. General notices given by Directors which remain current as at 31 July 2013 are as follows:
MARK TODD A director of: City Care Limited
JOHN HARVEY A director of: DNZ Property Fund Limited
Port Otago Limited
New Zealand Opera Limited
Heartland Bank Limited
Balance Agri-Nutrients Limited
An advisor to the board of: Resource Coordination Partnership Limited
SANDRA MCPHEE AM A director of: AGL Energy Limited
Tourism Australia
Fairfax Media Limited
Westfield Retail Trust
A vice president of: The Art Gallery of NSW Trust
A member of: JP Morgan Advisory Council
Advisory Board of MMC
St Vincents and Mater Health Sydney Community Advisory Council
JOHN HOLLAND A partner of: Chapman Tripp
A director of: Southbase Construction Limited (appointed March 2013)
A member of: Financial Markets Authority Capital Markets Disclosure Consideration Panel
CHRISTINE CROSS A director of: Next Plc
Sonae Group Plc
Woolworths Limited
Plantasjen ASA
DIRECTORS’ AND OFFICERS’ INSURANCE AND INDEMNITY
The Group has arranged, as provided for under the Company’s Constitution, policies of Directors’ and Officers’ Liability Insurance which, with a Deed of Indemnity entered into with all Directors, ensures that generally Directors will incur no monetary loss as a result of actions undertaken by them as Directors. Certain actions are specifically excluded, for example, the incurring of penalties and fines which may be imposed in respect of breaches of the law.
USE OF COMPANY INFORMATION
There were no notices from Directors of the Company requesting to use Company information received in their capacity as Directors which would not otherwise have been available to them.
GROUP STRUCTURE
Kathmandu Holdings Limited owns 100% of the following companies:
Milford Group Holdings Limited Kathmandu Limited Kathmandu Pty Limited Kathmandu (UK) Limited
DIRECTORS’ DETAILS
John Harvey Acting Chairman, Non-Executive
Peter Halkett Managing Director and Chief Executive Officer
Mark Todd Finance Director and Chief Financial Officer and Company Secretary
Christine Cross Non-Executive Director
John Holland Non-Executive Director
Sandra McPhee Non-Executive Director
EXECUTIVES’ DETAILS
Peter Halkett Chief Executive Officer
Mark Todd Chief Financial Officer
DIRECTORY
The details of the Company’s principal administrative and registered office in New Zealand is:
11 Mary Muller Drive Heathcote PO Box 1234 Christchurch 8140
80 ANNUAL REPORT 2013 KATHMANDU
SHARE REGISTRY
In New Zealand: Link Market Services (LINK)
Physical Address: Level 16, Brookfields House, 19 Victoria Street West, Auckland 1010 New Zealand
Postal Address: PO Box 91976, Auckland, 1142 New Zealand
Telephone: +64 9 375 5999
Investor enquiries: +64 9 375 5998
Facsimile: +64 9 375 5990
Internet address: www.linkmarketservices.com
In Australia: Link Market Services (LINK)
Physical Address: Level 1, 333 Collins Street
Melbourne, VIC 3000
Australia
Postal Address: Locked Bag A14
Sydney, South NSW 1235
Australia
Telephone: +61 2 8280 7111
Investor enquiries: +61 2 8280 7111
Facsimile: +61 2 9287 0303
Internet address: www.linkmarketservices.com.au
STOCK EXCHANGES
The Company’s shares are listed on the NZX and the ASX.
INCORPORATION
The Company is incorporated in New Zealand.
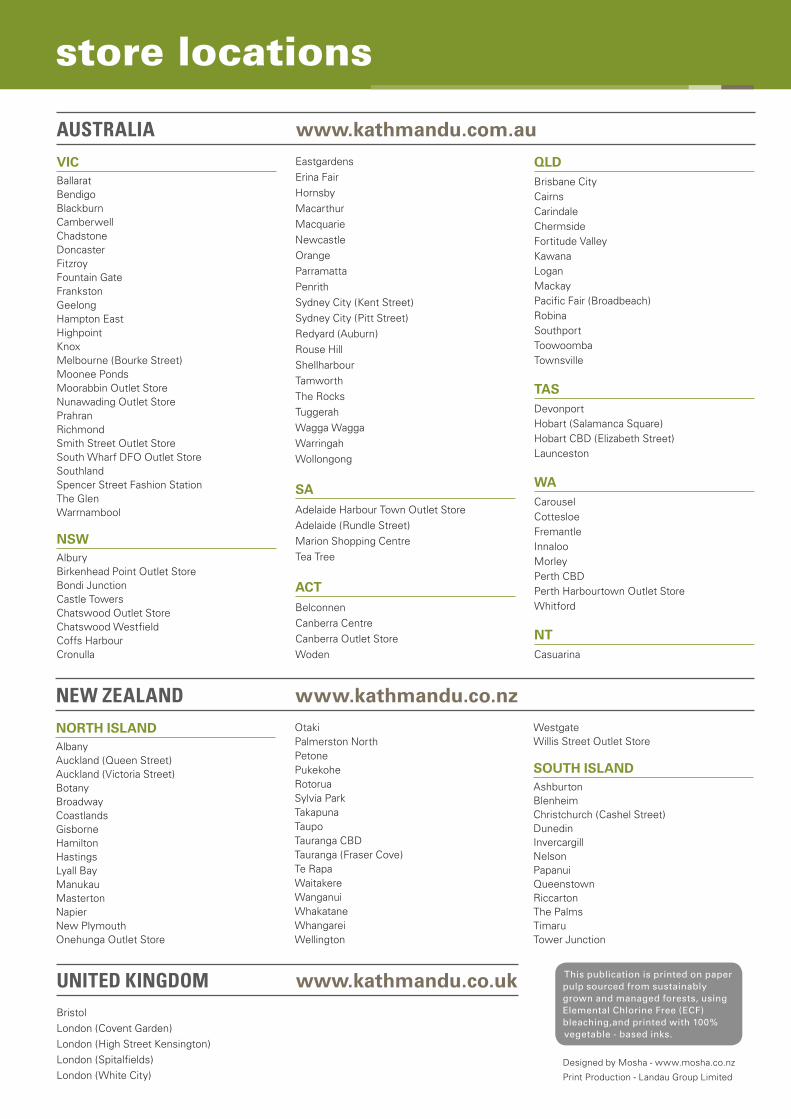
Designed by Mosha - www.mosha.co.nz
Print Production - Landau Group Limited
AUSTRALIA www.kathmandu.com.au
VICBallaratBendigoBlackburnCamberwell ChadstoneDoncasterFitzroyFountain GateFrankston GeelongHampton EastHighpointKnoxMelbourne (Bourke Street)Moonee PondsMoorabbin Outlet StoreNunawading Outlet StorePrahranRichmondSmith Street Outlet StoreSouth Wharf DFO Outlet StoreSouthland Spencer Street Fashion StationThe Glen Warrnambool
NSWAlburyBirkenhead Point Outlet StoreBondi JunctionCastle TowersChatswood Outlet StoreChatswood Westfield Coffs HarbourCronulla
Eastgardens Erina FairHornsbyMacarthurMacquarieNewcastleOrangeParramatta Penrith Sydney City (Kent Street)Sydney City (Pitt Street)Redyard (Auburn)Rouse HillShellharbourTamworthThe RocksTuggerahWagga Wagga WarringahWollongong
SAAdelaide Harbour Town Outlet StoreAdelaide (Rundle Street)Marion Shopping CentreTea Tree
ACTBelconnenCanberra CentreCanberra Outlet StoreWoden
QLDBrisbane CityCairnsCarindaleChermsideFortitude ValleyKawanaLoganMackayPacific Fair (Broadbeach)RobinaSouthport ToowoombaTownsville
TASDevonportHobart (Salamanca Square)Hobart CBD (Elizabeth Street)Launceston
WACarouselCottesloeFremantle InnalooMorleyPerth CBDPerth Harbourtown Outlet Store Whitford
NTCasuarina
store locations
NORTH ISLANDAlbanyAuckland (Queen Street)Auckland (Victoria Street)BotanyBroadwayCoastlandsGisborneHamiltonHastingsLyall BayManukau MastertonNapierNew PlymouthOnehunga Outlet Store
OtakiPalmerston NorthPetonePukekohe RotoruaSylvia ParkTakapunaTaupoTauranga CBDTauranga (Fraser Cove)Te RapaWaitakereWanganuiWhakataneWhangareiWellington
Westgate Willis Street Outlet Store
SOUTH ISLANDAshburtonBlenheimChristchurch (Cashel Street)DunedinInvercargillNelsonPapanuiQueenstownRiccartonThe PalmsTimaruTower Junction
NEW ZEALAND www.kathmandu.co.nz
BristolLondon (Covent Garden)London (High Street Kensington)London (Spitalfields)London (White City)
UNITED KINGDOM www.kathmandu.co.uk This publication is printed on paper pulp sourced from sustainably grown and managed forests, using Elemental Chlorine Free (ECF) bleaching,and printed with 100% vegetable - based inks.

KATHMANDU HOLDINGS LIMITED
ANNUAL REPORT 2013
www.kathmanduholdings.com