ANNUAL REPORT 2010 - Kathmandu Investor Centre · 2 KATHMANDU HOLDINGS LIMITED ANNUAL REPORT 2010...
80
ANNUAL REPORT 2010
Transcript of ANNUAL REPORT 2010 - Kathmandu Investor Centre · 2 KATHMANDU HOLDINGS LIMITED ANNUAL REPORT 2010...

ANNUAL REPORT
2010


KATHMANDU HOLDINGS LIMITED ANNUAL REPORT 2010 1
CONTENTS
Chairman’s Report 2
Highlights For The Year 4
Chief Executive’s Report 6
Board 10
Management Team 11
Directors’ Report 13
Corporate Governance 21
Auditor’s Independence Declaration 23
Financial Statements 25
Statutory Information 70
Share Registry 76
NOTICE OF ANNUAL GENERAL MEETING
11.00am Wednesday 24 November 2010Wesley Conference Centre,220 Pitt StreetSydney, NSWAUSTRALIA
2 KATHMANDU HOLDINGS LIMITED ANNUAL REPORT 2010
CHAIRMAN’S REPORT
I am pleased to report for the first year as Chairman of Kathmandu Holdings Limited, after our listing on the ASX and NZX on 13 November 2009. Kathmandu Holdings Limited last year successfully issued 200 million shares for a total value of $NZ426 million. The funds from the share offer were primarily used to acquire the Kathmandu business from its previous shareholders, and to pay down in part the bank debt owed by Kathmandu prior to the listing. The Initial Public Offer (“IPO”) of shares was well supported on both sides of the Tasman, and it provided the opportunity for investors to participate in the ownership of Australasia’s leading retailer of clothing and equipment for travel and adventure.
Given the background of the global financial crisis, in recent years it has been very challenging to complete a successful capital raising for a new company in Australia or New Zealand. The successful conclusion of the IPO involved numerous key advisers and in particular the role of the joint lead managers, Goldman Sachs JB Were and Macquarie Capital Advisers, was pivotal to this outcome. The offer was particularly well supported by Australasian institutional shareholders, and most of the substantial initial investors remain on our share register today.
A primary reason for the difficulty in attracting investors to new listings on the ASX and NZX has been the economic environment that has existed in Australia and New Zealand, and in general internationally, since the global financial crisis hit hardest in the last half of 2008. This environment has had an ongoing negative impact on consumer confidence throughout 2009 and 2010. It is now clear that without government support measures for the economy, primarily in Australia, the downturn in consumer spending would have been even greater than that experienced by retailers over this period. Discretionary retailers such as Kathmandu have thus had a very challenging year, and at this point there still remains considerable uncertainty as to whether the global economy has fully turned the corner.
Financial Results
The key financial highlights for the year ended 31 July 2010 were growth in sales by 14% to $245.8 million and a 12.4% increase in earnings before interest and tax to $47.9 million, after eliminating the one-off costs associated with the IPO. Reporting on this year’s trading is made complicated by the IPO which materially changed both capital structure and
the makeup of certain key expenses, both year on year and before and after the IPO. Earnings were approximately 6% short of our prospectus forecast, but profitability continued to grow, and the overall result was still a very creditable performance.
Board and Corporate Governance
A new Board of Directors was appointed in conjunction with the IPO, and the Board members have a broad range of appropriate experience required to oversee Kathmandu’s growth in its initial years as a listed company. Amongst the matters which the Board has focused on in our initial period of operation has been the establishment and ongoing monitoring of key corporate governance policies and practices. The alignment of Board expectations with management and business practice when a new Board or ownership structure is introduced to an organisation is always challenging. In this instance, the Board and management team at Kathmandu have worked closely together to apply appropriate standards and process as a listed company, and it is very pleasing that the transition from private equity ownership has been undertaken competently and successfully. I thank all of the Board members for their commitment and support during our first year.
The Board has also focused on the implementation of an appropriate long term remuneration structure for Kathmandu Executives and its wider senior management team. As a dual listed company we have an excellent opportunity to properly align our remuneration framework with the overriding objective of maximising shareholder value. The work we have undertaken will result in a revised long term employee incentive plan to be put forward for shareholder approval at the forthcoming annual general meeting.
Dividend
Given the substantial improvement in operating cashflow during the year, the Directors are recommending an initial dividend of 7 cents per share, which is higher than the 6.7 cents per share projected in the IPO prospectus. The dividend will be fully imputed for New Zealand shareholders, and fully franked for Australian shareholders.
James StrongChairman

KATHMANDU HOLDINGS LIMITED ANNUAL REPORT 2010 3
This dividend represents a payout ratio of 55% (after adjusting for IPO costs and their associated tax deductions), and the Board re-confirms that a payout ratio of around this level is expected to be sustainable through the next two or three years under our current business plans.
People
I wish to congratulate Kathmandu’s Chief Executive Officer, Peter Halkett for his key role in the successful IPO, and subsequently the leadership shown by him and his team to successfully open 15 stores during the year and achieve another substantial increase in earnings. The commitment of the Kathmandu staff through a year of considerable challenges, culminating in the recent earthquake event that significantly affected our Christchurch domiciled staff, has been critical to the ongoing stability and growth of the business over this period.
James StrongChairman
Outlook
Our trading performance since the IPO and continuing market leadership reinforce the sustainability of the store rollout programme identified in our prospectus which projects a Kathmandu potential store network across Australia and New Zealand of up to 150 stores. The economic environment may continue to adversely affect overall consumer spending, and this is certainly an ongoing concern for our UK business in particular. However Kathmandu’s brand positioning and value proposition, which is underpinned by its vertical integrated business model will continue to provide strategic competitive advantage and resilience to deal with market conditions. It now remains for these advantages to be best utilised in order to maximise the return to shareholders that will be derived from the inevitable ongoing growth in total product sales that will be delivered. The Board and senior management are clearly focused on achieving this outcome.
Cashel Street, Christchurch

4 KATHMANDU HOLDINGS LIMITED ANNUAL REPORT 20104 KATHMANDU HOLDINGS LIMITED ANNUAL REPORT 2010
HIGHLIGHTS FOR THE YEAR
Successful listing on ASX and NZX, November 2009
Continued sales and profit growth
15 new stores opened
Online selling commenced October 2009
Summit Club members now exceed 400,000

SALES (NZ$m)
$245.8$215.6
$192.8
$151.4
FY2007 FY2008 FY2009 FY2010
NPAT (NZ$m)*
$25.2
$14.9
$8.0$11.5
FY2007 FY2008 FY2009 FY2010
KATHMANDU HOLDINGS LIMITED ANNUAL REPORT 2010 5
*Prior years as presented in the Prospectus dated 23 October 2009, and current year excluding the impact of IPO listings costs.
EBIT (NZ$m)*
$47.9$44.1
$32.9$33.1
FY2007 FY2008 FY2009 FY2010

6 KATHMANDU HOLDINGS LIMITED ANNUAL REPORT 2010
CHIEF EXECUTIVE’S REPORT
Peter HalkettManaging Director and Chief Executive Officer
KEY HIGHLIGHTS
Successful Public Listing on NZX and ASX, and inclusion in ASX All Australian 200 and NZX50,
15 new stores and 4 refurbished stores with new store design and enhanced format,
Continued sales and profit growth,
Sales increase $30.2m 14.0%, Gross margin 63.2%, EBIT up $5.3m 12.4%,
A new capital structure with reduced debt levels,
Improved operating cashflow and capacity for investment in further product opportunities,
Launched new products and ranges, grew overall product offering,
Summit Club membership numbers now over 400,000 across AU, NZ and the UK, increase of 129% over 2 years,
Successful launch of online selling on Kathmandu website in October 2009 with 88% of current season product now available to buy online,
First successful third party warehousing and distribution of product as part of direct to store delivery project.
The 2009/10 year was a milestone in the history of Kathmandu with our successful public listing on 13 November, 2009. Our transition in the first four months of the year from private to public company, with a dual listing on both the ASX and NZX, was a significant and unique achievement for a company of our size. This has been followed by a pleasing overall first result as a public company, as Kathmandu has achieved solid growth in terms of both sales and profit, strengthening its leading position in the travel and adventure market.
The dual listing occurred during a strong first half trading period to 31 January, with significant growth in earnings being achieved in this period. By comparison throughout most of the 2010 calendar year to date we encountered a much tougher retail climate in all our markets. Although we undertook additional promotional activity to support
sales, our second half result was less than forecast. Overall, primarily because of our gross margin performance and total promotional spend; we were short of our full year prospectus EBIT target by $3.1m (6.1%).
We could have undertaken more aggressive short term actions to achieve the prospectus profit targets however we considered this would have been detrimental to the brand and not in our interest over the longer term. Kathmandu holds a market leading position in a growing sector, and our products continue to grow in popularity with consumers. We are clearly number 1 in the New Zealand market, and our recognition in the Australian market is growing rapidly, with increasing store numbers and marketing exposure.
Our continued growth in product range has been, and will continue to be a key growth driver. This strategy, complemented by our store rollout programme, and our brand and marketing initiatives, will be our key long term growth engines. As our vertical business model can reach customers directly in conjunction with retaining high margins, these longer term opportunities remain our key focus. Our approach to market conditions in the second half was consistent with this positioning.
BUSINESS OVERVIEW
Key to Kathmandu’s success is our brand and marketing, products, stores, systems and people.
We are a clear market leader in our category and it is our intention to remain number one. We have established a unique and highly profitable business model with significant competitive advantage via our scale, vertical retailing and brand heritage.
First and foremost Kathmandu is a brand, not just a chain of retail stores. The Kathmandu brand name is our greatest asset, which we must protect and grow. During the year we commissioned in depth research on the brand to ensure we fully understand the value we provide to customers and how to maintain its relevance and position in today’s competitive environment. In the coming year we plan to apply these learnings and further strengthen our brand identity, through our store environment, packaging and marketing communications. We initiated new store formats during the year that we will continue to evolve and enhance in tandem with our brand refresh project.
Continuous innovation of our product offer in terms of new

KATHMANDU HOLDINGS LIMITED ANNUAL REPORT 2010 7
designs and design features, new technology, improved quality and the introduction of new products and ranges is critical to our future growth. Examples of new products that we introduced to the market over the year included:
Ultracore added to our thermal range,
Extended travel accessories range, particularly the new Transit series,
Further substantial expansion of the Kathmandu Kids range.
We continue to establish long term sustainable trading terms with our key suppliers. Our emphasis in this process is to ensure suppliers apply minimum standards for employees, meet environmental and social responsibility undertakings and comply with ongoing product standards.
Our Store network continues to grow. At the time of issuing our prospectus we anticipated opening 12 stores this year, however we exceeded this target and opened 15 stores. Total stores as at 31 July 2010 were New Zealand 36, Australia 55 and UK 6. The new stores opened during the year were:
Australia: Brisbane CBD, located close to Queens Mall Precinct (replaced existing store), Townsville, Sydney Macarthur, Melbourne South Wharf DFO, Melbourne Chapel St, Frankston, Ballarat, Devonport, Adelaide Tea Tree, Adelaide Harbour Town, Fremantle.
New Zealand: Christchurch Cashel Street (replaced existing store), Tauranga (replaced temporary store), Auckland Onehunga, Gisborne, Hastings, Timaru.
The results to date for new stores overall are in line with expectations, and continue to confirm that there remains substantial opportunity for further new stores, particularly in markets where we are under represented such asWestern Australia and regional cities across Australia.As previewed in our prospectus last year there remains potential for approximately 150 stores in Australia andNew Zealand.
In addition to the new stores, following successful trials in Canberra and Queenstown, in the second half of the year we commenced a programme of refurbishment and relocations of existing stores. Our new store design concepts were introduced to these upgrades, improving brand image as well as increasing selling floor space in most instances. Projects completed were Kent Street in Sydney, Cashel Street in Christchurch, Bourke Street in Melbourne and Dunedin. Initial trading performance in these locationshas been pleasing.
We introduced online selling through the Kathmandu website from October 2009. Online sales performance to date has been above expectations in Australia and New Zealand, and in each country the current rate of sales equates to that of a smaller store within our retail network. This sales channel will continue to grow as the range is expanded and specific online promotional strategies are introduced. Additional opportunities to integrate this channel further with our Summit Club loyalty programme will be explored.
Ongoing enhancement and improvement of our information systems is a core strategy to enable Kathmandu to deliver
Kathmandu store network as at 31 July 2010
New Zealand
North Island 27 stores South Island 9 stores
Australia
VIC 18 stores NSW 16 stores QLD 6 stores WA 5 stores SA 4 stores TAS 3 stores ACT 3 stores
WA
NT
SA
QLD
NSW
VIC
TAS
ACT
United Kingdom
6 stores

8 KATHMANDU HOLDINGS LIMITED ANNUAL REPORT 2010
ongoing growth and operating efficiency. As part of our focus on supply chain effectiveness we have now introduced direct to store deliveries via third party warehousing for selected products into the Auckland and Brisbane areas, and this programme will expand significantly next year, incorporating Perth stores also. The migration of our existing ERP platform to the latest available release with consequent significant enhancement in functionality is an ongoing project. It is scheduled for implementation at the end of the forthcoming year.
MARKET OVERVIEW
Generally market conditions and consumer confidence were stronger in our first half when Kathmandu traded above expectations. In the equivalent period in 2008/09, the impact of the global financial crisis was a very significant negative influence on consumer sentiment. From February 2010 onwards we encountered retail conditions that became more challenging as factors such as the cycling of the previous year’s government stimulus measures in Australia, rising interest rates (again primarily in Australia) and de-leveraging by New Zealand consumers all began to slow the market. In addition to those economic factors, Kathmandu was impacted by the record March/April hot temperatures across both New Zealand and Australia during our Easter Sale.
Published statistics record a decrease in total Australian clothing, footwear and personal accessory retailing sales in the February to July period compared to the same period in 2009. Similarly, total New Zealand recreational goods retailing decreased in the same period in 2010 compared to 2009. The second half also appeared to be a period of aggressive price competition, particularly in the final quarter, and we observed apparel retailing rather than equipment was the more challenging market segment.
Trading through the second half was in a more adverse market environment than was anticipated at the commencement of the year. Reported results by listed retailers in both Australia and New Zealand highlight similar trading conditions for most discretionary retail categories. Generally we experienced weaker sales demand than expected across most of our regional markets, whether new or existing stores, though the Australian market was certainly stronger than New Zealand.
FINANCIAL PERFORMANCE
Group sales increased 14.0% over the previous year to $245.8m. On a same store basis, sales increased by 1.3% (0.9% at a constant exchange rate). Country by country same store sales increased as follows:
Australia 0.8%,
New Zealand 0.6% and
UK 5.8%.
Sales exceeded prospectus forecast by $5.8m (2.4%). The opening of 3 stores more than envisaged in our prospectus underpinned the above forecast sales performance. This
helped to offset the impact of a lower than expected same store sales performance that arose in a tougher than expected retail environment during the second half.
Whilst sales were up, gross margin was down 120 bps on previous year and 80 bps on the prospectus forecast. This was lower than expected for several reasons that reflected market conditions generally, primarily:–
a slightly adverse product mix outcome with improved equipment sales but reduced apparel sales; and
necessary promotional pricing levels and offers undertaken particularly during the second half of the financial year to maximise sales.
In a very price focused market and in a period of subdued demand for discretionary retail, our response to the market environment was essential. The period of subdued demand coincided with our most critical trading period from March to July. However we took the actions needed to maximise sell through of winter stock in particular, with a small consequential impact on gross margin. We consider we achieved the optimum outcome between sales, profit, discounting and maintaining brand credibility.
Although second half sales and gross profit expectations were not met, we were able to deliver improved stock turns for the same period, and our stock position at year end was reduced by $2.2m overall and 20.1% per store on the previous year. We adopted a conservative approach to the planning for levels of stock ordered and associated working capital requirements for the winter season. However our end of year stock position was slightly lower than optimum and did result in some lost sales opportunities through out-of-stocks in the winter sales period. We have modified our processes to enable additional stock availability for the equivalent period next year, and this represents a good opportunity to improve results in the forthcoming year.
Expenses (excluding depreciation and IPO costs) were below last year as a % of sales by 70 bps but in excess of prospectus forecast by $5.2 m. Additional expenses compared to the prospectus estimate were primarily incurred in the uplift in costs from operating 15 new stores rather than 12 and the increase in marketing activity and associated advertising spending in response to slowing market conditions. These costs added approximately $3.1m to total expenses. Other expenses that were above prospectus forecast arose from various sources, including accounting for foreign currency translation losses on intercompany transactions and a higher level of expenditure on public company costs.
Actual IPO costs of $21.3 million compared to the prospectus estimate of $15 million. IPO costs relating to advisory fees were substantially higher, due to the scope of work eventually required to meet the requirements of dual listing on both the NZX and ASX. Additional costs were also incurred as a result of the change in banking arrangements.
EBIT and NPAT whilst below prospectus forecast were above last year (after eliminating costs of the IPO) by $5.3m (12.4%) and $10.3m (69.1%) respectively. EBIT margin achieved for the year 19.5% compares to 19.8% for the previous year.

KATHMANDU HOLDINGS LIMITED ANNUAL REPORT 2010 9
UK BUSINESS PROSPECTS
We achieved 16.7% total sales growth in the UK and 5.8% on a same stores basis. This improved performance was a good result given the very difficult economic environment in the UK, but it remains below the level we have targeted as a minimum needed to justify further investment in the UK retail network. The UK operation remains some way from profitability and a review will be undertaken in the new financial year to decide how best to take the business forward.
THE KATHMANDU TEAM
Staff numbers as at 31 July 2010 increased by 6% to 1562 compared to 1480 as a result of increased store numbers. The importance of retention and development of our team members to support our growing retail network remains a critical enabler of success. Finding and retaining quality employees who wish to make a career in retailing is an ongoing challenge. Staff training and adequacy of technical knowledge is a priority for our store leadership, and we support this by regular product training and an ongoing leadership development programme.
Two new members have joined the management team in the period since the IPO. Paul Stern who initially joined us as Acting General Manager Marketing whilst Tamalin Morton was on maternity leave, will move into the newly created role of General Manager Business Development and Sustainability, where he will lead strategic growth initiatives and drive our long term Sustainability plan. In August we appointed a new Chief Information Officer, Grant Taylor, who will lead the strategic development of Kathmandu’s IT systems and infrastructure.
Our primary investment in staffing resources, other than growth associated with the store network expansion, has been, and will continue to be in the teams supporting product development and sourcing, as well as marketing and brand strategy. The commitment of our staff through a period of significant and ongoing business change has been vital to Kathmandu’s ongoing success. This was never better illustrated than during the recent Christchurch earthquake, where staff at our Head office, New Zealand distribution centre and local stores provided exemplary support to keep the Company operating despite their own personal circumstances.
OUTLOOK
We expect to be celebrating our 100th store opening at the end of 2010, and our target is to rollout 15 new stores in the next financial year. We have a clear expectation as to what catchments remain appropriate for Kathmandu stores and consider 15 sites per year is an appropriate target for the next 3 years.
In conjunction with the store rollout strategy our key medium term plan for the next 3 years is also focused on successful delivery of our other key profit growth strategies, namely:
upgrading, relocating and enlarging existing older stores,
significantly growing our product range,
building our Summit Club loyalty scheme membership base, and
controlling and managing down costs to improve overall operating leverage
In the next financial year uncertainty over future economic conditions is a prevalent theme from commentators in all of our markets. At best it appears the growth in consumer spending in the year ahead will be steady. Kathmandu will therefore remain very focused on improving market share, selecting appropriate sites for new store openings and effectively executing planned growth in product range offering. The recent GST increase in New Zealand will also likely impact consumer demand in the short term.
In addition, we expect to be experiencing above normal cost increases through next year in key areas including international and domestic freight; offshore manufacturing and sourcing costs in some key product categories; and salary and wage increases in Australia arising from the new Fair Work legislation.
Given all of the above circumstances we expect a year ahead that will be demanding. However as in past years Kathmandu’s brand strength, market leadership and operating model, supported by the store roll out programme and growth in product range, will mean we are well positioned to continue to grow sales and profitability. Whilst some uplift in costs may be unavoidable, our opportunities for improvements in business efficiency are numerous and we continue to target improved operating margins.
The management team will continue to adopt a disciplined and positive approach to growing the business.
Peter HalkettManaging Director andChief Executive Officer
P. Halkett
10 KATHMANDU HOLDINGS LIMITED ANNUAL REPORT 2010
BOARD
James StrongAO Chairman
Mr Strong is currently Chairman of Woolworths Limited and the Australia Council for the Arts. He is a Director of Qantas Airways Limited, a member of the Australian Grand Prix Corporation and a member of the Nomura Australia Advisory Board.
Previously, Mr Strong was the Chairman of Insurance Australia Group Limited, Rip Curl Group and Corrs Chambers Westgarth. Mr Strong was also the Chief Executive Officer of Australian Airlines from 1986 to 1989 and the Managing Director and Chief Executive Officer of Qantas Airways from 1993 to 2001.
Peter HalkettManaging Director and Chief Executive Officer
Mr Halkett joined Kathmandu in 2006 and has directed the growth strategy for the business throughout the period of current ownership.
Mr Halkett has had a management career with extensive retail experience including Chief Executive Officer roles in New Zealand and the United Kingdom. The companies he has led include two that were publicly listed, in particular Pacific Retail Group.
Mark ToddFinance Director and Chief Financial Officer
Mr Todd joined Kathmandu in 1998 when the business had 11 stores, following previous financial management experience in both the apparel and retail sectors.
Mr Todd has been Kathmandu’s senior financial executive for 11 years, a Director of various Group companies and manager of the New Zealand business from 2004 to 2006.
Mr Todd is the Company Secretary.
John HarveyNon-Executive Director
Mr Harvey is a professional Director with a background in accounting and professional services. Mr Harvey has over 35 years professional experience, including 23 years as a partner of PricewaterhouseCoopers where he also held a number of leadership and governance roles.
Mr Harvey has extensive experience in financial reporting, governance, information systems and processes, business evaluation, acquisition, merger and takeover reviews.
Mr Harvey is currently a non-Executive Director of DNZ Property Fund, MARAC Finance, Port Otago and NZ Opera.
John HollandNon-Executive Director
Mr Holland is a partner in the national New Zealand law firm of Chapman Tripp and specialises in general corporate and commercial law. Mr Holland was a Board member of Chapman Tripp for six years until 31 March 2009.
Mr Holland’s securities law experience includes acting on initial public offerings, advising on employee share schemes and in the private equity area. Mr Holland has been a member of the Securities Commission of New Zealand since January 2007 and is an accredited directorof the New Zealand Institute of Directors.
Sandra McPheeNon-Executive Director
Ms McPhee is a professional Director with an executive career background in sales and marketing including 10 years with Qantas Airways. Ms McPhee also served as Chief Executive Officer of the Ansett/Traveland group which comprised a network of 250 retail travel and franchise stores.
Ms McPhee is currently a non-Executive Director of Fairfax Media Limited, AGL Energy and Tourism Australia and Deputy Chairman of St Vincent’s and Mater Health and the Art Gallery of New South Wales. She is also a member of the Advisory Council of JP Morgan and Advisory Board of MMC.
Previous non-Executive roles include Coles Group, Australia Post, Perpetual, Primelife and South Australia Water.

KATHMANDU HOLDINGS LIMITED ANNUAL REPORT 2010 11
Name Title Background
Peter Halkett Managing Director and Chief Executive Officer
Refer to Page 10
Mark Todd Finance Director andChief Financial Officer
Refer to Page 10
Matt Spencer General Manager,Retail
Joined Kathmandu in 2007 after over 10 years in operational and planning roles with Shell and then Coles, in particular with key responsibility for the initial establishment of the Coles Express business.
Michelle Adams General Manager,Product
Joined Kathmandu in 2009 following extensive product and brand management experience with Pacific Brands and Canterbury.
Tamalin Morton General Manager,Marketing
Joined Kathmandu in 2007, having had previous marketing roles with the Coles Group and Bass plc in the UK, with extensive experience in marketing management and brand strategy in both groups.
Grant Taylor General Manager,Information Technology
Joined Kathmandu in August 2010 with 15 years experience in senior IT roles, including CIO at Otago and Southland District Health Boards and Group IT Manager for PGG Wrightson.
Caleb Nicolson General Manager,Supply Chain
Joined Kathmandu in 2007, after eight years with The Warehouse, where he had responsibility for delivering change across the supply chain and the merchandise function.
Paul Stern General Manager,Business Development and Sustainability
Joined Kathmandu in January 2010 with over 18 years experience in senior Retail and Marketing roles, including at Kmart, A.S. Watson (Hong Kong), and Cadbury Schweppes.
MANAGEMENT

12 KATHMANDU HOLDINGS LIMITED ANNUAL REPORT 201012 KATHMANDU HOLDINGS LIMITED ANNUAL REPORT 2010

KATHMANDU HOLDINGS LIMITED ANNUAL REPORT 2010 13
DIRECTORS’ REPORT
Your Directors present their Report and the Financial Statements for the year ended 31 July 2010.
Directors
The following persons were Directors of Kathmandu Holdings Limited during the financial year and up to the date of this report.
James Strong
Was appointed Chairman, non-Executive Director, Member of the Audit and Risk Committee, Member of the Remuneration and Nominee Committee on 16 October 2009 and continues in these offices at the date of this report.
Peter Halkett
Was appointed as Managing Director and Chief Executive Officer on 9 October 2009 and continues in these offices at the date of this report.
Mark Todd
Was appointed as Finance Director, Chief Financial Officer and Company Secretary on 9 October 2009 and continues in these offices at the date of this report.
John Harvey
Was appointed as a non-Executive Director, Chair of the Audit and Risk Committee, Member of the Remuneration and Nominee Committee on 16 October 2009 and continues in these offices at the date of this report.
John Holland
Was appointed as a non-Executive Director, Member of the Audit and Risk Committee, Member of the Remuneration and Nominee Committee on 16 October 2009 and continues in these offices at the date of this report.
Sandra McPhee
Was appointed as a non-Executive Director, Member of the Audit and Risk Committee, Chair of the Remuneration and Nominee Committee on 16 October 2009 and continues in these offices at the date of this report.
John Strowger
Was appointed as a non-Executive Director on 1 October 2009 and resigned on 9 October 2009.
Details of the experience and expertise of the Directors and the Company Secretary are outlined on page 10 of this annual report.
Retirement of Directors
In accordance with the Company’s constitution, James Strong and John Holland will retire as Directors at the annual general meeting and being eligible, offer themselves for re-election.
Meeting of Directors
The number of meetings of the Board of Directors and Committees held during the year ended 31 July 2010 and the numbers of meetings attended by each Director were:
Director Meetings
Audit and Risk
Committee Meetings
Remuneration and Nominee
Committee Meetings
Director A B A B A B
James Strong 7 8 7 8 7 8
Peter Halkett 8 8 XX XX XX XX
Mark Todd 8 8 XX XX XX XX
John Harvey 8 8 8 8 8 8
John Holland 8 8 8 8 8 8
Sandra McPhee 8 8 8 8 8 8
A – Number of meetings attendedB – Number of meetings held during the time the Director held office during the yearXX – Not a member of relevant Committee
Review of Operations
The profit of the consolidated entity for the financial year after providing for income tax amounted to $9,387,000 (2009: $14,902,000).
A detailed review of operations is provided on pages 2 to 9 of this annual report.
Significant Changes of Affairs
Kathmandu Holdings Limited was incorporated on 1 October 2009 and was listed on the NZX and ASX on 13 November 2009. The successful issue of 200 million shares raised a total value of NZ$426 million which was primarily used to acquire the Kathmandu business from its previous shareholders, and to pay down in part the bank debt owed by Kathmandu prior to the listing.
Principal Activities
The Group’s principal activity in the course of the financial year was the design, marketing and retailing of clothing and equipment for travel and adventure. It operates in New Zealand, Australia and the United Kingdom.
14 KATHMANDU HOLDINGS LIMITED ANNUAL REPORT 2010
Matters Subsequent to the End of the Financial Year
No matters or circumstances have arisen since the end of the financial year which significantly affect or may significantly affect the operations of the consolidated entity, the results of those operations, or the state of affairs of the consolidated entity in future financial years.
Likely Developments and Expected Results of Operations
Likely developments in the operations of the consolidated entity and the expected results of those operations in future financial years are contained on pages 2 to 9 of this annual report.
Environmental Regulation
The consolidated entity’s operations are not regulated by any significant environmental regulation under a law of the Commonwealth or of a State or Territory of Australia, or of New Zealand.
Dividends
Since the end of the financial year the Directors have declared the payment of a final ordinary dividend of NZ 7.0 cents per share. Dividends will carry full New Zealand imputation credits and full Australian franking credits. The dividend will be paid on 25 November 2010, with a record date of 15th November 2010.
The Company does not currently have an active dividend re-investment plan.
Insurance of Officers
The Company has entered into deeds of indemnity, insurance and access with each Director which confirms each person’s right of access to certain books and records of the Company for a period of seven years after the Director ceases to hold office. This seven year period can be extended where certain proceedings or investigations commence before the seven years expires. The deed also requires the Company to provide an indemnity for liability incurred as an officer of the Company, to the maximum extent permitted by law.
Indemnification: Pursuant to the Constitution, the Company is required to indemnify all Directors and employees, past and present against all liabilities allowed under law. The Company has entered into an agreement with each Director to indemnify those parties against all liabilities to another person that may arise from their position as Director or other officer of the Company or its controlled entities to the extent permitted by law. The deed stipulates that the Company will meet the full amount of any such liabilities, including reasonable legal costs and expenses.
Insurance: Pursuant to the Constitution, the Company may arrange and maintain Directors’ and officers’ insurance during each Director’s period of office and for a period of seven years after a Director ceases to hold office. This seven year period can be extended where certain proceedings or investigations commence before the seven years expires.
Remuneration Report
The remuneration report is set out in the following sections:
A – Principles used to determine the nature and amount of remuneration
B – Details of remuneration
C – Service agreements
D – Share-based compensation
E – Additional information
The information provided in this remuneration report has not been audited as Kathmandu Holdings Limited is a foreign company in terms of the Corporations Act 2001 (Australia). However the report is provided in the same form as is generally applied by Australian companies listed on the ASX, and the audited remuneration disclosures contained in note 10 of the financial statements generally comply with those required under the Corporations Act 2001 (Australia).
A – Principles used to determine the nature and amount of remuneration
The objective of the Company’s Remuneration and Nominee Committee (“the Committee”) is to create a framework whereby Directors and Executives are remunerated fairly and within generally accepted market and comparable entity norms, on a basis that appropriately rewards for the creation of shareholder value. The composition, role and responsibility of the Committee is outlined in the Corporate Governance Statement on page 21 of this annual report. The general principles adopted by the Board in the setting of remuneration are:
Remuneration whether measured at base or total level, should be market competitive, and generally account for key relevant internal and external factors such as employee level of responsibility and place of domicile, Company commercial circumstances, and market practice;
Those employees with the clear ability to influence the achievement of the Company’s strategic objectives and business plans (“key management personnel”) should be rewarded by way of performance based rewards structured to reflect success or otherwise against those objectives and plans;
The opportunity to participate in equity based rewards should be a component of the reward structure for key management personnel, both to align their reward with the creation of shareholder value, and to encourage their ongoing participation in and retention by the Company;
Key management personnel who are Executives (those who report directly to the Board or the Chief Executive Officer) should have a substantial portion (as a target no less than one-third) of their total remuneration aligned with reward for creating shareholder value. This should generally

KATHMANDU HOLDINGS LIMITED ANNUAL REPORT 2010 15
be achieved through the application of appropriate and measureable performance hurdles to be met as criteria for receiving incentive based remuneration by way of cash or equity;
The Chief Executive Officer’s proportion of total remuneration that is “at risk”, i.e. contingent upon the achievement of performance hurdles, should be no less than the equivalent proportion of any other Executive, given his/her key role in delivering achievement of Company strategic objectives and business plans, and increasing shareholder value;
The opportunity to participate in equity based rewards should be a component of remuneration for all key management personnel.
Non-Executive Directors’ remuneration should enable the Company to attract and retain high quality Directors with the relevant experience. In order to maintain independence and impartiality, non-Executive Directors should not receive performance based remuneration.
Executive Rewards
The Executive remuneration framework has three components:
Base salary and benefits; Short term cash incentives; Long-term incentives via participation in the Company’s
Employee Option plan.
The combination of these comprises the Executives’ total remuneration.
The remuneration framework provides a market competitive reward for Executives that aligns appropriately with achievement of personal and strategic objectives, the results delivered, and the creation of value for shareholders. The framework also creates emphasis on cross-functional collaboration by requiring the payment of all incentive based rewards to be contingent firstly upon the achievement of overall Company profit targets.
The Company’s objective is to provide a remuneration framework whereby every incentive payment over and above an Executive’s fixed pay, whether in the form of cash or equity, is appropriate for the results delivered by the Company and the employee and based on reward for performance. The Board, through the Committee, undertakes its governance role in establishing Executive remuneration including, where required, use of external independent remuneration consultants and/or available market information, with reference to both total remuneration and its various components.
Base salary and benefits
Executive base salaries are structured as part of a total employment remuneration package which is delivered as a mix of cash and non-monetary benefits determined by negotiation with the Executive.
Executives are offered a competitive base salary that comprises the fixed component of pay and rewards.
External independent remuneration consultants provide analysis and advice to assess whether base salary reflects the market positioning for a comparable role. Base salary for senior Executives is reviewed annually to provide competitiveness with the market but there are no guaranteed base salary increases in any Executive’s contracts, except as specifically stated in this report. An Executive’s remuneration is also reviewed on promotion.
Executive benefits made available are medical insurance and for some Executives, reimbursement of vehicle running costs.
Short term cash incentives
Executives are eligible to participate in an annual short term cash incentive plan which delivers rewards by way of cash bonuses, subject to the achievement of Company and individual performance targets.
The Committee has established earnings before interest and tax (EBIT) as the appropriate financial performance target to trigger payment of short term cash incentives. This criterion was determined based on comparative research against the market and advice from external independent remuneration consultants. The audited financial results for the Kathmandu Group are the basis for measuring achievement against the financial performance target. Prior to the public listing Group earnings before interest, tax, depreciation and amortisation (EBITDA) was the financial performance target to determine whether short term cash incentives would be paid each year.
The amount of any short term cash incentive paid is dependent upon:
the level of over performance achieved against the financial performance target (whether this has been EBITDA or EBIT) for the year; and
if financial performance targets have been met or exceeded, the achievement or otherwise of individual KPI’s.
For the year ended 31 July 2010 no short term cash incentives were paid under the terms above, as financial performance targets were not met.
For the year ended 31 July 2009 short term cash incentives were paid to the extent of 50% of base salary for all eligible Executives. This was comprised of payment for achievement of financial performance targets to a level that triggered maximum permissible cash bonuses (40% of base salary), and consequent entitlement to individual KPI based cash bonuses (10% of base salary).
Further incentives may also be paid at the discretion of the Board to individual Executives as recognition of exceptional achievement in any given year.
Long Term Incentive PlansOptions Plan
The Company implemented the Employee Option plan on 16 October 2009, and it was developed in the lead in to the Company’s IPO in order to provide an incentive scheme for

16 KATHMANDU HOLDINGS LIMITED ANNUAL REPORT 2010
selected senior employees in conjunction with the public listing of the Company. An initial grant of options was made in conjunction with the IPO to seven Executives of the Company. Vesting of the options is subject to the Company achieving a compound annual growth in Total Shareholder Return (TSR) of 15% for the period applying to each tested period of performance measurement. TSR was determined as the criterion for performance measurement based on research against the market, and advice from external independent remuneration consultants with reference to the approach considered appropriate for a Company undertaking an IPO of shares.
Subject to achievement of this condition and Executives remaining in employment with the Company at the vesting date, the options granted to each Executive as detailed below vest progressively in 3 equal tranches on the test dates of 1 October 2010, 2011 and 2012. If the TSR performance condition has not been achieved on the applicable test date there will be re-testing of this condition on 1 October 2011, 2012 and 2013. All options have an expiry date five years from their date of grant.
The Directors do not intend to grant any further options under the existing plan. The Directors are of the view that the existing plan no longer represents an appropriate on-going long term incentive structure for the Company post the IPO.
Proposed new long-term incentive
Subject to shareholder approval the Board are proposing to implement a new long term incentive plan based on the granting of nil cost performance rights. The rights will be offered to all Executives and key management personnel domiciled in Australia and New Zealand. For Executives, vesting of the rights will be dependent upon the Company achieving Earnings per Share (EPS) and/or relative TSR targets over a 2, 3 and 4 year performance period, with 50% of the value of rights allocated under each target.
EPS will be measured on a compound annual growth basis and TSR will be measured on a relative basis against similar sized Australian and New Zealand listed retail organisations. Performance measurement under either criterion will be at the end of each applicable performance period with no ability to re-test. Fifty percent of the relevant portion of the award will vest for achievement of targets and a further fifty percent will vest for the achievement of aspirational targets. A sliding scale will operate between target and aspirational performance levels.
The new long-term incentive is intended to focus performance on achievement of key long-term performance metrics. The selected performance measures provide an appropriate balance between relative and absolute Company performance. The Board considers this plan will best support and facilitate the growth in shareholder value over the long term.
Non-Executive Directors’ fees
The current aggregate limit for non-Executive Directors’ fees is $A600,000 per annum with a base fee payable
(including superannuation if applicable) to the Chairman of $A200,000 and to a non-Executive Director currently of $A100,000 per annum. All non-Executive Directors’ fees are inclusive of Committee fees. The Managing Director and Finance Director do not receive Directors’ fees. The amounts approved for Directors’ fees are expressed in $A given the specific requirements for remuneration reporting applying to ASX listed companies, however all amounts reported in the tables within this report are specified in $NZ, being the reporting currency of the Company.
Non-Executive Directors’ fees are those as set at the time of the IPO. For the first part year from date of incorporation of the Company to 31 July 2010 the fees were pro-rated, being an amount of $A180,000 payable to the Chairman and $A90,000 payable to each non-Executive Director as detailed below. It is intended that Directors’ fees will be reviewed annually, with external independent remuneration consultants providing advice to ensure fees reflect market rates. There are no guaranteed annual increases in any Director’s fees.
Non-Executive Directors do not participate in the Company short or long term incentive schemes.
The following fees apply per annum:
Base Fees AUD $
ChairmanOther non-Executive Directors
200,000100,000
Actual fees paid in year ended 31 July 2010 NZD $
ChairmanOther non-Executive DirectorsNo additional fees are payable for membership or chairing of any Board sub-committees.
225,231112,607
B – Details of remuneration
The following Executives along with the Directors were the key management personnel with the authority and responsibility for planning, directing and controlling the activities of the Group, directly or indirectly, during the financial year. The key management personnel also include the five highest paid officers:
Peter Halkett – Chief Executive Officer
Mark Todd – Chief Financial Officer
Matt Spencer – General Manager, Retail
Tamalin Morton – General Manager, Marketing (maternity leave commenced 28 April 2010)
Michelle Adams – General Manager, Product (since 22 June 2009)
Caleb Nicolson – General Manager, Supply Chain
Bryan Moore – General Manager, Information Systems
All of the above persons were employed by the Group and were key management personnel for the entire year ended 31 July 2010 and the year ended 31 July 2009, unless otherwise stated. Peter Halkett, Mark Todd, Michelle Adams, Caleb Nicolson and Bryan Moore are employees of Kathmandu Limited (New Zealand domiciled), and Matt Spencer and Tamalin Morton are employees of Kathmandu

KATHMANDU HOLDINGS LIMITED ANNUAL REPORT 2010 17
Pty Limited (Australian domiciled). Bryan Moore ceased to be an employee on 10 September 2010.Details of the remuneration of the Directors and other key management personnel of the Group, for the current and prior financial years are set out in note 10 of the financial statements.
The cash bonuses paid in the year ended 31 July 2009 as detailed in note 10 for the Executives specified above were made up of:
Short term cash incentive to the extent of 50% of base pay as a result of Company achievement of financial performance targets and individual achievement of personal KPI’s; and
One-off payment as a result of cancellation of previous share ownership incentive arrangements. Prior to the IPO of the Company, Executives and other management personnel held shares in Milford Group Holdings Limited, that were funded by way of an interest free advance, and they were incentivised to be issued further shares in future years on a similar basis, contingent upon the achievement of certain financial performance targets in those years. This previous incentive plan ceased in conjunction with the IPO, and all management personnel converted their previously held shares as part of the IPO. The one-off cash bonus was paid in lieu of the entitlement to any further shares under that plan.
The cash bonuses paid in the year ended 31 July 2010 for selected Executives are explained in note 10. No other long term or remuneration benefits were paid or are payable with respect to the current and prior year.
C - Service agreements
All Executives are on employment terms consistent with the remuneration framework outlined in this report. Each of the agreements has an open term, and the period of notice to be given by the employee is three months. The agreements provide for three months base salary inclusive of any applicable superannuation to be paid in the event of a redundancy.
D – Share-based compensation
The Company Employee Option plan entitles the holder to acquire one share for each option granted by paying the prescribed exercise price to the Company once the option has vested in the holder and the relevant exercise conditions have been met. The number of options granted by the Company and thus provided as remuneration to Executive Directors and other key management personnel during the current financial year is set out below.
2010 Options Grant Date
Options Granted during
the year
First Vesting Date
Last Vesting Date
Total fair value of Options at Grant Date $
Options vested during the year
Executive Directors
Peter Halkett 18 Nov 2009 186,218 1 Oct 2010 1 Oct 2013 78,925 - Peter Halkett 18 Nov 2009 186,218 1 Oct 2011 1 Oct 2013 88,912 - Peter Halkett 18 Nov 2009 186,219 1 Oct 2012 1 Oct 2013 90,841 -
Mark Todd 18 Nov 2009 53,377 1 Oct 2010 1 Oct 2013 22,623 - Mark Todd 18 Nov 2009 53,377 1 Oct 2011 1 Oct 2013 25,485 - Mark Todd 18 Nov 2009 53,377 1 Oct 2012 1 Oct 2013 26,038 -
Other Key Management Personnel
Matt Spencer 18 Nov 2009 39,541 1 Oct 2010 1 Oct 2013 16,759 - Matt Spencer 18 Nov 2009 39,541 1 Oct 2011 1 Oct 2013 18,879 - Matt Spencer 18 Nov 2009 39,542 1 Oct 2012 1 Oct 2013 19,289 -
Michelle Adams 18 Nov 2009 26,755 1 Oct 2010 1 Oct 2013 11,340 - Michelle Adams 18 Nov 2009 26,755 1 Oct 2011 1 Oct 2013 12,774 - Michelle Adams 18 Nov 2009 26,756 1 Oct 2012 1 Oct 2013 13,052 -
Tamalin Morton 18 Nov 2009 36,932 1 Oct 2010 1 Oct 2013 15,653 - Tamalin Morton 18 Nov 2009 36,932 1 Oct 2011 1 Oct 2013 17,634 - Tamalin Morton 18 Nov 2009 36,933 1 Oct 2012 1 Oct 2013 18,017 -
Bryan Moore 18 Nov 2009 14,983 1 Oct 2010 1 Oct 2013 6,350 -
Bryan Moore 18 Nov 2009 14,983 1 Oct 2011 1 Oct 2013 7,154 -
Bryan Moore 18 Nov 2009 14,983 1 Oct 2012 1 Oct 2013 7,309 -
Caleb Nicolson 18 Nov 2009 15,518 1 Oct 2010 1 Oct 2013 6,577 -
Caleb Nicolson 18 Nov 2009 15,518 1 Oct 2011 1 Oct 2013 7,409 -
Caleb Nicolson 18 Nov 2009 15,518 1 Oct 2012 1 Oct 2013 7,570 -
Total 1,119,976 518,590 -

18 KATHMANDU HOLDINGS LIMITED ANNUAL REPORT 2010
The fair value of the options granted on 18 November 2009 is $0.46 per option.All options granted during the current year will vest on the exercise dates above provided the required performance hurdles are achieved and the employee remains employed with the Company at the vesting date. In the event an employee leaves the Company prior to the vesting date the options will lapse. Any options that vest under this plan must be exercised no later than 18 November 2014. The total payable per employee on the exercise of one or more options on a particular day is the price per share in the Company paid for by the purchasers of shares in the IPO, being $A1.70 and $NZ2.1333, regardless of the number exercised on that day. No options in the Company were granted or vested in the previous year. No grants have been made subsequent to year end.
E – Additional information
Cash Bonuses and performanceAs noted above, for the current year all cash bonuses that were available to be paid to key management personnel based on achievement of financial performance targets and individual KPI’s were forfeited as a result of the Company failing to meet those performance targets. No part of the cash bonuses are payable in future years.
Options and performanceThe first test date for the vesting of options granted under the Company Employee Option plan is 1 October 2010 (for one-third of the options granted). In the event that the initial tranche of options do not vest on that date because the TSR performance target for the tested period has not been met, the options do not lapse. There is annual retesting against the 15% compound TSR growth target on 1 October each year through to 2013 for this tranche and the subsequent tranches that will be performance tested for the first time in 2011 and 2012.
Company performanceAll key management personnel’s short term cash incentive is dependent upon the Company’s overall financial performance and their long term incentive is dependent upon total shareholder returns.The table below outlines the Company’s earnings and share performance since its listing on 13 November 2009:
Year NPAT Growth EPS cents per share
EPS Growth
Share price at start of
year
Share price at end of
year
Share price
growth
Ordinary dividends paid or declared per
share
FY2010 $9.4m NA 0.3 NA $2.13 $2.05 (3.8%) $0.07
Share price quoted is the NZX listing price. The Company is listed on both the ASX and NZX and options will vest on both exchanges, dependent on where the employee is based.
Historical performance prior to the Company’s listing is not considered meaningful with respect to the Company’s performance and its impact on shareholder wealth.
Shares under options or performance rights
There are no unissued ordinary shares of the Company under any vested options or performance rights at the date of this report.
2009 Options Grant Date
Options Granted during
the year
First Vesting Date
Last Vesting Date
Total fair value of Options at Grant Date $
Options vested during the year
Executive Directors
Peter Halkett - - - - - -
Mark Todd - - - - - -
Other Key Management Personnel
Matt Spencer - - - - - -
Michelle Adams - - - - - -
Tamalin Morton - - - - - -
Bryan Moore - - - - - -
Caleb Nicolson - - - - - -
Total - - -

KATHMANDU HOLDINGS LIMITED ANNUAL REPORT 2010 19
Remuneration of Auditors
Details of remuneration of Auditors is set out in Note 24 of the Financial Statements.
Non-Audit Services
PricewaterhouseCoopers were appointed auditors of Kathmandu Holdings Limited in 2009 and whilst their main role is to provide audit services to the Company, the Company does employ their specialist advice where appropriate. In each instance, the Board has considered the nature of the advice sought in the context of the audit relationship and in accordance with the advice received from the Audit and Risk Committee, does not consider these services compromised the auditor independence for the following reasons:
All non-audit services have been reviewed by Audit and Risk Committee to ensure they do not impact the impartiality and objectivity of the auditor
None of the services undermined the general principles relating to auditor independence, including not reviewing or auditing the auditor’s own work, not acting in a management or a decision making capacity for the Company, not acting as advocate for the Company or not jointly sharing economic risk or rewards.
A copy of the auditor’s independence declaration is contained on page 23 of this annual report.
This report is made in accordance with a resolution of the Directors.
James Strong Peter HalkettChairman Managing Director

20 KATHMANDU HOLDINGS LIMITED ANNUAL REPORT 201020 KATHMANDU HOLDINGS LIMITED ANNUAL REPORT 2010

KATHMANDU HOLDINGS LIMITED ANNUAL REPORT 2010 21
CORPORATE GOVERNANCE
The Board and management of the Company are committed to ensuring that the Company adheres to best practice governance principles and maintains the highest ethical standards. The Board is responsible for the overall corporate governance of the Company, including adopting the appropriate policies and procedures and seeking to ensure Directors, management and employees fulfil their functions effectively and responsibly.
The Company is listed on both the New Zealand and Australian stock exchanges. Corporate governance principles and guidelines have been introduced in both countries. These include the Australian Securities Exchange (ASX) Corporate Governance Council Corporate Governance Principles and Recommendations, the New Zealand Stock Exchange Listing Rules relating to corporate governance, the NZX Corporate Governance Best Practice Code, and the New Zealand Securities Commission’s Corporate Governance Principles and Guidelines (collectively, the Principles).
The Board considers that the Company’s corporate governance practices and procedures substantially reflect the principles. The full content of the Company’s Corporate Governance policies, practices and procedures can be found on the Company’s website (www.kathmanduholdings.com).
The main policies and practices adopted by the Company are summarised below.
Board Charter of Directors and its committees
The Board has adopted a written charter to provide a framework for the effective operation of the Board. The charter addresses the following matters and responsibilities of the Board:
enhancing Shareholder value;
oversight of the Company, including its control and accountability systems;
appointing and removing the Managing Director (or equivalent) and the Chief Financial Officer;
ratifying the appointment, and where appropriate, the removal of the senior executives;
input into and approval of corporate strategy and performance objectives;
reviewing and ratifying systems of risk management and internal compliance and control, codes of conduct and legal compliance;
monitoring senior management’s performance and implementation strategy, and seeking to ensure appropriate resources are available;
approving and monitoring the progress of major capital expenditure, capital management and acquisitions and divestitures;
approving budgets; and
approving and monitoring financial and other reporting.
Board Composition
At present, there are six Directors on the Board. Four out of the six Directors are non-Executive Directors. Peter Halkett, (Managing Director and Chief Executive Officer), and Mark Todd (Finance Director and Chief Financial Officer) are the only Executive Directors on the Board. The Chairman of the Board is James Strong. The biography of each Board member, including each Director’s skills, experience, expertise and the term of office held by each Director at the date of this Annual Report is set out in the “Board” section of this Annual Report.
Independence of Directors
The factors that the Company will take into account when assessing the independence of its Directors are set out in its Charter, a copy of which is available on the Company’s website (www.kathmanduholdings.com).
The Managing Director (Peter Halkett) and Finance Director (Mark Todd) are employed by the Company or another Group member in an executive capacity and are not considered to be independent Directors based on the criteria set out in the Board Charter. All remaining Directors satisfy the criteria and are considered independent Directors, namely James Strong, John Harvey, John Holland and Sandra McPhee.
Board committees
The Board may from time to time establish appropriate committees to assist in the discharge of its responsibilities. The Board has established the Audit and Risk Committee and the Remuneration and Nominee Committee.
Other committees may be established by the Board as and when required. Membership of Board committees will be based on the needs of the Company, relevant legislative and other requirements and the skills and experience of individual Directors.
Audit and Risk Committee
Under its charter, this committee must have at least three members, a majority of whom must be independent Directors and all of whom must be non-Executive Directors. Currently, all the non-Executive Directors are members of this committee. John Harvey is Chair of the committee. The primary role of this committee includes:

22 KATHMANDU HOLDINGS LIMITED ANNUAL REPORT 2010
overseeing the process of financial reporting, internal control, continuous disclosure, financial and non-financial risk management and compliance and external audit;
monitoring Kathmandu’s compliance with laws and regulations and Kathmandu’s own codes of conduct and ethics;
encouraging effective relationships with, and communication between, the Board, management and Kathmandu’s external auditor; and
evaluating the adequacy of processes and controls established to identify and manage areas of potential risk and to seek to safeguard the Company’s assets.
Under the charter it is the policy of the Company that its external auditing firm must be independent of the Company. The committee will review and assess the independence of the external auditor on an annual basis.
Remuneration and Nominee Committee
Under its charter, this committee must have at least three members, a majority of whom must be independent Directors and all of whom must be non-Executive Directors. Currently, all the non-Executive Directors are members of this committee. Sandra McPhee is Chair of the committee. The main functions of the committee are to assist the Board with a view to establishing a Board of effective composition, size, expertise and commitment to adequately discharge its responsibilities and duties, and assist the Board with a view to discharging its responsibilities to Shareholders and other stakeholders to seek to ensure that the Company:
has coherent remuneration policies and practices which enable the Company to attract and retain Executives and Directors who will create value for Shareholders;
fairly and responsibly remunerates Directors and Executives, having regard to the performance of the Company, the performance of the Executives and the general remuneration environment; and
has effective policies and procedures to attract, motivate and retain appropriately skilled persons to meet the Company’s needs.
Risk management policy
The identification and proper management of the Company’s risk are an important priority of the Board. The Company has a risk management policy appropriate for its business. This policy highlights the risks relevant to the Company’s operations, and the Company’s commitment to designing and implementing systems and methods appropriate to minimise and control its risk. The Audit and Risk Committee is responsible for monitoring risk management and establishing procedures which seek to provide assurance that major business risks are identified, consistently assessed and appropriately addressed.
Continuous disclosure policy
The Company is committed to observing its disclosure obligations under the Listing Rules. The Company has a policy which establishes procedures which are aimed at ensuring that Directors and management are aware of and fulfil their obligations in relation to the timely disclosure of material price-sensitive information.
Securities trading policy
The Company has guidelines for dealing in securities which are intended to explain the prohibited type of conduct in relation to dealings in securities under the Corporations Act 2001 (Australia) and the Securities Markets Act 1988 (New Zealand) and to establish a best practice procedure in relation to Directors’, managements’ and employees’ dealings in Shares in the Company.
Subject to the overriding restriction that persons may not deal in Shares while they are in possession of material price sensitive information, Directors and management will only be permitted to deal in Shares during certain ‘window periods’, following the release of the Company’s full and half year financial results or the release of a disclosure document offering shares in the Company. Outside of these periods, Directors and management must receive clearance for any proposed dealing in Shares.
Code of Conduct
The Board recognises the need to observe the highest standards of corporate practice and business conduct. Accordingly, the Board has a formal code of conduct, to be followed by all employees and officers. The key aspects of this code are to:
act with honesty, integrity and fairness and in the best interest of the Company;
act in accordance with all applicable laws, regulations, policies and procedures; and
use Company resources and property properly.
Communications with Shareholders
The Company is committed to keeping Shareholders informed of all major developments affecting the Company’s state of affairs relevant to Shareholders in accordance with all applicable laws. Information is communicated to Shareholders through the lodgement of all relevant financial and other information with ASX and NZX and publishing information on the Company’s website (www.kathmanduholdings.com). In particular, the Company’s website will contain information about the Company, including media releases, key policies and the terms of reference of the Company’s Board Committees.
All relevant announcements made to the market and any other relevant information will be posted on the Company’s website as soon as they have been released to the ASX and NZX.

KATHMANDU HOLDINGS LIMITED ANNUAL REPORT 2010 23
PricewaterhouseCoopers119 Armagh StreetPO Box 13244ChristchurchNew ZealandTelephone +64 3 374 3000Facsimile +64 3 374 3001
Auditor’s Independence Declaration
As lead auditor for the audit of Kathmandu Holdings Limited to the year ended 31 July 2010, Ideclare that to the best of my knowledge and belief, there have been:
a) no contraventions of the auditor independence requirements of the Corporations Act 2001in relation to the audit; and
b) no contraventions of any applicable code of professional conduct in relation to the audit.
This declaration is in respect of Kathmandu Holdings Limited and the entities it controlled duringthe year.
Robert HarrishcruhctsirhCrentraP0102rebmetpeS42srepooCesuohretawecirP

24 KATHMANDU HOLDINGS LIMITED ANNUAL REPORT 201024 KATHMANDU HOLDINGS LIMITED ANNUAL REPORT 2010
KATHMANDU HOLDINGS LIMITED ANNUAL REPORT 2010 25
FINANCIAL STATEMENTSFor the year ended 31 July 2010
Directors’ Approval of Financial Statements 26
Consolidated Income Statements 27
Consolidated Statements of Comprehensive Income 28
Consolidated Statements of Changes in Equity 29
Consolidated Balance Sheets 30
Consolidated Statements of Cash Flows 31
Notes to the Financial Statements 32
Auditors’ Report 69
CONTENTS OF NOTES TO FINANCIAL STATEMENTS1 General information 32
2 Summary of significant accounting policies 32
3 Standards, Interpretations and amendments to published standards 38
4 Expenses 39
5 Costs associated with the Initial Public Offering (IPO) 40
6 Income tax expense 41
7 Reconciliation of net profit after taxation with cash inflow from operating activities 42
8 Cash and cash equivalents 43
9 Trade and other receivables 43
10 Related party disclosures 44
11 Derivative financial instruments 48
12 Inventories 48
13 Property, plant and equipment 49
14 Intangible assets 50
15 Investment in subsidiaries 51
16 Deferred taxation 52
17 Trade and other payables 53
18 Interest bearing liabilities 53
19 Contributed equity - ordinary shares 54
20 Employee Share Option Plan 55
21 Reverse Acquisition 56
22 Reserves and retained earnings 57
23 Dividends 58
24 Remuneration of auditors 58
25 Contingent liabilities 58
26 Contingent assets 59
27 Commitments 59
28 Financial risk management 60
29 Segmental information 65
30 Earnings per Share 66
31 Comparison against Prospectus Forecast 67
32 Events occurring after the balance date 68

26 KATHMANDU HOLDINGS LIMITED ANNUAL REPORT 2010
DIRECTORS’ APPROVAL OF FINANCIAL STATEMENTSfor the year ended 31 July 2010
AUTHORISATION FOR ISSUE
The Board of Directors authorised the issue of these Financial Statements on 24 September 2010.
APPROVAL BY DIRECTORS
The Directors are pleased to present the Financial Statements of Kathmandu Holdings Limited for the year ending 31 July 2010 on pages 25 to 68.
24 September 2010 Director Date
24 September 2010 Director Date
For and on behalf of the Board of Directors
Director Date

KATHMANDU HOLDINGS LIMITED ANNUAL REPORT 2010 27
CONSOLIDATED INCOME STATEMENTSfor the year ended 31 July 2010
Group Parent
Note 2010NZ$’000
2009NZ$’000
2010NZ$’000
2009NZ$’000
Sales revenue 245,812 215,580 - -
Cost of sales (90,523) (76,820) - -
Gross profit 155,289 138,760 - -
Selling expenses 4 (77,556) (66,380) - -
Administration and general expenses 4 (29,278) (29,393) (1,235) -
48,455 42,987 (1,235) -
Finance income 2,277 696 (2) -
Finance expenses (11,934) (18,534) - -
Finance costs - net 4 (9,657) (17,838) (2) -
Profit before income tax and costs associated with IPO 38,798 25,149 (1,233) -
Costs associated with IPO 5 (16,834) - (11,572) -
Profit / (loss) before income tax 21,964 25,149 (12,805) -
Income tax (expense)/benefit 6 (12,577) (10,247) 446 -
Profit / (loss) after income tax 9,387 14,902 (12,359) -
Basic earnings per share 30 0.3cps 0.2cps
Diluted earnings per share 30 0.3cps 0.2cps
Weighted average basic ordinary shares outstanding (‘000) 30 2,754,829 9,096,006
Weighted average diluted ordinary shares outstanding (‘000) 30 2,755,608 9,096,006

28 KATHMANDU HOLDINGS LIMITED ANNUAL REPORT 2010
Group Parent
Note2010
NZ$’0002009
NZ$’0002010
NZ$’0002009
NZ$’000
Profit / (loss) after tax 9,387 14,902 (12,359) -
Movement in cash flow hedge reserve 22 (2,580) 4,201 - -
Movement in foreign currency translation reserve 22 (1,515) (360) - -
Other comprehensive income for the year, net of tax (4,095) 3,841 (12,359) -
Total comprehensive income for the year attributable to shareholders 5,292 18,743 (12,359) -
CONSOLIDATED STATEMENTS OF COMPREHENSIVE INCOMEfor the year ended 31 July 2010

KATHMANDU HOLDINGS LIMITED ANNUAL REPORT 2010 29
CONSOLIDATED STATEMENTS OF CHANGES IN EQUITYfor the year ended 31 July 2010
GroupShare
Capital
Cash Flow
Hedge Reserve
Foreign Currency
Translation Reserve
Employee Share Option
Reserve
Retained earnings
Total Equity
NZ$’000 NZ$’000 NZ$’000 NZ$’000 NZ$’000 NZ$’000
Balance as at 31 July 2008 96,359 (5,621) 4,355 - 19,063 114,156
Total comprehensive income and expense - 4,201 (360) - 14,902 18,743
Dividends paid - - - - - -
Issue of share capital 186 - - - - 186
Repurchase of share capital (399) - - - - (399)
Reverse acquisition share capital - - - - - -
Movement in employee share entitlement reserve - - - - - -
Movement in employee share option reserve - - - - - -
Balance as at 31 July 2009 96,146 (1,420) 3,995 - 33,965 132,686
Total comprehensive income and expense - (2,580) (1,515) - 9,387 5,292
Dividends paid - - - - - -
Issue of share capital 100,903 - - - - 100,903
Movement in employee share entitlement reserve - - - - - -
Movement in employee share option reserve - - 246 - 246
Balance as at 31 July 2010 197,049 (4,000) 2,480 246 43,352 239,127
ParentShare
Capital
Cash Flow
Hedge Reserve
Foreign Currency
Translation Reserve
Employee Share Option
Reserve
Retained earnings
Total Equity
NZ$’000 NZ$’000 NZ$’000 NZ$’000 NZ$’000 NZ$’000
Balance as at 31 July 2008 - - - - - -
Total comprehensive income and expense - - - - - -
Dividends paid - - - - - -
Issue of share capital - - - - - -
Repurchase of share capital - - - - - -
Reverse acquisition share capital - - - - - -
Movement in employee share entitlement reserve - - - - - -
Movement in employee share option reserve - - - - - -
Balance as at 31 July 2009 - - - - - -
Total comprehensive income and expense - - - - (12,359) (12,359)
Dividends paid - - - - - -
Issue of share capital 422,137 - - - - 422,137
Movement in employee share entitlement reserve - - - - - -
Movement in employee share option reserve - - - 246 - 246
Balance as at 31 July 2010 422,137 - - 246 (12,359) 410,024

30 KATHMANDU HOLDINGS LIMITED ANNUAL REPORT 2010
CONSOLIDATED BALANCE SHEETSfor the year ended 31 July 2010
Group Parent
Note2010
NZ$’0002009
NZ$’0002010
NZ$’0002009
NZ$’000
ASSETS
Current assets
Cash and cash equivalents 8 4,736 32,209 6 -
Trade and other receivables 9 3,903 2,629 181 -
Related party receivable 10 - - 88,225 -
Derivative financial instruments 11 - 1,524 - -
Inventories 12 37,416 39,613 - -
Current tax assets - - 1 -
Employee share scheme loan 20 - 2,286 - -
Total current assets 46,055 78,261 88,413 -
Non-current assets
Property, plant and equipment 13 28,018 21,326 - -
Intangible assets 14 241,825 243,855 - -
Derivative financial instruments 11 44 828 - -
Investment in subsidiaries 15 - - 321,234 -
Deferred tax 16 3,472 5,1 15 445 -
Total non-current assets 273,359 271,124 321,679 -
Total assets 319,414 349,385 410,092 -
LIABILITIES
Current liabilities
Trade and other payables 17 16,891 17,879 68 -
Derivative financial instruments 11 4,819 4,636 - -
Interest bearing liabilities 18 - 5,917 - -
Current tax liabilities 4,297 6,010 - -
Total current liabilities 26,007 34,442 68 -
Non-current liabilities
Derivative financial instruments 11 315 218 - -
Interest bearing liabilities 18 53,965 182,039 - -
Total non-current liabilities 54,280 182,257 - -
Total liabilities 80,287 216,699 68 -
Net assets 239,127 132,686 410,024 -
EQUITY
Contributed equity - ordinary shares 19 197,049 96,146 422,137 -
Reserves 22 (1,274) 2,575 246 -
Retained earnings 22 43,352 33,965 (12,359) -
Total equity 239,127 132,686 410,024 -

KATHMANDU HOLDINGS LIMITED ANNUAL REPORT 2010 31
CONSOLIDATED STATEMENTS OF CASH FLOWSfor the year ended 31 July 2010
Group Parent
Note2010
NZ$’0002009
NZ$’0002010
NZ$’0002009
NZ$’000
Cash flows from operating activities
Cash was provided from:
Receipts from customers 244,422 215,230 - -
Interest received 258 286 2 -
244,680 215,516 2 -
Cash was applied to:
Payments to suppliers and employees 189,699 167,646 (257) -
Income tax paid 11,904 6,104 - -
Interest paid 10,474 17,081 - -
212,077 190,831 (257) -
Net cash inflow from operating activities 7 32,603 24,685 (255) -
Cash flows from investing activities
Cash was provided from:
Proceeds from sale of property, plant and equipment 9 8 - -
9 8 - -
Cash was applied to:
Purchase of property, plant and equipment 13 12,823 7,313 - -
Purchase of Intangibles 14 746 827 - -
13,569 8,140 - -
Net cash (outflow) from investing activities (13,560) (8,132) - -
Cash flows from financing activities
Cash was provided from:
Proceeds from share issue 21 105,426 - - -
Proceeds of loan advances 126,884 47,593 261 -
232,310 47,593 261 -
Cash was applied to:
Repurchase of shares - 50 - -
Costs associated with IPO 5 21,357 - - -
Repayment of loan advances 258,511 52,394 - -
279,868 52,444 - -
Net cash inflow / (outflow) from financing activities (47,558) (4,851) 261 -
Net increase / (decrease) in cash held (28,515) 11,702 6 -
Opening cash and cash equivalents 32,209 20,868 - -
Effect of foreign exchange rates 1,042 (361) - -
Closing Cash 8 4,736 32,209 6 -
The parent company bank account was not opened until after the IPO, thus the parent cash flow statement only reflects cash movements after listing of Kathmandu Holdings Limited.

32 KATHMANDU HOLDINGS LIMITED ANNUAL REPORT 2010
NOTES TO FINANCIAL STATEMENTS
1 General information
Kathmandu Holdings Limited (the Company) and its subsidiaries (together the Group) is a designer, marketer and retailer of clothing and equipment for travel and adventure. It operates in New Zealand, Australia and the United Kingdom.
The Company is a limited liability company incorporated and domiciled in New Zealand. The address of its registered office is 11 Mary Muller Drive, Heathcote, Christchurch.
These audited consolidated financial statements have been approved for issue by the Board of Directors on 24 September 2010.
2 Summary of significant accounting policies
These financial statements have been prepared in accordance with Generally Accepted Accounting Practice in New Zealand. They comply with the New Zealand Equivalents to International Financial Reporting Standards (NZ IFRS) and other applicable Financial Reporting Standards, as appropriate for profit-oriented entities. The financial statements also comply with International Financial Reporting Standards (IFRS).
The reporting currency used in the preparation of these consolidated financial statements is New Zealand dollars, rounded where necessary to the nearest thousand dollars.
(a) Basis of preparation
The principal accounting policies adopted in the preparation of the financial statements are set out below. These policies have been consistently applied to all periods presented, unless otherwise stated.
Reverse Acquisition
The acquisition of Milford Group Holdings Limited by Kathmandu Holdings Limited was recognised as a reverse acquisition and the consolidated financial statements have therefore been prepared as a continuation of the financial statements of the accounting acquirer, Milford Group Holdings Limited. Accordingly, consolidated comparative information is provided for the balance sheet and related information as at 31 July 2009 and for the income statement, cashflow statement, statement of changes in equity and related information for the year to 31 July 2009 of Milford Group Holdings Limited and its controlled entities.
As a result:
The retained earnings of the Group represent the retained earnings of Milford Group Holdings Limited from the date of its incorporation, plus the results of other combining entities from the date of acquisition.
The consolidated balance sheet comprises the existing
consolidated net assets of Milford Group Holdings Limited and its controlled entities measured at their historical cost, except for derivatives which are measured at fair value, plus the fair value of the net assets of the other combining entities.
The comparatives for the consolidated income statement, statement of cashflows and statement of changes in equity comprises the resulting consolidated statements of Milford Group Holdings Limited and its controlled entities.
Entities reporting
The financial statements for the “Parent” are for Kathmandu Holdings Limited as a separate legal entity.
The consolidated financial statements for the “Group” are for the economic entity comprising Kathmandu Holdings Limited and its subsidiaries. The Group consists of:
Kathmandu Holdings Limited Parent Company
Milford Group Holdings Limited 100% owned by Kathmandu Holdings Limited
Kathmandu Limited 100% owned by Milford Group Holdings Limited
Kathmandu Pty Limited 100% owned by Milford Group Holdings Limited
Kathmandu (U.K.) Limited 100% owned by Milford Group Holdings Limited
The Company and Group are designated as profit oriented entities for financial reporting purposes.
Statutory base
Kathmandu Holdings Limited is a company registered under the Companies Act 1993 (New Zealand).
The financial statements have been prepared in accordance with the requirements of the Financial Reporting Act 1993 and the Companies Act 1993 (New Zealand).
Historical cost convention
These financial statements have been prepared under the historical cost convention, as modified by the revaluation of certain assets as identified in specific accounting policies below.
Critical accounting estimates
The Group makes estimates and assumptions concerning the future. The resulting accounting estimates will, by definition, seldom equal the related actual results. The estimates and assumptions that have a significant risk of causing a material adjustment to the carrying amounts of assets and liabilities within the next financial year are discussed below.

KATHMANDU HOLDINGS LIMITED ANNUAL REPORT 2010 33
(i) Estimated impairment of goodwill and brands
The Group tests annually whether goodwill and brands have suffered any impairment; in accordance with the accounting policy stated in note 2 (q) (i) & (ii). The recoverable amounts of cash-generating units have been determined based on the fair value less cost to sell calculation. These calculations require the use of estimates (note 14).
(ii) Stock obsolescence
The Group assesses the likely residual value of inventory. A stock provision is recognised for stock which is selling for less than cost. Any increase in these provisions is taken as a reduction to inventory on the balance sheet and expensed into gross profit on the income statement.
(b) Principles of consolidation
(i) Subsidiaries
Subsidiaries are all entities (including special purpose entities) over which the Group has the power to govern the financial and operating policies generally accompanying a shareholding of more than one half of the voting rights. The existence and effect of potential voting rights that are currently exercisable or convertible are considered when assessing whether the Group controls another entity. Subsidiaries are fully consolidated from the date on which control is transferred to the Group. They are de-consolidated from the date that control ceases.
The acquisition method of accounting is used to account for business combinations by the Group. The consideration transferred for the acquisition of a subsidiary is the fair values of the assets transferred, the liabilities incurred and the equity interests issued by the Group. The consideration transferred includes the fair value of any asset or liability resulting from a contingent consideration arrangement. Acquisition-related costs are expensed as incurred. Identifiable assets acquired and liabilities and contingent liabilities assumed in a business combination are measured initially at their fair values at the acquisition date. On an acquisition-by-acquisition basis, the Group recognises any non-controlling interest in the acquiree either at fair value or at the non-controlling interest’s proportionate share of the acquiree’s net assets.
The excess of the consideration transferred over the amount of any non-controlling interest in the acquiree and the acquisition date fair value of any previous equity interest in the acquiree over the fair value of the Group’s share of the identifiable net assets acquired is recorded as goodwill. If this is less than the fair value of the net assets of the subsidiary acquired in the case of a bargain purchase, the difference is recognised directly in the statement of comprehensive income.
Inter-company transactions, balances and unrealised gains on transactions between Group companies are eliminated. Unrealised losses are also eliminated. Accounting policies of subsidiaries have been changed where necessary to ensure consistency with the policies adopted by the Group.
(ii) Transactions and non-controlling interests
The Group treats transactions with non-controlling interests as transactions with equity owners of the Group. For purchases from non-controlling interests, the difference between any consideration paid and the relevant share acquired of the carrying value of net assets of the subsidiary is recorded in equity. Gains or losses on disposals to non-controlling interests are also recorded in equity.
(c) Segment reporting
An operating segment is a component of an entity that engages in business activities which earns revenue and incurs expenses and where the chief decision maker reviews the operating results on a regular basis and makes decisions on resource allocation. The Group is organised into three operating segments, depicting the three geographical regions the Group operates in.
(d) Foreign currency translation
(i) Functional and presentation currency
Items included in the financial statements of each of the subsidiaries’ operations are measured using the currency of the primary economic environment in which it operates (‘functional currency’). The financial statements are presented in New Zealand dollars, which is the Company’s functional currency and Group’s presentation currency.
(ii) Transactions and balances
Foreign currency transactions are translated into the functional currency using the exchange rates prevailing at the dates of the transaction. Foreign exchange gains and losses resulting from the settlement of such transactions and from the translation at year end exchange rates of monetary assets and liabilities denominated in foreign currencies are recognised in the income statement, except when deferred in equity as qualifying cash flow hedges. Translation differences on non-monetary financial assets and liabilities are reported as part of the fair value gain or loss.
(iii) Group companies
The results and financial position of all the Group entities (none of which has the currency of a hyper-inflationary economy) that have a functional currency different from the presentation currency are translated into the presentation currency as follows:
Assets and liabilities for each balance sheet presented are translated at the closing rate at the date of that balance sheet;
Income and expenses for each income statement are translated at average exchange rates (unless this average is not a reasonable approximation of the cumulative effect of the rates prevailing on the transaction dates, in which case income and expenses are translated at the rate on the dates of the transactions); and
All resulting exchange differences are recognised as a separate component of equity.

34 KATHMANDU HOLDINGS LIMITED ANNUAL REPORT 2010
On consolidation, exchange differences arising from the translation of the net investment in foreign operations, and of borrowings and other currency instruments designated as hedges of such investments, are taken to shareholders’ equity. When a foreign operation is partially disposed of or sold, exchange differences that were recorded in equity are recognised in the income statement as part of the gain or loss on sale.
Goodwill and fair value adjustments arising on the acquisition of a foreign entity are treated as assets and liabilities of the foreign entity and translated at the closing rate.
(e) Revenue recognition
Revenue comprises the fair value of the consideration received or receivable for the sale of goods and services, excluding Goods and Services Tax, rebates and discounts and after eliminating sales within the Group. Revenue is recognised as follows:
(i) Sales of goods
Sales of goods are recognised when a Group entity has delivered a product to the customer. Retail sales are usually in cash or by credit card. The recorded revenue is the gross amount of sale (excluding GST), including credit card fees payable for the transaction. Such fees are included in selling expenses.
(ii) Sales of services
Management fees are recognised in the accounting period in which the services are rendered.
(iii) Interest income
Interest income is recognised on a time-portion basis using the effective interest method.
(iv) Dividend income
Dividend income is recognised when the right to receive payment is established.
(f) Current and deferred income tax
The tax expense for the year comprises current and deferred tax. Tax is recognised in the income statement, except to the extent that it relates to items recognised directly in equity. In this case, the tax is also recognised in equity.
The current income tax charge is calculated on the basis of the tax laws enacted or substantively enacted at the balance sheet date in the countries where the company’s subsidiaries operate and generate taxable income. Management periodically evaluates positions taken in tax returns with respect to situations in which applicable tax regulations is subject to interpretation and establishes provisions where appropriate on the basis of amounts expected to be paid to the tax authorities.
Deferred income tax is provided in full, using the liability method, on temporary differences arising between tax bases of assets and liabilities and their carrying amounts in the consolidated financial statements. However, the deferred income tax is not accounted for if it arises from initial recognition of an asset or liability in a transaction
other than a business combination that at the time of the transaction affects neither accounting nor taxable profit or loss. Deferred income tax is determined using tax rates (and laws) that have been enacted or substantially enacted by the balance sheet date and are expected to apply when the related deferred income tax asset is realised or the deferred income tax liability is settled.
Deferred income tax assets are recognised to the extent that it is probable that future taxable profit will be available against which the temporary differences can be utilised.
Deferred income tax is provided on temporary differences arising on investments in subsidiaries and associates, except where the timing of the reversal of the temporary difference is controlled by the group and it is probable that the temporary difference will not reverse in the foreseeable future.
(g) Goods and Services Tax (GST)
The income statement and the cash flow statement have been prepared so that all components are stated exclusive of GST. All items in the balance sheet are stated net of GST, with the exception of receivables and payables, which include GST invoiced.
(h) Leases
The Group is the lessee
Leases in which a significant portion of the risks and rewards of ownership are retained by the lessor are classified as operating leases. Payments made under operating leases (net of any incentives received from the lessor) are charged to the income statement on a straight-line basis over the period of the lease.
(i) Impairment of non financial assets
Assets are reviewed for impairment whenever events or changes in circumstances indicate that the carrying amount may not be recoverable. Intangible assets that have an indefinite useful life, including goodwill, are not subject to amortisation and are tested annually for impairment irrespective of whether any circumstances identifying a possible impairment have been identified. An impairment loss is recognised for the amount by which the asset’s carrying amount exceeds its recoverable amount. The recoverable amount is the higher of an asset’s fair value less costs to sell and value in use.
For the purposes of assessing impairment, assets are grouped at the lowest levels for which there are separately identifiable cash flows (cash generating units).
(j) Cash and cash equivalents
Cash and cash equivalents includes cash on hand, deposits held at call with financial institutions, other short-term, highly liquid investments with original maturities of three months or less that are readily convertible to known amounts of cash and which are subject to an insignificant risk of changes in value, and bank overdrafts. Bank overdrafts are shown within borrowings in current liabilities on the balance sheet.

KATHMANDU HOLDINGS LIMITED ANNUAL REPORT 2010 35
(k) Trade receivables
Trade receivables are recognised initially at fair value and subsequently measured at amortised cost, less provision for doubtful debts.
The collectability of trade receivables is reviewed on an ongoing basis. Debts, which are known to be uncollectible, are written off. A provision for doubtful receivables is established when there is objective evidence that the Group will not be able to collect all amounts due according to the original terms of receivables. Significant financial difficulties of the debtor, probability that the debtor will enter bankruptcy or financial reorganisation, and default or delinquency in payments are considered indicators that the trade receivable is impaired. The amount of the provision is the difference between the asset’s carrying amount and the present value of estimated future cash flows, discounted at the effective interest rate. The amount of the provision is recognised in the income statement.
(l) Inventories
Inventories are stated at the lower of cost and net realisable value. Cost is determined on a weighted average cost method and includes expenditure incurred in acquiring the inventories and bringing them to their existing location and condition. Net realisable value is the estimated selling price in the ordinary course of business, less applicable variable selling expenses.
(m) Investments and other financial assets
The Group classifies its investments in the following categories: loans and receivables and financial assets at fair value through profit or loss. The classification depends on the purpose for which the investments were acquired. Management determines the classification of its investments at the initial recognition and re-evaluates this designation at every reporting date.
(i) Loans and receivables
Loans and receivables are non derivative financial assets with fixed or determinable payments that are not quoted in an active market. They arise when the Group provides money, goods or services directly to a debtor with no intention of selling the receivable. They are included in current assets, except for those with maturities greater than 12 months after the balance sheet date which are classified as non-current assets.
(ii) Financial assets at fair value through profit or loss
Financial assets at fair value through profit or loss are financial assets held for trading. A financial asset is classified in this category if acquired principally for the purpose of selling in the short-term. Derivatives are also categorised as held for trading unless they are designated as hedges. Assets in this category are classified as current assets.
Financial assets carried at fair value through profit or loss are initially recognised at fair value, and transaction costs are expensed in the income statement. Financial assets are derecognised when the rights to receive cash flows from
the investments have expired or have been transferred and the group has transferred substantially all risks and rewards of ownership. Loans and receivables are carried at amortised cost using the effective interest method.
Gains or losses arising from changes in the fair value of ‘financial assets at fair value through profit or loss’ are presented in the income statement, except for foreign exchange movements on monetary assets, which are recognised in the income statement within ‘finance costs – net’. Dividend income from financial assets at fair value through profit or loss is recognised in the income statement as part of other income when the Group’s right to receive payments is established.
The Group assesses at each balance sheet date whether there is objective evidence that a financial asset of a group of financial assets is impaired. In the case of equity securities classified as available for sale, a significant or prolonged decline in the fair value of the security below its cost is considered in determining whether the securities are impaired. If any such evidence exists for available for sale financial assets, the cumulative loss – measured as the difference between the acquisition cost and the current fair value, less any impairment loss on that financial asset previously recognised in profit or loss – is removed from equity and recognised in the income statement. Impairment losses recognised in the income statement on equity instruments are not reversed through the income statement.
(n) Derivatives
Derivatives are initially recognised at fair value on the date a derivative contract is entered into and are subsequently remeasured to their fair value. The method of recognising the resulting gain or loss depends on whether the derivative is designated as a hedging instrument, and if so, the nature of the item being hedged. The Group designates certain derivatives as either; (1) hedges of the fair value of recognised assets or liabilities or a firm commitment (fair value hedge); or (2) hedges of highly probable forecast transactions (cash flow hedges).
The Group documents at the inception of the transaction the relationship between hedging instruments and hedged items, as well as its risk management objective and strategy for undertaking various hedge transactions. The Group also documents its assessment, both at hedge inception and on an ongoing basis, of whether the derivatives that are used in hedging transactions have been and will continue to be highly effective in offsetting changes in fair values or cash flows of hedged items.
(i) Fair value hedge
Changes in the fair value of derivatives that are designated and qualify as fair value hedges are recorded in the income statement, together with any changes in the fair value of the hedged asset or liability that are attributable to the hedged risk.
If the hedge no longer meets the criteria for hedge accounting, the adjustment to the carrying amount of a
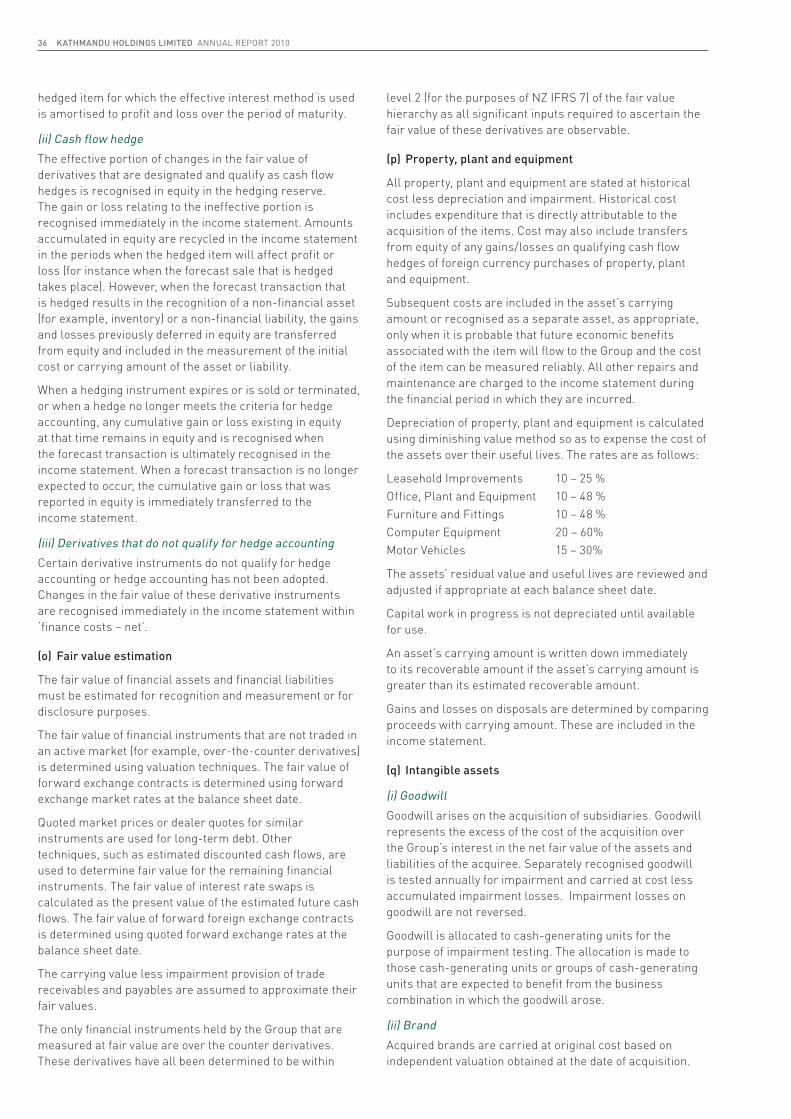
36 KATHMANDU HOLDINGS LIMITED ANNUAL REPORT 2010
hedged item for which the effective interest method is used is amortised to profit and loss over the period of maturity.
(ii) Cash flow hedge
The effective portion of changes in the fair value of derivatives that are designated and qualify as cash flow hedges is recognised in equity in the hedging reserve. The gain or loss relating to the ineffective portion is recognised immediately in the income statement. Amounts accumulated in equity are recycled in the income statement in the periods when the hedged item will affect profit or loss (for instance when the forecast sale that is hedged takes place). However, when the forecast transaction that is hedged results in the recognition of a non-financial asset (for example, inventory) or a non-financial liability, the gains and losses previously deferred in equity are transferred from equity and included in the measurement of the initial cost or carrying amount of the asset or liability.
When a hedging instrument expires or is sold or terminated, or when a hedge no longer meets the criteria for hedge accounting, any cumulative gain or loss existing in equity at that time remains in equity and is recognised when the forecast transaction is ultimately recognised in the income statement. When a forecast transaction is no longer expected to occur, the cumulative gain or loss that was reported in equity is immediately transferred to the income statement.
(iii) Derivatives that do not qualify for hedge accounting
Certain derivative instruments do not qualify for hedge accounting or hedge accounting has not been adopted. Changes in the fair value of these derivative instruments are recognised immediately in the income statement within ‘finance costs – net’.
(o) Fair value estimation
The fair value of financial assets and financial liabilities must be estimated for recognition and measurement or for disclosure purposes.
The fair value of financial instruments that are not traded in an active market (for example, over-the-counter derivatives) is determined using valuation techniques. The fair value of forward exchange contracts is determined using forward exchange market rates at the balance sheet date.
Quoted market prices or dealer quotes for similar instruments are used for long-term debt. Other techniques, such as estimated discounted cash flows, are used to determine fair value for the remaining financial instruments. The fair value of interest rate swaps is calculated as the present value of the estimated future cash flows. The fair value of forward foreign exchange contracts is determined using quoted forward exchange rates at the balance sheet date.
The carrying value less impairment provision of trade receivables and payables are assumed to approximate their fair values.
The only financial instruments held by the Group that are measured at fair value are over the counter derivatives. These derivatives have all been determined to be within
level 2 (for the purposes of NZ IFRS 7) of the fair value hierarchy as all significant inputs required to ascertain the fair value of these derivatives are observable.
(p) Property, plant and equipment
All property, plant and equipment are stated at historical cost less depreciation and impairment. Historical cost includes expenditure that is directly attributable to the acquisition of the items. Cost may also include transfers from equity of any gains/losses on qualifying cash flow hedges of foreign currency purchases of property, plant and equipment.
Subsequent costs are included in the asset’s carrying amount or recognised as a separate asset, as appropriate, only when it is probable that future economic benefits associated with the item will flow to the Group and the cost of the item can be measured reliably. All other repairs and maintenance are charged to the income statement during the financial period in which they are incurred.
Depreciation of property, plant and equipment is calculated using diminishing value method so as to expense the cost of the assets over their useful lives. The rates are as follows:
Leasehold Improvements 10 – 25 %Office, Plant and Equipment 10 – 48 %Furniture and Fittings 10 – 48 %Computer Equipment 20 – 60%Motor Vehicles 15 – 30%
The assets’ residual value and useful lives are reviewed and adjusted if appropriate at each balance sheet date.
Capital work in progress is not depreciated until available for use.
An asset’s carrying amount is written down immediately to its recoverable amount if the asset’s carrying amount is greater than its estimated recoverable amount.
Gains and losses on disposals are determined by comparing proceeds with carrying amount. These are included in the income statement.
(q) Intangible assets
(i) Goodwill
Goodwill arises on the acquisition of subsidiaries. Goodwill represents the excess of the cost of the acquisition over the Group’s interest in the net fair value of the assets and liabilities of the acquiree. Separately recognised goodwill is tested annually for impairment and carried at cost less accumulated impairment losses. Impairment losses on goodwill are not reversed.
Goodwill is allocated to cash-generating units for the purpose of impairment testing. The allocation is made to those cash-generating units or groups of cash-generating units that are expected to benefit from the business combination in which the goodwill arose.
(ii) Brand
Acquired brands are carried at original cost based on independent valuation obtained at the date of acquisition.
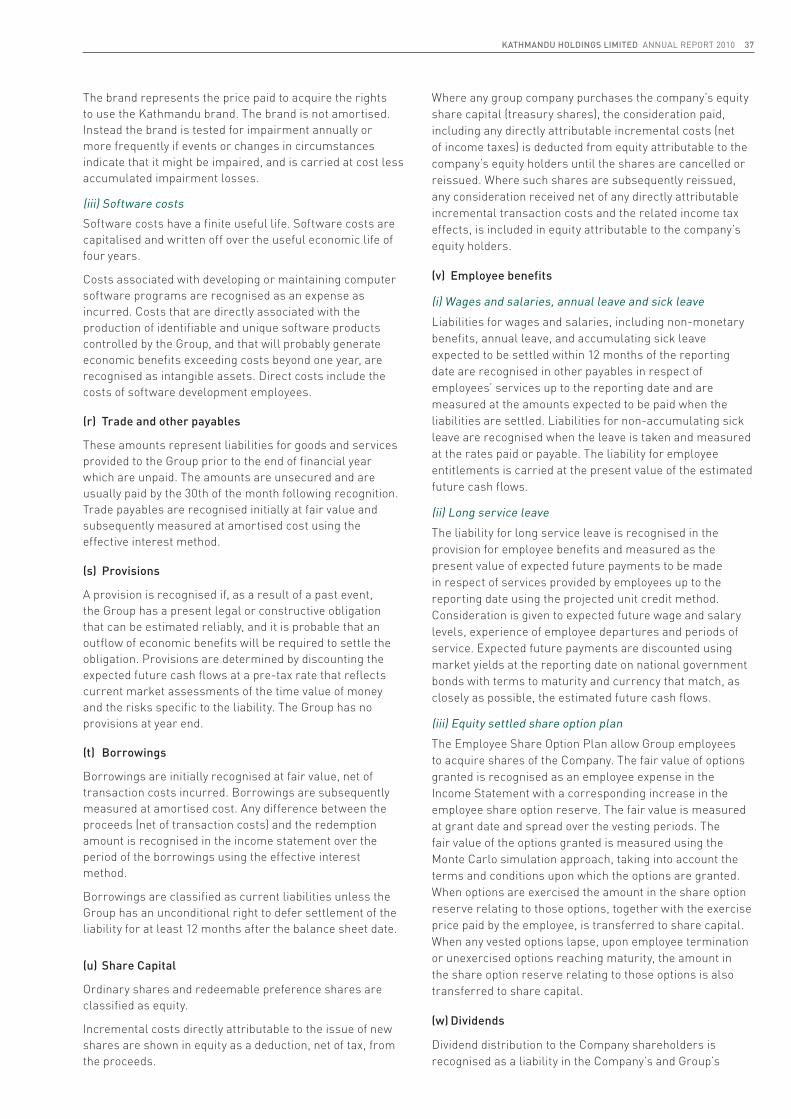
KATHMANDU HOLDINGS LIMITED ANNUAL REPORT 2010 37
The brand represents the price paid to acquire the rights to use the Kathmandu brand. The brand is not amortised. Instead the brand is tested for impairment annually or more frequently if events or changes in circumstances indicate that it might be impaired, and is carried at cost less accumulated impairment losses.
(iii) Software costs
Software costs have a finite useful life. Software costs are capitalised and written off over the useful economic life of four years.
Costs associated with developing or maintaining computer software programs are recognised as an expense as incurred. Costs that are directly associated with the production of identifiable and unique software products controlled by the Group, and that will probably generate economic benefits exceeding costs beyond one year, are recognised as intangible assets. Direct costs include the costs of software development employees.
(r) Trade and other payables
These amounts represent liabilities for goods and services provided to the Group prior to the end of financial year which are unpaid. The amounts are unsecured and are usually paid by the 30th of the month following recognition. Trade payables are recognised initially at fair value and subsequently measured at amortised cost using the effective interest method.
(s) Provisions
A provision is recognised if, as a result of a past event, the Group has a present legal or constructive obligation that can be estimated reliably, and it is probable that an outflow of economic benefits will be required to settle the obligation. Provisions are determined by discounting the expected future cash flows at a pre-tax rate that reflects current market assessments of the time value of money and the risks specific to the liability. The Group has no provisions at year end.
(t) Borrowings
Borrowings are initially recognised at fair value, net of transaction costs incurred. Borrowings are subsequently measured at amortised cost. Any difference between the proceeds (net of transaction costs) and the redemption amount is recognised in the income statement over the period of the borrowings using the effective interest method.
Borrowings are classified as current liabilities unless the Group has an unconditional right to defer settlement of the liability for at least 12 months after the balance sheet date.
(u) Share Capital
Ordinary shares and redeemable preference shares are classified as equity.
Incremental costs directly attributable to the issue of new shares are shown in equity as a deduction, net of tax, from the proceeds.
Where any group company purchases the company’s equity share capital (treasury shares), the consideration paid, including any directly attributable incremental costs (net of income taxes) is deducted from equity attributable to the company’s equity holders until the shares are cancelled or reissued. Where such shares are subsequently reissued, any consideration received net of any directly attributable incremental transaction costs and the related income tax effects, is included in equity attributable to the company’s equity holders.
(v) Employee benefits
(i) Wages and salaries, annual leave and sick leave
Liabilities for wages and salaries, including non-monetary benefits, annual leave, and accumulating sick leave expected to be settled within 12 months of the reporting date are recognised in other payables in respect of employees’ services up to the reporting date and are measured at the amounts expected to be paid when the liabilities are settled. Liabilities for non-accumulating sick leave are recognised when the leave is taken and measured at the rates paid or payable. The liability for employee entitlements is carried at the present value of the estimated future cash flows.
(ii) Long service leave
The liability for long service leave is recognised in the provision for employee benefits and measured as the present value of expected future payments to be made in respect of services provided by employees up to the reporting date using the projected unit credit method. Consideration is given to expected future wage and salary levels, experience of employee departures and periods of service. Expected future payments are discounted using market yields at the reporting date on national government bonds with terms to maturity and currency that match, as closely as possible, the estimated future cash flows.
(iii) Equity settled share option plan
The Employee Share Option Plan allow Group employees to acquire shares of the Company. The fair value of options granted is recognised as an employee expense in the Income Statement with a corresponding increase in the employee share option reserve. The fair value is measured at grant date and spread over the vesting periods. The fair value of the options granted is measured using the Monte Carlo simulation approach, taking into account the terms and conditions upon which the options are granted. When options are exercised the amount in the share option reserve relating to those options, together with the exercise price paid by the employee, is transferred to share capital. When any vested options lapse, upon employee termination or unexercised options reaching maturity, the amount in the share option reserve relating to those options is also transferred to share capital.
(w) Dividends
Dividend distribution to the Company shareholders is recognised as a liability in the Company’s and Group’s

38 KATHMANDU HOLDINGS LIMITED ANNUAL REPORT 2010
financial statements in the period in which the dividends are approved by the Company’s shareholders.
(x) Cash Flow Statement
The following are definitions of the terms used in the Cash Flow Statement:
a. Cash comprises; cash at bank, cash on hand and overdraft balances;
b. Investing activities are those activities relating to the acquisition, holding and disposal of property, plant and equipment and of investments. Investments can include securities not falling within the definition of cash;
c. Financing activities are those activities which result in changes in the size and composition of the capital structure of the Company;
d. Operating activities include all transactions and other events that are not investing or financing activities.
(y) Changes in accounting policies
There were no changes in the accounting policies during the period.
3 Standards, Interpretations and amendments to published standards
The following new standards and amendments to standards are mandatory and are required to be applied for the first time for financial years beginning on or after 1 July 2009.
NZ IAS 1: Presentation of Financial Statements (revised)
The revised standard requires ‘non-owner changes in equity’ to be presented separately from owner changes in equity. All ‘non-owner changes in equity’ are required to be shown in a performance statement.
Entities can choose whether to present one performance statement (the statement of comprehensive income) or two statements (the income statement and statement of comprehensive income). The Group has elected to present two statements; an income statement and a statement of comprehensive income.
NZ IFRS 7: Financial instruments – Disclosures (amendment)
The amendment requires enhanced disclosures about fair value measurement and liquidity risk. In particular, the amendment requires disclosure of fair value measurements by level of the following fair value measurement hierarchy:
• Quoted prices (unadjusted) in active markets for identical assets or liabilities (level 1),
• Inputs other than quoted prices included within level 1 that are observable for the asset or liability, either directly (that is, as prices) or indirectly (that is, derived from prices) (level 2),
• Inputs for the asset or liability that are not based on observable market data (that is, unobservable inputs) (level 3).
This change in accounting standard results in additional disclosure only.
The following are standards, amendments and interpretations to existing standards applicable to the Group but are not yet effective and have not been early adopted by the Group:
NZ IFRS 9: Financial Instruments (effective from 1 January 2013)
The standard replaces part of NZ IAS 39 and establishes two primary measurement categories for financial assets: amortised cost and fair value, with classification depending on an entity’s business model and the contractual cash flow characteristics of the financial asset. The Company is currently in the process of evaluating the potential effect of this standard.

KATHMANDU HOLDINGS LIMITED ANNUAL REPORT 2010 39
4 Expenses
Group Parent
2010NZ$’000
2009NZ$’000
2010NZ$’000
2009NZ$’000
Profit / (loss) before income tax includes the following specific (income) and expenses:
Depreciation
- Leasehold improvements 3,045 2,655 - -
- Office, plant and equipment 394 399 - -
- Furniture and fittings 1,239 990 - -
- Computer equipment 669 658 - -
- Motor vehicles 32 40 - -
Total depreciation 5,379 4,742 - -
Amortisation
- Software 594 827 - -
Total amortisation 594 827 - -
(Gain) / Loss on sale of property, plant and equipment 290 123 - -
Rental and operating lease expenses 25,610 23,080 - -
Directors’ fees 611 117 563 -
Donations 109 125 - -
Employee entitlements:
- Wages, salaries and other short term benefits 41,139 39,481 - -
- Employee share option plan 246 - 246 -
Finance Costs
Interest income (258) (286) (2) -
Interest expense 7,674 17,206 - -
Other finance costs 1,674 515 - -
Net exchange (gain) / loss on foreign currency borrowings 567 403 - -
9,657 17,838 (2) -
Remuneration of auditors is detailed in Note 24.Amortisation expenditure is included in administration expense in the income statement.

40 KATHMANDU HOLDINGS LIMITED ANNUAL REPORT 2010
5 Costs associated with the Initial Public Offering (IPO)
Group Parent
2010NZ$’000
2009NZ$’000
2010NZ$’000
2009NZ$’000
Costs associated with Initial Public Offering:
Charged to income statement 16,834 - 11,572 -
Equity reduction (refer note 19) 4,523 - 4,523 -
21,357 - 16,095 -
The total costs associated with the IPO can be analysed as follows:
(a) Direct IPO Costs 18,306 - 15,714 -
(b) Costs associated with IPO 3,051 - 381 -
Total costs associated with IPO 21,357 - 16,095 -
(a) The direct costs of the IPO include legal, accounting and tax due diligence and advice, Joint Lead Manager’s fees (including the discretionary incentive fee), prospectus design and printing, advertising, marketing, share registry and other expenses. The direct costs have been allocated based on the proportion of new equity raised to the total IPO proceeds and accounted for as either an expense or a reduction in equity as follows:
Reduction in equity 4,523 - 4,523 -
Charged to income statement 13,783 - 11,191 -
18,306 - 15,714 -
(b) The costs associated with the IPO have been expensed and comprise primarily the costs of exiting the previous banking facilities together with the related interest rate swaps.

KATHMANDU HOLDINGS LIMITED ANNUAL REPORT 2010 41
6 Income tax expense
Group Parent
2010NZ$’000
2009NZ$’000
2010NZ$’000
2009NZ$’000
Income statement
Current income tax charge 10,791 10,910 (1) -
Deferred income tax charge 1,786 (663) (445) -
Income tax charge / (credit) reported in income statement 12,577 10,247 (446) -
Reconciliation of effective tax charge
Profit before income tax 21,964 25,149 (12,805) -
Income tax calculated at 30% 6,589 7,544 (3,841) -
Adjustments to taxation:
Adjustments due to different rate in different jurisdictions 76 50 - -
Non-taxable income (559) (352) (71) -
Expenses not deductible for tax purposes 5,143 750 3,461 -
Effect of change in corporate tax rate 12 - 5 -
Utilisation of tax losses by group companies - - - -
Tax expense transferred to foreign currency translation reserve (529) - - -
Adjustments in respect of prior years 1,845 2,255 - -
Income tax charge / (credit) reported in income statement 12,577 10,247 (446) -
On 20 May 2010 the New Zealand Government announced that the company tax rate will reduce from 30% to 28% and tax depreciation on any buildings with an estimated useful life of 50 years or more will reduce to 0%. The changes were substantively enacted on 21 May 2010 and are effective for years beginning on or after 1 August 2011. The effect of these changes on the remeasurement of deferred tax balances has been brought to account in the financial statements for the year ended 31 July 2010.
The balance of Australian franking credits able to be used by the Group as at 31 July 2010, is A$1,399,463.
Unrecognised tax losses
The Group has estimated tax losses to carry forward from Kathmandu (U.K.) Limited of £4,705,832 (NZ$10,120,069) (2009: £3,179,348; (NZ$8,048,982) which can be carried forward to be offset against future profits generated within the UK.
Imputation credits reconciliation Group Parent
2010NZ$’000
2009NZ$’000
2010NZ$’000
2009NZ$’000
Opening balance at 1 August 6,765 2,543 - -
Income tax – paid 9,372 4,210 - -
Resident withholding tax on interest received 15 15 1 -
Dividends received - - - -
Income tax refund received - (3) - -
Dividends paid - - - -
Imputations lost on shareholding change (11,945) - - -
Closing balance at 31 July 4,207 6,765 1 -

42 KATHMANDU HOLDINGS LIMITED ANNUAL REPORT 2010
7 Reconciliation of net profit after taxation with cash inflow from operating activities
Group Parent
2010NZ$’000
2009NZ$’000
2010NZ$’000
2009NZ$’000
Profit after taxation 9,387 14,902 (12,359) -
Movement in working capital:
(Increase) / decrease in receivables and prepayments (1,274) (349) (181) -
(Increase) / decrease in inventories 2,198 (4,018) - -
Increase / (decrease) in trade and other payables (988) 2,845 68 -
Increase / (decrease) in tax liability (1,710) 4,808 - -
(1,774) 3,286 (113) -
Add non cash items:
Depreciation 5,379 4,742 - -
Amortisation of intangibles 594 827 - -
Revaluation of derivative financial instruments 4 2,143 - -
(Increase) / decrease in deferred taxation 1,643 (1,338) (445) -
Cost of Share Options 246 - 246 -
Gain on sale of property, plant and equipment - - - -
Loss on sale of property, plant and equipment 290 123 - -
8,156 6,497 (199) -
Items classified as financing activities:
Costs associated with the IPO 16,834 - - -
Intercompany financing - - 12,416 -
Cash inflow from operating activities 32,603 24,685 (255) -

KATHMANDU HOLDINGS LIMITED ANNUAL REPORT 2010 43
Group Parent
2010NZ$’000
2009NZ$’000
2010NZ$’000
2009NZ$’000
Cash on hand 143 124 - -
Cash at bank 4,593 8,875 6 -
Short term deposits - 23,210 - -
4,736 32,209 6 -
The carrying amount of the Group’s cash and cash equivalents are denominated in the following currencies:
NZD 225 8,857 6 -
AUD 3,747 19,050 - -
GBP 432 1,209 - -
USD 321 3,081 - -
EUR 11 12 - -
4,736 32,209 6 -
8 Cash and cash equivalents
9 Trade and other receivables
Group Parent
2010NZ$’000
2009NZ$’000
2010NZ$’000
2009NZ$’000
Trade receivables - - - -
Sundry debtors and prepayments 3,903 2,629 181 -
3,903 2,629 181 -
Bad and doubtful trade receivables
The Group has recognised a loss of $0 (2009: $0) in respect of bad and doubtful trade receivables during the year ended 31 July 2010.
The carrying amount of the Group’s trade and other receivables are denominated in the following currencies:
NZD 1,181 1,446 137 -
AUD 2,032 407 44 -
GBP 690 599 - -
USD - 177 - -
3,903 2,629 181 -

44 KATHMANDU HOLDINGS LIMITED ANNUAL REPORT 2010
10 Related party disclosures
(a) Key Management Personnel
Parent and Ultimate Controlling Party
Kathmandu Holdings Limited is the immediate parent, ultimate parent and controlling party.
During the year, legal fees of $413,386 were paid to Chapman Tripp for services provided during the IPO, and $112,274 for other services (primarily related to property leases). John Holland is both a Director of Kathmandu Holdings Limited and a Partner of Chapman Tripp.
During the year, operating lease costs of $98,000 were paid to Chalmers Properties Limited, a subsidiary of Port Otago Limited. John Harvey is a Director of both of these companies.
During the 2009 period the company paid fees to Goldman Sachs JB Were of $7,007,804 in relation to their role as Joint Lead Managers of the IPO and for completion of the issue of shares. Goldman Sachs JB Were act as managers of various funds that were shareholders of Milford Group Holdings until the date of the IPO.
The previous shareholders granted to James Strong, with effect from listing, an option to purchase (“Call Option”) 1,764,705 shares. The exercise price of the Call Option is A$1.70 per Option Share. The call option is only exercisable fourteen days after the audited financial results for the year ended 31 July 2010 is reported, and otherwise during a permitted trading window for dealing in the Company’s securities under applicable laws or the Company’s securities trading policy. The Call Option will expire on 23 November 2011.
All subsidiaries within the group (note 15) are related parties. No amounts owed to related parties have been written off or forgiven during the year.
During the year the Company advanced and repaid loans to its subsidiaries by way of an internal current account. In presenting the financial statements of the Group, the effect of transactions and balances between fellow subsidiaries and those with the parent have been eliminated. All transactions with related parties were in the normal course of business and provided on commercial terms.
Material amounts outstanding between the parent and subsidiaries at year end were:
Loans from the parent to subsidiaries (Kathmandu Limited) $88,225,280 (2009: $0).
Loans to the parent from subsidiaries $0 (2009: $0).
Material transactions between the parent and its subsidiaries were:
Management fees charged to subsidiaries $0 (2009: $0)
Group Parent
2010NZ$’000
2009NZ$’000
2010NZ$’000
2009NZ$’000
Salaries 2,013 1,729 - -
Other short-term employee benefits 217 2,661 - -
Termination benefits - - - -
Employee share purchase plans - 313 - -
Employee share option plans 246 - - -
2,476 4,703 - -

KATHMANDU HOLDINGS LIMITED ANNUAL REPORT 2010 45
(b) Non Executive Directors
Group Parent
2010NZ$’000
2009NZ$’000
2010NZ$’000
2009NZ$’000
Total directors fees 611 117 563 -
Share purchase plans - - - -
Share option plans - - - -
611 117 563 -
Directors fees for the Parent company were paid to the following:
James Strong
Sandra McPhee
John Harvey
John Holland
Directors fees for other Group companies were paid to the following shareholding entities on whose behalf the directors appointed prior to the IPO acted:
Goldman Sachs JB Were Trans-Tasman Private Equity Fund 07 Trust A
Goldman Sachs JB Were Trans-Tasman Private Equity Fund 07 Trust B
Goldman Sachs JB Were Trans-Tasman Private Equity Fund 07 - Trust C
Goldman Sachs JB Were – Employee Fixed Trusts
TTPE 07 No. 1 Ltd
Quadrant Private Equity Management Pty Ltd
Special Managed Investment Company No. 80 Ltd
Quadrant Private Equity Services Pty Ltd

46 KATHMANDU HOLDINGS LIMITED ANNUAL REPORT 2010
(c) Remuneration Details (as referred to in the Remuneration report)
2010 Short Term benefits Post employment benefits Share based payments
NameCash
Salary and fees
$
Cashbonus
$
Non-Monetarybenefits
$
Super- annuation
$
RetirementBenefits
$
ShareOptions
$
Proportion ofRemuneration
as equity related%
Total$
Proportion of Remuneration
as performance related
%
Non-Executive Directors
James Strong 225,213 - - - - - - 225,213 -
John Harvey 112,607 - - - - - - 112,607 -
John Holland 112,607 - - - - - - 112,607 -
Sandra McPhee 112,607 - - - - - - 112,607 -
Total Non-Excecutive Directors
563,033 - - - - - - 563,033 -
Executive Directors
Peter Halkett 586,447 - 7,076 - - 122,726 17.1% 716,249 0.0%
Mark Todd 1 282,552 50,000 2,938 7,193 - 35,178 9.3% 377,861 13.2%
Total Executive Directors
869,000 50,000 10,014 7,193 - 157,904 14.4% 1,094,110 4.6%
Other Key Management Personnel
Matt Spencer 339,942 - 9,862 29,466 - 26,059 6.4% 405,329 0.0%
Michelle Adams 2 200,582 141,699 1,033 6,846 - 17,633 4.8% 367,794 38.5%
Tamalin Morton 216,625 - - 18,806 - 24,340 9.4% 259,771 0.0%
Caleb Nicolson 161,347 - 2,443 3,227 - 10,227 5.8% 177,244 0.0%
Bryan Moore 159,789 - 2,372 - - 9,874 5.7% 172,036 0.0%
Total Other Key Management Personnel
1,078,285 141,699 15,710 58,343 - 88,133 6.4% 1,382,174 10.3%
Total 2,510,319 191,699 25,724 65,538 - 246,037 8.1% 3,039,317 6.3%
1. Cash bonus was a one off payment in recognition of work undertaken during the IPO.2. Cash bonus was a one off payment in lieu of participation in previous Milford Group Holdings employee share scheme (refer note 20)

KATHMANDU HOLDINGS LIMITED ANNUAL REPORT 2010 47
2009 Short Term benefits Post employment benefits Share based payments
NameCash
Salary and fees
$
Cashbonus
$
Non-Monetarybenefits
$
Super- annuation
$
RetirementBenefits
$
ShareOptions
$
Proportion ofRemuneration
as equity related%
Total$
Proportion of Remuneration
as performance related
%
Non-Executive Directors
James Strong - - - - - - - - -
John Harvey - - - - - - - - -
John Holland - - - - - - - - -
Sandra McPhee - - - - - - - - -
Total Non-Excecutive Directors
- - - - - - - - -
Executive Directors
Peter Halkett 525,000 1,290,107 4,547 - - - - 1,819,654 70.9%
Mark Todd 235,000 514,697 1,625 4,610 755,932 68.1%
Total Executive Directors
760,000 1,804,804 6,172 4,610 2,575,586 70.1%
Other Key Management Personnel
Matt Spencer 290,010 498,395 6,413 29,001 - - - 823,819 60.5%
Michelle Adams 23,077 10,000 - 2,308 - - - 35,385 28.3%
Tamalin Morton 280,239 338,580 - 28,024 - - - 646,843 52.3%
Caleb Nicolson 145,000 2,342 - 2,342 - - - 149,684 1.6%
Bryan Moore 140,649 - 1,289 - - - - 141,938 0.0%
Total Other Key Management Personnel
878,975 849,317 7,702 61,675 1,797,669 47.2%
Total 1,638,975 2,654,121 13,874 66,285 4,373,255 60.7%
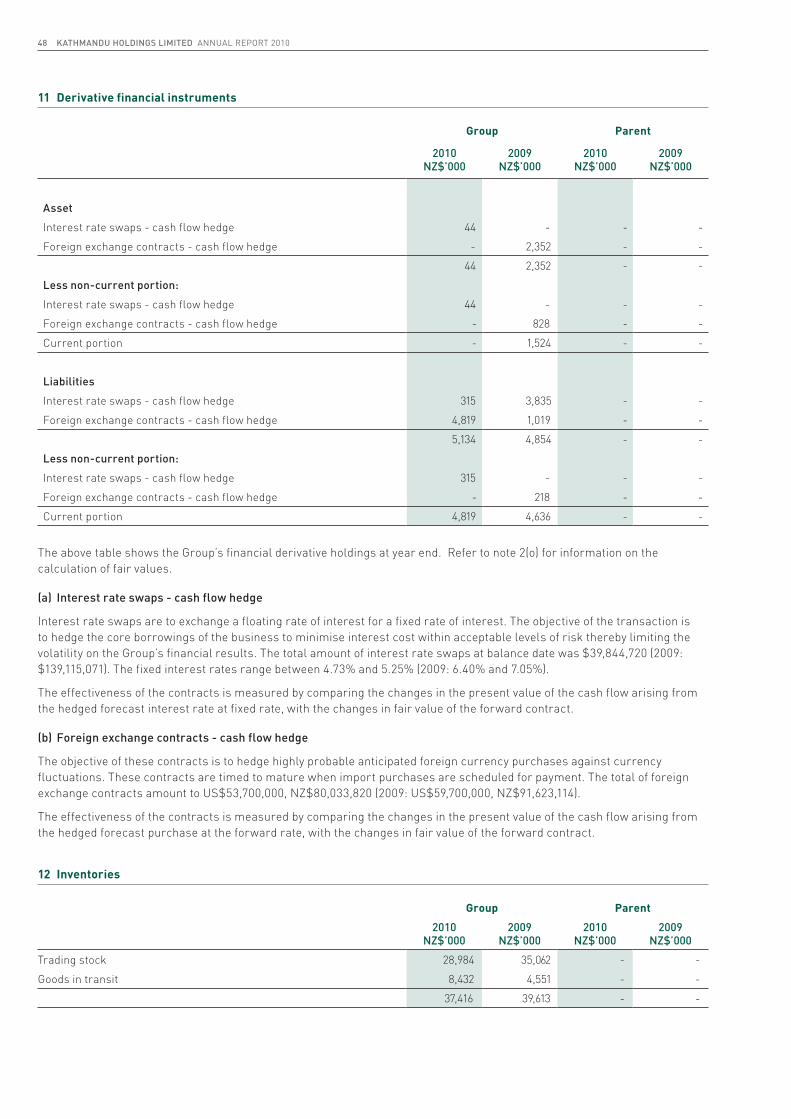
48 KATHMANDU HOLDINGS LIMITED ANNUAL REPORT 2010
11 Derivative financial instruments
Group Parent
2010NZ$’000
2009NZ$’000
2010NZ$’000
2009NZ$’000
Asset
Interest rate swaps - cash flow hedge 44 - - -
Foreign exchange contracts - cash flow hedge - 2,352 - -
44 2,352 - -
Less non-current portion:
Interest rate swaps - cash flow hedge 44 - - -
Foreign exchange contracts - cash flow hedge - 828 - -
Current portion - 1,524 - -
Liabilities
Interest rate swaps - cash flow hedge 315 3,835 - -
Foreign exchange contracts - cash flow hedge 4,819 1,019 - -
5,134 4,854 - -
Less non-current portion:
Interest rate swaps - cash flow hedge 315 - - -
Foreign exchange contracts - cash flow hedge - 218 - -
Current portion 4,819 4,636 - -
The above table shows the Group’s financial derivative holdings at year end. Refer to note 2(o) for information on the calculation of fair values.
(a) Interest rate swaps - cash flow hedge
Interest rate swaps are to exchange a floating rate of interest for a fixed rate of interest. The objective of the transaction is to hedge the core borrowings of the business to minimise interest cost within acceptable levels of risk thereby limiting the volatility on the Group’s financial results. The total amount of interest rate swaps at balance date was $39,844,720 (2009: $139,115,071). The fixed interest rates range between 4.73% and 5.25% (2009: 6.40% and 7.05%).
The effectiveness of the contracts is measured by comparing the changes in the present value of the cash flow arising from the hedged forecast interest rate at fixed rate, with the changes in fair value of the forward contract.
(b) Foreign exchange contracts - cash flow hedge
The objective of these contracts is to hedge highly probable anticipated foreign currency purchases against currency fluctuations. These contracts are timed to mature when import purchases are scheduled for payment. The total of foreign exchange contracts amount to US$53,700,000, NZ$80,033,820 (2009: US$59,700,000, NZ$91,623,114).
The effectiveness of the contracts is measured by comparing the changes in the present value of the cash flow arising from the hedged forecast purchase at the forward rate, with the changes in fair value of the forward contract.
12 Inventories
Group Parent
2010NZ$’000
2009NZ$’000
2010NZ$’000
2009NZ$’000
Trading stock 28,984 35,062 - -
Goods in transit 8,432 4,551 - -
37,416 39,613 - -

KATHMANDU HOLDINGS LIMITED ANNUAL REPORT 2010 49
Group
Leasehold improvement
Office, plant &
EquipmentFurniture & Fittings
Computer equipment
Motor vehicles Total
$’000 $’000 $’000 $’000 $’000 $’000
As at 31 July 2008
Cost or valuation 17,599 2,833 5,332 6,016 369 32,149
Accumulated depreciation (5,507) (1,352) (1,844) (4,010) (187) (12,900)
Closing net book value 12,092 1,481 3,488 2,006 182 19,249
Year ended 31 July 2009
Opening net book value 12,092 1,481 3,488 2,006 182 19,249
Additions 5,212 358 1,549 195 - 7,314
Disposals (129) (79) (50) (34) (4) (296)
Depreciation charge (2,655) (399) (990) (658) (40) (4,742)
Exchange differences (128) (20) (37) (11 ) (3) (199)
Closing net book value 14,392 1,341 3,960 1,498 135 21,326
As at 31 July 2009
Cost or valuation 22,604 2,990 6,701 5,877 335 38,507
Accumulated depreciation (8,212) (1,649) (2,741) (4,379) (200) 17,181
Closing net book value 14,392 1,341 3,960 1,498 135 21,326
Year ended 31 July 2010
Opening net book value 14,392 1,341 3,960 1,498 135 21,326
Additions 7,022 625 3,801 1,351 24 12,823
Disposals (221) (1) (63) (5) (8) (298)
Depreciation charge (3,045) (394) (1,239) (669) (32) (5,379)
Exchange differences (382) (13) (35) (22) (2) (454)
Closing net book value 17,766 1,558 6,424 2,153 117 28,018
As at 31 July 2010
Cost or valuation 28,373 3,565 10,301 6,990 314 49,543
Accumulated depreciation (10,607) (2,007) (3,877) (4,837) (197) (21,525)
Closing net book value 17,766 1,558 6,424 2,153 117 28,018
13 Property, plant and equipment

50 KATHMANDU HOLDINGS LIMITED ANNUAL REPORT 2010
14 Intangible assets
Group Goodwill Brand Software Total
NZ$’000 NZ$’000 NZ$’000 NZ$’000
As at 31 July 2008
Cost or valuation 76,677 168,948 1,595 247,220
Accumulated amortisation and impairment (1,271) - (510) (1,781)
Closing net book value 75,406 168,948 1,085 245,439
Year ended 31 July 2009
Opening net book value 75,406 168,948 1,085 245,439
Additions - - 767 767
Disposals - - - -
Amortisation - - (827) (827)
Exchange differences - (1,493) (31) (1,524)
Closing net book value 75,406 167,455 994 243,855
As at 31 July 2009
Cost or valuation 76,677 167,455 2,331 246,463
Accumulated amortisation and impairment (1,271) - (1,337) (2,608)
Closing net book value 75,406 167,455 994 243,855
Year ended 31 July 2010
Opening net book value 75,406 167,455 994 243,855
Additions - - 746 746
Disposals - - - -
Amortisation - - (594) (594)
Exchange differences - (2,170) (12) (2,182)
Closing net book value 75,406 165,285 1,134 241,825
As at 31 July 2010
Cost or valuation 76,677 165,285 3,065 245,027
Accumulated amortisation and impairment (1,271) - (1,931) (3,202)
Closing net book value 75,406 165,285 1,134 241,825
Impairment tests for goodwill and brand
The aggregate carrying amounts of goodwill and brand allocated to each unit are as follows:
GroupGoodwill Brand
2010NZ$’000
2009NZ$’000
2010NZ$’000
2009NZ$’000
New Zealand 28,654 28,654 51,000 51,000
Australia 46,752 46,752 114,285 116,455
75,406 75,406 165,285 167,455

KATHMANDU HOLDINGS LIMITED ANNUAL REPORT 2010 51
For the purposes of goodwill and brand impairment testing, the Group operates as two cash generating units, New Zealand and Australia. The recoverable amount of the cash generating units has been determined based on the fair value less cost to sell.
The valuation methodologies used were:- Discounted cash flow (DCF) (Group and both cash generating units)- Capitalisation of EBIT (Group and both cash generating units)- Current market value (Group only)
Discounted cash flow valuations were calculated using projected 5 year future cash flows, based on Board approved business plans. Cash flows beyond 5 years have been extrapolated using a terminal growth rate of 2.5% and a pre-tax discount rate of 15.1% (NZ CGU – 15.4%, AU CGU – 14.7%).
Capitalisation of EBIT has been calculated using an EBIT multiple of 9 times representing the average of the assessed New Zealand (8.0) and Australia (10.0) multiples and is considered reflective of the markets in which Kathmandu operates. Comparable New Zealand listed retailers EBIT ratios ranged from between 6.0 – 9.3 with an average of 7.9. Australian listed retailers EBIT ratios ranged from between 5.6 – 13.5 with an average of 9.8.
Current market value has been assessed using Kathmandu market capitalisation as at 31 July 2010, with an adjustment made for the term debt level and assumed dividend funding required. This is considered to provide a conservative estimate of the enterprise value.
All methodologies used confirmed that there was no impairment of goodwill and brand during the year (2009: nil). The Board believes that any reasonably possible change in the key assumptions used in the calculations would not cause the carrying amount to exceed its recoverable amount.
15 Investment in subsidiaries
The consolidated financial statements incorporate the assets, liabilities and results of the following subsidiaries in accordance with the accounting policy described in note 2:
Name of entity
Equity holding
2010 2009
Milford Group Holdings Limited1 100% -
Milford Equities Limited2 - 100%
Kathmandu Group Limited2 - 100%
Kathmandu Limited 100% 100%
Kathmandu Pty Limited 100% 100%
Kathmandu (U.K.) Limited 100% 100%
1. Milford Group Holdings Limited was the ultimate parent company in 2009 2. On 31 July 2010, Milford Equities Limited and Kathmandu Group Limited were amalgamated into Milford Group Holdings Limited
and ceased to exist.
All subsidiary entities have a balance date of 31 July. Kathmandu Pty Limited and Kathmandu (U.K.) Limited are incorporated in Australia and United Kingdom, respectively. All other subsidiary entities are incorporated in New Zealand.
The principal activities of the subsidiaries are:
Country of Registration Principal Activity
Milford Group Holdings Limited New Zealand Holding company
Kathmandu Limited New Zealand Outdoor retailer
Kathmandu Pty Limited Australia Outdoor retailer
Kathmandu (U.K.) Limited United Kingdom Outdoor retailer
Interest in subsidiaries 2010NZ$
2009NZ$
Milford Group Holdings Limited 321,233,808 n/a
Milford Equities Limited - 1
Kathmandu Group Limited - -
Kathmandu Limited - -
Kathmandu Pty Limited - -
Kathmandu (U.K.) Limited - -
321,233,808 1

52 KATHMANDU HOLDINGS LIMITED ANNUAL REPORT 2010
16 Deferred taxation
The following are the major deferred taxation liabilities and assets recognised by the Group and movements thereon during the current period and prior year.
Group
Taxdepreciation
NZ$’000
Employeeobligations
NZ$’000Losses
NZ$’000
Other timingdifferences
NZ$’000ReservesNZ$’000
TotalNZ$’000
As at 31 July 2008 13 420 756 2,693 (105) 3,777
Charge to the income statement (2) 787 (347) 225 - 663
Charge to other comprehensive income
675 675
As at 31 July 2009 11 1,207 409 2,918 570 5,115
Charge to the income statement (2) (512) (43) (1,261) - (1,818)
Charge to other comprehensive income
- - - - 175 175
As at 31 July 2010 9 695 366 1,657 745 3,472
Parent
TaxDepreciation
NZ$’000
Employeeobligations
NZ$’000LossesNZ$’000
Other timing
differencesNZ$’000
ReservesNZ$’000
TotalNZ$’000
As at 31 July 2008 - - - - - -
Charge to the income statement - - - - - -
As at 31 July 2009 - - - - - -
Charge to the income statement - 69 365 11 - 445
As at 31 July 2010 - 69 365 11 - 445
Certain deferred taxation assets and liabilities have been offset. The following is the analysis of the deferred taxation balances (after offset) for financial reporting purposes:
Group Parent
2010NZ$’000
2009NZ$’000
2010NZ$’000
2009NZ$’000
Deferred taxation assets:
- Deferred tax asset to be recovered after more than 12 months 1,289 2,992 69 -
- Deferred tax asset to be recovered within 12 months 2,411 2,729 376 -
Deferred taxation liabilities:
- Deferred tax liability to be recovered after more than 12 months - - - -
- Deferred tax liability to be recovered within 12 months (228) (606) - -
3,472 5,115 445 -

KATHMANDU HOLDINGS LIMITED ANNUAL REPORT 2010 53
Movements
The gross movement on the deferred income tax account is as follows:
Effective tax rate reconciliation:
Group Parent
2010NZ$’000
2009NZ$’000
2010NZ$’000
2009NZ$’000
Opening balance 5,115 3,777 - -
Income statement charge (1,818) 663 445 -
Tax charged directly to equity 175 675 - -
Closing balance 3,472 5,115 445 -
Group Parent
2010NZ$’000
2009NZ$’000
2010NZ$’000
2009NZ$’000
Remeasurement of deferred tax - company tax rate change from 30% to 28% (12) - (5) -
Remeasurement of deferred tax - removal of depreciation on buildings - - - -
(12) - (5) -
17 Trade and other payables
18 Interest bearing liabilities
Group Parent
2010NZ$’000
2009NZ$’000
2010NZ$’000
2009NZ$’000
Trade payables 4,463 2,879 - -
Employee entitlements 2,818 4,373 - -
Sundry creditors and accruals 9,610 10,627 68 -
16,891 17,879 68 -
The carrying amount of the Group’s trade and other payables are denominated in the following currencies:
NZD 6,084 7,621 58 -
AUD 9,853 9,143 10 -
GBP 954 1,115 - -
USD - - - -
16,891 17,879 68 -
Group Parent
2010NZ$’000
2009NZ$’000
2010NZ$’000
2009NZ$’000
Current portion - 5,917 - -
Non-current portion 53,965 182,039 - -
Total term loans 53,965 187,956 - -

54 KATHMANDU HOLDINGS LIMITED ANNUAL REPORT 2010
The bank loan is part of a facility agreement with ANZ National Bank, Bank of New Zealand and Commonwealth Bank of Australia dated 19 November 2009. The loan is repayable in full on final maturity date of the facility being 13 November 2012. Interest is payable based on the BKBM rate ($NZ borrowings) or the BBSY rate ($A borrowings) plus a margin of up to 1.25%. The bank loan is secured against the assets of the company and its subsidiaries.
The covenants entered into by the Group require specified calculations of Group earnings before interest, tax, depreciation and amortisation (EBITDA) plus lease rental costs to exceed total fixed charges (net interest expense and lease rental costs) at the end of each quarter during the financial year. Similarly EBITDA must be no less than a specified proportion of total net debt at the end of each quarter. The calculations of these covenants are specified in the bank syndicated facility agreement of 19 November 2009 and have been complied with at the end of each quarter of the year ended 31 July 2010.
The current interest rates, prior to hedging, on the term loans ranged between 4.24% - 5.81% (2009: 4.83% - 5.69%).
Group Parent
2010NZ$’000
2009NZ$’000
2010NZ$’000
2009NZ$’000
The maturity analysis of interest bearing liabilities is:
Payable within 1 year - 5,918 - -
Payable 1 to 2 years - 8,477 - -
Payable 2 to 3 years 53,965 173,561 - -
Payable 3 to 4 years - - - -
53,965 187,956 - -
19 Contributed equity - ordinary shares
Group Parent
2010NZ$’000
2009NZ$’000
2010NZ$’000
2009NZ$’000
Ordinary shares fully paid ($) 197,049 96,146 422,137 -
Balance at beginning of year 96,146 96,359 - -
Shares issued during the year 105,426 - 426,660 -
Less capital raising costs (refer note 5) (4,523) - (4,523) -
Shares issued under Employee Share Scheme - 186 - -
Shares repurchased - (399) - -
Balance at end of year 197,049 96,146 422,137 -
Number of authorised shares Group Parent
2010’000
2009’000
2010’000
2009’000
Ordinary shares on hand at beginning of the year 9,081,072 9,098,712 - -
Shares issued during the year 200,000 - 200,000 -
Shares issued under Employee Share Scheme - 17,640 - -
Shares repurchased (9,081,072) (35,280) - -
Ordinary shares on hand at end of the year 200,000 9,081,072 200,000 -

KATHMANDU HOLDINGS LIMITED ANNUAL REPORT 2010 55
(a) Ordinary shares
At 31 July 2009 there were 9,081,072,589 issued shares in Milford Group Holdings Limited. As a result of the Initial Public Offer and subsequent reverse acquisition transaction there are now 200,000,000 ordinary issued shares in Kathmandu Holdings Limited and these are classified as equity.
All ordinary shares carry equal rights in respect of voting and the receipt of dividends. Ordinary shares do not have a par value.
(b) Shares issued and repurchased under Milford Group Holdings Limited Employee Share Scheme
During the 2009 year 17,640,000 shares were issued under the Employee Share Scheme at fair value and were funded by way of loan.
During the 2009 year 35,280,000 shares were repurchased, 4,410,000 for cash with the remainder being off-set against loans under the Employee Share Scheme.
20 Employee Share Option Plan
On 16 October 2009 the Board approved an Executive Share Option Plan to issue options to selected senior executives and subject to shareholder approval to Executive Directors. Options will vest annually in part or in full with the holder, in three tranches commencing 1 October 2010. All options not vested expire on 1 October 2013, and all options vested must be exercised within five years from date of grant. Entitlement to exercise is conditional on the Company achieving in relation to each tranche a compound total shareholder return of 15% per annum over the period of trading that is measured in relation to that tranche. Each option entitles the holder to one ordinary share in the capital of the Company. The exercise price is determined by the Board but is generally $2.1333 for New Zealand based employees and A$1.70 for Australian based employees.
During the financial year 2010 the Company issued 1,119,976 options to Executive Directors and senior executives. The fair value of these options is estimated as $518,590 under a Monte Carlo simulation approach factoring in the total shareholder return condition using the following assumptions:
Current price at issue date $2.14 Risk free interest rate 5.40% Expected life (years) 5 Expected share volatility 30%
A 50% NPAT dividend payout ratio has been factored into the valuation of the options based on current management budgets. The expected volatility has been estimated based on the historical volatility of comparable listed retail businesses.
The estimated fair value for each tranche of options issued is amortised over the vesting period from the grant date. The Company has recognised a compensatory expense in the income statement of $246,037 which represents this amortisation.
Movements in the number of share options outstanding and their related weighted average exercise price are as follows:
2010 2009
Average exercise price $ per share
Options ‘000
Average exercise price $ per share Options
Balance at beginning of year - - - -
Issued 2.1333 1,120 - -
Balance at end of year 2.1333 1,120 - -
Share options outstanding at the end of the year have the following expiry date, exercise dates and exercise prices.
First Vesting Month Last Vesting Month
Exercise Price Number
October 2010 October 2013 $2.1333 373,324
October 2011 October 2013 $2.1333 373,324
October 2012 October 2013 $2.1333 373,328
1,119,976

56 KATHMANDU HOLDINGS LIMITED ANNUAL REPORT 2010
Milford Group Holdings Limited Employee Share Scheme
Prior to the IPO of Kathmandu Holdings Limited, Milford Group Holdings Limited operated an Employee Share Scheme. The Employee Share Scheme provided the opportunity for key management to acquire equity in Milford Group Holdings Limited. The price which management paid for the shares was set at fair value on the date the employee and Milford Group Holdings Limited entered into the agreement. The purchase of shares by the employee was partly funded by a limited recourse, interest free advance from Milford Group Holdings Limited. Any dividends payable on the shares were applied towards the repayment of the advance. As at 31 July 2009 the balance of advances outstanding from employees under the Scheme was $2,286,430 and was recognised as an asset.
The IPO of Kathmandu Holdings Limited, and the Company’s offer to purchase the shares issued by Milford Group Holdings Limited constituted a Liquidity Event under the terms of the Milford Group Holdings Limited Employee Share Scheme. All of the shares issued under the Scheme have thus been disposed of, the loans owing to Milford Group Holdings Limited have been repaid in conjunction with the IPO and the scheme is at an end.
21 Reverse Acquisition
Under the terms of NZ IFRS 3 Business Combinations, Milford Group Holdings Limited was deemed to be the accounting acquirer in the business combination. This transaction has therefore been accounted for as a reverse acquisition under NZ IFRS 3. Accordingly the consolidated financial statements of Kathmandu Holdings Limited have been prepared as a continuation of the consolidated financial statements of Milford Group Holdings Limited as the deemed acquirer.
Although legally the transaction involved Kathmandu Holdings Limited raising $426.6m by the issue of new shares and the expending of $321.3m in cash for the acquisition of Milford Group Holdings Limited, the substance from a group perspective is that $105.4m of new capital was raised. Of this $19.7m was used to settle the costs associated with the IPO and $85.7m was used to repay debt. The substance is reflected in the reverse acquisition accounting adopted in these consolidated financial statements.
Kathmandu Holdings Limited was incorporated on 1 October 2009 and did not commence trading until 13 November 2009. In the period between 13 November 2009 and 31 July 2010 Kathmandu Holdings Limited did not generate any income, and incurred expenses which primarily related to Directors and annual listing costs, and the cost associated with the IPO as set out in note 5. At the date of acquisition the net assets of Kathmandu Holdings Limited comprised cash of $105,426. There was no goodwill.

KATHMANDU HOLDINGS LIMITED ANNUAL REPORT 2010 57
22 Reserves and retained earnings
(a) Reserves Group Parent
2010NZ$’000
2009NZ$’000
2010NZ$’000
2009NZ$’000
(i) Cash flow hedging reserve
Opening balance (1,420) (5,621) - -
Revaluation - gross (2,908) 3,259 - -
Deferred tax 175 675 - -
Transfer to net profit - gross 153 267 - -
Closing balance (4,000) (1,420) - -
(ii) Foreign Currency Translation Reserve
Opening balance 3,995 4,355 - -
Currency translation differences (1,515) (360) - -
Closing balance 2,480 3,995 - -
(iii) Share Option Reserve
Opening balance - - - -
Current year amortisation 246 - 246 -
Closing balance 246 - 246 -
Total Reserves (1,274) 2,575 246 -
Nature and purpose of reserves
(i) Cash flow hedging reserve
The hedging reserve is used to record gains or losses on a hedging instrument in a cash flow hedge that are recognised directly in equity, as described in policy 2 n (ii). The amounts are recognised in profit and loss when the associated hedged transaction affects profit and loss.
(ii) Foreign currency translation reserve
The foreign currency translation reserve is used to record gains or losses on investments in foreign operations. The amounts are accumulated in equity and recognised in profit and loss when the foreign operation is partially disposed of or sold.
(iii) Share option reserve
The employee share option reserve is used to recognise the fair value of options granted but not exercised or lapsed. Amounts are transferred to share capital when the vested options are exercised by the employee or lapse upon expiry.
(b) Retained earnings
Group Parent
2010NZ$’000
2009NZ$’000
2010NZ$’000
2009NZ$’000
Opening retained earnings 33,965 19,063 - -
Profit / (loss) for the year 9,387 14,902 (12,359) -
Balance at 31 July 43,352 33,965 (12,359) -

58 KATHMANDU HOLDINGS LIMITED ANNUAL REPORT 2010
23 Dividends
Group Parent
2010NZ$’000
2009NZ$’000
2010NZ$’000
2009NZ$’000
Prior year final dividend paid - - - -
Current year interim dividend paid - - - -
Dividends paid ($nil per share and 2009; $nil) - - - -
24 Remuneration of auditors
During the year the following fees were paid or payable for services provided by the auditor of the parent entity, its related practices and other network audit firms:
Group Parent
2010NZ$’000
2009NZ$’000
2010NZ$’000
2009NZ$’000
(a) Audit services
PricewaterhouseCoopers
Statutory Audit 102 79 55 -
Half year review 38 - 38 -
Other assurance services 5 5 - -
Total remuneration for audit services 145 84 93 -
(b) Other services
Accounting standards advice 59 16 - -
IPO due diligence 533 - 495 -
Total remuneration for other services 592 16 495 -
Total auditor remuneration 737 100 588 -
25 Contingent liabilities
Group Parent
2010NZ$’000
2009NZ$’000
2010NZ$’000
2009NZ$’000
Liabilities outstanding under letters of credit 1,767 3,337 - -
Rent Guarantees 7,643 7,406 - -
Financial Guarantees 1,430 1,490 - -
Financial guarantees cover internal overdrafts and credit card limits between banks across the Group.

KATHMANDU HOLDINGS LIMITED ANNUAL REPORT 2010 59
26 Contingent assets
There are no contingent assets in 2010 (2009: nil).
27 Commitments
(a) Capital commitments
Capital commitments contracted for at balance date are:
Group Parent
2010NZ$’000
2009NZ$’000
2010NZ$’000
2009NZ$’000
Property, plant and equipment 440 - - -
Intangible assets 339 - - -
779 - - -
(b) Operating lease commitments
Group company as lessee:
Rent expenses reported in these financial statements relate to non-cancellable operating leases. The future commitments on these leases are as follows:
Group Parent
2010NZ$’000
2009NZ$’000
2010NZ$’000
2009NZ$’000
Due within 1 year 23,834 20,594 - -
Due within 1-2 years 21,459 19,936 - -
Due within 2-5 years 46,580 44,607 - -
Due after 5 years 17,760 23,313 - -
109,633 108,450 - -
Some of the existing lease agreements have right of renewal options for varying terms.
The Group leases various properties under non-cancellable lease agreements. These leases are generally between 1 - 10 years.
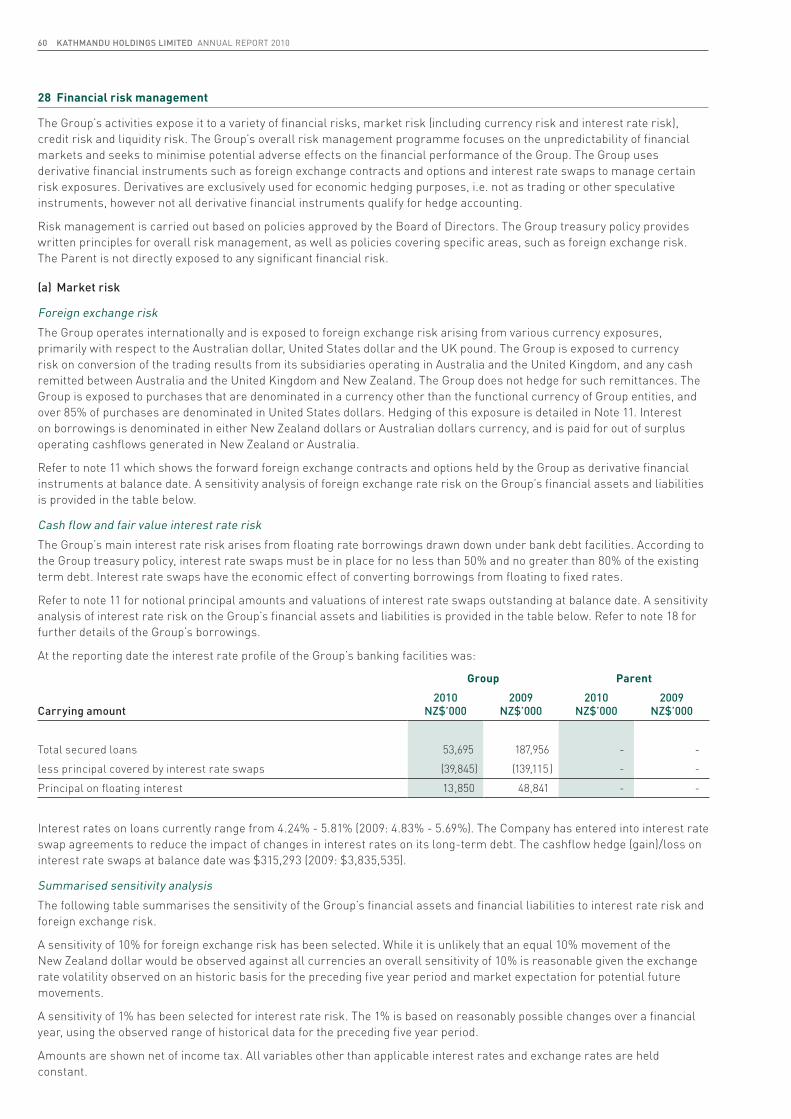
60 KATHMANDU HOLDINGS LIMITED ANNUAL REPORT 2010
28 Financial risk management
The Group’s activities expose it to a variety of financial risks, market risk (including currency risk and interest rate risk), credit risk and liquidity risk. The Group’s overall risk management programme focuses on the unpredictability of financial markets and seeks to minimise potential adverse effects on the financial performance of the Group. The Group uses derivative financial instruments such as foreign exchange contracts and options and interest rate swaps to manage certain risk exposures. Derivatives are exclusively used for economic hedging purposes, i.e. not as trading or other speculative instruments, however not all derivative financial instruments qualify for hedge accounting.
Risk management is carried out based on policies approved by the Board of Directors. The Group treasury policy provides written principles for overall risk management, as well as policies covering specific areas, such as foreign exchange risk. The Parent is not directly exposed to any significant financial risk.
(a) Market risk
Foreign exchange risk
The Group operates internationally and is exposed to foreign exchange risk arising from various currency exposures, primarily with respect to the Australian dollar, United States dollar and the UK pound. The Group is exposed to currency risk on conversion of the trading results from its subsidiaries operating in Australia and the United Kingdom, and any cash remitted between Australia and the United Kingdom and New Zealand. The Group does not hedge for such remittances. The Group is exposed to purchases that are denominated in a currency other than the functional currency of Group entities, and over 85% of purchases are denominated in United States dollars. Hedging of this exposure is detailed in Note 11. Interest on borrowings is denominated in either New Zealand dollars or Australian dollars currency, and is paid for out of surplus operating cashflows generated in New Zealand or Australia.
Refer to note 11 which shows the forward foreign exchange contracts and options held by the Group as derivative financial instruments at balance date. A sensitivity analysis of foreign exchange rate risk on the Group’s financial assets and liabilities is provided in the table below.
Cash flow and fair value interest rate risk
The Group’s main interest rate risk arises from floating rate borrowings drawn down under bank debt facilities. According to the Group treasury policy, interest rate swaps must be in place for no less than 50% and no greater than 80% of the existing term debt. Interest rate swaps have the economic effect of converting borrowings from floating to fixed rates.
Refer to note 11 for notional principal amounts and valuations of interest rate swaps outstanding at balance date. A sensitivity analysis of interest rate risk on the Group’s financial assets and liabilities is provided in the table below. Refer to note 18 for further details of the Group’s borrowings.
At the reporting date the interest rate profile of the Group’s banking facilities was:
Carrying amount
Group Parent
2010NZ$’000
2009NZ$’000
2010NZ$’000
2009NZ$’000
Total secured loans 53,695 187,956 - -
less principal covered by interest rate swaps (39,845) (139,115) - -
Principal on floating interest 13,850 48,841 - -
Interest rates on loans currently range from 4.24% - 5.81% (2009: 4.83% - 5.69%). The Company has entered into interest rate swap agreements to reduce the impact of changes in interest rates on its long-term debt. The cashflow hedge (gain)/loss on interest rate swaps at balance date was $315,293 (2009: $3,835,535).
Summarised sensitivity analysis
The following table summarises the sensitivity of the Group’s financial assets and financial liabilities to interest rate risk and foreign exchange risk.
A sensitivity of 10% for foreign exchange risk has been selected. While it is unlikely that an equal 10% movement of the New Zealand dollar would be observed against all currencies an overall sensitivity of 10% is reasonable given the exchange rate volatility observed on an historic basis for the preceding five year period and market expectation for potential future movements.
A sensitivity of 1% has been selected for interest rate risk. The 1% is based on reasonably possible changes over a financial year, using the observed range of historical data for the preceding five year period.
Amounts are shown net of income tax. All variables other than applicable interest rates and exchange rates are held constant.

KATHMANDU HOLDINGS LIMITED ANNUAL REPORT 2010 61
Group Interest rate risk Foreign exchange risk
-1% +1% -10% +10%
31 July 2010Carrying amount $’000
Profit $’000
Equity $’000
Profit $’000
Equity $’000
Profit $’000
Equity $’000
Profit $’000
Equity $’000
Derivative Financial Instruments (asset) / liability 5,090 - 603 - (668) - (8,322) - 6,785
Financial assets
Cash 4,736 (34) - 34 - 361 - (295) -
Financial liabilities
Trade payables 16,891 - - - - (865) - 707 -
Borrowings 53,965 141 - (141) - (2,117) 1,732
141 - (141) - (865) (2,117) 412 1,732
Total increase / decrease 107 603 (107) (668) (504) (10,439) 412 8,517
Group
Interest rate risk Foreign exchange risk
-1% +1% -10% +10%
31 July 2009Carrying amount $’000
Profit $’000
Equity $’000
Profit $’000
Equity $’000
Profit $’000
Equity $’000
Profit $’000
Equity $’000
Derivative Financial Instruments (asset) / liability 2,502 - (993) - 1,051 - (10,210) - 8,319
Financial assets
Cash 32,209 (232) - 232 - 1,758 - (1,758) -
Financial liabilities
Trade payables 2,879 - - - - (153) - 153 -
Borrowings 187,956 488 - (488) - (14,105) 11,451
488 - (488) - (153) (14,105) 153 11,451
Total increase / decrease 256 (993) (256) 1,051 1,605 (24,315) (1,605) 19,770
The parent is not sensitive to either interest rate or foreign exchange risk.
(b) Credit risk
Credit risk is the risk of financial loss to the Group if a customer or counterparty to a financial instrument fails to meet its contractual obligations. This would arise principally from the Group’s receivables from customers. The nature of the customer base is such that there is no individual customer concentration of credit risk. Other financial instruments which potentially subject the Company to credit risks principally consist of bank balances, loans, advances and refund of taxes.
Trade and other receivables
The nature of the customer base is such that there is no individual customer concentration of credit risk.
The Company does not carry out credit evaluations for all new customers requiring credit. Credit is generally only given to government or local council backed institutions.
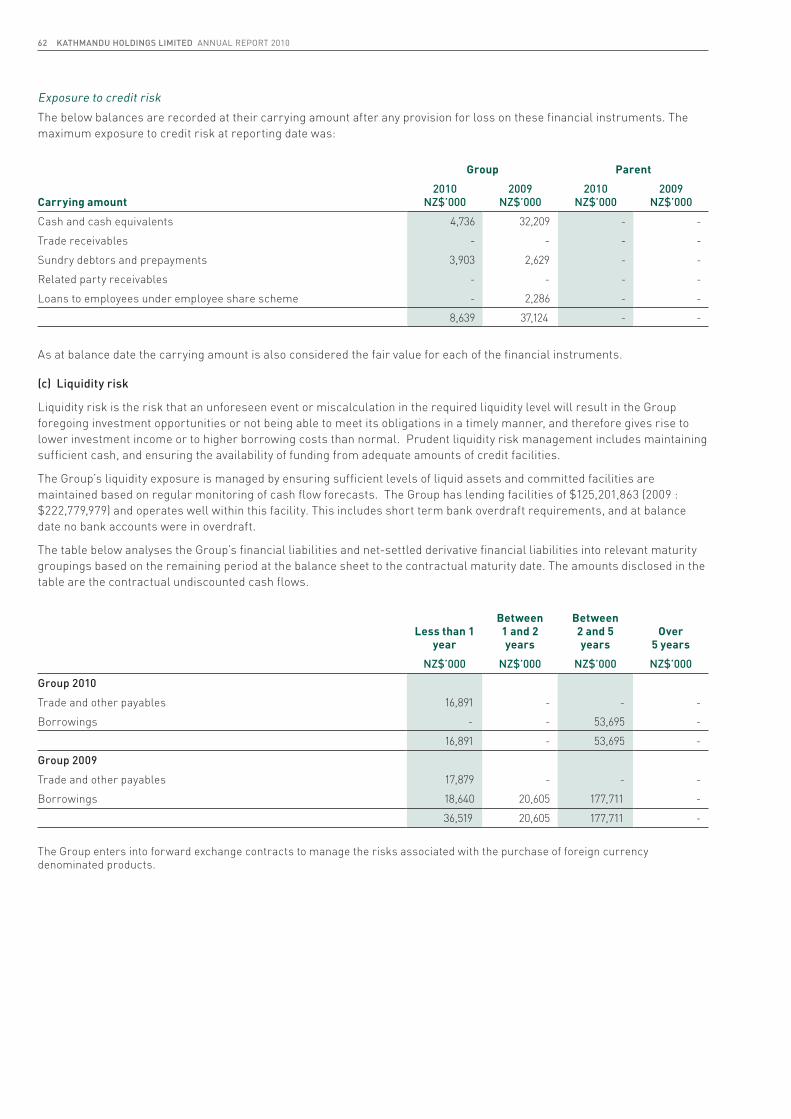
62 KATHMANDU HOLDINGS LIMITED ANNUAL REPORT 2010
Exposure to credit risk
The below balances are recorded at their carrying amount after any provision for loss on these financial instruments. The maximum exposure to credit risk at reporting date was:
Carrying amount
Group Parent
2010NZ$’000
2009NZ$’000
2010NZ$’000
2009NZ$’000
Cash and cash equivalents 4,736 32,209 - -
Trade receivables - - - -
Sundry debtors and prepayments 3,903 2,629 - -
Related party receivables - - - -
Loans to employees under employee share scheme - 2,286 - -
8,639 37,124 - -
As at balance date the carrying amount is also considered the fair value for each of the financial instruments.
(c) Liquidity risk
Liquidity risk is the risk that an unforeseen event or miscalculation in the required liquidity level will result in the Group foregoing investment opportunities or not being able to meet its obligations in a timely manner, and therefore gives rise to lower investment income or to higher borrowing costs than normal. Prudent liquidity risk management includes maintaining sufficient cash, and ensuring the availability of funding from adequate amounts of credit facilities.
The Group’s liquidity exposure is managed by ensuring sufficient levels of liquid assets and committed facilities are maintained based on regular monitoring of cash flow forecasts. The Group has lending facilities of $125,201,863 (2009 : $222,779,979) and operates well within this facility. This includes short term bank overdraft requirements, and at balance date no bank accounts were in overdraft.
The table below analyses the Group’s financial liabilities and net-settled derivative financial liabilities into relevant maturity groupings based on the remaining period at the balance sheet to the contractual maturity date. The amounts disclosed in the table are the contractual undiscounted cash flows.
Less than 1 year
Between 1 and 2 years
Between 2 and 5 years
Over 5 years
NZ$’000 NZ$’000 NZ$’000 NZ$’000
Group 2010
Trade and other payables 16,891 - - -
Borrowings - - 53,695 -
16,891 - 53,695 -
Group 2009
Trade and other payables 17,879 - - -
Borrowings 18,640 20,605 177,711 -
36,519 20,605 177,711 -
The Group enters into forward exchange contracts to manage the risks associated with the purchase of foreign currency denominated products.

KATHMANDU HOLDINGS LIMITED ANNUAL REPORT 2010 63
The table below analyses the Group’s derivative financial instruments that will be settled on a gross basis into relevant maturity groupings based on the remaining period of the balance sheet to the contractual maturity date. The amounts disclosed in the table are the contractual undiscounted cash flows. They are expected to occur and affect the profit or loss at various dates between balance date and the following five years.
Less than 1 year
Between 1 and 2 years
Between 2 and 5 years
NZ$’000 NZ$’000 NZ$’000
At 31 July 2010
Forward foreign exchange contracts
- Inflow 74,098 -
- Outflow (80,033) - -
Net Inflow/(Outflow) (5,935) - -
Net settled derivatives – interest rate swaps
Net (outflow) (315) - -
At 31 July 2009
Forward foreign exchange contracts
- Inflow 60,579 31,209 -
- Outflow (60,177) (31,446) -
Net Inflow/(Outflow) 402 (237) -
Net settled derivatives – interest rate swaps
Net (outflow) (3,835) - -
Fair values
The following methods and assumptions were used to estimate the fair values for each class of financial instrument.
Trade debtors, trade creditors and bank balances
The carrying value of these items is equivalent to their fair value.
Term liabilities
The fair value of the Group’s term liabilities is estimated based on current market rates available to the Group for debt of similar maturity.
Foreign exchange contracts and interest rate swaps
The fair value of these instruments is estimated based on the quoted market price of these instruments.
Guarantees and overdraft facilities
The fair value of these instruments is estimated on the basis that management do not expect settlement at face value to arise. The carrying value and fair value of these instruments is nil. Details of guarantees are included in note 25. All guarantees are repayable on demand.

64 KATHMANDU HOLDINGS LIMITED ANNUAL REPORT 2010
Financial instruments by category
Loans and receivables
Derivatives used for hedging
Measured at amortised cost Total
NZ$’000 NZ$’000 NZ$’000 NZ$’000
Group
At 31 July 2010
Cash and cash equivalents 4,736 - - 4,736
Trade and other receivables 3,902 - - 3,902
Derivative financial instrument assets - 44 - 44
Total financial assets 8,638 44 - 8,682
Trade and other payables - - 16,891 16,891
Interest bearing liabilities - - 53,965 53,965
Derivative financial instrument liabilities - 5,134 - 5,134
Total financial liabilities - 5,134 70,856 75,990
At 31 July 2009
Cash and cash equivalents 32,209 - - 32,209
Trade and other receivables 2,629 - - 2,629
Derivative financial instrument assets - 2,352 - 2,352
Total financial assets 34,838 2,352 - 37,190
Trade and other payables - - 17,879 17,879
Interest bearing liabilities - - 187,956 187,956
Derivative financial instrument liabilities - 4,854 - 4,854
Total financial liabilities - 4,854 205,835 210,689
Parent
At 31 July 2010
Cash and cash equivalents 6 - - 6
Trade and other receivables 181 - - 181
Related party receivable 88,225 - - 88,225
Total financial assets 88,412 - - 88,412
Trade and other payables - - 68 68
Related party payable - - - -
Total financial liabilities - - 68 68
At 31 July 2009
Trade and other receivables - - - -
Related party receivable - - - -
Total financial assets - - - -
Trade and other payables - - - -
Related party payable - - - -
Total financial liabilities - - - -

KATHMANDU HOLDINGS LIMITED ANNUAL REPORT 2010 65
Capital risk management
The Group’s capital includes contributed equity, reserves and retained earnings.
The Group’s objectives when managing capital are to safeguard the Group’s ability to continue as a going concern in order to provide returns for shareholders and benefits for other stakeholders and to maintain an optimal capital structure to reduce the cost of capital.
In order to maintain or adjust the capital structure, the Group may adjust the amount of dividends paid to shareholders, return capital to shareholders, issue new shares or sell assets to reduce debt or draw down more debt.
Externally imposed capital requirements
The Group is subject to various covenants with its banking syndicate in relation to the ratios of earnings to total debt and interest on that debt, which were complied with during and at the end of the year.
29 Segmental information
The Group operates in three geographical areas: New Zealand, Australia and the United Kingdom.
31 July 2010 New Zealand Australia
United Kingdom Elimination Total
NZ$’000 NZ$’000 NZ$’000 NZ$’000 NZ$’000
Segment profit / (loss) before income tax and IPO costs 36,244 12,966 (3,818) (6,594) 38,798
Costs associated with IPO (16,834)
Income tax expense (12,577)
Profit/(loss) after tax 9,387
Segment profit / (loss) before income tax and IPO costs includes the following specific income and (expenses):
Sales to external customers 94,294 141,876 9,642 - 245,812
Cost of sales (37,411) (48,986) (4,126) - (90,523)
Net interest income/(expense) (1,372) (6,044) - - (7,416)
Net other finance income/(expense) (964) (898) (2,132) 1,753 (2,241)
Intercompany net finance income/(expense) 2,990 (2,990) - - -
Intercompany recharges income/(expense) 7,495 (7,495) - - -
Depreciation and software amortisation (1,788) (3,606) (580) - (5,974)
Other income from reversal of UK Loan provision 8,346 - - (8,346) -
Total current assets 372,751 21,363 3,127 (351,186) 46,055
Total non-current assets 333,521 133,522 1,144 (194,828) 273,359
Total assets 706,272 154,885 4,271 (564,014) 319,414
Total current liabilities (9,074) (67,995) (1,327) 52,389 (26,007)
Total non-current liabilities (27,762) (26,518) - - (54,280)
Total liabilities (36,836) (94,513) (1,327) 52,389 (80,287)

66 KATHMANDU HOLDINGS LIMITED ANNUAL REPORT 2010
31 July 2009 New Zealand Australia
United Kingdom Elimination Total
$’000 $’000 $’000 $’000 $’000
Segment profit /(loss) before income tax and IPO 14,154 11,010 (2,492) - 25,149
Costs associated with IPO -
Income tax expense (10,247)
Profit/(loss) after tax 14,902
Segment profit / (loss) before income tax and IPO includes the following specific income and (expenses):
Sales to external customers 85,133 120,953 9,494 - 215,580
Cost of sales (32,368) (40,254) (4,198) - (76,820)
Net interest income/(expense) (6,693) (10,235) 8 - (16,920)
Net other finance income/(expense) (799) 3 (122) - (918)
Intercompany net finance income/(expense) (996) 996 - - -
Intercompany recharges income/(expense) 6,670 (6,670) - - -
Depreciation and software amortisation (1,652) (3,306) (611) - (5,569)
Other income from reversal of UK Loan provision - - - - -
Total current assets 183,397 63,400 4,115 (174,937) 75,975
Total non-current assets 302,317 131,491 1,871 (162,268) 273,411
Total assets 485,714 194,891 5,986 (337,205) 349,386
Total current liabilities (189,732) (13,598) (14,394) 183,283 (34,441)
Total non-current liabilities (55,183) (127,074) - - (182,257)
Total liabilities (244,915) (140,672) (14,394) 183,283 (216,698)
Revenue is allocated based on the country in which the customer is located. New Zealand includes holding company costs and head office charges.
Assets / liabilities are allocated based on where the assets / liabilities are located.
The Group operates in one industry being outdoor clothing and equipment.
30 Earnings per Share
Due to the reverse acquisition referred to in note 2 above, the capital structure of the Group changed in November 2009. 9,081,072,000 Milford Group Holdings Limited shares were on issue prior to the IPO. 200,000,000 shares were issued in the IPO by Kathmandu Holdings Limited. As a consequence there is a significant variation in the weighted average number of shares between 2009 and 2010.
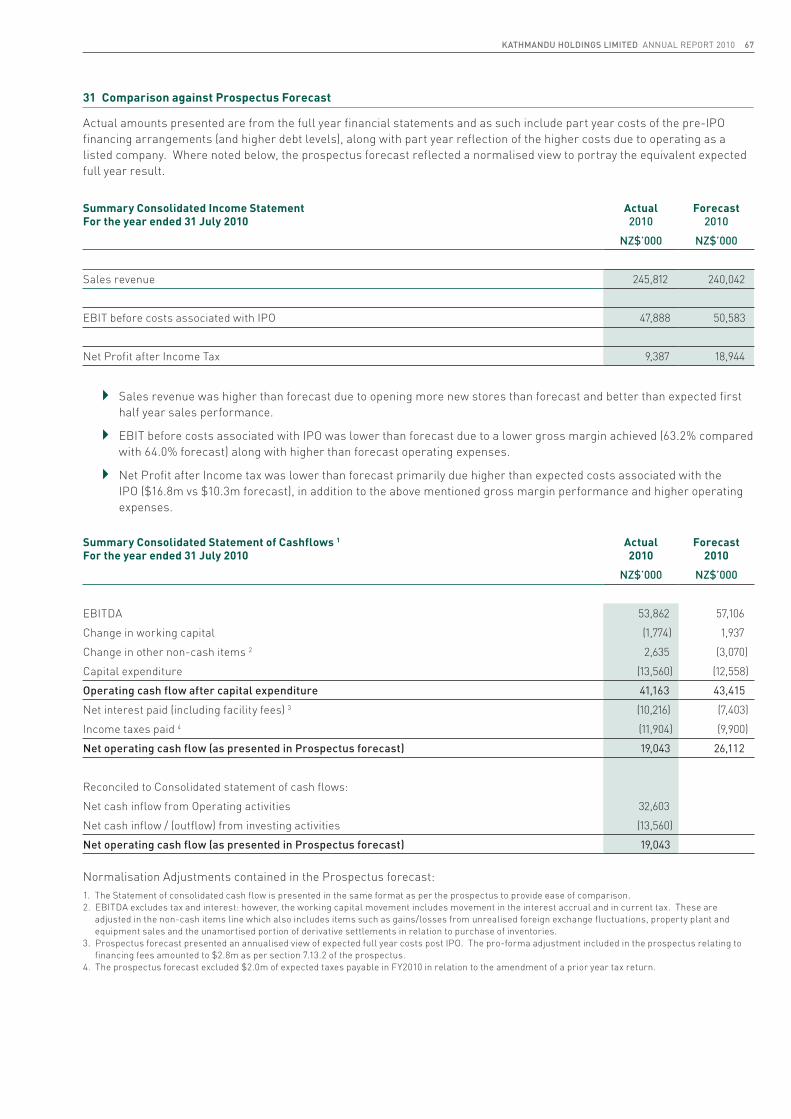
KATHMANDU HOLDINGS LIMITED ANNUAL REPORT 2010 67
31 Comparison against Prospectus Forecast
Actual amounts presented are from the full year financial statements and as such include part year costs of the pre-IPO financing arrangements (and higher debt levels), along with part year reflection of the higher costs due to operating as a listed company. Where noted below, the prospectus forecast reflected a normalised view to portray the equivalent expected full year result.
Summary Consolidated Income Statement For the year ended 31 July 2010
Actual 2010
Forecast 2010
NZ$’000 NZ$’000
Sales revenue 245,812 240,042
EBIT before costs associated with IPO 47,888 50,583
Net Profit after Income Tax 9,387 18,944
Sales revenue was higher than forecast due to opening more new stores than forecast and better than expected first half year sales performance.
EBIT before costs associated with IPO was lower than forecast due to a lower gross margin achieved (63.2% compared with 64.0% forecast) along with higher than forecast operating expenses.
Net Profit after Income tax was lower than forecast primarily due higher than expected costs associated with the IPO ($16.8m vs $10.3m forecast), in addition to the above mentioned gross margin performance and higher operating expenses.
Summary Consolidated Statement of Cashflows 1
For the year ended 31 July 2010Actual2010
Forecast2010
NZ$’000 NZ$’000
EBITDA 53,862 57,106
Change in working capital (1,774) 1,937
Change in other non-cash items 2 2,635 (3,070)
Capital expenditure (13,560) (12,558)
Operating cash flow after capital expenditure 41,163 43,415
Net interest paid (including facility fees) 3 (10,216) (7,403)
Income taxes paid 4 (11,904) (9,900)
Net operating cash flow (as presented in Prospectus forecast) 19,043 26,112
Reconciled to Consolidated statement of cash flows:
Net cash inflow from Operating activities 32,603
Net cash inflow / (outflow) from investing activities (13,560)
Net operating cash flow (as presented in Prospectus forecast) 19,043
Normalisation Adjustments contained in the Prospectus forecast:1. The Statement of consolidated cash flow is presented in the same format as per the prospectus to provide ease of comparison.2. EBITDA excludes tax and interest: however, the working capital movement includes movement in the interest accrual and in current tax. These are
adjusted in the non-cash items line which also includes items such as gains/losses from unrealised foreign exchange fluctuations, property plant and equipment sales and the unamortised portion of derivative settlements in relation to purchase of inventories.
3. Prospectus forecast presented an annualised view of expected full year costs post IPO. The pro-forma adjustment included in the prospectus relating to financing fees amounted to $2.8m as per section 7.13.2 of the prospectus.
4. The prospectus forecast excluded $2.0m of expected taxes payable in FY2010 in relation to the amendment of a prior year tax return.

68 KATHMANDU HOLDINGS LIMITED ANNUAL REPORT 2010
EBITDA variance to forecast is due to the Gross Margin and operating expense variance as discussed regarding EBIT previously.
Change in working capital variance is due to a higher than expected decrease in inventories and a decrease in the tax liability due to a lower than forecast net profit after tax (as discussed above).
Capital expenditure is higher than forecast due to opening three more stores than forecast. Interest paid is higher than forecast due to the financial statements reflecting part year costs of the pre-IPO existing banking arrangements (and higher debt levels).
Income taxes paid are higher than the forecast due to a payment of $1.8m relating to the amendment of a prior year tax return. The prospectus forecast excluded this payment in the normalised forecast presented.
32 Events occurring after the balance date
There are no events occurring after balance date that materially affect the information within the financial statements.

KATHMANDU HOLDINGS LIMITED ANNUAL REPORT 2010 69
PricewaterhouseCoopers119 Armagh StreetPO Box 13244Christchurch 8141New Zealandwww.pwc.com/nzTelephone +64 3 374 3000Facsimile +64 3 374 3001Auditors’ Report
To the shareholders of Kathmandu Holdings Limited
We have audited the financial statements on pages 27 to 68. The financial statements provide information aboutthe past financial performance and cash flows of the Company and Group for the year ended 31 July 2010 andtheir financial position as at that date. This information is stated in accordance with the accounting policies setout on pages 32 to 38.
This report is made solely to the Company's shareholders, as a body, in accordance with Section 205 (1) of theCompanies Act 1993. Our audit has been undertaken so that we might state to the Company's shareholdersthose matters we are required to state to them in an auditors' report and for no other purpose. To the fullestextent permitted by law, we do not accept or assume responsibility to anyone other than the Company and theCompany's shareholders, as a body, for our audit work, for this report or for the opinion we have formed.
Directors' ResponsibilitiesThe Company’s Directors are responsible for the preparation and presentation of the financial statements whichgive a true and fair view of the financial position of the Company and Group as at 31 July 2010 and their financialperformance and cash flows for the year ended on that date.
Auditors’ ResponsibilitiesWe are responsible for expressing an independent opinion on the financial statements presented by the Directorsand reporting our opinion to you.
Basis of OpinionAn audit includes examining, on a test basis, evidence relevant to the amounts and disclosures in the financialstatements. It also includes assessing:(a) the significant estimates and judgements made by the Directors in the preparation of the financial
statements; and(b) whether the accounting policies are appropriate to the circumstances of the Company and Group,
consistently applied and adequately disclosed.
We conducted our audit in accordance with generally accepted auditing standards in New Zealand. We plannedand performed our audit so as to obtain all the information and explanations which we considered necessary toprovide us with sufficient evidence to give reasonable assurance that the financial statements are free frommaterial misstatements, whether caused by fraud or error. In forming our opinion we also evaluated the overalladequacy of the presentation of information in the financial statements.
We have no relationship with or interests in the Company or any of its subsidiaries other than in our capacities asauditors and providers of other assurance services.
Unqualified OpinionWe have obtained all the information and explanations we have required.
In our opinion:(a) proper accounting records have been kept by the Company as far as appears from our examination of
those records; and(b) the financial statements on pages 27 to 68:
(i) comply with generally accepted accounting practice in New Zealand;(ii) comply with International Financial Reporting Standards; and(iii) give a true and fair view of the financial position of the Company and Group as at 31 July 2010
and their financial performance and cash flows for the year ended on that date.
Our audit was completed on 24 September 2010 and our unqualified opinion is expressed as at that date.
hcruhctsirhCstnatnuoccAderetrahC

70 KATHMANDU HOLDINGS LIMITED ANNUAL REPORT 2010
STATUTORY INFORMATION
EMPLOYEE REMUNERATION
The Group operates in New Zealand, Australia and the UK where remuneration market levels differ. The offshore remuneration amounts are converted into New Zealand dollars. Of the employees noted in the table below, 55% are employed by the Group outside New Zealand. During the year a number of employees or former employees, not being non-Executive Directors of the Group, received remuneration and other benefits that exceeded NZ$100,000 in value as follows:
Remuneration Number of Employees
$ $
100,000 - 110,000 5
110,001 - 120,000 4
120,001 - 130,000 1
140,001 - 150,000 3
150,001 - 160,000 1
170,001 - 180,000 2
190,001 - 200,000 1
250,001 - 260,000 1
310,000 - 320,000 1
360,001 - 370,000 1
370,001 - 380,000 1
400,001 - 410,000 1
710,001 - 720,000 1
DISTRIBUTION OF SHAREHOLDERS AND HOLDINGS
Number of Holders % Number of
Ordinary Shares %
1 to 999 341 10% 205,219 0%
1,000 to 4,999 1,365 40% 3,509,587 2%
5,000 to 9,999 736 22% 5,409,703 3%
10,000 to 99,999 874 26% 22,254,152 11%
100,000 and over 67 2% 168,621,339 84%
Total 3,383 100% 200,000,000 100%
The details set out above were as at 13 September 2010.
The Company has only one class of shares on issue, ordinary shares, and these shares are listed on the NZX and ASX. There are no other classes or equity security currently on issue. The Company’s ordinary shares each carry a right to vote on any resolution on a poll at a meeting of shareholders. Holders of ordinary shares may vote at a meeting in person, or by proxy, representative or attorney. Voting may be conducted by voice, by show of hands, or poll. There are no voting rights attached to options.
There were 82 shareholders holding less than a marketable parcel, as defined by ASX Listing Rules, of the Company’s ordinary shares, based on the market price as at 13 September 2010.
There are no restricted securities or securities subject to voluntary escrow on issue.

KATHMANDU HOLDINGS LIMITED ANNUAL REPORT 2010 71
SUBSTANTIAL SECURITY HOLDERS
According to notices given under the Securities Markets Act 1988 (New Zealand), the substantial security holders in ordinary shares (being the only class of listed voting securities) of the Company and their relevant interests according to the substantial security holder file as at 13 September 2010, were as follows:
Ordinary shares %
Commonwealth Bank of Australia (16 August 2010) 19,988,023 10.0%
AMP (22 July 2010) 16,346,785 8.2%
Orion Asset Management (11 February 2010) 12,780,057 6.4%
AusBil Dexia (25 November 2009) 10,512,000 5.3%
As at 13 September 2010, the Company had 200,000,000 ordinary shares on issue.
LIMITATIONS ON THE ACQUISITION OF SECURITIES
The Company is not subject to Chapters 6, 6A, 6B and 6C of the Corporations Act 2001 (Australia) dealing with the acquisition of shares (i.e. substantial holdings and takeovers).
Limitations on the acquisition of the securities imposed by the jurisdiction in which the Company is incorporated (New Zealand) are:
(a) In general, securities in the Company are freely transferable and the only significant restrictions or limitations in relation to the acquisition of securities are those imposed by New Zealand laws relating to takeovers, overseas investment and competition.
(b) The New Zealand Takeovers Code creates a general rule under which the acquisition of 20% or more of the voting rights in the Company or the increase of an existing holding of 20% or more of the voting rights of the Company can only occur in certain permitted ways. These include a full takeover offer in accordance with the Takeovers Code, a partial takeover offer in accordance with the Takeovers Code, an acquisition approved by an ordinary resolution, an allotment approved by an ordinary resolution, a creeping acquisition (in certain circumstances) or compulsory acquisition of a shareholder holds 90% or more of the shares of the Company.
(c) The New Zealand Overseas Investment Act 2005 and Overseas Investment Regulations 2005 (New Zealand) regulate certain investments in New Zealand by overseas persons. In general terms, the consent of the New Zealand Overseas Investment Office is likely to be required where an “overseas person” acquires shares in the Company that amount to 25% or more of the shares issued by the Company, or if the overseas person already holds 25% or more, the acquisition increases that holding.
(d) The New Zealand Commerce Act 1986 is likely to prevent a person from acquiring shares in the Company if the acquisition would have, or would be likely to have, the effect of substantially lessening competition in the market.
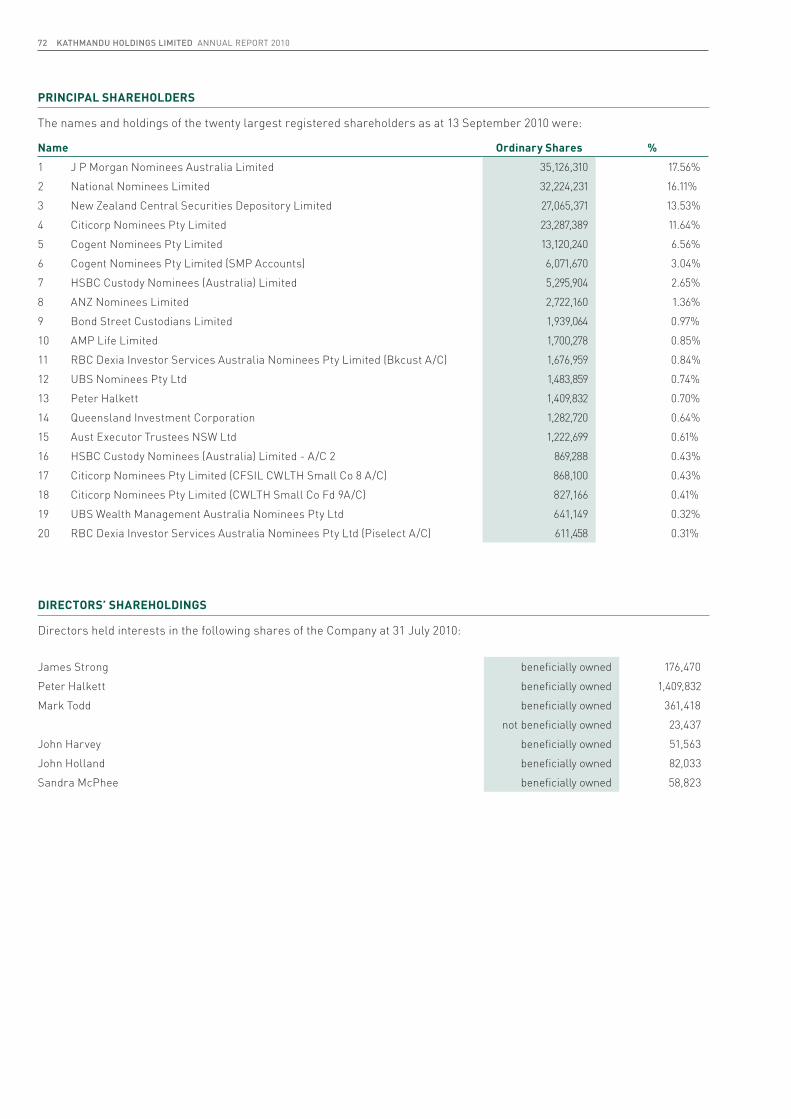
72 KATHMANDU HOLDINGS LIMITED ANNUAL REPORT 2010
PRINCIPAL SHAREHOLDERS
The names and holdings of the twenty largest registered shareholders as at 13 September 2010 were:
Name Ordinary Shares %
1 J P Morgan Nominees Australia Limited 35,126,310 17.56%
2 National Nominees Limited 32,224,231 16.11%
3 New Zealand Central Securities Depository Limited 27,065,371 13.53%
4 Citicorp Nominees Pty Limited 23,287,389 11.64%
5 Cogent Nominees Pty Limited 13,120,240 6.56%
6 Cogent Nominees Pty Limited (SMP Accounts) 6,071,670 3.04%
7 HSBC Custody Nominees (Australia) Limited 5,295,904 2.65%
8 ANZ Nominees Limited 2,722,160 1.36%
9 Bond Street Custodians Limited 1,939,064 0.97%
10 AMP Life Limited 1,700,278 0.85%
11 RBC Dexia Investor Services Australia Nominees Pty Limited (Bkcust A/C) 1,676,959 0.84%
12 UBS Nominees Pty Ltd 1,483,859 0.74%
13 Peter Halkett 1,409,832 0.70%
14 Queensland Investment Corporation 1,282,720 0.64%
15 Aust Executor Trustees NSW Ltd 1,222,699 0.61%
16 HSBC Custody Nominees (Australia) Limited - A/C 2 869,288 0.43%
17 Citicorp Nominees Pty Limited (CFSIL CWLTH Small Co 8 A/C) 868,100 0.43%
18 Citicorp Nominees Pty Limited (CWLTH Small Co Fd 9A/C) 827,166 0.41%
19 UBS Wealth Management Australia Nominees Pty Ltd 641,149 0.32%
20 RBC Dexia Investor Services Australia Nominees Pty Ltd (Piselect A/C) 611,458 0.31%
DIRECTORS’ SHAREHOLDINGS
Directors held interests in the following shares of the Company at 31 July 2010:
James Strong beneficially owned 176,470
Peter Halkett beneficially owned 1,409,832
Mark Todd beneficially owned 361,418
not beneficially owned 23,437
John Harvey beneficially owned 51,563
John Holland beneficially owned 82,033
Sandra McPhee beneficially owned 58,823

KATHMANDU HOLDINGS LIMITED ANNUAL REPORT 2010 73
SHARE DEALINGS BY DIRECTORS
In accordance with Section 148(2) of the Companies Act 1993 (New Zealand), the Board has received disclosures from the Directors named below of acquisitions or disposals of relevant interests in the Company between 13 November 2009 and 13 July 2010, the details of those dealings were entered in the Company’s interests register. The particulars of such disclosures are:
SUBSIDIARY COMPANY DIRECTORS
Section 211(2) of the Companies Act 1993 (New Zealand) requires the Company to disclose, in relation to its subsidiaries, the total remuneration and value of other benefits received by Directors and former Directors, and particulars of entries in the interests registers made during the year ended 31 July 2010.
No subsidiary has Directors who are not full-time employees of the Group.
The remuneration and other benefits of such employees (received as employees) totalling $100,000 or more during the year ended 31 July 2010, are included in the relevant bandings for remuneration disclosed at the beginning of the “Statutory Information” section of this annual report.
No employee of the Group appointed as a Director of Kathmandu Holdings Limited or its subsidiaries receives or retains any remuneration or other benefits in their capacity as a Director.
The persons who held office as Directors of subsidiary companies at 31 July 2010, and those who ceased to hold office during the year ended 31 July 2010, are as follows:
Milford Group Holdings Limited Peter Halkett, Mark Todd (Clark Perkins, Christopher Hadley and Hugh Toll ceased to hold office during the year)
Kathmandu Limited Peter Halkett, Mark Todd (Clark Perkins, Christopher Hadley and Hugh Toll ceased to hold office during the year)
Kathmandu Pty Limited Peter Halkett, Mark Todd, Matthew Spencer (Clark Perkins, Christopher Hadley and Hugh Toll ceased to hold office during the year)
Kathmandu (U.K.) Limited Peter Halkett, Mark Todd (Clark Perkins and Christopher Hadley ceased to hold office during the year)
Director Nature of Interest Shares Acquired Consideration Date
James Strong Beneficial 176,470 NZD 2.13 13/11/2009
Sandra McPhee Beneficial 58,823 NZD 2.13 13/11/2009
John Harvey Beneficial 51,563 NZD 2.13 13/11/2009
John Holland Beneficial 82,033 NZD 2.13 13/11/2009
Peter Halkett Beneficial 1,409,832 NZD 2.13 13/11/2009
Mark Todd Beneficial 361,418 NZD 2.13 13/11/2009
Mark Todd Non-Beneficial 23,437 NZD 2.13 13/11/2009

74 KATHMANDU HOLDINGS LIMITED ANNUAL REPORT 2010
DISCLOSURE OF INTERESTS BY DIRECTORS
In accordance with Section 140(2) of the Companies Act 1993 (New Zealand), the Directors named below have made a general disclosure of interest, by a general notice disclosed to the Board and entered in the Company’s interests register. General notices given by Directors which remain current as at 31 July 2010 are as follows:
JAMES STRONG
Chairman of: Woolworths LimitedInsurance Australia Group Limited (resigned 26 August 2010)
A director of:Qantas Airways LimitedIAG Finance New Zealand Limited (resigned 26 August 2010)Australian Grand Prix CorporationAustralia Council for the Arts
A member of:Nomura Australia Limited Advisory Board
SANDRA McPHEE
Deputy chairman of:St Vincents and Mater Health Sydney Limited
A director of:AGL Energy LimitedTourism Australia Fairfax Media Limited
A vice president of:The Art Gallery of NSW Trust
A member of:JP Morgan Advisory CouncilAdvisory Board of MMC
JOHN HARVEY
A director of:DNZ Property Fund LimitedPort Otago LimitedNew Zealand Opera LimitedMARAC Finance Limited
An advisor to the board of:Resource Coordination Partnership Limited
JOHN HOLLAND
A partner of:Chapman Tripp
A member of:Securities Commission of New Zealand

KATHMANDU HOLDINGS LIMITED ANNUAL REPORT 2010 75
DIRECTORS’ AND OFFICERS’ INSURANCE AND INDEMNITY
The Group has arranged, as provided for under the Company’s Constitution, policies of Directors’ and Officers’ Liability Insurance which, with a Deed of Indemnity entered into with all Directors, ensures that generally Directors will incur no monetary loss as a result of actions undertaken by them as Directors. Certain actions are specifically excluded, for example, the incurring of penalties and fines which may be imposed in respect of breaches of the law.
USE OF COMPANY INFORMATION
There were no notices from Directors of the Company requesting to use Company information received in their capacity as Directors which would not otherwise have been available to them.
GROUP STRUCTURE
Kathmandu Holdings Limited owns 100% of the following companies:Milford Group Holdings Limited*
Kathmandu Group LimitedKathmandu Pty LimitedKathmandu (UK) Limited* Milford Equities Limited and Kathmandu Group Limited were amalgamated into Milford Group Holdings Limited on 31 July 2010.
DIRECTORS’ DETAILS
James Strong Chairman, non-Executive DirectorPeter Halkett Managing Director and Chief Executive OfficerMark Todd Finance Director and Chief Financial Officer and Company SecretaryJohn Harvey non-Executive DirectorJohn Holland non-Executive DirectorSandra McPhee non-Executive Director
EXECUTIVES’ DETAILS
Peter Halkett Chief Executive OfficerMark Todd Chief Financial Officer
DIRECTORY
The details of the Company’s principal administrative and registered office in New Zealand is:
11 Mary Muller DriveHeathcotePO Box 1234Christchurch 8140

76 KATHMANDU HOLDINGS LIMITED ANNUAL REPORT 2010
SHARE REGISTRY
IN NEW ZEALAND Link Market Services (LINK)
Physical address Level 16, Brookfields House, 19 Victoria Street West, Auckland 1010 New Zealand
Postal address PO Box 91976, Auckland, 1142 New Zealand
Telephone +64 9 375 5999Investor enquiries +64 9 375 5998Facsimile +64 9 375 5990
Internet address www.linkmarketservices.com
IN AUSTRALIA Link Market Services (LINK)
Physical address Level 1, 333 Collins Street Melbourne, VIC 3000 Australia
Postal address Locked Bag A14 Sydney, South NSW 1235 Australia
Telephone +61 2 8280 7111Investor enquiries +61 2 8280 7111Facsimile +61 2 9287 0303
Internet address www.linkmarketservices.com.au
STOCK EXCHANGESThe shares are listed on the NZX and the ASX.
INCORPORATIONThe Company was incorporated in New Zealand.

This book is printed on environmentally responsible paper manufactured using FSC-certified, mixed-source pulp harvested from sustainable well-managed forests and using an elemental chlorine-free process. Vegetable based inksand water-based aqueous coating were used.
Designed and printed byGEON print and communication solutions
www.geongroup.com
VIC
Smith StFitzroyBlackburn Hampton EastMelbourne (Bourke St)Knox Richmond Highpoint (Maribyrnong)Camberwell Melbourne (Spencer St)ChadstoneDoncasterFrankston Chapel St South Wharf DFOBendigo GeelongBallarat
ACT
Canberra CivicWodenCanberra Centre
NSW
AlburySydney (Kent St)ChatswoodCronulla Birkenhead PointRedyard (Auburn)Bondi JunctionHornsbyWarringahNewcastleCastle TowersMacquarie Rouse HillParramattaMacarthur Erina Fair
QLD
Brisbane (Queens Mall) Fortitude Valley ChermsideLoganKawanaPacific Fair (Broadbeach) Townsville
SA
Adelaide (Rundle St)MarionTea TreeAdelaide Harbour Town
TAS
HobartDevonportLaunceston
WA
Perth (Hay St)CottesloeInnalooCarousel (Cannington)Fremantle
NORTH ISLAND
Albany Auckland (Queen St) Auckland (Victoria St) Botany GisborneHamilton Hastings Lyall BayManukau Napier New Plymouth Newmarket Onehunga Otaki
London: Berners St Covent Garden Spitalfields White City
Brighton Bristol
AUSTRALIA
NEW ZEALAND
UNITED KINGDOM
STORE LOCATIONS
Palmerston North Petone Rotorua Sylvia Park Takapuna TaupoTauranga Tauranga CBD Te RapaWaitakere WanganuiWellingtonWhangarei
SOUTH ISLAND
Blenheim Christchurch [Cashel St) Christchurch (Tower Junction) Dunedin Invercargill Nelson Queenstown Riccarton Timaru

KATHMANDU HOLDINGS LIMITEDANNUAL REPORT 2010