Annual Report 2010 Every year brings new challenges · new challenges new opportunities. This...
130
Genesis Energy 602 Great South Rd PO Box 17188 Greenlane 1546 Auckland T: +64 9 580 2094 F: +64 9 580 4894 genesisenergy.co.nz Every year brings new challenges new opportunities. This Annual Report reviews the performance of Genesis Energy in the past financial year. More information on our activities and our social and environmental performance can be found in our online Annual Report. For the complete picture, go to genesisenergy.co.nz Here is a review of 2010 GENESIS ENERGY ANNUAL REPORT 2010
Transcript of Annual Report 2010 Every year brings new challenges · new challenges new opportunities. This...

Genesis Energy602 Great South RdPO Box 17188
Greenlane 1546Auckland
T: +64 9 580 2094F: +64 9 580 4894genesisenergy.co.nz
Every year bringsnew challenges new opportunities.
This Annual Report reviews the performance of Genesis Energy in the past financial year. More information on our activities and our social and environmental performance can be found in our online Annual Report.
For the complete picture, go to genesisenergy.co.nz
Here is areviewof 2010
GENESIS ENERGY ANNUAL REPORT 2010
GEN
ESIS ENER
GY / Annual Report 2010

A fundamental rethink of Genesis Energy’s production, retail and development strategies conductedover the recent past is now delivering results in terms of improved business performance and a focuson future growth.
I am pleased to report that Genesis Energy has returned to profit in the year ended 30 June 2010 witha declared net profit after tax of $69 million.
The full year profit after tax was higher than projected due to favourable wholesale hedgesettlements, revenue from ancillary services, and savings from reduced operating costs, includingbringing the Customer Contact Centre in house. The profit was partly offset by settlement of thelongstanding Kinleith litigation and other accounting adjustments.
Total Group revenue was $1,895 million, down from $1,957 million in 2008/2009, while total operatingcosts were $1,646 million, down from $1,755 million in the previous year.
In 2009 we reported a loss of $136 million, which was due to a downwards revaluation of ourgeneration assets, primarily the older coal and gas units known as Huntly Units 1 to 4. As a result wehighlighted the underlying earnings after tax of $82 million. Underlying earnings in the year to 30 June2010 were $88 million.
Targets exceededThe 2009/2010 financial result reflects strategic decisions taken over the past two years in order tostrengthen the commercial focus and behaviour of the Company. A reduction in retail commitmentshas enabled our wholesale trading division to gain greater flexibility in the electricity market which hasled to increased revenues from wholesale contracts, ancilliary services and frequency keeping.
The focus on business improvement, efficiency and cost management has been applied to all sectorsof the Company and has contributed to an improved result against our key targets which are outlinedeach year in the Company’s Statement of Corporate Intent (SCI).
Genesis Energy has exceeded all key financial performance targets in its SCI for the year ending 30June 2010. The target of a 1.9 per cent return on equity was more than achieved with an actual returnof 4.9 per cent. Gearing was 28 per cent compared to the target of 31 per cent and interest cover was10.1 against the SCI target of 5.7. There were also no significant resource consent non-compliances.
New business objectivesGenesis Energy has introduced a formal process to identify the Company’s key material issues –those issues that influence the Company’s ability to deliver on the business strategy and ives. Thefollowing are the major Company level material issues:
Improvement of customer service levels and increased retail efficiency
Improvement of financial performance as required by the shareholder
Development of economic, long term generation opportunities
Maximisation of value from the Huntly Power Station.
Renewal of existing operating consents to maintain access to resources
The final step in this process will be the development of a suite of meaningful performance measuresand targets to address these key business unit material issues. These performance measures willbuild upon those expressed in the SCI. The actions associated with these targets will be reflected inindividual employee performance objectives. This all helps to integrate the Business Objectives (seebelow) into the Company’s business planning and ensures constant monitoring and review ofperformance against them.
Chairman's Report
The favourable result reflects strategicdecisions taken in the past two years.
Focusing on opportunitiesfor growth
Page 2
Genesis Energy Annual Report 2010

Future of HuntlyIn the past year we have developed a new asset management strategy for the Huntly Power Stationand begun its implementation. We have been able to push back retirement plans for the older, dualfuel Huntly Units 1 to 4 which we announced last year by a year or so as a result of signing a longterm winter electricity hedge with Meridian Energy. We are also continuing constructive discussionswith other market participants on other long term arrangements.
We have moved our strategic thinking away from retirement of Huntly’s Units 1 to 4 to various storageoptions for these units. This would allow operational flexibility to meet market demands, should therebe delays in the present forecasts of new generation build for the New Zealand market.
Another key initiative during the year was to bring the Retail Contact Centre in-house. The Company'sgoal is to provide a high level of service and innovative product offerings to its customers. TheCompany believes this is best achieved by the integration of the Contact Centre into the business.
Improving competitionThe Government’s announced policy in December 2009 to improve retail competition through theintroduction of compulsory hedges and the sale of Tekapo A and B Hydro Power Stations to GenesisEnergy was supported by the Company. We believe a more balanced and geographically-spreadgeneration portfolio, achieved through a transfer of assets and long term financial hedges forelectricity, will lead to greater competition and improved outcomes for electricity and gas customers.
Since the introduction to the House of the Electricity Industry Bill in December 2009, Genesis Energyhas been negotiating for the purchase of Tekapo A and B from Meridian Energy.
Concurrent with negotiations and planning for the acquisition of Tekapo A and B, our Retail businesslaunched a comprehensive sales and marketing campaign to acquire customers in Christchurch,Dunedin, and Queenstown. To date we have welcomed thousands of new South Island customers toour brand.
Board changesI assumed the Chairmanship of Genesis Energy from Brian Corban CNZM QSO in November 2009.Brian's contribution to the development of the Company during his 11-year tenure as Chairman is wellknown and respected. I would also like to acknowledge the contribution of the other directors who leftthe Board during the year. Annabel Cotton and Ian Kusabs retired from the Board through rotationand Sara Lunam resigned from the Board to take a corporate management role. We welcomed JohnDell and Rukumoana Schaafhausen to the Board in May 2010.
The Board and I acknowledge and thank the staff for its excellent response to the challenges set bythe Electricity Industry Bill and for answering the call for a higher degree of commerciality throughoutthe business. This has been a year of change for Genesis Energy and the changes that are still beingmade are positioning us well for the future.
On behalf of the Board, I have great pleasure in submitting the 2009/2010 Genesis Power LimitedAnnual Report.
Rt Hon Dame Jenny ShipleyDNZM, Chairman
Page 3
Genesis Energy Annual Report 2010

In 2009/2010 we have been able to successfully implement operational changes due to strategicdecisions taken in the past two years and we have taken advantage of new opportunities thatpresented themselves to the Company.
In last year’s Annual Report we raised some very important issues about the long term sustainabilityof our generation business, in particular the viability of the dual fuel units at Huntly that we refer to asUnits 1 to 4.
Last year we signalled the potential retirement of these units at Huntly in the near future. This year wehave been able to push back those retirement plans by a year or more by signing a five-year wintersupply arrangement with Meridian Energy, and we are continuing constructive discussions with othermarket participants. As well, we have advanced our work on asset management strategies for theHuntly Power Station.
As a result we are now considering various storage options as an alternative to near term retirementof the Huntly units. Storage in our view is not the same as mothballing. We are considering a range ofshort and medium term storage options which would enable units to be returned to the market with aminimum of expenditure in a matter of days, weeks or months, depending on the storage approach.
The driver for this storage strategy is to obtain better commercial outcomes from our generatingassets, as well as security of supply. A key commercial issue for Genesis Energy has been the abilityto derive a satisfactory return from an increasingly expensive to maintain and operate generationasset. While this asset was originally built to provide security of supply for the country, our storageand asset management strategies will support the need to operate commercially.
Flexible response to the marketOur new asset management strategy can provide flexibility to respond to new generationdevelopment, or possible delays in new plant construction.
Allied to the asset management programme has been a shift in thinking regarding our Retail load –that is, the amount of electricity we are contracted to supply. Reducing our Retail load by around 10per cent over the past year has allowed us more flexibility in the wholesale market. This retail loadreduction has been achieved through a combination of reduced customer numbers as well asreduced load.
Apart from giving the Company more wholesale market flexibility, our retail strategy served to send aclear message that Huntly cannot be relied upon if other participants are not careful with their ownrisk management.
As a result, wholesale market behaviour in 2010 has been significantly different. Wholesale spotmarket prices at South Island nodes in late summer 2010 were higher than in previous years withsimilar low storage levels and remained firm even as inflows improved storage.
Improving customer serviceDuring the year we made the decision to bring our Hamilton-based customer contact centre in-house.This decision was driven by a desire for greater efficiency, an improved grade of customer serviceand a long term strategy to develop a stronger and closer relationship with our customers.
The shift from outsource to in-house formally took place on 1 March 2010. However, this waspreceded by several months of transition work. Despite it being early days, this move has improvedcustomer service and has reduced our cost to serve.
There is no doubt the retail electricity market is going through a phase of intense competition and weexpect this scenario to continue. We continue to be active in the retail market and have looked toretain our profitable, high value customers with competitive price offers, superior products and loyaltyand win-back offers.
The programme to roll out Advanced Meters to our electricity customershas progressed well. As at 30 June 2010, Genesis Energy had installed59,860 advanced meters in customer premises, and has now reached aninstallation rate of around 10,000 new meters per month. This scale willfacilitiate development in the near future of a range of new products to beoffered via Advanced Meters.
Chief Executive’s Report
Our asset management strategy is designed to maximisemarket opportunities
Creating operationalflexibility to create abusiness edge
Page 4
Genesis Energy Annual Report 2010

The likely acquisition of Tekapo A and B hydro power stations by the end of 2010 created significantchallenges within the business. The potential acquisition of the two stations required a re-think of ourgeneration and retail strategies. We were able to launch an aggressive customer acquisitioncampaign in the South Island in anticipation of being able to service a sizable retail load in that sectorwithout being exposed to basis risk. By balance date, we had acquired around 6,000 new electricityand LPG customers in the South Island and we continue with good growth in this area.
Developing generation capacityWhile the acquisition of the two South Island hydros will rapidly increase and reshape the generatingportfolio of the Company, the need to develop generation capacity for the longer term remains.
We have a target to construct 300MW of new renewable electricity generation by 2015. With thatobjective in mind, we have been working over the past year on a range of generation opportunities inthe wind, hydro and geothermal sectors.
The most promising development in our pipeline of projects is the Castle Hill Wind Farm site located20kms north-east of Masterton and 20km east of Eketahuna. Genesis Energy has signed land useagreements with 27 owners of 30,000ha, with around 4,000ha suitable for wind farm development.Just after balance date we announced the Company's intent to lodge a resource consent applicationfor this project. This decision was a significant step forward for the Company’s strategy to increase itsportfolio of renewable energy.
Wind monitoring at the site has confirmed an attractive wind prospect with a potential generatingcapacity of up to 600MW. The exact number of wind turbines, their precise location and size is yet tobe determined. We expect that it could be built in stages over several years. The resource consentapplication will contain details on the turbines, site layout, construction and operation activities and acomplete assessment of environmental effects and is expected to be lodged before mid 2011,following consultation with the community.
On 30 June 2010 Genesis Energy acquired the Slopedown Wind Farm project in Southland fromWind Prospect CWP NZ Ltd. The project is a 50 turbine site, 50km east of Invercargill and 8km eastof Wyndham and is expected to have a generation capacity of between 110 to 150MW, with potentialoutput of approximately 400 to 500GWh per annum.
Genesis Energy lodged resource consent applications with the Auckland Regional Council (ARC) andRodney District Council in July 2007 for the proposed Rodney Power Station. Consents wereobtained from the ARC in December 2008 and Genesis Energy appealed three conditions to theEnvironment Court in January 2009. The appeal was resolved through mediation with the ARC and aconsent order from the Environment Court was issued in October 2009 resolving the appeal.
An appeal lodged against the Vector pipeline designation for the Rodney Power Station project washeard in the Environment Court during the week commencing 19 April 2010. Genesis Energy was aparty to the appeal and participated in the Environment Court hearing. The Environment Court ruledin favour of the gas pipeline designation on 18 June 2010.
Now that we have finalised all necessary approvals for the Rodney project, we are reviewing variousdevelopment alternatives as well as long term fuel supplies to determine the optimum developmenttimeframe for this project.
Securing fuel suppliesA significant milestone for Genesis Energy during the year was the commissioning and production offuels from the 31 per cent owned Kupe Oil and Gas Project. All of the natural gas from the field iscontracted to Genesis Energy and this has added security and flexibility to our gas supplies forgeneration andfor wholesale and retail customers.
Commissioning was completed on 22 March 2010, and the project has now entered commercialproduction. Genesis Energy's Kupe sales over 2009/2010 included 3PJ of gas, 319,000 barrels of oiland 8,800 tonnes of LPG.
On 14 July 2010, the Kupe Joint Venture approved revised Kupe reserves numbers. The initial provedand probable (P50) sales gas reserves have increased by eight per cent, LPG reserves by five percent and light oil reserves by 27 per cent.
At balance date, Genesis Energy’s total expenditure for the Kupe project was $539.3 million, inclusiveof a rehabilitation provision.
Our coal stockpile stood at 1,092 kilotonnes as at 30 June 2010. The level of the stockpile is likely tovary under different hydrological conditions.
Iwi engagementThere has been a significant development of emphasis and relationships with most iwi that weengage with. There is an increasing willingness to engage with each other in a constructive and directmanner.
The signing of a Relationship Agreement between Genesis Energy and six Huntly Marae and theHuntly based Waahi Whaanui Trust was the culmination of five years of engagement and dialogue.The agreement records the parties’ intention to establish an enduring, positive and beneficialrelationship which directly addresses the effects of the Huntly Power Station on local Marae, whilerecognising the Huntly Power Station is a key strategic asset for Genesis Energy and New Zealand.
Through regular engagement and funding provided by Genesis Energy, the parties seek to deliver thebroad objectives of developing a long term relationship, assisting Marae development, fosteringcultural understanding, supporting the kaitiaki role of the Marae and enhancing the environment andsupporting education and training initiatives.
With regard to the legal dispute with Whanganui River Maori Trust Board, Ngati Rangi Trust andTamahaki Incorporated Society over the duration of resource consents for the Tongariro PowerScheme, we have all agreed to suspend legal proceedings (an appeal to the Supreme Court) and talkconstructively about options to resolve outstanding issues.
Page 5
Genesis Energy Annual Report 2010
Kupe Production Station

Environmental and social impactOur challenge as we developed the Company’s business plan and strategy was to bring sustainabilityinto all parts of the business. The task now is to make it real and bring it to life and into allperformance measures.
Genesis Energy’s impact on climate change is still a priority even as our emissions from thermalgeneration are decreasing. The Company is significantly affected by the Emissions Trading Schemewhich came into force on 1 July 2010. We have been planning and preparing our staff and systemsfor the onset of emissions trading for some time. As the detail around the scheme became clearer in2010, we re-scoped our position and scaled back some activities. Genesis Energy was ready for thescheme when it launched on 1 July 2010.
We believe we manage our environmental impact to the highest possible standard. We had nosignificant breaches of our resource consents in the past year and we are continually striving toimprove our environmental management processes and systems. A significant environmental issuefor Genesis Energy is ash produced by Units 1 to 4 at Huntly and we are constantly seeking methodsto upgrade and improve our ash management programme.
The safety of our staff remains a major concern to the Company. Our annual statistics show an overallimprovement, but still demonstrate an increase in loss time injuries. We believe our health and safetyprocesses are at a high standard and may have reached their limits from a procedural point of view.We have been focusing more on behavioural outcomes using new programmes and we will continueto investigate new methods of improving staff safety.
Finally, I would like to express my gratitude to the Company's employees for the way that they haveresponded to the challenges presented by the results of the Ministerial Review into the Performanceof the Electricity Market, as well as to the challenges required to adapt to revisions in the Company'sstrategy. Their efforts have postioned us well for the future.
Albert BrantleyChief Executive
Page 6
Genesis Energy Annual Report 2010

Highlights + Challenges
01 New Technology59,860 Advanced Meters
installed.
05 New CustomersSouth Island customer
acquisition campaign launched. TheCompany continues to seek growth inthe South Island.
08 New Schools42 Schoolgen schools now
generating their own renewableelectricity; nine schools in theManawatu/Wanganui region added tothe programme
02 New Power StationsElectricity Industry Bill
enables sale of Tekapo A and B toGenesis Energy.
06 New AgreementsHuntly Marae Relationship
Agreement signed, signifying new eraof connection with local marae.
09 New FuelNatural gas, LPG and light
oil flows from Kupe Field.03 New SkillsTwo more years of
commitment to the marae-basedTrades Training programme createdby Nga Kanohi Marae o Wairarapa inMasterton.
07 New StaffCustomer Contact Centre
brought in-house.
10 New ViewNew asset-
management strategyadopted for Huntly PowerStation.
04 New WarmthWellington Curtain Bank
launched with support from GenesisEnergy
Page 7
Genesis Energy Annual Report 2010

While competition for electricity and gas customers in New Zealand has, arguably,never been more intense as it has in 2009/2010, Genesis Energy has welcomedthousands of new customers to its service during the year.
Overall customer numbers for both electricity and gas are down compared to the previous year as aresult of aggressive campaigns run by rival retailers. However the Company was also involved in thebid for new customers, particularly in the South Island where comprehensive sales and marketingcampaigns were run in the second half of the financial year.
The residential offer included competitive pricing (in some areas Genesis Energy could givecustomers a saving of up to $350 per annum), bonus Brownie Points when joining and fixed pricing.As at 30 June 2010 Genesis Energy had welcomed over 6,000 new residential and business SouthIsland customers to Genesis Energy.
Genesis Energy values its existing customer base and rewards loyalty with a scheme called BrowniePoints. Instead of encouraging a higher spend, Brownie Points rewards customer behaviour,particularly those aligned to our sustainability targets. Customers gain Brownie Points by receivingtheir bills online, paying electronically or by using the online Your Account function.
New Customers
Page 8
Genesis Energy Annual Report 2010
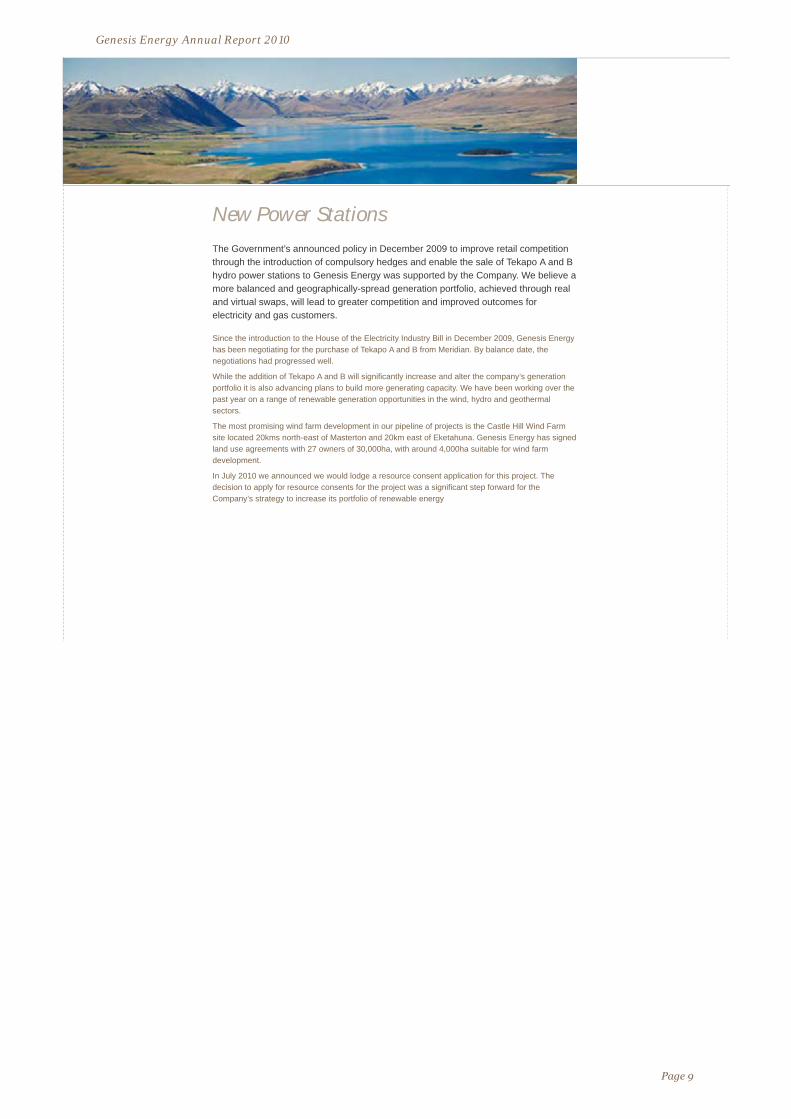
The Government’s announced policy in December 2009 to improve retail competitionthrough the introduction of compulsory hedges and enable the sale of Tekapo A and Bhydro power stations to Genesis Energy was supported by the Company. We believe amore balanced and geographically-spread generation portfolio, achieved through realand virtual swaps, will lead to greater competition and improved outcomes forelectricity and gas customers.
Since the introduction to the House of the Electricity Industry Bill in December 2009, Genesis Energyhas been negotiating for the purchase of Tekapo A and B from Meridian. By balance date, thenegotiations had progressed well.
While the addition of Tekapo A and B will significantly increase and alter the company’s generationportfolio it is also advancing plans to build more generating capacity. We have been working over thepast year on a range of renewable generation opportunities in the wind, hydro and geothermalsectors.
The most promising wind farm development in our pipeline of projects is the Castle Hill Wind Farmsite located 20kms north-east of Masterton and 20km east of Eketahuna. Genesis Energy has signedland use agreements with 27 owners of 30,000ha, with around 4,000ha suitable for wind farmdevelopment.
In July 2010 we announced we would lodge a resource consent application for this project. Thedecision to apply for resource consents for the project was a significant step forward for theCompany’s strategy to increase its portfolio of renewable energy
New Power Stations
Page 9
Genesis Energy Annual Report 2010

A fundamental rethink of Genesis Energy’s production, retail and developmentstrategies carried out recently is now delivering results in terms of improved businessperformance and a focus on driving growth through commercial behaviour.
The installation of 59,860 Advanced Meters plus an investment in retail systems has created anopportunity to develop and offer new electricity tariffs and services to meet customer needs. Weexpect to roll out these new offers in the next 12 months.
The likely acquisition of Tekapo A and B hydro power stations, enabled by the Electricity Industry Bill,provided an opportunity to aggressively seek new customers in the South Island.
We have developed a new asset management strategy for the Huntly dual fuel units and begun itsimplementation. We have been able to push back retirement plans for Huntly Units 1 to 4 which weannounced last year by a year or so as a result of signing a long term winter supply arrangement withMeridian Energy. We have moved our strategic thinking away from retirement of these units to variousstorage options which would allow operational flexibility to meet market demands.
New Opportunities
Page 10
Genesis Energy Annual Report 2010

Having determined the need to maintain a closer relationship with ourcustomers, Genesis Energy announced in June 2009 its intention to bring theCustomer Contact Centre in-house. This decision was driven by a desire forgreater efficiency, an improved grade of customer service and a long termstrategy to develop a stronger and closer relationship with our customers.
Since the successful transition on 1 March 2010 to an in-house model, Genesis Energy hasseen the benefits of having a single organisation with one core culture that is delivering to thesame strategic plan. This is resulting in a more efficient and dynamic company with customersat the centre.
New People
Page 11
Genesis Energy Annual Report 2010
Dame Jenny Shipley visitingcustomer contact centre
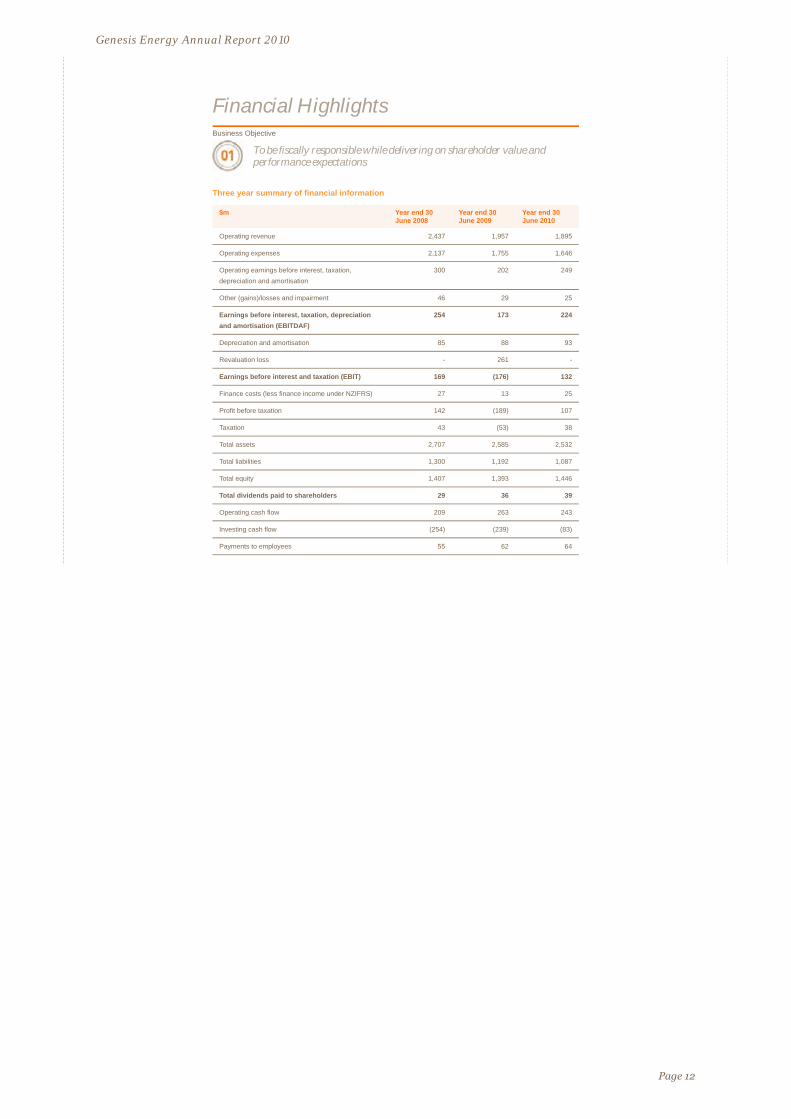
Three year summary of financial information
$m Year end 30June 2008
Year end 30June 2009
Year end 30June 2010
Operating revenue 2,437 1,957 1,895
Operating expenses 2,137 1,755 1,646
Operating earnings before interest, taxation,depreciation and amortisation
300 202 249
Other (gains)/losses and impairment 46 29 25
Earnings before interest, taxation, depreciation
and amortisation (EBITDAF)
254 173 224
Depreciation and amortisation 85 88 93
Revaluation loss - 261 -
Earnings before interest and taxation (EBIT) 169 (176) 132
Finance costs (less finance income under NZIFRS) 27 13 25
Profit before taxation 142 (189) 107
Taxation 43 (53) 38
Total assets 2,707 2,585 2,532
Total liabilities 1,300 1,192 1,087
Total equity 1,407 1,393 1,446
Total dividends paid to shareholders 29 36 39
Operating cash flow 209 263 243
Investing cash flow (254) (239) (83)
Payments to employees 55 62 64
Financial HighlightsBusiness Objective
To be fiscally responsible while delivering on shareholder value andperformance expectations
Page 12
Genesis Energy Annual Report 2010

Genesis Energy is acomplex business withtwo core revenue earners- Production and Retail.This section details thecompany's operations,sustainabilityperformance andstakeholder engagementover the past year.
Company Report
Page 13
Genesis Energy Annual Report 2010

In our view sustainability has to be simply the way business is done and not a bolt on or anafterthought.
This approach is not something that will happen overnight. Rather sustainability is a long-term journeycovering all aspects of the business – our workforce, management of our assets, our environmentalperformance, energy products and our impact on communities. We have been on the journey sincewe first opened our doors for business. We recognise that we are not there yet - good things taketime.
Last year was about trying to position sustainability in all areas of the business rather than have it asan isolated programme. The manifestation of our commitment to this integrated view of sustainabilityhas been the elevation, in 2010, of the company’s sustainability objectives to be company objectives.These objectives are being incorporated across our operations as a key part of our strategic approachto drive performance.
The challenge has been how to make it real, how to bring these objectives to life and intoperformance measures.
In last year’s report we detailed our ambitious plans to develop targets associated with the sevencompany-wide objectives. Whilst we have not yet finalised all of the targets and 2010/2011 actionsassociated with these seven objectives as we said we would have by the end of 2009, we haveidentified key performance measures against our business objectives and expressed these in theStatement of Corporate Intent 2010/11-2013.
In addition to the Statement of Corporate Intent targets, the next stage in this process is to develop amore comprehensive suite of targets to address the material issues and to deliver on the businessobjectives. The actions associated with these targets will then be reflected in individual employeeperformance objectives.
Global Reporting Initiative
1.2 Description of key impacts, risks and opportunities
Click this link to the GRI table for explanation
Approach to Sustainability
Genesis Energy considers sustainability is about ensuring our business is viable for the long-term,delivering value for our shareholders, and contributing lasting benefits to society.
Sustainability– simply the waybusiness is done
Page 14
Genesis Energy Annual Report 2010

The focus in the Production business unit in 2009/2010 has been on our assets, our people and ourperformance. There has been a complete review of forecast maintenance and capital requirementswith a focus on efficiency gains.
Sound cost management meant cost savings were achieved during the year resulting in indirect costsbeing below budget. This was mainly through reduced staff costs, reduced or delayed maintenanceon Huntly units and the delay of non-critical projects.
Total revenue from the generation and wholesale trading of electricity and related products in the yearto 30 June 2010 was $1,151 million ($1,213 million in 2008/2009). Profit before tax from theProduction segment was $154 million (in 2008/2009 there was a loss of $122 million.)
While there have been no job losses, the change in focus in our asset management regime hasimpacted staff. The move away from high levels of thermal plant availability, which required highlevels of engineering excellence, has necessitated a shift in thinking to a more flexible engineeringculture.
Thermal productionIn light of increasing fixed operational and fuel costs, compounded by the impending introduction of acarbon price, Genesis Energy reviewed the economic life of its four 250MW coal and gas fired units atHuntly. We have developed new asset management philosophies and implemented a regime wherethe older units are to be maintained according to expected usage. These asset managementphilosophies will allow greater flexibility to either store units so as to return if market conditionschange or retire at some future date.
Generally plant performance for the 2009/2010 year was inline with targets except for Huntly Unit 6 –a 48MW open cycle gas turbine. The full year availability for Huntly Unit 6 was well below budget dueto an unplanned outage to repair internal damage.
Hydro productionThe Tongariro and Waikaremoana power schemes provide backbone generation and hydro flexibilityto our generation profile. This is increasingly important as we review how we manage diverse assetsacross the portfolio.
In the early part of the year these stations were also used heavily to provide frequency keeping andancillary services which increased generation revenues significantly. The Equivalent AvailabilityFactor for the hydro stations was 91.8% (target 94.4%) for the Tongariro scheme and 93.6% (target90.7%) for the Waikaremoana stations.
Major production projects
Hydro Control Systems
A Hydro Control systems project continued during the year. In this project analogue control systemsare replaced with digital control systems. Tokaanu Power Station was upgraded in 2009 with Rangipoand Tuai being completed in 2010. The remaining Waikaremoana stations will be completed in the2010/2011 year.
Huntly Consents project
Work has commenced on the planning and consultation process for the renewal of resource consentsto generate from the Huntly site. These are due for replacement from March 2013 onwards.
Condenser Upgrades
Huntly Unit 1 condenser has been purchased and is awaiting installation in the next cold survey. Unit3 condenser is in storage.
Production metricsProduction revenue from external sources was down slightly when compared with the 2008/2009year. Due to the lower wholesale electricity price there was less thermal generation offset byadditional ancilliary services provided to the market. Offsetting the lower electricity revenue wasadditional wholesale gas sales.
Production Summary
2008/2009 2009/2010
Thermal generation (GWh) 6,276 5,761
Hydro & Wind generation (GWh) 1,770 1,815
Total Generation 8.046 7,576
Average Wholesale electricity price ($/MWh) 67.82 61.88
Gas used in generation PJ 26.50 31.80
Coal used in generation PJ 31.00 21.20
Total fuel used PJ 57.50 53.00
Production + New Generation DevelopmentBusiness objective
To provide economic production and new generation solutions thatdemonstrate strong sustainability performance
Page 15
Genesis Energy Annual Report 2010

New Generation DevelopmentGenesis Energy is focused on identifying opportunities for long term growth. Genesis Energy isinvestigating a wide range of technology and resource opportunities including thermal, geothermal,wind and hydro.
We take a wide focus as we believe diversity of supply will remain a key element of the New Zealandpower system into the future. Equally, there is no one technology from an economic perspective thatwarrants exclusive attention in the current environment.
Castle Hill Wind Farm projectGenesis Energy continues to develop a portfolio of renewable energy options to help us meet ourtarget of consenting and constructing 300MW of renewable energy projects by 2015. Among theseprojects are some high quality wind generation options including Castle Hill, Hau Nui Stage 3(Wairarapa Region) and the recently acquired Slopedown Wind Farm prospect east of Invercargill inSouthland.
After completing a detailed feasibility assessment in February 2010, the Castle Hill Wind Farm projectadvanced through to the next phase of development in July 2010.
The project, located in the Northern Wairarapa, encompasses 30,000ha of land held by 28landowners. The site offers a Class I wind regime with average wind speeds in the order of 9.5m/s.Our studies suggest the wind farm could be developed in stages up to a capacity of 600MW. Althoughfinal numbers are yet to be confirmed a wind farm of this scale could incorporate upwards of 290turbines, depending on the turbine size adopted in order to maximise the energy yield.
We are now well underway with resource consent acquisition activities on the Castle Hill project whichincorporates consultation with stakeholders and a detailed assessment of environmental effects.
The Generation Development team is also pursuing other opportunities. In June 2010 GenesisEnergy purchased the Slopedown Wind Farm prospect from developer Wind Prospect CWP NZ Ltd.The 100MW Southland project is in the early stages of investigation and will add to Genesis Energy’srange of new generation development options.
Other development optionsLong term thermal development options are being worked up that could see additional generation ateither the Huntly or Rodney Power Station sites. Pre-feasibility assessments and preliminary costestimates for several new hydro opportunities are also underway.
Water management policy participationGenesis Energy is an active participant in the Governments “New Start for Fresh Water” programme.Genesis Energy is a plenary member of the Land and Water Forum – the Forum asked to report backto the Minister for the Environment on potential water reform.
Genesis Energy continues to stay involved in the development of the proposed NationalEnvironmental Standard for Ecological Flows and Water Levels and the proposed National PolicyStatement on Freshwater Management.
As well as getting involved at the national level, Genesis Energy participates in water management atthe regional level with the Regional Councils responsible for water bodies and freshwater. Wherenecessary, Genesis Energy provides authoritative comment and submissions on regional policies andPlans in relation to water.
Global Reporting Initiative
EU2 Net energy output broken down by energy source and regulatory regime
EN4 Direct energy consumption
EU30 Average plant availability factor by energy source and regulatory regime
EN6 Initiatives to provide energy-efficient or renewable energy based products and services, andreductions in energy requirements as a result of these initiatives.
EU8 Research and Development activity and expenditure aimed at providing reliable electricityand promoting sustainable development
EU10 Planned capacity against projected electricity demand
Click this link to the GRI table for explanation
Page 16
Genesis Energy Annual Report 2010
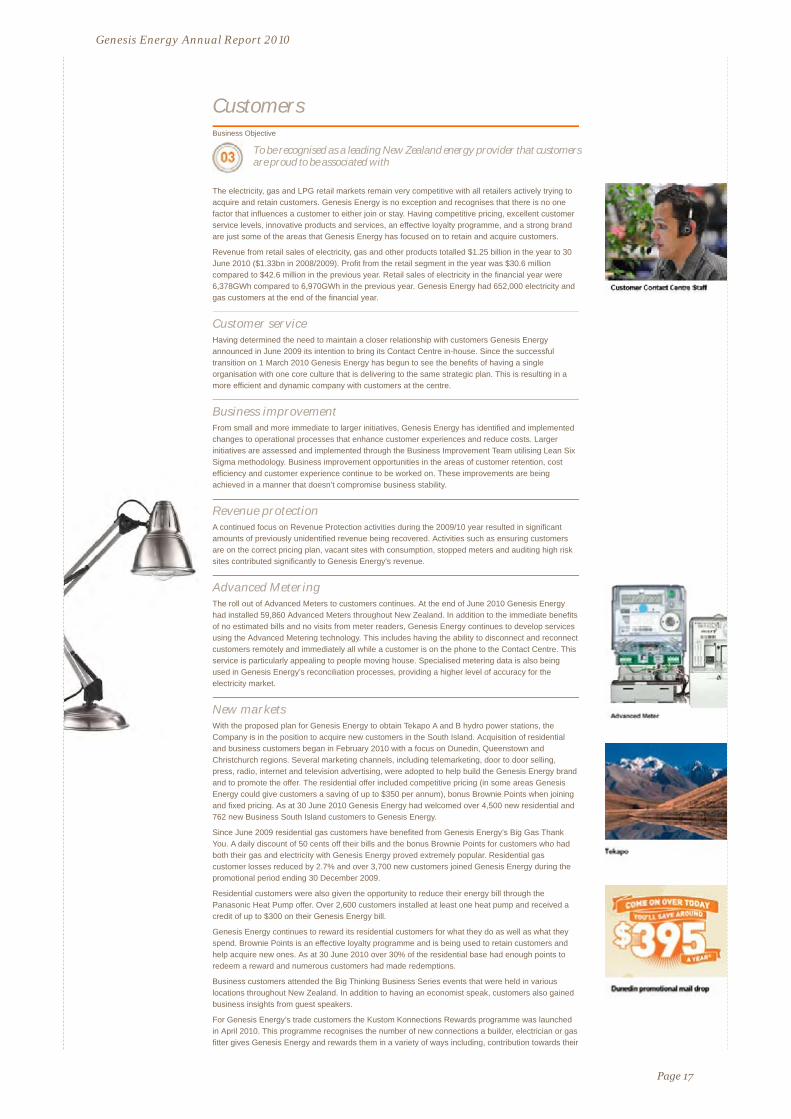
The electricity, gas and LPG retail markets remain very competitive with all retailers actively trying toacquire and retain customers. Genesis Energy is no exception and recognises that there is no onefactor that influences a customer to either join or stay. Having competitive pricing, excellent customerservice levels, innovative products and services, an effective loyalty programme, and a strong brandare just some of the areas that Genesis Energy has focused on to retain and acquire customers.
Revenue from retail sales of electricity, gas and other products totalled $1.25 billion in the year to 30June 2010 ($1.33bn in 2008/2009). Profit from the retail segment in the year was $30.6 millioncompared to $42.6 million in the previous year. Retail sales of electricity in the financial year were6,378GWh compared to 6,970GWh in the previous year. Genesis Energy had 652,000 electricity andgas customers at the end of the financial year.
Customer serviceHaving determined the need to maintain a closer relationship with customers Genesis Energyannounced in June 2009 its intention to bring its Contact Centre in-house. Since the successfultransition on 1 March 2010 Genesis Energy has begun to see the benefits of having a singleorganisation with one core culture that is delivering to the same strategic plan. This is resulting in amore efficient and dynamic company with customers at the centre.
Business improvementFrom small and more immediate to larger initiatives, Genesis Energy has identified and implementedchanges to operational processes that enhance customer experiences and reduce costs. Largerinitiatives are assessed and implemented through the Business Improvement Team utilising Lean SixSigma methodology. Business improvement opportunities in the areas of customer retention, costefficiency and customer experience continue to be worked on. These improvements are beingachieved in a manner that doesn’t compromise business stability.
Revenue protectionA continued focus on Revenue Protection activities during the 2009/10 year resulted in significantamounts of previously unidentified revenue being recovered. Activities such as ensuring customersare on the correct pricing plan, vacant sites with consumption, stopped meters and auditing high risksites contributed significantly to Genesis Energy's revenue.
Advanced MeteringThe roll out of Advanced Meters to customers continues. At the end of June 2010 Genesis Energyhad installed 59,860 Advanced Meters throughout New Zealand. In addition to the immediate benefitsof no estimated bills and no visits from meter readers, Genesis Energy continues to develop servicesusing the Advanced Metering technology. This includes having the ability to disconnect and reconnectcustomers remotely and immediately all while a customer is on the phone to the Contact Centre. Thisservice is particularly appealing to people moving house. Specialised metering data is also beingused in Genesis Energy’s reconciliation processes, providing a higher level of accuracy for theelectricity market.
New marketsWith the proposed plan for Genesis Energy to obtain Tekapo A and B hydro power stations, theCompany is in the position to acquire new customers in the South Island. Acquisition of residentialand business customers began in February 2010 with a focus on Dunedin, Queenstown andChristchurch regions. Several marketing channels, including telemarketing, door to door selling,press, radio, internet and television advertising, were adopted to help build the Genesis Energy brandand to promote the offer. The residential offer included competitive pricing (in some areas GenesisEnergy could give customers a saving of up to $350 per annum), bonus Brownie Points when joiningand fixed pricing. As at 30 June 2010 Genesis Energy had welcomed over 4,500 new residential and762 new Business South Island customers to Genesis Energy.
Since June 2009 residential gas customers have benefited from Genesis Energy’s Big Gas ThankYou. A daily discount of 50 cents off their bills and the bonus Brownie Points for customers who hadboth their gas and electricity with Genesis Energy proved extremely popular. Residential gascustomer losses reduced by 2.7% and over 3,700 new customers joined Genesis Energy during thepromotional period ending 30 December 2009.
Residential customers were also given the opportunity to reduce their energy bill through thePanasonic Heat Pump offer. Over 2,600 customers installed at least one heat pump and received acredit of up to $300 on their Genesis Energy bill.
Genesis Energy continues to reward its residential customers for what they do as well as what theyspend. Brownie Points is an effective loyalty programme and is being used to retain customers andhelp acquire new ones. As at 30 June 2010 over 30% of the residential base had enough points toredeem a reward and numerous customers had made redemptions.
Business customers attended the Big Thinking Business Series events that were held in variouslocations throughout New Zealand. In addition to having an economist speak, customers also gainedbusiness insights from guest speakers.
For Genesis Energy’s trade customers the Kustom Konnections Rewards programme was launchedin April 2010. This programme recognises the number of new connections a builder, electrician or gasfitter gives Genesis Energy and rewards them in a variety of ways including, contribution towards their
CustomersBusiness Objective
To be recognised as a leading New Zealand energy provider that customersare proud to be associated with
Page 17
Genesis Energy Annual Report 2010

gas licensing fee, access to free gas industry courses and contribution to their electrician’s practicinglicence fee.
Global Reporting Initiative
2.7 Nature of markets served
EN6 Initiatives to provide energy-efficient or renewable energy based products and services, andreductions in energy requirements as a result of these initiatives.
Click this link to the GRI table for explanation
Page 18
Genesis Energy Annual Report 2010

During the year, customer switching between retailers reached unprecedented levelsand to preserve our customer base, our focus moved to ensuring our existingcustomers are receiving the level of service that they deserve. With an increasingnumber of our customers expecting to be able to engage with us electronically,initiatives were delivered to fulfil these expectations as well as enhancing our existingservice delivery.
To fulfil these objectives, our customers can now opt to receive their invoice by email instead of bypost as well as being able to pay their bills by credit card on our website customer portal My Account.The completion of our ‘billing to actual reads’ initiative has ensured increasing volumes of accuratebills delivered to our customers removing any element of estimation on their bills.
Entering gas marketWe broadened our service offering when we entered the gas supply market in November.This enables us to offer our customers a dual fuel package of electricity and gas with theconvenience of dealing with only one company and receiving one bill for both services.
A revised version of our Terms and Conditions was released in November and incorporatedrequirements for Gas supply as well as accommodating the Electricity Commission’sguidelines for model domestic retail contracts.
Hawkes Bay marketingA team from Energy Online attended the Hawkes Bay Better Home and Living Show in Maywhich was promoting sustainable living. We were able to meet many of our Hawkes Baycustomers and discuss their energy needs and provide advice on energy efficiency.
Computer donationDuring the year, Energy Online embarked on a computer replacement programme and wewere able to donate our older, replaced computers to a number of our customers that are‘not for profit’ organisations.
Energy Online
Page 19
Genesis Energy Annual Report 2010

Genesis Energy has an outstanding group of people on its staff. Over the years the company hasdeveloped a reputation as an employer of choice through a range of internal programmes focused onleadership development, training, performance, wellness, and health and safety.
Wellness programmes are encouraged and include the use of on-site gymnasiums, fitnessprogrammes and the support of teams and individuals in long distance running and multi-sportevents. On-site occupational health nurses are available for advice, flu jabs and regular workstationassessments.
Genesis Energy holds the health and safety of our workforce as our top priority. The company’smanagement approach to health and safety is that the responsibility for operational health and safetyshould be part of the line function of the organisation.
The company’s Health and Safety division promotes accident prevention and employee wellnessthrough a range of programmes. It is also responsible for developing an organisational health andsafety strategy that supports the Genesis Energy business strategy and partners with managementand employee representatives to deliver that strategy.
Ninety nine per cent of our staff receive regular performance and career development reviews.
Genesis Energy safety and wellbeing policyGenesis Energy is committed to excellence in the management of the work environment andprocedures to provide for the safety and wellbeing of all staff.
This means:
Ensuring that all employees are working in a safe and healthy work environment;
Ensuring that all employees are adequately trained and competent to perform the tasks expectedof them in an effective and safe manner;
Ensuring all employees, visitors and contractors conform to Genesis Energy' safety and qualitymanagement programme;
Systematically identifying and appropriately managing existing and new workplace hazards;
Adhering to best practice and legislative requirements through policies and procedures; and
Continuously improving safety and wellbeing management through employee consultation andreview.
Health and Safety performanceGenesis Energy continues to empower leaders and employees to jointly take control of their safetyand wellness at work and while the results for this year are disappointing they are an improvement on2009, with the exception of Loss Time Injuries.
Perhaps this is some indication that Zero Incident Process (ZIP) Programme is beginning to changebehaviour. We will continue to strive for a zero incident workplace through People, Process,Environment and Leadership.
Ultimately, every employee of Genesis Energy has a duty of care for his/her own health and safetyand to avoid placing others at risk.
ZIP continues to be a major safety initiative within the Production business unit to create a safetyculture which enables employees to close the gap between their values, goals and actual behaviourallowing people to make the right choices about their safety and wellbeing at the right time to preventexposure to unnecessary risks causing injury.
Changing people’s behaviours long term takes courage and leadership coupled with consistent andcontinuous reinforcement of the behaviours expected in the work place that prevent events causinginjury.
The Company encourages all staff to be involved in safety briefings: 99% of employees arerepresented in formal joint management and employee committees. Every site has a safetycommittee that meets monthly and has manager and employee representation.
Performance metrics
Total Injuries 2010includingContact Centre
2010excludingContact Centre
2009excludingContact Centre
Injuries / 100 employees 20.6 (1) 21.4 (3) 29 (4)
Occupational disease / 100 employees 0 0 0
Percent lost days(lost days / days scheduled to be work)
0.02% 0.02% 0.01%
Percent absent days(Absentee days / days scheduled to be work)
3.62% 3.01% 2.40%
Contractor injuries / 100 employees 23.72 (2) 23.72 63.72
(1) Based on 1006 employees(2) Based on 150 contractors(3) Based on 511 employees
EmployeesBusiness Objective
To partner with our people for success
Page 20
(4) Based on 520 employees
Genesis Energy Annual Report 2010

The inclusion of the Contact Centre in this year’s health and safety results makes it difficult tocompare our performance with last year – particularly as the Contact Centre has only been part ofGenesis Energy for four months of the twelve month reporting period. Partly as a result of this thenormalised results of this year’s health and safety performance may appear to demonstrateimprovement i.e. 20.6 injuries / 100 employees compared to 29 in 2009, however, the de-normalisedresults tell a different story.
In 2009 there were 4 lost time injuries (LTIs) and 11 days of incapacity whereas this year we have had11 lost time injuries and 34 days of incapacity. While LTIs are a lagging indicator it is one of GenesisEnergy’s key measures of health and safety performance along with lead indicators such asattendance to safety education and preventative action clearance rate from events, near misses andaudits.
Production had 5 LTI injuries – mainly soft tissue strain type injuries resulting in 14 days of incapacity.The office environment had 6 LTI injuries – mainly slips, trips and falls resulting in 20 days ofincapacity.
Many initiatives have been undertaken in Production to reduce the incidence of soft tissue injuryhowever there is still one task that has continued to cause back injuries for the last 10 years. Clearingof coal mill rejects through shovelling by hand presents the most significant contributor to backinjuries. A solution has been engineered however it is taking some time to be implemented.
The office environment although seemingly less hazardous compared with Production produced moreLTI injuries particularly in the last quarter of the year (with the addition of the Contact Centre). Overthe past financial year two areas of change that may have contributed to these results were adecrease in attendance to tool box sessions run internally by the business units and health and safetyeducation programmes were reduced at the request of the business units. Further, Health and Safetyperformance at the Contact Centre, is not yet up to the high standard achieved by the remainder ofGenesis Energy.
As for the absence rate, the introduction of the Contact Centre has contributed significantly to theresults. If the performance figures for 2010 were to exclude the Contact Centre the absence ratewould be 3.01%. Inclusion of the Contact centre in our performance figures demonstrates an absencerate of 5.88%.
Genesis Energy remains committed to the Health and Safety of employees and contractors acrossthe organisation and will continue to focus on People, Process and Environment encouraging peopleto have safe attitudes and behaviors at work and at home.
Virtual Classroom programme at Huntly Power StationIn 2010 Genesis Energy completed its first virtual classroom programme for technical staff based atthe Huntly Power Station.
A pilot programme which sought to up-skill Genesis Energy employees via the internet began in July2008. The programme consisted of Genesis Energy candidates linking via video conferencing with anactual mechanical engineering classroom located at the Wellington Institute of Technology (Weltec) inWellington.
Over two years Genesis Energy candidates attended evening classes working along side Weltecstudents via the internet to meet the educational requirements of a National Certificate inMaintenance and Diagnostics in Mechanical Engineering Level 5.
This programme has bridged the knowledge gap between trades and engineering and has opened upopportunities for Genesis Energy tradesmen and women to study towards an engineering degree, anopportunity which had been difficult to take up during full time employment.
Foundations of LeadershipThis programme provides an early stepping stone for leadership development for emerging or newfront-line leaders, or as a refresher. It complements the flagship Leadership Development Programmewhich has been running for a few years. The programme was piloted in 2009 and due to high demandran again six months later.
The Foundations of Leadership programme is a three day programme run over two months. Thecourse is designed to support people to develop relevant behaviours from our leadership framework,ASPIRE, such as motivating and developing others, conflict management and self awareness.
Genesis Energy Employee Benefits ProgrammeThe company’s Employee Benefits Programme is a successful strategy directed at maintainingcompetitiveness in the labour market to attract and secure new employees; retaining currentemployees; and providing risk management of employee costs and productivity when faced with acrisis or ill health. The ability to attract and retain valuable employees is critical to meeting businessobjectives.
The Employee Benefits Programme is a comprehensive package that is provided to all full-time andpart-time employees. The Programme currently consists of:
Life, terminal illness and accident insurance cover;
Trauma benefit;
Income protection cover;
Surgical Plan insurance;
Annual medical with your GP; and
Will and Enduring Power of Attorney service.
A cumulative Genesis Energy retirement savings subsidy, conditional on employees contributing amatching amount is available to all employees.
The ability to provide support and lessen the financial stress for employees when faced with a crisishas been appreciated and valued by employees
Genesis Energy Annual Report 2010
Page 21

Employee VolunteeringIn 2009/10 206 employees made a real difference in the community as part of the EmployeeVolunteer Programme.
Staff spent many hours helping a number of different organisations throughout the country. Here arejust some of the places we helped out:
Collecting donations for the Asthma Society Balloon Day
Weeding and tidying the carnivore area at the Auckland Zoo
Helping Department of Conservation staff to catch and band Whio as part of their Blue DuckMonitoring programme
Providing labour to assist in the refurbishment of the Citizens Advice Bureau in Turangi
Helping Habitat for Humanity build homes for families in Auckland
Preparation of the Fishing Cats enclosure at Hamilton Zoo
Helping to paint and tidy the garden at the Kimihia Resthome and Hospital
Helping Department of Conservation plant trees at Lake Ohinewai
Providing assistance to set up the Red Cross Book Fair
Providing experts to man the activity stations for the Schoolgen Cluster Day
Helping to set up the Special Needs Christmas Party for disabled and disadvantaged children inthe Waikato
Providing assistance for the Turangi Blue Light programme
Painting over graffiti at the Turangi Community Health Centre
Collecting donations for the Victims Support Street Appeal
Everyone who has taken part in a volunteering opportunity has really enjoyed doing something for thecommunity as part of a team. The volunteering programme provides a practical way for employees tocontribute their skills and energy to local communities while also personifying company values toImagine, Respect, Support and Drive.
All employees of Genesis Energy receive one day each year to get involved in activities in thecommunity. Genesis Energy has set itself the target of 35% of staff participating in employeevolunteering. In the year to 30 June 2010 we achieved a 21.4% participation rate. If the Call Centrestaff, which only joined Genesis Energy in March 2010 are excluded, we achieved 36.2 per cent staffparticipation up from 35 per cent the previous year. The challenge for the coming year is tosuccessfully roll-out the employee volunteer programme across all staff.
Our Changing WorkforceThe number of employees at Genesis Energy nearly doubled this year with the inclusion of theContact Centre from 520 at balance of year 2009 to 961 plus 39 people on fixed term contracts (notincluded in graph). The Contact Centre staff (511 in total) are predominantly female and young,masking the trend towards an ageing workforce experienced by the electricity industry. The ContactCentre are all part of the Retail business unit, making this the largest unit of Genesis Energy takingover from Production in previous years.
Our annual total turnover this year was 8.64 compared to 8.62% for the previous year.
Genesis Energy Annual Report 2010
Page 22

55-64 3 99 3.03
65+ 2 13 15.38
Gender
Male 39 481 8.11
Female 44 480 9.17
Total 83 961 8.64
Global Reporting Initiative
LA1 Total workforce by employment type, employment contract, and region.
LA2 Total number and rate of employee turnover by age group, gender, and region.
LA3 Benefits provided to full-time employees that are not provided to part-time or temporaryemployees.
LA6 Percentage of total workforce represented in formal joint management–worker health andsafety committees that help monitor and advise on occupational health and safety programmes.
LA7 Rates of injury, occupational diseases, lost days, and absenteeism, and number ofwork-related fatalities by region.
EU16 Policies and requirements regarding health and safety of employees, contractors andsub-contractors.
Click this link to the GRI table for explanation
Genesis Energy Annual Report 2010
Page 23
Personnel leaving the organisation Number of leavers Total staff in age group Rate(%)
Age
Under 25 6 107 5.61
25-34 40 320 12.50
35-44 20 224 8.93
45-54 12 198 6.06

Sponsorships and support for community, iwi and hapu groups substantiate Genesis Energy’scommitment to developing and maintaining constructive relationships with its neighbours and thewider community.
The highlight of the year was the signing of a long term relationship agreement with the Huntly-basedWaahi Whaanui Trust and six local marae.
Genesis Energy engages with its communities and iwi in many ways – from formal meetings tosupporting a wide range of community activities and organisations. Genesis Energy is in regularcontact with customers, shareholders, regulators and people who live and work near the sites of thecompany’s projects and operations.
Annual environmental reports, regular consultation meetings and the company website keep thepublic up to date with latest developments and Genesis Energy staff meets regularly with Maori andenvironmental consultation and advisory groups.
The company is well-known for supporting a wide range of community initiatives, facilities andorganisations. This support is delivered through financial sponsorship agreements, provision ofmaterials and services, and through management support and advice.
Relationship agreement with Huntly MaraeIn May 2010 Genesis Energy signed a long term relationship agreement with the Huntly based WaahiWhaanui Trust and six local marae: Kaitumutumu Marae, Matahuru Marae, Taupiri Marae, Te KauriMarae, Te Ohaaki Marae and Waahi Paa.
The agreement was the culmination of many years of engagement and work on the part ofrepresentatives of all of the agreement signatories including a principle-based review into the impactof the Huntly Power Station on the local Marae communities.
The agreement records the parties’ intention to establish an enduring, positive and beneficialrelationship which directly addresses the effects of the Huntly Power Station on the Marae, whilerecognising the Huntly Power Station as a key strategic asset for Genesis Energy and New Zealand.
Through regular engagement and funding provided by Genesis Energy the parties seek to deliver thebroad objectives of developing a long term relationship, assisting Marae development, fosteringcultural understanding, supporting the kaitiaki role of the Marae and enhancing the environment andsupporting education and training initiatives.
Marae-based Trades Training in MastertonFollowing the successful first year of the Marae-based Trades Training scheme created by NgaKanohi Marae o Wairarapa, Genesis Energy restated its commitment to the scheme by agreeing asponsorship package of funding and services for another two years.
The retention of 90% of the trainees on the scheme in its first year was a good indicator of the qualityof the scheme’s community support, structure and management.
Nga Kanohi Marae o Wairarapa, a collective of 11 Wairarapa Marae, developed a Marae-BasedTrades Training Program targeting primarily youth between 16 and 18 that would like a career withinthe building or allied trades industries. The programme is based on NZQA Level 2 BCATS partneredwith cultural, life and employment skills.
The aim of the programme is to provide each trainee with a balance of marketable employment andmeaningful life skills coupled to a confidence to participate in Marae activities.
Students study at a former marae in Masterton that has been equipped with a workshop andclassroom. They also complete practical work and carry out maintenance at the 11 Wairarapa marae.
Schoolgen programme expandsGenesis Energy’s solar power in schools programme – Schoolgen – has now grown to include 42schools with photovoltaic panels installed. In the past year we completed the installation of solarpanels into nine schools in the Manawatu/Wanganui region.
Since the programme was launched in February 2007 Schoolgen has saved more than 34 tonnes ofCO2 from entering the atmosphere and has generated 155MWh of electricity.
In order to broaden the programme and reach more schools without necessarily installing solarpanels, a ‘sister school’ programme was developed.
More than 70 Auckland students from 15 different schools gathered at Greenhithe School inSeptember 2009 to learn about the benefits of solar energy.
Schools in the Northern Auckland ‘cluster’ were invited to attend the launch of the Schoolgen SisterSchool programme. During the day students took part in a series of activities related to solar energy.
Schoolgen is a programme that was developed by Genesis Energy in 2006 to bring solar energy tolife for New Zealand children. There are 42 schools across the North Island with a Schoolgentwo-kilowatt photovoltaic system (solar panels) installed on the roof of one of their school buildings.This allows them to generate their own electricity from the sun and to learn more about renewableenergy and climate change.
Nine schools that showed outstanding contribution and student involvement in the Schoolgenprogramme were selected as our top Schoolgen schools for 2009. Their achievements werehighlighted in the inaugural Schoolgen Yearbook for 2009 http://www.schoolgen.co.nz/ss/2009-yearbook.aspx
Community, Iwi + StakeholdersBusiness Objective
To engage meaningfully with the communities, Iwi and hapu in the areas inwhich we operate, and with other key stakeholders
Page 24
Genesis Energy Annual Report 2010

Schoolgen uses the same technology as the Australian solar schools programme to capture andcommunicate the solar electricity data from the solar panels to the Schoolgen website. This hascreated the ability for visitors on the Australian solar schools site (www.solarschools.net), to comparehow much solar electricity Australian solar schools are generating compared to New ZealandSchoolgen schools. Schoolgen schools can access this data via a link from the Schoolgen website.
Curtain BankGenesis Energy has been supporting the Huntly Curtain Bank with funding and professional supportsince 2006. In the past year more than 1000 sets of curtains were distributed throughout Huntly andHamilton. These curtains went into some 310 homes
This year the Company has reconfirmed its support for the Huntly Curtain Bank for a further threeyears and in July 2010 reaffirmed its commitment to communities and healthy homes by supportingthe establishment of a second Curtain Bank. The Wellington Curtain Bank has been established inWellington by the Sustainability Trust.
Sir Edmund Hillary Outdoor Pursuits Centre SponsorshipOPC offers outdoor education to children and adults throughout New Zealand from its sites atTongariro and Great Barrier Island. Based alongside the Tongariro Power Scheme, the Tongariro sitehas long been supported by Genesis Energy.
New Genesis Energy Scholarships are now being offered to low decile schools in parts of NewZealand where Genesis Energy has a presence. These scholarships enable students to attend theGenesis Energy Secondary School Hillary Challenge, which is a fiercely contested five days ofadventure racing held annually at the Sir Edmund Hillary Outdoor Pursuits Centre, near Turangi.
Lake to Lighthouse ChallengeGenesis Energy was proud to be the official sponsor of then second Genesis Energy Lake toLighthouse Challenge, one of New Zealand’s newest multi-sport events. The event circumnavigatesthe spectacular Lake Waikaremoana before heading to the coastal town of Wairoa. It was held overtwo days in November 2009 and was very successful attracting more than 250 competitors.
Global Reporting Initiative
SO1 Nature, scope and effectiveness of any programmes and practices that assess and managethe impacts of operations on communities, including entering, operating, and exiting
Click this link to the GRI table for explanation
Page 25
Genesis Energy Annual Report 2010

Genesis Energy’ many diverse stakeholders are key to the successful generation anddelivery of energy to homes and, businesses and industry throughout New Zealand. Itis crucial that we engage with our stakeholders in an effective dialogue and developrelationships built on mutual respect and a desire to find balanced outcomes.
We seek to be open and transparent with our stakeholders and acknowledge that in some instancesthe impact of our operations cannot be mitigated. We identify our stakeholders as any group whichhas an interest or concern relating to Genesis Energy. We operate an open door policy at GenesisEnergy and do not seek to exclude any stakeholder groups from our engagement processes.
Genesis Energy has a range of formal and informal stakeholder relationships that enable thecompany to identify and assess stakeholder needs and concerns. Stakeholder groups and their keyconcerns and interests are illustrated in the diagram below. Further details on how we respond tostakeholder interests and concerns and the mechanisms we use to engage with them are set outbelow.
Our Business’ Key Stakeholder Relationships
Stakeholder Group Stakeholderconcerns andexpectations
How we engage How we respond tostakeholder concerns
Shareholders Return on investmentand shareholdervalue
Investment decisionsand other decisionsthat may impact onshareholder value
Timely and accurateinformation Ethicalbehaviour
Briefings with Ministers andofficials.
Conduct analyst briefings
Hold Annual meeting
Prepare accurate, timely andinformative Half Year and AnnualReports.
Release disclosure statements asrequired
Business strategy with acommitment to increaseperformance of thebusiness
Business strategy with acommitment to reducecarbon intensity ofbusiness.
Implementation of abusiness model focussedon driving performanceacross the entirebusiness.
Commitment to followinggovernment guidelines ondisconnection andvulnerable customers.
Produced clear andcomprehensive QuarterlyReports to shareholders,and public Half Year andAnnual Reports.
Released relevantcontinuous disclosurereports to theShareholders as required.
Held an Annual meeting
Customers Cost and access toenergy
Reliable supply
Customer service
Climate change andenergy efficiency
Company reputation
Surveys.
Customer newsletter.
Develop retail processes thatsupport a positive customerexperience
Develop innovative productofferings
Continuous improvementof customer service.
Customer contact centrebrought “in-house” on 1March 2010 to facilitateimprovements incustomer service.
Committed to followingElectricity Commission’sdisconnection guidelines.
Deployment of advancedmeters
Tools, advice and productoffers for energyefficiency and carbonfootprint reduction.
Held an Annual meeting
GenerationCommunities
Impact of powergeneration oncommunities
Local environmentalfootprint
Compliance with thelaw and resourceconsent requirements
Local employmentand local economicimpact
Support for the needsof the localcommunity
Honest and openengagement
Consult communities on issues ina timely manner
Community meetings on topics ofinterest.
Newsletters and reporting
Comply with resource consents
Be cognisant of the impacts of ouroperations and ensure thecommunity understand theseimpacts and the actions weundertake to minimise andmitigate them.
Foster relationships with localcommunities
Involve the community in keymilestones
Invest in the communities in whichwe operate via local sponsorshipsand other support.
Provided communityupdates on the activitieson generation sites vianewsletters and meetings
Held an Annual meeting
Consulted in an open andtransparent manner onour projects
Targeting 100 per centresource consentcompliance.
EnvironmentalManagement Systems.
Implementation of asustainable businessmodel.
Policy of hiring locally.Celebration in Tuai tomark the 80th year of the
Station.
Page 26
Genesis Energy Annual Report 2010

Continued to supportactivities in thecommunities in which weoperate
GovernmentStakeholders
Investment decisionsand other decisionsthat may impact ongovernment
Ethical behaviour
Contribution to NewZealand’s carbonfootprint
Open and detailed engagementand contribution on policy issuesrelating to our business.
Policy submissions.
Participation in working groups,conferences and meetings.
Business strategy with acommitment to increaseperformance of thebusiness
Business strategy with acommitment to reducecarbon intensity ofbusiness.
Implementation of asustainable businessmodel to driveperformance.
Policy submissions.
Commitment to followinggovernment guidelines ondisconnection andvulnerable customers.
Produced clear andcomprehensive Half Yearand Annual Reports.
Held an Annual meeting
Non-governmentalorganisations
Climate change
Impact on localcommunities
Cost and access toenergy
Meetings on topics of interest.
Partnerships and funding forcommunity projects.
Membership of organisation
Business strategy with acommitment to reducecarbon intensity ofbusiness.
Resource consentagreements.
Implementation of asustainable businessmodel.
Held an Annual meeting
Tangata Whenua Tangata whenua arekaitiaki of resourceswithin their rohe
Ongoing impact anddegradation ontangata whenuacultural and spiritualvalues
Local environmentalfootprint
Desire to understandextent of Genesis
Energy activities
Regular formal and informalmeetings.
Acknowledge that tangatawhenua have concernsabout how the powerschemes weredeveloped.
Acknowledge thatongoing activities impacton tangata whenuavalues.
Third-party agreements.
Respect role of tangatawhenua as kaitiaki of thenatural resources andtaonga within their rohe.
Policy of hiring locally.
Employees Interesting andrewarding work
Work/life balance
Competitive rates ofpay
Benefits
Provision of a safeworking environment
Security ofemployment
Working for aresponsible employer
Attract, recruit and retain the rightperson – job fit and organisationalfit
Regular meetings/briefings.
Surveys.
Staff newsletter.
Intranet.
Competitive salaries andstaff benefits.
Continued to implementLeadership DevelopmentProgrammes
Continued to implementemployee developmentinitiatives
Continuous improvementof Wellness programme.
Rewards and Recognitionprogramme
Flexible ways of working
Commitment to health,safety and disabilitymanagement.
Implementation of asustainable businessmodel.
Electricity Sector Huntly’s future role inthe market
Working together onmutual interestsrelated to planningand regulation
Submissions on electricity sectorpolicy.
Participation in utility forums.
Policy submissions.
Participation in workinggroups, conferences andforums of mutual interest.
Suppliers andContractors
Requirements ofGenesis Energyclearlycommunicated
Genesis Energyfuture demand forservices and goods
Contractual arrangements.
Procurement policy.
Sustainable procurementpolicy.
Page 27
Genesis Energy Annual Report 2010

Global Reporting Initiative
4.14 List of stakeholder groups engaged by the organisation4.15 Identification and selection of stakeholders4.16 Approaches to stakeholder engagement4.17 Key topics and concerns from stakeholder engagement
Click this link to the GRI table for explanation
Civil Society Climate changeSecurity of supply
Cost and access toenergy
Impact on localcommunities
Management anduse of naturalresources
Electricity marketeffectiveness
Media releases.
Public meetings.
Annual meeting
Direct mail communications.
Advertising.
Business strategy with acommitment to reducecarbon intensity ofbusiness.
Implementation of asustainable businessmodel.
Held an Annual meeting
Future Generations Our use of resources
Climate change
n/a Long-term businessstrategy response toclimate change.
Implementation of asustainable businessmodel
Page 28
Genesis Energy Annual Report 2010

The two key highlights of Genesis Energy's environmental impact during the financial year weremeeting the long term carbon intensity target and reporting nil significant resource consentcompliance breaches.
The company has a target to reduce the carbon intensity from its generation portfolio by 30% below2006 levels by 2015 i.e to 484 tCO2/GWh or less. This year we have achieved our target with a 33%decrease in carbon intensity compared to 2006 levels. This was due to lower thermal generationvolumes and increased use of gas in generation. The challenge is to sustain this position for the longterm.
Approach to managing our impactGenesis Energy understands its business has an impact on the environment and communities and, inorder to reduce this impact it :
Identifies those with responsibility for environmental management;
Identifies and documents all environmental effects associated with our activities;
Identifies environmental objectives and develops associated work programmes to address ourenvironmental and social effects;
Regularly reviews how well we are implementing our environmental values and meeting ourobjectives; and
Reports publicly on our environmental performance.
Greenhouse Gas EmissionsGenesis Energy has a target to measure and accurately report on Genesis Energy’s greenhouse gasemissions across all areas of the business. This year we have reconsidered the way we voluntarilyreport our greenhouse gas emissions. In previous years we have reported solely on the basis ofgeneration versus non-generation emissions.
We are now reporting a Greenhouse Gas Inventory in alignment with the World Business Council forSustainable Development Greenhouse Gas Protocol (GHG Protocol). This addition to our reportingwas also a key recommendation of the assurance process for our 2009 Annual Report.
Although we are now reporting in alignment with the GHG Protocol, as a thermal electricity generator,we believe it is important to continue to report on our thermal generation emissions in more detail asthey are the majority of our greenhouse gas emissions.
The Company’s total generation emissions for the 2010 year were 3,529 kilotonnes of CO2.
Our approach to reducing our emissions is to focus on our carbon intensity and we have a target toreduce the carbon intensity of Genesis Energy’s generation portfolio by 30% below 2006 levels by2015 i.e to 484 tCO2/GWh or less.
This year we have achieved our target with a carbon intensity of 463 tCO2/GWh - a 33% decrease incarbon intensity compared to 2006 levels. The challenge is to sustain this position for the long term.
For more detail on Genesis Energy’s Greenhouse Gas Emissions please click here.
Internal Environmental FootprintGenesis Energy has been working to measure, report and reduce the environmental impact of its dayto day activities since the company’s inception. Our approach to managing our impact is to ensurethat all of our employees are aware of their responsibility to minimise their impact and to support andencourage them to do so wherever possible.
This year yielded some notable improvements to our internal footprint largely around accuratelyreporting and monitoring our environmental impacts and waste reduction.
We:
Upgraded our bespoke greenhouse gas calculator to report our greenhouse gas emissions inaccordance with the World Business Council for Sustainable Development Greenhouse GasProtocol;
Included Energy Online, a new office in Christchurch, and our customer Contact Centre into ourperformance metrics;
Established baseline auditing of waste at the Contact Centre and at Huntly Power Station; and
Significantly improved waste reduction practices at Huntly Power Station.
Our total non-generation footprint for the year was 965.2 tonnes of Carbon Dioxide equivalent(tCO2e) and 1.3 tCO2e per Full Time Equivalent (FTE) staff member.
We have purchased 970 carbon credits from Permanent Forests International Ltd to offset all of ournon-generation emissions for the year 2009/2010. The carbon credits have been retired on the MarkitEnvironmental Registry by Permanent Forests International on behalf of Genesis Energy.
For more detail on Genesis Energy’s Internal Environmental Footprint including the following pleaseclick here.
Non-Generation Carbon Footprint;
Electricity use;
Travel;
Environmental + Social ImpactBusiness Objective
To manage responsibly Genesis Energy’s environmental and social impactwhile growing our business
Page 29
Genesis Energy Annual Report 2010

Waste minimisation; and
Sustainable procurement.
Compliance with resource consentsIn the past financial year there have been no significant spills or non-compliance events at GenesisEnergy generation sites. There were a number of low level or technical breaches with no adverseeffects on the environment and corrective actions were put in place to address these. Whereappropriate, consent variations have been or are being sought to resolve areas of technicalnon-compliance. Genesis Energy’s resource consent compliance has been independently audited byspecialist auditors and regulating authorities.
Genesis Energy also meets regularly with stakeholders of the Huntly, Tongariro and WaikaremoanaPower Schemes to inform communities on operational and environmental performance and to receivefeedback. One complaint was received at each of the TPS and WPS through the year. Neither ofthese complaints were the result of Genesis Energy activities or non-compliance. A complaint wasalso received regarding Huntly Power Station’s overland coal conveyor noise and remedial action wassubsequently taken.
Tuna fisheries managementGenesis Energy has been involved in supporting several tuna (native eel) management programmesin areas adjacent to the Company’s assets.The Waikato River – Lake Okowhao Eel Habitat Enhancement Project is a collaborative venturebetween Waikato-Tainui Te Kauhanganui Incorporated (Iwi Authority of Waikato Tainui), HukanuiAmuri Paa (Mana Whenua), Waahi Whaanui Trust (Marae Representative Trust) and GenesisEnergy.The project aims to enhance habitat for eels within Rahui Pokeka (Huntly), restore eel passage to andfrom Lake Okowhao and the Waikato River, and in so doing, re-create opportunities for customaryand traditional use of tuna, and enhance habitat for other indigenous flora and fauna. The projectlaunch and site blessing was held on 18 December 2009 and preliminary vegetation clearanceactivities were carried out 18 March 2010.
On 30 April and 1 May 2010 the Waikato-Tainui Claims and Environment Unit and Genesis Energyjointly hosted an Eel Monitoring Workshop for Waikato-Tainui tribal members in Huntly. The workshophad a mix of korero from Waahi Pa traditional eelers, presentations from NIWA on eel biology and eelfisheries issues, electric fishing demonstrations and monitoring.
The highlight for many was the release of an 11kg longfin female eel back into the Waikato River. Formany of the Kaumatua it has been a long time since they had seen an eel of that size in the rohe. Thelong term goal of holding such workshops is to empower the community to be actively involved in themanagement of eel populations.
A Tuna Wananga was also held at Hiruharama Marae, Jerusalem, in the middle reaches of theWhanganui River, during April 2010. It was hosted by Ngati Hau; run by NIWA Te Wai Maori Unit andFisheries staff; and funded by Genesis Energy. The Wananga was attended by some 30 peoplerepresenting four local Hapu. Attendees gained a contemporary understanding of many aspects ofTuna biology and management.
Genesis Energy has contracted the Lake Waikaremoana Hapu Restoration Trust to beginimplementing a Tuna Fisheries Management Plan for the Waikaremoana/Wairoa Catchment. The firstyear has involved baseline monitoring and skill development for the trap and transfer of migrant tuna(both elvers and mature adults) around power scheme structures.
Waahi Stream Restoration ProjectElectricity generation at Huntly Power Station results in cooling water discharge which has an impacton the Waikato River. Ecology mitigation projects to offset these impacts are required under ourresource consents.
During the year a project commenced to complete outstanding fisheries mitigation obligationsrequired by a resource consent condition. Waahi Stream was chosen due to its close proximity toHuntly Power Station and its importance to local Marae.
Enhancement of the stream and Lake Waahi margins will also support the fishery and improveconnectivity with the Waikato River. This project involved fencing and planting along 3km (1.5km eachside) of Waahi Stream.
This project is highly dependant on strong partnerships with the adjacent land owners which includesWaahi Paa Marae, private landowners, and Te Wharekura o Rakaumangamanga. Other partiesactively involved in the project include Environment Waikato and Department of Conservation.
Moawhango Willow ControlWhile willow infestation on the Moawhango River is not caused by Genesis Energy activities, thereduced flow due to diversion of water for the Tongariro Power Scheme has increased willow impactson the river. Genesis Energy must undertake 200 metres of willow control per year as a resourceconsent condition. The control programme has been so successful however, that over 7.0 km hasbeen controlled in the first five years. What has now become a multi-stakeholder catchment-wide,willow management programme, will progressively remove all willows from the Moawhangocatchment, upstream of Pungatawa Bridge, over the next few years.
Annual Environmental Reports
The Tongariro Power Scheme and Waikaremoana Power Scheme have produced Annual EnvironmentalReports. These reports bridge the gap between site-specific environmental performance reporting and thisAnnual Report. They contain detailed information on resource consent compliance, monitoring and researchprogrammes, community and environmental initiatives. Please use this link to access the current annualenvironmental reports.
Genesis Energy Annual Report 2010
Page 30

Genesis Energy uses these same rivers to generate renewable energy and, as such, has aresponsibility to look after these national treasures. The company has a proud history of involvementwith an increasing number of successful Whio conservation programmes through a range of resourceconsent conditions, mitigation packages and sponsorship agreements.
As part of the company’s marketing campaigns, and together with the Central North Island Blue DuckConservation Charitable Trust, DOC and Forest & Bird, Genesis Energy made March 2010 theinaugural Whio Awareness Month. The month culminated in a Whio Family Day at the TongariroNational Trout Centre on 20 March, where over 500 people attended to enjoy fun activities and learnabout Whio.
Fishability studyThe operation of the Waikaremoana Power Scheme can influence the seasonal levels of LakeWaikaremoana, which in turn can affect angling opportunity for shore based anglers who targetcruising brown trout as they feed in the shallow lake margins. As part of its resource consentrequirements, Genesis Energy has completed a Fishability Study of Lake Waikaremoana to determinehow access for shore based angling opportunities changes with varying lake level. The results havebeen mapped and, when viewed in association with water levels from the Genesis Energy Hydrologywebsite, provide a useful guide for anglers as to how much shore-based fishing is available at a givenlake level, and where to access this opportunity.
Lake Waikaremoana Shoreline Hazard Management GuidelinesThe size and nature of the Lake Waikaremoana catchment can often mean the lake’s shoreline isaffected by high lake levels after heavy rain Camping, tramping, conservation activities andinfrastructure placement can be affected by these high lake levels. A draft ‘Shoreline HazardManagement Report’ for Lake Waikaremoana was completed during the reporting period. This Reportpresents practical information guiding the management of risk to activities and assets around theshore of the lake including methods for avoiding and/or mitigating these risks
Global Reporting Initiative
EN13 Habitats protected or restored
EN23 Total number and volume of significant spills
EN28 Monetary value of significant fines and total number of non-monetary sanctions fornon-compliance with environmental laws and regulations
Click this link to the GRI table for explanation
Genesis Energy Annual Report 2010
Page 31
Whio (Blue Duck) Awareness MonthWhio are an iconic river species on New Zealand’s fast flowing, high quality mountain streams.

This year we have achieved our target to reduce the carbon intensity of our generationbusiness. Our challenge is to sustain this reduction.
Genesis Energy has a target to measure and accurately report on Genesis Energy’s greenhouse gasemissions across all areas of the business. This year we have reconsidered the way we voluntarilyreport our greenhouse gas emissions. We are now reporting a Greenhouse Gas Inventory inalignment with the World Business Council for Sustainable Development Greenhouse Gas Protocol(GHG Protocol).
Greenhouse Gas Inventory
Greenhouse Gas Emissions Scope 1 (tCO2e) 2009 2010
Generation (1) 4,236,000 3,529,287
SF6 85 1
Petrol (fleet fuel use) 259 184
Diesel (fleet fuel use) 97 78
LPG 0.1 0
Total Scope 1 4,236,441 3,529,550
Greenhouse Gas emissions Scope 2 (tCO2e)
Purchased electricity - auxiliary 356 243
Purchased electricity – non-generation sites 277 459
Total Scope 2 633 700
Greenhouse Gas emissions Scope 3 (tCO2e)
Air travel 345 211
Rental Cars and mileage 14 35
Total Scope 3 359 246
Total Scope 1, 2 and 3 (2) 4,237,433 3,530,497
(1) Our thermal assets also emit small amounts of methane (CH4) and nitrous oxide (N20). Theseemissions are not included in our emissions profile.(2) Scope 1: All direct GHG emissions i.e. burning of fossil fuels in our generation facilities and fuelcombustion in our vehicle fleetScope 2: Indirect GHG emissions from consumption of purchased electricity.Scope 3: Other indirect emissions i.e. transport-related activities in vehicles not owned or controlledby Genesis Energy. We cannot currently track taxi usage accurately.(3) Note that all of the emissions in this inventory are on an operational control basis.
In previous years we have reported solely on the basis of generation versus non-generationemissions. Reporting in alignment with the GHG Protocol is in accordance with best practice in NewZealand and globally. This addition to our reporting was also a key recommendation of the assuranceprocess for our 2009 Annual Report.
We have also been able to present our 2009 emissions in accordance with the WBCSD. As theGreenhouse Gas Inventory shows, we produced significantly fewer Scope 1 emissions from ourelectricity production this year compared to last year. Our Scope 3 emissions have also decreasedfrom 2009 largely due to a greater use of video conferencing facilities. The bringing in-house of theContact Centre has resulted in an increase in our Scope 2 emissions as we have two additionalbuilding to purchase electricity for. Further discussion on these trends is contained in the InternalEnvironmental Footprint section.
Genesis Energy offsets emissions due to the operation of our vehicles and purchased electricity fornon-generation activities (scopes 1 + 2), plus air travel, and car hire (scope 3) i.e any non-generationemissions that we have not reduced. This year we purchased 970 carbon credits from PermanentForests International Ltd. The carbon credits have been retired on the Markit Environmental Registryby Permanent Forests International on behalf of Genesis Energy.
Although we are now reporting in alignment with the GHG Protocol, as a thermal electricity generator,we believe it is important to continue to report on our thermal generation emissions in more detail asthey are the majority of our greenhouse gas emissions.
The Company’s total generation emissions for the 2010 year were 3,529 kilotonnes of C02. The C02is calculated by multiplying the fuel burn (PJ) by the relevant emission factor for each fuel (ktC02/PJ).Emissions factors are sourced from Energy Greenhouse Gas Emissions 1990-2008 published by theMinistry for Economic Development. The emission factor for the rate of CO2 produced from electricitygeneration using coal (GJ – T) was 0.0894. The emission factor for the rate of CO2 produced fromelectricity generation using gas (GJ – T) was 0.0531.
Greenhouse Gas Emissions
Genesis Energy Annual Report 2010
Page 32
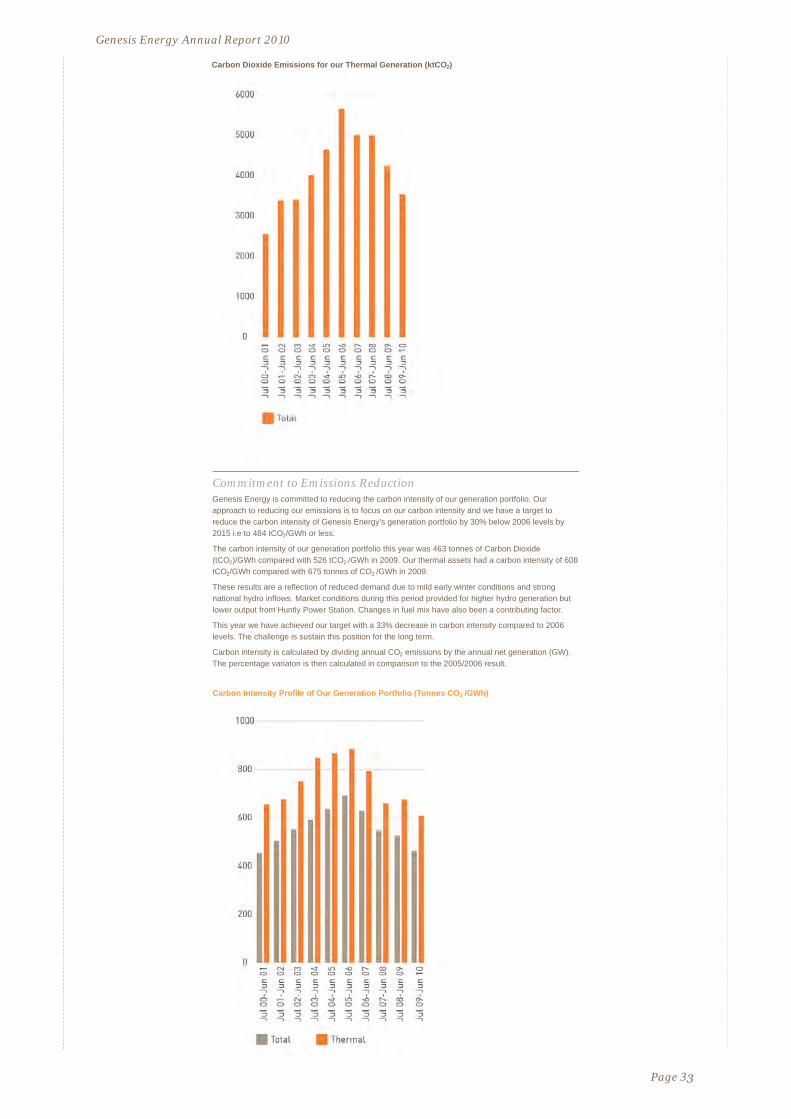
Commitment to Emissions ReductionGenesis Energy is committed to reducing the carbon intensity of our generation portfolio. Ourapproach to reducing our emissions is to focus on our carbon intensity and we have a target toreduce the carbon intensity of Genesis Energy’s generation portfolio by 30% below 2006 levels by2015 i.e to 484 tCO2/GWh or less.
The carbon intensity of our generation portfolio this year was 463 tonnes of Carbon Dioxide(tCO2)/GWh compared with 526 tCO2 /GWh in 2009. Our thermal assets had a carbon intensity of 608tCO2/GWh compared with 675 tonnes of CO2 /GWh in 2009.
These results are a reflection of reduced demand due to mild early winter conditions and strongnational hydro inflows. Market conditions during this period provided for higher hydro generation butlower output from Huntly Power Station. Changes in fuel mix have also been a contributing factor.
This year we have achieved our target with a 33% decrease in carbon intensity compared to 2006levels. The challenge is sustain this position for the long term.
Carbon intensity is calculated by dividing annual CO2 emissions by the annual net generation (GW).The percentage variaton is then calculated in comparison to the 2005/2006 result.
Carbon Intensity Profile of Our Generation Portfolio (Tonnes CO2 /GWh)
Genesis Energy Annual Report 2010
Page 33
2Carbon Dioxide Emissions for our Thermal Generation (ktCO )

Sulphur hexaflouride (SF6)Genesis Energy operates SF6 circuit breakers across the generation sites. A small amount of SF6 islost from this equipment over time. Genesis Energy is a signatory to the voluntary electricity sectorMemorandum of Understanding relating to “Management of Emissions of Sulphur Hexafluoride toAtmosphere” (“MOU”) managed by the New Zealand Climate Change Office. All signatories of theMOU, agree to maintain both a yearly leakage rate and a three year rolling average leakage ratebelow 2 per cent of total weight of SF6 held by the Participant.
For the period 1 July 2009 – 30 June 2010 Genesis Energy had a total of 0.06 kg of SF6 gas lost tothe atmosphere. This is equivalent to 1.4 tonnes of CO2e. This leakage is considered a 0.006% lossand is well within the target of 2 per cent. There has been a marked reduction in the loss of SF6 gasover this reporting period in comparison to previous years – last years leakage was equivalent to 84.8tonnes of CO2e. This can be attributed to Genesis Energy’s focus on SF6 management.
Change to the Calculation Methodology of Carbon Intensity and Total Emissions
This year for the first time we have used our bespoke greenhouse gas calculator to voluntarily report on ourgeneration emissions. Generation fuel consumption and fuel delivery data for thermal sites that is used in theGreenhouse gas calculator is sourced from the Generation Operational Data Store (GODS).
GODS is a collection of information from the PI (Plant Information system) on actual metered quantities of coaland gas. Previous year’s emissions have been manually derived from fuel consumption reconciled to financialand production values. Due to subtle differences between the actual measurements provided by PI and andderived measurements there is a very small difference in results between manual calculation and thegreenhouse gas calculator.
This methodology has been applied to the Genesis Energy emissions as of 2010. The variation in emissionsfor 2010 is <1% under the new methodology compared with the previous methodology.
Genesis Energy Annual Report 2010
Page 34

Genesis Energy has been working to measure, report and reduce the environmentalimpact of its day to day activities since the company’s inception. Our approach tomanaging our impact is to ensure that all of our employees are aware of theirresponsibility to minimise their impact and to support and encourage them to do sowherever possible.
We have two key targets that aim to improve our performance in this area:
To measure and accurately report on Genesis Energy’s greenhouse gas emissions across allareas of the business; and
To reduce the carbon intensity of Genesis Energy’s non-generation activities.
This year yielded some notable improvements to our internal footprint largely around accuratelyreporting and monitoring our environmental impacts and waste reduction.
We:
Upgraded our bespoke greenhouse gas calculator to report our greenhouse gas emissions inaccordance with the World Business Council Sustainable Development GHG protocol;
Included Energy Online, a new office in Christchurch, and our customer Contact Centre into ourperformance metrics;
Established baseline auditing of waste at the Contact Centre and at Huntly Power Station;
Significantly improved waste reduction practices at Huntly Power Station; and
Offset all of our non-generation emissions for the year 2009/2010.
Our total non-generation footprint for the year was 965 tonnes of Carbon Dioxide equivalent (tC02e)and 1.3 tC02e per Full Time Equivalent (FTE) staff member. It has been challenging this year tocompare our performance against the previous year as there have been a number of changesinlcuding a significant number of new staff with the Contact Centre coming in-house and three newoffices.
Non-Generation Carbon FootprintWhile we have included all of our Scope 1 and 2 emissions in our Greenhouse Gas Inventory webelieve it is important to identify the proportion of these emissions that come from our non-generationactivities as opposed to our generation activities so that we can effectively manage them. We alsosee our responsibility for our Scope 3 non-generation emissions as being equally as important.Overall, non-generation emissions include the direct emissions from our fleet, and the indirectemissions from rental car use and mileage, purchased electricity, and air travel.
For the second year we have measured our non-generation emissions using our greenhouse gascalculator. This year we expanded the boundary of our reporting to include air travel, purchasedelectricity, mileage and rental car use for Energy Online. We also captured emissions from ourContact Centre in Hamilton and our new office in Christchurch. All data captured in the calculator ismultiplied by associated emission factors. The emission factors used are sourced from the Ministry ofEconomic Development Guidance for Voluntary Corporate Greenhouse Gas Reporting 2008 and theWBCSD/WRI GHG Protocol Initiative Travel Emissions version 2 for air travel.
Our total non-generation footprint for the year was 965tonnes of Carbon Dioxide equivalent (tC02e) and 1.3tC02e per Full Time Equivalent (FTE) staff member.
While this may seem like an improvement comparedto our performance last year (1071 tC02e and 1.83tC02e per FTE), it is difficult to draw any conclusionsdue to the addition of our Contact Centre staffmembers and three new offices. Contact centre staffmembers are unlikely to travel compared with the restof the company and are therefore likely to haveskewed the results this year.
As with previous years we have offset thenon-generation emissions that we have not be able toreduce. This year we purchased 970 carbon creditsfrom Permanent Forests International Ltd. The carboncredits have been retired on the Markit EnvironmentalRegistry by Permanent Forests International on behalfof Genesis Energy.
Electricity UseWe have now built a comprehensive picture ofelectricity use at all of our non-generation sitesincluding our recently acquired offices in Hamilton andChristchurch. All of our non-generation sites meet theEnergy Efficiency and Conservation Authority (EECA)low typical usage benchmark of 200 – 280 kWh/sqmexcept for the Greenlane and Hamilton (London St)offices.
Internal Environmental Footprint
Page 35
Genesis Energy Annual Report 2010
Reducing carbon with hybrid cars

Electricity Consumption 2008 kWh/sqm 2009 kWh/sqm 2010 kWh/sqm
Greenlane 151 232 338
Hamilton – London St 274 472 641
Hamilton – 371 Victoria St - - 93
Hamilton – 500 Victoria St - - 85
Wellington – The Terracevacated Feb 2010
116 110 57
Wellington – Chews Lane - - 24
Christchurch - - 29
Energy Online - 240 222
Overall the electricity consumption across all our non-generation sites was 0.6 tCO2 per FTE; thesame result as the previous year. It is not possible to identify a trend from this result as there havebeen significant changes in our electricity use largely due to the addition of three new office sites anda significant increase in employees resulting from the Contact Centre coming in-house.
Recent energy audits have identified good opportunities to improve energy efficiencies at several ofthe sites. However, at the Greenlane site we have now implemented all energy efficiencyimprovements with a reasonable payback period and there are limited opportunities for furtherimprovement while we remain in our current building.
We also track the purchased electricity used by our generation sites, although it is a particularchallenge to manage this electricity use due to the capital cost constraints of improvements.
TravelEmissions attributable to travel by fleet and rental cars for 2010 were 296 tCO2e or 0.4 tCO2e perFTE. For air travel it was 212 tCO2e or 0.3 tCO2e per FTE. We have not reported in this level ofdetail in the past and will seek to identify trends in this area of performance in coming years.
The bringing in-house of the Contact Centre resulted in an increase of vehicle trips between Aucklandand Hamilton. Where possible the impact of this travel has been minimised by carpooling and byincreased use of video conference facilities. There has also been a decrease in air travel across thecompany, largely due to video conference facilities which are now utilised wherever possible and alsoa focus on overhead reductions.
Fuel Use (litres) 2009 2010
Diesel 36,296 29,032
Petrol 111,110 78,655
LPG 60 0
Waste MinimisationThis year we have been working hard to ensure all sites have a waste minimisation programme inplace. All sites now have the same bin systems and signage and five out of seven of ournon-generation sites have had an annual audit undertaken. We have improved performance at allnon-generation sites except for Greenlane where a 24% increase of waste to landfill has occurredcompared to 2009.
The Hamilton London St office has achieved the most notable improvements in performance with a58% decrease in waste sent to landfill. This has been achieved by the use of improved recyclingfacilities and signage, and a campaign lead by the office manager. The key barrier to continuedimprovement has been identified as the lack of facilities’ for organic waste recycling in Hamilton.
Huntly Power Station has also significantly improved waste reduction practices, with new recyclingfacilities being installed. The new waste service provider, Metrowaste, is providing good informationon tonnages of waste. Previous waste audits estimated tonnages based on information supplied bythe previous contractor on skip bin sizes, number of lifts and estimates of how full these bins wereeach time they were lifted.
No audits were undertaken at Tokaanu or Tuai power stations this year.
Office Waste per employee (kg per FTE)
2007 2008 2009 2010 performance
Greenlane Office 88 28 15 19 +24%
Hamilton Office – London St - 45 54 23 -58%
Hamilton Contact Centre – ASB Building - - - 21
Hamilton Contact Centre – Waitomo House - - - 31
Wellington Office - 76 25 55
Christchurch Office - - - -
Energy Online Office 40 34 -15%
Total Waste to Landfill (tonnes)
Huntly Power Station 1,976 1,756 1,463 316* -78%
Tokaanu Power Station 97.25 60.82 - -
Tuai Power Station - 429 - -
Genesis Energy Annual Report 2010
Page 36

waste to landfill from January 2010. This data is an extrapolation of 4 months worth of data. It isdifficult to draw conclusions from this data as a number of changes have occurred during that time.The most likely reasons for this result is that improved site wide recycling, including diversions of anestimated 85 tonnes per annum of river weed, is now occurring.
An ongoing success story this year for Genesis Energy has been the composting of weed at TokaanuPower Station. Some 600 cubic metres of weed is collected from the weed screen at the LakeRotoaira intake and is provided to an iwi based worm farm initiative in Turangi. Previously this weedwas a significant problem for the power station, with weed being removed to landfill at great cost toGenesis Energy and the environment.
The worm farm is a trial for the possible use of weed from Lake Taupo in a commercial worm farm tocreate nutrients that can be used within the Lake Taupo catchment as an alternative to importingnutrients into the catchment.
Genesis Energy provides a cost effective source of weed for the trial. Tokaanu Power Station hasbeen involved from the start of the trial in November 2008.
Sustainable ProcurementGenesis Energy has continued to progress the embedding of sustainability principles into purchasedecisions made within the company. While we have not been as active in this space as in previousyears we recognise this as a key area of business and sustainability leadership. We continue toimplement our Sustainable Purchasing Guidelines and have also added some tools specific tosustainable building and office fitouts to our suite of procurement practices.
Genesis Energy Annual Report 2010
Page 37
*No audit has been undertaken at Huntly this year as the new waste providers are now weighing all
Remaining weed from the TongariroRiver near the Rangipo Dam

Genesis Energy remains committed to sharing the key highlights and challenges of oureconomic, environmental and social performance through our Annual Report. Thisyear’s report has been produced in an expanded online format that moves us towardsbest practice in sustainability reporting, An accompanying print version contains asummary of the Annual Report focussing on key highlights and challenges along withthe financial statements and notes.
The reason for this reportProducing a sustainability report is a key part of the process to define what being a sustainableorganisation means to us and our stakeholders. It will help promote discussion both within thecompany and in the communities in which we operate. As such the target audience for this report isall of our stakeholders.
Identifying Material ContentThis is Genesis Energy’s fourth annual sustainability report, containing information about thecompany’s economic, environmental and social policies and performance. The previous sustainabilityreport was published in 2009. This report identifies the areas that we believe are the most importantto Genesis Energy’s sustainability.
To identify the key material issues, we first compiled information on economic, environmental,governance and social issues that were relevant to Genesis Energy’s business and stakeholders. Tothis end, we reviewed numerous sources, including:
Corporate plans, objectives and strategies;
Risk Register;
Shareholder resolutions and other feedback received through ongoing dialogue with ShareholdingMinisters;
Partners, non-governmental organisations, suppliers and other stakeholders concerns andinterests;
Media coverage;
Industry benchmarking; and
The Global Reporting Initiative (GRI), Electricity Sector Supplement.
The assessment was based upon three parameters that we used to define and determine materialityfor the purpose of sustainability reporting:
The level of concern to external stakeholders;
The impact of stakeholder concern on our ability to achieve our Business Plan; and
The degree to which Genesis Energy can control and influence the topic or issue.
We weighted the issues raised (highest weighting went to the first two criteria above) and combinedthis assessment with the presence of the issues in the GRI in order to prioritise their coverage in theAnnual Report. The topics that had the highest score for this reporting year were considered to be themost material at this time, to be included in the Annual Report.
Sustainability Reporting GuidelinesThe content of the Annual Report is guided by the Global Reporting Initiative (GRI) SustainabilityReporting Guidelines Version 3.0 (G3) and the Electricity Utility Sector Supplement (2009). The reportmeets the requirements of Application Level C+.
The GRI Guidelines provide a voluntary reporting framework used by organisations globally formeasuring, disclosing, and being held accountable to internal and external stakeholders fororganisation performance toward the goal of sustainable development.
In addition to guiding principles on report content and quality, the GRI includes a suite of performanceindicators relating to company profile, strategy, governance, stakeholder engagement andenvironmental, economic and societal performance. The indicators accompany performanceinformation in the report and in the GRI index
Use of the GRI’s Reporting PrinciplesWe have reviewed the GRI G3 Reporting Principles for Defining Report Content and Quality, withemphasis on ensuring we provide a material representation of Genesis Energy’s sustainabilityperformance. We have drawn upon the outcomes of our frequent and formal stakeholder engagementto inform materiality (as discussed previously in this section).
Reporting period, accuracy and completenessThis report is based on the performance and information for the financial year to the end of June2010. Some data on our performance for the financial year is not included in this report due to theprioritisation of information. This information is available in the Annual Environmental Reportspublished for the Tongariro and Waikaremoana Power Schemes and the Huntly Power Station and isalso covered in the extended GRI index.
There is much historical information that may meet GRI indicator requirements, however, this is notincluded in the report as it is does not the meet the GRI principle of timeliness or would be repeatinginformation found in earlier annual reports. Much of this information can be found on our website or inthe GRI Index.
Our systems for data collection and accountability continue to grow more sophisticated as we strive
About This Report
Page 38
Genesis Energy Annual Report 2010

for continuous improvement in this area. A sample of the data collected was also subject to theassurance review undertaken by Deloitte.
We have relied on our materiality self assessment described above to meet the GRI principle ofcompleteness however this has been limited as stakeholders have not been consulted on the AnnualReport content this year.
Boundary of the ReportWholly-owned subsidiaries of Genesis Energy, such as Energy Online (EOL) are included in thescope of this report. As we have control over this asset we have increased coverage of materialissues this year. From 1st March 2010 customer services previously provided by SITEL were movedin-house to a Genesis Energy Contact Centre. As Genesis Energy has control over the ContactCentre from this date, its material performance is reported on in this report.
Joint ventures and investments are not included for the purposes of sustainability reporting as theyare largely operated by external organisations and are outside of our control. Also outside of thisreport are outsourced field services contractors.
Please refer to the Financial Notes for a diagram and explanation of the Company Structure.
External AssuranceFor the second time the Annual Report has been the subject of a Limited assurance, in accordancewith the ISAE3000 assurance standard, by Deloitte. The assurance scope included application of theGRI principles and selected GRI performance indicators. The Application level of the GRI has beenthird party checked by Deloitte.
Our financial statements have again been audited by Deloitte on behalf of the Auditor-General.
As part of Deloitte’s assurance process for our 2009 report, they considered ways in which GenesisEnergy might improve its overall sustainability reporting. The key areas and Genesis Energy’sresponses to them were:
Content Materiality
Recommendation: Genesis Energy should more clearly identify those areas to which it gives highestpriority. It should also link performance measures to the materiality assesssment process.
Genesis Energy response: We have implemented a new materiality identification process linked toour business planning and performance measure setting processes. Refer to Approach toSustainability for more information.
Governance
Recommendation: Genesis Energy should ensure that the Executive Team have a consistentunderstanding of an apporach to sustainability. Also senior management should be included in theassessment of material issues during the report development stages.
Genesis Energy response: As part of the 2010/11 business strategy and plan development theExecutive defined the areas of the business where performance was essential in order to succeed inbeing a sustainable business that delivers on its financial targets. Accordingly, the company hasincorporated seven business objectives across its operations to drive perfomance. In 2010, theExecutive also reviewed the company’s existing targets with the express view to ensure a soundprocess for addressing material issues for the company.
Stakeholder Engagement
Recommendation: Genesis Energy’s stakeholder engagement process needs to be broadended,enhanced and more formalised to enable report content to be influenced to the extent recommendedby the GRI.
Genesis Energy response: Genesis Energy has not undertaken specific engagement on the AnnualReport 2010 but as part of the Business planning round for 2010/11 as identified the following as firststeps that need to be undertaken before appropriate stakeholder engagement can be determined.
1. Stakeholder Mapping Exercise - collecting information from staff and identifying gaps.
2. Stakeholder Engagement Plan - developing company-wide engagement plan includingimplementation options
Deloitte also recommended we report on our GHG emissions according to the requirements of theGHG protocol developed by the WBCSD instead of defining them as generation and non-generation.This year we have followed that advice in order to be more comparable with other GRI reporters andenergy utilities that follow best practice.
Global Reporting Initiative
2.1 Name of Reporting organisation
2.3 Operational Structure of the Organisation
3.1 Reporting period for information provided
3.2 Date of most recent previous report
3.3 Reporting cycle
3.5 Process for defining report content
3.6 Boundary of the report
3.7 State any specific limitations on the scope or boundary of the report
3.8 Basis for reporting on joint ventures, subsidiaries, leased facilities, outsourced operations, andother entities that can significantly affect comparability from period to period and/or betweenorganizations
3.13 Policy and current practice with regard to seeking external assurance for the report.
Page 39
Genesis Energy Annual Report 2010

INDEPENDENT ASSURANCE STATEMENTON THE CORPORATE RESPONSIBILITY REPORT - 2010
INDEPENDENT ASSURANCE STATEMENT
To the Directors of Genesis Power Limited
We have been engaged by the directors to conduct a limited assurance engagement relating to the ‘Sustainability Content for Genesis Power Limited’s ‘Annual Report’ (the Content) for the financial year ending 30 June 2010 as described below:
Global Reporting Initiative Sustainability Reporting Guidelines (GRI G3) ‘application level’ –reviewing whether the Content meets the requirements of the ‘C+’ application level as stated inthe GRI G3 for Sustainability Reporting;
GRI G3 ‘principles for defining report content’- reviewing Genesis Power Limited’s application ofthe GRI ‘principles for defining report content’;
GRI G3 selected ‘performance indicators’ – reviewing whether the information reported as part ofthe sustainability reporting indicators on pages 119-120 (presented in the table ‘The following 10 GRIPerformance indicators form part of the ‘C+’ GRI application level’) has been correctly extractedfrom the underlying systems of the Company;
This report is provided solely to the directors of Genesis Power Limited in accordance with our letterof engagement dated 1 July 2010. Our work has been undertaken so that we might state to thedirectors of Genesis Power Limited those matters we are required to state to them in this report andfor no other purpose. To the fullest extent permitted by law, we do not accept or assume duty,responsibility or liability to anyone other than Genesis Power Limited for our work, for thisindependent assurance statement, or for the conclusions we have formed including, without limitation,liability for negligence.
Directors’ ResponsibilityThe directors are responsible for:
The preparation and compilation of the Content and for the information and statements containedwithin it in accordance with GRI G3;
Determining the objectives in respect of sustainability performance and for establishing andmaintaining appropriate performance management and internal control systems from which thereported information is derived based on the GRI G3.
Our ResponsibilityIt is our responsibility to independently express a conclusion on the reliability of management’sassertions on selected subject matters as outlined above.
Basis of Opinion
The evaluation criteria used for our assurance on GRI G3 ‘C+’ application level and GRI G3‘principles for defining report content’ are based on the publicly available GRI G3.
We conducted our limited assurance engagement in accordance with International Standard onAssurance Engagements (New Zealand) 3000: Assurance Engagements Other than Audits orReviews of Historical Financial Information (‘ISAE (NZ) 3000’). To achieve limited assurance the ISAE(NZ) 3000 requires that we review the processes, systems and competencies used to compile theinformation on which we provide limited assurance. It does not include detailed testing of source dataor the operating effectiveness of processes and internal controls. A limited assurance engagement issubstantially less in scope than a reasonable assurance engagement conducted in accordance withISAE(NZ) 3000 and consequently does not enable us to obtain assurance that we would becomeaware of all significant matters that might be identified in a reasonable assurance engagement.Accordingly, we will not express an opinion providing reasonable assurance.
Considering the risk of material error, we planned and performed the work to obtain all the informationand explanations considered necessary to provide sufficient evidence to support our assuranceconclusions.
Our procedures consisted primarily of the following:
Understanding and analysing the process for preparing the content including:
Assessing the Content against the requirements GRI G3 ‘C+’ application level.
Interviewing the senior executives and group level sustainability team responsible for preparingthe Content;
Analysing the process of compiling and validating information received from data owners forinclusion in the Content;
Reviewing the Contents against the findings of our work and, as necessary, providingrecommendations for improvement.
Other than in our capacity as auditors of the statutory financial statements on behalf of the Auditor-General, we have no relationship with or interests in the Company or any of its subsidiaries.Furthermore, principals and employees of our firm deal with the Company on arm’s-length terms
Independent Assurance Statement
Page 40
Genesis Energy Annual Report 2010

limited assurancerm’s-length transactions, we have no relationship with
ries.
ll material respects:
ted has not met the requirements of the ‘C+’ application level asility Reporting;
lied the GRI G3 ‘principles for defining report content’ in
rmance indicators on pages 119-120 (presented in the table ‘Therm part of the ‘C+’ GRI application level’) has not been
rlying systems of the Company;
ountants
Note:This Assurance Statement relates to the Global Reporting Initiative G3 (GRI G3) content within the Annual Report 2010 ofGenesis Power Limited for the 12 months ended 30 June 2010 included on Genesis Power Limited’s website. GenesisPower Limited is responsible for the maintenance and integrity of the Genesis Power Limited website. We have not beenengaged to report on the integrity of the Genesis Power Limited website. We accept no responsibility for any changes thatmay have occurred to the Annual Report 2010 since it was initially presented on the website.
The Assurance Statement refers only to the Global Reporting Initiatives G3 (GRI G3) content within the Annual Reportnamed above. It does not provide an opinion on any other information which may have been hyperlinked to/from thisAnnual Report. If readers of this report are concerned with the inherent risks arising from electronic data communicationsthey should refer to the published hard copy of the reviewed Annual Report and related Assurance Statement dated 8 October 2010 to confirm the information included in the Annual Report presented on this website.
Legislation in New Zealand governing the preparation and dissemination of Annual Reports that report on sustainabilityperformance may differ from legislation in other jurisdictions.
Page 41
Genesis Energy Annual Report 2010
8 October 2010 and our conclusion is
Chartered Acc
Auckland New Zealand
within the ordinary course of the Company’s trading activities. Other than this engagement, the financial statutory audit and aor interests in the Company, or any of its subsidia
Conclusion
Based on the procedures performed, in a
GRI G3 ‘application level’– nothing has come to our attention to suggest that the Contentprepared by Genesis Power Limistated in the GRI G3 for Sustainab
GRI G3 – ‘principles for defining report content’ – nothing has come to our attention to suggestthat Genesis Power Limited has not appthe Content;
GRI G3 selected performance indicators - nothing has come to our attention to suggest that theinformation reported under perfofollowing 10 GRI Performance indicators focorrectly extracted from the unde
Our limited assurance engagement was completed on expressed as at that date.

The content of the on-line version of the Annual Report was guided by the Global Reporting Initiative(GRI) Sustainability Reporting Guidelines Version 3.0 (G3) and the Electricity Utility SectorSupplement (2009).
The GRI Guidelines provide a voluntary reporting framework used by organisations globally formeasuring, disclosing, and being held accountable to internal and external stakeholders fororganisation performance toward the goal of sustainable development.
We have reviewed the GRI G3 Reporting Principles for Defining Report Content and Quality, withemphasis on ensuring we provide a material representation of Genesis Energy’s sustainabilityperformance.
The GRI also includes a suite of performance indicators relating to company profile, strategy,governance, stakeholder engagement and environmental, economic and societal performance. Theindicators accompany performance information in the report and in the GRI Index.
The on-line version of the Annual Report meets the requirements of Application Level C+.
GRI Indicators for Application levelThe following 10 GRI Performance Indicators form part of the C+ GRI Application level.
Click this link to the GRI table for explanation
Complete GRI IndexThis year we have considered all of the GRI profile disclosures and performance indicators andincluded more detailed reporting against the GRI framework.
The following table outlines our level of disclosure against all of the GRI profile disclosures andperformance indicators.
Click this link to the full GRI table for explanation
Global Reporting Initiative
Page 42
Genesis Energy Annual Report 2010

Global Reporting Initiative
EU1 Installed capacity broken down by primary energy source and regulatory regime
Click this link to the GRI table for explanation.
Physical Assets
Genesis Energy's assets are currently locatedsolely in the North Island of New Zealand.
Click on the energytype below formore information
Gas
Wind
Thermal
Hydro
Page 43
Genesis Energy Annual Report 2010

Global Reporting Initiative
EU1 Installed capacity broken down by primary energy source and regulatory regime
Click this link to the GRI table for explanation.
Physical Assets
Kupe Gas and Oil FieldGenesis Energy owns 31 per cent of the oil and gas production field of Kupe, located 30km offshoreof South Taranaki. The project was commissioned in March 2010.
Click on the energytype below formore information
Gas
Wind
Thermal
Hydro
Page 44
Genesis Energy Annual Report 2010

Global Reporting Initiative
EU1 Installed capacity broken down by primary energy source and regulatory regime
Click this link to the GRI table for explanation.
Physical Assets
Hau Nui Wind FarmHarnessing the strong and consistent winds of the South Wairarapa Coast, the wind farm is aptlynamed Hau Nui, or ‘strong wind’ in Maori. Hau Nui’s 15 wind turbines provide enough power foraround 4,200 homes in the district. Its annual generation output is between 20 and 25GWh. Hau Nuihas excellent availability, recording 48 per cent capacity factor since commissioning.
YEARS COMMISSIONED: Stage 1: 1996 Stage 2: 2004
TOTAL CAPACITY: 8.65MW
Click on the energytype below formore information
Gas
Wind
Thermal
Hydro
Page 45
Genesis Energy Annual Report 2010

Global Reporting Initiative
EU1 Installed capacity broken down by primary energy source and regulatory regime
Click this link to the GRI table for explanation.
Physical Assets
Huntly Power StationWith an output of 1,448MW, Huntly is New Zealand’s largest power station. It has four separategenerating units of 250MW utilising conventional boiler and steam turbine technology. Each unit canburn coal, gas or a mixture of the two. Unit 5 is a 400MW Mitsubishi 701F combined cycle gasturbine. Unit 6 is a 48MW open cycle gas turbine. Annual generation output at Huntly is typicallybetween 5,000 and 7,000GWh.
YEARS COMMISSIONED: 1981 2004 2007
GENERATION UNITS: 4x 250MW 1x 48MW 1x 400MW
TOTAL CAPACITY: 1,448MW
FUEL: Coal and gas
Click on the energytype below formore information
Gas
Wind
Thermal
Hydro
Page 46
Genesis Energy Annual Report 2010

Global Reporting Initiative
EU1 Installed capacity broken down by primary energy source and regulatory regime
Click this link to the GRI table for explanation.
Physical Assets
Tongariro Power SchemeThe Tongariro Power Scheme gathers water from the mountains of the central volcanic plateau in theNorth Island. The water passes through three power stations before entering Lake Taupo. Thescheme has a catchment area of over 2,600 sq km and uses a series of lakes, canals, dams, andtunnels to bring water to the stations that typically generate 1,300GWh per annum.
YEARS COMMISSIONED: 1973 1983 2008
GENERATION UNITS: Tokaanu Rangipo Mangaio
4x 60MW 2x 60MW 1x 2MW
TOTAL CAPACITY: 362MW
Waikaremoana Hydro SchemeThe Waikaremoana Hydro Scheme includes the Tuai (60MW), Piripaua (42MW) and Kaitawa (36MW)hydro stations. Annual generation output is between 400 and 500GWh. The Waikaremoana storagereservoir was created by an historic landslide that closed off the valley and provided the opportunity toimplement flood control while creating the characteristics for a high-head hydro scheme.
YEARS COMMISSIONED: 1929 1943 1947/1978
GENERATION UNITS: Tuai Piripaua Kaitawa
3x 20MW 2x 21MW 2x 18MW
TOTAL CAPACITY: 138MW
Click on the energytype below formore information
Gas
Wind
Thermal
Hydro
Page 47
Genesis Energy Annual Report 2010

Genesis Energy has astrong focus oncorporate governance.
This section details ourgovernance practicesand the people whogovern and managethe Company.
Management + Governance
Page 48
Genesis Energy Annual Report 2010

The following is an overview of Genesis Energy’s main corporate governancepractices. Genesis Energy has a strong focus on corporate governance and aims tocomply with internationally recommended best corporate governance practices as theyapply in New Zealand.
ShareholdersGenesis Energy is a state-owned enterprise pursuant to the State-Owned Enterprises Act 1986 (“SOE Act”) and is wholly owned by HerMajesty the Queen in Right of New Zealand (“Crown”). The Crown’s shareholding is held by the shareholding Ministers who as at 30 June2010 were:
Hon. Bill English Minister of Finance
Hon. Simon Power Minister for State-Owned Enterprises
Shareholding Ministers appoint the Board of Directors. The Board provides shareholding Ministers with a Statement of Corporate Intent (“SCI”)on an annual basis outlining goals, objectives and business plans in respect of the relevant financial year and each of the immediatelyfollowing two financial years.
Role of the Board of DirectorsThe Board is responsible for the governance, management and proper direction and control of theactivities of Genesis Energy and its subsidiaries. Day to day management is delegated to the ChiefExecutive of the Company under a formal delegations of authority policy with specific reservations tothe Board and on-going oversight by the Board of all activities of the Company.
Generally, the principal functions of the Board are to:
confirm corporate objectives, establish policy and approve major strategies;
ensure business risks are appropriately identified and controlled;
oversee processes for financial reporting and compliance and ensure the integrity of themanagement information system;
select and review the performance of the Chief Executive and review succession planning; and
authorise the formation of any subsidiary companies and appoint directors and overseegovernance of subsidiary companies.
The Board holds two annual strategic planning workshops with management each year, and reviewsstrategic initiatives throughout the year.
While the Board acknowledges that it is responsible for the overall control framework of GenesisEnergy, it recognises that no cost effective internal control system will preclude all errors andirregularities. Written procedures, policies and guidelines, organisational structures allocatingresponsibilities, a programme of internal audit, regular reporting and the careful selection and trainingof qualified personnel all form part of the control framework, overseen by the Board.
In discharging its duties the Board requires management to submit annually, for its consideration andapproval, a business plan setting out the Company’s operation and development objectives. TheBoard also requires an annual budget, embracing the objectives of the adopted business plan, to besubmitted for approval.
The Board monitors actual financial results compared to budget and forecasts on a monthly basis, and on a quarterly basis it reviews theCompany’s performance compared to its business plan objectives.
The Board recognises the particular importance of, and the need to comply with, legislation controlling the environment and management ofnatural resources, consumer protection and safety and health of employees. For that reason, it monitors the Company’s compliance with thestatutes concerned through consideration of regular reports from management.
Board MembershipFrom the beginning of the year in review through to March 2010 the Board comprised nine non-executive, independent directors reducing toeight for the remainder of the year under review. All appointments to the Board are made by shareholding Ministers in accordance with section36 (1)(a)(i) of the Companies Act 1993 and the Company’s Constitution.
The Constitution provides that directors be appointed to the Board for a fixed term not exceeding three years. Shareholding Ministers maychoose to renew an appointment for further fixed terms of up to three years.
Shareholding Ministers appoint the Board Chair and Deputy Chair.
The names of the directors holding office during the year in review, including details of their qualifications, special responsibilities and standingcommittee memberships, are set out below:
Corporate Governance Statement
Page 49
Genesis Energy Annual Report 2010

Directors' Qualifications Term and Special Responsibilities
Rt Hon Dame Jenny Shipley
DNZMAppointed 1 November 2009Chairman of the Board from 1 November 2009Member of Audit Committee from 1 November 2009Member of Remuneration Committee from 1 November 2009Member of Ministerial Review Oversight Committee
Joanna Perry
MNZM, MA Econ (Cantab),FCA (ICAEW), FCA (NZICA)
Appointed 1 May 2007Member of Audit Committee from May 2007Chair of Audit Committee from September 2007Deputy Chair of the Board from May 2009Chair of Ministerial Review Oversight Committee
Nicki Crauford
BSc (Hons), PhD, FIPENZ,MInstD, FAICD
Appointed 1 January 2005Chair of Remuneration Committee from July 2008
Barbara Elliston
B.E. Elect (Hons)Appointed 1 May 2008Member of Audit Committee from 1 May 2010Member Ministerial Review Oversight Committee
Denis Wood
MA Econ (Hons)Appointed 1 May 2009Member of Audit Committee from 1 May 2010Member Ministerial Review Oversight Committee
Graeme Milne
B.Tech (Biotech) HonsAppointed 1 May 2009
John Dell
BCom (Hons) CAAppointed 1 May 2010Member of Remuneration Committee from 1 May 2010
Rukumoana Schaafhausen
LLBAppointed: 1 May 2010
Brian Corban
CNZM, QSO, MA (Hons),LLB, FInstD, FNZIM
Appointed 21 December 1998Term Ended 31 October 2009Establishment Board (IDG) member August 1998.Chairman of the Board from 11 May 1999Member of Audit Committee from August 1999Member of Remuneration Committee from February 2001
Sara Lunam
BA, PG Dip Regionaland Resource Planning
Appointed 15 August 2008Term Ended 31 March 2010
Annabel Cotton BMS(Accounting & Finance),ACA, CSAP
Appointed 8 June 2004Term Ended 30 April 2010Member of Audit Committee from August 2004
Ian Kusabs
MSc (Hons) BiologicalSciences
Appointed 3 June 2004Term Ended 30 April 2010Member of Remuneration Committee from July 2008
Appointment of DirectorsThe directors are appointed by shareholding Ministers through a director recruitment process managed by the Crown Ownership MonitoringUnit (“COMU”). COMU seeks the advice of the Board through liaison with the Chairman and from reports of the results of the Board’s selfreview and director evaluation process, to ascertain the particular skills and experience required by the Board.
The Board seeks to maintain a balance of skills, knowledge, experience and perspectives among directors to enable the Board to workeffectively in the best interests of the Company.
Governance PracticesThe directors support the principles set out in the Code of Practice for Directors issued by the Institute of Directors in New Zealand and theSecurities Commission’s Principles of Corporate Governance. While recognising that the Code and the Principles are guidelines which do notpurport to determine the detailed course of conduct by directors on any particular matter, the directors support the need for the higheststandards of governance, behaviour and accountability and report on the matters set out in the Code and Principles in this statement:
Board MeetingsThe Board schedules 11 meetings of directors each year at which directors receive written monthly and information monitoring reports andreports on matters requiring directors’ approval from the Chief Executive and senior management. The Board calls additional meetings ofdirectors as required. Each year the Board aims to hold a number of meetings of directors away from the corporate office, combining the Boardmeeting with an opportunity for directors to meet and engage with stakeholders, iwi, hapu and business partners of the Company.
Board CommitteesThe Board may constitute standing committees that focus on specific areas of the Board’s responsibility. The Board also reserves the right toconstitute temporary non-standing committees to consider or monitor proposed business. The Board uses committees where this enhances itseffectiveness while retaining Board responsibility.
The current standing committees comprise the Audit Committee and the Remuneration Committee. Following each committee meeting thecommittee is required to report back on its proceedings to the next meeting of the full Board. In the year under review, the Board constituted atemporary non-standing committee to oversee a significant acquisition proposal.
Audit CommitteeThe Audit Committee has power of recommendation to the Board and is scheduled to meet no less than four times a year, with additionalmeetings being convened when required.
The principal purpose of the Audit Committee is to assist the Board in the proper and efficient discharge of its responsibilities to exercise duecare and skill in relation to:
Integrity of external financial reporting;
Page 50
Genesis Energy Annual Report 2010

Financial management;
Internal control systems;
Accounting policy and practice;
Risk management framework and monitoring compliance with that framework; and
Compliance with applicable laws, regulations and standards.
The Chair of the Audit Committee is a chartered accountant and is not the Chairman of the Board.
The Board has established full terms of reference for the Audit Committee which are reviewed annually.
Remuneration CommitteeThe Remuneration Committee has power to recommend to the Board and is scheduled to meet no less than twice a year, with additionalmeetings being convened when required.
The principal purpose of the Remuneration Committee is to assist the Board in the discharge of its responsibilities relative to the setting andreview of the terms of employment and remuneration of the Company’s Chief Executive, the review of the terms of employment andremuneration of direct reports to the Chief Executive and the setting and reviewing of policy in relation to directors’ fees and expenses.
The Board has established full terms of reference for the Remuneration Committee which are reviewed annually.
Additional CommitteeIn the year under review, directors Dame Jenny Shipley, Joanna Perry, Barbara Elliston and Denis Wood were appointed by the Board to theMinisterial Review Oversight Committee to provide oversight of the proposed acquisition of Tekapo A and B Power Stations and othertransactions as contemplated in the Electricity Industry Bill which was introduced into the House of Representatives in December 2009following the Ministerial Review into the Performance of the Electricity Industry. The Committee was established in February 2010 and isexpected to remain constituted until 31 October 2010. The Committee is chaired by Joanna Perry.
Attendance at MeetingsIn the year ended 30 June 2010 there were 13 Board meetings including two teleconference meetings, seven Audit Committee meetings andsix Remuneration Committee meetings. Attendance at Board and Committee meetings was as follows:
Directors Board Attendance(scheduled and additional) Audit Committee Remuneration Committee Board Oversight Committee
Rt Hon Dame Jenny Shipley(from 1 November 2009)
8 5 4 6
Joanna Perry 12 7 8
Nicki Crauford 12 6
Barbara Elliston 13 1 8
Denis Wood 13 7 8
Graeme Milne 13
John Dell(from May 2010)
2
Rukumoana Schaafhausen(from May 2010)
2 2
Brian Corban(to October 2009)
5 2
Sara Lunam(to March 2009)
9 3
Annabel Cotton(to April 2009)
9 6
Ian Kusabs(to April 2009)
10 3
All directors attended two joint Board and senior management strategic planning workshops in February 2010.
Risk ManagementThe Board requires the Company to operate rigorous processes for risk management and internal control. Genesis Energy has developed acomprehensive, enterprise-wide risk management framework which is reviewed by the Board on an annual basis.
The Company's management actively participates in the identification, assessment and monitoring of new and existing risks. Particularattention is given to the market risks that could impact on Genesis Energy. All trading activities are consistent with the requirements andprocedures stipulated in the Company's Market Risk Policy and credit risks arising in the retail business are managed through the Credit RiskPolicy. Both of these policies are approved by the Board and are subject to regular oversight by a committee of senior executives.
Management undertakes regular reporting to apprise the Audit Committee and the Board of the Company's key risks and the treatment ofthose risks.
AuditThe Board has adopted a policy to prevent its auditors providing services on any matters that may compromise audit independence.
External Audit
In accordance with section 19 of the SOE Act, the Office of the Controller and Auditor General is required to express an opinion on GenesisEnergy’s financial statements and pursuant to section 15 of the Public Audit Act 2001, has appointed Bruce Taylor of Deloitte to undertake theaudit on its behalf.
The Audit Committee meets regularly with the external auditor and the Board requires regular financial reports and information frommanagement throughout the year, which enable the Board to give a true and fair view of the financial position of the Company and the GenesisPower Limited Group.
In the year under review, Deloitte also provided certain services involving a limited assurance in relation to the sustainability content of the2010 Annual Report and related advice. The value of these other services is detailed in the Financial Statements.
Page 51
Genesis Energy Annual Report 2010
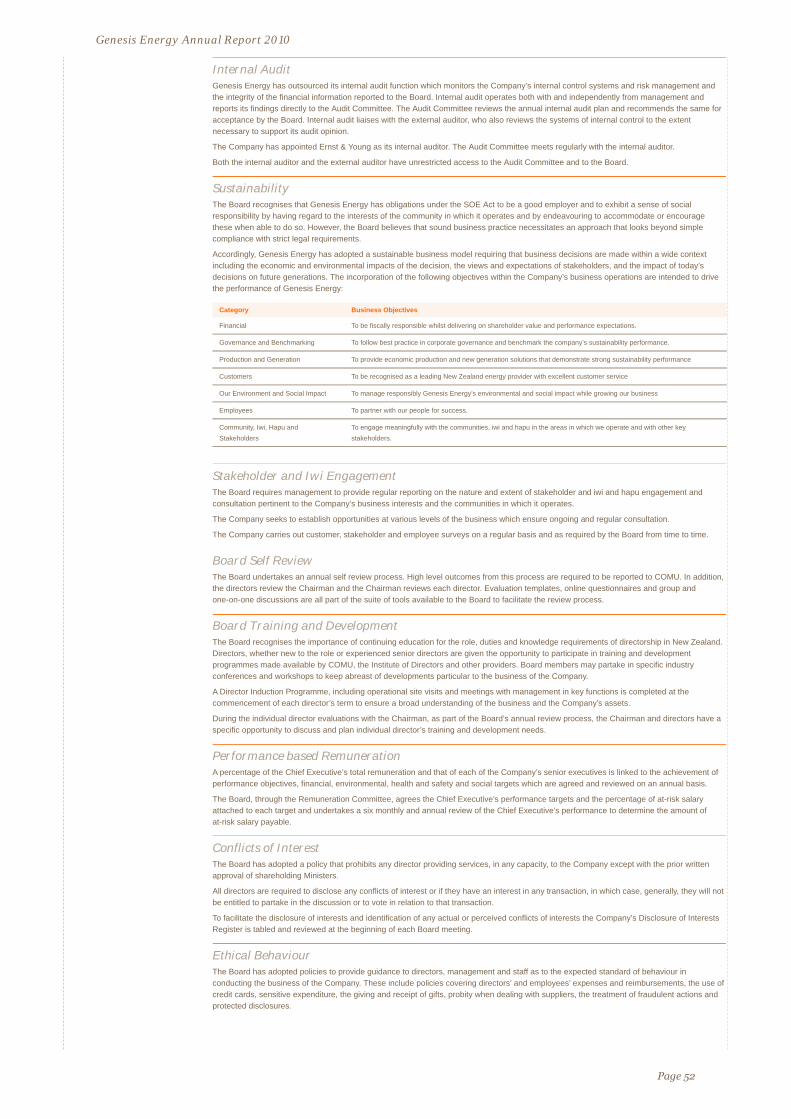
Internal AuditGenesis Energy has outsourced its internal audit function which monitors the Company’s internal control systems and risk management andthe integrity of the financial information reported to the Board. Internal audit operates both with and independently from management andreports its findings directly to the Audit Committee. The Audit Committee reviews the annual internal audit plan and recommends the same foracceptance by the Board. Internal audit liaises with the external auditor, who also reviews the systems of internal control to the extentnecessary to support its audit opinion.
The Company has appointed Ernst & Young as its internal auditor. The Audit Committee meets regularly with the internal auditor.
Both the internal auditor and the external auditor have unrestricted access to the Audit Committee and to the Board.
SustainabilityThe Board recognises that Genesis Energy has obligations under the SOE Act to be a good employer and to exhibit a sense of socialresponsibility by having regard to the interests of the community in which it operates and by endeavouring to accommodate or encouragethese when able to do so. However, the Board believes that sound business practice necessitates an approach that looks beyond simplecompliance with strict legal requirements.
Accordingly, Genesis Energy has adopted a sustainable business model requiring that business decisions are made within a wide contextincluding the economic and environmental impacts of the decision, the views and expectations of stakeholders, and the impact of today’sdecisions on future generations. The incorporation of the following objectives within the Company’s business operations are intended to drivethe performance of Genesis Energy:
Category Business Objectives
Financial To be fiscally responsible whilst delivering on shareholder value and performance expectations.
Governance and Benchmarking To follow best practice in corporate governance and benchmark the company’s sustainability performance.
Production and Generation To provide economic production and new generation solutions that demonstrate strong sustainability performance
Customers To be recognised as a leading New Zealand energy provider with excellent customer service
Our Environment and Social Impact To manage responsibly Genesis Energy’s environmental and social impact while growing our business
Employees To partner with our people for success.
Community, Iwi, Hapu andStakeholders
To engage meaningfully with the communities, iwi and hapu in the areas in which we operate and with other keystakeholders.
Stakeholder and Iwi EngagementThe Board requires management to provide regular reporting on the nature and extent of stakeholder and iwi and hapu engagement andconsultation pertinent to the Company’s business interests and the communities in which it operates.
The Company seeks to establish opportunities at various levels of the business which ensure ongoing and regular consultation.
The Company carries out customer, stakeholder and employee surveys on a regular basis and as required by the Board from time to time.
Board Self ReviewThe Board undertakes an annual self review process. High level outcomes from this process are required to be reported to COMU. In addition,the directors review the Chairman and the Chairman reviews each director. Evaluation templates, online questionnaires and group andone-on-one discussions are all part of the suite of tools available to the Board to facilitate the review process.
Board Training and DevelopmentThe Board recognises the importance of continuing education for the role, duties and knowledge requirements of directorship in New Zealand.Directors, whether new to the role or experienced senior directors are given the opportunity to participate in training and developmentprogrammes made available by COMU, the Institute of Directors and other providers. Board members may partake in specific industryconferences and workshops to keep abreast of developments particular to the business of the Company.
A Director Induction Programme, including operational site visits and meetings with management in key functions is completed at thecommencement of each director’s term to ensure a broad understanding of the business and the Company’s assets.
During the individual director evaluations with the Chairman, as part of the Board’s annual review process, the Chairman and directors have aspecific opportunity to discuss and plan individual director’s training and development needs.
Performance based RemunerationA percentage of the Chief Executive’s total remuneration and that of each of the Company’s senior executives is linked to the achievement ofperformance objectives, financial, environmental, health and safety and social targets which are agreed and reviewed on an annual basis.
The Board, through the Remuneration Committee, agrees the Chief Executive’s performance targets and the percentage of at-risk salaryattached to each target and undertakes a six monthly and annual review of the Chief Executive’s performance to determine the amount ofat-risk salary payable.
Conflicts of InterestThe Board has adopted a policy that prohibits any director providing services, in any capacity, to the Company except with the prior writtenapproval of shareholding Ministers.
All directors are required to disclose any conflicts of interest or if they have an interest in any transaction, in which case, generally, they will notbe entitled to partake in the discussion or to vote in relation to that transaction.
To facilitate the disclosure of interests and identification of any actual or perceived conflicts of interests the Company’s Disclosure of InterestsRegister is tabled and reviewed at the beginning of each Board meeting.
Ethical BehaviourThe Board has adopted policies to provide guidance to directors, management and staff as to the expected standard of behaviour inconducting the business of the Company. These include policies covering directors’ and employees’ expenses and reimbursements, the use ofcredit cards, sensitive expenditure, the giving and receipt of gifts, probity when dealing with suppliers, the treatment of fraudulent actions andprotected disclosures.
Page 52
Genesis Energy Annual Report 2010

Shareholder RelationshipThe SOE Act provides a comprehensive outline of a state owned enterprise’s reporting responsibilities and accountability. The businessplanning process culminates in the delivery of a final SCI for tabling in Parliament. Before the SCI is finalised the Company is required toprovide shareholding Ministers with a draft SCI, supported by the Company’s business plan, to enable shareholding Minsters and their advisersto assess the SCI. In preparing the SCI, the Company is required to consider and address the Company’s objectives and nature and scope ofactivities, to provide financial and non-financial performance indicators and an estimate of current commercial value, to state the Company’sdividend policy and to indicate the matters in respect of which the Company will consult with shareholding Ministers.
The Company is required under the SOE Act to provide annual and six monthly reports. In addition shareholding Ministers also expectquarterly reporting to shareholding Ministers. This quarterly report is required to fully and accurately summarise the Company’s performanceagainst budget, identify the cause of major variances, signal any potential developing issues and highlight major achievements for the quarteras well as the number of full time equivalent staff employed by the Company and a clear statement of the outlook for the rest of the financialyear.
Shareholding Ministers expect the Board to be sensitive to their interests and to be mindful that Ministers are accountable to a wider audience.Accordingly, the Board has approved practices which endeavour to ensure shareholding Ministers are informed well in advance of any materialor significant events, transactions and other issues relating to the Company that may be contentious or could attract wide public interest,whether positive or negative.
COMU acts as the liaison between shareholding Ministers and the Company and facilitates quarterly meetings. COMU issues an Owner’sExpectations Manual which is provided to each director to ensure directors are aware of the Crown’s expectations of state owned enterprisedirectors.
The Board has adopted a policy that requires all communications with shareholding Ministers, whether in writing or in person, to be authorisedby the Board.
The Board requires regular monthly reports from management on all communications with Ministers and officials.
Continuous DisclosureWith the aim of increasing transparency of state owned enterprises and to provide the public with a more continuous flow of informationregarding SOE performance, shareholding Ministers have, since January 2010, required a number of the larger state owned enterprises tocomply with newly developed SOE Continuous Disclosure Rules. The rules require the immediate disclosure of Material Information. MaterialInformation includes information that would have a material effect on the Company’s commercial valuation, information in relation to dividendsdifferent from that in the Company’s most recent SCI and Material Transactions, being transactions the value of which is greater than fivepercent of the current commercial value of the Company. The Rules further require public announcement of comparative financial performanceinformation no later than 60 days after the end of each half and full year period.
A Board approved policy has established the internal processes for identifying, reporting and timely disclosure of Material Information.
All disclosures are placed on the Company’s website and The Treasury website. As at 30 June 2010 Genesis Energy had made six disclosuresunder the SOE Continuous Disclosure Rules.
Page 53
Genesis Energy Annual Report 2010

Directors holding office during accounting periodThe names of the directors of Genesis Power Limited, trading as Genesis Energy (“GenesisEnergy”) or (“Company”), and its subsidiary companies, during the accounting period 1 July 2009 to30 June 2010 are shown below.
Disclosure of InterestThe general disclosures of interest made by directors of Genesis Energy and its subsidiaries,pursuant to section 140(2) of the Companies Act 1993 (“Companies Act”), are shown below. Therewere no declarations of interest made pursuant to section 140(1) of the Companies Act entered in theInterests Registers of Genesis Energy or its subsidiary companies. No director of Genesis Energy is ashareholder of Genesis Energy or any of its subsidiary companies.
Interest Register entriesIn accordance with section 211(1)(e) of the Companies Act, particulars of the entries in the InterestsRegister of Genesis Energy made during the accounting period are as set out below. New or adjustedentries made during the accounting period are marked with an asterisk (*).
Rt HonDameJennyShipley,DNZMChairman
Chair Seniors Money International Ltd
Chair Mainzeal Property and Construction Ltd
Chair Venator Search Limited;*
Chair and Trustee of Heart Health Research Trust *
Managing Director of Jenny Shipley New Zealand Ltd
Director of Education New Zealand International Ltd
Director of Momentum Holdings Ltd
Director of Momentum Consulting Group Ltd
Director of Investment Savings and Insurance Association
Director of China Construction Bank Corporation
Trustee NZ Global Women *
JoannaPerry,MNZMDeputyChair
Chairman of Financial Reporting Standards Board
Director and Shareholder of JMGP Limited
Director of Kiwi Income Property Limited
Director of PSIS Limited
Director of AsureQuality Limited
Director of Rowing New Zealand *
Trustee of Melanesian Mission Trust Board
Member of Australian Accounting Standards Board
Member of Policy Council and New Zealand Regional Council for Financial Services Institute of Australasia
Member of the Audit Committee of the Victorian Auditor General’s Office
Member of the Speakers Assurance Committee
Member of the International Financial Reporting Interpretations Committee (IFRIC)
Member of New Zealand Regional Council for Financial Services Institute of Australia
Dr NicolaCrauford
Director of the Centre for Advanced Engineering
Director and Shareholder of Crauford Robertson Consulting Limited
Director and Shareholder of Martin Crauford Limited
Chief Executive of Institute of Directors, New Zealand
Member of Nominations and Governance Committee of New Zealand Institute of Chartered Accountants *
Member of the Electoral Authority of PSIS Limited *
DenisWood Chairman of Mercy Healthcare Limited and its subsidiaries
Chairman of Mercy Hospice Auckland Limited
Director of Tower Limited
Director and sole Shareholder of DMW Investments Limited
GraemeMilne
Chairman of New Zealand Pharmaceuticals Limited
Chairman of Synlait Limited
Chairman of Terracare Limited
Chairman of Encoate Holdings Limited
Chairman of Waikato District Health Board
Shareholder of Media Profile Limited
Director Farmers Mutual Group
Director Satara Co-operative Group Limited
Statutory Information
Page 54
Genesis Energy Annual Report 2010

Director New Zealand Institute for Rare Disease Research Limited
Board member of the Advisory Board School of Engineering and Advanced Technology, Massey University *
Partner of G.R. & J. A. Milne
Trustee of Rockhaven Trust
John DellManaging Director and Shareholder of Japad Trading Limited
Managing Director and Shareholder of Japad Limited
Managing Director of Japad Long Term Investments Limited
Non Executive Director of Unimarket Holdings Limited
Non Executive Director of Euroglass Systems Limited and its subsidiaries
Trustee of Japad Family Trust
Trustee of Japad Investment Trust
Trustee of The Otago Trust
Trustee of Cuthby Trust
Trustee of Newcastle Trust.
Rukumoana Schaafhausen
Director of Tainui Group Holdings Limited
Executive Member of Waikato-Tainui Te Kauhanganui Incorporated, the trustee of the Waikato Raupatu Lands Trustand Waikato Raupatu River Trust.
BarbaraElliston
Director of Solar Power and Renewables Company Limited
Director of SPARCO Limited *
Director of Investment Vehicle Limited
Director of King Solar Limited *
Director of Sun King Solar Limited *
Director of The Solar Hot Water Company Limited
Director of Elliston Power Consultants Limited
Director of Timeless by Design Limited
Director of Fireball Limited
Director of Azzuro Solar Limited *
Director of Solar Imports Limited *
Director of Eco Warm Solutions Limited *
BrianCorbanCNZM,QSO
Chairman and Shareholder of Corban Consultants Limited
Chairman and Shareholder of Lindsay Corban Associates Limited
Chairman and Shareholder of Ngatarawa Wines Limited
Chairman and Trustee of Corban Estate Arts Centre
Chairman of the Melanesian Mission Trust Board
Chairman of Corbans Viticulture Limited
Chairman of West Auckland Trust Services Limited
Chairman of Languages International Limited
Chairman Frontier Global Limited
Director of Frontier Mapping (NZ) Limited
Consultant of Corban Revell Lawyers
Trustee of the Royal New Zealand Navy Museum
Trustee of the West Auckland Hospice Foundation Trust
Trustee of Waitakere Enterprise Board
Advisory Council Member of the Church of Melanesia
Member of the Speaker’s Assurance Committee
SaraLunam
Chair of WNC 2007 Limited
Director of NZ Post Limited
Director of New Zealand Merino Company Limited
AnnabelCotton
Director of Merlin Consulting Limited
Director of Barramundi Limited
Director of Kingfish Limited *
Director of Marlin Global Limited
Director of Anamallai Tea Estates & Ropeway Company Limited
Director of Riverbend Dairy Farms Limited
Member of Securities Commission and the Commissioner for Financial Advisers *
IanKusabs
Chairman of the Lake Taupo Sustainable Management Group
Director and Shareholder of Ian Kusabs and Associates.
Member of the Lake Taupo management board.
Advisor of Ngati Tuwharetoa
Page 55
Genesis Energy Annual Report 2010

Fisheries associate of Wildland Consultants
Fisheries associate of Charles Mitchell and Associates
Member of the Lake Taupo Protection Project Joint Committee
Member of the Lake Taupo Liaison sub-committee
Member of the Foundation for Research 2009/10 Advisory Group *
Indemnity and InsuranceIn accordance with section 162 of the Companies Act and the Company’s constitution, GenesisEnergy has indemnified and arranged insurance for all current and former executive officers of theCompany and its subsidiary companies in respect of all liabilities to persons (other than the Companyor a related body corporate) to the extent permitted by law which arise out of the performance of theirnormal duties as directors or executive officers unless the liability relates to conduct involving a lackof good faith. In authorising the insurance to be effected each director signed a certificate stating thatin their opinion the cost of the insurance is fair to the Company.
Use of Company InformationNo notices have been received by the Board of Genesis Energy under section 145 of the CompaniesAct with regard to the use of Company information received by directors in their capacities asdirectors of the Company or its subsidiary companies.
Remuneration of DirectorsShareholding Ministers advise the Board the total allowance for fees available to directors of GenesisEnergy and its subsidiary companies. The following table sets out the total remuneration beforewithholding tax and excluding GST (including remuneration for standing and temporary committeemembership) and the value of other benefits received from Genesis Energy by each director of theCompany during the period 1 July 2009 to 30 June 2010.
Name Total $
Rt Hon Dame Jenny Shipley (term commenced 1 November 2009) 65,328
Joanna Perry 67,181
Nicki Crauford 53,960
Barbara Elliston 46,714
Denis Wood 46,756
Graeme Milne 45,301
John Dell (term commenced 1 May 2010) 8,029
Rukumoana Schaafhausen (term commenced 1 May 2010) 7,505
Brian Corban (term ended 31 October 2009) 32,735
Sara Lunam (resigned 31 March 2010) 33,975
Ian Kusabs (term ended 30 April 2010) 41,169
Annabel Cotton (term ended 30 April 2010) 42,455
John Stace (term ended 30 April 2009) 352
During the year in review Brian Corban, CNZM, QSO ended his term as a director and Chairman ofGenesis Energy on 31 October 2009. Sara Lunam resigned as a director on 31 March 2010. AnnabelCotton’s and Ian Kusabs’ respective terms as directors ended on 30 April 2010. Rt Hon Dame JennyShipley was appointed as a director and Chairman of the Board with effect from 1 November 2009.Joanna Perry was reappointed as a director and Deputy Chair with effect from 1 May 2010. John Delland Rukumoana Schaafhausen were appointed as directors with effect from 1 May 2010.
Directors of Subsidiary CompaniesDuring the year in review Brian Corban ceased to be a director, effective 31 October 2009, of thefollowing wholly owned subsidiaries:
Genesis Power Investments, Kinleith Cogeneration Limited, Kupe Holdings Limited, GP No. 1Limited, GP No.2 Limited, GP No. 4 Limited, GP No.5 Limited, Cardiff Holdings No.1 Limited,Cardiff Holdings No.2 Limited, Mangatoa No.1 Limited, Mangatoa No. 2 Limited, Mangatoa No.3Limited, Mangatoa No.4 Limited and Mangatoa No 5. Limited.
Rt Hon Dame Jenny Shipley and Mark Anderson joined Albert Brantley as directors of thosecompanies with effect from 1 November 2009.
With effect from 19 June 2010 Mangatoa No.1 Limited, Mangatoa No. 2 Limited, Mangatoa No.3Limited, Mangatoa No.4 Limited and Mangatoa No 5. Limited were amalgamated into Genesis PowerInvestments Limited.
The directors of wholly owned subsidiary Energy Online Limited are Albert Brantley, Mark Andersonand Dean Carroll.
Albert Brantley and Mark Anderson are directors of Gasbridge Limited in connection with GenesisEnergy’s 50 percent ownership of Gasbridge Limited.
Genesis Energy senior executives Mark Anderson, Allan Melhuish and Richard Pearce were directorsof CRL Energy Limited in connection with Genesis Energy’s 50 percent ownership of CRL EnergyLimited until its sale on 30 June 2010 from which date they ceased to be directors of CRL EnergyLimited.
Following the unconditional agreement to purchase Slopedown Wind Farm Limited on 30 June 2010,Albert Brantley and Mark Anderson became directors of Slopedown Wind Farm Limited with effect
Page 56
Genesis Energy Annual Report 2010

from 21 July 2010.
None of the directors of the subsidiary companies received any remuneration or other benefits duringthe period specifically in relation to their duties as directors of these companies, other than the benefitof an indemnity from Genesis Energy and the benefit of insurance cover in respect of all liabilities topersons (other than the Company or related body corporate), to the extent permitted by law, whicharise out of the performance of their normal duties as directors unless the liability relates to conductinvolving a lack of good faith.
Remuneration of EmployeesIn accordance with section 211(1)(g) of the Companies Act, the number of employees, or formeremployees of Genesis Energy who during the period received remuneration and other benefits thevalue of which exceeded $100,000 is as follows:
Record of Employees Earning over $100,000 in year ending 30 June 2010
$970,000 - $980,000 1
$480,000 - $490,000 1
$440,000 - $450,000 2
$430,000 - $440,000 1
$390,000 - $400,000 1
$360,000 - $370,000 1
$350,000 - $360,000 3
$280,000 - $290,000 2
$220,000 - $230,000 2
$210,000 - $220,000 1
$200,000 - $210,000 2
$180,000 - $190,000 1
$170,000 - $180,000 5
$160,000 - $170,000 7
$150,000 - $160,000 6
$140,000 - $150,000 5
$130,000 - $140,000 21
$120,000 - $130,000 35
$110,000 - $120,000 48
$100,000 - $110,000 50
Total staff earning $100k + 195
Staff included who are no longer employed by Genesis Energy 9
Rt Hon Dame Jenny Shipley, DNZMChairman
Joanna Perry, MNZMDeputy Chairman
Page 57
Genesis Energy Annual Report 2010

Rt Hon DameJenny ShipleyChair
Joanna PerryDeputy Chair
Graeme MilneDirector
Nicola CraufordDirector
Denis WoodDirector
Barbara EllistonDirector
John DellDirector
RukumoanaSchaafhausenDirector
Rt Hon Dame Jenny Shipley, DNZMDame Jenny took over the Chairmanship of Genesis Energy in November 2009. She is alsoChairman of Senior Money International and Mainzeal Construction and is a director on ChinaConstruction Bank, one of the big four major State owned banks in China. She is also a Director ofMomentum and ISI. Dame Jenny was Prime Minister of New Zealand from 1997 to 1999 and in thepreceding 7 years she was a Senior Minister in the New Zealand Government and a driving force inthe successful decade of economic and social reform in New Zealand. She retired from New Zealandpolitics in 2002.
Jenny travels extensively in her role as a director, a keynote speaker and in association with herconsultancy. She has served on a number of advisory boards. She advises companies andgovernments on geopolitical, demographic, economic and social mega trends and speaks all aroundthe world on these and a wide range of other topics.
She was an Initiator of the Education Forum for East Asia, is an active member of the World Women’sLeadership Council and is Vice President of the Club of Madrid, a group of former leaders whopromote democracy and transparent economic development, globally. She is deeply involved in arange of philanthropic projects in New Zealand and offshore.
Joanna PerryDeputy Chair, MA Econ (Cantab), FCA (ICAEW), FCA (NZICA)
Joanna Perry is a professional director and chartered accountant, and her current appointmentsinclude Director of Kiwi Income Property Limited, PSIS and AssureQuality Limited, and Trustee of theMelanesian Mission Trust Board. Joanna chairs the Financial Reporting Standards Board, is amember of the Australian Accounting Standards Board and the Trans-Tasman Advisory Group onAccounting and Auditing Standards.
Graeme MilneB.Tech (Biotech) (Hons)
Graeme Milne is a professional director based on a small sheep and beef farm on the outskirts ofCambridge. After graduating from Massey University in 1975 with an honours degree inBiotechnology, Graeme spent most of his working career in the dairy industry after an initial period inpharmaceuticals and brewing. During the 1980s and again in the 1990s Graeme spent several yearsbased in Europe developing and managing the operations of the New Zealand dairy industry inRussia, Africa, the Middle East and Europe. Currently he is the Chairman of five New Zealand-basedentities, including Synlait Ltd, New Zealand Pharmaceuticals, Waikato District Health Board, andholds directorships in four others.
Nicola CraufordBSc (Hons), PhD, FIPENZ, MInstD, FAICD
Dr Nicki Crauford is the Chief Executive of the Institute of Directors. She is a Director of the Centre ofAdvanced Engineering, and a Director of a number of private companies. She has over 20 years’experience in the oil, electricity and gas sectors in the UK and New Zealand including over nine yearswith national grid owner, Transpower. She holds a Doctorate in engineering.
Denis WoodMA Econ (Hons)
Denis has had a career in investment banking. From 1984 he was a partner in share-broking firm,Buttle Wilson and from 1991 an Executive Director in UBS Warburg. In 1998 he became an executiveDirector in Ernst & Young Corporate Finance until he retired from the investment banking industry in2005. Denis is a Director of Tower Limited and Chairman of Mercy Healthcare Auckland Limited.
Board of Directors
Page 58
Genesis Energy Annual Report 2010

Throughout his career Denis has gained extensive experience in investment management, corporaterestructuring, strategic planning and capital raisings.
Barbara EllistonBE Elect (Hons)
Trained as a professional engineer, Barbara Elliston has more than 20 years’ experience in theelectricity industry. She has been involved in a wide range of activities within the sector, includingtransmission design, power pricing, power contract negotiations, wholesale market development,assistance with the commercialisation of coal seam methane, development of small-scale localgeneration and business development in the solar hot water industry. She is a Director of a number ofsolar energy companies.
John DellBCom (Hons) CA
John is a professional director and is an active investor in high growth businesses. John hassignificant experience in executive finance and strategic management having previously heldexecutive positions as Chief Financial Officer and Chief Executive Officer of Tenon Limited (formerlynamed Fletcher Challenge Forests Limited) and as Chief Financial Officer of Air New ZealandLimited. Prior to his corporate roles, John worked for international accountancy and consultancy firmKPMG. John's background is as a qualified accountant and he has a bachelor’s degree inaccountancy and finance. John’s current Board appointments include the Euroglass/ National GlassGroup of Companies and Unimarket.
Rukumoana SchaafhausenLLB
Rukumoana Schaafhausen has practised as a lawyer for a number of years specialising in the area ofgovernance. She previously worked for a large scale property development company. She serves asa director/trustee on a number of Boards including Waikato Tainui Te Kauhanganui Incorporated,Tainui Group Holdings and Waikato-Tainui Fisheries Limited.
Page 59
Genesis Energy Annual Report 2010

Albert BrantleyChief Executive, BSc,P.Geol, F.AuSIMM
Bob WeirGeneral ManagerProduction, MBA, BEe,MIEAust, CPEng, MIPENZ
Dean CarrollGeneral Manager Retail,BSc
Maureen ShaddickGeneral Counsel andCompany Secretary
Malcolm AlexanderGeneral ManagerCorporate Affairs, LLB, BA(Hons)
Mark AndersonGeneral Manager Finance,BCom, CA
Peggy MolyneuxGeneral ManagerCorporate Services, MBA,BA, MIPM
Allan MelhuishGeneral Manager FuelDevelopment, BE (Hons),BCA (Hons),PGDipBusAdmin
Nic McCondachGeneral Manager EnergyOnline, CA
Richard PearceGeneral ManagerGeneration Development,MBA, BE (Hons)
Albert BrantleyChief Executive, BSc, P.Geol, F.AuSIMM
Albert is responsible for the overall management and strategic direction for all of Genesis Energy’sbusiness interests. He also serves as the Chairman of the Genesis Oncology Trust as well asChairman of Energy Online. His background has largely been in heavy industry, including oil and gasinfrastructure development as well as the mining and power sectors. He has had more than 35 years’experience both in New Zealand and internationally in technical, operational and senior managementpositions, concentrated particularly in the power industry over the past decade. He has hadconsiderable experience leading businesses requiring political, regulatory and environmentalmanagement, both in New Zealand and overseas.
Bob WeirGeneral Manager Production, MBA, BEe, MIEAust, CPEng, MIPENZ
Bob is responsible for the management and operation of all Genesis Energy’s generation assets,trading strategy development and implementation, transmission and intra-generator hedge tradingdesk and environmental impacts. He is also responsible for implementing the carbon strategy into thebusiness.
Dean CarrollGeneral Manager Retail, BSc
Dean is responsible for the management of Genesis Energy’s retail business, leading the retailbusiness unit to provide gas and electricity services driven by the needs of our customers in theresidential, commercial, industrial and derivative markets.
Maureen ShaddickGeneral Counsel and Company Secretary, LLB, BA
As General Counsel, Maureen is responsible for management of the provision of legal services toGenesis Energy and legal compliance and regulatory support. She is the Company Secretary ofGenesis Energy and Deputy Chair of the Genesis Oncology Trust.
Malcolm AlexanderGeneral Manager Corporate Affairs, LLB, BA (Hons)
Malcolm’s role includes management of Genesis Energy’s strategic planning, corporateenvironmental policy, government relations, regulatory affairs, public relations and sustainabilityprogrammes. He is a board member of the New Zealand Council for Infrastructure Development andthe Harvard Business School Association of New Zealand.
Mark AndersonGeneral Manager Finance, BCom, CA
In addition to the management of Genesis Energy’s financial, audit, treasury and insurance functions,Mark has responsibility for the Company’s information systems and risk-management framework.
Peggy MolyneuxGeneral Manager Corporate Services, MBA, BA, MIPM
Peggy’s role includes the management of property and administration, Genesis Energy’s recruitment,development training, NZQA training, e-learning and performance, employee relationships, payrollservices, health and safety, remuneration and internal communication. Peggy is also Project Manager
Executive Team
Page 60
Genesis Energy Annual Report 2010

for the Rodney Power Station project.
Allan MelhuishGeneral Manager Fuel Development, BE (Hons), BCA (Hons), PGDipBusAdmin
Allan is charged with the management of fuel purchases and fuel transportation, Genesis Energy’sinvestment in the Kupe Oil and Gas Field.
Nic McCondachGeneral Manager Energy Online, CA
Nic is responsible for managing the Energy Online retail business, providing leadership to ensure theongoing successful operation of Genesis Energy’s wholly owned subsidiary.
Richard PearceGeneral Manager Generation Development, MBA, BE (Hons)
Richard is responsible for the management of Genesis Energy’s generation development interests,including major renewable energy and thermal development projects, and investigation of carboncapture and sequestration technology.
Page 61
Genesis Energy Annual Report 2010

Focusing on a new level of commercial performance, accountability disclosure
01
Temperature gauge from Huntly Power Station used to monitor the temperatures of Units 1 to 4.
Page 62
Genesis Energy Annual Report 2010
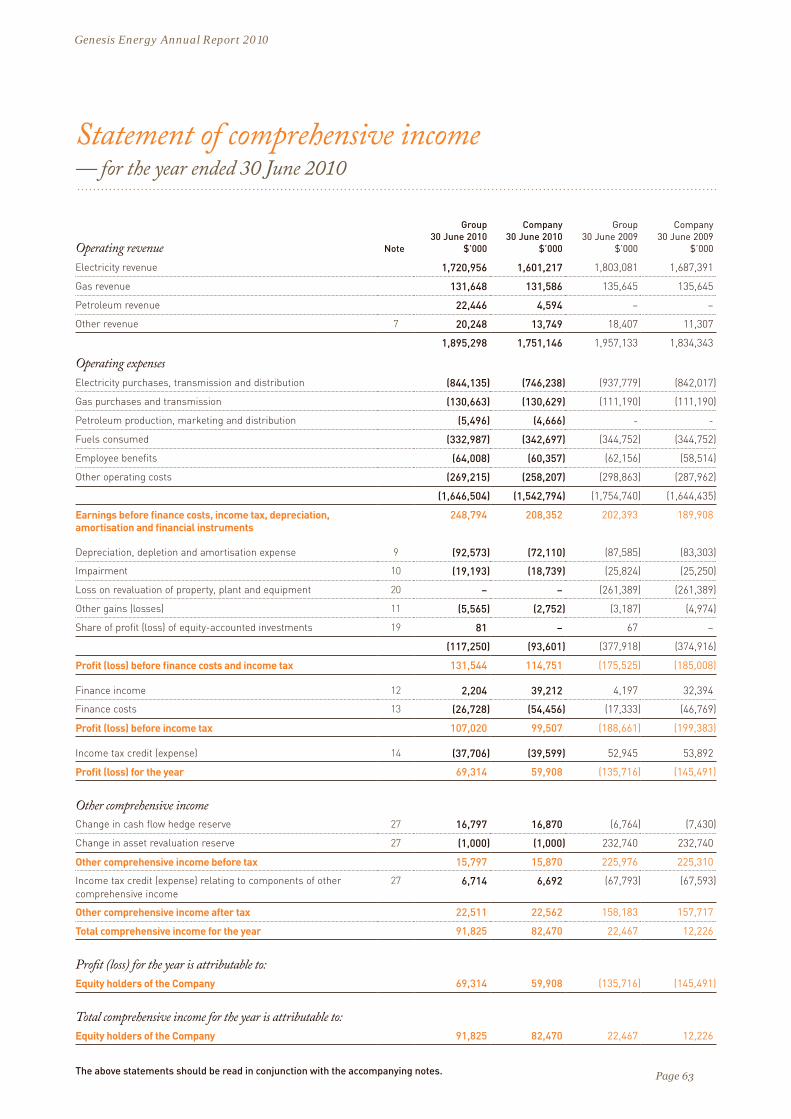
Statement of comprehensive income— for the year ended 30 June 2010
Operating revenue Note
Group 30 June 2010
$’000
Company 30 June 2010
$’000
Group 30 June 2009
$’000
Company 30 June 2009
$’000
Electricity revenue 1,720,956 1,601,217 1,803,081 1,687,391
Gas revenue 131,648 131,586 135,645 135,645
Petroleum revenue 22,446 4,594 – –
Other revenue 7 20,248 13,749 18,407 11,307
1,895,298 1,751,146 1,957,133 1,834,343
Operating expensesElectricity purchases, transmission and distribution (844,135) (746,238) (937,779) (842,017)
Gas purchases and transmission (130,663) (130,629) (111,190) (111,190)
Petroleum production, marketing and distribution (5,496) (4,666) - -
Fuels consumed (332,987) (342,697) (344,752) (344,752)
Employee benefits (64,008) (60,357) (62,156) (58,514)
Other operating costs (269,215) (258,207) (298,863) (287,962)
(1,646,504) (1,542,794) (1,754,740) (1,644,435)
Earnings before finance costs, income tax, depreciation, amortisation and financial instruments
248,794 208,352 202,393 189,908
Depreciation, depletion and amortisation expense 9 (92,573) (72,110) (87,585) (83,303)
Impairment 10 (19,193) (18,739) (25,824) (25,250)
Loss on revaluation of property, plant and equipment 20 – – (261,389) (261,389)
Other gains (losses) 11 (5,565) (2,752) (3,187) (4,974)
Share of profit (loss) of equity-accounted investments 19 81 – 67 –
(117,250) (93,601) (377,918) (374,916)
Profit (loss) before finance costs and income tax 131,544 114,751 (175,525) (185,008)
Finance income 12 2,204 39,212 4,197 32,394
Finance costs 13 (26,728) (54,456) (17,333) (46,769)
Profit (loss) before income tax 107,020 99,507 (188,661) (199,383)
Income tax credit (expense) 14 (37,706) (39,599) 52,945 53,892
Profit (loss) for the year 69,314 59,908 (135,716) (145,491)
Other comprehensive incomeChange in cash flow hedge reserve 27 16,797 16,870 (6,764) (7,430)
Change in asset revaluation reserve 27 (1,000) (1,000) 232,740 232,740
Other comprehensive income before tax 15,797 15,870 225,976 225,310
Income tax credit (expense) relating to components of other comprehensive income
27 6,714 6,692 (67,793) (67,593)
Other comprehensive income after tax 22,511 22,562 158,183 157,717
Total comprehensive income for the year 91,825 82,470 22,467 12,226
Profit (loss) for the year is attributable to:Equity holders of the Company 69,314 59,908 (135,716) (145,491)
Total comprehensive income for the year is attributable to:Equity holders of the Company 91,825 82,470 22,467 12,226
The above statements should be read in conjunction with the accompanying notes. Page 63
Genesis Energy Annual Report 2010

Statement of financial position— as at 30 June 2010
Assets
Current assets Note
Group 30 June 2010
$’000
Company 30 June 2010
$’000
Group 30 June 2009
$’000
Company 30 June 2009
$’000
Cash and cash equivalents 15 25,464 15,325 28,017 6,659
Trade and other receivables 16 207,908 553,851 241,187 587,394
Inventories 17 126,730 125,797 104,301 104,301
Derivative financial instruments 18 3,051 3,072 6,525 6,525
Current tax receivable – – 21,068 –
Total current assets 363,153 698,045 401,098 704,879
Non‑current assetsTrade and other receivables 16 18,554 252 31,643 2,698
Derivative financial instruments 18 3,166 3,166 4,155 4,155
Other financial assets 19 – 29,842 791 30,253
Property, plant and equipment 20 1,495,595 1,493,361 1,912,182 1,542,842
Intangible assets 21 128,906 125,723 133,002 129,833
Oil and gas assets 22 522,950 – 102,555 –
Total non current assets 2,169,171 1,652,344 2,184,328 1,709,781
Total assets 2,532,324 2,350,389 2,585,426 2,414,660
Liabilities
Current liabilitiesTrade and other payables 23 203,928 187,584 243,494 219,075
Borrowings 24 11,289 11,289 131,453 131,453
Derivative financial instruments 18 2,119 2,641 20,028 20,926
Current tax payable 6,535 17,305 – 2,915
Provisions 25 8,149 7,057 4,534 3,442
Total current liabilities 232,020 225,876 399,509 377,811
Non‑current liabilitiesBorrowings 24 541,091 541,091 492,871 492,871
Derivative financial instruments 18 18,486 20,786 14,141 17,864
Provisions 25 54,762 27,174 49,100 30,120
Deferred tax liabilities 26 240,400 174,783 236,965 178,685
Total non current liabilities 854,739 763,834 793,077 719,540
Total liabilities 1,086,759 989,710 1,192,586 1,097,351
Net assets 1,445,565 1,360,679 1,392,840 1,317,309
Shareholders’ equity 27 1,445,565 1,360,679 1,392,840 1,317,309
The Directors of Genesis Power Limited authorise these financial statements for issue. On behalf of the Board:
Rt Hon Dame Jenny Shipley DNZM Joanna Perry MNZM Chairman of the Board Chairman of the Audit Committee 27 August 2010 27 August 2010
The above statements should be read in conjunction with the accompanying notes. Page 64
Genesis Energy Annual Report 2010

Statement of changes in equity— for the year ended 30 June 2010
Note
Group 30 June 2010
$’000
Company 30 June 2010
$’000
Group 30 June 2009
$’000
Company 30 June 2009
$’000
Profit (loss) for the year 69,314 59,908 (135,716) (145,491)
Change in cash flow hedge reserve 27 11,764 11,815 (4,735) (5,201)
Change in asset revaluation reserve 27 10,747 10,747 162,918 162,918
Total comprehensive income for the year 91,825 82,470 22,467 12,226
Dividends provided for or paid 28 (39,100) (39,100) (36,400) (36,400)
Changes in equity for the year 52,725 43,370 (13,933) (24,174)
Equity at the beginning of the year 1,392,840 1,317,309 1,406,773 1,341,483
Equity at the end of the year 1,445,565 1,360,679 1,392,840 1,317,309
The above statements should be read in conjunction with the accompanying notes. Page 65
Genesis Energy Annual Report 2010

Cash flow statement— for the year ended 30 June 2010
Cash flows from operating activities Note
Group 30 June 2010
$’000
Company 30 June 2010
$’000
Group 30 June 2009
$’000
Company 30 June 2009
$’000
Cash was provided from:
Receipts from customers 1,929,774 1,795,178 2,167,152 2,046,148
Interest received 2,204 233 4,197 3,479
Dividend received 30 30 – –
Taxation credits (debits) 46 3,274 (58) 3,560
1,932,054 1,798,715 2,171,291 2,053,187
Cash was applied to:
Payments to suppliers 1,626,438 1,536,719 1,846,846 1,707,322
Payments to employees 62,971 59,323 61,577 57,962
1,689,409 1,596,042 1,908,423 1,765,284
Net cash inflow from operating activities 35 242,645 202,673 262,868 287,903
Cash flows from investing activitiesCash was provided from:
Proceeds from disposal of property, plant and equipment 2,805 2,805 2,386 2,386
Proceeds from disposal of intangibles 11,328 11,328 – –
Receipts of principal from finance lease receivable 6,160 – 5,348 –
Net advances and loans from subsidiaries – 4,099 – –
20,293 18,232 7,734 2,386
Cash was applied to:
Purchase of property, plant and equipment 43,313 33,331 189,873 106,731
Purchase of intangibles 16,754 16,533 20,278 20,074
Purchase of oil and gas assets 42,133 364 36,519 7,880
Purchase of investments 782 – – –
Net advances and loans to subsidiaries – – – 145,598
102,982 50,228 246,670 280,283
Net cash (outflow) to investing activities (82,689) (31,996) (238,936) (277,897)
Cash flows from financing activitiesCash was provided from:
Proceeds from new borrowings 120,000 120,000 225,000 225,000
120,000 120,000 225,000 225,000
Cash was applied to:
Repayment of borrowings 187,300 187,300 150,500 150,500
Interest paid and other finance charges 52,650 52,152 44,032 43,803
Repayment of principal on finance lease liabilities 3,459 3,459 3,199 3,199
Ordinary dividend paid 39,100 39,100 36,400 36,400
282,509 282,011 234,131 233,902
Net cash (outflow) to financing activities (162,509) (162,011) (9,131) (8,902)
Net increase (decrease) in cash and cash equivalents (2,553) 8,666 14,801 1,104
Cash and cash equivalents at beginning of year 28,017 6,659 13,216 5,555
Cash and cash equivalents at end of year 25,464 15,325 28,017 6,659
Cash and cash equivalents comprises:Cash at bank and on hand 17,064 6,925 28,017 6,659
Short term deposits 8,400 8,400 – –
15 25,464 15,325 28,017 6,659
The above statements should be read in conjunction with the accompanying notes. Page 66
Genesis Energy Annual Report 2010

Notes to the financial statements— for the year ended 30 June 2010
1. General informationThe financial statements have been prepared for Genesis Power Limited (the Company) and its subsidiaries (together, the Group). The Company was incorporated and became a state-owned enterprise on 16 December 1998 pursuant to the State-Owned Enterprises Act 1986. The Company is a profit-orientated entity and is wholly owned by Her Majesty the Queen in Right of New Zealand (the Crown). The Group’s core business is the generation, trading and retailing of energy in New Zealand. The Group’s secondary business involves petroleum mining and production.
The Company is a limited liability company incorporated and domiciled in New Zealand. The address of its registered office is 602 Great South Road, Auckland 1546.
2. Summary of accounting policiesThe financial statements include separate financial statements for Genesis Power Limited as an individual entity and the consolidated entity consisting of Genesis Power Limited and its subsidiaries.
(a) Basis of preparationThe financial statements have been prepared in accordance with New Zealand generally accepted accounting practice (NZ GAAP). They comply with New Zealand equivalents to International Financial Reporting Standards (NZ IFRS) and other applicable New Zealand Financial Reporting Standards, as appropriate for profit-orientated entities.
These financial statements are presented in New Zealand dollars rounded to the nearest thousand.
(i) Compliance with IFRSThe separate and consolidated financial statements of Genesis Power Limited also comply with International Financial Reporting Standards (IFRS).
(ii) Entities reportingThe financial statements of the Company are for Genesis Power Limited as a separate legal entity.
The consolidated financial statements of the Group are for the economic entity comprising Genesis Power Limited and its subsidiaries.
(iii) Statutory baseGenesis Power Limited is a company registered under the Companies Act 1993.
The financial statements have been prepared in accordance with the requirements of the Financial Reporting Act 1993 and the Companies Act 1993.
(iv) Historical cost conventionThese financial statements have been prepared on the basis of historical cost, except for the revaluation of available-for-sale financial assets, financial assets and liabilities (including
derivative instruments) at fair value through profit or loss, and certain classes of property, plant and equipment.
(v) Critical accounting estimates and judgementsThe preparation of financial statements in conformity with NZ IFRS requires the use of certain critical accounting estimates. It also requires management to exercise its judgement in the process of applying the Groups’ accounting policies. The areas involving a higher degree of judgement or complexity, or areas where assumptions and estimates are significant to the financial statements, are disclosed in note 5 or in the relevant accounting policy.
The estimates and associated assumptions are based on historical experience and various other factors that are believed to be reasonable under the circumstances. Actual results may differ from these estimates.
The estimates and underlying assumptions are reviewed on an ongoing basis. Revisions to accounting estimates are recognised in the period in which the estimate is revised if the revision affects only that period, or in the period of the revision and future periods if the revision affects both current and future periods.
(vi) Goods and Services Tax (GST)The statement of comprehensive income and the cash flow statement have been prepared so that all components are stated exclusive of GST. All items in the balance sheet are stated net of GST, with the exception of receivables and payables, which include GST.
(b) Principles of consolidation(i) SubsidiariesThe Group financial statements incorporate the financial statements of the Company and entities controlled by the Company (its subsidiaries). Control is achieved where the Company has the power to govern the financial and operating policies of an entity so as to obtain benefits from its activities.
The results of subsidiaries acquired or disposed of during the year are included in the profit or loss from the effective date of acquisition or up to the effective date of disposal, as appropriate.
Where necessary, adjustments are made to the financial statements of subsidiaries to bring their accounting policies into line with those used by other members of the Group. All intra-Group transactions, balances, income and expenses are eliminated in full on consolidation.
Investments in subsidiaries are recorded at cost in the Parent Company’s financial statements.
(ii) Business combinationsAcquisitions of subsidiaries and businesses are accounted for using the acquisition method.
The cost of the acquisition is measured at the aggregate of the fair values, at the date of
exchange, of assets given, liabilities incurred or assumed, and equity instruments issued by the Group in exchange for control of the acquiree. Acquisition-related costs are recognised in profit or loss as incurred.
Where applicable, the cost of acquisition includes any asset or liability resulting from a contingent consideration arrangement, measured at its acquisition-date fair value. Subsequent changes in such fair values are adjusted against the cost of acquisition where they qualify as measurement period adjustments (see below). All other subsequent changes in the fair value of contingent consideration classified as an asset or liability are accounted for in accordance with the relevant NZ IFRS. Changes in the fair value of contingent consideration classified as equity are not recognised.
Goodwill arising on acquisition is recognised as an asset and initially measured at cost, being the excess of the cost of the business combination over the Group’s interest in the net fair value of the acquiree’s identifiable assets, liabilities and contingent liabilities exceeds the cost of the business combination, the excess is recognised immediately in the profit or loss.
(iii) Joint venturesJointly controlled assets and entities are joint arrangements with other parties in which the Group jointly controls or owns one or more assets or entities and is consequently entitled to a share of the future economic benefits through its share of the jointly controlled asset or entity.
The Group’s share of the assets, liabilities, revenues and expenses of jointly controlled assets or entities is incorporated into the Group financial statements on a proportionate line-by-line basis.
(iv) AssociatesAssociates are all entities over which the Group has significant influence but not control, generally evidenced by a holding of between 20.0 per cent and 50.0 per cent of the voting rights. Investments in associates are accounted for in the Parent entity financial statements using the cost method and in the consolidated financial statements using the equity method of accounting, after initially being recognised at cost. The Group’s investment in associates includes goodwill (net of any accumulated impairment loss) identified on acquisition.
The Group’s share of its associates’ post-acquisition profits or losses is recognised in the profit or loss, and its share of post-acquisition movements in reserves is recognised in other comprehensive income. The cumulative post-acquisition movements are adjusted against the carrying amount of the investment. Dividends receivable from associates are recognised in the Parent entity’s profit or loss while, in the consolidated
Page 67
Genesis Energy Annual Report 2010

financial statements, they reduce the carrying amount of the investment.
When the Group’s share of losses in an associate equals or exceeds its interest in the associate, including any other unsecured receivables, the Group does not recognise further losses, unless it has incurred obligations or made payments on behalf of the associate.
Unrealised gains on transactions between the Group and its associates are eliminated to the extent of the Group’s interest in the associates. Unrealised losses are also eliminated unless the transaction provides evidence of an impairment of the asset transferred. Accounting policies of associates have been changed where necessary to ensure consistency with the policies adopted by the Group.
(c) Foreign currency translation(i) Functional and presentation currencyItems included in the financial statements of each of the Group’s entities are measured using the currency of the primary economic environment in which it operates (the functional currency). The consolidated financial statements are presented in New Zealand dollars rounded to the nearest thousand; the New Zealand dollar is Genesis Power Limited’s functional and presentation currency.
(ii) Transactions and balancesForeign currency transactions are translated into the functional currency using the exchange rates prevailing at the dates of the transactions. Foreign exchange gains and losses resulting from the settlement of transactions or from their translation at balance sheet date using balance date exchange rates, are recognised in the profit or loss, except for differences arising on the retranslation of non-monetary items. Gains and losses from the retranslation of non-monetary items are recognised directly in other comprehensive income.
Translation differences on non-monetary items, such as equities held at fair value through profit or loss, are reported as part of the fair value gain or loss. Translation differences on non-monetary items, such as equities classified as available-for-sale financial assets, are included in the fair value reserve in the statement of comprehensive income.
(d) Revenue recognitionRevenue is measured at the fair value of the consideration received or receivable net of returns, trade allowances and duties and taxes paid. Revenue recognised in the profit or loss includes amounts received and receivable for electricity, gas, oil, LPG and energy-related services, supplied to customers in the ordinary course of business. Management has exercised judgement in determining estimated retail sales for unread electricity and gas meters at balance date. Revenue is recognised as follows:
(i) Sales of goodsRevenue from the supply of goods is recognised when the significant risks and rewards of ownership have been transferred to the buyer.
(ii) Sales of servicesRevenue from the supply of services is
recognised at balance date on a straight line basis over the specified period for the services unless an alternative method better represents the stage of completion of the transaction.
(iii) Interest incomeInterest income is recognised on an accrual basis using the effective interest method. The effective interest rate exactly discounts estimated future cash receipts through the expected life of the financial asset to that asset’s net carrying amount. The method applies this rate to the principal outstanding to determine interest income in each period.
(iv) Rental incomeRental income is recognised in the profit or loss on a straight-line basis over the term of the lease. Lease incentives granted are recognised evenly over the term of the lease as a reduction in total rental income.
(v) Dividend incomeDividend income is recognised when the right to receive payment is established.
(e) Income taxThe income tax expense or income for the period is the tax payable or receivable on the current period’s taxable income or expense based on the New Zealand tax rate. This is adjusted by changes in deferred tax assets and liabilities attributable to temporary differences between the tax bases of assets and liabilities and their carrying amounts in the financial statements, and unused tax losses.
Deferred tax is recognised for temporary differences and is accounted for using the balance sheet liability method. Deferred tax liabilities are generally recognised for all taxable temporary differences and deferred tax assets are recognised to the extent that it is probable that taxable profits will be available against which deductible temporary differences can be utilised. Such assets and liabilities are not recognised if the temporary difference arises from goodwill or from the initial recognition (other than in a business combination) of other assets and liabilities in a transaction that affects neither the taxable profit nor the accounting profit.
Deferred tax liabilities are recognised for taxable temporary differences arising on investments in subsidiaries and associates, and interests in joint ventures, except where the Group is able to control the reversal of the temporary difference and it is probable that the temporary difference will not reverse in the foreseeable future.
The carrying amount of deferred tax assets is reviewed at each balance sheet date and reduced to the extent that it is no longer probable that sufficient taxable profits will be available to allow all or part of the asset to be recovered.
Deferred tax is calculated at the tax rates that are expected to apply in the period when the liability is settled or the asset realised, based on those tax rates that are enacted or substantively enacted. The relevant tax rates are applied to the cumulative amounts of deductible and taxable temporary differences to measure the deferred tax asset or liability.
Deferred tax is charged or credited to profit or loss, except when it relates to items charged or credited directly to other comprehensive income, in which case the deferred tax is also dealt with in other comprehensive income.
Deferred tax assets and liabilities are offset when there is a legally enforceable right to set off current tax assets against current tax liabilities and when they related to income taxes levied by the same taxation authority and the Group intends to settle its current tax assets and liabilities on a net basis.
(f ) Leases(i) The Group is the lesseeLeases of property, plant and equipment where the Group has substantially all the risks and rewards of ownership are classified as finance leases. Finance leases are capitalised at the lease’s inception at the lower of the fair value of the leased property and the present value of the minimum lease payments. The corresponding rental obligations, net of finance charges, are included in other long-term payables. Each lease payment is allocated between the liability and finance charges so as to achieve a constant periodic rate of interest on the finance balance outstanding. The property, plant and equipment acquired under finance leases are depreciated over the shorter of the asset’s useful life and the lease term.
Leases in which a significant portion of the risks and rewards of ownership are retained by the lessor are classified as operating leases. Payments made under operating leases (net of any incentives received from the lessor) are charged to the profit or loss on a straight-line basis over the period of the lease.
(ii) The Group is the lessorWhen assets are leased out under a finance lease, the present value of the minimum lease payments is recognised as a receivable. Finance lease receipts are allocated between interest revenue and reduction of the lease receivable over the term of the lease in order to reflect a constant periodic rate of return on the net investment outstanding in respect of the lease.
Assets leased to third parties under operating leases are included in property, plant and equipment in the balance sheet. They are depreciated over their expected useful lives on a basis consistent with similar owned property, plant and equipment. Rental income is recognised on a straight-line basis over the lease term.
(g) Impairment of assetsAssets that have an indefinite useful life are not subject to amortisation and are tested annually for impairment. Assets that are subject to amortisation are reviewed for impairment annually, or whenever events or changes in circumstances indicate that the carrying amount may not be recoverable. If an asset’s carrying value exceeds its recoverable amount, the difference is recognised as an impairment loss.
The recoverable amount is the higher of an asset’s fair value less costs to sell, and the asset’s value in use. In assessing value in use, the estimated future cash flows are discounted to their present value at a rate that reflects
Page 68
Genesis Energy Annual Report 2010

current market assessments of the time value of money. This discount rate is adjusted for the risks specific to the asset where the estimated cash flows have not been adjusted.
For the purposes of assessing impairment, assets are grouped at the lowest levels for which there are separately identifiable cash flows (cash generating units). Non financial assets other than goodwill that have been impaired are reviewed for possible reversal of the impairment at each reporting date.
Where an impairment loss subsequently reverses, the carrying amount of the asset is increased to the revised estimate of its recoverable amount, but only to the extent the carrying amount of the asset at the date the impairment is reversed does not exceed what the amortised cost would have been had the impairment not been recognised. A reversal of an impairment loss is recognised in profit or loss immediately, unless the relevant asset is carried at fair value, in which case the reversal of the impairment loss is treated as a revaluation increase. Impairment of goodwill is not reversed.
(h) Cash and cash equivalentsCash and cash equivalents includes cash on hand, deposits held on call with financial institutions, other short-term, highly liquid investments with original maturities of three months or less that are readily convertible to known amounts of cash, and which are not subject to significant risk of changes in value, and bank overdrafts. Bank overdrafts are shown within borrowings in current liabilities on the statement of financial position.
(i) Trade receivablesTrade receivables are recognised initially at fair value and subsequently measured at amortised cost using the effective interest-rate method, less impairment loss.
Appropriate allowances for estimated unrecoverable amounts are recognised in profit or loss when there is objective evidence that the Group will not be able to collect all amounts due according to the original terms of receivables.
(j) Inventories(i) Fuel stocksCoal and other fuel stocks used in electricity production are stated at the lower of cost and net realisable value. Cost is based on the weighted average basis and includes expenditure incurred in bringing the fuel stocks to their present location and condition, including shipping and handling.
(ii) Consumables and spare partsConsumables and spare parts are stated at the lower of cost and net realisable value. Costs are assigned to individual items of inventory on the weighted average basis.
(iii) Petroleum production stockPetroleum production stocks are stated at the lower of production cost and net realisable value. Cost of production includes attributable mining and manufacturing overheads.
Net realisable value is the estimated selling price in the ordinary course of business less the estimated costs necessary to make the sale.
(k) Non current assets (or disposal groups) held-for-saleNon-current assets (or disposal groups) are classified as held-for-sale and stated at the lower of their carrying amount and fair value less costs to sell, if their carrying amount will be recovered principally through a sale transaction rather than through continuing use: that is, if the assets are available for immediate sale and the sale is highly probable.
An impairment loss is recognised for any initial or subsequent write-down of an asset (or disposal group) to fair value less costs to sell. A gain is recognised for any subsequent increases in fair value less costs to sell of an asset (or disposal group), but not in excess of any cumulative impairment loss previously recognised. A gain or loss not previously recognised by the date of the sale of the non-current asset (or disposal group) is recognised at the date of de-recognition.
Non-current assets (including those that are part of a disposal group) are not depreciated or amortised while they are classified as held-for-sale. Interest and other expenses attributable to the liabilities of a disposal group classified as held-for-sale continue to be recognised.
Non-current assets classified as held-for-sale and the assets of a disposal group classified as held-for-sale are presented separately from the other assets in the balance sheet. The liabilities of a disposal group classified as held-for-sale are presented separately from other liabilities in the balance sheet.
(l) Investments and other financial assets(i) InvestmentsPurchases and sales of investments are recognised on the trade-date, being the date on which the Group commits to purchase or sell the asset. Investments are initially recognised at fair value net of transaction costs. Financial assets classified as fair value through profit or loss are initially measured at fair value.
Subsequent to initial recognition, investments in subsidiaries are measured at cost less impairment in the Company financial statements.
Subsequent to initial recognition, investments in associates are accounted for under the equity method in the consolidated financial statements and the cost method in the Company financial statements.
(ii) Other financial assetsThe Group classifies its other financial assets in the following categories: financial assets at fair value through profit or loss, loans and receivables, held-to-maturity investments and available-for-sale financial assets. The classification depends on the nature of the financial assets and the purpose for which the financial assets were acquired. Management determines the classification of its financial assets at initial recognition and re-evaluates this designation at each reporting date.
(a) Financial assets at fair value through profit or loss
This category has two sub-categories: financial assets held-for-trading, and those designated at fair value through profit
or loss on initial recognition. A financial asset is classified in this category if acquired principally for the purpose of selling in the short term or if so designated by management. A financial asset is designated as held-for-trading if the possibility exists that it will be sold in the short term and the asset is subject to frequent changes in fair value. Derivatives are also categorised as held-for-trading unless they are designated as hedges. Assets in this category are classified as current assets if they are either held-for-trading or are expected to be realised within 12 months of the balance sheet date.
(b) Loans and receivablesLoans and receivables are non-derivative financial assets with fixed or determinable payments that are not quoted in an active market and are measured at amortised cost. They arise when the Group provides money, goods or services directly to a debtor with no intention of selling the receivable. They are included in current assets, except for those with maturities greater than 12 months after the balance sheet date which are classified as non-current assets.
Loans and receivables are included in receivables in the balance sheet (note 16).
(c) Held-to-maturity investmentsHeld-to-maturity investments are non-derivative financial assets with fixed or determinable payments and fixed maturities that the Group’s management has the positive intention and ability to hold to maturity.
(d) Available-for-sale financial assetsAvailable-for-sale financial assets, comprising principally marketable equity securities, are non-derivative financial assets that are either designated in this category or not classified in any of the other categories. They are included in non-current assets unless management intends to dispose of the investment within 12 months of the balance sheet date.
Other financial assets are de-recognised when the rights to receive cash flows from the financial assets have expired or have been transferred and the Group has transferred substantially all the risks and rewards of ownership.
Available-for-sale financial assets and financial assets at fair value through profit and loss are subsequently carried at fair value. Loans and receivables and held-to-maturity investments are carried at amortised cost using the effective interest-rate method less impairment. Realised and unrealised gains and losses arising from changes in the fair value of the ‘financial assets at fair value through profit or loss’ category are included in profit or loss in the period in which they arise. Unrealised gains and losses arising from changes in the fair value of financial assets classified as available-for-sale are recognised in other comprehensive income and accumulated as a separate component
Page 69
Genesis Energy Annual Report 2010
of equity. When securities classified as available-for-sale are sold, the accumulated fair value adjustments are reclassified from equity to profit and loss as gains and losses from investment securities.
If the market for a financial asset is not active (and for unlisted securities), the Group establishes fair value by using valuation techniques. These include reference to the fair values of recent arm’s-length transactions, involving the same instruments or other instruments that are substantially the same, estimated discounted cash flow analyses and option pricing models refined to reflect the issuer’s specific circumstances.
Financial assets, other than those at fair value through profit or loss, are assessed for indicators of impairment at each balance date. Financial assets are impaired where there is objective evidence that, as a result of events occurring after initial recognition, the estimated future cash flows of the asset have been impacted. In the case of equity securities classified as available-for-sale, a significant or prolonged decline in the fair value of a security below its cost is considered in determining whether the security is impaired. If any such evidence exists for available-for-sale financial assets, the cumulative loss measured as the difference between the acquisition cost and the current fair value, less any impairment loss on that financial asset previously recognised in profit and loss, is removed from equity and recognised in the statement of comprehensive income. In respect of available-for-sale equity instruments, any subsequent increase in fair value after an impairment loss is recognised directly in other comprehensive income.
The carrying amount of the financial asset is reduced by the impairment loss directly for all financial assets with the exception of trade receivables where the carrying amount is reduced through the use of an allowance account. When a trade receivable is uncollectible, it is charged to profit or loss. Changes in the carrying amount of the allowance account are usually recognised in profit or loss.
With the exception of available-for-sale equity instruments, if, in a subsequent period, the amount of the impairment loss decreases and the decrease can be related objectively to an event occurring after the impairment was recognised, the previously recognised impairment loss is reversed through the profit or loss to the extent the carrying amount of the asset at the date the impairment is reversed does not exceed what the amortised cost would have been had the impairment not been recognised.
(m) DerivativesDerivatives are initially recognised at fair value on the date a derivative contract is entered into and are subsequently remeasured to their fair
value. The method of recognising the resulting gain or loss depends on whether the derivative is designated as a hedging instrument and, if so, the nature of the item being hedged. The Group designates certain derivatives as either:
(1) hedges of the fair value of recognised assets or liabilities or a firm commitment (fair value hedges); or
(2) hedges of highly probable forecast transactions (cash flow hedges).
The Group has entered into transactions using financial instruments within predetermined policies and limits in order to reduce risks from carrying out its ongoing business. These instruments include foreign exchange contracts and interest-rate swaps. The Group enters into these contracts to hedge its foreign currency and interest-rate exposures. The Group has also entered into forward and option contracts to manage its exposure to price fluctuations in the wholesale electricity market, and for sales of oil products.
The Group documents, at the inception of the transaction, the relationship between hedging instruments and hedged items, as well as its risk-management objective and strategy for undertaking various hedge transactions. The Group also documents its assessment, both at hedge inception and on an ongoing basis, of whether the derivatives that are used in hedging transactions have been and will continue to be highly effective in offsetting changes in fair values or cash flows of hedged items.
The fair values of various financial instruments used for hedging purposes are disclosed in note 18. Movements in the hedging reserve in shareholders’ equity are shown in note 27.
(i) Fair value hedgesChanges in the fair value of derivatives that are designated and qualify as fair value hedges are recorded in profit or loss, together with any changes in the fair value of the hedged asset or liability that are attributable to the hedged risk.
(ii) Cash flow hedgesThe effective portion of changes in the fair value of derivatives that are designated and qualify as cash flow hedges is recognised in other comprehensive income and accumulated as a separate component of equity in the hedging reserve. The gain or loss relating to the ineffective portion is recognised immediately in profit or loss.
Amounts accumulated in equity are recycled in profit or loss in the periods when the hedged item will affect profit or loss (for instance when the forecast sale that is hedged takes place). However, when the forecast transaction that is hedged results in the recognition of a non-financial asset (for example, inventory) or a non-financial liability, the gains and losses previously deferred in equity are transferred from equity and included in the measurement of the initial cost or carrying amount of the asset or liability.
When a hedging instrument expires or is sold or terminated, or when a hedge no longer meets the criteria for hedge accounting, any cumulative gain or loss existing in equity at that time remains in equity and is recognised when
the forecast transaction is ultimately recognised in profit or loss. When a forecast transaction is no longer expected to occur, the cumulative gain or loss that was reported in equity is immediately transferred to profit or loss.
The fair value of hedging derivatives is classified as non-current assets or non-current liabilities if the remaining maturity of the hedging relationship is more than 12 months and as a current asset or current liability if the remaining maturity of the hedging relationship is less than 12 months.
(iii) Derivatives that do not qualify for hedge accountingCertain derivative instruments do not qualify for hedge accounting. Changes in the fair value of any derivative instrument that does not qualify for hedge accounting are recognised immediately in profit or loss.
(iv) Embedded derivativesDerivatives embedded in other financial instruments or other non-financial host contracts are treated as separate derivatives when their risks and characteristics are not closely related to those of the host contract, and the host contract is not carried at fair value with unrealised gains or losses reported in profit or loss.
(n) Fair value estimationThe fair value of financial assets and financial liabilities must be estimated for recognition and measurement or for disclosure purposes.
The fair value of financial instruments traded in active markets (such as publicly traded derivatives, and trading and available-for-sale securities) is based on quoted market prices at the balance sheet date. The quoted market price used for financial assets held by the Group is the current bid price; the quoted market price for financial liabilities is the current ask price.
The fair value of financial instruments that are not traded in an active market (for example, over-the-counter derivatives) is determined using valuation techniques. The Group uses a variety of methods and makes assumptions that are based on market conditions existing at each balance date. Quoted market prices or dealer quotes for similar instruments are used for long-term debt instruments held. Other techniques, such as estimated discounted cash flow analysis, are used to determine fair value for the remaining financial instruments. The fair value of interest-rate swaps is calculated as the present value of the estimated future cash flows. The fair value of forward exchange contracts is determined using forward exchange market rates at the balance sheet date. The fair value of electricity derivatives is calculated as the present value of the estimated future cash flows taking into account a market price path where available or an internally generated electricity price path.
The nominal values less estimated credit adjustments of trade receivables and payables are assumed to approximate their fair values.
(i) Deferred ‘day 1’ gains (losses)Where the Group estimates fair values of derivative financial instruments using internally
Page 70
Genesis Energy Annual Report 2010

generated future price paths, as is the case with electricity derivatives, the instrument is fair valued at inception and the difference arising between the estimated fair value and its cost (nil) is a valuation adjustment. Other than for some energy option contracts, the valuation adjustment is eliminated by adjusting the future price path used to determine the fair value of electricity derivatives by a constant dollar amount to return the initial fair value to nil. For the energy option contracts, the valuation adjustment is effectively amortised based on expected call volumes over the term of the contract.
(o) Property, plant and equipment(i) Generation assetsGeneration assets are stated in the balance sheet at cost or, in the case of previously revalued items, at fair value at the date of revaluation, less any subsequent accumulated depreciation and impairment losses. Revaluations are performed with sufficient regularity, not to exceed five years, to ensure the carrying amount does not differ materially from that which would be determined using fair values at the balance sheet date.
Any increase arising on the revaluation of generation assets is recognised in other comprehensive income and accumulated as a separate component of equity in the asset revaluation reserve, except to the extent that it reverses a revaluation decrease for the same asset previously recognised in profit or loss, in which case the increase is credited to the statement of comprehensive income to the extent of the decrease previously charged. A decrease in carrying amount arising on the revaluation of such generation assets is charged to profit or loss to the extent that it exceeds the balance, if any, held in the asset revaluation reserve relating to a previous revaluation of that asset.
Depreciation on revalued generation assets is charged to profit or loss. On the subsequent sale or retirement of a revalued asset, the attributable revaluation surplus remaining in the asset revaluation reserve is transferred directly to retained earnings.
Property and plant constructed for production or administrative purposes, is carried at cost or, in the case of previously revalued items, at fair value at the date of revaluation, less any subsequent accumulated impairment losses. The cost of assets constructed by the Group, including capital work in progress, is the cost of all materials used in construction, direct labour costs of construction, resource management consent costs, and an appropriate proportion of applicable variable and fixed overheads. Where applicable, cost also includes the estimated cost of dismantling and removing the asset and restoring the site on which it is located.
(ii) Other property, plant and equipmentAll remaining property, plant and equipment, except for land and capital work in progress (which is not depreciated), is stated at cost less accumulated depreciation, and any accumulated impairment losses.
(iii) DepreciationWith the exception of land and property and plant under construction, depreciation is charged on a straight-line basis at rates calculated to allocate the costs or valuation of an item of property, plant and equipment, less any estimated residual value, over its estimated useful life.
The estimated useful lives of different classes of property plant and equipment are as follows:
Estimated useful lifeGeneration assets 10 to 50 years
Buildings and improvements 10 to 50 years
Other plant and equipment 3 to 15 years
Leased plant and equipment 20 to 25 years
Freehold land is not depreciated
The assets’ residual values and useful lives are reviewed, and adjusted if appropriate, at each balance sheet date.
An asset’s carrying amount is written down immediately to its recoverable amount if the asset’s carrying amount is greater than its estimated recoverable amount (note 2(g)).
Gains and losses on the disposal or retirement of an item of property, plant and equipment is determined as the difference between the sales proceeds and the carrying amount of the asset and is recognised in profit or loss. When revalued assets are disposed of, it is Group policy to transfer the attributable surplus remaining in the asset revaluation reserve in respect of those assets to retained earnings.
(p) Oil and gas assets(i) Exploration and evaluation expenditureExploration and evaluation expenditure is accounted for in accordance with the area of interest method. An area of interest is defined as being a permit area, where the Group has a current right of tenure. The application of the area of interest method is based on a partial capitalisation model aligned to the ‘successive efforts’ approach. All exploration and evaluation costs, including directly attributable overheads, general permit activity, geological and geophysical costs, are expensed as incurred except the costs of drilling exploration wells and the costs of acquiring new interests. The costs of drilling exploration wells are initially capitalised pending the determination of the success of the well. Costs are expensed where the well does not result in a successful discovery. Costs incurred before the Group has obtained the legal rights to explore an area are recognised in profit or loss.
Exploration and evaluation expenditure is partially or fully capitalised where either: (i) the expenditure is expected to be recouped through successful development and exploitation of the area of interest (or alternatively, by its sale); or (ii) exploration and evaluation activities in the area of interest have not at the reporting date reached a stage which permits a reasonable assessment of the existence or otherwise of economically recoverable reserves, and active and significant operations in, or in relation to, the area of interest are continuing, or where both conditions are met.
Upon approval for the commercial development of a project, the accumulated expenditure is transferred to oil and gas development assets.
(ii) Oil and gas-development assetsThe costs of oil and gas assets in the development phase are separately accounted for and include costs transferred from exploration and evaluation, and all development drilling and other subsurface expenditure.
Oil and gas-development assets are assessed annually for indicators of impairment. Any impairment is recognised in profit or loss. No amortisation is provided, in respect of oil and gas-development assets, until they are reclassified as oil and gas-producing assets. When production commences, the accumulated expenditure is transferred to oil and gas-producing assets.
(iii) Mining licencesThe costs of acquiring mining licences are capitalised as intangible assets. The licence costs of unsuccessful efforts are deemed impaired and charged to profit or loss when the decision to abandon an area of interest or licence is made. No amortisation is provided in respect of the licence costs of successful efforts, until the licence area is reclassified as an oil and gas-producing asset.
Licence costs of successful efforts are reclassified to oil and gas-producing assets when the wells contained within the licence area enter commercial production.
(iv) Oil and gas-producing and other oil and gas assetsThe costs of oil and gas assets in production are separately accounted for and include costs transferred from exploration and evaluation expenditure, transferred development expenditure and the ongoing costs of continuing to develop reserves for production. These costs are subject to depreciation, depletion and amortisation in accordance with the policy outlined below.
Land and buildings and surface plant and equipment associated with oil and gas-producing assets are recorded in the other land and buildings and other plant and equipment categories respectively.
With the exception of oil and gas-producing assets (including land), depreciation is charged to profit or loss on a straight-line basis over the estimated useful life of each part of an item of property, plant and equipment. The carrying values of oil and gas producing assets are amortised on a units-of-production basis using the proven reserves (P90) to which they relate.
The units of production basis is an accounting method where the provision for depreciation, depletion and amortisation is computed at a fixed rate per unit of product, based on an estimate of the total number of units the oil and gas property will produce during its service life.
Proven reserves (P90) are the estimated quantities of oil and gas which geological and engineering data demonstrate with reasonable certainty to be recoverable in future years from known reservoirs, under existing economic
Page 71
Genesis Energy Annual Report 2010

and operating conditions. Proven and probable (P50) reserves are defined as those which have a 50 per cent chance or better of being technically and economically producible.
Estimated useful lifeBuildings 50 years
Storage facilities 25 years
Sales pipelines 25 years
Motor vehicles 5 years
Freehold land is not depreciated
(q) Intangible assetsIntangible assets include goodwill, research and development, computer software, naming rights and emissions units.
Assets with indefinite useful lives are not amortised but are tested at least annually for impairment and whenever there is an indication that the asset may be impaired. Where there is an active market for an intangible asset, the asset is recorded at a revalued amount, being fair value less any subsequent accumulated amortisation and subsequent accumulated impairment losses. Revaluations are completed for each intangible asset, not for a class of asset.
Realised gains and losses arising from disposal of intangible assets are recognised in profit or loss in the period in which the transaction occurs. Unrealised gains and losses arising from changes in the value of intangible assets are recognised as at balance date. To the extent that a gain reverses a loss previously charged to profit or loss, the gain is credited to profit or loss. Otherwise, gains are credited to an asset revaluation reserve for that asset. To the extent that there is a balance in the asset revaluation reserve for the intangible asset, a revaluation loss is debited to the reserve. Otherwise, losses are reported in profit or loss.
(i) GoodwillGoodwill arising on the acquisition of a subsidiary or a jointly controlled entity represents the excess of the cost of acquisition over the Group’s interest in the net fair value of the identifiable assets, liabilities and contingent liabilities of the subsidiary or jointly controlled entity recognised at the date of acquisition. Goodwill is initially recognised as an asset at cost and is subsequently measured at cost less any accumulated impairment losses. Goodwill is not amortised but is reviewed for impairment at least.
For the purpose of impairment testing, goodwill is allocated to each of the Group’s cash-generating units expected to benefit from the synergies of the combination. Cash-generating units to which goodwill has been allocated are tested for impairment annually, or more frequently when there is an indication that the unit may be impaired. The recoverable amount of the cash-generating unit is less than the carrying amount of the unit; the impairment loss is allocated first to reduce the carrying amount of any goodwill allocated to the unit and then of the other assets of the unit pro rata on the basis of the
carrying amount of each asset in the unit. Any impairment loss is recognised immediately in the profit or loss and is not reversed in a subsequent period.
On disposal of a subsidiary or jointly controlled entity, the attributable amount of goodwill is included in the determination of the profit or loss on disposal.
The Group’s policy for goodwill arising on the acquisition of an associate is described at 2(b) and impairment testing of the carrying amount of an associate is described at 2(g) above.
(ii) Research and developmentExpenditure on research activities, undertaken with the prospect of obtaining new scientific or technical knowledge and understanding, is recognised in profit or loss as an expense when it is incurred. Expenditure incurred on research of an internally generated intangible asset is expensed when it is incurred. Where the research phase cannot be distinguished from the development phase, the expenditure is expensed when it is incurred.
The cost of an internally generated intangible asset represents expenditure incurred in the development phase of the asset only. The development phase occurs after the following can be demonstrated: technical feasibility; ability to complete the asset; intention and ability to sell or use; and development expenditure that can be reliably measured.
Other development expenditure is recognised in profit or loss as an expense as incurred. Capitalised development expenditure is stated at cost less accumulated amortisation and accumulated impairment losses. Amortisation is calculated using the straight-line method to allocate the cost over the period of the expected benefit.
(iii) Computer softwareAcquired computer software licences are capitalised on the basis of the costs incurred to acquire and bring to use the specific software. These costs are amortised to profit or loss on a straight-line basis over their estimated useful lives (not exceeding four years).
Costs associated with developing or maintaining computer software programmes are recognised as expenses as incurred. Costs that are directly associated with the production of identifiable and unique software products controlled by the Group, and that will probably generate economic benefits exceeding costs beyond one year, are recognised as intangible assets. Direct costs include the software development employee costs and an appropriate portion of relevant overheads.
Computer software development costs recognised as assets are amortised to profit or loss on a straight-line basis over their estimated useful lives (not exceeding four years).
(iv) EmissionsEmissions units are purchased (or granted by the Crown) to offset the Group’s emissions obligation.
Emissions units held are treated as intangible assets and initially recorded at fair value.
Fair value is cost in the case of purchased units or their initial market value in the case of government-granted units. Emissions units are not revalued subsequent to initial recognition.
The difference between cost and fair value of government granted units is treated as revenue.
Emissions obligations are recognised as a current liability. An emissions liability is recognised when the Group incurs the emissions obligation. Up to the level of units held, the liability is recorded at the average cost of emissions units held on hand. When emissions obligations exceed the level of units held, the net liability is measured at the market price of units, or the contract price where forward contracts exist.
Forward contracts for the purchase of emissions units are recognised when the contracts are settled and the units are received (on an accruals basis) as they are contracts for the delivery of non-financial items to meet the Group’s expected emissions obligations.
Financial instruments including contracts for differences and future price options in relation to emissions units are accounted for in line with the Group’s accounting policy for derivatives.
Emissions units receivable from, or payable to, third parties pursuant to commercial agreements are accounted for in the period in which they are earned or the obligation has been incurred.
(r) Trade and other payablesTrade and other accounts payable are recognised when the Group becomes obligated to make future payments resulting from the purchase of goods and services, and are subsequently carried at amortised cost.
(s) BorrowingsBorrowings are initially recognised at fair value, net of transaction costs incurred. Borrowings are subsequently measured at amortised cost. Any difference between the proceeds (net of transaction costs) and the redemption amount is recognised in profit or loss over the period of the borrowings using the effective interest method.
Borrowings are classified as current liabilities unless the Group has an unconditional right to defer settlement of the liability for at least 12 months after the balance sheet date.
(t) Finance costsFinance costs include origination, commitment and transaction fees and are amortised to profit or loss as part of finance costs over the period of the borrowings using the effective interest-rate method, unless such costs relate to capital work in progress.
Financing costs on capital work in progress and other qualifying assets that take a substantial period of time to construct or prepare for use or sale, are capitalised during the construction period. Investment income earned on the temporary investment of specific borrowings pending their expenditure on qualifying assets is deducted from the borrowing costs eligible for capitalisation.
Page 72
Genesis Energy Annual Report 2010

Costs cease to be capitalised when the asset is available for productive use. Depreciation of these assets on the same basis as for other assets commences when the assets are ready for their intended use.
The capitalisation rate used to determine the amount of borrowing costs to be capitalised is the weighted average interest rate applicable to the Group’s outstanding borrowings during the year. The weighted average interest rate is disclosed in note 18.
All other finance costs are recognised in profit or loss in the period in which they are incurred.
(i) Interest expenseInterest expense is accrued using the effective interest-rate method. The effective interest rate discounts estimated future cash payments through the expected life of the financial liability to that liability’s net carrying amount. The method applies this rate to the principal outstanding to determine interest expense for each period.
(u) ProvisionsProvisions for legal claims and service warranties are recognised when: the Group has a present legal or constructive obligation as a result of past events; it is more likely than not that an outflow of resources will be required to settle the obligation; and the amount has been reliably estimated. Provisions are not recognised for future operating losses.
Where there is a number of similar obligations, the likelihood that an outflow will be required in settlement is determined by considering the class of obligations as a whole. A provision is recognised even if the likelihood of an outflow with respect to any one item included in the same class of obligations may be small.
Liabilities and provisions to be settled beyond 12 months are recorded at their present value. Provisions are re-assessed at each balance date. Changes in the present value of cash flow estimates are recognised in profit or loss. The provisions are reduced by expenditure incurred relating to the provision.
(i) Provision for mitigation costsA provision for mitigation costs is recognised when the Group has a legal or constructive obligation. The provision is based upon contractual commitments over the shorter of the contract period or the life of the resource consent.
(ii) Provision for rehabilitation and restorationA provision for rehabilitation is recognised when the Group has a legal obligation or has publicly announced its intended rehabilitation policy for a particular site. The provision is based on an independent engineering report as to the appropriate action to rehabilitate each site. The provision is stated at the present value of the future net cash outflows expected to be incurred.
(v) Employee benefitsProvision is made for benefits accruing to employees in respect of wages and salaries, annual leave, long service leave and employee incentives when it is probable that settlement will be required and they are capable of being measured reliably.
Provisions made in respect of employee benefits are measured using the remuneration rate expected to apply at the time of settlement.
(w) Contributed equityOrdinary shares are classified as equity.
(x) DividendsProvision is made for the amount of any dividend declared on or before the end of the financial year but not distributed at balance date.
(y) Resource consentsCosts incurred in obtaining resource consents are capitalised and recognised as part of the cost of property, plant and equipment. These costs are amortised over the life of the consent on a straight-line basis commencing from the date that the resource consent is granted.
(z) Financial liabilitiesFinancial liabilities that are classified as held-for-trading and financial liabilities designated at fair value through profit or loss are recorded at fair value with any realised and unrealised gains or losses recognised in profit or loss. A financial liability is classified in this category if acquired principally for the purpose of selling in the short term or if so designated by management to eliminate or reduce accounting mismatches. It is part of financial assets and financial liabilities managed at fair value. Gains or losses reported in profit or loss include any interest component. Transaction costs are expensed as they are incurred.
Other financial liabilities are recognised initially at fair value less transaction costs and subsequently measured at amortised cost using the effective interest-rate method (refer finance costs policy).
(aa) Contingent assets and liabilitiesContingent assets and liabilities are recorded in the notes to the financial statements at the point at which the contingency is evident. Contingent liabilities are disclosed if the possibility that they will crystallise is not remote. Contingent assets are disclosed if it is probable that the benefits will be realised.
(ab) Statement of cash flowsThe following are the definitions of the terms used in the statement of cash flows:
• Cash is considered to be cash on hand and current accounts in banks, net of bank overdrafts;
• Investing activities are those activities relating to the acquisition, holding and disposal of property, plant and equipment and of investments;
• Financing activities are those activities that result in changes in the size and composition of the capital structure of the Group; this includes both equity and debt not falling within the definition of cash; and
• Operating activities include all transactions and other events that are not investing or financing activities.
3. Adoption of new and revised Accounting Standards and InterpretationsThe following are the new and revised Accounting Standards and interpretations adopted during the year.
(a) Those with measurement impactNo Standards and Amendments adopted have impacted on the measurement of items provided in these financial statements.
(b) Those with disclosure impactThe impact of the adoption of the following Standards and Amendments has been to expand the disclosures provided in these financial statements:
Name Impact
NZ IAS 1 Presentation of Financial Statements (revised 2007)
This has introduced terminology changes (including revised titles for the financial statements) and changes in the format and content of the financial statements.
NZ IFRS 8 Operating Segments This is a disclosure Standard that has resulted in a redesignation of the Group’s reportable segments (see note 6).
Amendments to NZ IFRS 7 Financial Instruments: Disclosures
The amendments to NZ IFRS 7 expand the disclosures required in respect of fair value measurements and liquidity risk. The Group has elected not to provide comparative information for these expanded disclosures in the current year despite the transitional provisions offered in these amendments allowing it not to.
Amendments to NZ IAS 24 Related Party Disclosures
This Standard is effective for annual reporting periods beginning on or after 1 January 2011. The Group early adopted the revised Standard. The revised Standard simplifies the disclosure requirements for entities that are controlled, jointly controlled or significantly influenced by the Crown (Crown-related entities) and clarifies the definition of a related party. This resulted in less disclosure on transactions between the entity and the Crown (see note 31).
Page 73
Genesis Energy Annual Report 2010

(c) Those with no impactAdoption of the following Standards, Interpretations and Amendments has not led to any changes in the Group’s accounting policies with measurement or recognition impact on the periods presented in these financial statements:
Name Impact
NZ IFRS 2 Share-based Payment Vesting Conditions and Cancellations
The amendments clarify the definition of vesting conditions for the purposes of NZ IFRS 2, introduce the concept of non-vesting conditions and clarify the accounting treatment for cancellations.
NZ IFRS 3 (revised 2008) and NZ IAS 27 (revised 2008)
The revised NZ IFRS 3 and NZ IAS 27 together change the accounting for business combinations. The revised NZ IFRS 3 and revised NZ IAS 27 are to be applied prospectively to business combinations and changes in control in reporting periods beginning on or after 1 July 2009. Accordingly, no restatements will be required in respect of transactions prior to the date of adoption.
NZ IFRS 3 Business Combinations (revised 2008) Key changes to NZ IFRS 3 affect the recognition and measurement rules for pre-existing contracts, costs incurred in a business combination and the recalculation of goodwill for business combinations achieved in stages. The revised NZ IFRS 3 also provides two options for measurement of minority interest, requires the reassessment and designation of existing contractual arrangements, and requires subsequent changes to the initial measurement of contingent consideration to be recognised in profit or loss.
Amendments to NZ IAS 27 Consolidated and Separate Financial Statements – Cost of an Investment in a Subsidiary, Jointly Controlled Entity or Associate
Key changes to the revised NZ IAS 27 include the requirement to record changes in a parent’s ownership interest in a subsidiary that do not result in a loss of control within shareholders’ equity and the requirement upon loss of control of a subsidiary to remeasure to fair value the remaining investment in the former subsidiary. By consequential amendment to NZ IAS 28 and NZ IAS 31, the treatment required for loss of control is extended to investments in associates and joint ventures. The revised NZ IAS 27 also requires a parent to attribute the minority interest’s share of total comprehensive income to the minority interest even when this would result in the minority interest having a deficit balance.
NZ IFRS 4 Insurance Contracts – The Scope of Insurance Activities and Differential Reporting Concessions
The amendments have revised the scope to include entities which ‘issue insurance contracts’, rather than those which ‘undertake insurance or reinsurance activities’. This change has had no impact on the Group as it does not issue insurance contracts or undertake insurance or reinsurance activities.
NZ IFRS 23 Borrowing Costs (revised 2007) The principal change to the Standard was to eliminate the option to expense all borrowing costs when incurred. This change has led to no impact on these financial statements because it has always been the Group's accounting policy to capitalise borrowing costs on qualifying assets.
NZ IAS 32 and NZ IAS 1 Puttable Financial Instruments and Obligations Arising on Liquidation
The amendments to NZ IAS 32 amend the criteria for debt/equity classification by permitting certain puttable financial instruments and instruments (or components of instruments) that impose on an entity an obligation to deliver to another party a pro-rata share of the net assets of the entity only on liquidation, to be classified as equity, subject to specified criteria being met.
Improvements to NZ IFRS 2008 (excluding the amendment relating to loss of control of a subsidiary, which is not yet effective)
These improvements have led to a number of changes in the details of the Group's accounting policies – some of which are changes in terminology only, and some of which are substantive but have had no material effect on amounts reported.
NZ Specific Omnibus Amendments 2008-01 These amendments are minor in nature and have no impact on the Group.
NZ Specific Omnibus Amendments 2009-01 These amendments are minor in nature and have no impact on the Group.
NZ IFRIC 15 Agreements for the Construction of Real Estate
The Interpretation addresses how entities should determine whether an agreement for the construction of real estate is within the scope of NZ IAS 11 Construction Contracts or NZ IAS 18 Revenue and when revenue from the construction of real estate should be recognised. The requirements have not affected the Group as it does not undertake construction of real estate.
NZ IFRIC 16 Hedges of a Net Investment in a Foreign Operation
The Interpretation provides guidance on the detailed requirements for net investment hedge accounting designations. The Group does not have investments in foreign operations.
NZ IFRIC 17 Distribution of Non-cash Assets to Owners
The Interpretation clarifies when the dividend payable should be recognised and that it should be measured at fair value of the assets to be distributed. The Group undertakes no such distributions.
NZ IFRIC 18 Transfers of Assets from Customers The Interpretation provides guidance on situations where an entity receives an item of property, plant and equipment from customer and the entity uses the asset is used to provide ongoing services to the customer. The Group does not receive assets transferred from customers.
Page 74
Genesis Energy Annual Report 2010
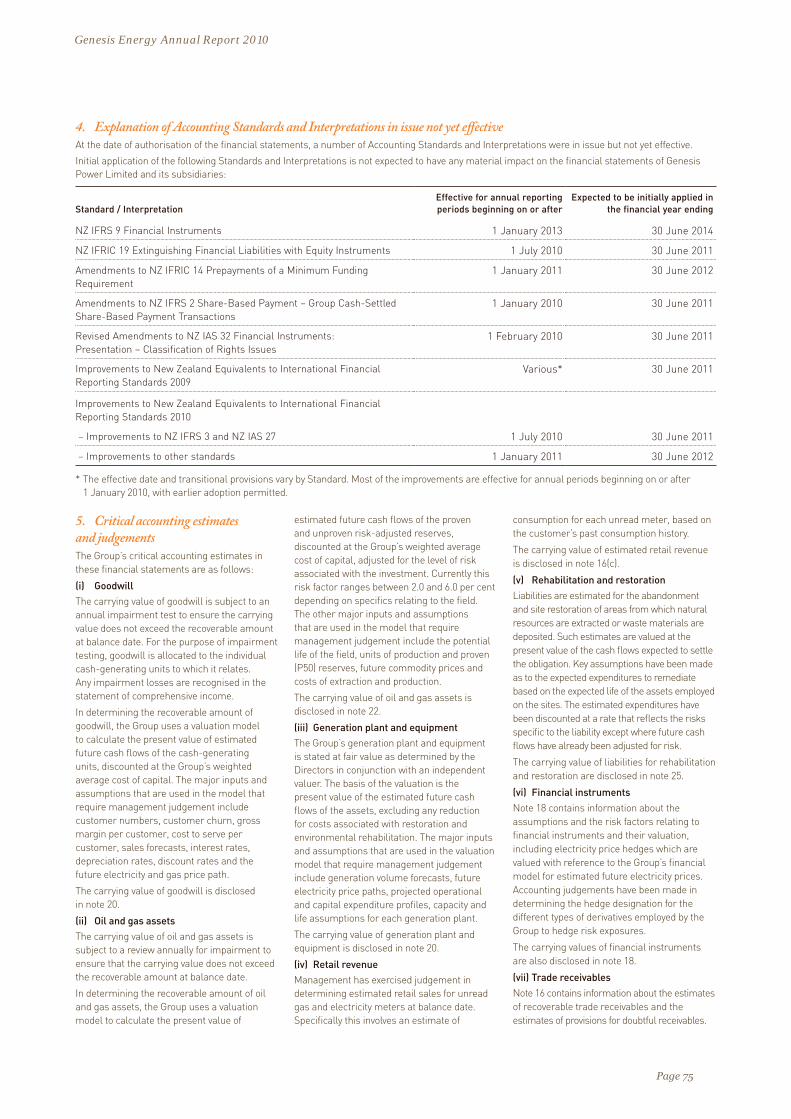
4. Explanation of Accounting Standards and Interpretations in issue not yet effectiveAt the date of authorisation of the financial statements, a number of Accounting Standards and Interpretations were in issue but not yet effective.
Initial application of the following Standards and Interpretations is not expected to have any material impact on the financial statements of Genesis Power Limited and its subsidiaries:
Standard / InterpretationEffective for annual reporting periods beginning on or after
Expected to be initially applied in the financial year ending
NZ IFRS 9 Financial Instruments 1 January 2013 30 June 2014
NZ IFRIC 19 Extinguishing Financial Liabilities with Equity Instruments 1 July 2010 30 June 2011
Amendments to NZ IFRIC 14 Prepayments of a Minimum Funding Requirement
1 January 2011 30 June 2012
Amendments to NZ IFRS 2 Share-Based Payment – Group Cash-Settled Share-Based Payment Transactions
1 January 2010 30 June 2011
Revised Amendments to NZ IAS 32 Financial Instruments: Presentation – Classification of Rights Issues
1 February 2010 30 June 2011
Improvements to New Zealand Equivalents to International Financial Reporting Standards 2009
Various* 30 June 2011
Improvements to New Zealand Equivalents to International Financial Reporting Standards 2010
– Improvements to NZ IFRS 3 and NZ IAS 27 1 July 2010 30 June 2011
– Improvements to other standards 1 January 2011 30 June 2012
* The effective date and transitional provisions vary by Standard. Most of the improvements are effective for annual periods beginning on or after 1 January 2010, with earlier adoption permitted.
5. Critical accounting estimates and judgementsThe Group’s critical accounting estimates in these financial statements are as follows:
(i) GoodwillThe carrying value of goodwill is subject to an annual impairment test to ensure the carrying value does not exceed the recoverable amount at balance date. For the purpose of impairment testing, goodwill is allocated to the individual cash-generating units to which it relates. Any impairment losses are recognised in the statement of comprehensive income.
In determining the recoverable amount of goodwill, the Group uses a valuation model to calculate the present value of estimated future cash flows of the cash-generating units, discounted at the Group’s weighted average cost of capital. The major inputs and assumptions that are used in the model that require management judgement include customer numbers, customer churn, gross margin per customer, cost to serve per customer, sales forecasts, interest rates, depreciation rates, discount rates and the future electricity and gas price path.
The carrying value of goodwill is disclosed in note 20.
(ii) Oil and gas assetsThe carrying value of oil and gas assets is subject to a review annually for impairment to ensure that the carrying value does not exceed the recoverable amount at balance date.
In determining the recoverable amount of oil and gas assets, the Group uses a valuation model to calculate the present value of
estimated future cash flows of the proven and unproven risk-adjusted reserves, discounted at the Group’s weighted average cost of capital, adjusted for the level of risk associated with the investment. Currently this risk factor ranges between 2.0 and 6.0 per cent depending on specifics relating to the field. The other major inputs and assumptions that are used in the model that require management judgement include the potential life of the field, units of production and proven (P50) reserves, future commodity prices and costs of extraction and production.
The carrying value of oil and gas assets is disclosed in note 22.
(iii) Generation plant and equipmentThe Group’s generation plant and equipment is stated at fair value as determined by the Directors in conjunction with an independent valuer. The basis of the valuation is the present value of the estimated future cash flows of the assets, excluding any reduction for costs associated with restoration and environmental rehabilitation. The major inputs and assumptions that are used in the valuation model that require management judgement include generation volume forecasts, future electricity price paths, projected operational and capital expenditure profiles, capacity and life assumptions for each generation plant.
The carrying value of generation plant and equipment is disclosed in note 20.
(iv) Retail revenueManagement has exercised judgement in determining estimated retail sales for unread gas and electricity meters at balance date. Specifically this involves an estimate of
consumption for each unread meter, based on the customer’s past consumption history.
The carrying value of estimated retail revenue is disclosed in note 16(c).
(v) Rehabilitation and restoration
Liabilities are estimated for the abandonment and site restoration of areas from which natural resources are extracted or waste materials are deposited. Such estimates are valued at the present value of the cash flows expected to settle the obligation. Key assumptions have been made as to the expected expenditures to remediate based on the expected life of the assets employed on the sites. The estimated expenditures have been discounted at a rate that reflects the risks specific to the liability except where future cash flows have already been adjusted for risk.
The carrying value of liabilities for rehabilitation and restoration are disclosed in note 25.
(vi) Financial instruments
Note 18 contains information about the assumptions and the risk factors relating to financial instruments and their valuation, including electricity price hedges which are valued with reference to the Group’s financial model for estimated future electricity prices. Accounting judgements have been made in determining the hedge designation for the different types of derivatives employed by the Group to hedge risk exposures.
The carrying values of financial instruments are also disclosed in note 18.
(vii) Trade receivables
Note 16 contains information about the estimates of recoverable trade receivables and the estimates of provisions for doubtful receivables.
Page 75
Genesis Energy Annual Report 2010

6. Segment reportingThe Group adopted NZ IFRS 8 Operating Segments on 1 July 2009 and has applied it retrospectively for the comparative periods presented.
This segment information is consistent with the management accounts that are reviewed monthly by the Group’s Chief Executive to make decisions about resources to be allocated to the segments and to assess performance. The same segments are reported monthly to the Chief Executive and the Board. Segment liabilities are not presented as they are not reported in the management accounts by segment. The segment information presented complies with the Group’s accounting policies.
The segments reported here have individual managers responsible for them. The segments are:
(i) Retail – Activities that are associated with the supply of energy (electricity, gas and LPG) to end-user customers as well as related services.
(ii) Production – Activities that are associated with the generation and trading of electricity and related products. The segment includes electricity sales to the wholesale electricity market, derivatives entered into to fix the price of electricity, and wholesale gas and coal sales.
(iii) Oil and Gas – Exploration, development, production and sale of gas, LPG and light oil.
(iv) Corporate – Head office functions including new generation investigation and development, fuel management, information systems, human resources, finance, corporate relations, property management, legal, corporate governance and the finance lease receivable relating to the Kinleith cogeneration plant. Corporate revenue is made up of finance lease income, property rental and miscellaneous income.
(a) Segment revenue
Year ended 30 June 2010
Retail $’000
Production $’000
Oil and Gas $’000
Corporate $’000
Total $’000
Electricity revenue 1,150,077 570,878 – – 1,720,955
Gas revenue 99,758 31,890 – – 131,648
Petroleum revenue – – 22,446 – 22,446
Other revenue 6,356 6,798 130 6,964 20,248
Revenue from external customers 1,256,191 609,566 22,576 6,964 1,895,297
Inter-segment revenue – 541,399 9,779 – 551,178
Total segment operating revenue 1,256,191 1,150,965 32,355 6,964 2,446,475
Year ended 30 June 2009
Retail $’000
Production $’000
Oil and Gas $’000
Corporate $’000
Total $’000
Electricity revenue 1,189,260 613,821 – – 1,803,081
Gas revenue 134,661 984 – – 135,645
Petroleum revenue – – – – –
Other revenue 6,403 4,178 43 7,783 18,407
Revenue from external customers 1,330,324 618,983 43 7,783 1,957,133
Inter-segment revenue – 594,021 – – 594,021
Total segment operating revenue 1,330,324 1,213,004 43 7,783 2,551,154
Reconciliation to reported operating revenue
30 June 2010 $’000
30 June 2009 $’000
Total segment operating revenue 2,446,475 2,551,154
Inter-segment revenue (551,178) (594,021)
Reported operating revenue 1,895,297 1,957,133
Sales between segments are based on transfer prices developed in the context of a long-term contract.
Page 76
Genesis Energy Annual Report 2010

(b) Segment result
Year ended 30 June 2010
Retail $’000
Production $’000
Oil and Gas $’000
Corporate $’000
Inter-segment items $’000
Total $’000
Profit (loss) before income tax 30,618 153,914 (7,600) (69,913) – 107,020
Items included in segment resultElectricity purchase, transmission and distribution (971,944) (413,590) – – 541,399 (844,135)
Gas purchase and transmission (93,924) (36,807) – – 69 (130,663)
Petroleum production, marketing and distribution – – (5,496) – – (5,496)
Fuel consumed – (342,697) – – 9,710 (332,987)
Depreciation, depletion and amortisation (6,902) (58,297) (16,368) (11,007) – (92,573)
Impairment – (11,446) 277 (8,023) – (19,193)
Other gains and losses 640 (3,171) (2,445) (589) – (5,565)
Loss on revaluation of property, plant and equipment
– – – – – –
Finance income 601 – 230 43,827 (42,454) 2,204
Finance expense (388) (2,274) (14,606) (51,914) 42,454 (26,728)
Equity-accounted gain (loss) of associate – – – 81 – 81
Year ended 30 June 2009
Retail $’000
Production $’000
Oil and Gas $’000
Corporate $’000
Inter-segment items $’000
Total $’000
Profit (loss) before income tax 42,643 (122,024) (11,293) (97,987) - (188,661)
Items included in segment resultElectricity purchase, transmission and distribution (1,019,354) (512,446) – – 594,021 (937,779)
Gas purchase and transmission (110,269) (921) – – – (111,190)
Petroleum production, marketing and distribution – – – – –
Fuel consumed – (344,752) – – – (344,752)
Depreciation, depletion and amortisation (7,934) (69,800) – (9,852) – (87,585)
Impairment (153) – (8,283) (17,387) – (25,824)
Other gains and losses (654) (5,570) 1,786 1,250 – (3,187)
Loss on revaluation of property, plant and equipment – (261,389) – – – (261,389)
Finance income 1,779 – 611 35,973 (34,166) 4,197
Finance expense (1,625) (2,804) (4,692) (42,378) 34,166 (17,333)
Equity-accounted gain (loss) of associate – – – 67 – 67
(c) Segment assets
Year ended 30 June 2010
Retail $’000
Production $’000
Oil and Gas $’000
Corporate $’000
Total $’000
Assets 254,309 1,644,649 555,473 77,893 2,532,324
Equity-accounted investments – – – – –
Capital expenditure 4,407 23,779 69,675 15,919 113,780
Year ended 30 June 2009
Retail $’000
Production $’000
Oil and Gas $’000
Corporate $’000
Total $’000
Assets 291,693 1,695,378 496,523 101,832 2,585,426
Equity-accounted investments – – – 791 791
Capital expenditure 3,960 46,452 149,132 27,283 226,827
Segment assets are disclosed net of inter-segment liabilities.
(d) Geographic informationAll business segments operate within New Zealand.
(e) Major customer informationThe Group has no individual customers that account for 10.0 per cent or more of the Group’s external revenue.
Page 77
Genesis Energy Annual Report 2010

7. Other revenue
Group 30 June 2010
$’000
Company 30 June 2010
$’000
Group 30 June 2009
$’000
Company 30 June 2009
$’000
Other operating revenue 9,310 9,310 8,857 8,857
Finance and operating lease income 7,324 795 7,879 779
Government grants 185 185 197 197
Dividends received – 30 – –
Miscellaneous income 3,429 3,429 1,474 1,474
20,248 13,749 18,407 11,307
8. Other operating costs
Note
Group 30 June 2010
$’000
Company 30 June 2010
$’000
Group 30 June 2009
$’000
Company 30 June 2009
$’000
Other operating costs include:Auditor’s remuneration
– Audit services 297 297 281 275
– Other assurance services* 41 41 48 48
Bad debts 9,415 8,994 9,253 8,712
Damages 11,300 11,300 10,000 10,000
Directors’ fees 491 491 514 514
Doubtful debts 16(a) 612 557 2,257 1,652
Donations 272 272 210 209
Employee benefits expense – defined contributions 1,692 1,692 1,440 1,440
Inventory write-downs 349 349 6,498 6,498
Rental expenses on operating leases 7,964 7,600 8,711 6,984
*During the year, the Auditor provided third-party assurance services in relation to the Company’s Annual Report.
9. Depreciation, depletion and amortisation expense
Note
Group 30 June 2010
$’000
Company 30 June 2010
$’000
Group 30 June 2009
$’000
Company 30 June 2009
$’000
Depreciation, depletion and amortisation expense includes:Depreciation of property, plant and equipment 20 61,222 61,075 70,891 70,746
Depreciation, depletion and amortisation of oil and gas assets 22 16,368 – – –
Amortisation of intangibles 21 11,242 11,035 12,735 12,557
Amortisation of finance lease receivable reset 3,741 – 3,959 –
92,573 72,110 87,585 83,303
Refer to note 16 for details regarding the finance lease receivable reset adjustment.
10. Impairment expense
Note
Group 30 June 2010
$’000
Company 30 June 2010
$’000
Group 30 June 2009
$’000
Company 30 June 2009
$’000
Impairment expense includes:Impairment of property, plant and equipment 20 15,498 15,495 9,342 6,512
Impairment of goodwill 21 1,354 – – –
Impairment and reversal of impairment of oil and gas assets 22 (280) 364 16,482 11,028
Impairment of other receivables 2,621 2,621 – –
Impairment of intercompany loans and investments 31 – 259 – 7,710
19,193 18,739 25,824 25,250
Page 78
Genesis Energy Annual Report 2010

11. Other gains (losses)
Group 30 June 2010
$’000
Company 30 June 2010
$’000
Group 30 June 2009
$’000
Company 30 June 2009
$’000
Net ineffective gains (losses) on cash flow hedges:
– Electricity contracts for difference 7 7 1 1
Net fair value gains (losses) on hedges at fair value through profit or loss:
– Electricity contracts for difference (1,988) (1,988) (7,019) (7,019)
– Oil options (1,747) – 3,496 –
– Bunker fuel price swaps (659) (659) 659 659
Fair value changes of financial instruments (4,387) (2,640) (2,863) (6,359)
Net gain (loss) on disposal of property, plant and equipment 65 79 851 851
Net gains (losses) on financial liabilities measured at amortised cost:
– Net realised foreign exchange gains (losses) (616) (827) 848 841
– Net unrealised foreign exchange gains (losses) (647) 266 (633) (307)
Net gain (loss) on acquisition of associate 20 370 (1,390) –
(5,565) (2,752) (3,187) (4,974)
12. Finance incomeInterest revenueInterest revenue is calculated using the effective interest-rate method. It comprises the following:
Group 30 June 2010
$’000
Company 30 June 2010
$’000
Group 30 June 2009
$’000
Company 30 June 2009
$’000
Bank deposits 2,193 233 4,176 3,479
Other loans and receivables (including advances to subsidiaries) 11 38,979 21 28,915
Interest revenue 2,204 39,212 4,197 32,394
13. Finance costs
Group 30 June 2010
$’000
Company 30 June 2010
$’000
Group 30 June 2009
$’000
Company 30 June 2009
$’000
Interest paid (a) 47,880 50,763 43,838 44,588
Other finance charges 3,586 3,093 2,527 2,298
Time value of money adjustments on provisions 1,410 884 1,200 1,200
52,876 54,740 47,565 48,086
Interest paid and other finance charges capitalised to assets (26,148) (284) (30,232) (1,317)
26,728 54,456 17,333 46,769
Weighted average capitalisation rate on borrowings 4.6% 0.0% 5.3% 0.2%
(a) Interest paidInterest paid is calculated using the effective interest-rate method. It comprises the following:
Group 30 June 2010
$’000
Company 30 June 2010
$’000
Group 30 June 2009
$’000
Company 30 June 2009
$’000
Interest on borrowings 46,411 46,411 41,026 41,026
Interest on finance lease liabilities 1,417 1,417 1,639 1,639
Interest on other loans and payables (including advances from subsidiaries) 52 2,935 1,173 1,923
Interest paid 47,880 50,763 43,838 44,588
Page 79
Genesis Energy Annual Report 2010

14. Income tax expense
(a) Income tax expense (income)
Group 30 June 2010
$’000
Company 30 June 2010
$’000
Group 30 June 2009
$’000
Company 30 June 2009
$’000
Current tax expense (income) 22,442 33,217 3,159 27,142
Deferred tax expense (income) – temporary differences 23,024 9,576 (56,183) (81,117)
Deferred tax expense (income) – change in corporate tax rate (5,162) (557) – –
Current tax expense (income) – under (over)-provided in prior years 5,115 3,592 79 83
Deferred tax expense (income) – under (over)-provided in prior years (7,713) (6,229) – –
Income tax expense (income) 37,706 39,599 (52,945) (53,892)
(b) Reconciliation of prima facie income tax expense on pre-tax accounting profit (loss) to income tax expense
Group 30 June 2010
$’000
Company 30 June 2010
$’000
Group 30 June 2009
$’000
Company 30 June 2009
$’000
Profit (loss) before income tax 107,020 99,507 (188,661) (199,383)
Income tax at 30.0 per cent 32,106 29,852 (56,598) (59,815)
Tax effect of adjustments:
– Non-taxable impairment of intercompany loans – 78 – 2,313
– Non-taxable impairment of goodwill 406 – – –
– Non-taxable gains (losses) on joint venture participation 24 – (417) –
– Non-deductible expenditure 300 300 3,000 3,000
– Non-deductible building depreciation 11,100 11,100
– Other adjustments 1,530 1,463 991 527
Change in corporate tax rate (5,162) (557) – –
Under (over)-provided in prior years (2,598) (2,637) 79 83
Income tax expense (income) 37,706 39,599 (52,945) (53,892)
Weighted average tax rate 35.2% 39.8% 28.1% 27.0%
The Budget 2010 contained two provisions which have had an impact on the Group and Company’s 2010 tax expense, namely:
– A decrease in the corporate income tax rate from 30.0 per cent to 28.0 per cent, effective from 1 July 2011. As a result of this change, deferred tax which is not expected to crystallise in the next 12 months has been restated to 28.0 per cent, as deferred tax is required to be recorded at the tax rate that will apply when the future tax liability/asset is expected to crystallise.
– The removal of tax depreciation on buildings with estimated useful lives of 50 years or more. The Group will no longer be able to claim tax depreciation on buildings from 1 July 2011. This has resulted in an increase in deferred tax liability in respect of buildings completed before May 2010.
(c) Imputation credits
Group 30 June 2010
$’000
Company 30 June 2010
$’000
Group 30 June 2009
$’000
Company 30 June 2009
$’000
Imputation credit accountBalance at beginning of year 244,166 226,613 261,422 243,869
Tax payments, net of refunds 3 3 7 7
Credits attached to dividend received 13 13 – –
Credits attached to dividend distributions (16,757) (16,757) (17,263) (17,263)
Balance at end of year 227,425 209,872 244,166 226,613
Imputation credits are available directly and indirectly to shareholders of the Company through:
Group 30 June 2010
$’000
Group 30 June 2009
$’000
Company 209,872 226,613
Subsidiaries 17,553 17,553
227,425 244,166
Page 80
Genesis Energy Annual Report 2010

15. Cash and cash equivalents
Group 30 June 2010
$’000
Company 30 June 2010
$’000
Group 30 June 2009
$’000
Company 30 June 2009
$’000
Cash at bank and on hand 17,064 6,925 28,017 6,659
Short-term deposits 8,400 8,400 – –
25,464 15,325 28,017 6,659
(a) Cash at bank and on handThe interest rate for cash at bank ranges from 0.0 per cent to 2.23 per cent per annum (2009: 0.0 per cent to 2.23 per cent).
(b) Fair valueRefer to note 18 below for the fair value analysis of the Group’s financial assets.
16. Trade and other receivables
Group 30 June 2010
$’000
Company 30 June 2010
$’000
Group 30 June 2009
$’000
Company 30 June 2009
$’000
Current assetsTrade receivables 193,828 172,238 231,592 216,664
Allowance for doubtful receivables (a) (10,628) (10,273) (10,092) (9,713)
183,200 161,965 221,500 206,951
Advances to subsidiaries – 377,214 – 370,713
Finance lease receivable (b) 10,643 – 9,901 –
Other receivables 7,590 6,945 4,991 4,987
Prepaid fuel 2,144 3,446 – –
Prepaid insurance 2,141 2,141 2,091 2,091
Other prepayments 2,190 2,140 2,704 2,652
207,908 553,851 241,187 587,394
Term assetsFinance lease receivable (b) 18,302 – 28,945 –
Other prepayments 252 252 2,698 2,698
18,554 252 31,643 2,698
All trade and other receivables, with the exception of prepayments, are classified as ‘loans and receivables’ under NZ IFRS 7.8 Financial Instruments: Disclosures.
Refer to note 31 for details regarding the nature, terms and conditions attached to the advances to subsidiaries and other related parties.
(a) Allowance for doubtful receivablesAn allowance has been made for estimated unrecoverable amounts as detailed below:
Movement in the allowance for doubtful receivables Note
Group 30 June 2010
$’000
Company 30 June 2010
$’000
Group 30 June 2009
$’000
Company 30 June 2009
$’000
Opening balance (10,092) (9,713) (9,079) (8,763)
Amounts written off (recovered) during the year 98 19 451 (91)
(Increase) decrease in allowance recognised in expenditure 8 (612) (557) (2,257) (1,652)
(Increase) decrease in allowance recognised against income (22) (22) 793 793
Closing balance (10,628) (10,273) (10,092) (9,713)
Page 81
Genesis Energy Annual Report 2010

Below is an analysis of the age of individually impaired receivables:
Age category
Group 30 June 2010
$’000
Company 30 June 2010
$’000
Group 30 June 2009
$’000
Company 30 June 2009
$’000
Current 2,137 2,024 1,121 1,066
0–30 days 780 678 1,006 831
30–60 days 756 673 1,025 936
60–90 days 556 521 775 745
›90 days 6,399 6,377 6,165 6,135
Total impaired receivables provided for 10,628 10,273 10,092 9,713
Below is the value of receivables past due date that have not been impaired or provided for in the allowance for doubtful receivables:
Age category
Group 30 June 2010
$’000
Company 30 June 2010
$’000
Group 30 June 2009
$’000
Company 30 June 2009
$’000
30–60 days 2,782 2,385 2,586 2,586
60–90 days 623 617 1,118 1,118
›90 days 2,344 2,324 2,024 2,024
Total receivables past due date not impaired or provided for 5,749 5,326 5,728 5,728
(b) Finance lease receivableThe Group has provided lease finance for a cogeneration plant. The lease is for a period of 15 years.
Finance lease receivable
Group 30 June 2010
$’000
Company 30 June 2010
$’000
Group 30 June 2009
$’000
Company 30 June 2009
$’000
Gross investment in finance lease:
Not later than one year 12,514 – 12,995 –
Later than one year and not later than two years 12,639 – 13,076 –
Later than two years and not later than five years 7,433 – 20,861 –
32,586 – 46,932 –
Unearned finance income (11,279) – (19,465) –
Present value of future minimum lease receipts 21,307 – 27,467 –
Unamortised finance lease receivable reset adjustment* 7,638 – 11,379 –
Net investment in finance lease 28,945 – 38,846 –
The present value of future minimum lease receipts may be analysed as follows:
Not later than one year 7,225 – 6,160 –
Later than one year and not later than two years 8,475 – 7,225 –
Later than two years and not later than five years 5,607 – 14,082 –
21,307 – 27,467 –
The net investment in finance lease may be analysed as follows:
Not later than one year 10,643 – 9,901 –
Later than one year and not later than two years 11,441 – 10,643 –
Later than two years and not later than five years 6,861 – 18,302 –
28,945 – 38,846 –
* On 1 April 1999, Kinleith Cogeneration Limited (a subsidiary company) purchased the finance lease receivable from the Electricity Corporation of New Zealand (ECNZ) at book value as at that date. The Group undertook a review of the net asset values of the assets purchased. This review resulted in an increase in the value of the finance lease receivable by $38.2 million, known as a reset adjustment. Since this date, the reset adjustment has been amortised to profit or loss over the remaining term of the lease, at a rate that results in the net investment in the finance lease approximating fair value.
Page 82
Genesis Energy Annual Report 2010

(c) Estimates for unread gas and electricity metersManagement has exercised judgement in determining estimated retail sales for unread gas and electricity meters, included in trade receivables at balance date. These estimates have been summarised below:
Group 30 June 2010
$’000
Company 30 June 2010
$’000
Group 30 June 2009
$’000
Company 30 June 2009
$’000
Estimates for unread gas and electricity meters 70,843 62,600 90,044 77,082
(d) Fair valuesRefer to note 18 below for the fair value analysis of the Group’s financial assets.
(e) Interest-rate risk exposuresRefer to note 18 below for the Group’s exposure to interest rates on financial assets.
17. InventoriesGroup
30 June 2010 $’000
Company 30 June 2010
$’000
Group 30 June 2009
$’000
Company 30 June 2009
$’000
Fuel stock 107,419 107,419 86,645 86,645
Petroleum production stock 949 16 – –
Consumables and spare parts 18,362 18,362 17,656 17,656
126,730 125,797 104,301 104,301
During the year the Group wrote down consumables and spares inventory by $0.3 million (2009: $6.5 million).
18. Financial instruments(a) Fair value of derivative financial instrumentsThe fair values of the significant types of derivative financial instruments outstanding as at balance date together with the designation of their hedging relationship are summarised below:
Group 30 June 2010
$’000
Company 30 June 2010
$’000
Group 30 June 2009
$’000
Company 30 June 2009
$’000
Current assetsInterest-rate swap contracts Cash flow hedge 861 861 – –
Foreign exchange contracts Cash flow hedge 234 255 1,347 1,347
Electricity contracts for difference Cash flow hedge 17 17 2,765 2,765
Electricity contracts for difference and swaptions Fair value hedge 1,417 1,417 908 908
Oil options Fair value hedge 522 522 846 846
Bunker fuel price swaps Fair value hedge – – 659 659
Total current derivative financial instrument assets 3,051 3,072 6,525 6,525
Non current assetsInterest-rate swap contracts Cash flow hedge 692 692 – –
Foreign exchange contracts Cash flow hedge 89 89 – –
Electricity contracts for difference Cash flow hedge – – 90 90
Electricity contracts for difference and swaptions Fair value hedge 85 85 342 342
Oil options Fair value hedge 2,300 2,300 3,723 3,723
Total non current derivative financial instrument assets 3,166 3,166 4,155 4,155
Total derivative financial instrument assets 6,217 6,238 10,680 10,680
Current liabilitiesInterest-rate swap contracts Cash flow hedge – – (13,205) (13,205)
Foreign exchange contracts Cash flow hedge (658) (658) (2,716) (2,768)
Electricity contracts for difference Cash flow hedge (391) (391) (2,515) (2,515)
Electricity contracts for difference and swaptions Fair value hedge (1,070) (1,070) (1,592) (1,592)
Oil options Fair value hedge – (522) – (846)
Total current derivative financial instrument liabilities (2,119) (2,641) (20,028) (20,926)
Page 83
Genesis Energy Annual Report 2010

Group 30 June 2010
$’000
Company 30 June 2010
$’000
Group 30 June 2009
$’000
Company 30 June 2009
$’000
Non current liabilitiesInterest-rate swap contracts Cash flow hedge – – (1,148) (1,148)
Foreign exchange contracts Cash flow hedge (772) (772) (545) (545)
Electricity contracts for difference Cash flow hedge – – (12,146) (12,146)
Electricity contracts for difference and swaptions Fair value hedge (17,714) (17,714) (302) (302)
Oil options Fair value hedge – (2,300) – (3,723)
Total non current derivative financial instrument liabilities (18,486) (20,786) (14,141) (17,864)
Total derivative financial instrument liabilities (20,605) (23,427) (34,169) (38,790)
Total net financial instruments (14,388) (17,189) (23,489) (28,110)
(b) Fair valuesThe carrying amount of derivative financial assets and liabilities recorded in the financial statements approximates their fair values. The fair values of all other non-derivative financial assets and financial liabilities are disclosed in note 18(k) to the financial statements.
The fair values of financial assets and financial liabilities are determined as follows:
- The fair value of financial assets and financial liabilities with standard terms and conditions and traded on active liquid markets are determined with reference to quoted market prices.
- Where market prices are not available, use is made of estimated discounted cash flow analyses using the applicable yield curve or available forward price data for the duration of the instruments.
- Where the fair value of a derivative is calculated as the present value of the estimated future cash flows of the instrument, the two key types of variables used are:
(i) Future price curve (for the relevant underlying interest rates, foreign exchange rates or commodity prices)
(ii) Discount rates.
The selection of variables requires significant judgement, and therefore there is a range of reasonably possible assumptions in respect of these variables that could be used in estimating the fair value of these derivatives.
- Electricity derivativesElectricity derivatives are valued against forward electricity price paths. Other than for certain short-term electricity derivatives that are valued against a specific forward price curve that relates to those derivatives all other derivatives are valued against an internally generated electricity price path. The internally generated price paths incorporate assumptions relating to electricity demand, 77 years of historical hydrological inflow observations, existing and future generation plant and offer strategies for the respective plant. The electricity swaptions are valued by taking into account the internally generated price paths and assumptions on when the swaptions will be called based on the terms of the respective contracts. The terms of the contracts include minimum and maximum call volumes, the call duration, annual minimum call volumes, the treatment of emissions costs, escalation factors and the respective premiums and strike prices. Generally, the swaptions are deemed to be called when the internally generated price path is higher than are the strike prices after taking into account rules relating to the specific terms of each contract.
- Deferred ‘day 1’ gains (losses)A day 1 adjustment arises when an electricity derivative is entered into at a price that is different from its fair value. The day 1 adjustment is amortised by adjusting the future price path used to determine the fair value of electricity derivatives by a constant amount to return the initial fair value to nil. In the case of electricity swaption contracts, the valuation adjustment is amortised based on expected call volumes over the term of the contract. The carrying value of derivatives is disclosed net of the day 1 adjustments.
The following table details the movements in deferred day 1 gains (losses) included in the fair value of derivative financial assets and liabilities held at balance date:
Group 30 June 2010
$’000
Company 30 June 2010
$’000
Group 30 June 2009
$’000
Company 30 June 2009
$’000
Electricity derivativesOpening deferred day 1 gains (losses) (4,620) (4,620) 1,311 1,311
Deferred day 1 gains (losses) on new hedges 38,735 38,735 2,011 2,011
Deferred day 1 gains (losses) realised during the year 384 384 (7,942) (7,942)
Closing deferred ‘day 1’ gains (losses) 34,499 34,499 (4,620) (4,620)
Page 84
Genesis Energy Annual Report 2010

(c) Realised gain (losses) on derivative financial instrumentsThe net realised gains (losses) for the year on derivative financial instruments held at fair value through profit or loss are summarised below:
Group 30 June 2010
$’000
Company 30 June 2010
$’000
Group 30 June 2009
$’000
Company 30 June 2009
$’000
Derivative financial instrumentsInterest-rate swap contracts Cash flow hedge (9,329) (9,329) 7,756 7,810
Foreign exchange contracts Cash flow hedge (616) (827) – –
Electricity contracts for difference Cash flow hedge 13,752 13,752 22,054 22,054
Electricity contracts for difference and swaptions Fair value hedge 36,242 36,242 24 24
Oil options Fair value hedge – – – –
Bunker fuel price swaps Fair value hedge 725 725 215 215
(d) Financial risk-management objectives In the normal course of business, the Group is exposed to a variety of financial risks: market risk (including currency risk, interest-rate risk and price risk), credit risk and liquidity risk. The Group’s overall risk-management programme focuses on the unpredictability of financial markets and seeks to minimise potential adverse effects on the financial performance of the Group. The Group uses financial instruments to hedge these risk exposures.
Risk management is carried out by a central treasury function (Treasury) for interest rate, foreign exchange and oil price exposures. Risk-management activities in respect of the electricity exposures are undertaken by the Risk Management Group (Risk). Both Treasury and Risk operate under policies approved by the Board of Directors. Treasury and Risk identify, evaluate and hedge financial risks in close cooperation with the Group’s operating units. The Board policies provide documented principles for overall risk management, as well as policies covering specific areas, such as foreign exchange risk, interest-rate risk, electricity price risk, credit risk, use of derivative financial instruments and the investment of excess liquidity. Trading in financial instruments, including derivative financial instruments, for speculative purposes is not permitted by the Board. Compliance with policies and exposure limits is reviewed by the Company’s internal auditor.
(e) Capital risk management The Group manages its capital in a prudent manner to ensure that entities in the Group will be able to continue as going concerns while maximising the return to stakeholders through the appropriate balance of debt and equity. This strategy remains unchanged from previous years. The capital structure of the Group consists of debt, which includes the borrowings disclosed in note 24, cash and cash equivalents as disclosed in note 15 and equity attributable to the shareholders of Genesis Power Limited, comprising issued capital, reserves and retained earnings as disclosed in note 27.
Under the Group’s debt funding facilities the Group has given undertakings that the ratio of debt to equity will not exceed a prescribed level. This is monitored regularly to ensure continued compliance. There was no breach of these limits during the year.
(f ) Accounting policiesDetails of accounting policies and methods adopted, including the criteria for recognition, and the basis of measurement applied in respect of each class of financial asset and financial liability, are disclosed in note 2 to the financial statements.
(g) Market risk(i) Currency risk The Group is exposed to foreign currency risk as a result of transactions denominated in currencies other than the Group’s functional currency,
the New Zealand dollar (NZD). The currencies giving rise to this risk are primarily the United States dollar, Australian dollar, Euro, British pound sterling and the Japanese yen.
Currency risk arises from future commercial transactions (including the purchase of coal, capital equipment and maintenance and the sale of petroleum production) and recognised assets and liabilities.
The Group uses forward foreign exchange contracts to manage foreign exchange risk arising from future commercial transactions and recognised assets and liabilities. The net position in each foreign currency is managed within approved policy parameters.
– Foreign exchange contracts The following table details the forward foreign exchange contracts outstanding at balance date:
Outstanding contracts
Foreign amount 30 June 2010
’000
Foreign amount 30 June 2009
’000
Face value 30 June 2010
’000
Face value 30 June 2009
’000
Fair value 30 June 2010
’000
Fair value 30 June 2009
’000
Group– United States dollar 2,222 13,833 3,296 21,882 2 (593)
– Australian dollar 619 2,381 767 2,867 (9) 87
– Euro 784 2,356 1,610 5,287 (217) (177)
– Japanese yen 1,221,736 931,993 21,283 16,429 (883) (1,231)
Total forward foreign exchange contracts 26,956 46,465 (1,107) (1,914)
The fair value of forward foreign exchange contracts outstanding at balance date is made up of:
Current assets 234 1,347
Non current assets 89 –
Current liabilities (658) (2,716)
Non current liabilities (772) (545)
(1,107) (1,914)
Page 85
Genesis Energy Annual Report 2010

Outstanding contracts
Foreign amount 30 June 2010
’000
Foreign amount 30 June 2009
’000
Face value 30 June 2010
’000
Face value 30 June 2009
’000
Fair value 30 June 2010
’000
Fair value 30 June 2009
’000
Company– United States dollar 5,772 13,833 8,389 21,882 23 (593)
– Australian dollar 619 1,683 767 2,052 (9) 35
– Euro 784 2,356 1,610 5,287 (217) (177)
– Japanese yen 1,221,736 931,993 21,283 16,429 (883) (1,231)
Total forward foreign exchange contracts 32,049 45,650 (1,086) (1,966)
The fair value of forward foreign exchange contracts outstanding at balance date is made up of:
Current assets 255 1,347
Non current assets 89 –
Current liabilities (658) (2,768)
Non current liabilities (772) (545)
(1,086) (1,966)
The hedged transactions denominated in foreign currency are expected to occur at various dates through to August 2011. The effective portion of fair value gains and losses on qualifying forward foreign exchange contracts as at balance date, that are recognised in the cash flow hedge reserve in equity, will be released to profit or loss or added to the cost of any asset acquired. This will occur when the cash flow from the underlying anticipated transactions is recognised. During the year, no hedges were de-designated and all underlying forecast transactions remain highly probable to occur as originally forecast.
– Sensitivity analysisThe following table summarises the impact of increases/decreases in foreign exchange rates on the Group’s post-tax profit for the year and on other components of equity. The sensitivity analysis is based on the assumption that the New Zealand dollar had weakened/strengthened by 10.0 per cent against the currencies with which the Group has foreign currency risk, with all other variables held constant. A positive number represents an increase in profit or equity.
Post-tax impact on profit Post-tax impact on cash flow hedge reserve (equity)
Group 30 June 2010 +/–10% $’000
Company 30 June 2010 +/–10% $’000
Group 30 June 2010
+10% $’000
Group 30 June 2010
–10% $’000
Company 30 June 2010
+10% $’000
Company 30 June 2010
–10% $’000
– United States dollar - - (214) 263 (549) 672
– Australian dollar - - (49) 60 (49) 60
– Euro - - (91) 111 (91) 111
– Japanese yen - - (1,332) 1,637 (1,332) 1,637
Total foreign exchange contracts - - (1,686) 2,071 (2,021) 2,480
Post-tax impact on profit Post-tax impact on cash flow hedge reserve (equity)
Group 30 June 2009 +/–10% $’000
Company 30 June 2009 +/–10% $’000
Group 30 June 2009
+10% $’000
Group 30 June 2009
–10% $’000
Company 30 June 2009
+10% $’000
Company 30 June 2009
–10% $’000
– United States dollar - - (1,350) 1,653 (1,350) 1,653
– Australian dollar - - (187) 228 (132) 161
– Euro - - (324) 397 (324) 397
– Japanese yen - - (963) 1,180 (963) 1,180
Total foreign exchange contracts - - (2,824) 3,458 (2,769) 3,391
There have been no changes in the methods and assumptions used in the sensitivity calculations from the previous year.
(ii) Price risk The Group is exposed to commodity price risk primarily from electricity and oil prices. To manage its commodity price risk in respect of electricity,
the Group utilises electricity contracts for difference and swaptions to hedge against electricity spot price exposure. These instruments are either traded on the energy hedge market or negotiated bilaterally with counterparties. Electricity derivatives are valued against market and internally generated price curves. To manage the commodity price risk in respect of oil sales, the Group utilises oil price options which provides a minimum price for future oil sales.
Page 86
Genesis Energy Annual Report 2010

– Electricity derivatives The aggregate notional face value of the outstanding electricity derivatives at balance date was $236.6 million (2009: $321.0 million).
The hedged electricity sale and purchase transactions are expected to occur continuously for each half-hour period. The effective portion of fair value gains and losses on qualifying electricity derivatives as of balance date, recognised in the cash flow hedge reserve in equity, will be continuously released to the statement of comprehensive income in each period in which the underlying sale transactions are recognised.
During 2010, the Company entered into a five-year electricity derivative contract giving the right to a counterparty to exercise a call option. The exercise period during each of the five years is from April to October. The baseload quantity for the first year is 50MW and for the next four years is 200MW.
During 2008, the Company entered into a five-year derivative contract giving the right to a counterparty to exercise a call option. When called, the contract has minimum and maximum call volumes. In addition, there is a minimum call volume for the term of the contract and minimum annual call volumes. Any shortfall in the minimum annual and term volumes is subject to wash-up provisions.
– Oil options The aggregate notional value of the outstanding oil options at balance date was USD42,000,000 (2009: USD55,999,800).
The hedged anticipated oil sale transactions are expected to occur continuously over the term of the contracts to June 2014. Fair value gains and losses on oil options are recognised in profit or loss in each period in which the fair value gains and losses occur.
– Bunker fuel price swaps The aggregate notional value of the outstanding bunker fuel price swaps at balance date was USDNil (2009: USD767,250).
The transactions to which the bunker fuel price swaps related occurred continuously for the period of July 2009 to December 2009. Fair value gains and losses on bunker fuel price swaps were recognised in profit or loss in each period in which the fair value gains and losses occurred.
– Sensitivity analysis The following table summarises the impact of increases/decreases in the relevant forward prices (for commodities) on the Group’s post-tax
profit for the year and on other components of equity. The sensitivity analysis is based on the assumption that the relevant market prices (future electricity, oil and bunker fuel price paths) had increased/decreased by 10.0 per cent with all other variables held constant. A positive number represents an increase in profit or other equity.
Post-tax impact on profit
Group 30 June 2010
+10% $’000
Group 30 June 2010
–10% $’000
Company 30 June 2010
+10% $’000
Company 30 June 2010
–10% $’000
Electricity contracts for difference and swaptions (32,454) 31,040 (32,454) 31,040
Oil options (483) 684 – –
Post-tax impact on cash flow hedge reserve (equity)
Group 30 June 2010
+10% $’000
Group 30 June 2010
–10% $’000
Company 30 June 2010
+10% $’000
Company 30 June 2010
–10% $’000
Electricity contracts for difference (1,889) 92 (1,889) 92
Post-tax impact on profit
Group 30 June 2009
+10% $’000
Group 30 June 2009
–10% $’000
Company 30 June 2009
+10% $’000
Company 30 June 2009
–10% $’000
Electricity contracts for difference and swaptions (18,075) 17,127 (18,075) 17,127
Oil options (735) 1,031 – –
Bunker fuel price swaps 128 (128) 128 (128)
Post-tax impact on cash flow hedge reserve (equity)
Group 30 June 2009
+10% $’000
Group 30 June 2009
–10% $’000
Company 30 June 2009
+10% $’000
Company 30 June 2009
–10% $’000
Electricity contracts for difference (2,737) 2,735 (2,737) 2,735
Post-tax profit for the year would increase or decrease due to:
– the Group’s risk-management policy requiring hedging of less than 100.0 per cent of forecast future purchases and sales of commodities; and
– some derivative instruments that are valid economic hedges of these commodity price risks not achieving hedge accounting under NZ IAS 39 requirements.
Retained earnings would increase/decrease as a result of the hedging instruments that do not qualify for cash flow hedge accounting under NZ IAS 39.
There have been no changes in the methods and assumptions used in the sensitivity calculations from the previous year.
(iii) Interest-rate risk The Group is exposed to interest-rate risk as it borrows funds at floating interest rates. This risk is managed through the use of interest-rate
swap contracts.
Page 87
Genesis Energy Annual Report 2010

– Interest rate swaps The following table details the notional principal amounts and the remaining terms of interest-rate swap contracts outstanding at balance date:
Average contracted fixed interest rates Notional principal amount Fair Value Fair value
Floating to fixed contracts
30 June 2010 %
30 June 2009 %
30 June 2010 $’000
30 June 2009 $’000
30 June 2010 $’000
30 June 2009 $’000
GroupNot later than one year – 7.78 – 100,000 – (2,718)
Later than one year and not later than two years
– 8.30 – 70,000 – (5,022)
Later than two years and not later than five years
– 8.16 – 70,000 – (6,613)
Later than five years 8.10 – 25,000 – 1,553 –
8.10 8.04 25,000 240,000 1,553 (14,353)
The fair value of interest-rate swap contracts outstanding at balance date is made up of:
Fair Value 30 June 2010
$’000
Fair value 30 June 2009
$’000
Current assets 861 –
Non current assets 692 –
Current liabilities – (13,205)
Non current liabilities – (1,148)
1,553 (14,353)
Average contracted fixed interest rates Notional principal amount Fair Value Fair value
Floating to fixed contracts
30 June 2010 %
30 June 2009 %
30 June 2010 $’000
30 June 2009 $’000
30 June 2010 $’000
30 June 2009 $’000
CompanyNot later than one year – 7.78 – 100,000 – (2,718)
Later than one year and not later than two years
– 8.30 – 70,000 – (5,022)
Later than two years and not later than five years
– 8.16 – 70,000 – (6,613)
Later than five years 8.10 – 25,000 – 1,553 –
8.10 8.04 25,000 240,000 1,553 (14,353)
The fair value of interest-rate swap contracts outstanding at balance date is made up of:
Current assets 861 –
Non current assets 692 –
Current liabilities – (13,205)
Non current liabilities – (1,148)
1,553 (14,353)
The average contracted fixed interest rates include the relevant bank margins.
The hedged anticipated interest payment transactions are expected to occur at various dates between one month and six years from balance date. Cash flows relating to the borrowings and the interest-rate swaps are settled quarterly. The effective portion of fair value gains and losses on qualifying interest-rate swap contracts, recognised in the cash flow hedge reserve in equity as of balance date, will be continuously realised in profit or loss in each period in which interest payments are recognised until maturity of the underlying borrowings.
– Sensitivity analysis The following table summarises the impact of increases/decreases of interest rates on the Group’s post-tax profit for the year and on other
components of equity. The sensitivity analysis is based on the assumption that interest rates had been 100 basis points higher/lower with all other variables held constant. A positive number represents an increase in profit or other equity.
Page 88
Genesis Energy Annual Report 2010

Post-tax impact on profit Post-tax impact on cash flow hedge reserve (equity)
Group 30 June 2010 +/–1% $’000
Company 30 June 2010 +/–1% $’000
Group 30 June 2010
+1% $’000
Group 30 June 2010
–1% $’000
Company 30 June 2010
+1% $’000
Company 30 June 2010
–1% $’000
Interest-rate swap contracts – – 1,018 (949) 1,018 (949)
Post-tax impact on profit Post-tax impact on cash flow hedge reserve (equity)
Group 30 June 2009 +/–1% $’000
Company 30 June 2009 +/–1% $’000
Group 30 June 2009
+1% $’000
Group 30 June 2009
–1% $’000
Company 30 June 2009
+1% $’000
Company 30 June 2009
–1% $’000
Interest-rate swap contracts – – 2,242 (2,316) 2,242 (2,316)
There have been no changes in the methods and assumptions used in the sensitivity calculations from the previous year.
(h) Credit riskCredit risk refers to the risk that a counterparty will default on its contractual obligations, resulting in financial loss to the Group. The Group is exposed to credit risk in the normal course of business arising from trade receivables, finance leases (where the Group is lessor), and with banks and financial institutions where deposits are held. The Group is also exposed to credit risk arising from electricity derivative counterparties defaulting on their contractual obligations.
The Group has adopted a policy of dealing only with credit-worthy trade counterparties and obtaining collateral, where appropriate, as a means of mitigating the risk of financial loss from defaults. The Group minimises its exposure to credit risk from trade receivables through the adoption of counterparty credit limits. Derivative counterparties and cash transactions are limited to high-credit-quality financial institutions and other organisations. The Group’s exposure and the credit ratings of its counterparties are continuously monitored and the aggregate value of transactions concluded are spread amongst approved counterparties.
As a participant in the electricity market, the Group is a generator and retailer of electricity. The Group’s exposure to credit risk is therefore reduced significantly to the net position on settlement. Market security requirements in place ensure that there is no significant credit risk for any one participant.
The Group does not have any significant credit risk exposure to any single counterparty or any group of counterparties having similar characteristics. Concentration of credit risk with respect to trade receivables is limited due to the Group’s large customer base in a diverse range of industries throughout New Zealand. The Group has no significant concentration of credit risk with any one financial institution.
The carrying amounts of financial assets recognised in the balance sheet best represents the Group’s maximum exposure to credit risk at the reporting date without taking account of the value of any collateral obtained.
The value of collateral held at balance date was $3.7 million (2009: $4.2 million).
(i) Liquidity riskThe Group’s ability to readily attract cost-effective funding is largely driven by its credit standing.
Prudent liquidity risk management implies maintaining sufficient cash and marketable securities, the availability of funding through an adequate amount of committed credit facilities and the spreading of debt maturities.
Liquidity risk is monitored by continuously forecasting cash flows and matching the maturity profiles of financial assets and liabilities.
The following table details the Group’s liquidity analysis for its derivative financial instruments. The table has been drawn up based on the undiscounted net cash inflows (outflows) on the derivative instruments that settle net and gross undiscounted cash inflows (outflows) where these instruments settle gross. Where the amount payable or receivable is not fixed, the amount disclosed has been determined by reference to the internally generated forward price curves existing at balance date. The difference between this table and 18(a) is due to discounting of future cash flows.
Group
Less than one year
$’000
One to two years
$’000
Two to five years
$’000
More than five years
$’000Total
$’000
Year ended 30 June 2010
Interest-rate swap contracts 2,663 1,427 4,273 1,571 9,934
Foreign exchange contracts (429) (710) – – (1,139)
Electricity contracts for difference and swaptions 14,104 (10,668) (19,856) – (16,420)
16,338 (9,951) (15,583) 1,571 (7,625)
Group
Less than one year
$’000
One to two years
$’000
Two to five years
$’000
More than five years
$’000Total
$’000
Year ended 30 June 2009
Interest-rate swap contracts (13,685) (8,853) (6,245) – (28,783)
Foreign exchange contracts (1,395) (565) – – (1,960)
Electricity contracts for difference and swaptions 1,958 (4,097) (11,938) – (14,077)
Bunker fuel price swaps 664 – – – 664
(13,122) (13,515) (18,183) – (44,820)
Page 89
Genesis Energy Annual Report 2010

Company
Less than one year
$’000
One to two years
$’000
Two to five years
$’000
More than five years
$’000Total
$’000
Year ended 30 June 2010
Interest-rate swap contracts 2,663 1,427 4,273 1,571 9,934
Foreign exchange contracts (407) (710) – – (1,117)
Electricity contracts for difference and swaptions 14,104 (10,668) (19,856) – (16,420)
16,360 (9,951) (15,583) 1,571 (7,603)
Company
Less than one year
$’000
One to two years
$’000
Two to five years
$’000
More than five years
$’000Total
$’000
Year ended 30 June 2009
Interest-rate swap contracts (13,685) (8,853) (6,245) – (28,783)
Foreign exchange contracts (1,447) (565) – – (2,012)
Electricity contracts for difference and swaptions 1,958 (4,097) (11,938) – (14,077)
Bunker fuel price swaps 664 – – – 664
(13,174) (13,515) (18,183) – (44,872)
(j) Financial asset and liability interest-rate risk and contractual repricing or maturitiesThe following tables set out the Group’s exposure to interest-rate risk and the contractual repricing or maturity dates for its non-derivative financial assets and liabilities. The tables have been drawn up based on the undiscounted cash flows of financial assets and liabilities.
Group
Weighted average effective
interest rate %
Less than one year
$’000
One to two years
$’000
Two to five years
$’000
More than five years
$’000Total
$’000
Year ended 30 June 2010
Financial assets
Cash and cash equivalents Varying 25,464 – – – 25,464
Trade and other receivables Non-bearing 190,790 – – – 190,790
Finance lease receivable 19.2 12,514 12,639 7,433 – 32,586
Other financial assets Non-bearing – – – – –
Total financial assets 228,768 12,639 7,433 – 248,840
Financial liabilities
Trade and other payables Non-bearing 203,928 – – – 203,928
Revolving credit borrowings 3.8 113,821 – – – 113,821
Wholesale term notes 7.1 15,420 12,584 37,650 232,680 298,334
Retail term notes 7.8 22,463 17,610 160,809 110,935 311,817
Finance lease payable 7.1 3,310 3,424 9,280 334 16,348
Total financial liabilities 358,942 33,618 207,739 343,949 944,248
Group
Weighted average effective
interest rate %
Less than one year
$’000
One to two years
$’000
Two to five years
$’000
More than five years
$’000Total
$’000
Year ended 30 June 2009
Financial assets
Cash and cash equivalents Varying 28,017 – – – 28,017
Trade and other receivables Non-bearing 226,491 – – – 226,491
Finance lease receivable 19.2 12,995 13,076 20,861 – 46,932
Other financial assets Non-bearing – – – 791 791
Total financial assets 267,503 13,076 20,861 791 302,231
Financial liabilities
Trade and other payables Non-bearing 243,494 – – – 243,494
Money market borrowings 4.1 4,300 – – – 4,300
Revolving credit borrowings 7.1 179,955 78,608 195,794 105,000 559,357
Wholesale term notes 7.2 6,990 5,407 16,237 86,955 115,589
Finance lease payable 7.1 3,348 3,595 11,063 1,801 19,807
Total financial liabilities 460,708 105,172 393,116 313,089 1,272,085Page 90
Genesis Energy Annual Report 2010

Company
Weighted average effective
interest rate %
Less than one year
$’000
One to two years
$’000
Two to five years
$’000
More than five years
$’000Total
$’000
Year ended 30 June 2010
Financial assets
Cash and cash equivalents Varying 15,325 – – – 15,325
Trade and other receivables Non-bearing 168,910 – – – 168,910
Advances to subsidiaries 8.2 377,214 – – – 377,214
Other financial assets Non-bearing – – – 29,842 29,842
Total financial assets 561,449 – – 29,842 591,291
Financial liabilities
Trade and other payables Non-bearing 187,584 – – – 187,584
Revolving credit borrowings 3.8 113,821 – – – 113,821
Wholesale term notes 7.1 15,420 12,584 37,650 232,680 298,334
Retail term notes 7.8 22,463 17,610 160,809 110,935 311,817
Finance lease payables 7.1 3,310 3,424 9,280 334 16,348
Total financial liabilities 342,598 33,618 207,739 343,949 927,904
Company
Weighted average effective
interest rate %
Less than one year
$’000
One to two years
$’000
Two to five years
$’000
More than five years
$’000Total
$’000
Year ended 30 June 2009
Financial assets
Cash and cash equivalents Varying 6,659 – – – 6,659
Trade and other receivables Non-bearing 211,938 – – – 211,938
Advances to subsidiaries 7.9 370,713 – – – 370,713
Other financial assets Non-bearing – – – 30,253 30,253
Total financial assets 589,310 – – 30,253 619,563
Financial liabilities
Trade and other payables Non-bearing 219,075 – – – 219,075
Money market borrowings 4.1 4,300 – – – 4,300
Revolving credit borrowings 7.1 179,955 78,608 195,794 105,000 559,357
Wholesale term notes 7.2 6,990 5,407 16,237 86,955 115,589
Retail term notes 7.8 22,621 17,562 170,022 119,333 329,538
Finance lease payable 7.1 3,348 3,595 11,063 1,801 19,807
Total financial liabilities 436,289 105,172 393,116 313,089 1,247,666
The weighted average effective interest rate incorporates the effect of the relevant derivative contracts.
The information presented in the table about the Group’s exposure to interest-rate risk includes the contractual repricing dates or the maturity dates, whichever dates are earliest.
Page 91
Genesis Energy Annual Report 2010

(k) Financial asset and liability fair valuesThe following tables set out the fair values of the Group’s non-derivative financial assets and liabilities:
Group
Group 30 June 2010
Total carrying value $’000
Group 30 June 2010
Fair value $’000
Group 30 June 2009 Total carrying
value $’000
Group 30 June 2009
Fair value $’000
Financial assets
Cash and cash equivalents 25,464 25,464 28,017 28,017
Trade and other receivables 190,790 190,790 226,491 226,491
Finance lease receivable 28,945 29,886 38,846 41,957
Other financial assets – – 791 791
Total financial assets 245,199 246,140 294,145 297,256
Financial liabilities
Trade and other payables 203,928 203,928 243,494 243,494
Money market borrowings – – 4,300 4,300
Revolving credit borrowings 112,000 112,000 297,608 297,608
Wholesale term notes 197,338 197,870 76,433 76,581
Retail term notes 226,694 229,901 226,176 227,608
Finance lease payables 16,348 16,348 19,807 19,807
Total financial liabilities 756,308 760,047 867,818 869,398
Company
Company 30 June 2010
Total carrying value $’000
Company 30 June 2010
Fair value $’000
Company 30 June 2009 Total carrying
value $’000
Company 30 June 2009
Fair value $’000
Financial assets
Cash and cash equivalents 15,325 15,325 6,659 6,659
Trade and other receivables 168,910 168,910 211,938 211,938
Advances to subsidiaries 377,214 377,214 370,713 370,713
Other financial assets 29,842 29,842 30,253 30,253
Total financial assets 591,291 591,291 619,563 619,563
Financial liabilities
Trade and other payables 187,584 187,584 219,075 219,075
Money market borrowings – – 4,300 4,300
Revolving credit borrowings 112,000 112,000 297,608 297,608
Wholesale term notes 197,338 197,870 76,433 76,581
Retail term notes 226,694 229,901 226,176 227,608
Finance lease payables 16,348 16,348 19,807 19,807
Total financial liabilities 739,964 743,703 843,399 844,979
The Company’s investment in its unlisted subsidiaries is measured at cost which, for the purposes of this financial report, is assumed to approximate its fair value.
Page 92
Genesis Energy Annual Report 2010

(l) Financial asset and liability fair value hierarchyThe following tables provide an analysis of financial instruments that are measured subsequent to initial recognition at fair value, grouped into Levels one to three based on the degree to which the fair value is observable:
Level one – the fair value is determined using quoted prices (unadjusted) from an active market for identical assets and liabilities. A market is regarded as active if quoted prices are readily and regularly available from an exchange, dealer, broker, industry group, pricing service or regulatory agency, and those prices represent actual and regularly occurring market transactions on an arm’s-length basis.
Level two – the fair value is derived from inputs other than quoted prices included within Level one that are observable for the asset or liability, either directly (i.e. as prices) or indirectly (i.e. derived from prices). Financial instruments in Level two include forward foreign exchange derivatives, interest-rate derivatives and certain short-term electricity derivatives.
Level three – the fair value is derived from inputs that are not based on observable market data. Financial instruments included in Level three include electricity derivatives which are valued using internally generated electricity price paths. :
GroupLevel one
$’000Level two
$’000Level three
$’000Total
$’000
As at 30 June 2010Financial assets
Derivative financial instruments
– Interest-rate swap contracts – 1,553 – 1,553
– Foreign exchange contracts – 323 – 323
– Electricity contracts for difference – – 17 17
– Electricity contracts for difference and swaptions – – 1,502 1,502
– Oil options – 2,822 – 2,822
Total derivative financial instrument assets – 4,698 1,519 6,217
Financial liabilities
Derivative financial instruments
– Foreign exchange contracts – (1,430) – (1,430)
– Electricity contracts for difference – – (391) (391)
– Electricity contracts for difference and swaptions – – (18,784) (18,784)
Total derivative financial instrument liabilities – (1,430) (19,175) (20,605)
GroupLevel one
$’000Level two
$’000Level three
$’000Total
$’000
As at 30 June 2009Financial assets
Derivative financial instruments
– Foreign exchange contracts – 1,347 – 1,347
– Electricity contracts for difference – – 2,855 2,855
– Electricity contracts for difference and swaptions – – 1,250 1,250
– Oil options – 4,569 – 4,569
– Bunker fuel price swaps – 659 – 659
Total derivative financial instrument assets – 6,575 4,105 10,680
Financial liabilities
Derivative financial instruments
– Interest-rate swap contracts – (14,353) – (14,353)
– Foreign exchange contracts – (3,261) – (3,261)
– Electricity contracts for difference – – (14,661) (14,661)
– Electricity contracts for difference and swaptions – – (1,894) (1,894)
Total derivative financial instrument liabilities – (17,614) (16,555) (34,169)
Page 93
Genesis Energy Annual Report 2010
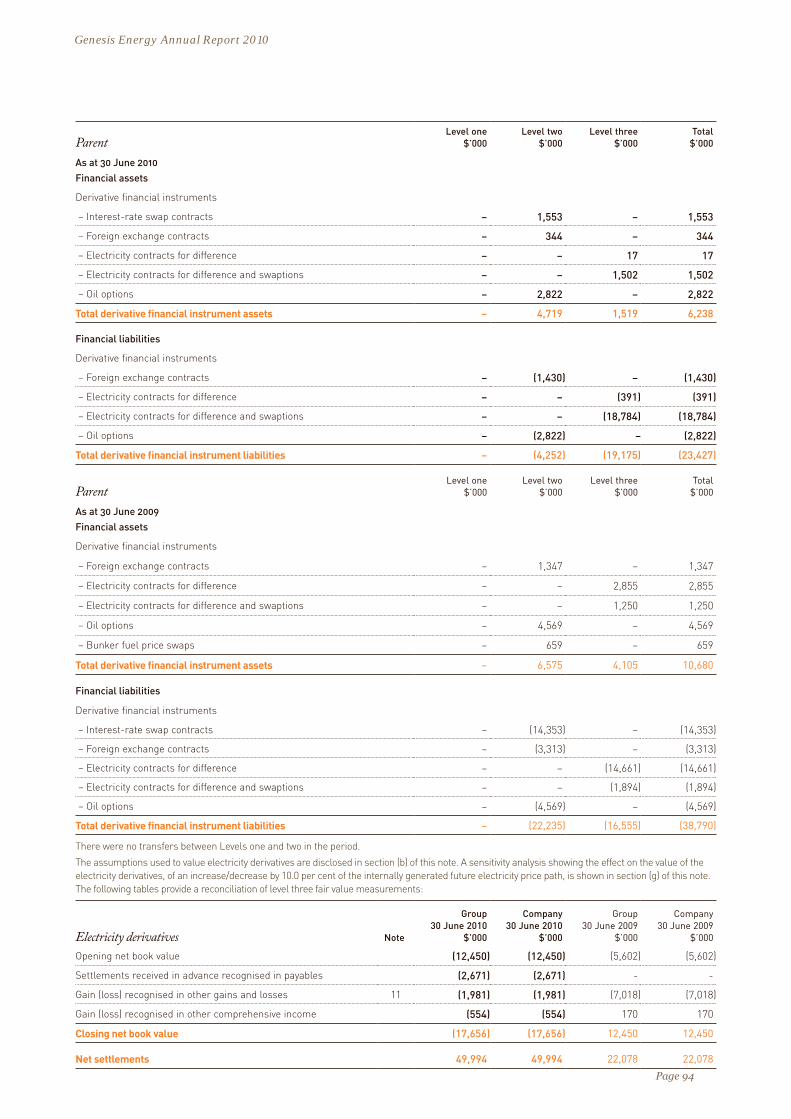
ParentLevel one
$’000Level two
$’000Level three
$’000Total
$’000
As at 30 June 2010Financial assets
Derivative financial instruments
– Interest-rate swap contracts – 1,553 – 1,553
– Foreign exchange contracts – 344 – 344
– Electricity contracts for difference – – 17 17
– Electricity contracts for difference and swaptions – – 1,502 1,502
– Oil options – 2,822 – 2,822
Total derivative financial instrument assets – 4,719 1,519 6,238
Financial liabilities
Derivative financial instruments
– Foreign exchange contracts – (1,430) – (1,430)
– Electricity contracts for difference – – (391) (391)
– Electricity contracts for difference and swaptions – – (18,784) (18,784)
– Oil options – (2,822) – (2,822)
Total derivative financial instrument liabilities – (4,252) (19,175) (23,427)
ParentLevel one
$’000Level two
$’000Level three
$’000Total
$’000
As at 30 June 2009Financial assets
Derivative financial instruments
– Foreign exchange contracts – 1,347 – 1,347
– Electricity contracts for difference – – 2,855 2,855
– Electricity contracts for difference and swaptions – – 1,250 1,250
– Oil options – 4,569 – 4,569
– Bunker fuel price swaps – 659 – 659
Total derivative financial instrument assets – 6,575 4,105 10,680
Financial liabilities
Derivative financial instruments
– Interest-rate swap contracts – (14,353) – (14,353)
– Foreign exchange contracts – (3,313) – (3,313)
– Electricity contracts for difference – – (14,661) (14,661)
– Electricity contracts for difference and swaptions – – (1,894) (1,894)
– Oil options – (4,569) – (4,569)
Total derivative financial instrument liabilities – (22,235) (16,555) (38,790)
There were no transfers between Levels one and two in the period.
The assumptions used to value electricity derivatives are disclosed in section (b) of this note. A sensitivity analysis showing the effect on the value of the electricity derivatives, of an increase/decrease by 10.0 per cent of the internally generated future electricity price path, is shown in section (g) of this note. The following tables provide a reconciliation of level three fair value measurements:
Electricity derivatives Note
Group 30 June 2010
$’000
Company 30 June 2010
$’000
Group 30 June 2009
$’000
Company 30 June 2009
$’000
Opening net book value (12,450) (12,450) (5,602) (5,602)
Settlements received in advance recognised in payables (2,671) (2,671) - -
Gain (loss) recognised in other gains and losses 11 (1,981) (1,981) (7,018) (7,018)
Gain (loss) recognised in other comprehensive income (554) (554) 170 170
Closing net book value (17,656) (17,656) 12,450 12,450
Net settlements 49,994 49,994 22,078 22,078
Page 94
Genesis Energy Annual Report 2010

19. Other financial assets
Group 30 June 2010
$’000
Company 30 June 2010
$’000
Group 30 June 2009
$’000
Company 30 June 2009
$’000
Investments accounted for at historical cost:
Shares in unlisted subsidiaries (a) – 29,842 – 29,753
Shares in unlisted associates (b) – – – 500
Investments accounted for using the equity method:
Investments in unlisted associates (b) – – 791 -
– 29,842 791 30,253
(a) Investments in unlisted subsidiariesThe consolidated financial statements incorporate the assets, liabilities and results of the following subsidiaries in accordance with the accounting policy described in note 2(b).
Interest held by Company
Name of entity
2010 %
2009 %
Principal activity
Country of incorporation
Genesis Power Investments Limited 100 100 Holding company New Zealand
Energy Online Limited 100 100 Energy retailer New Zealand
Kinleith Cogeneration Limited 100 100 Special purpose finance company New Zealand
Kupe Holdings Limited 100 100 Joint venture holding company New Zealand
GP No. 1 Limited 100 100 Joint venture holding company New Zealand
GP No. 2 Limited 100 100 Joint venture holding company New Zealand
GP No. 4 Limited 100 100 Joint venture holding company New Zealand
GP No. 5 Limited 100 100 Joint venture holding company New Zealand
Cardiff Holdings No. 1 Limited 100 100 Joint venture holding company New Zealand
Cardiff Holdings No. 2 Limited 100 100 Joint venture holding company New Zealand
Slopedown Wind Farm Limited 100 – Wind farm development company New Zealand
Mangatoa No. 1 Limited – 100 Non-trader New Zealand
Mangatoa No. 2 Limited – 100 Non-trader New Zealand
Mangatoa No. 3 Limited – 100 Non-trader New Zealand
Mangatoa No. 4 Limited – 100 Non-trader New Zealand
Mangatoa No. 5 Limited – 100 Non-trader New Zealand
All subsidiaries have 30 June balance dates.
Movements in the carrying value of investments in subsidiaries are set out below:
Company 30 June 2010
$’000
Company 30 June 2009
$’000
Opening net book value 29,753 29,753
Acquisition of shares in new subsidiaries 1,442 –
Acquisition of shares in existing subsidiaries 22,019 –
Impairment of subsidiary investments (23,372) –
Closing net book value 29,842 29,753
During the year, the Company acquired 100.0 per cent of the share capital of Slopedown Wind Farm Limited. The investment was subsequently impaired in the Parent Company. The acquisition resulted in goodwill arising on consolidation of $1.4 million which was also impaired. Refer note 19.
During the year, Cardiff No. 1 Limited, Cardiff No. 2 Limited and GP No. 4 Limited subsidiaries issued additional share capital of $22.0 million to the Parent Company. The additional share investments were subsequently impaired. Refer note 31.
During the year, the Group amalgamated the Mangatoa subsidiaries into Genesis Power Investments Limited. The amalgamation had no impact on the financial results presented as the subsidiaries were previously non-trading.
Page 95
Genesis Energy Annual Report 2010

(b) Investments in unlisted associatesThe consolidated financial statements incorporate the Group’s share of its associates’ results in accordance with the accounting policy described in note 2(b) .
Interest held by Company
Name of entity
2010 %
2009 %
Principal activity
Country of incorporation
Gasbridge Limited 50 50 Agency for joint venture New Zealand
CRL Energy Limited - 50 Research company New Zealand
Energyhedge Limited 20 - Electricity futures market developer New Zealand
The associates have 30 June balance dates.
Movements in the carrying value of investments in associates are set out below:
Group 30 June 2010
$’000
Company 30 June 2010
$’000
Group 30 June 2009
$’000
Company 30 June 2009
$’000
Opening net book value 791 500 724 500
Acquisitions – at cost 8 8 – –
Share of associates net profit (loss) after tax 81 – 67 –
Sale of associate (880) (500) – –
Impairment of investment – (8) – –
Closing net book value – – 791 500
Investments in associates include no amount for goodwill (2009: Nil).
The Group’s share of capital expenditure commitments relating to the associates are included in capital commitments disclosed in note 30.
Summarised financial information in respect of the Group’s share of associates is set out below:
2010 $’000
2009 $’000
Current assets 30 640
Non current assets - 608
Total assets 30 1,248
Current liabilities (43) (457)
Non current liabilities - -
Total liabilities (43) (457)
Group’s share of net assets of associates (13) 791
Revenue 2,195 2,236
Expenses (2,079) (2,128)
Profit before income tax 116 108
Income tax expense (35) (41)
Group’s share of associate profit for the year 81 67
The unrecognised share of net losses of the associates amounts to $13,000 (2009: Nil).
During the year, the Company disposed of its 50.0 per cent share in CRL Energy Limited resulting in a loss on sale of $320,000.
During the year, the Company acquired a 20.0 per cent share in Energyhedge Limited for $8,000.
Page 96
Genesis Energy Annual Report 2010
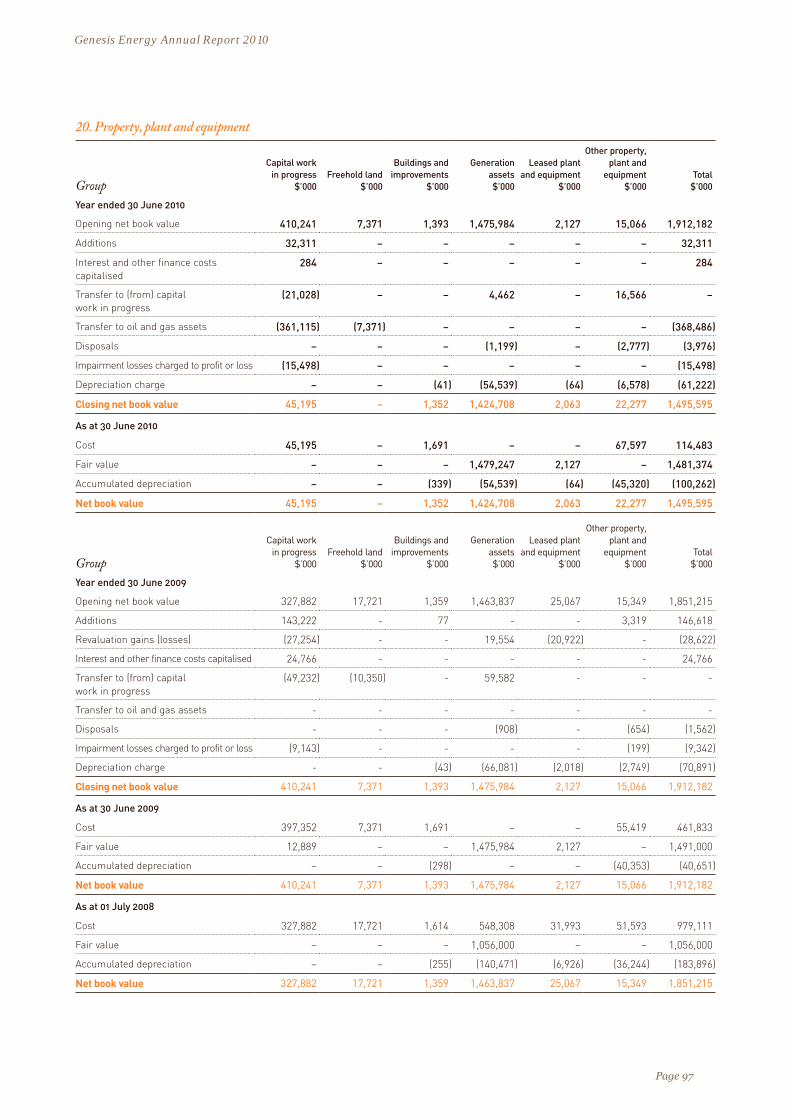
20. Property, plant and equipment
Group
Capital work in progress
$’000Freehold land
$’000
Buildings and improvements
$’000
Generation assets $’000
Leased plant and equipment
$’000
Other property, plant and
equipment $’000
Total $’000
Year ended 30 June 2010
Opening net book value 410,241 7,371 1,393 1,475,984 2,127 15,066 1,912,182
Additions 32,311 – – – – – 32,311
Interest and other finance costs capitalised
284 – – – – – 284
Transfer to (from) capital work in progress
(21,028) – – 4,462 – 16,566 –
Transfer to oil and gas assets (361,115) (7,371) – – – – (368,486)
Disposals – – – (1,199) – (2,777) (3,976)
Impairment losses charged to profit or loss (15,498) – – – – – (15,498)
Depreciation charge – – (41) (54,539) (64) (6,578) (61,222)
Closing net book value 45,195 – 1,352 1,424,708 2,063 22,277 1,495,595
As at 30 June 2010
Cost 45,195 – 1,691 – – 67,597 114,483
Fair value – – – 1,479,247 2,127 – 1,481,374
Accumulated depreciation – – (339) (54,539) (64) (45,320) (100,262)
Net book value 45,195 – 1,352 1,424,708 2,063 22,277 1,495,595
Group
Capital work in progress
$’000Freehold land
$’000
Buildings and improvements
$’000
Generation assets $’000
Leased plant and equipment
$’000
Other property, plant and
equipment $’000
Total $’000
Year ended 30 June 2009
Opening net book value 327,882 17,721 1,359 1,463,837 25,067 15,349 1,851,215
Additions 143,222 - 77 - - 3,319 146,618
Revaluation gains (losses) (27,254) - - 19,554 (20,922) - (28,622)
Interest and other finance costs capitalised 24,766 - - - - - 24,766
Transfer to (from) capital work in progress
(49,232) (10,350) - 59,582 - - -
Transfer to oil and gas assets - - - - - - -
Disposals - - - (908) - (654) (1,562)
Impairment losses charged to profit or loss (9,143) - - - - (199) (9,342)
Depreciation charge - - (43) (66,081) (2,018) (2,749) (70,891)
Closing net book value 410,241 7,371 1,393 1,475,984 2,127 15,066 1,912,182
As at 30 June 2009
Cost 397,352 7,371 1,691 – – 55,419 461,833
Fair value 12,889 – – 1,475,984 2,127 – 1,491,000
Accumulated depreciation – – (298) – – (40,353) (40,651)
Net book value 410,241 7,371 1,393 1,475,984 2,127 15,066 1,912,182
As at 01 July 2008
Cost 327,882 17,721 1,614 548,308 31,993 51,593 979,111
Fair value – – – 1,056,000 – – 1,056,000
Accumulated depreciation – – (255) (140,471) (6,926) (36,244) (183,896)
Net book value 327,882 17,721 1,359 1,463,837 25,067 15,349 1,851,215
Page 97
Genesis Energy Annual Report 2010

Company
Capital work in progress
$’000Freehold land
$’000
Buildings and improvements
$’000
Generation assets $’000
Leased plant and equipment
$’000
Other property, plant and
equipment $’000
Total $’000
Year ended 30 June 2010
Opening net book value 49,126 – 1,393 1,475,984 2,127 14,212 1,542,842
Additions 30,766 – – – – – 30,766
Interest and other finance costs capitalised
284 – – – – – 284
Transfer to (from) capital work in progress
(19,486) – – 4,462 – 15,024 –
Disposals – – – (1,199) – (2,762) (3,961)
Impairment losses charged to profit or loss (15,495) – – – – – (15,495)
Depreciation charge – – (41) (54,539) (64) (6,431) (61,075)
Closing net book value 45,195 – 1,352 1,424,708 2,063 20,043 1,493,361
As at 30 June 2010
Cost 45,195 – 1,691 – – 64,913 111,799
Fair value – – – 1,479,247 2,127 – 1,481,374
Accumulated depreciation – – (339) (54,539) (64) (44,870) (99,812)
Net book value 45,195 – 1,352 1,424,708 2,063 20,043 1,493,361
CompanyYear ended 30 June 2009
Capital work in progress
$’000Freehold land
$’000
Buildings and improvements
$’000
Generation assets $’000
Leased plant and equipment
$’000
Other property, plant and
equipment $’000
Total $’000
Opening net book value 70,478 10,350 1,359 1,463,771 25,067 14,465 1,585,490
Additions 60,130 – 77 – – 3,270 63,477
Revaluation gains (losses) (27,254) – – 19,554 (20,922) – (28,622)
Interest and other finance costs capitalised 1,317 – – – – – 1,317
Transfer to (from) capital work in progress (49,232) (10,350) – 59,582 – – –
Disposals – – – (908) – (654) (1,562)
Impairment losses charged to profit or loss (6,313) – – – – (199) (6,512)
Depreciation charge – – (43) (66,015) (2,018) (2,670) (70,746)
Closing net book value 49,126 – 1,393 1,475,984 2,127 14,212 1,542,842
As at 30 June 2009
Cost 36,237 – 1,691 – – 53,919 91,847
Fair value 12,889 – – 1,475,984 2,127 – 1,491,000
Accumulated depreciation – – (298) – – (39,707) (40,005)
Net book value 49,126 – 1,393 1,475,984 2,127 14,212 1,542,842
As at 01 July 2008
Cost 70,478 10,350 1,614 548,242 31,993 50,208 712,885
Fair value – – – 1,056,000 – – 1,056,000
Accumulated depreciation – – (255) (140,471) (6,926) (35,743) (183,395)
Net book value 70,478 10,350 1,359 1,463,771 25,067 14,465 1,585,490
Page 98
Genesis Energy Annual Report 2010

(a) Generation assets carried at fair valueThe Directors’ valued the Company’s generation assets and certain capital work in progress at 30 June 2009. The valuation was independently determined by First NZ Capital.
The valuation of generation assets for accounting purposes was $1,491.0 million which included capital work in progress amounting to $12.9 million and leased plant amounting to $2.1 million. The net revaluation change was a $28.6 million decrease in the book value of generation assets.
Generation assets and capital work in progress were revalued to fair value. The economic valuation of the generation assets was $1,197.0 million which was $294.0 million lower than was the accounting valuation as certain generation assets were determined to have a negative value whereas, for accounting purposes, they were revalued to zero.
The key assumptions in the valuation model include: the wholesale electricity price path; projected generation output; fuel costs; projected operational and capital expenditure profiles; capacity and life assumptions for each generation plant; the commencement date for the Emissions Trading Scheme; the price of emission units; and the discount rate.
The valuation was calculated on each generating site. The revaluation for those sites that had a negative revaluation went to profit or loss except to the extent that there was a previous upward revaluation. Any previous upward revaluation was reversed from the asset revaluation reserve. The movement for those generating sites that had a positive revaluation adjustment went to the asset revaluation reserve.
As a consequence of the revaluation, accumulated depreciation on revalued assets was reset to nil at 30 June 2009, a revaluation surplus of $232.8 million ($162.9 million net of deferred tax) transferred to equity (refer note 27), and a revaluation loss of $261.4 million transferred to profit or loss. There were no revaluation adjustments in 2010.
An independent review of the 2009 valuation of the Company was performed as at 30 June 2010. The independent valuer confirmed that, based on their review, nothing came to their attention that would materially impact the assessed valuation.
The current year’s additional depreciation charge due to past revaluations amounted to $11.5 million (2009: $10.2 million).
(b) Generation assets carried at historical costIf generation assets were stated on the historical cost basis, the carrying value of such assets would be as follows:
Generation assets
Group 30 June 2010
$’000
Company 30 June 2010
$’000
Group 30 June 2009
$’000
Company 30 June 2009
$’000
Cost 1,481,183 1,481,183 1,481,032 1,481,032
Accumulated depreciation (347,855) (347,855) (293,477) (293,477)
Net book value 1,133,328 1,133,328 1,187,555 1,187,555
(c) Impairment of property, plant and equipmentExpenditure of a capital nature on Huntly Units 1 to 4 and 6 is immediately impaired when incurred as these units have a zero book value. During the year, $8.8 million of expenditure was impaired. In addition, a further $6.7 million of business development expenditure was impaired.
(d) Reclassification of property, plant and equipmentThe Kupe production facilities commenced commercial operations on 22 March 2010. In line with the Group’s accounting policy, the capital work in progress has been reclassified to ‘oil and gas-producing assets’ within the oil and gas assets note. Refer note 22.
(e) Property, plant and equipment pledged as securityThe Group is not permitted to pledge assets as security unless it is an exception permitted within the negative pledge deed under which the Group borrows funds.
Page 99
Genesis Energy Annual Report 2010

21. Intangible assets
Group NoteGoodwill
$’000Naming rights
$’000
Computer software
$’000
Emissions units $’000
Total $’000
Year ended 30 June 2010
Opening net book value 102,599 5,067 14,336 11,000 133,002
Additions – 343 13,066 3,530 16,939
Acquired through business combinations 1,354 – – – 1,354
Disposals – – – (9,793) (9,793)
Impairment losses charged to profit or loss (1,354) – – – (1,354)
Amortisation charge 9 – (1,441) (9,801) – (11,242)
Closing net book value 102,599 3,969 17,601 4,737 128,906
As at 30 June 2010
Cost 103,953 5,410 77,087 4,737 191,187
Accumulated amortisation and impairment (1,354) (1,441) (59,486) – (62,281)
Net book value 102,599 3,969 17,601 4,737 128,906
Group NoteGoodwill
$’000Naming rights
$’000
Computer software
$’000
Emissions units $’000
Total $’000
Year ended 30 June 2009
Opening net book value 102,599 5,062 17,798 – 125,459
Additions – 1,437 7,841 11,000 20,278
Amortisation charge 9 – (1,432) (11,303) – (12,735)
Closing net book value 102,599 5,067 14,336 11,000 133,002
As at 30 June 2009
Cost 102,599 8,679 63,936 11,000 186,214
Accumulated amortisation – (3,612) (49,600) – (53,212)
Net book value 102,599 5,067 14,336 11,000 133,002
As at 30 June 2008
Cost 102,599 10,259 56,090 – 168,948
Accumulated amortisation – (5,197) (38,292) – (43,489)
Net book value 102,599 5,062 17,798 – 125,459
Page 100
Genesis Energy Annual Report 2010

Company NoteGoodwill
$’000Naming rights
$’000
Computer software
$’000
Emissions units $’000
Total $’000
Year ended 30 June 2010
Opening net book value 99,866 5,067 13,900 11,000 129,833
Additions – 343 12,845 3,530 16,718
Disposals – – – (9,793) (9,793)
Amortisation charge 9 – (1,441) (9,594) – (11,035)
Closing net book value 99,866 3,969 17,151 4,737 125,723
As at 30 June 2010
Cost 99,866 5,410 75,634 4,737 185,647
Accumulated amortisation – (1,441) (58,483) – (59,924)
Net book value 99,866 3,969 17,151 4,737 125,723
Company NoteGoodwill
$’000Naming rights
$’000
Computer software
$’000
Emissions units $’000
Total $’000
Year ended 30 June 2009
Opening net book value 99,866 5,062 17,388 – 122,316
Additions – 1,437 7,637 11,000 20,074
Amortisation charge 9 – (1,432) (11,125) – (12,557)
Closing net book value 99,866 5,067 13,900 11,000 129,833
As at 30 June 2009
Cost 99,866 8,679 62,789 11,000 182,334
Accumulated amortisation – (3,612) (48,889) – (52,501)
Net book value 99,866 5,067 13,900 11,000 129,833
As at 30 June 2008
Cost 99,866 10,259 55,153 – 165,278
Accumulated amortisation – (5,197) (37,765) – (42,962)
Net book value 99,866 5,062 17,388 – 122,316
Goodwill represents the excess of the purchase price paid for businesses acquired over the fair value of identifiable assets and liabilities taken over. In the case of customers acquired, goodwill represents the price paid for the customers. Goodwill is assessed as having an indefinite useful life and is not amortised but is subject to impairment testing annually or whenever there are indications of impairment. All other intangible assets are assessed as having finite lives and are subject to amortisation.
(a) Impairment tests for goodwillFor the purpose of impairment testing, goodwill is allocated to the cash-generating unit (CGU) of Retail in respect of goodwill relating to customers acquired, and the CGU of Corporate for goodwill arising on businesses acquired. The impairment tests are based on an estimated discounted cash flow analysis (value in use). Estimated future cash flow projections are based on the Group’s five-year business plan for the underlying Retail and Corporate business units and are extrapolated on a consistent basis (2009: growth rate of 2.0 per cent). The estimated future cash flow projections are discounted using pre-tax equivalent discount rate scenarios ranging between 12.0 per cent and 13.5 per cent (2009: 10.5 per cent and 12.0 per cent).
Key assumptions in the value-in-use calculation for the Retail cash-generating unit and the approach to determining the value are:
Assumptions Method of determination
– Customer numbers and customer churn Review of actual customer numbers and historical data regarding movements in customer numbers. The historical analysis is considered against expected market trends and competition for customers.
– Gross margin Review of actual gross margins and consideration of expected market movements and impacts.
– Cost to serve Review of actual costs to serve and consideration of expected market movements and impacts.
Goodwill of $1.4 million arising on the acquisition of Slopedown Wind Farm Limited has been impaired. No impairments were required for goodwill related to customers or to the other listed intangible assets as at 30 June 2010 (2009: Nil).
Page 101
Genesis Energy Annual Report 2010

22. Oil and gas assets
Group
Mining licences
$’000
Exploration and evaluation
expenditure $’000
Oil and gas- development
assets $’000
Oil and gas- producing
assets $’000
Other oil and gas
assets $’000
Total $’000
Year ended 30 June 2010
Opening net book value 16,518 – 86,037 – – 102,555
Additions – (280) 19,464 – 22,949 42,133
Transfer from capital work in progress – – – 368,486 – 368,486
Transfer to producing assets (16,518) – (131,365) 147,883 – –
Interest and other finance costs capitalised – – 25,864 – – 25,864
Impairment losses charged to profit or loss – (364) – – – (364)
Impairment losses reversed – 644 – – – 644
Depreciation, depletion and amortisation expense – – – (16,085) (283) (16,368)
Closing net book value – – – 500,284 22,666 522,950
As at 30 June 2010
Cost – 54,547 – 516,369 22,949 593,865
Accumulated depreciation, depletion, amortisation and impairment
– (54,547) – (16,085) (283) (70,915)
Net book value – – – 500,284 22,666 522,950
Group
Mining licences
$’000
Exploration and evaluation
expenditure $’000
Oil and gas- development
assets $’000
Oil and gas- producing
assets $’000
Other oil and gas
assets $’000
Total $’000
Year ended 30 June 2009
Opening net book value 16,518 3,148 58,776 – – 78,442
Additions – 13,334 21,795 – – 35,129
Interest and other finance costs capitalised – – 5,466 – – 5,466
Impairment losses charged to profit or loss – (16,482) – – – (16,482)
Depreciation, depletion and amortisation expense – – – – – –
Closing net book value 16,518 – 86,037 – – 102,555
As at 30 June 2009
Cost 16,518 54,847 86,037 – – 157,402
Accumulated depreciation, depletion, amortisation and impairment
– (54,847) – – – (54,847)
Net book value 16,518 – 86,037 – – 102,555
As at 1 July 2008
Cost 16,518 41,513 58,776 – – 116,807
Accumulated depreciation, depletion, amortisation and impairment
– (38,365) – – – (38,365)
Net book value 16,518 3,148 58,776 – – 78,442
The Group has a 31.0 per cent interest in the Kupe production facility and Petroleum Mining Permit 38146 held by the Kupe Joint Venture. Commissioning of the Kupe production facilities commenced on 4 December 2009 with the opening of the first offshore well (KS-6). Following the successful testing and commissioning of the production systems, commercial operations began on 22 March 2010. In line with the Group’s accounting policy, the assets have been reclassified as oil and gas-producing assets.
Capitalised exploration and evaluation expenditure relates primarily to the Kupe (Momoho), Mangatoa and Cardiff gas and condensate fields in which the Group has interests. Refer note 32.
The exploration and evaluation assets relating to the Kupe (Momoho), Mangatoa and Cardiff gas and condensate fields were considered to be impaired as the test results indicated they were not economic to develop further. The amount written off represents capitalised exploration expenditure on those fields to date and includes allowances for restoration and rehabilitation.
Page 102
Genesis Energy Annual Report 2010

Company
Mining licences
$’000
Exploration and evaluation
expenditure $’000
Oil and gas- development
assets $’000
Oil and gas- producing
assets $’000
Other oil and gas
assets $’000
Total $’000
Year ended 30 June 2010
Opening net book value – – – – – –
Additions – 364 – – – 364
Impairment losses charged to profit or loss – (364) – – – (364)
Depreciation, depletion and amortisation expense – – – – – –
Closing net book value – – – – – –
As at 30 June 2010
Cost – 11,392 – – – 11,392
Accumulated depreciation, depletion, amortisation and impairment
– (11,392) – – – (11,392)
Net book value – – – – – –
Company
Mining licences
$’000
Exploration and evaluation
expenditure $’000
Oil and gas- development
assets $’000
Oil and gas- producing
assets $’000
Other oil and gas
assets $’000
Total $’000
Year ended 30 June 2009
Opening net book value – 3,148 – – – 3,148
Additions – 7,880 – – – 7,880
Impairment losses charged to profit or loss – (11,028) – – – (11,028)
Depreciation, depletion and amortisation expense – – – – – –
Closing net book value – – – – – –
As at 30 June 2009
Cost – 11,028 – – – 11,028
Accumulated depreciation, depletion, amortisation and impairment
– (11,028) – – – (11,028)
Net book value – – – – – –
As at 1 July 2008
Cost 3,148 – – – 3,148
Accumulated depreciation, depletion, amortisation and impairment
– – – – –
Net book value 3,148 – – – 3,148
Capitalised exploration and evaluation expenditure relates to the Mangatoa gas and condensate field in which the Company has an interest.
The exploration and evaluation assets relating to the Mangatoa gas and condensate field were considered to be impaired as the test results indicated it was not economic to develop this field further. The amount written off represents capitalised exploration expenditure.
(a) Oil and gas reservesThe table below presents the proven (P90) and proven and probable (P50) oil and gas reserves relating to the Kupe permit. The Group has a 31.0 per cent interest in the reserves shown;
Sales gas Petajoules
LPG Kilotonnes
Light oil Kilobarrels
Total Petajoules equivalent
Kupe – Proven (P90) 192.7 788.8 11,288 294.4
Kupe – Proven and probable (P50) 289.9 1,181.2 19,866 458.7
Page 103
Genesis Energy Annual Report 2010

23. Trade and other payables
Group 30 June 2010
$’000
Company 30 June 2010
$’000
Group 30 June 2009
$’000
Company 30 June 2009
$’000
Trade payables and accruals 199,008 182,788 239,611 215,313
Employee benefits 4,920 4,796 3,883 3,762
203,928 187,584 243,494 219,075
All trade and other payables are classified as ‘other financial liabilities’ under NZ IFRS 7.8 Financial Instruments: Disclosures and are therefore shown at amortised cost.
Payment terms on trade payables range from seven to 30 days from date of invoice for both foreign and local suppliers. The Group has financial risk-management policies in place to ensure that all payables are paid within the credit time frame.
(a) ACC Partnership Programme The Company belongs to the ACC Partnership Programme whereby the Company accepts the management and financial responsibility for employee work-related illnesses and accidents. Under the programme, the Company is liable for all its claims costs for a period of one year up to a specified maximum.
At the end of the one-year period, the Company pays a premium to ACC for the value of residual claims and, from that point, the liability for ongoing claims passes to ACC.
The liability for the ACC Partnership Programme is measured as the present value of anticipated future payments to be made in respect of the employee injuries and claims up to the reporting date using actuarial techniques. Consideration is given to expected future wage and salary levels, and experience of employee claims and injuries.
The Company manages its exposure arising from the programme by promoting a safe and healthy working environment by:
• implementing and monitoring health and safety policies;
• conducting induction training on health and safety;
• actively managing workplace injuries to ensure employees return to work as soon as practical;
• recording and monitoring workplace injuries and near misses to identify risk areas and implementing mitigating actions; and
• identifying workplace hazards and implementing appropriate safety procedures.
The Company has chosen a stop loss limit of 250.0 per cent of the industry premium. The stop loss limit means the Company will carry the total cost of claims of up to $0.3 million only.
The Company is not exposed to any significant concentrations of insurance risk as work-related injuries are generally the result of isolated events for individual employees.
An external independent actuarial valuer, Mark Weaver, Fellow, New Zealand Society of Actuaries, has calculated Genesis Energy’s liability and the valuation is effective 30 June 2010. The valuer has attested he is satisfied as to the nature, sufficiency and accuracy of the data used to determine the outstanding claims liability. There are no qualifications contained in the actuarial valuer’s report.
Average inflation has been assumed to be between 2.6 per cent and 4.2 per cent. A discount rate of 6.0 per cent (2009: 6.8 per cent) has been used.
The value of the liability is not material for the Group’s financial statements; therefore, any changes in assumptions will not have a material impact on the financial statements.
Page 104
Genesis Energy Annual Report 2010

24. Borrowings
Currency
Group 30 June 2010
$’000
Company 30 June 2010
$’000
Group 30 June 2009
$’000
Company 30 June 2009
$’000
Current borrowings and current portion of term borrowings
Uncommitted money market borrowings (b) NZD – – 4,300 4,300
Revolving credit borrowings (b) NZD – – 117,608 117,608
Wholesale term notes (b) NZD 2,837 2,837 1,581 1,581
Retail term notes (b) NZD 5,142 5,142 4,616 4,616
Finance lease liabilities (d) NZD 3,310 3,310 3,348 3,348
Total current interest-bearing borrowings 11,289 11,289 131,453 131,453
Term borrowings
Revolving credit borrowings (b) NZD 112,000 112,000 180,000 180,000
Wholesale term notes (b) NZD 194,501 194,501 74,852 74,852
Retail term notes (b) NZD 221,552 221,552 221,560 221,560
Finance lease liabilities (d) NZD 13,038 13,038 16,459 16,459
Total non current interest-bearing liabilities 541,091 541,091 492,871 492,871
Total borrowings
Uncommitted money market borrowings (b) NZD – – 4,300 4,300
Revolving credit borrowings (b) NZD 112,000 112,000 297,608 297,608
Wholesale term notes (b) NZD 197,338 197,338 76,433 76,433
Retail term notes (b) NZD 226,694 226,694 226,176 226,176
Finance lease liabilities (d) NZD 16,348 16,348 19,807 19,807
Total interest-bearing liabilities 552,380 552,380 624,324 624,324
All interest-bearing borrowings are classified as ‘other financial liabilities’ under NZ IFRS 7.8 Financial Instruments: Disclosures and are, therefore, shown at amortised cost.
Further information relating to loans from related parties is set out in note 31.
(a) SecurityExcept for finance leases, all of Genesis Power Limited’s (the Company’s) borrowings are unsecured. The Company borrows under a negative pledge arrangement, which does not permit the Company to grant any security interest over its assets, unless it is an exception permitted within the negative pledge.
Finance lease liabilities are effectively secured as the rights to the leased assets recognised in the financial statements (as set out in note 20) revert to the lessor in the event of default.
(b) Financing arrangementsThe Company has an uncommitted money market facility from a syndicate of major New Zealand banks. This facility incurs interest at rates varying between 3.5 per cent and 4.5 per cent (2009: 3.1 per cent and 4.25 per cent) per annum and is repayable on demand.
The Company has the following committed revolving cash advance facilities provided by a number of major New Zealand trading banks:
• $400.0 million (2009: $675.0 million) facility expiring on 5 October 2011;
• $50.0 million (2009: Nil) facility expiring on 29 September 2012; and
• $50.0 million (2009: Nil) facility expiring on 29 September 2013; and
At 30 June 2010, the Company had drawn down $112.0 million (2009: $295.0 million) and had available undrawn funding of $388.0 million (2009: $380.0 million).
The Company has issued fixed and floating rate bonds (ranging from 7.5 years to 10 years) totalling $195.0 million (2009: $75.0 million). These bonds attract interest rates ranging between 5.4 per cent and 8.3 per cent (2009: 7.2 per cent) per annum and are repayable between 15 September 2016 and 23 June 2020.
On 20 August 2009, the Company issued fixed rate bonds totalling $25.0 million and floating rate bonds totalling $25.0 million, each maturing on 20 February 2017. The bonds were issued by a private placement with an institutional investor.
On 23 June 2010, the Company issued fixed rate bonds totalling $70.0 million, maturing on 23 June 2020. The bonds were issued by a private placement with an institutional investor.
Page 105
Genesis Energy Annual Report 2010
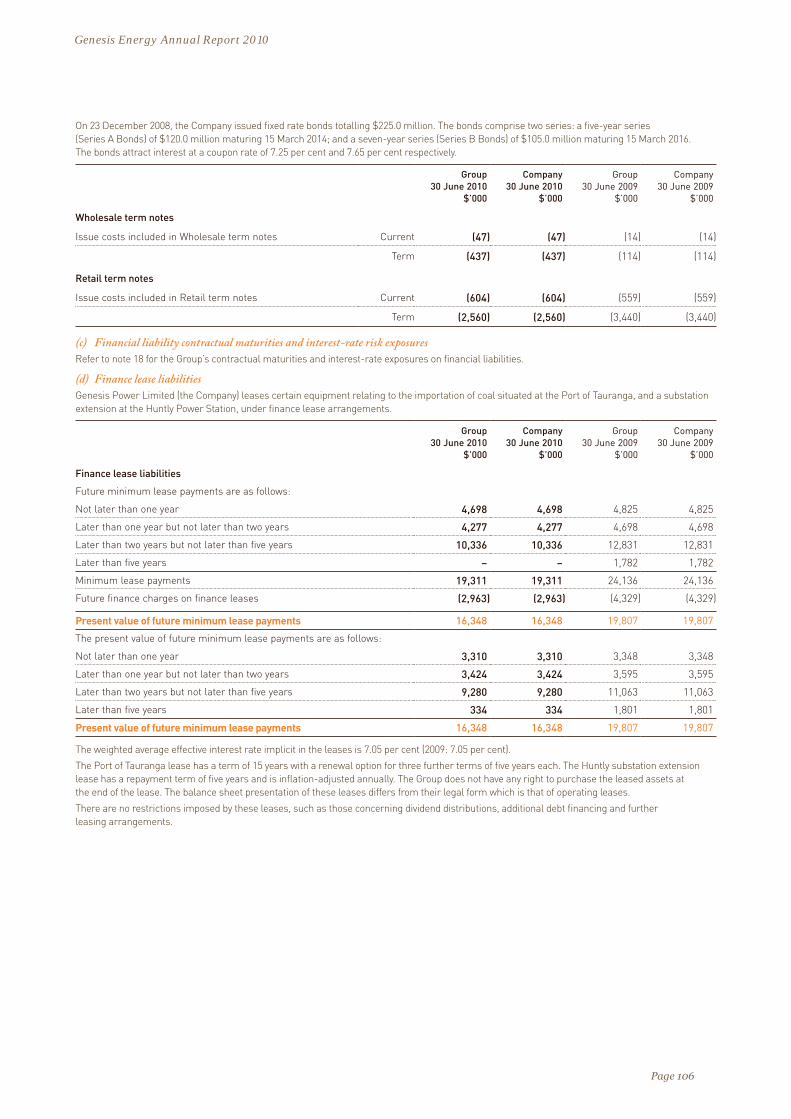
On 23 December 2008, the Company issued fixed rate bonds totalling $225.0 million. The bonds comprise two series: a five-year series (Series A Bonds) of $120.0 million maturing 15 March 2014; and a seven-year series (Series B Bonds) of $105.0 million maturing 15 March 2016. The bonds attract interest at a coupon rate of 7.25 per cent and 7.65 per cent respectively.
Group 30 June 2010
$’000
Company 30 June 2010
$’000
Group 30 June 2009
$’000
Company 30 June 2009
$’000
Wholesale term notes
Issue costs included in Wholesale term notes Current (47) (47) (14) (14)
Term (437) (437) (114) (114)
Retail term notes
Issue costs included in Retail term notes Current (604) (604) (559) (559)
Term (2,560) (2,560) (3,440) (3,440)
(c) Financial liability contractual maturities and interest-rate risk exposuresRefer to note 18 for the Group’s contractual maturities and interest-rate exposures on financial liabilities.
(d) Finance lease liabilitiesGenesis Power Limited (the Company) leases certain equipment relating to the importation of coal situated at the Port of Tauranga, and a substation extension at the Huntly Power Station, under finance lease arrangements.
Group 30 June 2010
$’000
Company 30 June 2010
$’000
Group 30 June 2009
$’000
Company 30 June 2009
$’000
Finance lease liabilities
Future minimum lease payments are as follows:
Not later than one year 4,698 4,698 4,825 4,825
Later than one year but not later than two years 4,277 4,277 4,698 4,698
Later than two years but not later than five years 10,336 10,336 12,831 12,831
Later than five years – – 1,782 1,782
Minimum lease payments 19,311 19,311 24,136 24,136
Future finance charges on finance leases (2,963) (2,963) (4,329) (4,329)
Present value of future minimum lease payments 16,348 16,348 19,807 19,807
The present value of future minimum lease payments are as follows:
Not later than one year 3,310 3,310 3,348 3,348
Later than one year but not later than two years 3,424 3,424 3,595 3,595
Later than two years but not later than five years 9,280 9,280 11,063 11,063
Later than five years 334 334 1,801 1,801
Present value of future minimum lease payments 16,348 16,348 19,807 19,807
The weighted average effective interest rate implicit in the leases is 7.05 per cent (2009: 7.05 per cent).
The Port of Tauranga lease has a term of 15 years with a renewal option for three further terms of five years each. The Huntly substation extension lease has a repayment term of five years and is inflation-adjusted annually. The Group does not have any right to purchase the leased assets at the end of the lease. The balance sheet presentation of these leases differs from their legal form which is that of operating leases.
There are no restrictions imposed by these leases, such as those concerning dividend distributions, additional debt financing and further leasing arrangements.
Page 106
Genesis Energy Annual Report 2010

25. ProvisionsMovements in each class of provision during the financial year, other than employee benefits, are set out below:
Group
Rehabilitation and restoration
$’000
Customer rewards
$’000
Other provisions
$’000Total
$’000
Year ended 30 June 2010
Balance at beginning of year 30,813 2,542 20,279 53,634
Provisions made during the year 8,608 4,237 8,369 21,214
Provisions reversed during the year – (833) – (833)
Provisions used during the year (74) (172) (12,268) (12,514)
Unwinding of discount 612 – 798 1,410
Balance at end of year 39,959 5,774 17,178 62,911
Current 1,092 3,299 3,758 8,149
Non current 38,867 2,475 13,420 54,762
39,959 5,774 17,178 62,911
Group
Rehabilitation and restoration
$’000
Customer rewards
$’000
Other provisions
$’000Total
$’000
Year ended 30 June 2009
Balance at beginning of year 13,901 – 11,880 25,781
Provisions made during the year 19,279 2,557 11,437 33,273
Provisions reversed during the year (2,268) – – (2,268)
Provisions used during the year (1,013) (15) (3,324) (4,352)
Unwinding of discount 914 – 286 1,200
Balance at end of year 30,813 2,542 20,279 53,634
Current 1,306 – 3,228 4,534
Non current 29,507 2,542 17,051 49,100
30,813 2,542 20,279 53,634
Company
Rehabilitation and restoration
$’000
Customer rewards
$’000
Other provisions
$’000Total
$’000
Year ended 30 June 2010
Balance at beginning of year 10,741 2,542 20,279 33,562
Provisions made during the year – 4,237 8,369 12,606
Provisions reversed during the year – (833) – (833)
Provisions used during the year (74) (172) (11,742) (11,988)
Unwinding of discount 612 – 272 884
Balance at end of year 11,279 5,774 17,178 34,231
Current – 3,299 3,758 7,057
Non current 11,279 2,475 13,420 27,174
11,279 5,774 17,178 34,231
Company
Rehabilitation and restoration
$’000
Customer rewards
$’000
Other provisions
$’000Total
$’000
Year ended 30 June 2009
Balance at beginning of year 9,882 – 11,880 21,762
Provisions made during the year – 2,557 11,437 13,994
Provisions used during the year (55) (15) (3,324) (3,394)
Unwinding of discount 914 – 286 1,200
Balance at end of year 10,741 2,542 20,279 33,562
Current 214 – 3,228 3,442
Non current 10,527 2,542 17,051 30,120
10,741 2,542 20,279 33,562
Page 107
Genesis Energy Annual Report 2010

The rehabilitation and restoration provisions represent the present value of the best estimate of future costs to be incurred for the rehabilitation and restoration of the Meremere generation site, the Huntly ash ponds, and the Kupe and Cardiff gas fields. These sites require remediation of conditions resulting from past and present operations. These costs are expected to be incurred at varying stages of up to 15 years.
During the previous year, the Company introduced its own customer loyalty programme ‘Brownie Points’ which awards points to customers for different behaviours. Accordingly, a provision was recognised for the full liability owing as there was no basis at that time for estimating redemption rates on behaviour-based programmes. During the current year, the provision has been reduced to 87.5 per cent of the full liability as this reflects the estimated redemption rate. The timing of the outflows is dependent on customers redeeming their points after achieving a minimum rewards points balance. Unredeemed rewards points expire after a period of three years.
Other provisions represent the present value of contracted costs and compensation claims covering a range of commercial matters including mitigation agreements, which are the subject of legal privilege and/or confidentiality arrangements. The timing of these outflows varies up to 14 years. The decrease in the current year provision is a result of the settlement of the proceedings arising from the claim by Carter Holt Harvey in relation to the Kinleith Cogeneration plant.
26. Deferred tax liabilities(a) The composition of deferred tax balancesDeferred tax assets and liabilities are offset on the face of the balance sheet where it is likely they will be settled on a net basis. The net deferred tax liability solely comprises temporary differences.
(b) The movement in deferred tax liability
Group
Opening balance
$’000
Recognised in income
$’000
Recognised in other
comprehensive income
$’000
Adjusted to current tax
$’000
Closing balance
$’000
Year ended 30 June 2010
Property, plant and equipment 308,466 7,344 (11,747) – 304,063
Oil and gas assets (45,958) 11,456 – – (34,502)
Intangibles 5,821 413 – – 6,234
Trade and other receivables (729) (4,964) – – (5,693)
Inventories – (2,795) – – (2,795)
Employee entitlements (1,254) (555) – – (1,809)
Provisions (11,187) (3,555) – – (14,742)
Finance lease liabilities (7,534) 932 – – (6,602)
Derivative financial instruments (8,965) (769) 5,033 – (4,701)
Other (1,695) 2,642 – – 947
Total liability 236,965 10,149 (6,714) – 240,400
Group
Opening balance
$’000
Recognised in income
$’000
Recognised in other
comprehensive income
$’000
Adjusted to current tax
$’000
Closing balance
$’000
Year ended 30 June 2009
Property, plant and equipment 285,800 (47,191) 69,822 35 308,466
Oil and gas assets (44,194) (1,764) – – (45,958)
Intangibles 6,858 (1,037) – – 5,821
Trade and other receivables 1,606 (2,335) – – (729)
Inventories (927) 927 – – –
Employee entitlements (990) (264) – – (1,254)
Provisions (6,671) (4,516) – – (11,187)
Finance lease liabilities (7,933) 399 – – (7,534)
Derivative financial instruments (6,424) (512) (2,029) – (8,965)
Other (1,805) 110 – – (1,695)
Total liability 225,320 (56,183) 67,793 35 236,965
Page 108
Genesis Energy Annual Report 2010

Company
Opening balance
$’000
Recognised in income
$’000
Recognised in other
comprehensive income
$’000
Adjusted to current tax
$’000
Closing balance
$’000
Year ended 30 June 2010
Property, plant and equipment 201,033 7,560 (11,747) – 196,846
Oil and gas assets – – – – –
Intangibles 5,690 414 – – 6,104
Trade and other receivables (4,238) (1,479) – – (5,717)
Inventories – (2,795) – – (2,795)
Employee entitlements (1,214) (550) – – (1,764)
Provisions (5,165) (1,523) – – (6,688)
Finance lease liabilities (7,534) 932 – – (6,602)
Derivative financial instruments (8,208) (702) 5,055 – (3,855)
Other (1,679) 933 – – (746)
Total liability 178,685 2,790 (6,692) – 174,783
Company
Opening balance
$’000
Recognised in income
$’000
Recognised in other
comprehensive income
$’000
Adjusted to current tax
$’000
Closing balance
$’000
Year ended 30 June 2009
Property, plant and equipment 209,376 (78,107) 69,822 (58) 201,033
Oil and gas assets 942 (942) – – –
Intangibles 6,735 (1,045) – – 5,690
Trade and other receivables (3,280) (958) – – (4,238)
Inventories (927) 927 – – –
Employee entitlements (958) (256) – – (1,214)
Provisions (5,465) 300 – – (5,165)
Finance lease liabilities (7,933) 399 – – (7,534)
Derivative financial instruments (4,419) (1,560) (2,229) – (8,208)
Other (1,804) 125 – – (1,679)
Total liability 192,267 (81,117) 67,593 (58) 178,685
The amounts showing as recognised in income and other comprehensive income are net of the effects of the change in corporate tax rate and the change in tax depreciation rules on buildings.
(c) Unrecognised deferred tax assets and liabilitiesThere are no unrecognised deferred tax assets or liabilities.
Page 109
Genesis Energy Annual Report 2010
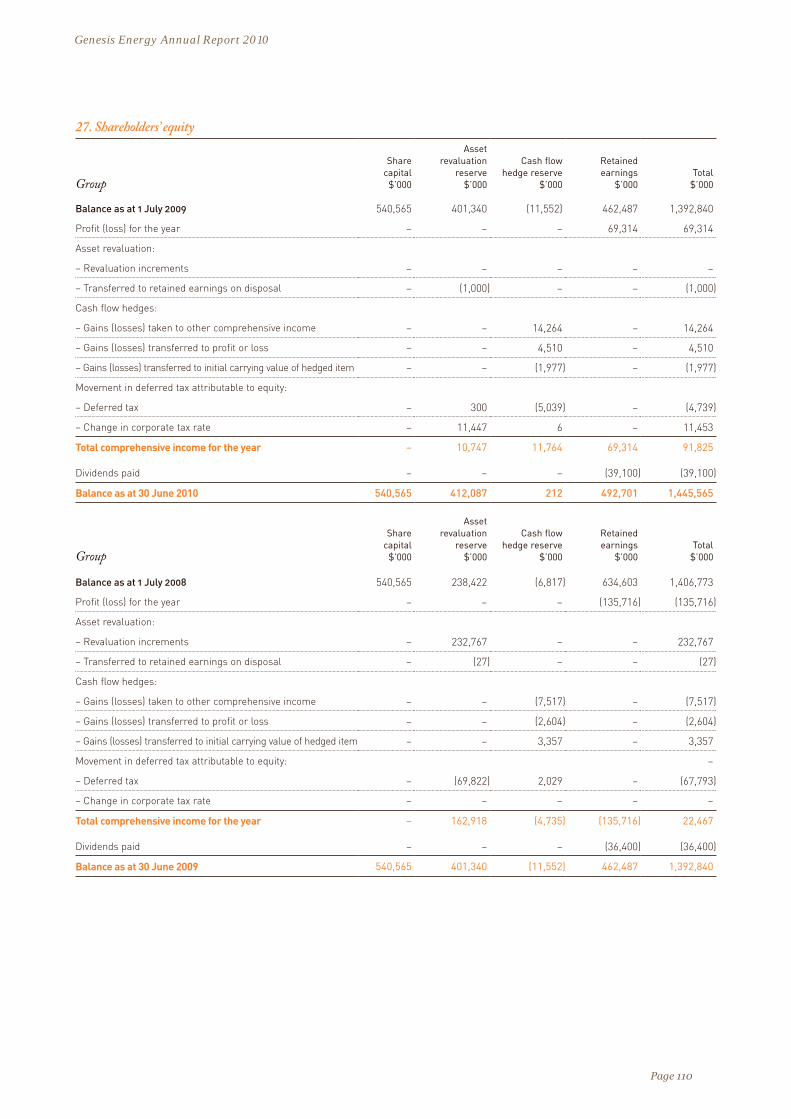
27. Shareholders’ equity
Group
Share capital
$’000
Asset revaluation
reserve $’000
Cash flow hedge reserve
$’000
Retained earnings
$’000Total
$’000
Balance as at 1 July 2009 540,565 401,340 (11,552) 462,487 1,392,840
Profit (loss) for the year – – – 69,314 69,314
Asset revaluation:
– Revaluation increments – – – – –
– Transferred to retained earnings on disposal – (1,000) – – (1,000)
Cash flow hedges:
– Gains (losses) taken to other comprehensive income – – 14,264 – 14,264
– Gains (losses) transferred to profit or loss – – 4,510 – 4,510
– Gains (losses) transferred to initial carrying value of hedged item – – (1,977) – (1,977)
Movement in deferred tax attributable to equity:
– Deferred tax – 300 (5,039) – (4,739)
– Change in corporate tax rate – 11,447 6 – 11,453
Total comprehensive income for the year – 10,747 11,764 69,314 91,825
Dividends paid – – – (39,100) (39,100)
Balance as at 30 June 2010 540,565 412,087 212 492,701 1,445,565
Group
Share capital
$’000
Asset revaluation
reserve $’000
Cash flow hedge reserve
$’000
Retained earnings
$’000Total
$’000
Balance as at 1 July 2008 540,565 238,422 (6,817) 634,603 1,406,773
Profit (loss) for the year – – – (135,716) (135,716)
Asset revaluation:
– Revaluation increments – 232,767 – – 232,767
– Transferred to retained earnings on disposal – (27) – – (27)
Cash flow hedges:
– Gains (losses) taken to other comprehensive income – – (7,517) – (7,517)
– Gains (losses) transferred to profit or loss – – (2,604) – (2,604)
– Gains (losses) transferred to initial carrying value of hedged item – – 3,357 – 3,357
Movement in deferred tax attributable to equity: –
– Deferred tax – (69,822) 2,029 – (67,793)
– Change in corporate tax rate – – – – –
Total comprehensive income for the year – 162,918 (4,735) (135,716) 22,467
Dividends paid – – – (36,400) (36,400)
Balance as at 30 June 2009 540,565 401,340 (11,552) 462,487 1,392,840
Page 110
Genesis Energy Annual Report 2010

Company
Share capital
$’000
Asset revaluation
reserve $’000
Cash flow hedge reserve
$’000
Retained earnings
$’000Total
$’000
Balance as at 1 July 2009 540,565 401,340 (11,588) 386,992 1,317,309
Profit (loss) for the year – – – 59,908 59,908
Asset revaluation:
– Revaluation increments – – – – –
– Transferred to retained earnings on disposal – (1,000) – – (1,000)
Cash flow hedges:
– Gains (losses) taken to other comprehensive income – – 12,563 – 12,563
– Gains (losses) transferred to profit or loss – – 4,539 – 4,539
– Gains (losses) transferred to initial carrying value of hedged item – – (232) – (232)
Movement in deferred tax attributable to equity:
– Deferred tax – 300 (5,061) – (4,761)
– Change in corporate tax rate – 11,447 6 – 11,453
Total comprehensive income for the year – 10,747 11,815 59,908 82,470
Dividends paid – – – (39,100) (39,100)
Balance as at 30 June 2010 540,565 412,087 227 407,800 1,360,679
Company
Share capital
$’000
Asset revaluation
reserve $’000
Cash flow hedge reserve
$’000
Retained earnings
$’000Total
$’000
Balance as at 1 July 2008 540,565 238,422 (6,387) 568,883 1,341,483
Profit (loss) for the year – – – (145,491) (145,491)
Asset revaluation:
– Revaluation increments – 232,767 – – 232,767
– Transferred to retained earnings on disposal – (27) – – (27)
Cash flow hedges:
– Gains (losses) taken to other comprehensive income – – (7,290) – (7,290)
– Gains (losses) transferred to profit or loss – – (2,604) – (2,604)
– Gains (losses) transferred to initial carrying value of hedged item – – 2,464 – 2,464
Movement in deferred tax attributable to equity:
– Deferred tax – (69,822) 2,229 – (67,593)
– Change in corporate tax rate – – – – –
Total comprehensive income for the year – 162,918 (5,201) (145,491) 12,226
Dividends paid – – – (36,400) (36,400)
Balance as at 30 June 2009 540,565 401,340 (11,588) 386,992 1,317,309
Page 111
Genesis Energy Annual Report 2010
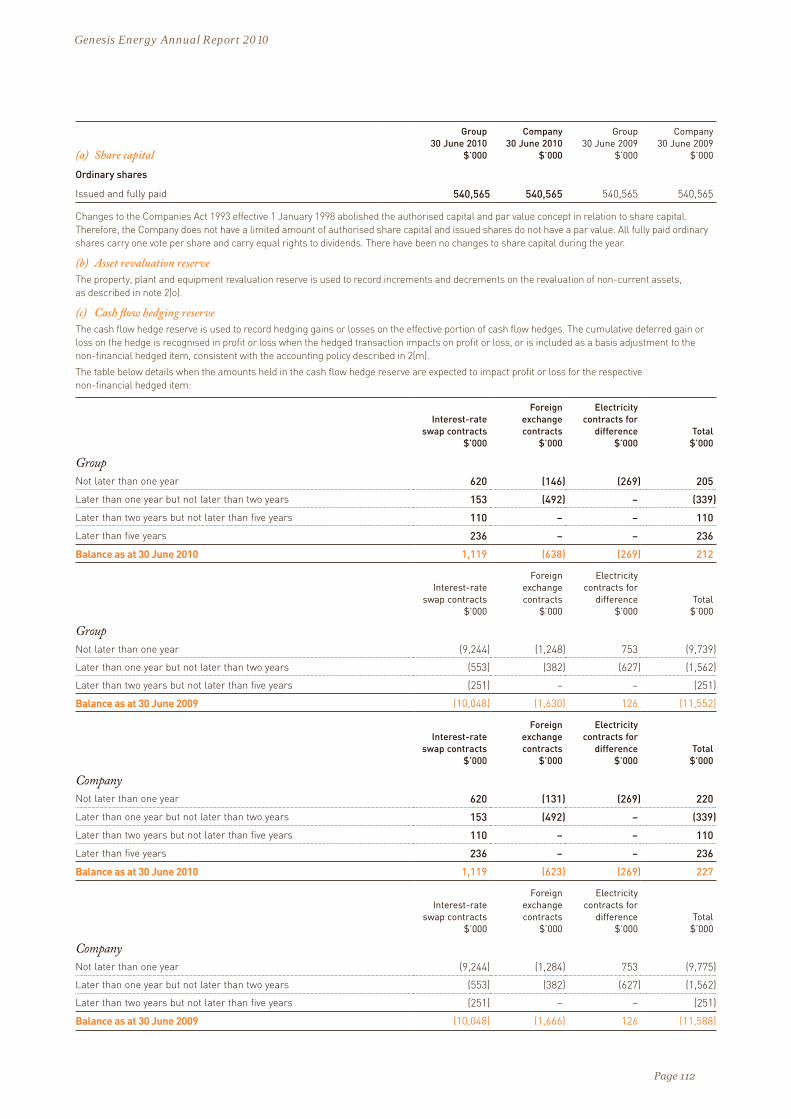
(a) Share capital
Group 30 June 2010
$’000
Company 30 June 2010
$’000
Group 30 June 2009
$’000
Company 30 June 2009
$’000
Ordinary shares
Issued and fully paid 540,565 540,565 540,565 540,565
Changes to the Companies Act 1993 effective 1 January 1998 abolished the authorised capital and par value concept in relation to share capital. Therefore, the Company does not have a limited amount of authorised share capital and issued shares do not have a par value. All fully paid ordinary shares carry one vote per share and carry equal rights to dividends. There have been no changes to share capital during the year.
(b) Asset revaluation reserveThe property, plant and equipment revaluation reserve is used to record increments and decrements on the revaluation of non-current assets, as described in note 2(o).
(c) Cash flow hedging reserveThe cash flow hedge reserve is used to record hedging gains or losses on the effective portion of cash flow hedges. The cumulative deferred gain or loss on the hedge is recognised in profit or loss when the hedged transaction impacts on profit or loss, or is included as a basis adjustment to the non-financial hedged item, consistent with the accounting policy described in 2(m).
The table below details when the amounts held in the cash flow hedge reserve are expected to impact profit or loss for the respective non-financial hedged item:
Interest-rate swap contracts
$’000
Foreign exchange contracts
$’000
Electricity contracts for
difference $’000
Total $’000
GroupNot later than one year 620 (146) (269) 205
Later than one year but not later than two years 153 (492) – (339)
Later than two years but not later than five years 110 – – 110
Later than five years 236 – – 236
Balance as at 30 June 2010 1,119 (638) (269) 212
Interest-rate swap contracts
$’000
Foreign exchange contracts
$’000
Electricity contracts for
difference $’000
Total $’000
GroupNot later than one year (9,244) (1,248) 753 (9,739)
Later than one year but not later than two years (553) (382) (627) (1,562)
Later than two years but not later than five years (251) – – (251)
Balance as at 30 June 2009 (10,048) (1,630) 126 (11,552)
Interest-rate swap contracts
$’000
Foreign exchange contracts
$’000
Electricity contracts for
difference $’000
Total $’000
CompanyNot later than one year 620 (131) (269) 220
Later than one year but not later than two years 153 (492) – (339)
Later than two years but not later than five years 110 – – 110
Later than five years 236 – – 236
Balance as at 30 June 2010 1,119 (623) (269) 227
Interest-rate swap contracts
$’000
Foreign exchange contracts
$’000
Electricity contracts for
difference $’000
Total $’000
CompanyNot later than one year (9,244) (1,284) 753 (9,775)
Later than one year but not later than two years (553) (382) (627) (1,562)
Later than two years but not later than five years (251) – – (251)
Balance as at 30 June 2009 (10,048) (1,666) 126 (11,588)
Page 112
Genesis Energy Annual Report 2010

Gains (losses) transferred from the cash flow hedge reserve into profit or loss during the year are included in the following line items on in profit or loss:
Group 30 June 2010
$’000
Company 30 June 2010
$’000
Group 30 June 2009
$’000
Company 30 June 2009
$’000
Operating revenue 16,919 16,919 24 24
Other operating costs (3,080) (3,051) 5,182 5,182
Finance costs (9,329) (9,329) (7,810) (7,810)
Gains (losses) transferred to profit or loss 4,510 4,539 (2,604) (2,604)
There are no forecast transactions for which hedge accounting had previously been applied but which are no longer expected to occur.
28. Ordinary dividendsThe Company paid the following fully imputed dividends during the year.
Dividend payment date
Company 30 June 2010
$’000
Company 30 June 2009
$’000
Company 30 June 2010
cents per share
Company 30 June 2009
cents per share
Dividends paid during the year:
2008 year final dividend 30 Sep 2008 26,000 4.81
2009 year interim dividend 31 Mar 2009 10,400 1.92
2009 year final dividend 30 Sep 2009 10,400 1.92
2010 year interim dividend 31 Mar 2010 28,700 5.31
Total Ordinary dividends paid 39,100 36,400
29. Contingent assets and liabilitiesThe Company and Group had contingent assets and liabilities at 30 June 2010 in respect of:
(a) Land claims, law suits and other claimsThe Company acquired interests in land and leases from ECNZ on 1 April 1999. These interests in land and leases may be subject to claims to the Waitangi Tribunal and may be resumed by the Crown. The Company would expect to negotiate with the new Maori owners for occupancy and usage rights of any sites resumed by the Crown. Certain claims have been brought to or are pending against the Company, ECNZ and the Crown under the Treaty of Waitangi Act 1975. Some of these claims may affect land and leases purchased by the Company or its subsidiaries from ECNZ. In the event that land is resumed by the Crown, there is provision for compensation to the Company.
The Board of Directors cannot reasonably estimate the adverse effect (if any) on Genesis Power Limited if any of the foregoing claims are ultimately resolved against Genesis Power Limited’s interest, or any contingent or currently unknown costs or liabilities crystallise. There can be no assurances that such litigation or costs will not have a material adverse effect on Genesis Power Limited’s business, financial condition or results of operations.
(b) Electricity market review changesThe Government’s Electricity Industry Bill (EIB) is currently in the legislative process. Amongst other things, the EIB provides for Meridian Energy to sell the Tekapo A and B Power Stations to Genesis Energy, and for Ministers to issue a direction to the companies on the sale terms and ancillary arrangements, if necessary. Negotiations on the terms of the sale are continuing. In the event the parties cannot reach agreement and Ministers determine the sale terms, there could be an adverse financial impact on the Group.
(c) Financial guaranteesThe Company issued financial guarantees to the alliance contractor and other agents of the Kupe Joint Venture for the full and faithful performance of its subsidiaries in their capacities as joint venture partners, to the extent of their several liabilities under the development agreement.
The Company issued a financial guarantee to Energy Clearing House Limited for the full and faithful performance of its subsidiary Energy Online Limited, to the extent of its liabilities for its retail electricity purchases.
These guarantees may give rise to liabilities in the Company if the subsidiaries do not meet their obligations under the terms of the respective arrangements.
(d) Letters of credit and performance bondsThe Company, as a participant in the electricity market, issued letters of credit to the Energy Clearing House Limited under the market’s security requirements. These letters of credit are issued as part of normal trading conditions and are to ensure there is no significant credit risk exposure to any one market participant.
The Company has also issued letters of credit and performance bonds to certain suppliers and service providers under normal trading conditions. The liabilities covered by these arrangements are already provided for in the balance sheet and are, therefore, not expected to create any adverse effects on the financial results presented. These are not material to the financial statements.
There are no other known material contingent assets or liabilities (2009: Nil).
Page 113
Genesis Energy Annual Report 2010

30. Commitments(a) Capital and investment commitmentsCapital expenditure contracted for at the reporting date but not recognised as liabilities is as follows:
Group 30 June 2010
$’000
Company 30 June 2010
$’000
Group 30 June 2009
$’000
Company 30 June 2009
$’000
Within one year 12,614 12,585 13,007 13,007
Later than one year but not later than five years 828 828 2,331 2,331
Total capital and investment commitments 13,442 13,413 15,338 15,338
(b) Operating lease commitments(i) Where the Group is lesseeThe operating leases are of a rental nature. The majority of the lessee commitments are for building accommodation for the Retail and Corporate sites, and land for the Generation sites. The remainder relates to vehicles, plant and equipment.
These leases are on normal commercial terms and conditions, with varying lease periods of up to 20 years. In some cases, renewal rights exist with market review clauses. The Group does not have any options to purchase the leased assets at the expiry of the lease period.
There are no restrictions imposed by these operating leases, such as those concerning dividend distributions, additional debt financing and further leasing arrangements.
Commitments for minimum lease payments in relation to non-cancellable operating leases are payable as follows:
Group 30 June 2010
$’000
Company 30 June 2010
$’000
Group 30 June 2009
$’000
Company 30 June 2009
$’000
Within one year 8,865 7,132 6,135 5,803
Later than one year but not later than five years 25,555 21,151 21,324 20,245
Later than five years 34,653 32,936 35,942 35,942
Commitments not recognised in the financial statements 69,073 61,219 63,401 61,990
(ii) Where the Group is lessorThe operating leases are of a rental nature. The majority of the lessor commitments relate to surplus farmland and buildings adjacent to Generation sites. The remainder relates to licences to occupy.
These leases are on normal commercial terms and conditions, with varying lease periods of up to 20 years. In some cases, renewal rights exist with market review clauses. The Group does not issue any options to lessees to purchase the leased assets at the expiry of the lease period.
Commitments for minimum lease receipts in relation to non-cancellable operating leases are receivable as follows:
Group 30 June 2010
$’000
Company 30 June 2010
$’000
Group 30 June 2009
$’000
Company 30 June 2009
$’000
Within one year 427 323 477 373
Later than one year but not later than five years 957 869 871 679
Later than five years 623 623 786 786
Commitments not recognised in the financial statements 2,007 1,815 2,134 1,838
Lease commitments are stated exclusive of GST.
(c) Other commitments(i) Maintenance commitmentsThe Company has entered into a long-term maintenance contract with a third party to provide spare parts, technical assistance and availability guarantees for certain plant. The contract expires on 30 June 2019, and has a fixed and variable charge component.
(ii) Fuel commitmentsThe Company has contracted to purchase coal and gas supplies for thermal generation and retail gas sales. The contracts are for varying periods, annual quantities and prices. The coal contracts include a supply of approximately 101.3PJ (2009: 120.7PJ) of coal with one major contract extending out to 30 June 2014. In addition, at 30 June 2010 the coal stockpile contained approximately 23.1PJ of coal (2009: 19.6PJ). The firm gas contracts amount to approximately 336.7PJ (2009: 317.3PJ) with two contracts extending out 14 years from 2010.
(iii) Coal transportation commitmentThe Company has contracted a third party to provide coal transportation facilities from the Port of Tauranga to the Rotowaro rail receipt facility for a fixed annual charge of $1.0 million per annum, plus a per-tonne freight cost for coal transported. The contract term extends out to 26 December 2019, with a right of renewal for three further five-year terms.
(iv) Coal receipt facility commitmentThe Company has committed to a fixed annual rental and service fee of $1.7 million charged over the life of the contract for coal receipt facilities plus a variable charge for throughput tonnage. The contract extends out four years to 30 June 2014.
Page 114
Genesis Energy Annual Report 2010

(v) Advance metering services commitmentThe Company has contracted with a third party for the provision of data and services from Advanced Meters. The third party owns the Advanced Meters. The contract runs until 2023.
(vi) Joint venture commitmentsAs a joint venture participant, the Group is committed to certain operational commitments in respect of the Kupe Joint Venture. Under the arrangement, operational costs are shared in proportion to the respective interest held (2009: $16.1 million in order to develop the Kupe field).
The Group has no ongoing commitments to the Cardiff Joint Venture in relation to maintaining the Cardiff permit (2009: Nil).
The Group has no ongoing commitments to the Gasbridge Joint Venture (2009: Nil).
(vii) Associates commitmentsThe Group has no ongoing commitments in respect of its shares in associates (2009: Nil).
31. Related party transactions(a) Crown The Company is a state-owned enterprise and all shares are owned by the Crown, as represented by the Shareholding Ministers, Hon Bill English, Minister of Finance, and Hon Simon Power, Minister for State-Owned Enterprises.
The following represents individual and collectively significant transactions with the Crown and other Crown-related entities:
In August 2004, the Crown facilitated the development of the Huntly Unit 5 plant by agreeing to share a limited amount of risk with Genesis Energy around the long-term supply of gas. Both the Crown and Genesis Energy have already taken action to reduce this uncertainty: the Crown through the introduction of gas exploration incentives and Genesis Energy by entering into long-term gas contracts. The risk-sharing agreement runs for up to 10 years.
The Group also transacts with certain other Crown-related entities for the supply of coal and coal-handling facilities, emissions activities including emission unit purchases and sales, scientific consultancy services, electricity transmission and energy-related products (including electricity and gas supply contracts and hedges). These transactions are all conducted in the ordinary course of business and are contracted at arm’s length, at normal market prices and on normal commercial terms.
(b) Key management and personnel compensationThe key management personnel of the Company consists of the Directors and the executive management team.
Key management personnel compensation is as follows:
Group 30 June 2010
$’000
Group 30 June 2009
$’000
Short-term benefits 4,696 5,701
Post-employment benefits (including defined contribution plan contributions) 104 76
Termination benefits – 560
Total key management personnel 4,800 6,337
(c) Other transactions with key management personnel or entities related to themKey management personnel and their families purchase gas and electricity from the Group for domestic purposes on an arm’s-length basis.
During the year, aside from Directors’ fees included in key management compensation in (b) above, no other transactions took place between the Directors and the Group or Company (2009: $Nil).
At 30 June 2010, the net balance payable to Directors was $23,242 (2009: $1,482).
(d) Subsidiaries and joint venturesNotes 19 and 32 identify Group entities and joint ventures in which Genesis Power Limited has interests. All of these entities are related parties of the Company. Note 16 details the outstanding balances relating to these entities at balance date.
During the year, the subsidiaries advanced the Company $4.1 million (2009: Company advanced its subsidiaries $145.6 million) in order to meet operating and capital commitments. Offsetting these advances were subsidiary tax credits of $25.7 million (2009: $27.5 million) transferred to the Company.
These advances are unsecured and have no repayment terms or conditions attached. Interest is charged at a rate equal to the Company’s average borrowing cost. Net interest charged by the Company during the year was $36.1 million (2009: $28.3 million).
During the year, Cardiff No. 1 Limited, Cardiff No. 2 Limited and GP No. 4 Limited subsidiaries issued additional share capital of $22.0 million to the Parent Company. The additional share investments were subsequently impaired together with certain subsidiary loans totalling $0.3 million on the grounds that the recoverability of those loans and investments was not supported by assets in the subsidiary (2009: $7.7 million).
(e) Other related parties(i) Genesis Oncology TrustThe Group has a sponsorship agreement with the Genesis Oncology Trust. The annual sponsorship to be paid to the Trust amounted to $0.2 million (2009: $0.2 million). In 2010, the Group made additional donations of $0.3 million (2009: $0.2 million). The total amount outstanding at year-end was $0.1 million (2009: $0.2 million).
The Group provides the Trust with accounting and administrative support free of charge.
Albert Brantley (Chief Executive of Genesis Power Limited) is the Chairman of the Trust. Maureen Shaddick (General Counsel and Company Secretary of Genesis Power Limited) is the Deputy Chair of the Trust.
Page 115
Genesis Energy Annual Report 2010

(ii) Gas Industry Company LimitedThe Group has a 10.0 per cent share in the Gas Industry Company Limited. The Gas Industry Company is an industry-owned entity established to fulfil the role of the industry body under the Gas Act 1992. The entity, as the industry body, is the co-regulator of the gas industry, working with both the Government and the gas industry to develop outcomes that meet the Government’s policy objectives as stated in the Government’s April 2008 Policy Statement on Gas Governance.
During the year, the Group made payments to the Gas Industry Company in the form of levies and cost reimbursements totalling $2.1 million (2009: $2.5 million).
(iii) CRL Energy LimitedOn 30 June 2010, the Group sold its 50 per cent shareholding in CRL Energy Limited. CRL Energy is an energy solutions research company.
During the year, the Group made no payments (2009: Nil) to CRL Energy.
(iv) Other environmental restoration and enhancement and charitable trustsThe Group has identified a number of other trusts established for charitable or environmental enhancement and restoration purposes which fall within the scope of the definition of related parties. During the year, the Group made payments of $0.8 million (2009: $1.0 million) to these trusts.
32. Interests in joint ventures(a) Joint venture operations
Interest held by Company
Name of entity 2010 % 2009 % Principal activity
Kupe Joint Venture 31.0 31.0 Petroleum production
Cardiff Joint Venture 55.1 55.1 Petroleum exploration and development
Gasbridge Joint Venture 50.0 50.0 Liquefied natural gas importation development
The Group has a 31.0 per cent interest in the Kupe production facility and Petroleum Mining Permit 38146 held by the Kupe Joint Venture. Commissioning of the Kupe production facilities commenced on 4 December 2009 with the opening of the first offshore well (KS-6). Following the successful testing and commissioning of the production systems, commercial operations began on 22 March 2010.
The Group holds a 55.1 per cent interest in the Deep petroleum rights in Petroleum Exploration Permit 38738 and Petroleum Mining Permit 38156 held by the Cardiff Joint Venture. The Joint Venture has delayed further exploration and evaluation and the Group is looking to sell down its interests in the permit.
The Group has a 50.0 per cent interest in the Gasbridge Joint Venture. The Gasbridge Joint Venture was established to investigate the feasibility of developing facilities to import Liquefied Natural Gas at the Port of Taranaki. The Joint Venture has delayed this investigation until further notice.
(b) Share of joint venture assets, liabilities, revenue and expensesThe table below reflects the Group’s share of the joint venture trial balances. The table excludes items that are accounted for outside of the joint ventures such as income, petroleum inventory, royalties, receivables and taxation.
Group 30 June 2010
$’000
Company 30 June 2010
$’000
Group 30 June 2009
$’000
Company 30 June 2009
$’000
Current assetsCash and cash equivalents 9,492 – 21,029 –
Accounts receivable 1,342 – 664 –
Prepayments – – – –
Inventories – – 66 –
Total current assets 10,834 – 21,759 –
Non current assetsProperty, plant and equipment (including oil and gas assets) 459,051 – 385,114 –
Exploration and evaluation assets 20,159 – 44,964 –
Total non current assets 479,210 – 430,078 –
Total share of assets employed in joint venture 490,044 – 451,837 –
Current liabilitiesTrade payables (9,957) – (15,805) –
Total share of liabilities employed in joint venture (9,957) – (15,805) –
Income 219 – 648 –
Expenses (6,551) – (1,499) –
Share of profit (6,332) – (851) –
For capital expenditure commitments relating to the joint ventures, refer to note 30(c).
Refer to note 10 for details of impairment of assets.
Page 116
Genesis Energy Annual Report 2010

33. Resource consentsThe Group requires resource consents (authorisations to use land, water and air), obtained under the Resource Management Act 1991, to enable it to operate its thermal, hydro and wind power stations. The duration of resource consents varies up to a maximum of 35 years. The current resource consents within which the Group’s power stations operate are due for renewal at varying times, the earliest of which relates to the Huntly Power Station which is due for renewal in 2013. The renewal dates are fixed by the expiry date of the consent or, in the case of resource consents granted under earlier legislation where there is no expiry date, by the date set by the Resource Management Act 1991.
The term of the resource consents for part of the Tongariro Power Scheme was reduced from 35 years to 10 years by the Environment Court in 2004. The Company contested the legal basis for the reduced terms in the High Court which found in favour of the Company by reinstating the 35-year terms as well as sending the proceeding back to the Environment Court for reconsideration. This decision was again upheld in the Court of Appeal. A further application for leave to appeal to the Supreme Court has been adjourned. In the absence of any agreement, the proceeding will ultimately return to the Environment Court for reconsideration of the term decision.
34. Events occurring after the balance sheet dateDuring July 2010, the Company entered into a conditional sale agreement for the Kourarau Power Scheme. The parties have 12 months to satisfy or waive the conditions relating to the sale agreement.
During July 2010, the Company entered into a sale agreement for the Mangatoa Petroleum Exploration Permit (PEP) 381204.
During July 2010, the Company entered into a sale agreement for the Deep petroleum rights in Petroleum Exploration Permit 38738 and Petroleum Mining Permit 38156 held by the Cardiff Joint Venture. The sale is contingent on Ministerial approval.
During July 2010, the Company entered into agreements with a number of New Zealand banks for a total of $575.0 million of revolving cash advance facilities.
(2009: On 28 July 2009, the Group agreed to sell certain retail business assets relating to its public internet service offering. On 31 July 2009, the Company purchased 25.0 per cent of the shares in Energyhedge Limited. On 20 August 2009, the Company issued $50.0 million of medium-term notes. The notes are repayable on 20 February 2017.)
35. Reconciliation of profit or loss to net cash inflow from operating activities
Note
Group 30 June 2010
$’000
Company 30 June 2010
$’000
Group 30 June 2009
$’000
Company 30 June 2009
$’000
Profit (loss) for the year 69,314 59,908 (135,716) (145,491)
Items classified as investing/financing activities:
Net (gain (loss) on disposal of property, plant and equipment 11 (65) (79) (851) (851)
Net gain (loss) on consolidation of associate/joint venture – – 1,390 –
Net (gain) loss on acquisition or sale of investments 300 (50) – –
Net (gain) loss on acquisition or sale of intangibles (1,535) (1,535) – –
Interest paid and other finance charges 25,318 14,593 16,133 16,654
24,018 12,929 16,672 15,803
Non cash items:
Depreciation, depletion and amortisation expense 9 92,573 72,110 87,585 83,303
Revaluation loss 20 – – 261,389 261,389
Impairment 10 16,572 16,118 25,824 25,250
Change in fair value of derivative financial instruments 11 4,387 2,640 4,484 8,178
Change in deferred tax liabilities 26 10,149 2,790 (58,177) (83,404)
Change in capital expenditure accruals 11,874 3,436 43,254 43,254
Other non cash items 2,405 2,487 (67) –
137,960 99,581 364,292 337,970
Movements in working capital:
Change in trade and other receivables 35,700 43,027 210,947 212,352
Change in prepayments 766 (538) 19,868 273
Change in inventories (22,429) (21,496) (17,022) (17,022)
Change in creditors and employee entitlements (39,564) (31,491) (227,171) (158,625)
Change in current taxation receivable/payable 27,603 40,084 3,145 30,843
Change in provisions 23 9,277 669 27,853 11,800
11,353 30,255 17,620 79,621
Net cash inflow from operating activities 242,645 202,673 262,868 287,903
Page 117
Genesis Energy Annual Report 2010

Audit Report— for the year ended 30 June 2010
The Auditor-General is the auditor of Genesis Power Limited (the Company) and its subsidiaries (the Group). The Auditor-General has appointed me, Bruce Taylor, using the staff and resources of Deloitte, to carry out the audit of the financial statements of the Company and group, on her behalf, for the year ended 30 June 2010.
Unqualified opinionIn our opinion, the financial statements of the Company and Group on pages 63 to 117:
- comply with generally accepted accounting practice in New Zealand;
- comply with International Financial Reporting Standards; and
- give a true and fair view of:
- the Company’s and Group’s financial position as at 30 June 2010;
- and the results of operations and cash flows for the year ended on that date.
Based on our examination, the Company and Group kept proper accounting records.
The audit was completed on 27 August 2010, and is the date at which our opinion is expressed.
The basis of our opinion is explained below. In addition, we outline the responsibilities of the Board of Directors and the Auditor, and explain our independence.
Basis of opinionWe carried out the audit in accordance with the Auditor-General’s Auditing Standards, which incorporate the New Zealand Auditing Standards.
We planned and performed the audit to obtain all the information and explanations we considered necessary in order to obtain reasonable assurance that the financial statements did not have material misstatements, whether caused by fraud or error.
Material misstatements are differences or omissions of amounts and disclosures that would affect a reader’s overall understanding of the financial statements. If we had found material misstatements that were not corrected, we would have referred to them in our opinion.
The audit involved performing procedures to test the information presented in the financial statements. We assessed the results of those procedures in forming our opinion.
Audit procedures generally include:
- determining whether significant financial and management controls are working and can be relied on to produce complete and accurate data;
- verifying samples of transactions and account balances;
- performing analyses to identify anomalies in the reported data;
- reviewing significant estimates and judgements made by the Board of Directors;
- confirming year-end balances;
- determining whether accounting policies are appropriate and consistently applied; and
- determining whether all financial statement disclosures are adequate.
We did not examine every transaction, nor do we guarantee complete accuracy of the financial statements.
We evaluated the overall adequacy of the presentation of information in the financial statements. We obtained all the information and explanations we required to support our opinion above.
Responsibilities of the Board of Directors and the AuditorThe Board of Directors is responsible for preparing the financial statements in accordance with generally accepted accounting practice in New Zealand. The financial statements must give a true and fair view of the financial position of the company and group as at 30 June 2010 and the results of operations and cash flows for the year ended on that date. The Board of Directors’ responsibilities arise from the State-Owned Enterprises Act 1986 and the Financial Reporting Act 1993.
We are responsible for expressing an independent opinion on the financial statements and reporting that opinion to you. This responsibility arises from section 15 of the Public Audit Act 2001 and section 19(1) of the State-Owned Enterprises Act 1986.
IndependenceWhen carrying out the audit we followed the independence requirements of the Auditor-General, which incorporate the independence requirements of the New Zealand Institute of Chartered Accountants.
In addition to the audit we have carried out assignments in the area of other assurance services which are compatible with those independence requirements. In addition to these assignments, principals and employees of our firm deal with the Company and Group on arm’s length terms within the ordinary course of trading activities of the Company and Group. Other than the audit and these assignments and arm’s length transactions, we have no relationship with or interests in the Company, or any of its subsidiaries.
BRUCE TAYLORDeloitte On behalf of the Auditor-General Hamilton, New Zealand
This audit report relates to the financial statements of Genesis Power Limited (the company) and group for the year ended 30 June 2010 included on Genesis Power Limited’s website. The Board of Directors are responsible for the maintenance and integrity of Genesis Power Limited’s website. We have not been engaged to report on the integrity of Genesis Power Limited’s website. We accept no responsibility for any changes that may have occurred to the financial statements since they were initially presented on the website. The audit report refers only to the financial statements named above. It does not provide an opinion on any other information which may have been hyperlinked to/from these financial statements. If readers of this report are concerned with the inherent risks arising from electronic data communication they should refer to the published hard copy of the audited financial statements and related audit report dated 27 August 2010 to confirm the information included in the audited financial statements presented on this website. Legislation in New Zealand governing the preparation and dissemination of financial statements may differ from legislation in other jurisdictions.
To the readers of Genesis Power Limited and Group’s Financial Statements
Page 118
Genesis Energy Annual Report 2010

Global Reporting Initiative
The content of the on-line version of the Annual Report (of which this is an abbreviated version) was guided by the Global Reporting Initiative (GRI) Sustainability Reporting Guidelines Version 3.0 (G3) and the Electricity Utility Sector Supplement (2009).
The GRI Guidelines provide a voluntary reporting framework used by organisations globally for measuring, disclosing, and being held accountable to internal and external
stakeholders for organisation performance toward the goal of sustainable development.
We have reviewed the GRI G3 Reporting Principles for Defining Report Content and Quality, with emphasis on ensuring we provide a material representation of Genesis Energy’s sustainability performance.
The GRI also includes a suite of performance indicators relating to company profile, strategy, governance, stakeholder engagement and
environmental, economic and societal performance. The indicators accompany performance information in the report and in the GRI index.
The on-line version of the Annual Report meets the requirements of Application Level C+.
Indicator Description Level of disclosure
Location of disclosure (section/article)*
Explanation
EC1 Direct economic value generated and distributed, including revenues, operating costs, employee compensation, donations and other community investments, retained earnings, and payments to capital providers and governments.
Full Financial Highlights
Financial Statements
GRI Index
Genesis Power Ltd’s financial statements have been prepared in accordance with NZ equivalents to International Financial Reporting Standards. NZIFRS is not specifically structured the same as the GRI, but we have included the GRI requirements within the parameters of our summary financial reporting.
Genesis Energy’s 2009 community investments included in the London Benchmarking Group had a value of $2.26 million up from $1.76 million in 2008. While the business contributes to society in other ways, not all of these are included in the LBG criteria as community contributions.
EN3 Direct energy consumption by primary energy source.
Full Company Report/Production and New Generation/Performance Summary
Company Report/Internal Environmental Footprint/Travel
Our total direct energy consumption of (53 PJs) captures our generation fuel use (coal and gas) as well as our fleet use (diesel and gasoline 3654.7 GJs).
EN4 Indirect energy consumption by primary source.
Full Company Report/Our Environmental & Social Impact/Internal Environmental Footprint
It is not possible to identify the primary energy source of our purchased electricity due to the nature of electricity distribution in New Zealand. We have estimated primary energy consumption using the “New Zealand Energy Data File 2009 Calendar Year Edition” from the Ministry for Economic Development as:
Hydro 8,074 GJ
Gas 4,990 GJ
Coal 2,550 GJ
Geothermal 10,362 GJ
Wind 496 GJ
Total indirect energy consumed in terms of primary energy 26,474 GJ
Total indirect energy consumed in terms of indirect energy 12,959 GJ
*These references refer to the online version of the 2009/2010 Annual Report at genesisenergy.co.nz
Table continues over page
GRI Indicators for Application levelThe following 10 GRI Performance Indicators form part of the C+ GRI Application level.
Page 119
Genesis Energy Annual Report 2010

Indicator Description Level of disclosure
Location of disclosure (section/article)*
Explanation
EN16 Total direct and indirect greenhouse gas emissions by weight (i.e Scope 1 and 2 emissions as defined by the GHG protocol)EUSS: Report emissions intensity by generation type:• CO2e per MWh for net generation;• CO2e from fossil fuel generation per
MWh net fossil fuel generation; and• estimated net delivery to end users
which includes emissions from own generation as well as purchased power including line losses
Full Company Report/Production + New Generation/Greenhouse Gas Emissions
Our total direct and indirect emissions for the 2010 financial year were 3,530,497 tonnes of CO2e.
We have not reported on the EUSS requirements of gross purchased power including line losses as the responsibility for line losses lies with transmission companies to report.
EN23 Total number and volume of significant spills
Full Company Report/Our Environmental & Social Impact/Resource Consent Compliance
There have been no significant spills.
EN28 Monetary value of significant fines and total number of non-monetary sanctions for non-compliance with environmental laws and regulations
Full GRI Index There have been no significant fines or non-monetary sanctions for non-compliance with environmental laws and regulations.
LA2 Total number and rate of employee turnover by age group, gender, and region for the North Island
EUSS: For the employees leaving employment during the reporting period, provide the average length of tenure of employees leaving broken down by gender and age group
Full
No Disclosure
Company Report/Employees/Our changing workforce
Our annual turnover rate was 8.64%. In the reporting period we only had staff in one region – the North Island. The turnover rate by age and gender was:Under 24 5.6125-34 12.5035-44 8.9345-54 6.0655-64 3.0365+ 15.38Male 8.11Female 9.17
We have not reported on the EUSS requirement of average length of tenure as this is not material this year.
LA7 Rates of injury, occupational diseases, lost days, and absenteeism, and number of work-related fatalities by region.
EUSS: Report on health and safety performance of contractors and subcontractors working onsite or on behalf of the reporting organisation off-site
Full
Partial
Company Report/Employees/Health and Safety performance report
Genesis Energy (including Contact Centre)Injuries/100 employees 20.6Occupational diseases/100 employees 0Per cent lost days 0.02Per cent absentee days 3.62Contractors Injuries/100 employees 23.72
We report on key contractors working for Genesis Energy (150 contractors). Whilst we have many more contractors working for us, it is not possible to easily identify the boundaries of our contractor workforce, as it is difficult to differentiate between contractors and service providers in some instances.
LA12 Percentage of employees receiving regular performance and career development reviews.
Full Company Report/Employees/Foundations of Leadership
99 per cent of our employees received regular performance and career development reviews.
SO5 Public policy positions and participation in public policy development and lobbying.
Full Chairman’s report Company Report/Production + New Generation/Water Management Policy Participation
Ministerial Review – overallMinisterial Review – asset transfersMinisterial Review - new regulatorsWater reform - improve water management
For the complete GRI Index refer to the on-line version of the Annual Report.
Independent Assurance of the Annual ReportIn the context of the Global Reporting Initiative (GRI) Sustainability Reporting Guidelines the Sustainability content of the on-line version of the Annual Report (of which this is an abbreviated version ) has been assured by Deloitte, a third party independent assurance provider and Genesis Energy’s financial auditor on behalf of the Office of the Auditor General. A limited level of assurance has been given over the Sustainability assertions and quantifications included in the Annual Report. Refer to the on-line version of the Annual Report 2010 for the full Independent Assurance Statement.
Page 120
Genesis Energy Annual Report 2010

Corporate governance
The following is an overview of Genesis Energy’s main corporate governance practices. Genesis Energy has a strong focus on corporate governance and aims to comply with internationally recommended best corporate governance practices as they apply in New Zealand.
ShareholdersGenesis Energy is a state-owned enterprise pursuant to the State-Owned Enterprises Act 1986 (SOE Act) and is wholly owned by Her Majesty the Queen in Right of New Zealand (Crown). The Crown’s shareholding is held by the shareholding Ministers who as at 30 June 2010 were:
Hon Bill English Minister of Finance
Hon Simon Power Minister for State-Owned Enterprises
Shareholding Ministers appoint the Board of Directors. The Board provides shareholding Ministers with a Statement of Corporate Intent (SCI) on an annual basis outlining goals, objectives and business plans in respect of the relevant financial year and each of the immediately following two financial years.
Role of the Board of DirectorsThe Board is responsible for the governance, management and proper direction and control of the activities of Genesis Energy and its subsidiaries. Day to day management is delegated to the Chief Executive of the Company under a formal delegations of authority policy with specific reservations to the Board and on-going oversight by the Board of all activities of the Company.
Generally, the principal functions of the Board are to:
• confirm corporate objectives, establish policy and approve major strategies;
• ensure business risks are appropriately identified and controlled;
• oversee processes for financial reporting and compliance and ensure the integrity of the management information system;
• select and review the performance of the Chief Executive and review succession planning; and
• authorise the formation of any subsidiary companies and appoint directors and oversee governance of subsidiary companies.
The Board holds two annual strategic planning workshops with management each year, and reviews strategic initiatives throughout the year.
While the Board acknowledges that it is responsible for the overall control framework of Genesis Energy, it recognises that no cost effective internal control system will preclude all errors and irregularities. Written procedures, policies and guidelines, organisational structures allocating responsibilities, a programme of internal audit, regular reporting and the careful selection and training of qualified personnel all form part of the control framework, overseen by the Board.
In discharging its duties the Board requires management to submit annually, for its
consideration and approval, a business plan setting out the Company’s operation and development objectives. The Board also requires an annual budget, embracing the objectives of the adopted business plan, to be submitted for approval.
The Board monitors actual financial results compared to budget and forecasts on a monthly basis, and on a quarterly basis it reviews the Company’s performance compared to its business plan objectives.
The Board recognises the particular importance of, and the need to comply with, legislation controlling the environment and management of natural resources, consumer protection and safety and health of employees. For that reason, it monitors the Company’s compliance with the statutes concerned through consideration of regular reports from management.
Board membershipFrom the beginning of the year in review through to March 2010, the Board comprised nine non-executive, independent directors reducing to eight for the remainder of the year under review. All appointments to the Board are made by shareholding Ministers in accordance with section 36(1)(a)(i) of the Companies Act 1993 and the Company’s Constitution.
The Constitution provides that directors be appointed to the Board for a fixed term not exceeding three years. Shareholding Ministers may choose to renew an appointment for further fixed terms of up to three years.
Shareholding Ministers appoint the Board Chair and Deputy Chair.
The names of the directors holding office during the year in review, including details of their qualifications, special responsibilities and standing committee memberships, are set out on page 76:
Page 121
Genesis Energy Annual Report 2010
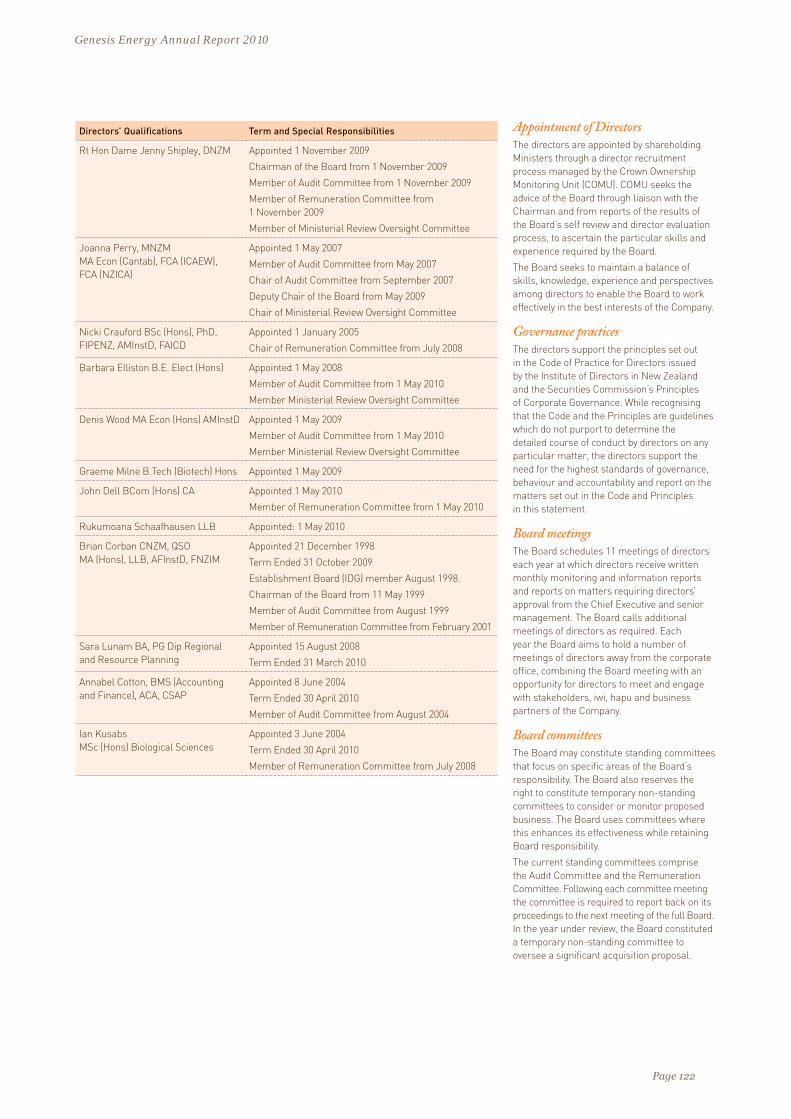
Appointment of DirectorsThe directors are appointed by shareholding Ministers through a director recruitment process managed by the Crown Ownership Monitoring Unit (COMU). COMU seeks the advice of the Board through liaison with the Chairman and from reports of the results of the Board’s self review and director evaluation process, to ascertain the particular skills and experience required by the Board.
The Board seeks to maintain a balance of skills, knowledge, experience and perspectives among directors to enable the Board to work effectively in the best interests of the Company.
Governance practicesThe directors support the principles set out in the Code of Practice for Directors issued by the Institute of Directors in New Zealand and the Securities Commission’s Principles of Corporate Governance. While recognising that the Code and the Principles are guidelines which do not purport to determine the detailed course of conduct by directors on any particular matter, the directors support the need for the highest standards of governance, behaviour and accountability and report on the matters set out in the Code and Principles in this statement.
Board meetingsThe Board schedules 11 meetings of directors each year at which directors receive written monthly monitoring and information reports and reports on matters requiring directors’ approval from the Chief Executive and senior management. The Board calls additional meetings of directors as required. Each year the Board aims to hold a number of meetings of directors away from the corporate office, combining the Board meeting with an opportunity for directors to meet and engage with stakeholders, iwi, hapu and business partners of the Company.
Board committeesThe Board may constitute standing committees that focus on specific areas of the Board’s responsibility. The Board also reserves the right to constitute temporary non-standing committees to consider or monitor proposed business. The Board uses committees where this enhances its effectiveness while retaining Board responsibility.
The current standing committees comprise the Audit Committee and the Remuneration Committee. Following each committee meeting the committee is required to report back on its proceedings to the next meeting of the full Board. In the year under review, the Board constituted a temporary non-standing committee to oversee a significant acquisition proposal.
Directors’ Qualifications Term and Special Responsibilities
Rt Hon Dame Jenny Shipley, DNZM Appointed 1 November 2009
Chairman of the Board from 1 November 2009
Member of Audit Committee from 1 November 2009
Member of Remuneration Committee from 1 November 2009
Member of Ministerial Review Oversight Committee
Joanna Perry, MNZM MA Econ (Cantab), FCA (ICAEW), FCA (NZICA)
Appointed 1 May 2007
Member of Audit Committee from May 2007
Chair of Audit Committee from September 2007
Deputy Chair of the Board from May 2009
Chair of Ministerial Review Oversight Committee
Nicki Crauford BSc (Hons), PhD, FIPENZ, AMInstD, FAICD
Appointed 1 January 2005
Chair of Remuneration Committee from July 2008
Barbara Elliston B.E. Elect (Hons) Appointed 1 May 2008
Member of Audit Committee from 1 May 2010
Member Ministerial Review Oversight Committee
Denis Wood MA Econ (Hons) AMInstD Appointed 1 May 2009
Member of Audit Committee from 1 May 2010
Member Ministerial Review Oversight Committee
Graeme Milne B.Tech (Biotech) Hons Appointed 1 May 2009
John Dell BCom (Hons) CA Appointed 1 May 2010
Member of Remuneration Committee from 1 May 2010
Rukumoana Schaafhausen LLB Appointed: 1 May 2010
Brian Corban CNZM, QSO MA (Hons), LLB, AFInstD, FNZIM
Appointed 21 December 1998
Term Ended 31 October 2009
Establishment Board (IDG) member August 1998.
Chairman of the Board from 11 May 1999
Member of Audit Committee from August 1999
Member of Remuneration Committee from February 2001
Sara Lunam BA, PG Dip Regional and Resource Planning
Appointed 15 August 2008
Term Ended 31 March 2010
Annabel Cotton, BMS (Accounting and Finance), ACA, CSAP
Appointed 8 June 2004
Term Ended 30 April 2010
Member of Audit Committee from August 2004
Ian Kusabs MSc (Hons) Biological Sciences
Appointed 3 June 2004
Term Ended 30 April 2010
Member of Remuneration Committee from July 2008
Page 122
Genesis Energy Annual Report 2010

Audit CommitteeThe Audit Committee has power of recommendation to the Board and is scheduled to meet no less than four times a year, with additional meetings being convened when required.
The principal purpose of the Audit Committee is to assist the Board in the proper and efficient discharge of its responsibilities to exercise due care and skill in relation to:
• Integrity of external financial reporting;
• Financial management;
• Internal control systems;
• Accounting policy and practice;
• Risk management framework and monitoring compliance with that framework; and
• Compliance with applicable laws, regulations and standards.
The Chair of the Audit Committee is a Chartered Accountant and is not the Chairman of the Board.
The Board has established full terms of reference for the Audit Committee which are reviewed annually.
Remuneration CommitteeThe Remuneration Committee has power to recommend to the Board and is scheduled to meet no less than twice a year, with additional meetings being convened when required.
The principal purpose of the Remuneration Committee is to assist the Board in the discharge of its responsibilities relative to the setting and review of the terms of employment and remuneration of the Company’s Chief Executive, the review of the terms of employment and remuneration of direct reports to the Chief Executive and the setting and reviewing of policy in relation to directors’ fees and expenses.
The Board has established full terms of reference for the Remuneration Committee which are reviewed annually.
Additional CommitteeIn the year under review, directors Dame Jenny Shipley, Joanna Perry, Barbara Elliston and Denis Wood were appointed by the Board to the Ministerial Review Oversight Committee to provide oversight of the proposed acquisition of Tekapo A and B Power Stations and other transactions as contemplated in the Electricity Industry Bill which was introduced into the House of Representatives in December 2009 following the Ministerial Review into the Performance of the Electricity Industry. The Committee was established in February 2010 and is expected to remain constituted until 31 October 2010. The Committee is chaired by Joanna Perry.
Attendance at meetingsIn the year ended 30 June 2010, there were 13 Board meetings including two teleconference meetings, seven Audit Committee meetings and six Remuneration Committee meetings. Attendance at Board and Committee meetings was as follows:
Directors
Board Attendance
(scheduled and additional)
Audit Committee
Remuneration Committee
Ministerial Review
Oversight Committee
Rt Hon Dame Jenny Shipley (from 1 November 2009)
8 5 4 6
Joanna Perry 12 7 8
Nicki Crauford 12 6
Barbara Elliston 13 1 8
Denis Wood 13 7 8
Graeme Milne 13
John Dell (from May 2010) 2 2
Rukumoana Schaafhausen (from May 2010)
2
Brian Corban (to October 2009) 5 2 3
Sara Lunam (to March 2010) 9
Annabel Cotton (to April 2010) 9 6
Ian Kusabs (to April 2010) 10 3
All directors attended two joint Board and senior management strategic planning workshops in February 2010.
Risk managementThe Board requires the Company to operate rigorous processes for risk management and internal control. Genesis Energy has developed a comprehensive, enterprise-wide risk management framework which is reviewed by the Board on an annual basis.
The Company’s management actively participates in the identification, assessment and monitoring of new and existing risks. Particular attention is given to the market risks that could impact on Genesis Energy. All trading activities are consistent with the requirements and procedures stipulated in the Company’s Market Risk Policy and credit risks arising in the retail business are managed through the Credit Risk Policy. Both of these policies are approved by the Board and are subject to regular oversight by a committee of senior executives.
Management undertakes regular reporting to apprise the Audit Committee and the Board of the Company’s key risks and the treatment of those risks.
AuditThe Board has adopted a policy to prevent its auditors providing services on any matters that may compromise audit independence.
External AuditIn accordance with section 19 of the SOE Act, the Office of the Controller and Auditor General is required to express an opinion on Genesis Energy’s financial statements and pursuant to section 15 of the Public Audit Act 2001, has
appointed Bruce Taylor of Deloitte to undertake the audit on its behalf.
The Audit Committee meets regularly with the external auditor and the Board requires regular financial reports and information from management throughout the year, which enable the Board to give a true and fair view of the financial position of the Company and the Genesis Power Limited Group.
In the year under review, Deloitte also provided certain services involving a limited assurance in relation to the sustainability content of the Annual Report and related advice. The value of these other services is detailed in the Financial Statements.
Internal AuditGenesis Energy has outsourced its internal audit function which monitors the Company’s internal control systems and risk management and the integrity of the financial information reported to the Board. Internal audit operates both with and independently from management and reports its findings directly to the Audit Committee. The Audit Committee reviews the annual internal audit plan and recommends the same for acceptance by the Board. Internal audit liaises with the external auditor, who also reviews the systems of internal control to the extent necessary to support its audit opinion.
The Company has appointed Ernst & Young as its internal auditor. The Audit Committee meets regularly with the internal auditor.
Both the internal auditor and the external auditor have unrestricted access to the Audit Committee and to the Board.
Page 123
Genesis Energy Annual Report 2010

SustainabilityThe Board recognises that Genesis Energy has obligations under the SOE Act to be a good employer and to exhibit a sense of social responsibility by having regard to the interests of the community in which it operates and by endeavouring to accommodate or encourage these when able to do so. However, the Board believes that sound business practice necessitates an approach that looks beyond simple compliance with strict legal requirements.
Accordingly, Genesis Energy has adopted a sustainable business model requiring that business decisions are made within a wide context including the economic and environmental impacts of the decision, the views and expectations of stakeholders, and the impact of today’s decisions on future generations.
The incorporation of the following objectives within the Company’s business operations is intended to drive the performance of Genesis Energy:
Category Business Objectives
Financial To be fiscally responsible whilst delivering on shareholder value and performance expectations.
Governance and Benchmarking To follow best practice in corporate governance and benchmark the company’s sustainability performance.
Production and New Generation To provide economic production and new generation solutions that demonstrate strong sustainability performance
Customers To be recognised as a leading New Zealand energy provider with excellent customer service
Our Environment and Social Impact
To manage responsibly Genesis Energy’s environmental and social impact while growing our business
Employees To partner with our people for success.
Community, Iwi, Hapu and Stakeholders
To engage meaningfully with the communities, iwi and hapu in the areas in which we operate and with other key stakeholders.
Stakeholder and Iwi engagementThe Board requires management to provide regular reporting on the nature and extent of stakeholder and iwi and hapu engagement and consultation pertinent to the Company’s business interests and the communities in which it operates.
The Company seeks to establish opportunities at various levels of the business which ensure ongoing and regular consultation.
The Company carries out customer, stakeholder and employee surveys on a regular basis and as required by the Board from time to time.
Board self reviewThe Board undertakes an annual self review process. High level outcomes from this process are required to be reported to COMU. In addition, the directors review the Chairman and the Chairman reviews each director. Evaluation templates, online questionnaires and group and one-on-one discussions are all part of the suite of tools available to the Board to facilitate the review process.
Board training and developmentThe Board recognises the importance of continuing education for the role, duties and knowledge requirements of directorship in New Zealand. Directors, whether new to the role or experienced senior directors, are given the opportunity to participate in training and development programmes made available by COMU, the Institute of Directors and other providers. Board members may partake in specific industry conferences and workshops to keep abreast of developments particular to the business of the Company.
A Director Induction Programme, including operational site visits and meetings with management in key functions is completed at the commencement of each director’s term to ensure a broad understanding of the business and the Company’s assets.
During the individual director evaluations with the Chairman, as part of the Board’s annual review process, the Chairman and directors have a specific opportunity to discuss and plan individual director’s training and development needs.
Page 124
Genesis Energy Annual Report 2010

Performance based remunerationA percentage of the Chief Executive’s total remuneration and that of each of the Company’s senior executives is linked to the achievement of performance objectives, financial, environmental, health and safety and social targets which are agreed and reviewed on an annual basis.
The Board, through the Remuneration Committee, agrees the Chief Executive’s performance targets and the percentage of at-risk salary attached to each target and undertakes a six monthly and annual review of the Chief Executive’s performance to determine the amount of at-risk salary payable.
Conflicts of interestThe Board has adopted a policy that prohibits any director providing services, in any capacity, to the Company except with the prior written approval of shareholding Ministers.
All directors are required to disclose any conflicts of interest or if they have an interest in any transaction, in which case, generally, they will not be entitled to partake in the discussion or to vote in relation to that transaction.
To facilitate the disclosure of interests and identification of any actual or perceived conflicts of interests the Company’s Disclosure of Interests Register is tabled and reviewed at the beginning of each Board meeting.
Ethical behaviourThe Board has adopted policies to provide guidance to directors, management and staff as to the expected standard of behaviour in conducting the business of the Company. These include policies covering directors’ and employees’ expenses and reimbursements, the use of credit cards, sensitive expenditure, the giving and receipt of gifts, probity when dealing with suppliers, the treatment of fraudulent actions and protected disclosures.
Shareholder relationshipThe SOE Act provides a comprehensive outline of a state owned enterprise’s reporting responsibilities and accountability. The business planning process culminates in the delivery of a final SCI for tabling in Parliament. Before the SCI is finalised the Company is required to provide shareholding Ministers with a draft SCI, supported by the Company’s business plan, to enable shareholding Minsters and their advisers to assess the SCI. In preparing the SCI, the Company is required to consider and address the Company’s objectives and nature and scope of activities, to provide financial and non-financial performance indicators and an estimate of current commercial value, to state the Company’s dividend policy and to indicate the matters in respect of which the Company will consult with shareholding Ministers.
The Company is required under the SOE Act to provide annual and six monthly reports. In addition, shareholding Ministers also expect quarterly reporting to shareholding Ministers. This quarterly report is required to fully and accurately summarise the Company’s performance against budget, identify the cause of major variances, signal any potential developing issues and highlight major achievements for the quarter as well as the number of full time equivalent staff employed by the Company and a clear statement of the outlook for the rest of the financial year.
Shareholding Ministers expect the Board to be sensitive to their interests and to be mindful that Ministers are accountable to a wider audience. Accordingly, the Board has approved practices which endeavour to ensure shareholding Ministers are informed well in advance of any material or significant events, transactions and other issues relating to the Company that may be contentious or could attract wide public interest, whether positive or negative.
COMU acts as the liaison between shareholding Ministers and the Company and facilitates quarterly meetings. COMU issues an Owner’s Expectations Manual which is provided to each director to ensure directors are aware of the Crown’s expectations of state owned enterprise directors.
The Board has adopted a policy that requires all communications with shareholding Ministers, whether in writing or in person, to be authorised by the Board.
The Board requires regular monthly reports from management on all communications with Ministers and officials.
Continuous disclosureWith the aim of increasing transparency of state owned enterprises and to provide the public with a more continuous flow of information regarding SOE performance, shareholding Ministers have, since January 2010, required a number of the larger state owned enterprises to comply with newly developed SOE Continuous Disclosure Rules. The rules require the immediate disclosure of Material Information. Material Information includes information that would have a material effect on the Company’s commercial valuation, information in relation to dividends different from that in the Company’s most recent SCI and Material Transactions, being transactions the value of which is greater than five percent of the current commercial value of the Company. The Rules further require public announcement of comparative financial performance information no later than 60 days after the end of each half and full year period.
A Board approved policy has established the internal processes for identifying, reporting and timely disclosure of Material Information.
All disclosures are placed on the Company’s website and The Treasury website. As at 30 June 2010 Genesis Energy had made six disclosures under the SOE Continuous Disclosure Rules.
Page 125
Genesis Energy Annual Report 2010

Performance against Statement of Corporate Intent— for the year ended 30 June 2010
Financial performance targets Notes SCI target SCI actual
Net profit after tax to average shareholders’ funds 1.9% 4.9%
Net operating profit after tax to average debt plus equity 2.5% 4.3%
Earnings before interest and tax to average total assets 2.8% 5.1%
Debt to debt plus equity 31.0% 27.0%
Consolidated shareholders’ funds to total assets 54.0% 57.0%
Interest cover: EBITDAF to finance cost 1 5.7% 10.1%
Efficiency: EBITDAF to revenues 9.3% 13.1%
Non–financial performance targets
Productivity $/MWh (EBITDAF/MWh generation) 25 33
Number of significant RMA non-compliances 2 0 0
Customer satisfaction 3 85.0% 82.0%
Power station availability
– Hydro 94.0% 92.3%
– Thermal 85.0% 84.3%
Forced outage factor
– Hydro 0.26% 1.09%
– Thermal 1.00% 1.60%
Lost time injuries 0 10
The Statement of Corporate Intent (SCI) for the period 1 July 2009 to 30 June 2012 was submitted to shareholding Ministers by the Board of Directors of Genesis Power Limited (Genesis Energy) in accordance with section 14 of the State-Owned Enterprises Act 1986 (Act).
The SCI, as required by the Act, specifies information in respect of the financial year in question and each of the two immediately following financial years. Genesis Energy also voluntarily provides information for an additional two years above the Act requirement. Set out to the right is a table reporting on performance against SCI targets for the year-end 30 June 2010.
Notes1. ‘EBITDAF’ is earnings before interest, tax, depreciation, amortisation, financial instruments
and impairment.
2. ‘Significant’ refers to those incidents which are more than minor and for which it is appropriate to notify the consent authority (over and above standard notification of minor consent non-compliances in consent monitoring reports).
3. Based on a survey question: “How do you rate the overall performance of your energy supplier?” Percentage of customers rating Genesis Energy as good, very good or excellent.
Page 126
Genesis Energy Annual Report 2010

Directors holding office during accounting periodThe names of the directors of Genesis Power Limited, trading as Genesis Energy (Genesis Energy) or (Company), and its subsidiary companies, during the accounting period 1 July 2009 to 30 June 2010 are shown below.
Disclosure of InterestThe general disclosures of interest made by directors of Genesis Energy and its subsidiaries, pursuant to section 140(2) of the Companies Act 1993 (Companies Act), are shown below. There were no declarations of interest made pursuant to section 140(1) of the Companies Act entered in the Interests Registers of Genesis Energy or its subsidiary companies. No director of Genesis Energy is a shareholder of Genesis Energy or any of its subsidiary companies.
Interest Register entriesIn accordance with section 211(1)(e) of the Companies Act, particulars of the entries in the Interests Register of Genesis Energy made during the accounting period are as set out below. New or adjusted entries made during the accounting period are marked with an asterisk (*).
Statutory Information
Rt Hon Dame Jenny Shipley, DNZM Chairman
- Chair of Seniors Money International Ltd- Chair of Mainzeal Property and Construction Ltd- Chair of Venator Search Limited;*- Chair of and Trustee of Heart Health Research Trust *- Managing Director of Jenny Shipley New Zealand Ltd- Director of Education New Zealand International Ltd- Director of Momentum Holdings Ltd- Director of Momentum Consulting Group Ltd- Director of Investment Savings and Insurance Association- Director of China Construction Bank Corporation- Trustee of NZ Global Women*
Joanna Perry, MNZM Deputy Chair
- Chairman of Financial Reporting Standards Board- Director and Shareholder of JMGP Limited- Director of Kiwi Income Property Limited- Director of PSIS Limited- Director of AsureQuality Limited- Director of Rowing New Zealand *- Trustee of Melanesian Mission Trust Board- Member of Australian Accounting Standards Board- Member of Policy Council and New Zealand Regional Council for
Financial Services Institute of Australasia - Member of the Audit Committee of the Victorian Auditor
General’s Office- Member of Speaker’s Assurance Committee- Member of International Financial Reporting Interpretations
Committee (IFRIC) - Member of New Zealand Regional Council for Financial Services
Institute of Australia
Dr Nicola Crauford - Director of Centre for Advanced Engineering- Director and Shareholder of Crauford Robertson Consulting Limited- Director and Shareholder of Martin Crauford Limited- Chief Executive of Institute of Directors, New Zealand- Member of Nominations and Governance Committee of New Zealand
Institute of Chartered Accountants *- Member of the Electoral Authority of PSIS Limited *
Denis Wood - Chairman of Mercy Healthcare Limited and its subsidiaries - Chairman of Mercy Hospice Auckland Limited- Director of Tower Limited - Director and sole Shareholder of DMW Investments Limited
Graeme Milne - Chairman of New Zealand Pharmaceuticals Limited- Chairman of Synlait Limited- Chairman of Terracare Limited- Chairman of Encoate Holdings Limited- Chairman of Waikato District Health Board- Shareholder of Media Profile Limited- Director of Farmers Mutual Group- Director of Satara Co-operative Group Limited- Director of New Zealand Institute for Rare Disease Research Limited- Board member of the Advisory Board School of Engineering and
Advanced Technology, Massey University *- Partner of G.R. & J. A. Milne- Trustee of Rockhaven Trust
John Dell - Managing Director and Shareholder of Japad Trading Limited- Managing Director and Shareholder of Japad Limited- Managing Director of Japad Long Term Investments Limited- Non Executive Director of Unimarket Holdings Limited- Non Executive Director of Euroglass Systems Limited
and its subsidiaries- Trustee of Japad Family Trust- Trustee of Japad Investment Trust- Trustee of The Otago Trust - Trustee of Cuthby Trust- Trustee of Newcastle Trust.
Page 127
Genesis Energy Annual Report 2010

Rukumoana Schaafhausen
- Director of Tainui Group Holdings Limited- Executive Member of Waikato-Tainui Te Kauhanganui Incorporated,
the trustee of the Waikato Raupatu Lands Trust and Waikato Raupatu River Trust.
Barbara Elliston - Director of Solar Power and Renewables Company Limited- Director of SPARCO Limited *- Director of Investment Vehicle Limited- Director of King Solar Limited *- Director of Sun King Solar Limited *- Director of The Solar Hot Water Company Limited- Director of Elliston Power Consultants Limited- Director of Timeless by Design Limited- Director of Fireball Limited- Director of Azzuro Solar Limited *- Director of Solar Imports Limited *- Director of Eco Warm Solutions Limited *
Brian Corban CNZM, QSO
- Chairman and Shareholder of Corban Consultants Limited- Chairman and Shareholder of Lindsay Corban Associates Limited- Chairman and Shareholder of Ngatarawa Wines Limited- Chairman and Trustee of Corban Estate Arts Centre- Chairman of Melanesian Mission Trust Board- Chairman of Corbans Viticulture Limited- Chairman of West Auckland Trust Services Limited- Chairman of Languages International Limited- Chairman Frontier Global Limited- Director of Frontier Mapping (NZ) Limited - Consultant of Corban Revell Lawyers- Trustee of Royal New Zealand Navy Museum- Trustee of West Auckland Hospice Foundation Trust- Trustee of Waitakere Enterprise Board- Advisory Council Member of the Church of Melanesia- Member of Speaker’s Assurance Committee
Sara Lunam - Chair of WNC 2007 Limited- Director of NZ Post Limited- Director of New Zealand Merino Company Limited
Annabel Cotton - Director of Merlin Consulting Limited- Director of Barramundi Limited - Director of Kingfish Limited * - Director of Marlin Global Limited- Director of Anamallai Tea Estates & Ropeway Company Limited- Director of Riverbend Dairy Farms Limited- Member of Securities Commission and the Commissioner for
Financial Advisers *
Ian Kusabs - Chairman of the Lake Taupo Sustainable Management Group- Director and Shareholder of Ian Kusabs and Associates.- Member of Lake Taupo management board.- Advisor of Ngati Tuwharetoa- Fisheries associate of Wildland Consultants- Fisheries associate of Charles Mitchell and Associates- Member of Lake Taupo Protection Project Joint Committee- Member of Lake Taupo Liaison sub-committee- Member of Foundation for Research 2009/10 Advisory Group *
Indemnity and InsuranceIn accordance with section 162 of the Companies Act and the Company’s constitution, Genesis Energy has indemnified and arranged insurance for all current and former directors and executive officers of the Company and its subsidiary companies in respect of all liabilities to persons (other than the Company or a related body corporate) to the extent permitted by law which arise out of the performance of their normal duties as directors or executive officers unless the liability relates to conduct involving a lack of good faith. In authorising the insurance to be effected each director signed a certificate stating that in their opinion the cost of the insurance is fair to the Company.
Use of Company InformationNo notices have been received by the Board of Genesis Energy under section 145 of the Companies Act with regard to the use of Company information received by directors in their capacities as directors of the Company or its subsidiary companies.
Page 128
Genesis Energy Annual Report 2010

Remuneration of DirectorsShareholding Ministers advise the Board the total allowance for fees available to directors of Genesis Energy and its subsidiary companies. The following table sets out the total remuneration before withholding tax and excluding GST (including remuneration for standing and temporary committee membership) and the value of other benefits received from Genesis Energy by each director of the Company during the period 1 July 2009 to 30 June 2010.
Name Total $
Rt Hon Dame Jenny Shipley (term commenced 1 November 2009) 65,328
Joanna Perry 67,181
Nicki Crauford 53,960
Barbara Elliston 46,714
Denis Wood 46,756
Graeme Milne 45,301
John Dell (term commenced 1 May 2010) 8,029
Rukumoana Schaafhausen (term commenced 1 May 2010) 7,505
Brian Corban (term ended 31 October 2009) 32,735
Sara Lunam (resigned 31 March 2010) 33,975
Ian Kusabs (term ended 30 April 2010) 41,169
Annabel Cotton (term ended 30 April 2010) 42,455
John Stace (term ended 30 April 2009) 352
During the year in review, Brian Corban, CNZM, QSO ended his term as a director and Chairman of Genesis Energy on 31 October 2009. Sara Lunam resigned as a director on 31 March 2010. Annabel Cotton’s and Ian Kusabs’ respective terms as directors ended on 30 April 2010. Rt Hon Dame Jenny Shipley was appointed as a director and Chairman of the Board with effect from 1 November 2009. Joanna Perry was reappointed as a director and Deputy Chair with effect from 1 May 2010. John Dell and Rukumoana Schaafhausen were appointed as directors with effect from 1 May 2010.
Directors of Subsidiary Companies During the year in review Brian Corban ceased to be a director, effective 31 October 2009, of the following wholly owned subsidiaries:
• Genesis Power Investments, Kinleith Cogeneration Limited, Kupe Holdings Limited, GP No. 1 Limited, GP No. 2 Limited, GP No. 4 Limited, GP No. 5 Limited, Cardiff Holdings No. 1 Limited, Cardiff Holdings No. 2 Limited, Mangatoa No. 1 Limited, Mangatoa No. 2 Limited, Mangatoa No. 3 Limited, Mangatoa No. 4 Limited and Mangatoa No. 5. Limited.
Rt Hon Dame Jenny Shipley and Mark Anderson joined Albert Brantley as directors of those companies with effect from 1 November 2009.
With effect from 19 June 2010 Mangatoa No. 1 Limited, Mangatoa No. 2 Limited, Mangatoa No. 3 Limited, Mangatoa
Remuneration of EmployeesIn accordance with section 211(1)(g) of the Companies Act, the number of employees, or former employees of Genesis Energy who, during the period, received remuneration and other benefits the value of which exceeded $100,000 is as follows:
Record of Employees Earning over $100,000 in year ending 30 June 2010
$970,000 - $980,000 1
$480,000 - $490,000 1
$440,000 - $450,000 2
$430,000 - $440,000 1
$390,000 - $400,000 1
$360,000 - $370,000 1
$350,000 - $360,000 3
$280,000 - $290,000 2
$220,000 - $230,000 2
$210,000 - $220,000 1
$200,000 - $210,000 2
$180,000 - $190,000 1
$170,000 - $180,000 5
$160,000 - $170,000 7
$150,000 - $160,000 6
$140,000 - $150,000 5
$130,000 - $140,000 21
$120,000 - $130,000 35
$110,000 - $120,000 48
$100,000 - $110,000 50
Total staff earning $100k + 195
Staff included who are no longer employed by Genesis Energy
9
Rt Hon Dame Jenny Shipley, DNZM Chairman
Joanna Perry, MNZM Deputy Chairman
No. 4 Limited and Mangatoa No. 5. Limited were amalgamated into Genesis Power Investments Limited.
The directors of wholly owned subsidiary Energy Online Limited are Albert Brantley, Mark Anderson and Dean Carroll.
Albert Brantley and Mark Anderson are directors of Gasbridge Limited in connection with Genesis Energy’s 50 percent ownership of Gasbridge Limited.
Genesis Energy senior executives Mark Anderson, Allan Melhuish and Richard Pearce were directors of CRL Energy Limited in connection with Genesis Energy’s 50.0 per cent ownership of CRL Energy Limited until its sale on 30 June 2010 from which date they ceased to be directors of CRL Energy Limited.
Following the unconditional agreement to purchase Slopedown Wind Farm Limited on 30 June 2010, Albert Brantley and Mark Anderson became directors of Slopedown Wind Farm Limited with effect from 21 July 2010.
None of the directors of the subsidiary companies received any remuneration or other benefits during the period specifically in relation to their duties as directors of these companies, other than the benefit of an indemnity from Genesis Energy and the benefit of insurance cover in respect of all liabilities to persons (other than the Company or related body corporate), to the extent permitted by law, which arise out of the performance of their normal duties as directors unless the liability relates to conduct involving a lack of good faith.
Page 129
Genesis Energy Annual Report 2010

Directory
Board of directors Executive management team Address of office
Chairman Rt Hon Dame Jenny Shipley, DNZM
Chief Executive Albert Brantley
Corporate Office 602 Great South Road PO Box 17188, Greenlane
Directors
Joanna Perry, MNZM (Deputy Chair)
Nicki Crauford
Barbara Elliston
Denis Wood
Graeme Milne
Rukumoana Schaafhausen
John Dell
General Counsel and Company Secretary Maureen Shaddick
GM Finance Mark Anderson
GM Retail Dean Carroll
GM Production Bob Weir
GM Corporate Affairs Malcolm Alexander
GM Generation Development Richard Pearce
GM Corporate Services Peggy Molyneux
GM Fuel Allan Melhuish
GM Energy Online Nic McCondach
Telephone: 64 9 580 2094
Facsimile: 64 9 580 4894
Auditor Bruce Taylor of Deloitte has been appointed to perform the audit on behalf of the Auditor-General.
Bank Westpac
Solicitors Russell McVeagh
For further information email: [email protected]
Design by Designworks.
Printed in New Zealand on Environmentally Responsible Novatech which has EMAS, ISO14001, and FSC certifications and is Elemental Chlorine Free.
GRI Application Level
2002 C C+ B B+ A A+ in accordance
Self Declared
Third Party Checked
GRI Checked
optio
nal
man
dato
ry
repo
rt e
xter
nally
ass
ured
repo
rt e
xter
nally
ass
ured
repo
rt e
xter
nally
ass
ured
Page 130