annual report 2006 - · PDF fileannual report 2006 DISCOVERY ANNUAL ... 100% Science-based...
189
annual report 2006
Transcript of annual report 2006 - · PDF fileannual report 2006 DISCOVERY ANNUAL ... 100% Science-based...

www.discovery.co.za
annual report 2006
DISC
OV
ERY
AN
NU
AL R
EPO
RT
20
06
Discovery covers 9/11/06 0:36 Page 1

CONTENTS
Group operating structure 2
Group financial highlights 3
Group at a glance 6
Chief executive’s report 8
Discovery Health report 18
Discovery Life report 26
Discovery Vitality report 32
Destiny Health report 38
PruHealth report 44
Value added statement 50
Group consolidated embedded value statement 51
Directorate, secretary and corporate governance committees 64
Corporate governance 67
Annual financial statements 72
Shareholders’ information 177
›DISCOVERY’S CORE PURPOSE:
TO MAKE PEOPLEH E A LT H I E R A N D E N H A N C EAND PROTECT THEIR L IVES
OUR BUSINESS IS BUILT ON AN ETHOS OF MEETING
CLIENTS’ NEEDS F IRST AND FOREMOST
Discovery covers 9/11/06 0:36 Page 2

D I S C O V E R Y A N N U A L R E P O R T 2 0 0 6 1
MEETING CLIENTS’ NEEDS THROUGH INNOVATIVE SOLUTIONS
AND CAREFUL RISK MANAGEMENT CREATES A SUSTAINED
DEMAND FOR OUR PRODUCTS, WHICH IN TURN LEADS TO
SUPERIOR PROFITABIL ITY AND STRONG GROWTH
DISCOVERY IS AT ONCE CONSERVATIVE IN ITS APPROACH TO
FINANCIAL RISK-TAKING, INNOVATIVE IN ITS PRODUCT DESIGN
AND RESPONSIVE TO CONSUMER NEEDS
A SOLUTION-CENTRIC BUSINESSBUILT ON ORGANIC GROWTH
It was a successful year for Discovery with
important developments in each of its
businesses, strong earnings growth and the
declaration of a maiden dividend.
All of Discovery’s businesses focused
intensely on innovations designed
to meet specific client needs –
resulting in strong organic growth.
A SUCCESSFUL YEAR
7558-discovery front 7-11 9/11/06 2:02 Page 1

D I S C O V E R Y A N N U A L R E P O R T 2 0 0 62
100% South Africa’s leading private health care funder
Established in 1992
Covers 2 million livesDISCOVERY HEALTH
100% South Africa’s fastest growing major life assurer
Established in 2000
Covers 200 000 livesDISCOVERY LIFE
100% Science-based wellness programme and unique value creator
Established in 1997
Covers 1,2 million livesDISCOVERY VITALITY
98% US-based health insurance company innovative in consumer-directed care
Established in 2000
Covers 60 000 livesDESTINY HEALTH
50% UK-based joint venture leading change in the private medical insurance market
Established in 2004
Covers 75 000 livesPRUHEALTH
GROUP OPERATING STRUCTURE
2006
7558-discovery front 7-11 9/11/06 2:02 Page 2

4
VALUE CREATORS
R million 2006 2005 2004 2003 2002 2001 2000
Gross inflows under management 20 427 17 295 14 345 10 946 7 739 5 494 3 559
Gross inflows under management measures the total funds managed
and received by Discovery and is an accurate measure of the continual
growth of Discovery.
25 000
20 000
15 000
10 000
5 000
000 01 02 03 04 05 06
(R million)
5 000
4 000
3 000
2 000
1 000
0
(R million)
00 01 02 03 04 05 06
R million 2006 2005 2004 2003 2002 2001 2000
New business annualised premium income
Discovery Health and Discovery Vitality 2 612 2 869 2 184 2 346 1 869 2 071 1 322Discovery Life 789 629 535 423 264 94 0Destiny Health 796 809 494 379 206 12 0PruHealth 282 35 0 0 0 0 0
4 479 4 342 3 213 3 148 2 339 2 177 1 322
New business annualised premium income measures the annualised
premiums generated by clients who have purchased Discovery
products over the last financial year. All business written by
Discovery is recurring in nature.
THE RESULTS
R million 2006 2005 2004 2003 2002 2001 2000
Embedded value 10 587 9 173 6 832 4 928 3 321 3 212 2 114
Embedded value is an actuarial calculation of the current value of
Discovery as it exists today. An embedded value calculation assumes
no growth in the current business. The continual growth of the embedded
value shows continuous shareholders’ value created by Discovery.
12 000
10 000
8 000
6 000
4 000
2 000
0
(R million)
00 01 02 03 04 05 06
GROUP FINANCIAL HIGHLIGHTS (CONTINUED)
7558-discovery front 7-11 9/11/06 2:02 Page 4

5
Cents 2006 2005 2004 2003 2002 2001 2000
Diluted headline earnings per share before abnormal items 97,0 94,2 77,4 65,7 48,1 33,6 14,3
Diluted headline earnings per share before abnormal items measures
the sustainable earnings attributable to ordinary shareholders.
2 500
2 000
1 500
1 000
500
0
(Thousand clients)
00 01 02 03 04 05 06
2006 2005 2004 2003 2002 2001 2000
Discovery Health clients 1 939 339 1 788 566 1 593 975 1 446 371 1 180 121 960 494 701 395
This is the number of lives administered by Discovery Health at
30 June. This large and diverse membership base reduces the reliance
on any one member or employer who purchases Discovery products.
2006 2005 2004 2003 2002 2001
Life individual policyholders 204 891 170 642 123 977 67 998 31 918 9 331
This is the number of principal lives on risk at 30 June. As premiums
collected from individual policyholders are recurring, each policyholder
adds to Discovery Life’s value.
250 000
200 000
150 000
100 000
50 000
0
(Clients)
01 02 03 04 05 06
70 000
60 000
50 000
40 000
30 000
20 000
10 000
0
(Clients)
01 02 03 04 05 06
2006 2005 2004 2003 2002 2001
Destiny Health clients 62 041 60 470 36 234 21 643 9 544 497
This is the number of lives administered by Destiny Health, including
its joint ventures with Guardian Life Insurance and Tufts Health Plan.
Each life adds to Destiny Health’s value.
120
100
80
60
40
20
0
(Cents)
00 01 02 03 04 05 06
7558-discovery front 7-11 9/11/06 2:02 Page 5

D I S C O V E R Y A N N U A L R E P O R T 2 0 0 6 3
• OPERATING PROFIT (BEFORE BEE EXPENSES) +37% TO R1,3 BILLION
• NET PROFIT AFTER TAX (BEFORE BEE EXPENSES) +51% TO R827 MILLION
• DILUTED HEPS (BEFORE BEE EXPENSES) +34% TO 126,4 CENTS PER SHARE
• NEW BUSINESS ANNUALISED PREMIUM INCOME +3% TO R4,5 BILLION
• MAIDEN DIVIDEND OF 27 CENTS PER SHAREDECLARED
GROUP FINANCIAL HIGHLIGHTSfor the year ended 30 June 2006
7558-discovery front 7-11 9/11/06 2:02 Page 3

D I S C O V E R Y A N N U A L R E P O R T 2 0 0 66
GROUP AT A GLANCE
DISCOVERY
It has been a successful year for
Discovery. The Group’s core purpose
of “making people healthier and
enhancing and protecting their lives”
imposes an ethos wherein always
meeting clients’ needs first and
foremost leads to superior growth
and profitability. The year under
review has illustrated the continued
efficacy of this approach.
ADRIAN GORE (42)
BSc (Hons), FFA, ASA, MAAA, FASSA
Chief Executive Officer
Discovery
NEVILLE KOOPOWITZ (42)
BCom, CFP
Chief Executive Officer
Discovery Health
HERSCHEL MAYERS (46)
BSc (Hons), FIA, FASSA
Chief Executive Officer
Discovery Life
DISCOVERY HEALTH
Discovery Health’s strong growth and
solid financial performance has again
positioned it as a major contributor to
the Discovery Group’s success. Its
scale, size and financial solidity have
further strengthened our ability to
ensure that our members receive
health care on a sustainable basis
backed by exceptional service, price
and quality.
DISCOVERY LIFE
Discovery Life’s performance every
year is characterised by a cycle of
consumer-centric innovation, followed
by rapid organic growth and
consequently, solid financial results.
In the past year, we have seen a 25%
increase in new business and a 31%
increase in operating profit. This has
bolstered Discovery Life’s contribution
to the overall performance of the
Discovery Group.
7558-discovery front 7-11 9/11/06 2:02 Page 6

D I S C O V E R Y A N N U A L R E P O R T 2 0 0 6 7
ALAN POLLARD (38)
BSc (Hons), FIA, FASSA
Chief Executive Officer
Discovery Vitality
BARRY SWARTZBERG (41)
BSc, FFA, ASA, FASSA, CFP
Executive Director
Discovery
ARTHUR CARLOS (40)
BSc, FSA, ERISA (EA)
Chief Executive Officer
Destiny Health
SHAUN MATISONN (34)
BSc, FFA, FASSA, ASA, MAAA
Chief Executive Officer
PruHealth
DISCOVERY VITALITY
Discovery Vitality posted a pleasing
performance in every respect:
profitability, growth and, most
importantly, value generated for
Discovery clients. We added 47 000
lives to Vitality during the year.
Vitality’s greatest contribution to
Discovery’s overall success is the
unique integration capabilities and
product differentiation that it creates
for our other businesses.
DESTINY HEALTH
Destiny Health’s performance was
disappointing. Particularly in the first
half of the year, we saw relatively flat
growth in membership, reduced new
business and worse than expected
losses driven by elevated loss ratios.
However, we have already implemented
a number of bold steps to address the
situation and have committed to
pinning losses down to a more
sustainable level.
PRUHEALTH
PruHealth has posted an exceptional
performance. The company’s rapid
growth in new business and
membership along with better than
expected rates of renewal, indicate
that UK consumers are embracing its
unique and innovative consumer-
directed approach. If new business
growth continues at projected rates,
we expect the company to achieve
the 100 000 lives milestone by
January 2007.
7558-discovery front 7-11 9/11/06 2:02 Page 7
D I S C O V E R Y A N N U A L R E P O R T 2 0 0 68
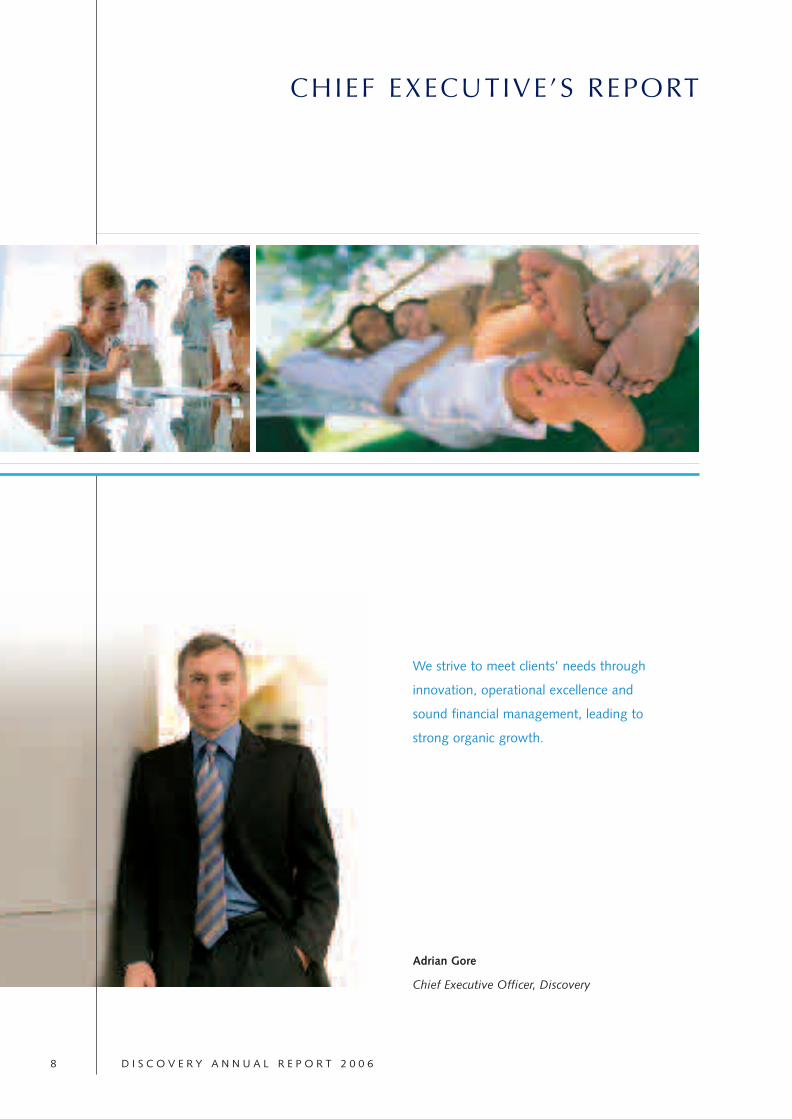
Adrian Gore
Chief Executive Officer, Discovery
We strive to meet clients’ needs through
innovation, operational excellence and
sound financial management, leading to
strong organic growth.
CHIEF EXECUTIVE’S REPORT
7558-discovery front 7-11 9/11/06 2:02 Page 8
D I S C O V E R Y A N N U A L R E P O R T 2 0 0 6 9
THIS YEAR’S PERFORMANCEThe 2006 financial year was a successful one for the
Discovery Group, featuring important strategic developments
in each of its businesses, as well as strong earnings growth.
As in previous years, all of Discovery’s businesses focused
intensely on innovations designed to meet specific client
needs in rapidly-changing markets. The group has reached
an important stage in its evolution, where it is positioned for
continued strong growth, yet has been able to generate
excess cash within the business. Given this strong cash-flow
position, we declared our maiden dividend at the
announcement of our annual results.
OUR STRATEGYA solution-centric approach to meeting clients’ needsDiscovery’s core purpose is making people healthier and
enhancing and protecting their lives. To deliver on our
purpose necessitates a solution-centric approach that focuses
on meeting clients’ needs. Developing effective solutions for
our clients helps to create a sustained demand for our
products, which in turn leads to strong organic growth.
Importantly, because we essentially go into areas where our
clients most need us, Discovery’s products are not defined or
bound by the specific industries we operate in.
We manage somewhat contradictorycompetencies to create a unique advantageOver the past five years, Discovery has increased its gross
inflows under management from R5,5 billion to almost
R20,5 billion, while its embedded value has grown from
around R3,2 billion to R10,6 billion. It has achieved this
superior growth and profitability purely organically based on
its ability to manage the apparent tensions between financial
prudence, innovation, and a customer-centric approach.
Somewhat paradoxically, Discovery is at once conservative in
its approach to financial risk-taking, innovative in its product
design and responsive to consumer needs.
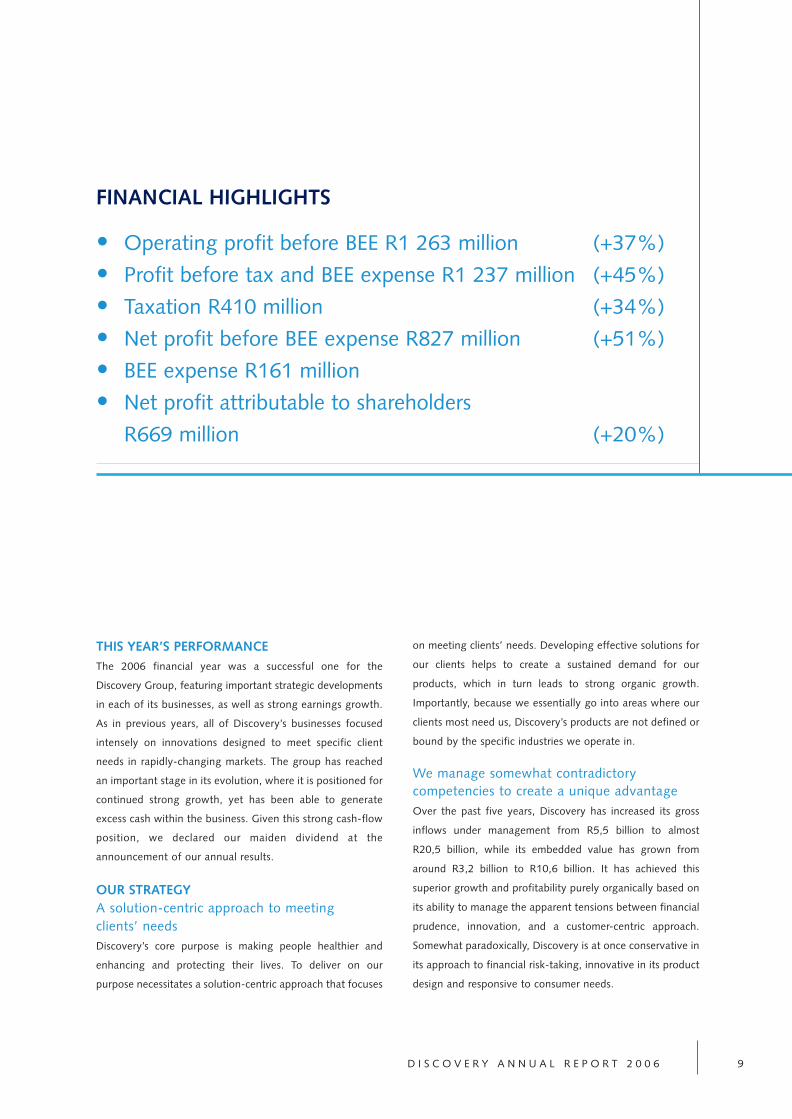
FINANCIAL HIGHLIGHTS
• Operating profit before BEE R1 263 million (+37%)
• Profit before tax and BEE expense R1 237 million (+45%)
• Taxation R410 million (+34%)
• Net profit before BEE expense R827 million (+51%)
• BEE expense R161 million
• Net profit attributable to shareholders
R669 million (+20%)
7558-discovery front 7-11 9/11/06 2:02 Page 9

D I S C O V E R Y A N N U A L R E P O R T 2 0 0 61 0
THE ENVIRONMENT IN WHICH WE OPERATEWe only enter markets where we make a differenceDiscovery enters markets where we clearly discern the need
for structural change – and only if we believe that we will
make a profound difference. We operate in health and life
assurance markets, fundamental areas of social need. Along
with our ethos of putting people at the centre of our
business, this positions us to introduce changes that make
a real difference.
Rising consumerism remains a keyenvironmental feature in all our marketsIn health care, the worldwide move to consumer-
engagement is accelerating. Discovery has long been
established as a leader in consumer-driven health care. The
market now demands a combination of consumer
engagement and supply-side cost controls. Discovery
Health, distinctive in its size in the South African health care
context, has the scale to control costs and maximise quality
for our members. In both the UK and US markets, while
legislation and the competitive landscape are different, the
issues of cost, quality and access are just as critical. There,
Discovery is using its extensive expertise and vast
operational platform to deliver innovative consumer-
directed solutions.
In life insurance, in the 80s and 90s, the industry migrated
to investments. Recently, however, consumer demand for
transparency and better value has led to the disintermediation
of the industry. Discovery Life, when it entered the market
six years ago, recognised the need to increase the efficiency
and flexibility of life assurance products. It did so by
specialising instead in risk protection, separating out the
investment aspects completely. Our risk-based product has
since led an industry shift to a greater focus on risk and has
further evolved its value proposition to clients. The recent
consumer backlash against insurers’ investment products,
which are seen as opaque and offering poor returns, has
now created an opportunity for Discovery Life to apply its
consumer-centric approach to investment products. We see
it as an important future focus area.
In the areas of wellbeing and lifestyle benefits, Discovery
Vitality has allowed us to respond to both the growing
scientific evidence for the powerful impact of lifestyle in
disease management, and growing demand for products
that acknowledge consumers’ need for personalisation,
convenience and added value.
With the addition of the DiscoveryCard to the Vitality
offering, we can now offer an even more integrated suite
of products to meet the entire spectrum of clients’ financial
protection needs. Before its launch, the credit card market
was largely the exclusive domain of banks. Since
DiscoveryCard launched two years ago, we have seen other
non-traditional providers follow our lead – with airlines,
retailers and others entering the credit card market. As a
result of the trend, credit cards have emerged as a true
consumer commodity, with enhanced competition helping
to lower costs and improve benefits.
THIS YEAR’S KEY FOCUS AREASDiscovery continued to deliver strong earningsand good growth across the GroupDiscovery has achieved exceptional growth in earnings and
embedded value over the past few years, performing well
for our shareholders. Encouragingly, the consistently strong
earnings performance has translated into an improved cash
flow position, as the business has evolved to the point
where new ventures have become either cash flow positive
or require less capital funding from the Group. During the
year under review, this process of evolution saw Discovery
Life become cash flow positive for the first time, being a
significant contributor to the increase in the cash generated
from operations to R656 million, from a like-for-like
comparative of R585 million in the preceding year.
See figure 1
During the year under review, the strong earnings performance
continued across the Group.
• Discovery Life delivered strong growth, profitability
and a better-than-expected underwriting performance,
demonstrating the quality of the business.
• Discovery Health, despite its dominant size, grew strongly
and further established itself as a major player in the
emerging lower income market, in addition to achieving
significant operational efficiencies.
• Vitality, while in essence an underpin to our other
businesses, also grew its profitability.
CHIEF EXECUTIVE’S REPORT (CONTINUED)
7558-discovery front 7-11 9/11/06 2:02 Page 10

Figure 1: Cash generated from operations
* Note: 2005 has been adjusted to exclude the effect of the quota shareagreement.
D I S C O V E R Y A N N U A L R E P O R T 2 0 0 6 1 1
• Destiny Health’s performance was in many respects a
disappointing one, but during the period we took steps
to limit the Group’s exposure to future losses and have
committed to pinning losses down at a more sustainable
level of below 5% of Group earnings.
• PruHealth, while continuing to operate at a loss in the short
term, achieved outstanding new business growth and
persistency rates, placing it firmly on track to profitability.
We based our maiden dividend on the guidingprinciples of sustainability and future growthDiscovery’s maiden dividend announcement of 27 cents per
share reflects the Group’s strong cash generative position and
future growth opportunities. Discovery Life achieved cash-flow
positive status during the year, a significant development in this
regard. The following principles underpinned our decision to
announce the dividend:
• Sustainability: We have always said Discovery would only
commence paying dividends when it could do so without
hampering the Group’s growth, on a sustainable basis,
and without placing undue stress on our business.
• Constant payout ratio: Discovery should pay dividends
based on a fixed proportion of earnings ratio.
We calculated the dividend at a conservative level with a
dividend cover of four-and-a-half times.
See figure 2
Discovery Health’s scale and size gives it thepurchasing power to create a balanceDiscovery Health has grown phenomenally in the past
fourteen years and is now a dominant player in South
African health care. It has close to two million lives on its
books, and 26% of the overall market share in an otherwise
fragmented medical schemes market. Despite its market
dominance, current market dynamics such as buy-downs
from more comprehensive cover, as well as growth in the
lower income market, have further entrenched Discovery
Health’s competitive position.
See figure 3
Discovery Health is in a unique position of leadership,
which enables it to offer members choice, increase their
700
600
500
400
300
200
100
0
Cash generated from operations(R million)
02 03 04 05 06
2 500
2 000
1 500
1 000
500
0
Free cash flow under different payout ratios(R million)
2006 2007 2008 2009
2x cover 3x cover 4x cover5x cover 6x cover No dividend
Figure 2: We still have access to sufficient cash resources to
pursue future growth opportunities
Schemes that grew or shrank during the year(Principal members – thousands)
–40 0 40 100–20 20 60
DiscoveryOxygen
FedHealthSpectramed
MedicoverHosmed
ResolutionLiberty
BestMedMunimedMediHelp
SizweMedshield
ProSanoBonitas
Momentum
80
Figure 3: Change in membership levels of top 16 medical
schemes from December 2004 to December 2005
7558-discovery front 7-11 9/11/06 2:02 Page 11

D I S C O V E R Y A N N U A L R E P O R T 2 0 0 61 2
access to care and, through its buying power, bring down
the cost of private health care for our members.
Interestingly, when it entered the market in the Nineties,
Discovery Health helped to check rampant medical inflation
by interventions on the demand side, despite its relatively
small size. Through innovations like the Medical Savings
Account and Vitality, it was able to empower consumers
to better understand and manage their health care costs.
The massive scale it has since achieved now allows it to
combine this consumer-driven approach with initiatives
focused on cost management on the supply side. The result
is that we are able to maximise choice, access and
affordability for our members.
By way of example, during the year we:
• Rolled out the Discovery Health Primary Care Network,
which came into effect on 1 January 2006. Prior to its
launch, there were only two players in this market, which
is characterised by significant barriers to entry. Discovery
was able to leverage its significant scale and size to
overcome these barriers, bringing innovation and
renewal to the lower income market. In less than a year,
the network has grown to incorporate over 2 000 GPs
and more than 60 hospitals. With the launch of the
Discovery Health GP Network, which will roll out next
year, we aim to build on this successful innovation to the
benefit of consumers.
See figure 4
• Developed the Specialty Medication Benefit, which will
help to address the challenging issue of access to high
cost new medical technologies. Around the world, in the
past number of years, we have seen increasing debate
around the funding of expensive new medical
technologies. The new class of biological drugs, such as
the controversial breast cancer drug, Herceptin, has
served to highlight the difficulties faced by health care
funders the world over, who are all grappling with how
to provide affordable, sustainable access to these
groundbreaking new technologies. Our philosophy has
always been that we want to offer our members access
to the best quality care. While it has been a challenging
process, we are proud that we have now been able to
create a funding solution that ensures Discovery Health
Discovery 2006 Faranani 2006 Prime Cure 2006
0
Size of Provider Network relative to the market(%)
200 400 600100 300 500 700
Gauteng
KZN
Western Cape
Free State
Mpumalanga
North West
Eastern Cape
Limpopo
Northern Cape
CareCross 2006
Figure 4: Relative size of primary care provider networks
250
200
150
100
50
0
Integrator versus non-integrator experience(Integrator experience as a % of non-integrator)
Ave
rage
NB
prem
ium
Ave
rage
Ben
efit
cou
nt
Loss
Rat
io(R
isk
prem
ium
A t
o E
)
Laps
e ra
te
VNB
per
pol
icy
Figure 5: Integrated plans as a percentage of
non-integrated plans
CHIEF EXECUTIVE’S REPORT (CONTINUED)
7558-discovery front 7-11 9/11/06 2:02 Page 12

D I S C O V E R Y A N N U A L R E P O R T 2 0 0 6 1 3
members may have access to biological drugs and other
new medical technologies on a sustainable basis. The
Specialty Medication Benefit will be available next year.
These, and other consumer-directed innovations, such as
the Discovery Hospital Rating Index, are discussed in greater
detail in the report by Neville Koopowitz on page 21.
Discovery Life has enhanced its valueproposition for consumers through integration Discovery Life is growing rapidly in the highly-
commoditised life insurance market. Through its consumer-
driven approach, which hinges on two clear strategies of
innovation and integration, Discovery Life is able to offer
clients a unique and compelling value proposition.
The benefits of this approach transcend the client
spectrum. Discovery Life’s analysis demonstrates that
integrated plans are on average of higher value, greater
profitability and have better risk experience when
measured against their non-integrated counterparts.
See figure 5
• An example of integration is the DiscoveryCard Integrator,
which was launched in June 2006, and uniquely links
credit card spending patterns to life insurance cover.
Discovery Life policyholders are able to use their
projected future spend to secure more financial
protection for their beneficiaries.
• Recent innovations include enhancements to the Severe
Illness Benefit. Policyholders now have the option of
O U R M O D E L O F E N G A G I N G C O N S U M E R S I N M A N A G I N G T H E I R
H E A LT H , P L A C E S D I S C O V E R Y I N A S T R O N G P O S I T I O N .
receiving a full lump-sum payout on claiming for severe
illness benefits, or choosing to receive a partial lump-sum
payout plus world-class treatment at a network of
leading US health care facilities.
As outlined in the report by Herschel Mayers on page 29,
Discovery Life’s integrated offerings now enable policyholders
to effectively control their premiums, increase their family's
future financial protection and even influence their own income
in retirement, simply by actively managing their health.
Destiny Health has recognised the need tooffer US consumers a soft landingDestiny Health’s relatively weak performance stems, we
believe, from a failure to capitalise fully on its early
leadership position in the US shift to consumer-directed
health care. This was compounded during the year under
review by a significant shift in the competitive dynamics of
the markets in which it operates.
While the concept of Consumer-Directed Healthcare
continues to grow significantly in the US health insurance
markets – presenting a substantial and unique opportunity
for Discovery given its experience and capabilities – Destiny
was poorly positioned to make positive progress.
A positive underwriting cycle and significantly deeper
discounts available to our major competitors, created an
environment in which Destiny is simply not price
competitive – particularly in Illinois, Destiny’s major market
– resulting in slow growth and worse-than-expected loss
ratios. In addition, Destiny’s pace of expansion into other
7558-discovery front 7-11 9/11/06 2:02 Page 13

D I S C O V E R Y A N N U A L R E P O R T 2 0 0 61 4
markets was inadequate and contingent upon partner
influences. As outlined in detail in the report by Art Carlos
and Barry Swartzberg, we have taken bold steps to address
these specific operational issues and have already seen
operating losses reduce as a result.
However, at a more strategic level, Discovery has made the
decision that the business model must change. Discovery,
Destiny Health and the Guardian Life Assurance Company
of New York (Destiny Health’s exclusive distribution partner
in the US) are in the process of revisiting their partnership
arrangement.
Potential changes may include a construct wherein Destiny
will provide the intellectual capital and an operational
platform for the Guardian in return for a fixed fee per
member in some states in the US, while Destiny Health will
market its own products in other US states. However, it
must be stressed that any growth outside of this will be
opportunistic, confined to those markets where competitive
pricing can be obtained and will be pursued with great care
to limit any downside.
PruHealth is making private medical insurancecover more accessible In the context of a highly sophisticated private medical
insurance market that has seen little change in recent years,
PruHealth in itself represents an industry-leading
innovation. Pent-up consumer demand for quality,
affordable cover has resulted in it gaining rapid traction,
which has far exceeded our expectations. PruHealth
reached the 75 000 member milestone in October 2006,
just two years after its launch.
Importantly, we have been able to apply to PruHealth the
lessons we have learnt in both the South African market
through Discovery Health, and in the US market through
Destiny Health. While it is growing at a phenomenal rate,
PruHealth does not yet possess significant scale in the UK
market. However, by using innovative, consumer-directed
constructs like Vitality that allow consumers to play a more
active role in managing their risks – and the cost of their
cover – PruHealth offers superior benefits at a discount
relative to other more traditional players. Based on their
Vitality status and claims, PruHealth clients are able to
lower their renewal premium or receive cash back at the
end of the year.
Examples of Vitality engagement
Over 300 preventive health screenings each month
20 000 gym visits per month
Over 4 000 FitBug events in just two months
More than 600 000 Vitality points awarded each month
142 000 online assessments to date
PruHealth has also applied Discovery’s cycle of regular
innovation, launching new benefits annually. Most recently,
it launched Vitality Underwriting and the Personal Health
Fund in June 2006:
• PruHealth has tapped into Discovery’s expertise to create
Vitality Underwriting. This innovative approach to
underwriting recognises that people are able to reduce
their long-term risks and health care expenditure simply
by eating healthily, exercising regularly, by not smoking
and through regular health screenings. PruHealth now
has the capability to appeal to a previously untapped
market and at the same time, practise sound risk
management.
• Private medical insurance in the UK typically provides
cover for once-off, high-cost medical conditions and
events. With the introduction of the Personal Health
Fund, PruHealth has for the first time introduced cover
for primary care expenses such as GP visits and routine
health screens.
PruHealth is also able to deliver superior service through its
capacity to tap into Discovery’s technological capability and
infrastructure. We have seen the combination of affordable,
quality benefits and exceptional service delivery result in
consumer endorsement of its products – independent
research results indicate that the majority of PruHealth
clients have recommended the company to others.
Reinvigorating the Vitality value propositionVitality remains first and foremost a wellness programme.
But it is also a strategic platform for integration across all of
CHIEF EXECUTIVE’S REPORT (CONTINUED)
7558-discovery front 7-11 9/11/06 2:02 Page 14
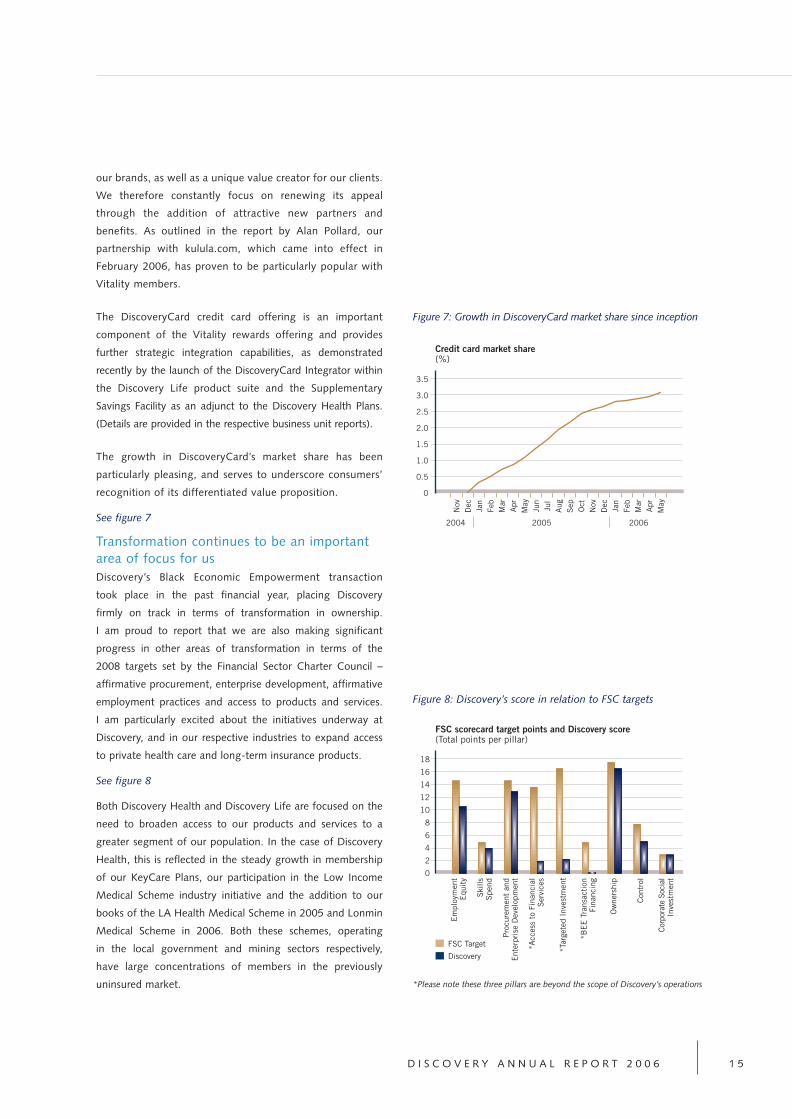
Figure 8: Discovery’s score in relation to FSC targets
*Please note these three pillars are beyond the scope of Discovery’s operations
D I S C O V E R Y A N N U A L R E P O R T 2 0 0 6 1 5
our brands, as well as a unique value creator for our clients.
We therefore constantly focus on renewing its appeal
through the addition of attractive new partners and
benefits. As outlined in the report by Alan Pollard, our
partnership with kulula.com, which came into effect in
February 2006, has proven to be particularly popular with
Vitality members.
The DiscoveryCard credit card offering is an important
component of the Vitality rewards offering and provides
further strategic integration capabilities, as demonstrated
recently by the launch of the DiscoveryCard Integrator within
the Discovery Life product suite and the Supplementary
Savings Facility as an adjunct to the Discovery Health Plans.
(Details are provided in the respective business unit reports).
The growth in DiscoveryCard’s market share has been
particularly pleasing, and serves to underscore consumers’
recognition of its differentiated value proposition.
See figure 7
Transformation continues to be an importantarea of focus for usDiscovery’s Black Economic Empowerment transaction
took place in the past financial year, placing Discovery
firmly on track in terms of transformation in ownership.
I am proud to report that we are also making significant
progress in other areas of transformation in terms of the
2008 targets set by the Financial Sector Charter Council –
affirmative procurement, enterprise development, affirmative
employment practices and access to products and services.
I am particularly excited about the initiatives underway at
Discovery, and in our respective industries to expand access
to private health care and long-term insurance products.
See figure 8
Both Discovery Health and Discovery Life are focused on the
need to broaden access to our products and services to a
greater segment of our population. In the case of Discovery
Health, this is reflected in the steady growth in membership
of our KeyCare Plans, our participation in the Low Income
Medical Scheme industry initiative and the addition to our
books of the LA Health Medical Scheme in 2005 and Lonmin
Medical Scheme in 2006. Both these schemes, operating
in the local government and mining sectors respectively,
have large concentrations of members in the previously
uninsured market.
18
16
14
12
10
8
6
4
2
0
FSC scorecard target points and Discovery score(Total points per pillar)
FSC Target
Discovery
Em
ploy
men
tE
quit
y
Ski
llsS
pend
Pro
cure
men
t an
dE
nter
pris
e D
evel
opm
ent
*Acc
ess
to F
inan
cial
Ser
vice
s
*Tar
gete
d In
vest
men
t
*BE
E T
rans
acti
onFi
nanc
ing
Ow
ners
hip
Con
trol
Corp
orat
e So
cial
Inve
stm
ent
Credit card market share(%)
3.5
3.0
2.5
2.0
1.5
1.0
0.5
0
2004 20062005
Nov
Dec Jan
Feb
Mar
Apr
May
Jun
Jul
Aug
Sep Oct
Nov
Dec Jan
Feb
Mar
Apr
May
Figure 7: Growth in DiscoveryCard market share since inception
7558-discovery front 7-11 9/11/06 2:02 Page 15

D I S C O V E R Y A N N U A L R E P O R T 2 0 0 61 6
In the case of Discovery Life, we have to date provided
access to funeral cover underwritten by Discovery Life to
members of KeyClub, the loyalty programme for KeyCare
members. Discovery Life is currently working on an exciting
initiative that will provide cover for the lower income
market, which we plan to take to market towards the end
of 2006.
In our Sustainability Report, available at www.discovery.co.za,
we outline initiatives in the arena of transformation and
sustainability issues in general.
OUR PROSPECTS FOR THE COMING YEARThere is significant scope for growth in each of Discovery’s
core businesses in the year ahead, and the key growth
strategies for each are outlined in the various subsidiary
reports. However, I would like to take the opportunity to
highlight a few of Discovery’s initiatives for next year that
I find especially noteworthy.
Vitality WellPoint applies the Vitalityphilosophy to the wellbeing of corporatesWith the introduction of Vitality WellPoint, which will be
available to South African corporates from February 2007,
Discovery is entering an exciting new space. WellPoint does
for corporates what Vitality does for individuals –
leveraging Discovery’s scale, size and expertise to unlock
value they would otherwise be unable to access.
WellPoint is a suite of products and services that integrates
the clinical and health insights, technological infrastructure
and actuarial expertise of Discovery Health and Vitality to
create a unique and comprehensive corporate wellness
programme. WellPoint encourages and rewards employers
and their employees for behaviours that improve their
health status, reduce absenteeism, and so, improve
productivity within the workplace. WellPoint integrates
seamlessly with Vitality, the Discovery Health Plans and the
Discovery HIVCare programme to help employers
understand and manage health-related risk within their
business. However, employees need not belong to
Discovery Health to participate in the programme. Through
employer discounts on the Discovery Life Group Risk Plans,
and enhanced DiscoveryCard benefits for employees, both
the employer and the employee are strongly incentivised to
participate actively in the programme.
Vitality WellPoint provides an opportunity for Discovery to
tap into its existing corporate client base of over 200 000
companies, to provide added value and enhanced cross-
selling opportunities across the business.
The Discovery Foundation aims to improveaccess to health care for all South AfricansThe Discovery Foundation was established as part of
Discovery’s BEE transaction announced in September 2005.
Its aim is to invest in the education and training of medical
specialists in South Africa, with the focus on:
1. Increasing the number of specialists in rural areas;
2. Contributing to academic and medical research centres
of excellence in South Africa; and
3. Increasing the number of black and female specialists in
South Africa.
The Discovery Foundation is an autonomous shareholder of
Discovery, capitalised through its shareholding of
Discovery. Its trustees have been independently elected and
appointed to ensure sound governance and autonomy.
Its establishment flowed from our wish to ensure that our
empowerment deal would make a real difference to the
broader community, within the context of our core purpose
of making people healthier and enhancing and protecting
their lifestyles.
Over the next decade, the Discovery Foundation Awards,
launched in August 2006, will contribute in excess of
R100 million to bursaries and fellowships that reward and
encourage excellence in the South African health care
sector. The Awards are expected to contribute to the
training of 300 new medical specialists. We believe this will
not only help to build on one of our nation’s greatest
assets, our world-class health care capability, but hopefully
make a tangible difference in the accessibility of quality
care for thousands of South Africans.
Discovery’s Prosperity programme takes ourcore purpose to our greatest asset, our peopleUltimately, the quality of Discovery’s people is what sets
our organisation apart. I believe they are the reason for
every success achieved. Our people are unique in their
CHIEF EXECUTIVE’S REPORT (CONTINUED)
7558-discovery front 7-11 9/11/06 2:02 Page 16

D I S C O V E R Y A N N U A L R E P O R T 2 0 0 6 1 7
diversity, their talent, their dedication and their quality.
Liberating the greatness within our people is one of our
core values at Discovery, and so we have decided to make
their wellbeing a particular area of focus in the year ahead
through our new Prosperity programme.
This unique incentive programme gears the rewards of
Vitality to encourage our people to participate in activities
that support their wellbeing, aid their development,
increase their level of engagement and improve their
productivity. These include maintaining a work-life balance,
participating in our CSI employee volunteer programmes
and in learning and development initiatives.
In developing the Prosperity programme, we have applied
what we have learnt from Vitality in terms of structuring
a compelling rewards programme that incentivises a
higher level of engagement. As with Vitality, we hope
our employees will not only benefit from the incomparable
rewards offered by the programme, but also from the
great sense of personal accomplishment associated with
participation.
MESSAGE OF THANKSAs always, I feel it is fitting to end my report by thanking
Discovery’s people. Our team is made up of over 4 000
talented and dedicated individuals who work hard every
day to pursue our core purpose and make a difference in
the lives of the people we serve. I thank them for their
commitment and for the privilege of working with them.
They truly are exceptional.
O U R P E O P L E A R E U N I Q U E I N T H E I R D I V E R S I T Y, T H E I R TA L E N T,
T H E I R D E D I C AT I O N A N D T H E I R Q U A L I T Y.
7558-discovery front 7-11 9/11/06 2:02 Page 17

D I S C O V E R Y A N N U A L R E P O R T 2 0 0 61 8
Neville Koopowitz
Chief Executive Officer, Discovery Health
DISCOVERY HEALTH
Helping more people access quality health care on a sustainable basis
Discovery Health continued to grow strongly in
2006, and remains the dominant player in the
South African medical schemes market.
7558-discovery front 7-11 9/11/06 2:03 Page 18
D I S C O V E R Y A N N U A L R E P O R T 2 0 0 6 1 9
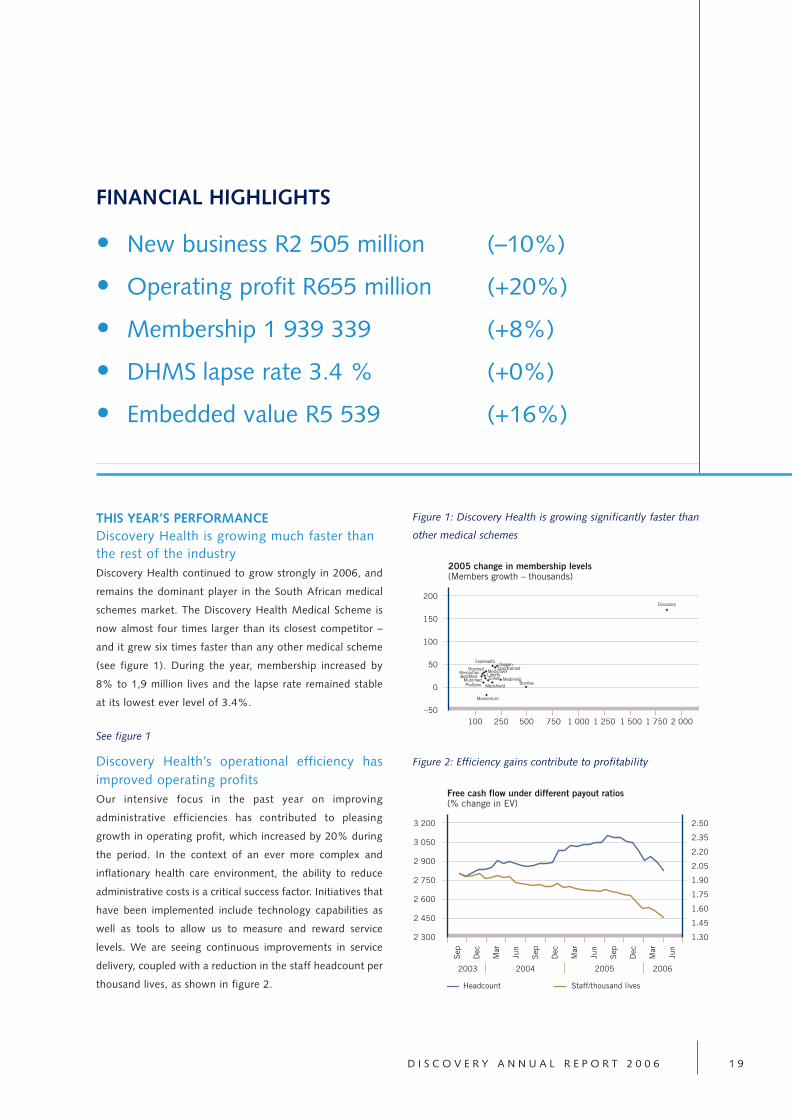
THIS YEAR’S PERFORMANCEDiscovery Health is growing much faster thanthe rest of the industryDiscovery Health continued to grow strongly in 2006, and
remains the dominant player in the South African medical
schemes market. The Discovery Health Medical Scheme is
now almost four times larger than its closest competitor –
and it grew six times faster than any other medical scheme
(see figure 1). During the year, membership increased by
8% to 1,9 million lives and the lapse rate remained stable
at its lowest ever level of 3.4%.
See figure 1
Discovery Health’s operational efficiency hasimproved operating profits Our intensive focus in the past year on improving
administrative efficiencies has contributed to pleasing
growth in operating profit, which increased by 20% during
the period. In the context of an ever more complex and
inflationary health care environment, the ability to reduce
administrative costs is a critical success factor. Initiatives that
have been implemented include technology capabilities as
well as tools to allow us to measure and reward service
levels. We are seeing continuous improvements in service
delivery, coupled with a reduction in the staff headcount per
thousand lives, as shown in figure 2.
FINANCIAL HIGHLIGHTS
• New business R2 505 million (–10%)
• Operating profit R655 million (+20%)
• Membership 1 939 339 (+8%)
• DHMS lapse rate 3.4 % (+0%)
• Embedded value R5 539 (+16%)
Figure 1: Discovery Health is growing significantly faster than
other medical schemes
200
150
100
50
0
–50
2005 change in membership levels(Members growth – thousands)
100 250 500 750 1 750 2 000
Discovery
1 5001 2501 000
OxygenSpectramed
FedHealth
MedicoverHosmedResolutionBestMed Liberty
MunimedProSano
Sizwe
MedshieldMediHelp
Momentum
Bonitas
Figure 2: Efficiency gains contribute to profitability
3 200
3 050
2 900
2 750
2 600
2 450
2 300
Free cash flow under different payout ratios(% change in EV)
Headcount Staff/thousand lives
2.50
2.35
2.20
2.05
1.90
1.75
1.60
1.45
1.30
2004 20062005
Sep
Dec
Mar
Jun
Sep
Dec
Mar
Jun
Sep
Dec
Mar
Jun
2003
7558-discovery front 7-11 9/11/06 2:03 Page 19
Our industry leadership creates value forshareholders and consumers alikeDiscovery Health’s strong growth and solid financial
performance has again positioned it as a major contributor
to the Discovery Group’s success – the company’s
embedded value has increased to over R5,5 billion. More
importantly, its scale, size and financial solidity have further
strengthened our ability to ensure that our members
receive health care on a sustainable basis backed by
exceptional service, price and quality.
OUR STRATEGYOur consumer-driven health care model aimsto improve quality and encourage lower costsThe South African health care environment has changed
significantly in the fourteen years since Discovery Health
was established. At the time of our entry, inefficient benefit
structures had created the wrong incentives, leading to
rampant medical inflation and consumer concern. We early
D I S C O V E R Y A N N U A L R E P O R T 2 0 0 62 0
on identified the need to engage consumers more actively
in managing their health care costs, and structured our
unique products in a way that supported direct consumer
involvement. Our aim: to contain costs by empowering
consumers, giving our members affordable access to quality
care over the long term.
Since then, the number of medical scheme members in
South Africa has remained largely unchanged at around
seven million. However, the regulatory requirements, the
benefit structures, the number of industry players, the way
prices are determined and the expectations of medical
scheme members, have all shifted dramatically. The
dynamics are different, but the Discovery Health approach
to dealing with them is the same – to put consumers first
and provide them with affordable access to quality care.
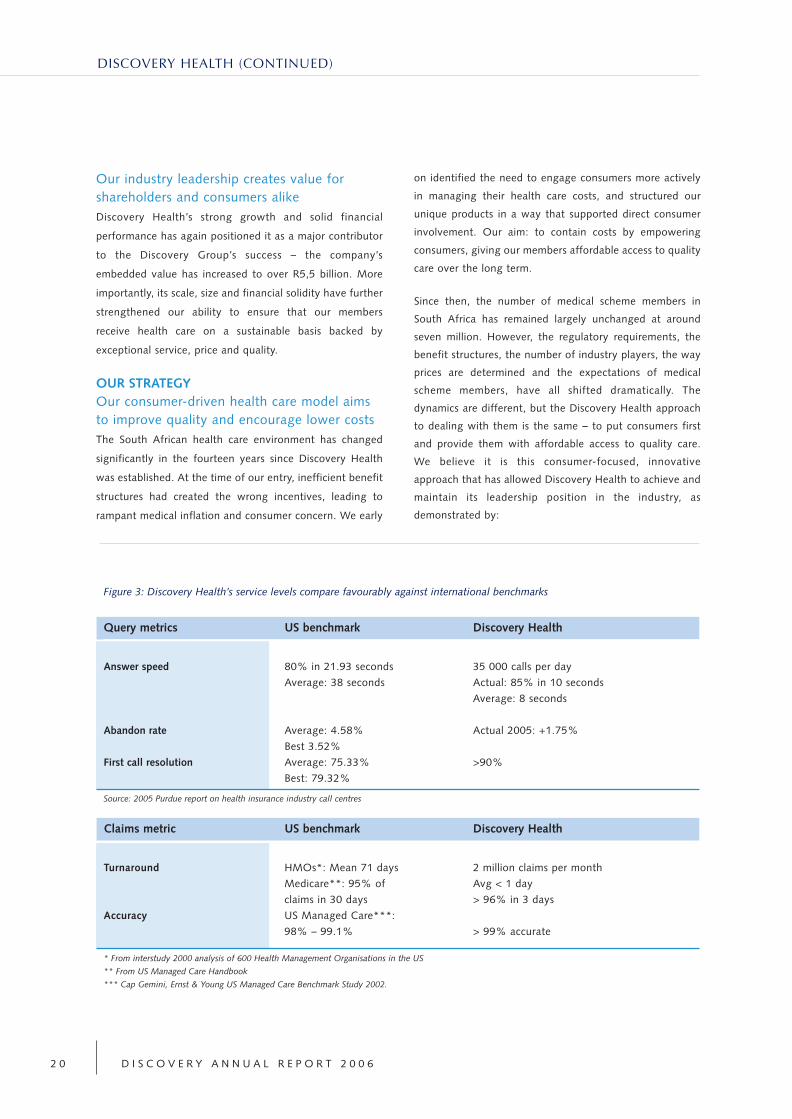
We believe it is this consumer-focused, innovative
approach that has allowed Discovery Health to achieve and
maintain its leadership position in the industry, as
demonstrated by:
Figure 3: Discovery Health’s service levels compare favourably against international benchmarks
Query metrics US benchmark Discovery Health
Answer speed 80% in 21.93 seconds 35 000 calls per day
Average: 38 seconds Actual: 85% in 10 seconds
Average: 8 seconds
Abandon rate Average: 4.58% Actual 2005: +1.75%
Best 3.52%
First call resolution Average: 75.33% >90%
Best: 79.32%
Source: 2005 Purdue report on health insurance industry call centres
Claims metric US benchmark Discovery Health
Turnaround HMOs*: Mean 71 days 2 million claims per month
Medicare**: 95% of Avg < 1 day
claims in 30 days > 96% in 3 days
Accuracy US Managed Care***:
98% – 99.1% > 99% accurate
* From interstudy 2000 analysis of 600 Health Management Organisations in the US
** From US Managed Care Handbook
*** Cap Gemini, Ernst & Young US Managed Care Benchmark Study 2002.
DISCOVERY HEALTH (CONTINUED)
7558-discovery front 7-11 9/11/06 2:03 Page 20

D I S C O V E R Y A N N U A L R E P O R T 2 0 0 6 2 1
O U R S C A L E A N D S I Z E E N T R U S T S U S W I T H A N E N O R M O U S
R E S P O N S I B I L I T Y, B U T A L S O C R E AT E S C O N S I D E R A B L E O P P O RT U N I T I E S
F O R U S T O W O R K T O T H E B E N E F I T O F O U R M E M B E R S .
• Our growth
While other medical schemes are losing members,
Discovery Health is gaining them.
• Our financial strength
The Discovery Health Medical Scheme has yet again
been awarded the highest credit rating in the industry
for its claims paying ability – an AA rating from Global
Credit Ratings.
• Our service levels
We constantly measure and benchmark our service
interactions to ensure continual improvement
(figure 3 shows how we perform against international
benchmarks).
THIS YEAR’S KEY FOCUS AREASInitiatives that help to ensure our members getthe best quality careAs the largest medical scheme administrator in South
Africa, and administrator of the Discovery Health Medical
Scheme (the largest open medical scheme), as well as eight
other closed schemes, Discovery Health has almost two
million people in our care. Our scale and size entrusts
us with an enormous responsibility, but also creates
considerable opportunities for us to work to the benefit
of our members. In September 2005, we introduced two
important initiatives aimed at using our scale and size to
provide additional peace of mind for our members about
their medical care:
1. Discovery 911 provides rapid medical care in an
emergency
Discovery Health has partnered with Netcare 911 to offer
our members – at no additional charge – Discovery 911, our
emergency rapid response service. We believe this unique,
value-added service is making an important difference to
the quality of care received at the most crucial stage of a
medical emergency. This is the so-called Platinum Ten
Minutes; the first ten minutes after a medical trauma event.
Discovery 911 includes a cellphone alert service, allowing
members to alert us to an emergency situation at the press
of a button, even if they are unable to speak. We dispatch
an emergency response vehicle to the scene immediately
upon receiving the alert. The trained paramedics are able to
take the appropriate action to treat or stabilise the patient’s
condition while emergency transport is underway. They are
also able to assess which transport and facilities are most
appropriate based on the patient’s injury and condition.
2. The Discovery Hospital Rating Index allows
consumers to assess quality of careThe Discovery Hospital Rating Index has been very popular
with consumers. Around 5 000 people – not just Discovery
Health members – click into our website every month to
look up the cost and quality ratings of South Africa’s private
hospitals. It is the only index of its kind in South Africa and
7558-discovery front 7-11 9/11/06 2:03 Page 21

uses data collected by Discovery Health over a period of
five years to assess the quality and cost of care. The data is
based on the actual claims experience of our almost two
million members.
Some hospital groups and health care professionals have
questioned the need for such a tool, the validity of the
ratings we have assigned and the methodology we used
to rate hospitals’ performance. The Council for Medical
Schemes has endorsed the Hospital Rating Index and ruled
that it is not only a valid and sound consumer tool, but a
very necessary one. We are working with the hospital
groups that have raised concerns, to allay them. We have
already made many improvements and adjustments to the
index based on the feedback received from stakeholders,
and have seen several hospitals receive improved ratings in
terms of the cost and quality of health care outcomes.
This means that not only are consumers able to make more
informed decisions, but that we are also seeing progress in
our goal of using the tool to improve the quality and reduce
the cost of health care for consumers in the longer term.
Initiatives that help to contain the cost ofhealth careDiscovery Health has for the past two years contained its
average annual contribution increases to a single digit.
Health care is by nature costly, and funding it affordably
and sustainably is a challenge the world over. Several
factors on both the supply and demand side contribute to
the challenges – for example, the high costs involved with
developing new medical technologies and the unequal
distribution of health care resources. Certain developments
during the past year have served to highlight these
challenges, and Discovery Health has an important role to
play in finding ways to meet our members’ expectations
without compromising the long-term sustainability of their
health care benefits.
1. We are finding ways to fund high-cost new
technologies in a sustainable manner
Medical and technological advances are opening up
exciting new possibilities in health care. Research in the
field of genetics, for instance, now allows doctors to
understand how the make-up of our bodies contributes to
the likelihood of our developing a disease. It gives them the
tools to develop medicines and treatments that fight
diseases biologically, rather than chemically. However,
these advances come at a high price and health care
funders need to approach the way they fund them,
responsibly and consistently.
Guided by the principle that we want to fund the
best quality health care for our members, including
appropriate and effective new technologies, Discovery
Health carefully and constantly evaluates new treatments.
We follow a rigorous process, which includes Health
Economics Evaluations, to ensure we develop responsible
funding policies. This entails detailed clinical and economic
modelling, based on the gold-standards of evidence-based
medicine, to develop the most appropriate health care
funding decision for a particular therapy.
Many of these technologies have proven clinical benefits,
while the scientific evidence for others is less clear. Discovery
Health is continuously hard at work in evaluating these various
products. We work with the medical profession to ensure that
we keep up to date with the latest clinical evidence. On behalf
of our members, we also engage the pharmaceutical
manufacturers in evidence-based and commercial discussions
to reduce their costs. In short, we make every effort to find
sustainable solutions for our members.
Discovery Health has recently developed the Specialty
Medication Benefit, which will be available from 1 January
2007. We are the first funder in South Africa to develop a
clearly defined, consistent benefit to pay for high-cost
treatments like Herceptin®, Revellex® and Enbrel®. The
benefit is only available on the Comprehensive Plans and
covers a list of twenty clearly defined high-cost treatments.
2. We are working to meet member and providerexpectations around rates of reimbursementAnother important area where it is sometimes difficult to
strike a sound balance between health care access and cost,
is the reimbursement rates for the services of health
professionals. Health care professionals have the right to
choose how much they believe is fair to charge for their
services. Health care funders have the responsibility to
ensure that they carefully manage how much they pay for
services on behalf of the members who have entrusted
them with the management of their funds.
Ideally, all three parties – patient, doctor and funder –
should agree on the best price through a process of
negotiation. This is certainly the intent of the Competition
D I S C O V E R Y A N N U A L R E P O R T 2 0 0 62 2
DISCOVERY HEALTH (CONTINUED)
7558-discovery front 7-11 9/11/06 2:03 Page 22

D I S C O V E R Y A N N U A L R E P O R T 2 0 0 6 2 3
Commission’s banning of the price-setting practices of the
past, where health professionals collectively agreed how
much they would charge and health care funders
collectively agreed how much they would reimburse.
Since that ruling, however, there has been some
uncertainty and confusion in the industry. The National
Health Reference Price List has been treated by most health
care funders and health professional as a collective medical
aid tariff, harking back to the old system, instead of seeing
it as it was intended – merely as a reference tool in price
negotiations. The industry still has some way to go in terms
of fully understanding and embracing the new more
competitive, free market-based structures.
We are working hard to address these issues. Discovery
Health’s size provides it with the resources to work with
provider groups to create reimbursement structures that
both ensure fair remuneration for health providers and
contain costs for members. In 2006, we applied this
approach successfully in creating the proprietary KeyCare
Primary Care Network. More than 2 000 GPs joined the
network in the first year, negotiating preferential prices for
KeyCare members to ensure affordable access to primary
care for those individuals who previously didn’t enjoy
private health care. In 2007, Discovery Health will extend
these principles even further with the Discovery GP
Network. It will halve the cost of primary care for Discovery
members, who will now pay only R95 per consultation. The
Discovery Health Medical Scheme will pay the rest of the
consultation fee directly to the GP. This will enhance
members’ benefits significantly.
Similarly, Discovery Health has introduced the Discovery
Health Premier Rate for 2007 which provides certainty
around the rate of reimbursement for specialists who agree
to charge this rate, while reducing the risk of short-falls
for members.
In 2007, we will also be looking at strengthening our
relationships with various hospital groups to reduce the
high cost of hospital care and to engage in risk-sharing
initiatives for the benefit of all stakeholders.
These structures leverage Discovery Health’s strength to
protect members against co-payments, secure convenient
direct payments for health care practitioners and most
importantly, contain the cost of health care to ensure the
long-term sustainability of cover.
Initiatives that extend health care access tonew marketsWhile Discovery Health is the clear leader in the industry, it
still only holds a 26% share of the medical scheme market
in South Africa. This means it has significant scope to grow
in its existing market – the seven million people who
already belong to a medical scheme. We also see significant
opportunities to increase the size of the medical scheme
market by creating products that attract the previously
uninsured: those employed South Africans who were
historically excluded from financial services markets.
This is reflected in the steady growth in membership of our
KeyCare Plans, our participation in the Low Income Medical
Scheme industry initiative and the addition to our books of the
LA Health Medical Scheme in 2005 and Lonmin Medical
Scheme in 2006. Both these schemes, operating in the local
government and mining sectors respectively, have large
concentrations of members in the previously uninsured market.
1. KeyCare is the most successful plan in its marketDiscovery Health launched the KeyCare Plans in 2003 with
the specific aim of increasing medical scheme membership
among the previously uninsured market, particularly
employed individuals earning a household income of
between R3 500 and R6 500 per month.
Three years later, the KeyCare Plans have already attracted
140 000 lives, and we estimate that two-thirds of those
members did not belong to a medical scheme before. Its
rapid growth makes it the most successful product in the
lower income market. As demonstrated in figure 4, the
KeyCare Plans alone have more members than the majority
of medical schemes have in total.
Figure 4: the KeyCare Plans alone have more members than
most established medical schemes
Changes in total members Dec 2004 – Dec 2005(Principal members – thousands)
–40 0 40 100–20 20 60
DiscoveryOxygen
FedHealthSpectramed
MedicoverHosmed
ResolutionLiberty
BestMedMunimedMediHelp
SizweMedshield
ProSanoBonitas
Momentum
80
KeyCare
7558-discovery front 7-11 9/11/06 2:03 Page 23

D I S C O V E R Y A N N U A L R E P O R T 2 0 0 62 4
inflationary trend we have seen in the past number of years,
where members are increasingly viewing specialists as their
first port of call when seeking medical advice.
2. Using Discovery Health’s expertise on HIV and
AIDS through Discovery HIVCare
Increasingly, quality of delivery is a key differentiator in the
health environment. We must use our scale and size, as well
as our experience, to the advantage of our members. An
important initiative that we will focus on in 2007 is
Discovery HIVCare, a comprehensive HIV and AIDS-
management programme aimed at employers, which
seamlessly integrates with Vitality WellPoint.
It provides employers with a variety of reporting tools and
interventions, including surveys, HIV and AIDS education
and awareness, voluntary counselling and testing, medical
advice and counselling and policy development. The HIV
and AIDS disease management programme also gives
access to ARVs, doctor consultations and pathology, as well
as support for employees with HIV and AIDS.
3. Managing the complex health care environment
through DiscoveryCare
Discovery Health is committed to providing our members
with access to excellent health care that is affordable in the
long-term. Through DiscoveryCare, a high-touch service to
our members who are in need of care, we manage the high
cost of health care, hospitalisation and chronic medicines
with the specialised input from experts in actuarial and
clinical risk management.
DiscoveryCare’s Hospital Utilisation Management enables
us to manage the risk of expensive and clinically complex
hospital events and allows us to make clinically appropriate
funding decisions for certain cases. Through our Disease
Management Programme, we recognise the importance of
assisting members who suffer from diseases such as HIV
and AIDS and cancer, to actively manage their lifestyles.
Interventions such as lifestyle management, managing
treatment compliance and response, and support and
counselling, all have positive effects on the prognosis of a
patient, and ultimately reduce hospital admissions.
An important focus for DiscoveryCare in 2007 will be to
engage in strong relationships with hospital groups that will
benefit all stakeholders in the health care environment.
2. New partnerships in the distribution environmentDuring the year under review, Discovery embarked on two
exciting enterprise development initiatives that are helping
to create a presence in new markets and in particular, are
helping to create greater awareness of Discovery and the
KeyCare offering. These are:
• A partnership with a black-owned intermediary house, PFM
• The opening of Discovery Consulting Services, Soweto –
our first distribution franchise in Soweto, allowing us to
better service intermediaries and clients based in the area.
In both cases, we have created partnerships that allow us
better penetration into emerging markets. In turn, we
provide the resources and expertise to help individuals from
previously disadvantaged communities develop viable
business enterprises.
3. We are involved in LIMS, an industry initiativeWe have been closely involved with the private health care
industry’s investigation into extending access to medical
scheme benefits for the low income market. We expect to
see the activity around this new class of medical schemes –
the Low Income Medical Scheme – to intensify during the
year ahead and expect implementation in January 2008.
Discovery Health will continue its active role in this process,
in line with our commitment to making quality health care
accessible to a greater proportion of South Africans.
OUR PROSPECTS FOR THE COMING YEARWe are excited about Discovery Health’s future prospects –
not only in terms of growth and profitability, but also our
ability to use our leadership role to contribute to a better
health care system in South Africa. In the year ahead, we
will focus on important strategic opportunities that will
allow us to reduce the cost of health care while our
infrastructure capabilities enable us to deliver personalised
and convenient service to our members:
1. Continued focus on the quality and cost ofhealth careGoing into 2007, Discovery Health has announced its third
consecutive single digit increase. We are also excited about
the impact that the Discovery Health GP Network and our
Premier Rate agreement with specialists will have in
reducing the cost of care for our members. Importantly, the
reduced cost of GP consultations will hopefully encourage
members to make more use of primary care, only consulting
specialists when it is appropriate. This will address the
DISCOVERY HEALTH (CONTINUED)
7558-discovery front 7-11 9/11/06 2:03 Page 24
D I S C O V E R Y A N N U A L R E P O R T 2 0 0 6 2 5
Our aim is to work together toward reduced hospital costs
through risk-sharing initiatives.
4. Delivering high quality health care and
personalised transactions and service
While the high cost of health care remains a challenge for
all medical schemes in South Africa, we are confident that
our actuarial and clinical expertise, resources and external
relationships with health care groups, will enable us to keep
private health care in South Africa, affordable over the long
term. The Discovery Health Medical Scheme risk pool is
in a stable position, which provides our members with the
certainty that we can pay their claims well into the future.
Our infrastructure and technology capabilities allow us
to focus on better service delivery and value for our
members. Our aim for 2007 is to personalise and refine our
service offering even more, with initiatives such as
Discovery Mobile. Our members will enjoy easy and
convenient access to their basic plan, claims, Vitality and
DiscoveryCard information, via their cellphones.
5. Keeping abreast of key regulatory developments
The Council for Medical Schemes published a number of
proposals for changes to the design of medical scheme
benefits across the industry and for expanding the
Prescribed Minimum Benefits. Discovery Health is an active
participant in the industry debates around the proposed
changes, which we expect to be implemented in 2008. We
are also assessing their potential impact on Discovery
Health and the Discovery Health Medical Scheme. Overall,
we expect them to be positive.
We have initiated a project within Discovery Health to ensure
we are ready to implement the requirements of the Risk
Equalisation Fund once the legislation is passed and
implemented. We expect implementation on 1 January 2008,
but the timelines have not yet been confirmed. In the
meantime, Discovery Health will remain involved with the
industry discussions around this initiative. (For a more
comprehensive update on regulatory issues pertinent to
Discovery Health, please view the regulatory section of the
Discovery sustainability report at www.discovery.co.za).
6. We expect steady growth to continue
The Discovery Health Medical Scheme enjoys scale, size
and stability in the South African health care environment,
and with our continued focus on providing access to quality
health care and personalised service, we expect the scheme
to steadily grow in the year ahead. Discovery Health also
has a clear leadership role in the market and as the
environment changes; we will continue to debate and
engage in industry issues.
For 2007, we have refined our lower-income offering
through enhanced benefits to the KeyCare range. We believe
that KeyCare remains the best offering in the lower-income
market and that it will continue to grow in the year ahead.
The third key-area for continued growth is the closed
scheme market. We currently administer eight closed
schemes and have signed up the Umed Medical Scheme as
a new closed scheme. We believe that this is an area for
strong future growth and our aim is to grow our current
market share of 9% considerably.
O U R I N F R A S T R U C T U R E A N D T E C H N O L O G Y C A PA B I L I T I E S A L L O W
U S T O F O C U S O N B E T T E R S E R V I C E D E L I V E R Y A N D VA L U E F O R
O U R M E M B E R S .
7558-discovery front 7-11 9/11/06 2:03 Page 25

D I S C O V E R Y A N N U A L R E P O R T 2 0 0 62 6
Every year of Discovery Life’s short
history has been characterised by
a cycle of consumer-centric innovation,
followed by rapid organic growth
and consequently, a solid financial
performance.
South Africa’s fastest growing major life assurer
DISCOVERY LIFE
Herschel Mayers
Chief Executive Officer, Discovery Life
7558-discovery front 7-11 9/11/06 2:03 Page 26

D I S C O V E R Y A N N U A L R E P O R T 2 0 0 6 2 7
THIS YEAR’S PERFORMANCEDiscovery Life drives growth and profitability,without needing further capital investmentIn less than six years, Discovery Life has grown rapidly to
become South Africa’s fastest-growing major life assurance
company. I would argue it is also the industry leader in
innovation. Every year of the company’s short history
has been characterised by a cycle of consumer-centric
innovation, followed by rapid organic growth and
consequently, a solid financial performance.
The year under review has been no exception. In the past
year, we have seen a 25% increase in new business and a
31% increase in operating profit. This has bolstered
Discovery Life’s contribution to the overall performance of
the Discovery Group. In fact, Discovery Life is now a
major contributor to the Discovery Group’s growth and
profitability, as outlined in the Discovery Holdings report by
Adrian Gore. A particularly encouraging development has
been the improvement in the operational cash flow position
of Discovery Life (see figure 1).
100
50
0
–50
–100
–150
–200
–250
–300
Operational cash flow(R million)
2003 2004 2005 2006
FINANCIAL HIGHLIGHTS
• New business R789 million (+25%)
• Gross inflows R1 768 million (+38%)
• Operating profit R546 million (+31%)
• Value of in-force (FSV Basis) R2 297 (+25%)
Figure 1: Discovery Life has turned cash-flow positive in 2006
7558-discovery front 7-11 9/11/06 2:03 Page 27

D I S C O V E R Y A N N U A L R E P O R T 2 0 0 62 8
Our good risk experience has increasedDiscovery Life’s profitabilityAn important aspect of Discovery Life’s performance is our
good risk experience, which resulted in a risk profit of more
than R500 million in the period under review (as
demonstrated in figure 2). Put simply, policyholders are
claiming less than we projected. The positive risk experience
can be attributed to our ability to encourage healthier lives,
as well as healthier lifestyles, through the Vitality
programme. This exceptional mortality and morbidity
experience points to the actuarial soundness of Discovery
Life’s product design and underwriting practices. It also
speaks to an important, almost paradoxical feature of the
Discovery business model: our ability to be both innovative
and conservative at the same time. While we have
developed groundbreaking product structures to the benefit
of the consumer, we have done so in a way that is both
financially prudent and profitable. What’s good for our
clients is also good for our business.
Discovery Life creates real value for its parentcompany and shareholdersSix years ago, we set out to build a major life assurance
business that would compete successfully against more
established players and deliver value to the Discovery
Group and its shareholders. We are seeing this vision
manifest in the strong embedded value of Discovery Life’s
new business, which has grown to R529 million in 2006, as
shown in figure 3.
OUR STRATEGYWe want to lead our industry throughconsumer-centric product innovationDiscovery Life’s success in the risk assurance market has
hinged on a clear strategy. When we entered the market
six years ago, we set out to take a fresh look at life, as our
launch advertising campaign’s tagline put it. The ambiguous
use of the word life was intentional, and spoke to two facets
of our vision:
1. Redefining the life assurance industry through product
innovation;
2. Making a tangible difference in the lives of South
African life assurance consumers.
600
500
400
300
200
100
0
New business EV(R million)
2002 2003 2004 2005 2006
100908070605040302010
0
Actual risk experience as a % of expectation(%)
Adjusted for comparison to reflect5% improvement in expectation
EV assumption
2002 2003 2004 2005 2006
Figure 2: Discovery Life policyholders are claiming less
than expected
Figure 3: Discovery Life’s new business shows strong
embedded value
DISCOVERY LIFE (CONTINUED)
7558-discovery front 7-11 9/11/06 2:03 Page 28

D I S C O V E R Y A N N U A L R E P O R T 2 0 0 6 2 9
It also pointed to the fact that our products centred on
risk cover, rather than investment aspects. This latter aspect
of our strategy has since evolved to include investment
products, but our focus on innovation and consumer-
centricity will never shift.
THIS YEAR’S KEY FOCUS AREASThe Discovery retirement Optimiser performedwell in its first yearPerhaps the most important strategic development of the
past year has been Discovery Life’s entry into investment
markets with the Discovery retirement Optimiser. Recent
negative publicity around unfair penalty fees and poor
surrender values has painted a picture of a somewhat
beleaguered – and therefore not a very commercially
attractive industry. However, optimism is a hallmark of the
Discovery approach and we are excited about the
possibilities for positive change created by the increasing
trend to consumerism in financial services markets. In fact,
we had identified the potential for more consumer-friendly
retirement products early on. The launch of the Discovery
retirement Optimiser last year was the result of nearly two
years of product development.
I am pleased to report that it has gone well. We now hold
16% of the independent broker retirement annuity market.
New industry developments indicate a shift in the life
assurance industry’s approach to retirement funding.
We integrated the LIFE PLAN with theDiscoveryCard to create more value forpolicyholdersLife insurance costs less today than it did when we entered
the market. Discovery Life led the move to a new
generation of more efficient, pure risk life insurance
products. The savings have been even greater for Discovery
Life policyholders who have integrated their life insurance
cover with Discovery’s other products.
1. Phase 1: Good claims experience reducespolicyholders’ premiums
Discovery Life first introduced the Discovery Integrator in
2002, giving Discovery Health members a 20% initial
discount on their LIFE PLAN premiums, as well as the ability
to manage their future increases based on their health
management – as measured by their Vitality status and
Health Plan claims. The Discovery Payback Benefit
introduced in 2004, extended the same philosophy of
influencing premiums through claims experience, by paying
policyholders back a percentage of their LIFE PLAN
premiums, based on their health claims.
2. Phase 2: Card spend can increase
policyholders’ cover
In June of 2006, Discovery Life took the value of
integration to a new level with the launch of the
DiscoveryCard Integrator. In essence, the product allows
policyholders to use their credit card spend to secure more
life cover to protect their loved ones. The mechanism to
W E A R E E X C I T E D A B O U T T H E P O S S I B I L I T I E S F O R P O S I T I V E
C H A N G E C R E AT E D B Y T H E I N C R E A S I N G T R E N D T O C O N S U M E R I S M
I N F I N A N C I A L S E R V I C E S M A R K E T S .›
7558-discovery front 7-11 9/11/06 2:03 Page 29
D I S C O V E R Y A N N U A L R E P O R T 2 0 0 63 0
achieve this is simple, yet elegant. Policyholders receive
an additional initial premium reduction of up to 15%,
linked to their Vitality status and future card spend. Their
future premium increases then adjust automatically based
on their actual card spend and Vitality status. The link to
Vitality means that we are able to encourage and reward
healthy behaviour.
The benefits to consumers are clear. Integration across the
Discovery range of products creates improved health,
enhanced value for money and tangible savings. Strategically,
it allows Discovery Life to increase its appeal and the
“stickiness” of its products among the existing Discovery
Health membership base of almost two million lives.
We also recently announced exciting newenhancements to key risk benefitsAnother recent enhancement related to the DiscoveryCard, is
the DiscoveryCard Protector, a unique card protection plan
that not only insures card debts, but also pays out a lump-
sum for a period of twelve months. This amount is based on
the policyholder’s actual credit card spend on key living
expenses such as groceries, petrol and cellphone costs.
In addition to this, we announced enhancements to our
range of risk benefits, including adding the option of
treatment at a network of leading US medical facilities to
our Severe Illness Benefit. Discovery Life is the first life
assurer to offer policyholders claiming from their severe
illness cover, the ability to choose their full lump-sum
payout, or a partial lump-sum payment plus cover for
treatment at a leading US medical facility. We also
introduced automatic cover for the parents of the
policyholder and those of the spouse under the Severe
Illness Benefit.
We believe these enhancements are compelling additions
to the unique Discovery Life value proposition – and that
they maintain our tradition of creating innovative industry
firsts that benefit consumers.
We helped Prudential plc to build a consumer-driven risk solution for the UK marketIn 2006, Prudential plc went to market with an initial
limited launch of its Flexible Protection Plan, a risk-focused
first for the UK market that Discovery Life helped them
build. Like the Discovery LIFE PLAN, the product uses
objective medical criteria and categories of impairment to
assess disability and severe illness cover claims. It also
allows multiple draw downs and guarantees cover at a
minimum protected level, ensuring funds are not depleted
even after multiple claims. These features were all unique
to the Discovery LIFE PLAN when it was first launched in
South Africa. While they have subsequently been adopted
more widely within the SA marketplace, they are entirely
new to the UK insurance market.
Discovery Life has invested more than its intellectual
capital in the project, paying for the systems development
costs associated with the product. An expense of around
R34,7 million that will be recouped from the Prudential
over a period of ten years, has already been accounted for
in the financials for the period in review. In addition, we will
share in the embedded value profit of the policyholder
book on a sliding scale, totalling around 25% of the
associated embedded value profit.
While still in its infancy, the market’s response to the
product has been positive and we are excited about our
contribution to product innovation in international
assurance markets.
OUR PROSPECTS FOR THE COMING YEAR1. Low income market growth opportunitiesAt the time of writing this report, Discovery Life is in the
process of launching an innovative new product aimed
specifically at the lower income market. This not only
provides the opportunity to address past imbalances in
terms of financial services access, but creates a significant
growth opportunity for Discovery Life, which has to date
only had limited exposure to this market.
Discovery Life has provided funeral cover to members of
KeyClub, the loyalty programme associated with Discovery
Health’s KeyCare Plans aimed at LSMs 5 and 6. Discovery
Life is now widening access to this product with the
Discovery Prepaid Funeral Plan, a funeral cover product
based on an innovative new distribution model that uses
the same principles as prepaid cellphone airtime. I am
hopeful that the launch of this product will herald a broad
and successful entry for Discovery Life into an exciting new
market for us.
DISCOVERY LIFE (CONTINUED)
7558-discovery front 7-11 9/11/06 2:03 Page 30

D I S C O V E R Y A N N U A L R E P O R T 2 0 0 6 3 1
2. An additional distribution channelTo date, Discovery Life has relied entirely on independent
financial advisers, serviced through our independently-
owned Discovery Consulting Services franchise offices.
While we will always continue to make use of the
specialised, high-advice services of the broker, we also see
the potential to bolster new business growth by creating
our own agency force and we are investigating the
feasibility of this distribution channel.
3. Potential in the long-term savings marketDiscovery Life is also exploring opportunities in the medium
to long term for further expansion into investment markets.
We are optimistic about Discovery Life’s future prospects.
D I S C O V E R Y L I F E H E L P E D P R U D E N T I A L P L C B U I L D I T S F L E X I B L E
P R O T E C T I O N P L A N , A R I S K - F O C U S E D F I R S T F O R T H E U K M A R K E T.
7558-discovery front 7-11 9/11/06 2:03 Page 31

D I S C O V E R Y A N N U A L R E P O R T 2 0 0 63 2
DISCOVERY VITALITY
Alan Pollard
Chief Executive Officer, Discovery Vitality
Healthy members – the foundation for a healthy business
Discovery Vitality posted a pleasing
performance in every respect: profitability,
growth and, most importantly, value
generated for Discovery clients.
7558-discovery front 7-11 9/11/06 2:03 Page 32

D I S C O V E R Y A N N U A L R E P O R T 2 0 0 6 3 3
THIS YEAR’S PERFORMANCEDiscovery Vitality posted a pleasing performance in every
respect: profitability, growth and, most importantly, value
generated for Discovery clients. We added an additional
47 000 lives to Vitality during the 2005/2006 financial year,
and saw new business increase by 15%.
Vitality’s greatest contribution to Discovery’s overall
success is not a purely financial one, but lies instead in the
unique integration capabilities and product differentiation
that it creates for our other businesses. However, we have
always believed in running Vitality like a business, ensuring
that it is financially self-supporting and profitable in its own
right. We are therefore pleased with the 11% increase in its
operating profits.
The success of the DiscoveryCard is undoubtedly the
highlight of the past financial year. Just two years after its
launch, there are more than 350 000 cards in circulation.
The number of primary cardholders increased by 120%
to 307 688.
OUR STRATEGYVitality makes people healthier, and enhancesand protects their livesWhen we launched Vitality in 1997, our aim was to
encourage Discovery members to live healthier lives and so
reduce their long-term health care spend. It still is. Vitality
is first and foremost a wellness programme, which puts in
consumers’ hands the knowledge and tools that underlie
good health – and creates powerful incentives for them to
put them to good use.
Vitality is also a value creator. For our members, it puts an
aspirational lifestyle within their reach. Through Vitality,
they are able to access a host of high-quality health, leisure
and lifestyle facilities at an unprecedented price. The better
their health, the more favourable the price at which they
are able to access these facilities. An important feature of
our strategy is to partner with premium brands that have a
national footprint and broad consumer appeal.
Vitality also makes it possible to integrate Discovery’s other
offerings, making it hard to replicate. By linking together
FINANCIAL HIGHLIGHTS
• New business R107 million (+15%)
• Gross inflows R654 million (+26%)
• Operating profit R41 million (+11%)
• Vitality membership (lives) 1 229 333 (+4%)
• Number of primary cardholders 307 688 (+120%)
7558-discovery front 7-11 9/11/06 2:03 Page 33

Discovery’s other products, Vitality creates innovative
health and life assurance benefits that generate powerful
savings for consumers. It increases the Discovery value
proposition to such an extent that our clients are less likely
to leave us. Figure 1 demonstrates how the increased
customer loyalty created by Vitality translates into better
value for shareholders.
THIS YEAR’S KEY FOCUS AREASWe added kulula.com as a Vitality partner tomake a healthy lifestyle even more rewardingA significant enhancement to Vitality’s rewards offering
was the addition of the kulula.com flight benefit in
February 2006, reflecting the consumer shift to low-cost
airlines. Vitality members enjoy significant discounts on
kulula.com flights based on their Vitality status:
Vitality status Saving
Blue 15%
Bronze 20%
Silver 25%
Gold 30%
Since the benefit’s introduction, we have seen a major
increase in the use of Vitality flight benefits, as shown in
figure 2. Vitality members fill an average of six kulula.com
aeroplanes a day.
Vitality members are visiting the gym more oftenMaking people healthier remains our number one priority.
The scientific evidence is clear that regular exercise – along
with good nutrition, stress management and preventive
screening – is one of the most influential factors in
preventing disease and increasing longevity. We are
therefore encouraged by the increase in the number of
Vitality members that have joined the gym through Vitality.
More than 200 000 Vitality members now belong to our
partner gyms and Vitality members currently make up more
than one-third of Virgin Active and Planet Fitness’s
membership bases.
Our Wellness Network is putting Vitality on the mapThe roll out of Vitality’s Wellness Network during the
period under review has literally put Vitality on the map
across South Africa, broadening our national footprint. We
have added 295 pharmacies and 106 dietitians around the
35
30
25
20
15
10
5
0
Impact on EV of improved persistency – Health and Life(% change in EV)
1% lower 2% lower 3% lower 4% lowerLapses
D I S C O V E R Y A N N U A L R E P O R T 2 0 0 63 4
20
04
20
06
20
05
0 10 20 355 15 25
MarJunSepDecMarJunSepDecMarJunSepDecFebMarAprMayJunJulAug
20
03
30
Bookings per month: BA/Comair vs kulula.com(Thousand flight bookings)
BA/Comair flights kulula.com
Figure 1: Integration through Vitality lowers lapse rates and
improves embedded value
Figure 2: Popularity of kulula.com flights
DISCOVERY VITALITY (CONTINUED)
7558-discovery front 7-11 9/11/06 2:03 Page 34

D I S C O V E R Y A N N U A L R E P O R T 2 0 0 6 3 5
S I N C E I N C E P T I O N O F T H E D I S C O V E R Y C A R D , W E H AV E A L R E A D Y
PA I D B A C K O V E R R 5 0 M I L L I O N T O D I S C O V E R Y C A R D - H O L D E R S .
country to our existing network of 150 biokineticists to
offer our members nationwide access to a comprehensive
range of preventive health screenings and assessments.
Vitality members earn Vitality points for completing the
Vitality nutrition assessment and for having screening tests
performed at any one of our Vitality Check pharmacies.
DiscoveryCard-holders have received backR50 million of their spend
We launched the DiscoveryCard, our credit card offering,
in 2004 to enhance the Vitality value proposition and
provide an additional platform for integration with
Discovery Health and Discovery Life. It has been a
phenomenal success, and just two years after its launch,
there are over 350 000 cards in circulation and cardholders
have spent more than R3,5 billion. 73% of Vitality
members have a DiscoveryCard.
The South African credit market has seen rapid growth in
the past few years, with various retailers and other players
entering a market previously dominated by the banking
sector. Some of the new players have focused on competing
against more traditional cards through enhanced value add,
while others are focused on competing on price through
lower card fees. DiscoveryCard’s fees are similar to other
credit cards in the market but its value proposition sets it far
apart from its competitors. This is affirmed by independent
surveys which rate the DiscoveryCard as the most compelling
credit card offer in the market.
The DiscoveryCard is linked to a network of retail store
partners, as well as selected travel partners. As members
improve their health through Vitality and achieve a higher
Vitality status, their savings within the store network
increase. These savings are paid back directly into their
DiscoveryCard account at the end of the month. Card-
holders also qualify for higher discounts through our travel
partners and increase their ability to earn travel miles as
they move through the Vitality statuses.
Since inception of the DiscoveryCard, we have already
paid back over R50 million to DiscoveryCard-holders,
demonstrating that the better your Vitality status is, the
greater your rewards will be.
Figure 3: Monthly savings paid back to Vitality members nowtotal over R50 million
Partner discounts(R million)
20
04
20
06
20
05
0 20 40 6010 30 50
NovDecJanFebMarAprMayJunJulAugSepOctNovDecJanFebMarAprMayJunJulAug
7558-discovery front 7-11 9/11/06 2:03 Page 35

D I S C O V E R Y A N N U A L R E P O R T 2 0 0 63 6
New benefits increase the integration – andvalue – across the Discovery brand
Both Discovery Health and Discovery Life have during the
year under review launched new benefits that link into the
DiscoveryCard offering to provide Discovery clients with
increased value and convenience.
Discovery Health members have, since January 2006, had
the option of choosing a Health Plan Account linked to
their DiscoveryCard. This facility allows members to select
an additional interest-free credit facility to help them fund
out-of-pocket health care expenses. Two additional
facilities were recently introduced which enables the
DiscoveryCard to fund out-of-pocket medical expenses on
a highly convenient basis for the member.
Discovery Life policyholders are also able to access unique
benefits linked to the DiscoveryCard. In June 2006,
Discovery Life launched the DiscoveryCard Integrator. This
innovative benefit allows a significant portion of the
DiscoveryCard-holder’s spending to be paid back on the
policyholder’s death. Alternatively, credit for this is given
upfront, which translates into lower Life premiums for
DiscoveryCard-holders.
Discovery Life also introduced the DiscoveryCard Protector,
a unique card protection plan that not only insures card
debts, but also insures the cost of living. It does so by
paying out a lump-sum in the case of disability, severe
illness or death, for a period of twelve months. The amount
paid is based on the policyholder’s actual credit card spend
on key living expenses such as groceries, petrol and
cellphone costs.
DiscoveryCard is adding new partners for 2007 and
Pick ’n Pay, with its national footprint and wide range of retail
consumer goods, replaces Woolworths as the anchor partner.
We have also added Stuttafords, Nando’s and Altech Netstar to
our existing network of DiscoveryCard partners. The prospect
of earning back between 5% and 8% of their spending at Pick
‘n Pay is bound to appeal to DiscoveryCard-holders. Nando’s
and Vitality are working together to create healthy Vitality
Card spend since inception(R million)
20
04
20
06
20
05
0 2 000 3 000 4 0001 000 2 500 3 500
DecJanFebMarAprMayJunJulAugSepOctNovDecJanFebMarAprMayJun
1 500500
Figure 4: DiscoveryCard-holders have notched up R3,5 billion
in spend since the launch of the card two years ago
Figure 5: Unique value proposition – internal integration
DISCOVERY VITALITY (CONTINUED)
7558-discovery front 7-11 9/11/06 2:03 Page 36

D I S C O V E R Y A N N U A L R E P O R T 2 0 0 6 3 7
menu options, tying into our overall commitment of making a
healthier lifestyle accessible to our members.
Vitality WellPoint will help make corporate companies
healthier. Employers have historically been an important
target market for Vitality. We have always held the belief
that improved health and reduced health care spend would
hold significant benefits for employers. Employers generally
not only fund a portion of their employees’ health care
cover, but also count the cost of illness in terms of
absenteeism and lost productivity.
We have therefore long encouraged employers to make
Vitality available to their employees. Over the years, we
have offered employers a number of supportive wellness
interventions, such as our regular wellness days where we
educate employees of large corporates about the benefits
of Vitality and perform a range of health screenings and
assessments. However, with the introduction of Vitality
WellPoint, we are taking corporate wellness to a new level.
WellPoint draws Vitality’s scale, size and wellness expertise
together into a comprehensive, focused programme for
corporates that allows them to actively encourage better
health within their organisation and be rewarded for it.
Discovery holds unique insights into its members’ health
status and lifestyles, has extensive disease management
expertise, and integrated technology infrastructure.
We have combined this into a range of wellness tools,
including:
• Wellness assessments and programmes
• Executive medicals
• Absenteeism management
• Comprehensive HIV and AIDS management
• Employee assistance programmes.
WellPoint is available to all employees, not just those on
Discovery Health. Similar to Vitality, employers earn a
WellPoint status based on their employees’ health and level
of engagement in the programme. Based on this, employers
will receive a discount of up to 30% on their Discovery Life
Group Risk premiums and employees receive additional
Pick ‘n Pay cash back on the DiscoveryCard.
Vitality WellPoint will be available to employers with effect
from 1 February 2007. We see it playing a significant role
in enhancing the value of integration for large employer
groups, leading to savings and most importantly, a
healthier workforce. Strategically, we believe it will increase
the appeal of Discovery’s integrated product range among
large corporates.
W E L L P O I N T D R AW S V I TA L I T Y ’ S S C A L E , S I Z E A N D W E L L N E S S
E X P E R T I S E T O G E T H E R I N T O A C O M P R E H E N S I V E , F O C U S E D
P R O G R A M M E F O R C O R P O R AT E S .
7558-discovery front 7-11 9/11/06 2:03 Page 37

New strategies to help us meet the growing US demand for consumer-directed health care
D I S C O V E R Y A N N U A L R E P O R T 2 0 0 63 8
DESTINY HEALTH
Barry Swartzberg
Executive Director, Discovery*
Arthur Carlos
Chief Executive Officer,
Destiny Health*
* This year’s Destiny Health report has been compiled with the input of Barry Swartzberg and Arthur Carlos, who jointly led the company from March2006 following the resignation of the previous CEO, Scott Spiker, until September 2006 when Arthur Carlos was officially appointed as the new CEO.
It has been a somewhat disappointing year
for Destiny Health in terms of its financial
performance, but strategically-speaking we
believe it has also been a defining one.
7558-discovery front 7-11 9/11/06 2:04 Page 38

D I S C O V E R Y A N N U A L R E P O R T 2 0 0 6 3 9
THIS YEAR’S PERFORMANCEIt has been a somewhat disappointing year for Destiny Health
in terms of its financial performance, but strategically-
speaking we believe it has also been a defining one.
Particularly in the first half of the year, we saw relatively
flat growth in membership, reduced new business and
worse-than-expected losses driven by elevated loss ratios.
We worked quickly to identify and address the causes,
implementing a number of bold steps to turn Destiny
Health’s performance around. While we did see the effects
of these measures manifesting in a slightly better second-
half (see figure 1), the overall performance for the year was
undeniably an unsatisfactory one. New business income
reduced by 6% compared to the 2005 financial year, and
membership grew by only 8%.
However, far from feeling defeated – as many who stand
sceptical of South African companies’ ability to succeed in
the highly-competitive US market would have us be – we
are excited about the opportunities that exist for us to
invigorate Destiny Health in the year ahead. We have a
clear plan that has already helped to reduce losses
significantly and, as shown in figure 1, bring them down to
a more acceptable and appropriate level.
Financial performance of Destiny(EBIT ($m))
0
–2
–4
–6
–8
–10
–12
–14
–162001 2002 2003 2004 2005 2006
Impact of actionsover last 6 months
Losses will reduce to an acceptable levelas full effects of the actions are felt
FINANCIAL HIGHLIGHTS
• New business US$123 million (–6%)
• Members 62 250 (+8%)
• Operating loss US$23 million (–57%)
• Operating loss R151 million (–68%)
Figure 1: Destiny Health’s losses reduced during the second half
of the year, and will continue to reduce to acceptable levels
7558-discovery front 7-11 9/11/06 2:04 Page 39

D I S C O V E R Y A N N U A L R E P O R T 2 0 0 64 0
OUR STRATEGYConsumer-directed health care is the future ofprivate health care in the USDiscovery’s entry into the US market in May 2000 was
driven by the following key factors:
• The similarities between the health care systems of the
United States and South Africa
In both countries, the public health sector is tasked with
providing care for the unemployed and indigent, while
the private health sector caters for the needs of the
employed. Funding is made affordable by the pooling
of funds through third party health care funders.
Employers are important stakeholders, and help to fund
the cost of private health care by subsidising employees’
health cover.
• The growing trend towards consumer-directed health care
in the USA
In the late 1990s US medical inflation started rising
uncontrollably despite the best efforts of health
maintenance organisations (HMOs) to contain costs by
restricting choice. Since then, there has been growing
support for the idea that US consumers should play a
more active role in managing their own health care
expenses to bring down rising costs.
• Discovery’s decade of expertise in delivering consumer-
directed health solutions
During the nineties in South Africa, Discovery Health led
an industry-wide move to a new generation of health
plans. Using the medical savings account structure,
Discovery Health put consumers in charge of at least a
portion of their health care spending, and encouraged
them to reduce their health care spend further by leading
a healthier lifestyle.
These factors are even more relevant in the US today than they
were when Destiny Health entered the market six years ago.
While consumer-directed health care plans are becoming
more common, the majority of health plans still contain
cost on the supply side through HMO-type structures.
Medical inflation is still soaring, and all stakeholders agree
that drastic reform is needed to bring the cost of health
care under control. The US government has introduced tax
and other legislation over the past number of years that
favours the health savings account structures characteristic
of consumer-directed health plans.
Just recently, the government announced plans to pilot
consumer-directed health care plans to participants of
Medicare, a federally-funded health insurance programme
for the elderly and disabled. In fact, in August of this year,
President Bush issued an executive order endorsing the
principles that underlie consumer-directed care, stating that
all health care programmes funded or run by the federal
government should: “promote quality and efficient delivery
of health care through the use of health information
technology, transparency regarding health care quality and
price, and better incentives for program beneficiaries,
enrollees, and providers”.
Destiny Health remains uniquely positioned tocapitalise on the shiftStrategically, the presence we have already created in the
US through Destiny Health is invaluable, in spite of the
setbacks we have faced in its execution. The US market is
undoubtedly a land of opportunity for a consumer-directed
health care organisation of Discovery’s unique scale and
expertise. Discovery has amassed fourteen years of
experience in consumer empowerment and the operational
capability that already allows it to service over two million
consumers in multiple markets.
We have carefully assessed the reasons why we have not
yet been able to capitalise fully on our early leadership
position and identified four problem areas:
• Uncompetitive networks
• Excessive market concentration
• Narrow focus on alliance relationships
• Loss ratios.
None of these areas of concern are fundamental to the
concept of consumer-directed health care or to Destiny
DESTINY HEALTH (CONTINUED)
7558-discovery front 7-11 9/11/06 2:04 Page 40

levels. This means that the premiums received were
inadequate to cover members’ claims. We have since
increased premiums to lower loss ratios. Importantly,
increases were carefully calculated to ensure that the higher
prices would not lead to a significant number of employer
groups relinquishing their cover with us. By pinning
increases at the appropriate rate, we were able to ensure
that those large groups who did lapse their cover were
those with a higher loss ratio percentage, while we retained
healthier lives with better claims experience and a lower
loss ratio.
Impact of pricing corrections on large groups
12-month Average Persistency
loss ratio increase rate
Confirmed groups 76% 24% 68%
Terminated groups 109% 44% 32%
We ended our partnership with Tufts and mayrestructure our Guardian partnershipDestiny Health three years ago entered into joint venture
agreements with Tufts Health Plan and Guardian. In both
instances, Destiny Health provided the consumer-directed
health care technology and shared some of the marketing
and distribution costs, but the JV partners themselves
handled the marketing and distribution. There was also an
element of risk exposure for Destiny Health to the
variability of claims. At the time, we hoped that the
established brand credibility and distribution footprint of
these two leading companies would facilitate Destiny
Health’s business model. They can be addressed effectively
through operational change, and below we provide an
outline of the steps we have already taken to do so.
THIS YEAR’S KEY FOCUS AREASDuring the year under review, we focused on the following
strategic changes.
A new leadership team is now at the helm ofDestiny HealthIn March 2006, following the resignation of CEO Scott
Spiker, we jointly took over the temporary management of
Destiny Health, with the help of other senior members of
the Discovery executive team. With Art Carlos’s permanent
appointment to the position in September 2006, a new
leadership team has been put in place in Chicago and the
Discovery executives, while still in close touch, have
returned to South Africa.
An important focus area for the team has been cost cutting
to ensure a far leaner operational platform. By focusing on
operational efficiency – steps have included reducing the
headcount in Chicago and moving all remaining back-office
and servicing functions to Discovery’s vast operational
infrastructure in South Africa – they have already been able
to significantly reduce costs.
We increased premiums appropriately to lowerloss ratios During the first half of the year under review, Destiny
Health’s loss ratio, calculated by dividing the claims paid by
the premiums received, had escalated to unacceptably high
D I S C O V E R Y A N N U A L R E P O R T 2 0 0 6 4 1
T H E U S M A R K E T I S U N D O U B T E D LY A L A N D O F O P P O R T U N I T Y
F O R A C O N S U M E R - D I R E C T E D H E A LT H C A R E O R G A N I S AT I O N O F
D I S C O V E R Y ’ S U N I Q U E S C A L E A N D E X P E R T I S E .
7558-discovery front 7-11 9/11/06 2:04 Page 41

D I S C O V E R Y A N N U A L R E P O R T 2 0 0 64 2
Health’s cost-effective expansion into new markets.
However, instead we found the model leaves us with little
control over the actual distribution process or the rate of
expansion, while still exposing us to a portion of the
associated costs and risks.
Earlier this year, following slower-than-anticipated sales of
the Liberty Health Plan (the name under which the joint
plan was marketed) and a period of protracted financial
difficulties for Tufts Health Plan, we reached a mutual
agreement with them to terminate our joint venture.
However, we have retained a block of their business under
our own administration and have the option to re-enter the
market at any time.
We believe there may be scope to restructure our
relationship with Guardian more efficiently as well – we are
looking into the possibility of taking on the role of a third
party administrator where we would provide claims
administration services to Guardian at a fee, without taking
on the risk of a loss.
Regardless of the outcome of our discussions with
Guardian, we have since made a strategic shift in terms of
our business model. We will consider a range of future
expansion models and opportunities, with the proviso that
they must be cost and risk effective.
We have entered more promising markets We have taken these learnings to heart in our recent
expansion into two promising new markets, Wisconsin and
Texas. We entered the Wisconsin market on a low cost,
fully-insured basis – in other words, where we take full
ownership of the risk and the distribution. For the
Wisconsin market, we have been able to deploy The
Destiny Health Plan in the market without creating an
operational presence – marketing and operational support
is provided through our Chicago office, while back-office
servicing infrastructure is provided by Discovery’s
Johannesburg-based head office. In the case of Texas, we
incurred some start-up costs associated with creating a
regional presence.
OUR PROSPECTS FOR THE COMING YEARIn addition to the steps outlined above, we see a number of
future opportunities for Destiny Health in the US market.
We will introduce PPOs to complement DestinyHealth’s consumer-directed health care plansUnlike the South African private health care market, which
has already assimilated consumer-directed care into the
mainstream, the US market is still in a transitional phase.
While a growing number of employers in the US market are
embracing consumer-directed health care plans, the more
traditional plans still dominate. Some employers are
interested in moving to these so-called high deductible health
plans that require employees to take on a greater level of
responsibility for actively managing health care expenses, but
many are nervous of exposing their employees to gaps in
cover. Destiny Health sees an opportunity to enhance its
appeal to these employers by providing access to plans
structured around preferred provider organisations (PPOs) in
addition to its range of consumer-directed health care plans.
Preferred provider organisations are in essence similar to
provider networks. These are organisations made up of
hospitals, doctors and other health care providers that enter
into an agreement with a health insurer or an administrator
of a health insurance plan, in this case Destiny Health, to
provide health care services to members at a discounted
rate. Unlike the more notorious health maintenance
organisations (HMOs), PPO plans do offer some consumer
choice and limited cover outside of the network.
By offering access to PPOs, Destiny Health will give
corporates the ability to offer their employees access to both
a traditional and a new-generation option. This will
significantly enhance Destiny Health’s ability to compete with
more established players who have added consumer-directed
health care plans to their more traditional product line-up.
Growth trends per market(Thousand members)
Illinois Wisconsin Mid Atlantic
Massachusetts Texas
20
05
20
06
0 20 40 60 7010 30 50
JunJulAugSepOctNovDecJanFebMarAprMayJun
Figure 2: Membership trends per market
DESTINY HEALTH (CONTINUED)
7558-discovery front 7-11 9/11/06 2:04 Page 42

D I S C O V E R Y A N N U A L R E P O R T 2 0 0 6 4 3
Discovery Health has similarly combined consumer
empowerment and network-based plans in the South
African market to help employers meet all their employees’
needs. Its KeyCare Plans limit choice in the interests of
affordability for lower income earners, while middle to
higher income earners have access to a range of new
generation plans.
We are making the Destiny Health Plansavailable to individuals for the first timeUntil now, Destiny Health’s target market has been
employers with fewer than 500 employees. However, The
Destiny Health Plan, with its focus on containing costs and
enabling healthy lifestyles, is ideally suited to self-employed
individuals and the currently uninsured. Here we see
opportunities to tap into unique distribution networks. For
example, we have already started distributing The Destiny
Health Plan through an innovative partnership agreement
with Life Time Fitness Centres, a network of fitness clubs.
Members of the clubs are able to reduce their Destiny
Health premiums through their active participation in the
Vitality programme, which includes exercising regularly at
the gym. We will actively pursue similar opportunities to
expand The Destiny Health Plan to individuals in new
markets, potentially across multiple states.
We are exploring the possibility of offeringthird party administration servicesAs discussed above in the section on our joint venture with
Guardian, we believe Destiny Health can also add value in
the provision of third party administration services to other
health care insurers, including the Guardian. This strategy
provides us with cost-effective opportunities for rapid
expansion into new markets and additional income streams.
W E R E M A I N C O M M I T T E D T O T H E U S M A R K E T A N D T O O U R
S T R AT E G Y O F P R O V I D I N G I N N O VAT I V E , C O N S U M E R - D I R E C T E D
H E A LT H C A R E S O L U T I O N S .
We may also look at offering ouradministration services to self-insuredemployer groupsDiscovery InHouse offers administration services to large
closed corporate medical schemes in South Africa, giving
these self-insured employer groups access to the benefits of
Vitality, Discovery Health’s efficiencies and innovative
product structures. Similarly, Destiny Health will seek
opportunities to offer administration services to large
corporate entities in the US that operate their own health
insurance structures. As with The Destiny Health Plan, the
ability to leverage off Discovery’s South African operational
platform creates the capability for Destiny Health to offer
premium services at a significantly discounted rate.
We will link up with additional networks tocreate cost-effective opportunities for fully-insured expansionLastly, where opportunities to link up with additional
competitive network affiliates create the ability to enter
new markets at a marginal cost, we will do so on a fully-
insured basis – in other words, in our own name.
In closing, we remain committed to the US market, and to
our strategy of providing innovative, consumer-directed
health care solutions that leverage off Discovery’s
significant scale, expertise and operational efficiency.
Our challenge going forward is to ensure a more nimble,
flexible operation that is better able to negotiate the
challenging and exciting dynamics of the world’s largest
health care market.
7558-discovery front 7-11 9/11/06 2:04 Page 43

D I S C O V E R Y A N N U A L R E P O R T 2 0 0 64 4
PRUHEALTH
Shaun Matisonn
Chief Executive Officer, PruHealth
Changing the UK’s private medical insurance market
In only its second full year of operation,
PruHealth has posted an exceptional
performance.
7558-discovery front 7-11 9/11/06 2:04 Page 44

20
04
20
06
20
05
0 20 40 60 7010 30 50
Membership(Thousand members)
NovDecJanFebMarAprMayJunJulAugSepOctNovDecJanFebMarAprMayJunJulAug
Figure 2: PruHealth’s rapid growth attests to the appeal of its
consumer-directed approach
D I S C O V E R Y A N N U A L R E P O R T 2 0 0 6 4 5
FINANCIAL HIGHLIGHTS
• New business R282 million (+706%)
• Members 58 912 (+696%)
• Operating loss £13 million (+0%)
• Operating loss R146 million (+1%)
100908070605040302010
0
Persistency – Actual vs expected(%)
Actual Expected
Individuals Groups
THIS YEAR’S PERFORMANCEIn only its second full year of operation, PruHealth has
posted an exceptional performance. The company’s rapid
growth in new business and membership – which both
increased more than six-fold – along with better than
expected rates of renewal, indicate that UK consumers are
embracing its unique and innovative consumer-directed
approach. As shown in figure 1, 100% of our existing
group clients renewed their policies. If the company’s new
business growth continues at projected rates, we expect the
company to achieve the 100 000 lives milestone by
January 2007 (see figure 2).
Operating losses remained stable and in line with budget.
Figure 1: Rates of renewal have exceeded our expectations
7558-discovery front 7-11 9/11/06 2:04 Page 45

D I S C O V E R Y A N N U A L R E P O R T 2 0 0 64 6
OUR STRATEGYMaking private medical insurance moreaffordable and attractive to UK consumersPrudential Health Limited, a 50/50 joint venture between
Discovery and the UK’s leading insurance company,
Prudential plc, was established two years ago after
Prudential had identified Discovery as an international
leader in consumer-directed private health care solutions.
Its launch came in response to the problems that have
characterised Britain’s private medical insurance industry in
recent years: stagnation, high costs and benefit reductions,
due to a number of factors, including an inability to attract
the young and healthy to the market. By contrast,
PruHealth is designed to make private health care more
affordable and more appealing to a broader audience by
focusing on rewarding members for leading a healthier
lifestyle. Members are able to reduce their premiums when
they renew their policies, or if their employer pays their
premiums, they earn cash back at the end of each year
based on their Vitality status. As in South Africa, members
earn Vitality points for regular exercise and participating in
preventive health screening tests. They also receive
discounts on rates with various health partners, including
leading gyms and health spas.
The strategy appears to be paying off, as demonstrated not
only by the company’s rapid new business growth and
lower lapse rates, but also by the fact that one third of
PruHealth’s individual members have never had private
medical insurance before.
THIS YEAR’S KEY FOCUS AREASProduct distribution was a key focus area this yearPruHealth, unlike many other start-ups, has some unique
advantages that have helped to catapult its growth:
• instant and quite exceptional brand credibility in the UK
through its relationship with the Prudential
• innovative product technologies new to the UK market,
yet based on concepts and principles that had been
pioneered, tried and tested by Discovery in South Africa
over more than a decade.
With these already strong foundations in place, we
identified distribution as an important strategic focus area to
help us expand PruHealth’s footprint and ensure its growth
is sustained.
1. Making the most of online sales tools
Unlike Discovery’s other businesses that have traditionally
relied mainly on a broker distribution model, PruHealth has
also adopted a direct-to-consumer sales approach. Online
and telephonic sales are supported by extensive advertising
and ongoing consumer-focused PR campaigns that
highlight trends in health, fitness and financial services and
demonstrates how PruHealth ties into these trends.
During the period under review, we have paid particular
attention to online sales, announcing our partnership with
Egg, the world’s largest online bank, in March. PruHealth’s
website has itself received accolades for its user-friendly
design and functionality, and improving it is a constant area
of focus for us. We believe this helps to increase our appeal
among younger consumers, who traditionally may not have
been attracted to private medical insurance (see figure 3).
2. More brokers are selling the PruHealth Plans
We have seen a steady climb in broker-generated sales and
an improvement in the overall number of brokers selling
our plans (see figure 4).
Traditionally, a relatively small group of specialist brokers
(who make up only 3% of the UK’s entire broker force)
have sold private medical insurance products in the UK
market. However, at PruHealth we have seen a large
volume of our quotes generated by an increasing number
of “generalist” brokers, who are involved in the marketing
of a broader range of financial services products,
supporting the PruHealth plans. This creates exciting
opportunities for PruHealth to capitalise on a distribution
channel currently not being utilised to advantage elsewhere
in the private medical insurance industry.
A key differentiator in our ability to attract brokers is our
service and we are pleased that we have received
recognition from brokers in this area (see figure 5).
PRUHEALTH (CONTINUED)
7558-discovery front 7-11 9/11/06 2:04 Page 46

D I S C O V E R Y A N N U A L R E P O R T 2 0 0 6 4 7
P R U H E A LT H I S D E S I G N E D T O M A K E P R I VAT E H E A LT H C A R E M O R E
A F F O R D A B L E A N D A P P E A L I N G B Y R E WA R D I N G M E M B E R S F O R
H E A LT H I E R L I F E S T Y L E S .
350
300
250
200
150
100
50
0
Applications completed(online applications)
27 13 27 10 24 08 22 05 19 03 17 31 14 02Mar Apr May Jun Jul Aug
14
12
10
8
6
4
2
0
Applications completed per completed quote(%)
27 13 27 10 24 08 22 05 19 03 17 31 14 02Mar Apr May Jun Jul Aug
Number of brokers with at least one PruHealth sale(Brokers)
20
04
20
06
20
05
0 100 200 30050 150 250
NovDecJanFebMarAprMayJunJulAugSepOctNovDecJanFebMarAprMayJun
Figure 4: More brokers are starting to sell the PruHealth plans
0
Broker recognition of service excellence(%)
Understands my business
Keeps me informed on client cases
Keeps promises
Takes ownership of issues
Easy to do business with
Excellent product
Gets things right first time
Quick and accurate
20 40 60 80
Slightly disagreeStrongly agree Net agreeStrongly agree
10 30 50 70 90
Figure 5: Most brokers agree that PruHealth’s service is excellent
Figure 3: Online sales have proven to provide a steady flow of new business
7558-discovery front 7-11 9/11/06 2:04 Page 47
D I S C O V E R Y A N N U A L R E P O R T 2 0 0 64 8
3. Positive word of mouth is helping our products
sell themselves
Finally, our research among our existing customer base
shows that the consumers themselves are an important
source of new business. In a recent survey, the majority of
PruHealth clients said they had recommended us to others
and over 35% said they recommended us to five or more
people. Overall, about 80% stated that they were ’very’ or
’highly’ likely to recommend PruHealth to their friends or
family in the future. We believe this level of advocacy
among consumers to be quite exceptional.
Product enhancements broaden appeal forboth sick and healthyAn important feature of the Discovery business model is its
regular innovation cycles aimed at ensuring products
remain relevant and appealing to consumers. It is a
philosophy we have carried across to PruHealth and in
June, we launched a range of products new to the UK
market. Importantly, these products align closely with
PruHealth’s overarching objective of broadening the market
by providing superior benefits at an affordable price.
1. Vitality Underwriting benefits more consumers
The introduction of Vitality Underwriting allows PruHealth
to target people with well-managed chronic lifestyle
diseases – a market usually excluded from cover because
of prohibitively high premiums. The more traditional form
of underwriting performed by other insurers automatically
loads the policy of potential members with a pre-existing
chronic condition, regardless of how well they are
managing their condition. Vitality Underwriting not only
assesses the applicant’s current health status, but evaluates
his or her lifestyle as well. This means that members with
a pre-existing condition such as high blood pressure, but
who manage their condition well through diet, exercise,
regular screening and not smoking, are not penalised.
Individuals that are currently healthy but are placing their
future health at risk through a sedentary lifestyle and poor
nutrition may on the other hand see their premiums
increase. However, the healthy lifestyle incentives offered
by Vitality do make it possible for these individuals to
improve their lifestyle and benefit from reduced premiums
at their policy renewal date.
Other lifestyle-related product enhancements include:
• The introduction of Vitality points for walking, using the
FitBug interactive pedometer, which measures the
number of steps members take every day
• Vitality points for completing the Personal Health
Review, a short questionnaire that allows members to
understand how their current lifestyle influences their
health risk. After completing the questionnaire, members
receive feedback on steps they can take to improve their
health status.
2. Extended cover for clients belonging to
employer groups
Private medical insurance in the UK is supplementary to the
health care access provided by the National Health System
(NHS) and typically provides cover for once-off, high-cost
medical conditions and events. With the introduction of the
Personal Health Fund, PruHealth has introduced cover for
lower cost, more routine expenses, including access to a
private GP, management of chronic conditions, pre-natal
scans and other maternity-related costs and cover for
routine health screens. The Personal Health Fund is only
available to members who have access to PruHealth
through their employer. Employers can opt to have a
portion of the cash earned back by employees at policy
renewal, which is based on their Vitality points, to be
deposited into their Personal Health Fund instead. These
funds can then be used to cover the cost of additional
private health care expenses like GP visits, blood tests and
pap smears. As benefits are directly related to the number
of Vitality points earned, members have yet more
incentives to lead a healthy lifestyle and reduce their overall
health care costs.
Encouraging wellness in partnership with theUK governmentDuring April, the UK government launched its campaign
“Small Change, Big Difference” aimed at encouraging
Britons to adopt a healthier lifestyle. As in the US, there is
growing concern about the health status of UK citizens
particularly in relation to high rates of obesity and
sedentary lifestyles. The campaign’s central message is that
even small changes in diet and physical activity levels can
have an impact on an individual’s risk of diseases such as
PRUHEALTH (CONTINUED)
7558-discovery front 7-11 9/11/06 2:04 Page 48

90
80
70
60
50
40
30
20
10
0
Historic PMI loss ratios(%)
PMI individual loss ratio PruHealth individual
1996 1997 1998 1999 2000 2001 2002
diabetes, heart disease and stroke. It aligns closely with our
own philosophy and PruHealth is the only financial services
company chosen by the UK’s Department of Health to help
it champion this important cause.
For PruHealth, it has created an important opportunity to
raise awareness of its Vitality programme and unique,
consumer-directed approach to health care funding.
Our healthy lifestyle focus has led to better-than-average loss ratiosThe healthier profile of PruHealth’s membership base is not
only impacting the company’s bottom line favourably in
terms of growth, but also in terms of its underwriting
performance. Our analysis shows that our loss ratios are far
better than the industry average – in other words, even
though our premiums are lower than those of our
competitors, we are still generating greater underwriting
profits through better claims experience.
Figure 6: PruHealth’s loss ratios are lower than the industry
has historically experienced
OUR PROSPECTS FOR THE COMING YEARWe are positive about the prospects for PruHealth in the
year ahead. We believe we will continue to see rapid
growth in the coming year. Based on our current growth
rates, we estimate that PruHealth will by the end of 2006
have achieved third place in terms of new business in the
UK market.
In addition to the continued growth that we anticipate, we see
a number of key future strategic opportunities. They include:
1. Focusing on the potential growth that can be achieved
through the broker distribution channel, and
particularly, the independent generalist brokers
mentioned above
2. Driving growth in the direct-to-consumer sales market
through a compelling online sales offering
3. Exploring opportunities for expanding our partnership
with the Prudential plc
4. Exploring opportunities that may arise out of current
government plans to include private sector insurers in
the administration of benefits within the National
Health System.
In addition, superior service and value-for-money remain
fundamental to PruHealth’s future success and we will
continue to focus on these critical factors in the year ahead.
D I S C O V E R Y A N N U A L R E P O R T 2 0 0 6 4 9
T H E H E A LT H I E R P R O F I L E O F P R U H E A LT H ’ S M E M B E R S H I P B A S E I S N O T
O N LY I M PA C T I N G T H E C O M PA N Y ’ S B O T T O M L I N E FAV O U R A B LY I N
T E R M S O F G R O W T H , B U T A L S O I N T E R M S O F I T S U N D E R W R I T I N G
P E R F O R M A N C E .
7558-discovery front 7-11 9/11/06 2:04 Page 49

D I S C O V E R Y A N N U A L R E P O R T 2 0 0 65 0
VALUE ADDEDNet income of Group 4 988 3 662
Investment income 318 159
Financing costs (21) (64)
Foreign exchange loss (7) (8)
Acquisition costs (845) (650)
Payments to suppliers of material and services (1 355) (1 183)
BEE expenses (161) –
2 917 1 916
VALUE ALLOCATEDTo employees
Salaries, wages and other benefits 1 141 39 853 45
To government 346 12 232 12
Normal taxation 217 138
Value-added tax 94 78
Capital gains tax 24 5
Other 11 11
To policyholders 506 17 5 0
Policyholder claims 974 577
Transfer from assets/liabilities arising from insurance contracts (468) (572)
To equity holders 160 –
Dividend distribution 160 6 – 0
Retention for expansion and growth 764 26 826 43
Retained income 509 557
Depreciation 90 113
Deferred taxation 165 156
2 917 100 1 916 100
2006 2006 2005 2005R million % R million %
VALUE-ADDED STATEMENTfor the year ended 30 June 2006
2006
Value allocated
To employeesTo governmentTo policyholdersRetention for expansion and growthTo equity holders
39%
12%
26%
17%
6%
2005
Value allocated
To employeesTo governmentTo policyholdersRetention for expansion and growth
45%
12%
43%
7558-discovery front 7-11 9/11/06 2:04 Page 50
D I S C O V E R Y A N N U A L R E P O R T 2 0 0 6 5 1
BUSINESS MODELThe figures in this report represent the consolidated embedded value of Discovery Holdings Limited and its subsidiaries
(“Discovery”). The embedded value is broken down by product category, as detailed below:
Health and VitalityThe Discovery Health Medical Scheme (“DHMS”) insures members for healthcare related expenses. Discovery provides
administration, managed care and risk management services to DHMS. Profits emerge from medical scheme
administration and managed care services provided by Discovery Health (Pty) Limited (“Discovery Health”). The same
services offered to DHMS are offered to other closed schemes through Discovery InHouse.
Vitality offers health and lifestyle benefits with selected partners to medical scheme members and Life policyholders.
Vitality’s function is foundational across Discovery, and it aims to create incentives for members and policyholders to
improve their health. The value proposition for members on Vitality was enhanced by the launch of the DiscoveryCard
during 2004 and its integration with both the Health and Life products.
KeyClub offers similar benefits to members on the KeyCare plans. Vitality and KeyClub membership is voluntary.
LifeDiscovery Life offers policyholders a range of insurance and financial solutions. The Life products reflect Discovery’s
underlying philosophy to make members healthier and to enhance and protect their lives. Unique benefits are also offered
that integrate with the benefits offered by Discovery Health and Vitality.
Discovery Life Plan – Individual LifeThe Discovery Life Plan provides protection against a comprehensive spectrum of risks. The plan includes:
• Life Cover Benefits;
• Disability Benefits;
• Severe Illness Benefits; and
• Income Continuation Benefits.
Health Plan ProtectorThe Health Plan Protector will fund contributions to the Discovery Health plans in the event of death, disability or severe
illness. It further rewards members for positive health management through the payback benefit. The Health Plan
Protector can be added to the Life Plan or can be bought on a stand-alone basis.
Discovery Retirement OptimiserThe Retirement Optimiser offers funding for retirement and offers benefits that could, together with the Life Plan,
capitalise unneeded risk cover to boost retirement funding. Policyholders have a choice of linked investment portfolios or
a portfolio that offers a guaranteed return in real terms.
Group LifeDiscovery Group Life offers a comprehensive spectrum of protection benefits on a group basis. Life Cover, Severe Illness,
Disability and Income Continuation Cover is offered.
Destiny HealthDestiny Health Inc. (“Destiny Health”) is a health insurer owned by Discovery Holdings and operating in the United
States of America. Destiny Health’s partnership agreement with Guardian Life Insurance Company of America is being
revisited, and the agreement with Tufts Health Plan in Massachusetts was recently terminated.
PruHealthPruHealth is a joint venture between Discovery and Prudential UK. PruHealth has been providing innovative private
medical insurance products to the UK market since October 2004.
GROUP CONSOLIDATED EMBEDDED VALUE STATEMENTfor the year ended 30 June 2006
D I S C O V E R Y A N N U A L R E P O R T 2 0 0 65 2
EMBEDDED VALUE CALCULATIONAn embedded value can be defined as:
• the excess assets over liabilities at the valuation date (ie net asset value); and
• the value of in-force business at the valuation date (less an allowance for the cost of capital and secondary tax on
companies (STC)).
Each of these elements is discussed in more detail below:
1. Net asset valuePreviously, Life calculated the embedded value on the Financial Soundness Valuation Method (“FSV”), and the net
asset value was the audited value of the assets of Discovery in excess of its liabilities (including assets under
insurance contracts determined using the FSV method).
A change in actuarial guidance note (PGN107) effective for financial year-ends on or after 31 December 2005 now
requires long-term insurers to base the embedded value on the Statutory Valuation Method (“SVM”). The key
difference between the two bases for Life is that the value capitalised in the assets under insurance contracts on the
FSV basis may not be reflected as an insurance asset under the SVM. The net asset value shown on the published
balance sheet has been adjusted to reflect the elimination of the assets under insurance contracts as per the Life
statutory accounts. The value of the assets under insurance contracts on the FSV basis is released in the value of in-
force of the Statutory Valuation Method over time. The capital maintained for Life throughout the projection term
is based on the statutory capital as defined by the SVM.
2. Value of in-force business less an allowance for the cost of capital and the cost of STCThe value of in-force business is calculated as the value of the projected future after-tax profits of the business of
Discovery Holdings in-force at the valuation date, discounted at the risk discount rate, less an allowance for the cost of
capital and the cost of STC. These projections have been performed using best estimate assumptions of future experience.
The value of in-force and the value of new business at 30 June 2006 are shown on both the SVM and the FSV bases
to allow comparison to prior periods.
The value of in-force is calculated by making assumptions about the major influences on the profits of Discovery in
the future. For the Health, Vitality and Destiny Health products, the future after-tax profit of in-force business
represents the value of future profit elements, while the future after-tax profit for the Life product is the release of
valuation margins on individual business and the value of future profit elements on group business. The Life value
of in-force includes expected future automatic premium increases. For PruHealth, no value has been placed on the
current in-force business.
The business of writing life and health insurance requires Discovery Life Limited and Destiny Health to maintain
solvency capital. The cost of capital in respect of the in-force business is calculated to equal the amount of solvency
capital at the valuation date, less the discounted value, using the risk discount rate, of the expected annual release
of this capital over the projection term, allowing for the return after tax and investment management charges on
the expected level of solvency capital.
In line with Discovery’s current dividend policy, the cost of STC is calculated assuming a 4.5 times dividend cover
on the after-tax profits as they emerge over the projection term. The after-tax profits will differ depending on
whether the SVM or FSV basis is used. The total STC charge has been allocated between the different business
entities based on their contribution to the total value of in-force. Previously, Discovery’s policy was not to declare
dividends and therefore no allowance was made in the embedded value calculation for STC.
GROUP CONSOLIDATED EMBEDDED VALUE STATEMENT (continued)
for the year ended 30 June 2006

D I S C O V E R Y A N N U A L R E P O R T 2 0 0 6 5 3
EMBEDDED VALUE STATEMENTConsolidated embedded valueThe consolidated embedded value statement is shown in Table 1 below.
TABLE 1 – Group embedded valueat 30 June
2006 2006 2005 %R million SVM basis FSV basis change
Shareholders’ funds 4 212 4 212 3 2901 28
Minority interest – – (67)
Elimination of assets under insurance contracts (2 088) – –
Shareholders’ funds excluding assets under
insurance contracts and minority interest 2 124 4 212 3 223
Value of in-force business before cost of capital 8 774 7 141 6 483
Cost of capital (60) (492) (533)
Cost of STC2 (251) (222) –
Discovery Holdings embedded value 10 587 10 639 9 173 15
Number of shares (millions) 533.4 533.4 528.2
Embedded value per share R19.85 R19.95 R17.37 14
Diluted number of shares (millions) 553.2 553.2 553.2
Diluted embedded value per share3 R19.47 R19.57 R16.93 15
1 The shareholders’ funds balance has been adjusted following the adoption of IFRS.2 Prior to 2006, Discovery’s policy was not to declare dividends and therefore no allowance was made in the embedded value calculation for STC. The cost
of STC at 30 June 2005 would have been R171 million on the same basis.3 The diluted embedded value per share is calculated by increasing the embedded value by the value of the loan to the Discovery Holdings share trust, and
by increasing the number of shares by the number of shares issued to the share incentive trust which have not been delivered to participants. Noallowance has been made for Discovery’s BEE transaction as the impact would be anti-dilutive due to the transaction price exceeding the currentembedded value per share.
Shareholders’ required returnThe shareholders’ required return, or risk discount rate, is used to calculate the discounted value of future profits.
At 30 June 2006, the following discount rates were used:
Health and Vitality – 12.00% per annum
Life – 12.00% per annum
Destiny Health – 10.00% per annum

D I S C O V E R Y A N N U A L R E P O R T 2 0 0 65 4
GROUP CONSOLIDATED EMBEDDED VALUE STATEMENT (continued)
for the year ended 30 June 2006
Value of in-force businessThe value of in-force business is shown in Table 2 below:
TABLE 2 – Value of in-force businessValue before Value after
cost of cost of capital Cost of Cost of capital
R million and STC capital STC and STC
at 30 June 2006 – SVM basis
Health and Vitality 4 258 – (122) 4 136
Life1 4 496 (45) (129) 4 322
Destiny Health2 20 (15) (0) 5
Total 8 774 (60) (251) 8 463
at 30 June 2006 – FSV basis
Health and Vitality 4 258 – (133) 4 125
Life1 2 863 (477) (89) 2 297
Destiny Health2 20 (15) (0) 5
Total 7 141 (492) (222) 6 427
at 30 June 2005
Health and Vitality 3 844 – – 3 844
Life1 2 349 (517) – 1 832
Destiny Health 290 (16) – 274
Total 6 483 (533) – 5 950
1 On the SVM basis, the Life cost of capital is based on a capital adequacy requirement at June 2006 of R95 million. On the FSV basis, the Life cost ofcapital is based on a capital adequacy requirement at June 2006 of R2 240 million (June 2005: R1 507 million on the FSV basis).
2 The reduction in the value of Destiny Health follows a review of the long-term assumptions for the existing business taking account of the performanceexperienced over the past year and changes to the alliance with Tufts Health Plan. The values for Destiny Health reflect Discovery’s 98.05% shareholdingin Destiny Health at 30 June 2006.

D I S C O V E R Y A N N U A L R E P O R T 2 0 0 6 5 5
EMBEDDED VALUE EARNINGSThe change in embedded value from one year to the next represents the embedded value earnings for Discovery, adjusted
for changes to the shareholders’ funds.
TABLE 3 – Embedded value earningsfor the year ended 30 June
R million 2006 2005
Embedded value at end of period 10 587 9 173
Less: Embedded value at beginning of period (9 173) (6 832)
Increase in embedded value 1 414 2 341
Net issue of capital (12) (60)
Dividends paid to Destiny preference shareholders 1 1
Realised loss on minority share buy-back 1 –
Transfer to hedging reserve (1) (9)
Embedded value earnings 1 403 2 273
Return on embedded value 15.3% 33.3%
Components of embedded value earningsThe components of the embedded value earnings are explained below.
TABLE 4 – Components of embedded value earningsfor the year ended 30 June
%R million 2006 2005 change
Total profit from new business (at point of sale) 572 783 (27)
Profit from existing business
• Expected return 756 602
• Change in methodology and assumptions (540) 307
• Experience variances 262 363
PruHealth start-up costs (128) (120)
Adjustment for minority interest in Destiny Health 10 4
Adjustment for Guardian profit share in Destiny Health1 1 (28)
Foreign exchange rate movements (4) 43
Interest on loan capital – (50)
IFRS adjustment – (8)
Return on shareholders’ funds 474 377
Embedded value earnings 1 403 2 273
1 In terms of the agreement between Destiny Health and the Guardian Life Insurance Company of America, Guardian shares in 50% of the profits frombusiness written by Destiny Health prior to the agreement with Guardian (ie non-alliance business) once the business written by Guardian reaches thecontractual new member threshold. This threshold has now been reached.

D I S C O V E R Y A N N U A L R E P O R T 2 0 0 65 6
GROUP CONSOLIDATED EMBEDDED VALUE STATEMENT (continued)
for the year ended 30 June 2006
Profit from new businessThe value of one year of new business is determined at the point of sale as the projected future after-tax profits of the businesssold during the year, less an allowance for cost of capital and the cost of STC and discounted at the risk discount rate.
In calculating the value of new business, Health and Destiny Health new business is defined as individuals and membersof new employer groups joining Discovery, irrespective of the size of the employer, and includes additions to first yearbusiness. Vitality new business includes all new members joining Vitality over the period. For Life, new business is definedas policies which incepted during the reporting period and which are on risk at the valuation date. Retirement Optimisersadded to existing risk plans are included in the value of new business.
TABLE 5 – Embedded value of new businessfor the year ended 30 June
2006 2006 2005 %R million SVM basis FSV basis change
Health and Vitality
Gross profit from new business at point of sale 115 115 229
Cost of capital – – –
Cost of STC (3) (3) –
Net profit from new business at point of sale 112 112 229 (51)
New business annualised premium income1 1 121 1 121 1 734 (35)
Life
Gross profit from new business at point of sale 532 679 676
Cost of capital (7) (129) (157)
Cost of STC (15) (21) –
Net profit from new business at point of sale 510 529 519 (2)
New business annualised premium income2 592 592 470 26
Annualised profit margin3 10.8% 11.3% 13.5%
Destiny Health
Gross profit from new business at point of sale (50) (50) 36
Cost of capital4 (0) (0) (1)
Cost of STC 0 0 –
Net profit from new business at point of sale5 (50) (50) 35
New business annualised premium income1 457 457 603 (24)
New business annualised premium income (US$ million) 71 71 97 (27)
1 The new business annualised premium income shown above has been adjusted to exclude premiums in respect of members who join an existing employerafter the first year, as well as premiums in respect of new business written during the period but only activated after 30 June 2006.
The total Health and Vitality new business annualised premium income written over the period was R2 612 million (June 2005: R2 869 million). The reduction in the new business margin for Health and Vitality is due to an increase in the sale of lower margin business.
For Destiny Health, the total new business annualised premium income written over the period was R796 million (June 2005: R809 million).2 The new business annualised premium income of R592 million shown above is net of automatic premium increases and servicing increases in respect
of existing business. The total Life new business annualised premium income written over the period, including both automatic premium increases of R103 million and servicing increases of R94 million was R789 million. Single premium business is included at 10% of the value of the single premium.R24 million of single premium business was written over the period.
Discovery Retirement Optimisers added to existing Life Plans have been included in the value of new business.3 The annualised profit margin is the value of new business expressed as a percentage of the present value of future premiums.4 As most of the new business is written on the Guardian and Tufts insurance licences, Destiny Health is not required to hold statutory capital for this
business. An explicit charge for the use of their capital is payable to Guardian and Tufts, and this cost is deducted from gross profit in the new businesscalculation.
5 The Destiny Health value of new business allows for the actual new business expenses incurred over the past year. Actual new business expenses includeinfrastructure development costs related to developing new business capacity. This value includes acquisition costs in respect of Tufts new businesswritten over the past year which is expected to run-off over the next 18 months.

D I S C O V E R Y A N N U A L R E P O R T 2 0 0 6 5 7
Expected returnThe risk discount rate is the return investors would have expected to earn on the previous year’s value of in-force
business. The expected return is based on the FSV method, and is reflected as the expected return of R756 million.
Change in methodology and assumptionsThe assumptions used in the embedded value are changed using an active basis to realistically reflect changes in
Discovery’s operating conditions. The change in methodology and assumptions item will vary over time to reflect
adjustments to the model and assumptions as a result of changes to the operating and economic environment. The
current period’s changes are described in detail below (for previous periods refer to previous embedded value
statements). The methodology and assumption changes are based on the FSV method. The modelling change, moving
from the FSV method to the SVM, is included as the last step in the change in methodology and assumptions.
TABLE 6 – Methodology and assumption changesfor the year ended 30 June 2006
Health and Vitality Destiny Health LifeValue of Value of Value of
R million Net worth in-force Net worth in-force Net worth in-force Total
Lapses – 68 – (32) (62) (94) (120)
Economic assumptions – (45) – – (18) (90) (153)
Premium increases – – – 23 101 8 132
Administration fees1 – (443) – – – – (443)
Benefit enhancements2 – – – – (33) (30) (63)
Expenses3 – 462 – (78) 4 7 395
Cash-settled share-based
payments4 – (67) – – – (11) (78)
Vitality benefits5 – 79 – – – – 79
Mortality and morbidity – – – (160) – – (160)
Tax6 – – – – – (20) (20)
Cost of STC7 – (119) – – – (114) (233)
Modelling changes8 – – – 20 (1 527) 1 634 127
Other – – – (3) 0 0 (3)
Total – (65) – (230) (1 535) 1 290 (540)
1 The Health administration fee change relates to a reduction in Discovery Health Medical Scheme administration fees from 1 July 2006.2 The Life benefit enhancements relate primarily to enhancements on the Integrator product.3 The Health and Vitality renewal expense assumption change is based on the results of the most recent expense analysis and allows for the expense
efficiencies achieved by management over the past six months.4 This assumption reflects the capitalised cost of cash-settled share-based payments made over the past year, and assumes a similar cost in each future year
for the full projection term.5 The Health and Vitality assumption change includes an allowance for a reduction in the expected benefit cost on Vitality in line with recent experience.6 The tax variance reflects the movement in the value of the tax deferral related to the deferred tax liability under the FSV method.7 Following the change to Discovery’s dividend policy, the cost of STC is now modelled assuming a 4.5 times dividend cover.8 The Life modelling change includes a R1 536 million decrease in the net worth and a R1 470 million increase in the value of in-force in respect of the
change from the Financial Soundness Valuation basis to the Statutory Valuation Method used to calculate the embedded value. The R1 470 millionincrease in the value of in-force includes a reduction of R311 million in the cost of capital.
The value of in-force includes a further reduction of R200 million in the cost of capital due to changes in the future projection of the Statutory CAR.

D I S C O V E R Y A N N U A L R E P O R T 2 0 0 65 8
GROUP CONSOLIDATED EMBEDDED VALUE STATEMENT (continued)
for the year ended 30 June 2006
Experience variancesThe embedded value is based on a series of assumptions about the future. To the extent that actual experience differs
from these assumptions, then the actual profits will differ from those expected. The experience variance items
approximately quantify this difference.
The following table gives a breakdown of the main experience variances for the year ended 30 June 2006. The experience
variances are shown on the FSV methodology:
TABLE 7 – Experience variancesfor the year ended 30 June 2006
Health and Vitality Destiny Health LifeValue of Value of Value of
R million Net worth in-force Net worth in-force Net worth in-force Total
Renewal expenses 37 – (49) – 6 – (6)
Other expenses1 – – (2) – (25) – (27)
Inflation2 (6) (67) – – 32 18 (23)
Extended modelling term3 – 212 – 23 – 6 241
Lapses4 21 177 (0) (118) (40) (16) 24
Policy alterations5 – 6 – – 24 29 59
Mortality and morbidity – – (122) – 60 21 (41)
Deferred profits released – – – – 31 (31) –
Commission6 – – – – (12) – (12)
Vitality premium and benefits 25 – – – – – 25
Other 13 1 2 16 (8) (2) 22
Total 90 329 (171) (79) 68 25 262
1 For Life, the non-recurring expenses relate to costs incurred as a result of the venture with Prudential in the UK.2 The negative variance for Health and Vitality is due to a lower increase in the Health administration fees in 2006 compared with that assumed in
June 2005.
The Life variance is primarily due to automatic premium increases being higher than expected.3 The projection term for Health, Vitality, Destiny Health and Group Life at 30 June 2006 has not been changed from that used at 30 June 2005. Thus, an
experience variance arises because the total term of the in-force business is effectively increased by twelve months.4 Included in the Health and Vitality lapse experience variance is an amount of R392 million in respect of members joining existing employer groups during
the period, offset by an amount of R244 million in respect of members leaving existing employer groups. A positive variance of R59 million is due tolower than expected lapses.
5 The Life policy alterations relate to benefit alterations to risk benefits. The impact of existing policies adding the Discovery Retirement Optimiser isincluded in the value of new business.
6 The commission variance includes a provision for bad debts on commission clawbacks and includes commissions paid in respect of business inceptingafter the valuation date.
Return on shareholders’ fundsThe return on shareholders’ funds of R474 million represents the investment return earned on shareholder assets and
includes the return earned on assets under insurance contracts, under the FSV method, after tax and investment
management charges.

D I S C O V E R Y A N N U A L R E P O R T 2 0 0 6 5 9
EMBEDDED VALUE ASSUMPTIONSThe principal assumptions used in the calculation of the value of in-force business and the value of new business are set
out below. These assumptions represent a best estimate view of the future:
General• It is assumed that the South African capital adequacy requirements in future years will be backed by surplus assets
consisting of 70% equities and 30% fixed interest securities for the purposes of calculating the cost of capital at risk.
Allowance has been made for tax and investment expenses in the calculation of the cost of capital.
• The risk-free interest rate is calculated with reference to the risk-free yield curve. A single risk-free rate is then derived
appropriate to the weighted duration of the cash flows and rounded to the nearest quarter of a percent. The risk-free rate
at 30 June 2006 was set at 9% p.a. The risk discount rate is then set by adding a margin to the risk-free interest rate.
• In line with Discovery’s current dividend policy, the cost of STC is calculated assuming a 4.5 times dividend cover on
the after-tax profits as they emerge over the projection term.
Health and Vitality• The embedded value term has been set at ten years for Health and Vitality.
• The Health administration and managed care fees are assumed to increase at the expense inflation rate for the full
projection term.
• Lapse assumptions are based on the results of recent experience investigations. Negative turnover on employer groups
is not modelled as lapses.
• Renewal expense assumptions have been based on the results of the latest expense and budget information.
Life• Mortality, morbidity and lapse assumptions were derived from internal experience, where available, augmented by
reinsurance and industry information.
• The embedded value projection term for group business has been set at ten years.
• Renewal expense assumptions have been based on the results of the latest expense and budget information.
Destiny Health• The embedded value projection term has been set at ten years.
• Based on the projected utilisation of Destiny Health’s assessed tax loss to date, it is assumed that no income tax will be
payable over the projection term.
• The morbidity and lapse assumptions are based on the results of recent experience investigations as well as
management’s expectations of the likely impact of future premium increases on experience.
• The renewal expense assumption was based on the results of the latest expense investigation.
• The value of in-force business for Destiny Health was converted into Rands using the year-end exchange rate of
R7.1325 per US$.

D I S C O V E R Y A N N U A L R E P O R T 2 0 0 66 0
GROUP CONSOLIDATED EMBEDDED VALUE STATEMENT (continued)
for the year ended 30 June 2006
TABLE 8 – Embedded value assumptionsfor the year ended 30 June
2006 2005
Risk discount rate (%)
– Health and Vitality 12.00 11.00
– Life 12.00 11.00
– Destiny Health 10.00 10.00
Medical inflation (%)
South Africa 8.00 7.00
United States Current levels Current levels
reducing to reducing to
13.00% over the 12.50% over the
projection period projection period
Expense inflation (%)
South Africa 5.00 4.00
United States 3.00 3.00
Pre-tax investment return (%)
South Africa – Cash 7.50 6.50
– Bonds 9.00 8.00
– Equity 11.00 10.00
United States – Bonds 3.00 3.00
Dividend cover ratio 4.5 times –
Income tax rate (%)
– South Africa 29.00 29.00
– United States Federal Tax Rate1 34.00 34.00
1 Various additional State taxes also apply.

D I S C O V E R Y A N N U A L R E P O R T 2 0 0 6 6 1
SENSITIVITY TO THE EMBEDDED VALUE ASSUMPTIONSIn order to illustrate the effect of using different assumptions, the sensitivity of the embedded value at 30 June 2006 to
changes in the key assumptions is shown below. For each sensitivity illustrated, all other assumptions have been left
unchanged. No allowance has been made for management action such as risk premium increases where future experience
is worse than the base assumptions.
TABLE 9 – Embedded value sensitivitiesat 30 June 2006
Shareholders’ funds
excluding assets Health and Vitality Destiny Health Life
under insurance Value Cost Cost Value Cost Cost Value Cost Cost
contracts and of of of of of of of of of Embedded %
R million minority interest in-force capital STC in-force capital STC in-force capital STC value change
Base 2 124 4 258 – (122) 20 (15) (0) 4 496 (45) (129) 10 587
Impact of:
Risk discount
rate + 1% 2 124 4 107 – (116) 18 (16) (0) 4 201 (52) (119) 10 147 (4)
Risk discount
rate – 1% 2 124 4 419 – (129) 23 (13) (1) 4 841 (35) (142) 11 087 5
Lapses + 10% 2 124 4 175 – (120) 17 (14) (0) 4 258 (40) (122) 10 278 (3)
Investment
return – 1%1 2 124 4 258 – (121) 17 (17) (0) 4 310 (55) (123) 10 393 (2)
Renewal
expenses + 10% 2 124 3 755 – (108) (50) (15) 1 4 452 (45) (128) 9 986 (6)
Mortality and
Morbidity + 10% 2 124 4 258 – (122) (234) (15) 6 3 934 (45) (113) 9 793 (7)
Health, Vitality and
Destiny Health:
projection term + 1 year 2 124 4 469 – (128) 31 (16) (1) 4 496 (45) (129) 10 801 2
1 For Life, both investment return and inflation assumptions were reduced by 1%.

D I S C O V E R Y A N N U A L R E P O R T 2 0 0 66 2
GROUP CONSOLIDATED EMBEDDED VALUE STATEMENT (continued)
for the year ended 30 June 2006
The following table shows the effect of using different assumptions on the value of new business.
TABLE 10 – Value of new business sensitivitiesat 30 June 2006
Health and Vitality Destiny Health Life
Value Cost Cost Value Cost Cost Value Cost Cost Value
of of of of of of of of of of new %
R million in-force capital STC in-force capital STC in-force capital STC business change
Base 115 – (3) (50) (0) 0 532 (7) (15) 572
Impact of:
Risk discount rate + 1% 104 – (3) (51) (0) 1 452 (8) (14) 481 (16)
Risk discount rate – 1% 126 – (4) (49) (0) 1 627 (6) (16) 679 19
Lapses + 10% 108 – (3) (51) (0) 1 469 (6) (14) 504 (12)
Investment return – 1%1 115 – (3) (50) (0) 1 480 (9) (14) 520 (9)
Renewal expenses + 10% 75 – (2) (71) (0) 2 520 (7) (15) 502 (12)
Mortality and Morbidity + 10% 115 – (3) (105) (0) 3 399 (7) (13) 389 (32)
Health, Vitality and Destiny Health:
Projection term + 1 year 128 – (4) (48) (0) 1 532 (7) (15) 587 3
Acquisition expenses + 10% 95 – (3) (59) (0) 0 497 (7) (15) 508 (11)
1 For Life, both investment return and inflation assumptions were reduced by 1%.
D I S C O V E R Y A N N U A L R E P O R T 2 0 0 6 6 3
6 September 2006
The DirectorsDiscovery Holdings Limited155 West StreetSandton 2146
Dear Sirs and Mesdames
EMBEDDED VALUE OF DISCOVERY HOLDINGS LIMITEDI have reviewed the consolidated embedded value of Discovery Holdings Limited (“Discovery”) for the year ended30 June 2006, as set out on pages 51 to 62 of these accounts.
My responsibilities in relation to the embedded value included a review of the following areas:
• The methodology and assumptions underlying the embedded value calculations;
• Material amendments to the existing valuation models since our review at the previous year-end;
• New valuation models developed for new products issued and amendments to existing models to allow for productenhancements during the period under review;
• The analysis of the change in embedded value over the period; and
• The analysis of the actual embedded value earnings versus those expected over the period.
In my opinion the embedded value results in aggregate and in all material respects for each of Discovery Health, Vitality,Destiny Health and Discovery Life are reasonable and have been calculated in accordance with the requirements ofPGN107: Embedded Values and Value of New Business. PGN107 represents best practice guidance issued by the ActuarialSociety of South Africa, and relates to long-term insurance business. In those cases where business other than long-terminsurance business has been included in the value of in-force for embedded value purposes, similar principles to thosecontained in PGN107 have been used to value such business.
For Destiny Health, recent experience has been volatile, and a range of future experience assumptions are accordinglypossible. The assumptions employed reflect recent experience and managements’ expectations of future experience.Although actual future experience will most likely differ from the assumptions chosen, we are satisfied that theassumptions used in the calculation of the value of in-force business and the value of new business fall within anacceptable range.
The Prudential Health (“PruHealth”) business has not yet matured to a level allowing a stable measure of the value ofin-force business, and accordingly no value of in-force for this business has been included in the consolidated embeddedvalue. The embedded value contribution of PruHealth was thus based on Discovery’s share of the net asset value of thePruHealth venture as at 30 June 2006.
In performing our work, we have relied on information supplied to us by, or on behalf of, Discovery for periods up to30 June 2006. The information included detail of shareholders’ net assets as at 30 June 2006, policy data and otherstatistical data relating to current and recent operating experience. We have reviewed this information for reasonablenessbased on our knowledge of the industry but we have not carried out independent checks thereon.
Yours faithfully
Mark Claassen FIA, FASSADirector of PricewaterhouseCoopers’ Actuarial and Insurance Management Solutions
SP Kana National Assurance Leader
Resident Director MS Claassen
The Company’s principal place of business is at 2 Eglin Road, Sunninghill where a list of the directors’ names is available for inspection.
PricewaterhouseCoopersAssurance Services (Pty) LtdReg. no. 1996/017738/07No 1 Waterhouse PlaceCentury City 7441PO Box 2799Cape Town 8000Telephone +27 (21) 529 2000Facsimile +27 (21) 529 3300www.pwc.com/za

D I S C O V E R Y A N N U A L R E P O R T 2 0 0 66 4
DIRECTORATE, SECRETARY AND CORPORATE GOVERNANCE COMMITTEES
DISCOVERY HOLDINGS DIRECTORATEDr BA BrinkJP BurgerLL Dippenaar (Chairman)Dr NJ DlaminiSB Epstein (USA)A Gore*MI HilkowitzNS Koopowitz*Dr TV Maphai**HP Mayers*JM Robertson*S Sebotsa**B Swartzberg*SD Whyte*SV Zilwa
* Executive
** Appointed 8 December 2005
BOARD OF DIRECTORSDr BA Brink (54)BSc (Med), MBBCh, DA (SA)Non-executive director
Dr Brian Brink has been employed by Anglo AmericanSouth Africa for more than 20 years and in his currentcapacity as Senior Vice President: Health, he advisesAnglo Group companies on a broad range of health-related issues. Dr Brink also spends much of his timeadvising businesses on how to respond effectively to HIVand AIDS; he is currently the alternate board memberrepresenting the private sector on the board of the GlobalFund to fight AIDS, TB and malaria.
Johan Burger (47)BCom (Hons), CA (SA)Non-executive director
Johan Burger is the chief financial officer of FirstRandLimited and financial director of FirstRand Bank Holdings.
Laurie Dippenaar (57)MCom, CA (SA)Chairman
Laurie Dippenaar was the chief executive officer ofFirstRand Limited, until his retirement in January 2006.Prior to the creation of FirstRand in 1998, he was executivechairman of Momentum Life Assurers and played anintegral part in the history of Rand Merchant Bank.
Dr Judy Dlamini (47)MBChB, Diploma in Occupational Health, MBANon-executive director
Judy founded Mbekani Health & Wellbeing (Pty) Ltd, and is also the executive chairperson. Judy was previously
employed as a senior manager at HSBC InvestmentServices (Africa) (Pty) Ltd in corporate finance, and priorto this, practiced as a family practitioner for many years.She also sits on the boards of Northam Platinum Ltd,Aspen Pharmacare Ltd and Gijima Ast Group Ltd.
Steven Epstein (63) (USA)
JD, Columbia University Law School, BA, Tufts UniversityNon-executive director
Steven is the founder and senior partner of Epstein Becker& Green, one of the largest US-based health law firmsthat support clients in health practice on issues that rangefrom health policy to strategic partnering to complexcompliance issues. He sits on the board of Destiny and anumber of health care companies and venture capitalfirms. For over 30 years, he has played a unique role inestablishing the concept that health care organisationsneed a dedicated form of legal representation.
Adrian Gore (42)BSc (Hons), FFA, ASA, MAAA, FASSA
Adrian started Discovery Health in 1992 after conceivingthe idea of a specialist risk management company that offered clients innovation, flexibility, value andexcellent service. He was chosen as the Ernst & YoungEntrepreneur of the Year in 1998. He currently serves onthe boards of Discovery Holdings, PruHealth (UK) andDestiny Health (USA), as well as the Ethics Institute ofSouth Africa.
Monty Hilkowitz (66)
FIA Non-executive director
Monty worked for Southern Life Association and Swiss Reprior to joining Liberty Life in 1971. Monty wasappointed managing director in 1978. He was appointedas chief executive officer of Westpac Life in Australia in1986. He has been self-employed since 1989 andinvolved in investment management, financial servicesand insurance interests in several countries. He iscurrently a director of The Dublin Network and Acuvest,specialist financial services companies in Ireland. He alsoserves as chairman of Pioneer International.
Neville Koopowitz (42)BCom, CFP
Neville joined Discovery as marketing director in 1996and has played a key role in defining and building theDiscovery identity. A particular area of focus of his hasbeen the development of Vitality and recently theDiscoveryCard. He also played an important role in thedevelopment of Discovery’s sales and distributionenvironments. He is currently the chief executive officer
D I S C O V E R Y A N N U A L R E P O R T 2 0 0 6 6 5
of Discovery Health. He serves on the board of the Sports
Science Institute of South Africa and the Board of
Trustees of the Laureus Sport for Good Foundation’s
South African chapter.
Dr Vincent Maphai (54)
BA, BA (Hons), M Phil, D Phil, Advanced Management
Program (Harvard)
Non-executive director
Dr Maphai is the chairperson of BHP Billiton SA, and he
was formerly the corporate affairs director of SAB and non-
executive chair of Castle Brewing Namibia. In an academic
career spanning two decades, he taught at various
universities both locally and abroad and consulted with
several blue-chip companies on a range of HR issues. He
was also a research executive director of social dynamics at
the HSRC for three years. He has served on the boards of
various companies as non-executive chair, and he has
chaired the SABC, the Presidential Review Commission into
the restructuring of the public sector, and the South
African Responsible Gambling Trust. Dr Maphai is also the
chairperson of the Discovery Foundation.
Herschel Mayers (46)
BSc (Hons), FIA, FASSA
Herschel joined Discovery in 2000 to set up and launch its
life insurance arm, Discovery Life. Prior to that he spent
twenty years in senior positions at Liberty Life heading up
administration, underwriting, systems, technology, product
development and finance for group and individual life
business. He was also a director of Millenium, Guardbank,
Oracle and Liberty Health Care.
Herschel was appointed CEO of Discovery Life in 2006.
He also serves on the board of Discovery Holdings,
Vitality and the Life Offices Association of S.A.
John Robertson (58)
BCom, CTA, CA (SA), HDipTax
John joined Discovery Health in April 1993 and was
responsible for information technology strategy, systems
development, information technology networks and
finance. He is currently responsible for all aspects of
information technology, e-commerce and all internal
corporate operations at Discovery. He is also responsible
for the strategic development of technology and
information systems for Destiny Health Inc. and for the
South African operations of the PruHealth joint venture.
Sonja Sebotsa (34)LLB (Hons), MANon-executive director
Sonja has been an executive director at WDB InvestmentHoldings since 2002 playing an important role in thedesign and execution of transactions and themanagement of ongoing investment relationships. Shewas previously a vice president in the investment bankingdivision of Deutsche Bank, where she gained more thanfive years’ experience in advisory work on Mergers &Acquisitions and Corporate Finance. She has specificexperience in advising government on the sale of assetsand potential investors on purchasing or disposing ofequity stakes in companies.
Barry Swartzberg (41)BSc, FFA, ASA, FASSA, CFP
Barry, a qualified actuary, joined Discovery Health at itsinception in 1992. As one of the company’s pioneers, hewas instrumental in setting up the company’s marketingdivision, as well as driving the evolution of DiscoveryHealth’s risk management and operational areas. He iscurrently the group executive director of DiscoveryHealth and serves on the boards of Discovery Holdings,Destiny Health, and Healthbridge.
Stewart Whyte (44)
Stewart started his career with Liberty Life. He worked in
various departments of the life insurance division and set up
the Medical Lifestyle division in 1991. In September 1992,
he joined Discovery Health as one of its founding members.
Stewart was responsible for implementing all operational
areas of the company. He has since relocated to the USA
where he is a board member and the chief operating
officer of Destiny Health.
Sindi Zilwa (39)
BCompt (Hons), CTA, CA (SA), Advanced Taxation Certificate,
Certified Financial Planner, Advanced Diploma in Financial
Planning
Non-executive director
Sindi is the chief executive officer of Nkonki, a chartered
accountancy firm. She was the second black women to
qualify as a CA in 1998. She was awarded the Business
Women of the Year title by the Executive Women’s Club. She
is a member of SAICA’s Education Committee, and serves on
the boards of Woolworths, Primedia and Strate Limited.

D I S C O V E R Y A N N U A L R E P O R T 2 0 0 66 6
DIRECTORATE, SECRETARY AND CORPORATE GOVERNANCE COMMITTEES (continued)
EXECUTIVE COMMITTEEA Gore
J Broomberg
MBBCh (Rand), MA (Oxon), MSc (Lond), PhD (Lond)
R Farber
BCom (Hons), CA (SA), ACMA
HD Kallner
BEconSc, FFA, FASSA
NS Koopowitz
K Kropman
MBBCh (Wits), MBA (UCT)
S Matisonn
HP Mayers
K Mayet
BA (Hons), LLB, LLM
A Pollard
BSc (Hons), FIA, FASSA
K Rabson
BSc Actuarial, FIA, FASSA
JM Robertson
B Swartzberg
P Tlhabi
MBChB (Medunsa), MAP (Wits), AHLF (Pompeu Fabra)
J van Rooyen
BA, LLB, HDip Co Law (Wits)
COMPANY SECRETARYMJ Botha
BCompt
ACTUARIAL COMMITTEE AB Rayner (Chairman)
BSc (Hons), ARCS, FIA, FASSA
RD Williams (Statutory Actuary)
BBusSc, FIA
HP Mayers
S Matisonn
BSc, FSA, FASSA, ASA
B Swartzberg
T Nzimande
CA (SA), Diploma in Company Law
JP Burger (by invitation)
SV Zilwa (by invitation)
AUDIT AND RISK COMMITTEEJP Burger (Chairman)
AH Arnott
BCom, CA (SA)
S Sebotsa
SV Zilwa
REMUNERATION COMMITTEELL Dippenaar (Chairman)
NJ Dlamini
T Slabbert
BA, MBA, TEFL Preparation Certification
M Olivier (independent HR expert)
TRANSFORMATION COMMITTEENJ Dlamini (Chairperson)
T Slabbert
SV Zilwa

D I S C O V E R Y A N N U A L R E P O R T 2 0 0 6 6 7
INTRODUCTIONThe directors of Discovery Holdings Limited and its subsidiaries (“Discovery”) are responsible for ensuring adherence to
principles of best corporate governance. Within the South African context these are embodied in the King II Report on
Corporate Governance for South Africa 2002 (“King II”).
Corporate governance, the system by which companies are managed and controlled, is of the utmost importance, both
to the directors of a company and to its stakeholders.
Discovery is committed to an open governance process that provides our stakeholders with the assurance that the Group
is being managed ethically, within prudent risk parameters and in compliance with international best practice.
The directors are satisfied that Discovery has in all material respects complied with the provisions and the spirit of
King II, unless otherwise stated in this report.
THE BOARD OF DIRECTORS AND ITS COMMITTEESDiscovery has a unitary board with a clear division of responsibilities. This ensures a balance of power and authority, so
that no single individual has unfettered powers of decision-making.
The chairman of Discovery is non-executive but not independent in terms of King II. The roles of the chairman and the
chief executive officer are separate with segregated duties.
At the date of publication of this annual report, the board consisted of 15 members, six of which are executive and nine
non-executive. Of the non-executive directors, seven are independent, including the two directors representing the BEE
partners. Two non-executive directors represent FirstRand Limited, the holding company, on the board. They are therefore
not considered to be independent. The members of the board bring to it an appropriate mix of diverse skills, experience
and backgrounds.
In terms of the board’s charter, it has reserved to itself the following responsibilities:
• To be the guardian of the values and ethics of Discovery;
• To consider major capital expenditure, acquisitions and disposals and any other matters which are defined as material;
• To appoint the chief executive officer;
• To approve the strategic direction of Discovery and the budgets necessary for the implementation thereof;
• To monitor the executive management in the implementation of the corporate vision and strategy;
• To ensure that at all times there is compliance with the letter and the spirit of the law; and
• To communicate with shareholders openly and timeously throughout the year.
The company secretary arranges induction and orientation programmes for incoming directors and education is ongoing.
This includes an explanation of their fiduciary duties and responsibilities and visits to divisions, where discussions with
management facilitate an understanding of Discovery.
DUTIES OF THE DIRECTORSThe directors exercise their fiduciary duty and act in good faith, with due diligence and care, and in the best interests of
the company and all stakeholders. The fundamental responsibility of the board is to improve economic prosperity of the
Group over which it has full and effective control. A report from the chief executive officer is presented at each board
meeting. The board also receives reports from the audit, actuarial, transformation and remuneration committees.
APPOINTMENT OF DIRECTORSThe board has taken the responsibility upon itself to identify potential new directors. This policy is formal and transparent
and a matter for the board as a whole. Non-executive directors are appointed for three years. Re-appointment of non-
executive directors is not automatic. The executive directors all have contracts that can be terminated with one month’s
notice. Directors are required to subscribe to the Discovery code of ethics.
CORPORATE GOVERNANCE

D I S C O V E R Y A N N U A L R E P O R T 2 0 0 66 8
BOARD PROCEEDINGSThe board meets six times per year. Additional meetings are convened as and when necessary. Directors have full and
unrestricted access to relevant information and are also entitled to seek independent professional advice at the expense
of Discovery to support them in their duties.
During the past financial year the attendance was as follows:
Aug Oct Dec Feb April June
2005 2005 2005 2006 2006 2006
LL Dippenaar (Chairman) ✓ ✓ ✓ ✓ ✓ ✓
A Gore (Chief Executive Officer) ✓ ✓ ✓ ✓ ✓ ✓
BA Brink ✓ ✓ ✓ ✓ ✓ ✓
JP Burger ✓ ✓ ✓ ✓ ✓
NJ Dlamini ✓ ✓ ✓ ✓ ✓
SB Epstein ✓ ✓ ✓ ✓ ✓
MI Hilkowitz ✓ ✓ ✓ ✓ ✓
NS Koopowitz ✓ ✓ ✓ ✓ ✓ ✓
TV Maphai (appointed 8 December 2005) ✓ ✓ ✓ ✓
HP Mayers ✓ ✓ ✓ ✓ ✓
JM Robertson ✓ ✓ ✓ ✓ ✓ ✓
S Sebotsa (appointed 8 December 2005) ✓ ✓ ✓ ✓
B Swartzberg ✓ ✓ ✓ ✓ ✓ ✓
SD Whyte ✓ ✓ ✓ ✓ ✓
SV Zilwa ✓ ✓ ✓ ✓ ✓ ✓
Richard Farber, the CFO of the Group, attends the board meetings by invitation.
BOARD COMMITTEESTo assist the board in discharging its collective responsibility, several committees have been established, to which certain
of the board’s responsibilities have been delegated. The board committees currently in place are:
Holdings executive committeeThe holdings executive committee is empowered and responsible for implementing the strategies approved by the
Discovery board and for managing the affairs of Discovery. The holdings executive committee is chaired by the chief
executive officer and meets weekly.
In addition the various business units, including the offshore operations (Destiny and PruHealth) also have executive
committees. All the executive committees meet weekly except for PruHealth which currently meets every second week.
Feedback on the activities of each business unit is given at the weekly holdings executive committee.
Audit and risk committeeThe responsibilities of the audit and risk committee are:
• To assist in the execution of the board’s role of corporate accountability;
• To ensure integrity, reliability and accuracy of accounting and financial reporting systems;
• To ensure that appropriate systems are in place for monitoring risk, control and compliance with the law and codes
of conduct;
• To evaluate the adequacy and effectiveness of the risk management, internal audit and compliance processes and to
ensure that management has maintained an environment that supports the respect for these functions;
• To maintain transparent and appropriate relationships with the external auditors and set the principles for
recommending the use of external auditors for non-audit services; and
• To review the scope, quality and cost of the statutory audit and the independence and objectivity of the auditors.
The audit and risk committee meets four times per year. Executive management, external audit and internal audit are
in attendance.
CORPORATE GOVERNANCE (continued)

D I S C O V E R Y A N N U A L R E P O R T 2 0 0 6 6 9
The board recognises the need for members of the actuarial committee to attend the audit and risk committee, and vice versa.
This ensures that the full spectrum of responsibilities of the two committees are addressed and noted in both these forums.
Mr Andy Rayner, the independent chairman of the actuarial committee, attends the audit and risk committee while Mr Johan
Burger and Ms Sindi Zilwa attend the actuarial committee.
During the past financial year the attendance at audit and risk committee meetings was as follows:
Aug Nov Feb May2005 2005 2006 2006
JP Burger (Chairman) ✓ ✓
AH Arnott ✓ ✓ ✓ ✓
AB Rayner (by invitation) ✓ ✓ ✓ ✓
S Sebotsa (appointed 8 December 2005) ✓ ✓
SV Zilwa ✓ ✓ ✓ ✓
Individual risk committees per business unit have been established as sub-committees of the audit and risk committee. Each
risk committee meets monthly and the meetings are attended by the CEOs of the business unit, members of its executive
committee, key risk management stakeholders, including members responsible for risk and compliance and internal audit.
The prime objective is to ensure the appropriate identification and control of key financial and non-financial risks using the
enterprise-wide risk management framework.
Actuarial committeeThe responsibilities of the actuarial committee are:
• To consider the financial soundness valuation results of Discovery including overall methodology and assumptions used
to value the assets and liabilities of the Group as well as the overall checks and controls applied by the statutory actuary;
• To consider the embedded value results of Discovery including the overall methodology and assumptions used in the
embedded value calculation, as well as the overall checks and controls applied by the responsible actuary;
• To review the external disclosure of the financial soundness valuation results and the embedded value results of Discovery;
• To ensure that, from an actuarial perspective, Discovery complies with all statutory requirements and adheres to
international best practice;
• To consider the capital position of Discovery;
• To satisfy itself that the necessary processes and forums are in place to enable the statutory actuary to ensure the
actuarial soundness of new products as well as revisions of existing products; and
• To review all reinsurance arrangements whether acting as reinsurer or reinsured.
The actuarial committee met six times during the year. The chief financial officer and the internal actuaries for DiscoveryHealth, Discovery Life, Destiny Health and PruHealth were in attendance if needed. During the past financial year theattendance of actuarial committee meetings was as follows:
July Aug Nov Jan Feb May2005 2005 2005 2006 2006 2006
AB Rayner (Chairman)* ✓ ✓ ✓ ✓ ✓ ✓
JP Burger (by invitation) ✓ ✓ ✓ ✓ ✓
S Matisonn ✓ ✓ ✓ ✓
HP Mayers ✓ ✓ ✓ ✓ ✓
B Swartzberg ✓ ✓ ✓ ✓ ✓
RD Williams ✓ ✓ ✓ ✓ ✓ ✓
SV Zilwa (by invitation) ✓ ✓ ✓ ✓ ✓ ✓
T Nzimande (appointed 8 December 2005)**
* Mr Rayner is a qualified actuary and employed by the actuarial consultancy of Deloitte. Mr Rayner is not a member of the board.
** Ms Nzimande represents WDB, one of Discovery’s BEE partners. Ms Nzimande is not a member of the board and was on maternity leave from Januaryto June 2006 and therefore did not attend any meetings.
D I S C O V E R Y A N N U A L R E P O R T 2 0 0 67 0
CORPORATE GOVERNANCE (continued)
Remuneration committee The primary objective of the remuneration committee is to develop a rewards strategy and is responsible for:
• Evaluating the performance of the executive directors;
• Recommending remuneration packages for executive directors;
• Recommending policy relating to the bonus and share incentive schemes;
• Recommending the basis for non-executive directors’ fees; and
• Reviewing annual salary increases.
The remuneration committee met twice during the year and the attendance was as follows:
Sep June2005 2006
LL Dippenaar (Chairman) ✓ ✓
NJ Dlamini ✓
M Olivier ✓ ✓
T Slabbert (appointed 8 December 2005)* ✓
* Ms Slabbert represents WDB, one of Discovery’s BEE partners. Ms Slabbert is not a member of the board.
In addition the CEO, the CFO, the head of HR and the managing directors of the business units attend the meetings
by invitation.
No executive director is involved in the setting of his own remuneration.
Details of the respective directors’ remuneration for the year under review can be found in the Directorate.
TRANSFORMATION COMMITTEEThe primary objectives of the transformation committee are to ensure compliance with both the spirit and letter of
transformation in general. Compliance will be measured in terms of, inter alia, an agreed scorecard or whatever other
measures are available in relation to the charters relevant to the organisation and DTI codes.
This was the first year the committee was established and it met four times during the year. The CEO and the CEOs of
the business units, the head of HR and the CFO also attend the meetings.
Aug Oct March May
2005 2005 2006 2006
NJ Dlamini (Chairman) ✓ ✓ ✓ ✓
SV Zilwa ✓ ✓ ✓ ✓
T Slabbert (appointed 8 December 2005)* ✓ ✓
* Ms Slabbert represents WDB, one of Discovery’s BEE partners. Ms Slabbert is not a member of the board.
Dr TV Maphai was invited to join the transformation committee. He accepted the invitiation on condition that he be
granted leave to only start attending meetings once the initial work required to establish the Discovery Foundation, of
which he is the chairman, has settled down. This is expected to be from January 2007.
COMPANY SECRETARYMJ Botha is the company secretary. He is suitably qualified and has access to the Discovery secretarial resources.
The company secretary provides support and guidance to the board in matters relating to governance and ethical
practices across Discovery (as defined above). The company secretary ensures the proper administration of board
proceedings. The company secretary’s other functions include providing direction to the directors with regard to
responsibilities within the statutory environment and the non-dealing in company shares during restricted periods.
A written notice is disseminated to all Discovery employees informing them of the provisions of the Insider Trading Act
and that, during a restricted period, dealing in shares of the company, may not be undertaken.

D I S C O V E R Y A N N U A L R E P O R T 2 0 0 6 7 1
GOING CONCERNThe board has satisfied itself that Discovery has adequate resources to continue with its operations in the near future and
Discovery’s financial statements have accordingly been prepared on a going concern basis.
AUDITOR INDEPENDENCEThe Discovery financial statements have been audited by the independent auditors PricewaterhouseCoopers Inc.
The auditors for Destiny Health and PruHealth are Deloitte & Touche LLP and KPMG respectively. Discovery believes
that the external auditors have observed the highest level of business and professional ethics. It has no reason to
believe that the external auditors have not at all times acted with unimpaired independence.
Details of fees paid to the external auditors for audit services are included in the Group annual financial statements. It is
the Discovery policy to ensure that it makes use of the most suitable organisation for any professional services it may
require. Fees paid in respect of non-audit services provided by the external auditors are disclosed in the financial
statements. These fees have also been disclosed and discussed by the audit committee.

D I S C O V E R Y A N N U A L R E P O R T 2 0 0 67 2
CONTENTS
Seven-year review 73Report of the chief financial officer 74Directors’ reponsibility statement 80Certificate by the company secretary 80Report of the independent auditors 81Directors’ report 82Accounting policies 85
Group:Balance sheet 102Income statement 103Cash flow statement 104Statement of changes in equity 105Notes to the annual financial statements 106Transition to international financial reporting standards 164
Company:Balance sheet 168Income statement 168Statement of changes in equity 169Cash flow statement 169Notes to the annual financial statements 170Directorate 173
ANNUAL F INANCIALSTATEMENTS
FOR THE YEAR ENDED 30 JUNE 2006

D I S C O V E R Y A N N U A L R E P O R T 2 0 0 6 7 3
SEVEN-YEAR REVIEWfor the year ended 30 June
New business API (Rm) 1 322 2 177 2 339 3 148 3 213 4 342 4 479 23
Gross inflows under management (Rm)
Gross inflows under management 3 559 5 494 7 739 10 946 14 345 17 295 20 427 34
Less: Collected on behalf of third parties 1 310 2 117 3 877 7 190 10 647 13 266 14 988 50
Less: Money Market contributions 221 559 357 – – – – –
Gross income of Group 2 028 2 818 3 505 3 756 3 698 4 029 5 439 18
Income statement extracts (Rm)
Profit from operations 122 216 318 460 829 923 1 263 48
– Local operations 155 277 426 629 961 1 151 1 547
– Foreign operations (33) (61) (108) (169) (132) (228) (284)
Headline earnings 51 130 236 356 406 509 531 48
Abnormal items* – – (45) (84) – – 161
Headline earnings before abnormal items 51 130 191 272 406 509 692 54
Diluted headline earnings per share before
abnormal items 14.3 33.6 48.1 65.7 77.4 94.2 97.0 38
* Abnormal items include BEE expenses
Balance sheet extracts (Rm)
Total assets 1 298 2 082 2 308 3 349 4 032 5 280 6 792 32
Shareholders’ funds 406 576 928 1 164 2 503 3 290 4 212 48
Embedded value
Embedded value (Rm) 2 114 3 156 3 321 4 928 6 832 9 173 10 587 31
Diluted embedded value per share (R) 5.50 8.15 8.26 12.20 12.89 16.93 19.47 23
Key ratios
Return on average equity (%) 21 30 38 39 24 20 18
Return on average assets (%) 5 8 11 13 11 12 11
Capital adequacy requirement (times) – – – – 10.2 12.9 14.0
Exchange rates
Rand/US$
– Closing 6.77 8.07 10.31 7.56 6.18 6.68 7.13
– Average 6.40 7.42 9.19 8.89 6.77 6.19 6.44
Rand/GBP
– Closing 10.26 11.35 15.75 12.47 11.20 11.97 13.15
– Average 9.88 10.81 14.81 14.12 11.83 11.50 11.45
Share statistics
Number of ordinary shares in issue
– Weighted average (000’s) 378 285 388 417 390 411 391 714 504 051 519 188 528 946
– Diluted weighted average (000’s) 386 970 400 047 414 701 430 963 536 025 553 227 574 871
– End of period (000’s) 384 979 386 026 390 625 397 800 532 416 548 957 591 953
Price/diluted headline earnings (times) 78.7 32.5 12.2 8.7 16.6 23.4 20.7
Share price (cents per share):
– High 1 310 1 300 1 140 900 1 425 2 550 2 700
– Low 745 1 000 640 590 695 1 210 1 825
– Closing 1 125 1 090 720 745 1 283 2 200 2 010
Market capitalisation (Rm) 4 331 4 207 2 812 2 964 6 831 12 077 11 898
Pre-IFRS
Group Group Group Group Group Group Group Compound
2000 2001 2002 2003 2004 2005 2006 growth %
D I S C O V E R Y A N N U A L R E P O R T 2 0 0 67 4
REPORT OF THE CHIEF FINANCIAL OFFICERfor the year ended 30 June 2006
Discovery Holdings Limited is a majority-owned subsidiary of FirstRand Limited, listed in the insurance sector of the JSE
Limited. The consolidated figures in this report include the operations of Discovery Health, Discovery Life, Discovery Vitality,
the Destiny group of companies and PruHealth. All operations take place within 100%-owned subsidiaries, with the
exception of the Destiny group of companies in which Discovery Holdings Limited has a 98% interest (with management
owning the balance) and PruHealth in which Discovery Holdings Limited has a 50% interest held indirectly via a wholly-
owned subsidiary, Discovery Offshore Holdings Limited. A comprehensive group structure is set out on page 2.
BASIS OF PREPARATIONThe attached annual financial statements relate to the Discovery Holdings group of companies (“Discovery”). In order to
provide a better understanding of Discovery’s results, the results have been provided on a segmental basis on page 129.
The segments into which Discovery has been divided are:
Health South Africa – the provision of administration and managed care services to Discovery Health Medical Scheme and
several smaller closed schemes.
Health United States of America – the provision and administration of health insurance products to employer groups and
individuals in the United States of America, together with Guardian Life Insurance Company of America (“Guardian”) and
Tufts Health Plan of Boston, Massachusetts (“Tufts”).
Health United Kingdom – the provision and administration of health insurance products to employer groups and
individuals in the United Kingdom, together with the Prudential Assurance Company Limited.
Life – the provision of a risk-only life assurance product and investment products in the South African market.
Vitality – the provision of health and lifestyle benefits with selected partners to medical scheme members and Discovery
Life policyholders. This includes the results from offering KeyClub benefits to KeyCare members.
The segmental analysis set out above is not necessarily based on the results per statutory entity, but rather on a functional
split of the activities of Discovery, as this is the basis on which the Group’s affairs are managed.
ACCOUNTING POLICIESThe accounting policies applied are in accordance with International Financial Reporting Standards (IFRS), as well as the
South African Companies Act 61 of 1973, as amended.
These are Discovery’s first IFRS annual financial statements and the provisions of IFRS 1 First-time adoption of
International Financial Reporting Standards, have been applied.
Details of the financial restatement impact as a consequence of the IFRS adoption are found on page 164 to 167. All
comparatives have been restated as shown on these pages.
REVIEW OF GROUP RESULTSDiscovery continued to produce strong, consistent earnings growth, despite significant investment into new products and
opportunities. Headline earnings excluding the impact of the BEE transaction increased by 36% to R692 million for the
year ended 30 June 2006. Unrealised gains on available-for-sale investments of R288 million for the year have been taken
directly to reserves and are not included in earnings.
In the financial year, the Group incurred costs of R35 million towards the development and launch of its joint protection
initiative with the Prudential plc. This initiative was launched into the UK assurance market in July 2006. Even though we
are confident that this investment will yield profits in excess of these costs in future years, the Group has continued to
adopt the policy of expensing set-up costs of new operations.
GROSS INFLOWS UNDER MANAGEMENTGross inflows under management, which in our belief is the most appropriate measure of our scale of operations, have
shown compound growth of 34% per annum. This is driven by growth in all business areas. Gross inflows under
management includes flows of the schemes Discovery administers and 100% of the business conducted together with its
joint venture partners.

D I S C O V E R Y A N N U A L R E P O R T 2 0 0 6 7 5
Gross inflows under managementJune June %
R million 2006 2005 change
Discovery Health 16 542 14 571 14
Discovery Life 1 768 1 278 38
Discovery Vitality 654 521 26
Destiny Health 1 322 914 45
PruHealth 141 11
Gross inflows under management 20 427 17 295 18
Less: collected on behalf of third parties (14 988) (13 266)
Discovery Health (14 507) (12 883)
Destiny Health (411) (377)
PruHealth (70) (6)
Gross income of Group 5 439 4 029 35
GROUP OPERATING RESULTSThe following table shows the main components of the increase in Group operating profit for the year:
Earnings sourceJune June %
R million 2006 2005 change
Discovery Health 655 548 20
Discovery Life 546 417 31
Discovery Vitality 41 37 11
Destiny Health (151) (90) (68)
PruHealth (146) (148) 1
Group operating profit before investment income 945 764 24
FINANCE COSTSIn January 2005, Destiny Health repaid its South African rand-denominated loan from RMB International (Dublin) Limited,
from the investment of R350 million by Discovery Holdings into Destiny. Destiny had previously incurred finance costs and
foreign exchange losses on this facility. Destiny still has a US dollar-denominated debt facility with HSBC Bank plc and the
majority of the finance costs in the current year relate this facility.
INVESTMENT INCOME ON THE SHAREHOLDERS’ ASSETSStrong investment market performance and additional investments resulted in an increase in:
• shareholder equity investments from R922 million to R1 176 million;
• investment income from R106 million to R161 million; and
• net realised gains from R53 million to R157 million.
TAXATIONAll South African entities are in a tax paying position. Destiny operations have significant tax losses but no deferred tax
asset has been accounted for on the foreign losses incurred in the US.
An asset has been accounted for on 50% of the PruHealth losses for which Group tax relief is available to Prudential plc
in the UK. No deferred tax asset has been accounted for on the balance of the PruHealth losses.

D I S C O V E R Y A N N U A L R E P O R T 2 0 0 67 6
REPORT OF THE CHIEF FINANCIAL OFFICER (continued)
for the year ended 30 June 2006
BEE TRANSACTIONIn December 2005, Discovery issued 38 725 909 shares in terms of its BEE transaction. The special purpose vehicles and
trusts to which these shares have been issued, have been consolidated into the accounts of Discovery, eliminating the
share issue.
These shares have been included in the calculation of diluted HEPS and diluted EPS.
The International Financial Reporting Interpretations Committee (IFRIC) released IFRIC 8 “Scope of IFRS 2” confirming
that BEE transactions should be accounted for under IFRS 2.
Discovery has early adopted IFRIC 8, resulting in a charge to the income statement of R161 million in the year ended
30 June 2006. This charge represents the financial effects of the BEE transaction.
An additional R24 million in respect of equity settled share-based payments and R6 million in respect of cash settled share-
based payments, granted under employee share incentive schemes, has been expensed in the income statement in
accordance with the requirements of IFRS 2.
CASH FLOW FROM OPERATIONSThe Group generates significant cash from all its South African operations. The Life business is starting to generate strong
positive cash flow.
Cash generated by operationsJune June %
R million 2006 2005 change
Discovery Health 678 760 (11)
Discovery Life 72 32 125
Discovery Vitality 108 53 103
Destiny Health (98) (68) 44
PruHealth (99) (185) (46)
Holdings (5) (7) (29)
Cash generated by operations including
working capital changes 656 585 12
PruHealth prepaid R75 million of administration services to Discovery Health in the year ended 30 June 2005.
SEVEN-YEAR REVIEWThe seven-year review of key financial indicators is set out on page 73. It is pleasing to note that profit from operations
has increased by a compound growth of 48% per annum since 2000 from R122 million to R1 263 million due to the
strong growth in all of Discovery’s operations.
BALANCE SHEETDiscovery’s shareholder funds are invested into the different business operations as follows:
R million
Health South Africa and Vitality 790
Life 3 374
Destiny Health (27)
PruHealth 85
Consolidation entries (10)
4 212
The shareholders funds invested in Health South Africa and Vitality will be used to fund future cash requirements of theinternational operations and dividends of the Group. The shareholders funds in Life will be used to support future growthof this business segment.

D I S C O V E R Y A N N U A L R E P O R T 2 0 0 6 7 7
The minority interest of R67 million reflected in the balance sheet in the prior year comprised the Series A preferenceshares of Destiny Health. These were redeemed in December 2005.
The increase in the assets under insurance contracts of R582 million is as a result of the significant increase in profitablenew business written by Discovery Life.
The deferred tax liability is primarily attributable to the application of the FSB directive 145. This directive allows for the zeroingof the negative life reserve on a statutory basis. The statutory basis is used when calculating tax payable for Discovery Life,resulting in a timing difference between the tax base and the accounting base. This is disclosed as a regulatory change in theembedded value statement.
FINANCIAL SERVICES BOARD DIRECTIVE 145In November 2004, the Financial Services Board issued directive 145 regarding the treatment of negative reserves. Thisdirective provides clarity regarding the treatment of negative reserves as well as the calculation of the Termination CapitalAdequacy Requirement (TCAR) relating to negative reserves. The directors believe that the application of this directivemore appropriately represents the financial soundness of Discovery Life and have applied it in the statutory returns ofDiscovery Life.
Following the application of this directive, the capital adequacy requirements of Discovery Life are R95 million(2005: R77 million), and the qualifying excess of assets over liabilities is R1 319 million (2005: R987 million). This results in acapital adequacy cover of 14.0 times (2005: 12.9 times).
CAPITAL MANAGEMENTDiscovery follows the philosophy of investing the Group’s capital in business projects which offer strong organic growthin earnings and maximise the return on capital over the long term.
Of the Group entities, Discovery Life Limited, Destiny Health Insurance Company Inc. (“DHIC”) and PruHealth areregulated and have minimum capital requirements.
DHIC is required to hold capital equal to one quarter of its annualised premium income. As at 30 June 2006, DHIC heldapproximately US$13 million (2005:US$15 million) for this purpose. Following the implementation of Destiny’s alliancewith Guardian, new business has primarily been written on the Guardian licence, limiting the growth in the capitalrequirements going forward.
The capital requirements of PruHealth have been funded equally by each of the joint venture partners. As at 30 June 2006,PruHealth was required to hold GBP12.6 million (2005: GBP12.7 million) in capital. At that date, PruHealth held GBP21.8 million (2005: GBP21.7 million) in available capital to meet this requirement.
DIVIDEND POLICYThe directors are of the view that the Group is sufficiently capitalised at this time and have taken the opportunity tocommence the payment of dividends. In determining the appropriate dividend, the directors set a policy that allows theGroup to maintain paying dividends in the foreseeable future. The directors have determined that it is appropriate to paydividends based on a dividend cover of 4.5 times.
EMBEDDED VALUEThe embedded value of Discovery, representing the sum of the shareholders’ net assets and the present value of the
expected future profits arising from the existing in-force insurance business less an allowance for the cost of capital, was
R10.6 billion at 30 June 2006 (2005: R9.2 billion). The embedded value calculation includes the shareholders’ net assets
at the values reflected in the consolidated balance sheet on page 102.

D I S C O V E R Y A N N U A L R E P O R T 2 0 0 67 8
REPORT OF THE CHIEF FINANCIAL OFFICER (continued)
for the year ended 30 June 2006
The analysis of the main components of the Group embedded value is set out below.
Health and Destiny Vitality Life Health Other Total
Value of in-force business at 30 June 2005 3 844 1 832 274 – 5 950
Expected return 390 230 34 – 654
Release of profits (654) (252) (9) – (915)
Value of new business as at 30 June 2006 292 1 197 15 – 1 504
Experience variances 329 25 (79) – 275
Methodology changes (65) 1 290 (230) – 995
Value of in-force business at 30 June 2006 4 136 4 322 5 – 8 463
Shareholders’ funds excluding assets under
insurance contracts 790 1 286 (27) 75 2 124
Embedded value 4 926 5 608 (22) 75 10 587
More detail on the components of each of these items, including the methodology and assumptions made in calculating
the embedded value of Discovery, can be found in the Embedded Value Statement on pages 51 to 62.
The embedded value of new business is set out in the following table:
Embedded value of new businessEmbedded value of new business for the year ended 30 June
2006 2006 2005 % R million SVM basis FSV basis change
Health and Vitality
Gross profit from new business at point of sale 115 115 229
Cost of capital – – –
Cost of STC (3) (3) –
Net profit from new business at point of sale 112 112 229 (51)
Life
Gross profit from new business at point of sale 532 679 676
Cost of capital (7) (129) (157)
Cost of STC (15) (21) –
Net profit from new business at point of sale 510 529 519 (2)
Destiny Health
Gross profit from new business at point of sale (50) (50) 36
Cost of capital (0) (0) (1)
Cost of STC 0 0 –
Net profit from new business at point of sale (50) (50) 35

D I S C O V E R Y A N N U A L R E P O R T 2 0 0 6 7 9
Reconciliation of embedded value earningsThe movement in the embedded value in the year under review can be reconciled to the accounting earnings of theGroup as follows:
Change in Impact on StatementEmbedded value of Cost of income of changes
R million value in-force capital statement in equity
Total profit from new business at point of sale 572 579 (7)Profit from existing business
– Expected return 756 673 83– Changes in methodology and assumptions (540) 497 498 (1 535)– Experience variances 262 292 (17) (13)
PruHealth start-up costs (128) (128)Adjustment for minority interest in Destiny Health 10 7 3Adjustment for Guardian profit share in Destiny Health 1 1Foreign exchange rate movements (4) (9) (1) (8) 14Return on shareholders’ funds 474 364 110Share-based payments (185) 185Negative reserve adjustment (2 088) 2 088
1 403 (48) 473 669 309
DISCOVERY LIFE PREFERENCE SHARESUpon the commencement of the life insurance business, Discovery Life issued preference shares to the management team.The terms of such preference shares were intended to achieve the result that the individuals (who subscribed for thepreference shares) would be placed in the same financial position after the expiry of three, four and five years respectivelyhad they subscribed for ordinary shares in Discovery Life at the date that the life business commenced operation. Theredemption value of these shares was thus determined as 15% of the shareholder value created by the life business.
All three tranches of one third each of the preference shares were redeemed on 31 August 2004, 30 June 2005 and30 June 2006 respectively. All tranches were redeemed at a premium of R108.44 per share.
On redemption date, the preference shareholders were obliged to invest the full amount of cash received from Discovery Lifein Discovery Holdings ordinary shares. Discovery Holdings was, in turn, obliged to invest an equivalent amount in newordinary shares of Discovery Life.
Following the redemption of all three tranches, the preference shareholders subscribed for 12 811 590 ordinary shares inDiscovery Holdings at a price of R12.57 per share. From a Group perspective, no cash has been received from the issueof these shares and therefore on consolidation, the proceeds of these share issues have been eliminated.
SHARES IN ISSUEIn December 2005, Discovery Holdings issued 38 725 909 shares in terms of the BEE deal. The special purpose vehiclesand trusts to which these shares have been issued, have been consolidated into the accounts of Discovery, eliminatingthe share issue. These shares have been included in the calculation of diluted HEPS and diluted EPS.
On 30 June 2006, Discovery Holdings issued 4 270 530 shares in the redemption of the final tranche of the DiscoveryLife preference shares. Following this issue, Discovery Holdings has 591 953 180 shares in issue.
DESTINY ALLIANCESDuring the financial year ended 30 June 2004, Destiny commenced writing business with its two alliance partners, GuardianLife Assurance Company and Tufts Health Plan.
With effect from 1 July 2006, Destiny and Tufts agreed to end their alliance formed three years ago to offer a consumer-directed health plan in Massachusetts. The existing 10 000 members on the Liberty plan – the plan jointly marketed byDestiny Health and Tufts – will continue through to the completion of their respective plan years, with no change in benefits,networks and service levels until December 2007.
Destiny and Guardian are also in the process of revisiting their partnership arrangement. It is anticipated that therestructure of this partnership will be mutually beneficial to both parties.

D I S C O V E R Y A N N U A L R E P O R T 2 0 0 68 0
Directors’ responsibility to the members of Discovery Holdings Limited and its subsidiaries (“Discovery”)
The directors of Discovery are required by the Companies Act (Act 61 of 1973) as amended (“Companies Act”), to
maintain adequate accounting records and to prepare financial statements for each financial year which fairly present the
state of affairs of Discovery at the end of the financial year, and of the results and cash flows for the period. In preparing
the accompanying annual financial statements, International Financial Reporting Standards have been used and
reasonable estimates have been made. The annual financial statements incorporate full and responsible disclosure, in line
with Discovery’s philosophy on corporate governance.
The directors have reviewed Discovery’s budget and flow of funds forecast for the year to 30 June 2007. On the basis of
this review, and in light of the current financial position and available cash resources, the directors have no reason to
believe that Discovery will not be a going concern for the foreseeable future. The going concern basis has therefore been
adopted in preparing the annual financial statements.
The directors are responsible for Discovery’s systems of internal control, which include internal financial controls in the
various subsidiaries that are designed to provide reasonable, but not absolute, assurance against material misstatement
and loss. Discovery maintains internal financial controls to provide assurance regarding:
• safeguarding of assets against unauthorised use or disposition; and
• the maintenance of proper accounting records and the reliability of financial information used within the business, or
for publication.
The controls contain self-monitoring mechanisms, and actions are taken to correct deficiencies as they are identified.
Even an effective system of internal control, no matter how well designed, has inherent limitations, including the
possibility of circumvention and the overriding of controls. An effective system of control therefore aims to provide
reasonable assurance with respect to the reliability of financial information and, in particular, the presentation of annual
financial statements.
To the best of their knowledge and belief, based on the above, the directors are satisfied that no material breakdown in
the operation of the systems of internal control and procedures has occurred during the year under review.
Discovery’s external auditors, PricewaterhouseCoopers Inc, have audited the annual financial statements and their
unqualified report appears on page 81.
The annual financial statements of Discovery for the year ended 30 June 2006, which appear on pages 82 to 176, have
been approved by the board of directors on 6 September 2006 and are signed on its behalf by:
A Gore JM Robertson
Chief Executive Officer Group Chief Information Officer
DIRECTORS’ RESPONSIBILITY STATEMENT
CERTIFICATE BY THE COMPANY SECRETARY
It is hereby certified that, in terms of section 268G(d) of the Companies Act, that Discovery Holdings Limited has for the
year ended 30 June 2006 lodged with the Registrar of Companies all such returns as are required by a public company
in terms of this Act and that all such returns are true, correct and up to date.
MJ Botha
Company Secretary

D I S C O V E R Y A N N U A L R E P O R T 2 0 0 6 8 1
To the members of
DISCOVERY HOLDINGS LIMITEDWe have audited the annual financial statements and group annual financial statements of Discovery Holdings Limited
and its subsidiaries set out on pages 82 to 176 for the year ended 30 June 2006. These annual financial statements are
the responsibility of the company’s directors. Our responsibility is to express an opinion on these annual financial
statements based on our audit.
ScopeWe conducted our audit in accordance with statements of International Standards of Auditing. Those standards require
that we plan and perform the audit to obtain reasonable assurance that the annual financial statements are free of
material misstatement. An audit includes examining, on a test basis, evidence supporting the amounts and disclosures in
the annual financial statements. An audit also includes assessing the accounting principles used and significant estimates
made by management and the overall financial statement presentation. We believe that our audit provides a reasonable
basis for our opinion.
Audit opinionIn our opinion, the annual financial statements and group annual financial statements fairly present, in all material
respects, the financial position of the company and the group at 30 June 2006 and the results of their operations and
cash flows for the year then ended in accordance with International Financial Reporting Standards, and in the manner
required by the South African Companies Act 61 of 1973, as amended.
PricewaterhouseCoopers Inc
Director: BA Stott
Registered Auditor
Johannesburg
6 September 2006
REPORT OF THE INDEPENDENT AUDITORS
D I S C O V E R Y A N N U A L R E P O R T 2 0 0 68 2
The directors present their seventh annual report, which forms part of the audited financial statements of the company and of
the Group for the year ended 30 June 2006.
NATURE OF BUSINESSDiscovery Holdings Limited (“the company”) is listed in the insurance sector of the JSE Limited and is the holding
company of:
• Discovery Life Limited (“Discovery Life”);
• Discovery Health (Proprietary) Limited (“Discovery Health”);
• Vitality Healthstyle (Proprietary) Limited (“Vitality”);
• Vitality Healthstyle Travel (Proprietary) Limited (ceased trading effective 1 February 2004);
• Discovery Nominees (Proprietary) Limited (dormant);
• Destiny Health Inc (“Destiny Health”), which is incorporated in the United States of America;
• Destiny Management Company LLC, which is incorporated in the United States of America;
• Destiny Health Insurance Company, which is incorporated in the United States of America;
• Destiny Health Administrators Inc. (dormant), which is incorporated in the United States of America;
• Discovery Offshore Holdings Limited, which is incorporated in England and Wales. This company holds Discovery’s
interest in Prudential Health (“PruHealth”); and
• Discovery Insurance Intermediary Services Limited (dormant), which is incorporated in England and Wales.
Discovery Holdings and its subsidiaries are referred to herein as “Discovery”. The subsidiaries are wholly-owned with the
exception of Destiny Health in which Discovery has a 98% interest.
Discovery Life is a long-term insurer in South Africa. Discovery Life offers a suite of risk benefit products to the individual
and group life markets. Discovery Life, until January 2004, offered reinsurance of medical scheme risks. Discovery Health
is a specialised administrator offering various services to medical schemes, Discovery Life, Destiny Health and PruHealth.
Vitality offers a rewards programme incentivising its members to lead healthy lives and rewarding lifestyles. Destiny
Health offers health insurance in the state of Illinois in the United States of America.
Discovery announced its UK joint venture in April 2004 with Prudential Assurance Company Limited heralding its entry
into the UK private health insurance market. PruHealth commenced business on 4 October 2004.
GENERAL REVIEWThe financial position and results are reflected on pages 82 to 176. The Group’s attributable share of profits and losses
from subsidiary companies for the year ended 30 June is set out below:
GROUP %R million 2006 2005 change
Aggregate profits after taxation from local subsidiaries 935 807 16
Loss from Destiny Health net of minority share of loss (147) (134)
Loss from PruHealth after taxation (119) (116)
669 557 20
DIRECTORS’ REPORTfor the year ended 30 June 2006

D I S C O V E R Y A N N U A L R E P O R T 2 0 0 6 8 3
SHARE CAPITALThe authorised share capital is 1 000 000 000 ordinary shares of 0,1 cent per share. The issued share capital of the
company at 30 June 2006 was 591 953 180 ordinary shares of 0,1 cent per share. The following shares were issued in
the current year:
• In December 2005, 38,7 million shares were issued in terms of its Black Economic Empowerment (“BEE”) transaction; and
• on 30 June 2006, 4 270 530 shares were issued to the preference shareholders of Discovery Life Limited. (Refer Note 15.2.)
The share incentive trust holds 3.3% of the share capital of the company for the benefit of trust participants.
Shareholders will be requested at the forthcoming annual general meeting of shareholders to place the unissued shares
under the control of the directors until the next annual general meeting.
Discovery Life Limited had issued 1 500 000 preference shares to certain directors and employees at a par value of 1 cent
per share. These shares were redeemable as set out in note 15.2 of the financial statements. As at 30 June 2006, all of
these preference shares have been redeemed.
DIVIDENDSThe directors are of the view that the Discovery Group is adequately capitalised at this time. On the statutory basis the
capital adequacy requirements of Discovery Life as at 30 June 2006 was R95 million (2005: R77 million) and was covered
14.0 times (2005: 12.9 times).
Dividend declaration:The board has declared a maiden dividend of 27 cents per share. The salient dates are as follows:
• Last date to trade “cum” dividend Friday, 13 October 2006
• Date trading commences “ex” dividend Monday, 16 October 2006
• Record date Friday, 20 October 2006
• Date of payment Monday, 23 October 2006
Share certificates may not be dematerialised or rematerialised between Monday, 16 October 2006 and Friday, 20 October 2006,
both days inclusive.
DIRECTORATE AND SECRETARYDetails of the directors, their emoluments, participation in share incentive schemes and interests in the company are
reflected on pages 173 to 176. Dr TV Maphai and Ms S Sebotsa were appointed as non-executive directors to the board of
Discovery with effect from 8 December 2005.
Dr NJ Dlamini, Dr TV Maphai and Ms S Sebotsa retire by rotation at the forthcoming annual general meeting of
shareholders and are eligible and available for re-election.
Mr MJ Botha continues in office as company secretary. His details are reflected on page 66.
DIRECTORS’ INTERESTS IN CONTRACTSNo material contracts involving directors’ interests were entered into in the current year. All of the executive directors
have signed restraints of trade which prevent them from competing with Discovery for one year after their employment
with Discovery ends. The directors had no interest in any third party or company responsible for managing any of the
business activities of the Group.
SUBSIDIARIES AND ASSOCIATESDetails of the company’s subsidiaries, associates and joint venture are set out in note 1 to the Discovery Holdings

D I S C O V E R Y A N N U A L R E P O R T 2 0 0 68 4
DIRECTORS’ REPORT (continued)
for the year ended 30 June 2006
Limited’s company financial statements. During the year under review, no changes were made to the memorandum and
articles of association of any of the subsidiary companies.
BORROWING POWERSThe directors may exercise all the powers of the company to borrow money. In terms of the articles of association, the
borrowing powers of the company are unlimited. In terms of the Long-Term Insurance Act, 1998, Discovery Life may not
encumber its assets or directly or indirectly borrow.
AUDITORSPricewaterhouseCoopers Inc will continue in office in accordance with section 270(2) of the Companies Act.
HOLDING COMPANYFirstRand Limited holds an interest of 57.09% (2005: 62.29%) in the issued ordinary share capital of the company.
EVENTS AFTER BALANCE SHEET DATEWith effect from 1 July 2006, Destiny Health and Tufts Health Plan agreed to end their alliance formed three years ago to
offer a consumer-directed health plan in Massachusetts. The existing 10 000 members on the Liberty plan – the plan jointly
marketed by Destiny Health and Tufts Health Plan – will continue through to the completion of their respective plan years,
with no change in benefits, networks and service levels until December 2007.
Subsequent to the year-end, Discovery Life has concluded a contract with Prudential Assurance Company Limited
(“Prudential Assurance”), a wholly-owned subsidiary of Prudential plc, for the development and marketing of a new
protection product in the United Kingdom. The product will be marketed under the Prudential brand. Prudential
Assurance have begun initial marketing and roll-out of the product. The partnership is not expected to have a material
impact on Discovery’s earnings in the short-term.
With effect from 1 July 2006, Discovery Health has agreed to reduce the administration fee charged per member per
month to the Discovery Health Medical Scheme by approximately 10%.
D I S C O V E R Y A N N U A L R E P O R T 2 0 0 6 8 5
1. GENERAL INFORMATIONDiscovery Holdings Limited is a majority-owned subsidiary of FirstRand Limited, listed in the insurance sector of the
JSE Limited. The Group consists of Discovery Health, Discovery Life, Discovery Vitality, the Destiny group of
companies (USA) and PruHealth (UK). All operations take place within 100%-owned subsidiaries, with the
exception of the Destiny group of companies in which Discovery Holdings Limited has a 98% interest (with
management owning the balance) and PruHealth in which Discovery Holdings Limited has a 50% interest held
indirectly via a wholly-owned subsidiary, Discovery Offshore Holdings Limited.
1.1 Discovery HealthDiscovery Health provides administration services and managed care services to the Discovery Health Medical
Scheme as well as nine large closed schemes. The administration services also include the administration of a
Primary Care network for the beneficiaries of the KeyCare Plus plan and covers the healthcare services provided
by the Primary Care network.
Discovery Health offered the insurance of private ward and overseas cover benefits. These benefits were written
through Discovery Life.
1.2 Discovery LifeDiscovery Life offers policyholders a range of insurance and financial solutions. The Discovery Life products
reflect Discovery’s underlying philosophy to make members healthier and to enhance and protect their lives.
Discovery Life offers some unique benefits that integrate with the benefits offered by Discovery Health and Vitality.
Discovery Life Plan – Individual LifeThe Discovery Life Plan provides protection against a comprehensive spectrum of risks. The plan includes:
• Life cover benefits;
• Disability benefits;
• Severe Illness benefits; and
• Income continuation benefits.
The Life Plan provides whole of life cover. Premium guarantees are offered and quantified on most benefits. For
example the premiums for Life cover are guaranteed not to increase by more than 25% for any ten-year period.
Premiums are payable monthly, however policyholders have a choice of premium payment methods.
A combination of level premium funding patterns, annually increasing premium patterns and ten-yearly stepped
premium funding patterns are offered. The higher the compulsory future premium increase, the lower the
starting premium, all else being equal.
Health Plan ProtectorThe Health Plan Protector will fund contributions to the Discovery Health plans in the event of death, disability or
severe illness. It further rewards members for positive health management through the payback benefit. The Health
Plan Protector can be added to the Life Plan or can be bought on a stand-alone basis. The Health Plan provides cover
to the age of 65, however premiums are not guaranteed.
Discovery Retirement OptimiserThe Retirement Optimiser offers funding for retirement and offers benefits that could together with the Life Plan,
capitalise unneeded risk cover to boost retirement funding. Policyholders have a choice of linked investment
portfolios or a portfolio that offers a guaranteed return in real terms.
Group LifeDiscovery Group Life offers a comprehensive spectrum of protection benefits on a group basis. Life Cover, Severe
Illness, Disability and Income continuation benefits are offered. The policies offered under Group Life can be
cancelled or the premiums adjusted at the end of the contract term (usually one year).
ACCOUNTING POLICIESfor the year ended 30 June 2006
D I S C O V E R Y A N N U A L R E P O R T 2 0 0 68 6
1.3 Destiny Health – Health insuranceThe Destiny product offers policyholders cover for a range of health insurance benefits. The plan typically covers
hospital benefits, outpatient surgery and day to day visits to physician offices. Optional cover is available for
chronic medication, total medication, preventative medication and preventative care.
Policies offered by Destiny are annual contracts which can be cancelled or the premiums adjusted on renewal.
1.4 PruHealth – Health insuranceThe PruHealth product offers policyholders cover for a range of private healthcare-related claims. The cover is
dependent on the plan type chosen and includes hospital and outpatient cover for selected conditions. It
specifically excludes emergency cover, maternity cover and cover for chronic conditions.
Policies offered by PruHealth are annual contracts which can be cancelled or the premiums adjusted on renewal.
1.5 Discovery VitalityVitality offers health and lifestyle benefits with selected partners to the Group’s clients. This business includes the
DiscoveryCard which is offered to Discovery policyholders within South Africa. The lifestyle benefits offered by
Vitality are subject to change and can be adjusted on a monthly basis.
2. BASIS OF PRESENTATIONDiscovery’s consolidated financial statements have been prepared in accordance with International Financial
Reporting Standards (“IFRS”).
Discovery prepares its consolidated financial statements on a going concern basis using the historical cost basis,
except for certain financial assets and liabilities which include:
• financial instruments classified as available-for-sale held at fair value through equity;
• derivative financial instruments at fair value through profit and loss; and
• financial instruments designated as held at fair value through profit and loss;
• policyholder liabilities and assets arising from insurance contracts which are valued in terms of the Financial
Soundness Valuation (FSV) basis as outlined under accounting policy 22 below; and
• financial instruments classified as originated loans carried at amortised cost.
The preparation of consolidated financial statements in conformity with IFRS requires the use of certain critical
accounting estimates. It also requires management to exercise its judgment in the process of applying Discovery’s
accounting policies. The critical estimates are explained in note 3 below.
In accordance with the transitional provisions set out in IFRS 1, First-time Adoption of International Financial
Reporting Standards and other relevant standards, Discovery has applied IFRS in-force as at 30 June 2006 in its
financial reporting with effect from 1 July 2004, with the exception of the disclosure requirements in IAS 32,
IAS 39 and IFRS 4 which were applied with effect from 1 July 2005. Discovery previously followed South African
Generally Accepted Accounting Practice. The impact of the adoption of IFRS is explained on page 164.
All monetary information and figures presented in these financial statements are stated in millions of rand
(R million), unless otherwise indicated.
Standards and interpretations not yet effectiveThe following new standards and interpretations are not yet effective for the current financial year. The Group
will comply with the new statements from the effective date.
IFRS 7 Financial Instruments: Disclosures (including amendments to IAS 1 Presentation of financial statement: Capital
Disclosures) – This standard should be applied to all annual periods commencing on or after 1 January 2007.
The standard deals mainly with the disclosure of financial instruments and the related qualitative and quantitative risks.
The statement will therefore not impact the results of the Group but will impact the disclosure of financial instruments.
ACCOUNTING POLICIES (continued)
for the year ended 30 June 2006

D I S C O V E R Y A N N U A L R E P O R T 2 0 0 6 8 7
Amendment to IAS 19 Employee Benefits (December 2004) – This standard should be applied to all annual periods
commencing on or after 1 January 2006. The standard permits an entity to recognise all actuarial gains and losses in
the period in which they occur, outside profit or loss, in a statement of recognised income and expense. This standard
is not applicable to the Group.
Amendment to IAS 39 Financial Instruments: Recognition and measurement (April 2005) – This standard should be
applied to all annual periods commencing on or after 1 January 2006. The amendment to IAS 39 allows the
designation, as a hedged item in consolidated financial statements, the foreign currency risk of a highly probable
forecast intragroup transaction under certain conditions. The statement is not expected to affect the Group’s
current application of the standard.
Amendment to IAS 39 Financial Instruments: Recognition and measurement (June 2005) – This standard should be
applied to all annual periods commencing on or after 1 January 2006. The revisions to IAS 39 restrict the extent to
which entities can designate a financial asset or financial liability as at fair value through profit or loss only to
specific situations. The statement is not expected to affect the Group’s current application of the fair value option.
Amendment to IAS 39 Financial Instruments: Recognition and measurement (August 2005) and IFRS 4 Insurance
contracts – This standard should be applied to all annual periods commencing on or after 1 January 2006. Under
the revised standards the issuer of a financial guarantee contract would generally measure the contract:
• initially at fair value; and
• subsequently at the higher of the amount determined in accordance with IAS 37 and the amount initially
recognised (less, when appropriate, cumulative amortisation).
This standard is not applicable to the Group.
Amendment to IAS 21 The effects of changes in a foreign operation (December 2005) – This standard should be
applied to all annual periods commencing on or after 1 January 2006. The amendment clarifies that a group
entity that may have a monetary item receivable from or payable to a foreign operation (which is in substance
part of the net investment in a foreign operation) may be part of the investment in the subsidiary. The
amendment further specifies that the exchange differences arising from the translation of these monetary items
will be classified in equity in the consolidated financial statements. It is not anticipated that the amendment will
have an impact on the Group’s results.
IFRIC 4 Determining whether an arrangement contains a lease – This interpretation should be applied to all annual
periods commencing on or after 1 January 2006. This interpretation provides guidance on determining whether
an arrangement that does not take the legal form of a lease contains a lease and should be accounted for in
terms of IAS 17 Lease. An arrangement contains a lease if the fulfillment of the arrangement is dependent on the
use of a specific asset or assets, and the arrangement conveys the right to use the asset. The Group’s current
application of the standard is substantially in line with this interpretation.
IFRIC 8 Scope of IFRS 2 – This interpretation should be applied to all annual periods commencing on or after
1 May 2006. The interpretation clarifies that IFRS 2 applies to transactions in which the entity cannot specifically
identify the goods or services received in return for a share-based payment, but where other circumstances
indicate that goods or services have been received. The Group’s application of IFRS 2 for shares issued in terms
of its Black Economic Empowerment (BEE) transaction is consistent with this interpretation.
IFRIC 9 Reassessment of embedded derivatives – This interpretation should be applied to all annual periods
commencing on or after 1 June 2006. IAS 39 Financial Instruments: Recognition and measurement requires an
entity, when it first becomes a party to a contract, to assess whether any embedded derivatives contained in the
contract are required to be separated from the host contract and accounted for as derivatives under the Standard.
IFRIC 9 clarifies that this should only be done when the entity first becomes a party to the contract. Subsequent
reassessment is prohibited unless there is a change in the terms of the contract that significantly modifies the cash
flows that otherwise would be required under the contract, in which case reassessment is required. A first-time

D I S C O V E R Y A N N U A L R E P O R T 2 0 0 68 8
ACCOUNTING POLICIES (continued)
for the year ended 30 June 2006
adopter however, shall assess whether an embedded derivative is required to be separated from the host contract
and accounted for as a derivative on the basis of the conditions that existed at the later of the date it first became
a party to the contract and the date of reassessment. This interpretation is consistent with the Group’s current
application of the standard.
3. CONSOLIDATIONThe consolidated financial statements include the assets, liabilities and results of the operations of the holding
company and its subsidiaries. Subsidiaries are companies in which Discovery, directly or indirectly, has the power
to exercise control over the operations. Discovery considers the existence and effect of potential voting rights that
are presently exercisable or convertible in determining control. Subsidiaries are consolidated from the date on
which Discovery acquires effective control. Consolidation is discontinued from the effective date control ceases.
Discovery consolidates a special purpose entity (“SPE”) when the substance of the relationship between
Discovery and the SPE indicates that Discovery controls the SPE.
Inter-group transactions, balances and unrealised gains on transactions between group companies are
eliminated. Unrealised losses are also eliminated unless the transaction provides evidence of impairment of the
asset transferred. Accounting policies of subsidiaries have been changed where necessary to ensure consistency
with the policies adopted by the Group.
Minority shareholders are treated as equity participants and, therefore, all acquisitions of minority interests or
disposals by the Group of its minority interests in subsidiary companies where control is maintained subsequent
to the disposal are accounted for as equity transactions with minorities. Consequently, the difference between
the purchase price and the book value of a minority interest purchased is recorded in equity. All profits and losses
arising as a result of the disposal of interests in subsidiaries to minorities, where control is maintained subsequent
to the disposal, are also recorded in equity.
Interests in subsidiaries in the company financial statements are shown at cost less any required impairment.
4. ASSOCIATESAssociates are entities in which Discovery has the ability to exercise significant influence but not control, generally
accompanying an equity interest of between 20% and 50%.
Discovery includes the results of associates in its consolidated financial statements using the equity accounting
method, from the effective date of acquisition to the effective date of disposal. The investment is initially recognised
at cost.
Profit includes Discovery’s share of earnings of associated companies. Discovery’s reserves include its share of post-
acquisition movements in reserves of associated companies. The cumulative post-acquisition movements are adjusted
against the cost of the investment in the associated company.
Discovery discontinues equity accounting when the carrying amount of the investment in an associated company
reaches zero, unless it has incurred obligations or guaranteed obligations in favour of the associated undertaking.
Discovery increases the carrying amount of investments by its share of the associated company’s income when
equity accounting is resumed.
Unrealised gains on transactions between Discovery and its associates are eliminated to the extent of Discovery’s
interest in the entity. Unrealised losses are also eliminated unless the transaction provides evidence of an
impairment of the asset transferred. Accounting policies of the investees have been changed where necessary to
ensure consistency with the policies adopted by Discovery.

D I S C O V E R Y A N N U A L R E P O R T 2 0 0 6 8 9
5. JOINT VENTURESJoint ventures are arrangements whereby the Group shares control over an economic activity with one or more parties.
Discovery accounts for interests in jointly controlled entities by proportionate consolidation. In terms of this methodDiscovery includes its share of a joint venture’s individual income, expense, assets and liabilities and cash flows in therelevant components of its financial statements. Accounting policies of joint ventures have been changed wherenecessary to ensure consistency with the policies adopted by Discovery.
6. FOREIGN CURRENCY TRANSLATION6.1 Functional and presentation currency
Items included in the financial statements of each of Discovery’s entities are measured using the currency of the primaryeconomic environment in which the entity operates (“the functional currency”). The consolidated financial statementsare presented in rand, which is the functional and presentation currency of Discovery Holdings Limited.
6.2 Transactions and balancesForeign currency transactions are translated into the functional currency using the exchange rates prevailing atthe dates of the transactions.
Foreign exchange gains and losses resulting from the settlement of such transactions and from the translation atyear-end exchange rates of monetary assets and liabilities denominated in foreign currencies are recognised inthe income statement, except when deferred in equity as qualifying cash flow hedges and qualifying netinvestment hedges. Amounts accumulated in equity are recycled to the income statement in the periods in whichthe hedged item affects profit or loss.
6.3 Group companiesThe results and financial position of all Discovery entities (none of which has the currency of a hyperinflationaryeconomy) that have a functional currency different from the presentation currency of Discovery are translatedinto the presentation currency as follows:
(i) assets and liabilities for each balance sheet presented are translated at the closing rate at the date of thatbalance sheet; and
(ii) income and expenses for each income statement are translated at average exchange rates (unless thisaverage is not a reasonable approximation of the cumulative effect of the rates prevailing on the transactiondates, in which case income and expenses are translated at the dates of the transactions).
Exchange differences arising from the translation of the net investment in foreign entities are recognised in theforeign currency translation reserve in equity. When a foreign operation is sold, such exchange differences arerecognised in the income statement as part of the gain or loss on sale.
7. RECOGNITION OF ASSETS7.1 Assets
Discovery recognises assets when it obtains control of a resource as a result of past events, and from which futureeconomic benefits are expected to flow to the enterprise.
7.2 Contingent assetsDiscovery discloses a contingent asset where, as a result of past events, it is highly likely that economic benefits willflow to it, but this will only be confirmed by the occurrence or non-occurrence of one or more uncertain futureevents which are not wholly within Discovery’s control.
8. LIABILITIES, PROVISIONS AND CONTINGENT LIABILITIES8.1 Liabilities and provisions
Discovery recognises liabilities, including provisions and on a company level provisions for financial guaranteesissued to Group companies, when:
• it has a present legal or constructive obligation as a result of past events;
• it is probable that an outflow of resources embodying economic benefits will be required to settle theobligation; and
• a reliable estimate of the amount of the obligation can be made.

D I S C O V E R Y A N N U A L R E P O R T 2 0 0 69 0
ACCOUNTING POLICIES (continued)
for the year ended 30 June 2006
8.2 Contingent liabilitiesDiscovery discloses a contingent liability where:
• it has a possible obligation arising from past events, the existence of which will be confirmed only by theoccurrence or non-occurrence of one or more uncertain future events not wholly within the control of theenterprise; or
• it is not probable that an outflow of resources will be required to settle an obligation; or
• the amount of the obligation cannot be measured with sufficient reliability.
9. OFFSETTING FINANCIAL INSTRUMENTSDiscovery offsets financial assets and liabilities and reports the net balance in the balance sheet only where:
• there is a legally enforceable right to set off; and
• there is an intention to settle on a net basis or to realise the asset and settle the liability simultaneously.
10. CASH AND CASH EQUIVALENTSIn the cash flow statement, cash and cash equivalents comprise:
• coins and bank notes;
• money at call and short notice; and
• balances with banks.
Cash and cash equivalents only include items held for the purpose of meeting short-term cash commitmentsrather than for investing or other purposes. Cash and cash equivalents have a maturity of less than three months.
11. FINANCIAL INSTRUMENTS11.1 General
Financial instruments carried on the balance sheet include all assets and liabilities, but exclude investments insubsidiary and associated companies, property and equipment, intangible assets, deferred income tax, deferredrevenue, provisions and assets and liabilities of insurance operations.
11.2 Financial assetsThe Group classifies its investments into the following categories:
• financial assets at fair value through profit or loss;
• available-for-sale financial assets; and
• loans and receivables.
Financial assets classified as fair value through profit or lossThis category has two sub-categories; financial assets held for trading and those designated at fair value throughprofit or loss at inception. A financial asset is classified into this category at inception if acquired principally for thepurpose of selling in the short-term or if so designated by management. Derivatives are also classified as held fortrading unless they are designated as hedges.
Loans and receivablesLoans and receivables are non-derivative financial assets with fixed or determinable payments that are not quotedin an active market other than those that the Group designated as held at fair value through profit and loss.
Financial assets classified as available-for-saleAvailable-for-sale financial assets are non-derivative financial assets that are either designated in this category ornot classified in any of the other categories. Available-for-sale investments are those intended to be held for anindefinite period of time, which may be sold in response to needs for liquidity or changes in interest rates,exchange rates or equity prices.
The classification depends on the purpose when the asset was acquired and, with the exception of those held as fairvalue through profit or loss, is reassessed on an annual basis.
D I S C O V E R Y A N N U A L R E P O R T 2 0 0 6 9 1
11.2.1 Initial measurementPurchases and sales of financial assets are recognised on settlement date, which is the date on which the Groupassumes or transfers substantially all risks and rewards of ownership. Financial assets are initially recognised atfair value plus, in the case of financial assets not at fair value through profit and loss, transaction costs directlyattributable to the acquisition of the financial asset.
11.2.2 Subsequent measurementFinancial assets classified as fair value through profit or loss or as available-for-sale are subsequently carried atfair value. Fair values are based on regulated exchange quoted ruling bid prices at the close of business on thelast trading day on or before the balance sheet date. Collective Investments are valued at their repurchase price.For unquoted investments the Group establishes fair value by using valuation techniques. These includereference to other instruments that are substantially the same, discounted cash flow and option pricing.
Discovery recognises realised and unrealised gains and losses arising from changes in the fair value of financialassets classified as fair value through profit or loss, directly in profit and loss. Discovery recognises unrealisedgains and losses arising from changes in the fair value of available-for-sale assets, in equity. It recognises interestincome on these assets as part of interest income, based on the instrument’s original effective rate. Interestincome is excluded from the fair value gains and losses reported in equity. Dividends on available-for-sale equityinstruments are recognised in the income statement when the entity’s right to receive payment is established.
When these assets are disposed of or impaired, the related accumulated fair value adjustments are included inthe income statement as realised gains and losses.
Loans and receivablesLoans and receivables are carried at amortised cost through the income statement using the effective interestrate method less any required impairment.
11.3 Financial liabilities11.3.1 Initial recognition
Policyholder contracts that do not transfer significant insurance risk are classified in the financial statements asfinancial liabilities held at fair value through profit and loss (“investment contracts”), with changes in fair valuebeing accounted for in the income statement. The premiums and benefit payments relating to these investmentcontract financial liabilities have been excluded from the income statement and are accounted for directly as partof the liability.
11.3.2 Subsequent recognition and measurementInvestment contracts are financial liabilities whose fair value is dependent on the fair value of underlying financialassets and are designated at inception as at fair value through profit or loss. Valuation techniques are used toestablish the fair value at inception and each reporting date.
The Group’s main valuation techniques incorporate all factors that market participants would consider and arebased on observable market data. The fair value of a unit-linked financial liability is determined using the currentunit values that reflect the fair values of the financial assets contained within the Group’s unitised investmentfunds linked to the financial liability, multiplied by the number of units attributed to the contract holder at thebalance sheet date. If the investment contract is subject to a put or surrender option, the fair value of thefinancial liability is never less than the amount payable on surrender, discounted for the required notice period,where applicable.
11.4 Derecognition of assets and liabilitiesDiscovery derecognises an asset when the contractual rights to the asset expires, where there is a transfer of thecontractual rights that comprise the asset, or Discovery retains the contractual rights of the assets but assumesa corresponding liability to transfer these contractual rights to another party and consequently transferssubstantially all the risks and benefits associated with the asset.
Where Discovery retains substantially all the risks and rewards of ownership of the financial asset, Discovery continues
to recognise the financial asset.

D I S C O V E R Y A N N U A L R E P O R T 2 0 0 69 2
ACCOUNTING POLICIES (continued)
for the year ended 30 June 2006
If a transfer does not result in derecognition because Discovery has retained substantially all the risks and rewards
of ownership of the transferred asset, Discovery continues to recognise the transferred asset in its entirety and
recognises a financial liability for the consideration received. In subsequent periods, Discovery recognises any
income on the transferred asset and any expense incurred on the financial liability.
Where Discovery neither transfers nor retains substantially all the risks and rewards of ownership of the financial
asset, Discovery shall determine whether it has retained control of the financial asset. In this case:
(i) if Discovery has not retained control, it shall derecognise the financial asset and recognise separately as assets
or liabilities any rights and obligations created or retained in the transfer;
(ii) if Discovery has retained control, it shall continue to recognise the financial asset to the extent of its
continuing involvement in the financial asset.
12. IMPAIRMENT12.1 Impairments of financial assets
Discovery assesses at each balance sheet date whether there is objective evidence that a financial asset or group
of financial assets is impaired. A financial asset is impaired if one or more events that have occurred after the
initial recognition of the asset have caused the carrying amount to be greater than its estimated recoverable
amount. Objective evidence includes the following events;
• significant financial difficulty of the issuer or debtor;
• a breach of contract, such as default or delinquency in payments;
• adverse changes in the payment status of issuers or debtors in the Group;
• national or local economic conditions that correlate with defaults on assets in the Group; or
• in the case of equities classified as available-for-sale, a significant or prolonged decline in the fair value of the
security below its cost.
If there is objective evidence that an impairment loss on loans and receivables carried at amortised cost has been
incurred, the amount of the loss is measured as the difference between the asset’s carrying amount and the
present value of estimated future cash flows discounted at the financial asset’s original effective interest rate. The
carrying amount of the asset is reduced and the amount of the loss is recognised in the income statement.
If there is objective evidence that an available-for-sale financial asset has been impaired, the cumulative loss –
measured as the difference between the acquisition cost and the current fair value, less any impairment loss on
that financial asset previously recognised in profit or loss – is removed from equity and recognised in the income
statement.
Other than for equity instruments carried at available-for-sale, which are reversed through equity, previously
recognised impairment losses are reversed through the income statement. Reversal of impairment losses are
limited to ensure that the carrying value of the asset does not exceed the carrying amount that would have been
determined (net of depreciation or amortisation) had no impairment loss been recognised in prior years.
12.2 Impairments of other assetsAssets that are subject to amortisation are reviewed for impairment whenever events or changes in circumstances
indicate that the carrying amount may not be recoverable. Such indicators include continued losses, changes in
technology, market, economic, legal and operating environments.
An impairment loss is recognised for the amount by which the asset’s carrying amount exceeds its recoverable
amount. The recoverable amount is measured using the higher of the fair value less costs to sell and the value-
in-use. Value-in-use is the present value of projected cash flows covering the remaining useful life of the asset.
An impairment charge is recognised as a loss in the income statement immediately.

D I S C O V E R Y A N N U A L R E P O R T 2 0 0 6 9 3
13. DERIVATIVE FINANCIAL INSTRUMENTS AND HEDGINGDiscovery initially recognises derivative financial instruments in the balance sheet at fair value and subsequently re-
measures these instruments at their fair value.
The fair value of publicly traded derivatives are based on quoted bid prices for assets held or liabilities to be
issued, and current offer prices for assets to be acquired and liabilities held.
The method of recognising the resulting fair value gain or loss depends on whether the derivative is designated
as a hedging instrument, and if so, the nature of the item being hedged. Discovery designates certain derivatives
as either:
• hedges of the fair value of recognised assets or liabilities or firm commitments (fair value hedge); or
• hedges of highly probable future cash flows attributable to a recognised asset or liability, or a forecasted
transaction (cash flow hedge).
Discovery documents at the inception of the transaction the relationship between hedging instruments and hedged
items, as well as its risk management objective and strategy for undertaking various hedge transactions. Discovery
also documents its assessment, both at hedge inception and on an ongoing basis, of whether the derivatives that are
used in hedging transactions are highly effective in offsetting changes in fair values or cash flows of hedged items.
13.1 Fair value hedgeChanges in the fair value are recorded in the income statement, together with any changes in the fair value of
the hedged asset or liability that are attributable to the hedged risk.
13.2 Cash flow hedgeDiscovery recognises fair value changes of derivatives that are designated and qualify as cash flow hedges and
prove to be highly effective in relation to the hedged risk, in the cash flow hedging reserve in equity. The gain
or loss relating to the ineffective portion is recognised immediately in the income statement.
Amounts accumulated in equity are recycled to the income statement in the periods in which the hedged item
will affect profit or loss (for example, when the forecast sale that is hedged takes place).
Where the forecasted transaction or a foreign currency firm commitment results in the recognition of a non-
financial asset or a liability, the gains and losses previously deferred in equity are transferred from equity and
included in the initial measurement of the cost of the non-financial asset or liability.
When a hedging instrument expires or is sold, or when a hedge no longer meets the criteria for hedge accounting,
any cumulative gain or loss existing in equity at that time remains in equity and is recognised when the forecast
transaction is ultimately recognised in the income statement. When a forecast transaction is no longer expected to
occur, the cumulative gain or loss that was reported in equity is immediately transferred to the income statement.
14. PROPERTY AND EQUIPMENTDiscovery carries property and equipment at historical cost less depreciation and impairment. Historical cost includes
expenditure that is directly attributable to the acquisition of the items.
Subsequent costs are included in the asset’s carrying amount or are recognised as a separate asset, as appropriate,
only when it is probable that future economic benefits associated with the item will flow to Discovery and the cost
of the item can be measured reliably.
Property and equipment are depreciated on a straight-line basis at rates calculated to reduce the book value of
these assets to estimated residual values over their expected useful lives.
Properties held under finance leases are further broken down into significant components that are depreciatedto their respective residual values over the economic lives of these components.
D I S C O V E R Y A N N U A L R E P O R T 2 0 0 69 4
ACCOUNTING POLICIES (continued)
for the year ended 30 June 2006
The average periods of depreciation used are as follows:
Leasehold premises Shorter of estimated life or period of lease
Property held under finance lease
– Buildings and structures 50 years
– Mechanical and electrical components 20 years
– Sundries 20 years
Computer equipment and operating systems 3 years
Furniture and fittings 6 years
Motor vehicles 4 years
Office equipment 5 years
Computer software packages 3 years
The assets’ residual values and useful lives are reviewed, and adjusted if appropriate, at each balance sheet date.
An asset’s carrying amount is written down immediately to its recoverable amount if the asset’s carrying amount
is greater than its estimated recoverable amount. The recoverable amount is the higher of the asset’s fair value
less costs to sell and value in use.
Repairs and maintenance are charged to the income statement during the financial period in which they
are incurred.
Gains or losses on disposals are determined by reference to the carrying amount of the asset and the net
proceeds received, and are recorded in the income statement on disposal.
15. LEASES15.1 Finance leases
Discovery classifies leases as property and equipment where it assumes substantially all the benefits and risks of
ownership as finance leases.
Finance leases are capitalised as assets at the fair value of the leased asset at the inception of the lease, or, if
lower, at the estimated present value of the underlying lease payments. Discovery allocates each lease payment
between the liability and finance charges to achieve a constant rate on the finance balance outstanding. The
interest component of the finance charge is charged to the income statement over the lease period. The property
and equipment acquired are depreciated over the useful life of the assets, unless it is not probable that Discovery
will take ownership of the assets, in which case the assets are depreciated over shorter of the useful life of the
asset or the lease period, on a basis consistent with similar owned fixed assets.
15.2 Operating leasesDiscovery classifies leases of assets, where the lessor effectively retains the risks and benefits of ownership, as
operating leases. Operating lease payments are charged to the income statement on a straight-line basis over
the period of the lease. Minimum rentals due after year-end are reflected under commitments.
Discovery recognises as an expense any penalty payment to the lessor for early termination of an operating lease
before the lease period has expired, in the period in which termination takes place.
16. INTANGIBLE ASSETS16.1 Computer software development costs
Where computer software development costs can be clearly associated with a strategic and unique system which
will result in a benefit for Discovery exceeding the costs incurred for more than one accounting period, Discovery
capitalises such costs and recognises them as an intangible asset.
Discovery carries capitalised software assets at cost less amortisation and any impairment losses. It amortises these
assets on a straight-line basis at a rate applicable to the expected useful life of the asset, but not exceeding three
years. Management reviews the carrying value wherever objective evidence of impairment exists. Carrying value is
written down to estimated recoverable amount when a permanent decrease in value occurs. Any impairment is
recognised in the income statement when incurred.

D I S C O V E R Y A N N U A L R E P O R T 2 0 0 6 9 5
16.2 Deferred acquisition costs – Investment contractsDeferred acquisition costs on investment contracts represents the contractual customer relationship and the right
to receive future investment management fees. Incremental costs directly attributable to securing rights to receive
policy fees for services sold with investment contracts are recognised as an intangible asset where they can be
identified separately and measured reliably and it is probable that they will be recovered. An incremental cost is
one that would not have been incurred if the Group had not secured the investment contract.
The asset represents the Group’s contractual right to benefit from providing asset management services and is
amortised on a straight-line basis over the period in which the Group expects to recognise the related revenue.
The costs of securing the right to provide asset management services do not include transaction costs relating to
the origination of the investment contracts.
16.3 Deferred acquisition costs – Insurance contractsThe accounting policy for deferred acquisition costs relating to insurance contracts are detailed in accounting
policy 22.11.
16.4 Other intangible assetsDiscovery does not attribute value to internally developed trademarks, patents and similar rights and assets,
including franchises and management contracts.
Discovery generally expenses the costs incurred on trademarks, patents and similar rights and assets, whether
purchased or created by it, to the income statement in the period in which the costs are incurred.
Amortisation and impairments of intangible assets are reflected under acquisition costs in the income statement.
17. DEFERRED INCOME TAXDiscovery calculates deferred income tax on all temporary differences using the balance sheet based approach.
It calculates deferred tax liabilities or assets by applying corporate tax rates that have been substantially enacted
to the temporary differences existing at each balance sheet date between the tax values of assets and liabilities
and their carrying amount, where such temporary differences are expected to result in taxable or deductible
amounts in determining taxable income for future periods when the carrying amount of the assets or liabilities
are recovered or settled.
Discovery recognises deferred tax assets if the directors of Discovery consider it probable that future taxable
income will be available against which the unused tax losses can be utilised.
Temporary differences arise primarily from the difference between accounting and tax balances arising from
insurance contracts, depreciation of property and equipment, effect of accounting for leases as a finance lease,
effect of straight-lining of operating leases, revaluation of certain financial assets and liabilities, provisions for
leave pay and tax losses carried forward. However, the deferred income tax is not accounted for if it arises from
initial recognition of an asset or liability in a transaction other than a business combination that at the time of
the transaction affects neither accounting nor taxable profit nor loss.
Deferred tax related to fair value re-measurement of available-for-sale investments and cash flow hedges, which are
charged or credited directly to equity, is also credited or charged directly to equity and is subsequently recognised in the
income statement together with the deferred gain or loss.
18. EMPLOYEE BENEFITS18.1 Post-employment benefits
Discovery operates defined contribution schemes, the assets of which are held in separate trustee-administered funds.
These funds are registered in terms of the Pension Funds Act, 1956, and membership is compulsory for all
Discovery employees.
For defined contribution plans, Discovery pays contributions to privately administered pension insurance plans on a
mandatory basis. Discovery has no further payment obligations once the contributions have been paid. The
contributions are recognised as an employee benefit expense when they are due.

D I S C O V E R Y A N N U A L R E P O R T 2 0 0 69 6
ACCOUNTING POLICIES (continued)
for the year ended 30 June 2006
18.2 Post-retirement medical benefitsDiscovery has no liability for the post-retirement medical benefits of employees.
18.3 Termination benefitsDiscovery recognises termination benefits as a liability in the balance sheet and as an expense in the income
statement when it has a present obligation relating to termination.
18.4 Leave pay provisionDiscovery recognises in full employees’ rights to annual leave entitlement in respect of past service.
18.5 Profit share and bonus planDiscovery recognises a liability and an expense for bonuses and profit-sharing, based on a formula where there
is a contractual obligation or where there is a past practice that has created a constructive obligation.
19. SHARE CAPITAL19.1 Share issue costs
Costs directly related to the issue of new shares or options are shown as a deduction from equity.
19.2 Dividends paidDividends on ordinary shares are recognised against equity in the period in which they are approved by the
company’s shareholders. Dividends declared after the balance sheet date are not recognised but disclosed as a
post-balance sheet event.
20. SEGMENT REPORTINGDiscovery defines a segment as a distinguishable component or business that provides either:
• unique products or services (“business segment”); or
• products or services within a particular economic environment (“geographical segment”)
subject to risks and rewards that are different from those of other segments.
Segments with a majority of revenue earned from charges to external customers and whose revenue, results or
assets are 10% or more of all the segments, are reported separately.
21. SHARE-BASED PAYMENT TRANSACTIONSDiscovery operates equity-settled and cash settled share-based compensation plans.
21.1 Equity-settled share-based compensation plansDiscovery expenses the fair value of the employee services received in exchange for the grant of the options,
over the vesting period of the options, as employee costs, with a corresponding credit to a share-based payment
reserve. The total value of the services received is calculated with reference to the fair value of the options on
grant date.
The fair values of the options are determined excluding non-market vesting conditions. These vesting conditions
are included in the assumptions of the number of options expected to vest. At each balance sheet date,
Discovery revises its estimate of the number of options expected to vest. Any changes to the estimated number
of options are recognised in profit and loss immediately.
21.2 Cash-settled share-based compensation plansDiscovery recognises employee services received in exchange for cash-settled share-based payments at the fair
value of the liability incurred and expenses these services over the vesting period of the benefits, as employee costs.
The liability is remeasured at each balance sheet date to its fair value, with all changes recognised immediatelyin profit or loss.
D I S C O V E R Y A N N U A L R E P O R T 2 0 0 6 9 7
22. POLICIES RELATING TO INSURANCE OPERATIONS (“THE INSURANCE OPERATIONS”)The Group developed its accounting policies for insurance contracts before the adoption of IFRS 4 and to apply thesame accounting policies for the recognition and measurement of obligations arising from insurance contracts that itissues and reinsurance contracts that it holds.
22.1 Product classificationDiscovery Life issues contracts that transfer insurance risk or financial risk or a combination of both.
Contracts are classified as insurance contracts if Discovery Life accepts significant insurance risk. Insurance riskis defined as a risk that on the occurrence of a defined uncertain insured event, the amount paid may significantlyexceed the amount payable should that event not have occurred. Such contracts may also transfer financial risk.
Investment contracts are contracts that transfer financial risk without significant insurance risk. Financial riskrefers to the risk of a possible future change in the value of an asset or financial instrument due to a change ininterest rate, commodity price, index of prices, foreign exchange rate or other measurable variable.
22.2 Assets and liabilities arising from insurance contractsInsurance contracts – Individual LifeFor the published accounts, the actuarial value of policyholder liabilities is determined based on the FinancialSoundness Valuation (FSV) method as detailed in Professional Guidance Note (PGN) 104 issued by the ActuarialSociety of South Africa (ASSA).
Where the value of policyholder liabilities is negative, this is shown as an asset under insurance contracts.
The FSV basis is a prospective, discounted cash flow basis calculated as the difference between the present valueof future benefit payments plus expenses and the present value of future premiums. The FSV basis uses bestestimate assumptions regarding the future experience of claims experience, premium income, expenses andcommission. Where the same policy includes both insurance and investment components and where the policyis classified as an insurance policy, the liability for the insurance benefits and investment benefits is separatelycalculated under the FSV methodology.
Liabilities for investment benefits where benefits are in part dependent on the performance of underlyinginvestment portfolios are taken as the aggregate value of the policies’ investment in the investment portfolio atthe valuation date.
Applying the FSV calculation on the best estimate basis, described above, results in a gain at initial recognitionin excess of initial expenses. Compulsory and discretionary margins are therefore added to the best estimateassumption to avoid the premature recognition of future profits. At initial recognition profits are recognised tothe extent of the actual acquisition costs incurred but considering the premium loadings available on the totalportfolio to recoup acquisition costs.
Discretionary and compulsory margins are therefore added to the best estimate assumptions within the following framework:
• All margins are at least equal to the compulsory margins prescribed by PGN 104. The compulsory marginsensure a minimum level of financial resilience.

D I S C O V E R Y A N N U A L R E P O R T 2 0 0 69 8
ACCOUNTING POLICIES (continued)
for the year ended 30 June 2006
The following compulsory margins are added to the best estimate assumptions:
Margin Compulsory minimum
Discount rate 0.25% reduction or increase to the discount rate in
direction to increase overall insurance liabilities
Renewal expense inflation rate 10% increase in the inflation rate, i.e. from x% to 1.1* x%
Renewal expenses 10% increase in the renewal expense assumption
Mortality incidence rates 7.5% increase in the mortality incidence rate
Morbidity incidence rates 10% increase in the morbidity incidence rate
Management fees on assets
under management 0.25% reduction in the management fee
Lapse rates 25% increase or decrease in direction to increase overall
insurance liability. (i.e. from y% to 0.75* y% or to
1.25* y%)
For the discount rate and lapse rate compulsory margins, the direction of the margins vary based on policyduration to ensure that the margin is in the conservative direction, overall. Both the discount rate and lapserate margins are initially additions to the best estimate rate but switch to reductions from the best estimaterate at later durations. The point where the margin changes direction is set considering the profitability of thetotal portfolio and considering broad durational groupings.
• Given the level of uncertainty in the best estimate assumptions for lapse, mortality and morbidity, additionalmargins are added over and above the compulsory margins to protect against future possible adverseexperience.
• Additional margins are added to allow for the release of profit over the term of the policy.
• Margins are released over the term of a policy in-line with the risk born.
• The best estimate and margins are reset at every valuation date to reflect the underlying profitability of the portfolio.
• Assets under insurance contracts are not used to offset the liability under the pure investment benefits of the policy.
In the valuation of policyholder liabilities, it has been assumed that all policyholders change to plans withminimum premium increases without changing the cover levels at the valuation date. This is in line with PGN104 which requires that expected profits in respect of future options that may be taken up by policyholdersshould not be recognised in the policyholder liability.
The actuarial liabilities are calculated gross of reinsurance. The expected impact of reinsurance is valued separately.
The FSV basis meets the requirement of the liability adequacy test as required by IFRS 4 for individual businessand no additional tests are performed.
Acquisition costs for insurance contracts represent commission and other costs that relate to the securing ofnew contracts and the renewing of existing contracts. The FSV basis for valuing insurance contracts makesimplicit allowance for the deferral of acquisition costs and hence no explicit deferred acquisition cost asset isrecognised in the balance sheet for insurance contracts.

D I S C O V E R Y A N N U A L R E P O R T 2 0 0 6 9 9
22.3 Liabilities arising from insurance contractsIndividual Life (including the Health Plan Protector)Where a claim is reported but not yet validated, an estimate of the expected claim amount is included in theclaims reported included in liabilities under insurance contracts. The estimate is determined taking into accountthe likelihood of the claim being valid and the expected severity of the claim given that the claim is valid. Theproportion to be included is estimated separately for each benefit type.
Liabilities are held to reflect IBNR claims. The IBNR is modified to reflect actual current operating conditions.
The liabilities are calculated gross of reinsurance. An asset is then raised to allow for the expected recoveries from reinsurers.
Group LifeWhere a claim is reported but not yet validated, an estimate of the expected claim is included in the claimsreported included in liabilities under insurance contracts.
Liabilities are held to reflect IBNR claims. The IBNR is estimated based on the actual incidence of historic reportedclaims. The IBNR is calculated on the risk premiums net of profit loadings as this represents the best estimate offuture claims experience. The IBNR is further modified to reflect current operational conditions or known events.
The liabilities are calculated gross of reinsurance. An asset is then raised to allow for the expected recovery from reinsurers.
Health insuranceThe Health IBNR calculation is performed using the chain ladder approach. This allows for the historic patternsof claims payment in determining the likely future emergence of claims. The IBNR is further modified to reflectcurrent operational conditions or known events.
22.4 Embedded derivativesA unit-linked insurance contract is an insurance contract with an embedded derivative linking payments on thecontract to units of an internal investment fund set up by the Group with the consideration received from thecontract holders. This embedded derivative meets the definition of an insurance contract and is not thereforeaccounted for separately from the host insurance contract. The liability for such contracts is adjusted for allchanges in the fair value of the underlying assets.
The Group does not separately measure embedded derivatives that meet the definition of an insurance contract oroptions to surrender insurance contracts for a fixed amount (or amount based on a fixed amount and an interestrate). All other embedded derivatives are separated and carried at fair value if they are not closely related to the hostinsurance contract and meet the definition of a derivative. Embedded derivatives that are separated from the hostcontract are fair valued through income.
22.5 Reinsurance contractsContracts entered into by Discovery with reinsurers under which it is compensated for losses on one or morecontracts issued by Discovery and that meet the classification requirements for insurance contracts are classifiedas reinsurance contracts held. Contracts that do not meet these classification requirements are classified asfinancial assets.
Amounts recoverable from or due to reinsurers are measured consistently with the amounts associated with thereinsured insurance contracts and in accordance with the terms of each reinsurance contract.
The amounts Discovery is required to pay under its reinsurance contracts held are recognised as reinsuranceliabilities (liabilities arising from reinsurance contracts).
The amounts due to Discovery under its reinsurance contracts held are recognised as reinsurance assets (classifiedwithin loans and receivables). Discovery assesses its reinsurance assets for impairment on an annual basis followingthe same method used for financial assets.
In certain cases there is a gain or loss at inception of a reinsurance contract. Any gains or losses on entering intothese contracts are amortised over the life of the insurance policies on the same basis as the profit is expectedto emerge. The unearned portion of the gain or loss is included in deferred revenue. The gain is disclosed inreinsurance premiums in the income statement.
D I S C O V E R Y A N N U A L R E P O R T 2 0 0 61 0 0
ACCOUNTING POLICIES (continued)
for the year ended 30 June 2006
22.6 Receivables and payables related to insurance and investment contractsReceivables and payables are recognised when due. These include amounts due to and from agents, brokers andinsurance contract holders. Discovery assesses its receivables for impairment on an annual basis following thesame method used for financial assets.
22.7 Premium incomePremiums and annuity considerations receivable under insurance contracts are stated gross of commission, and
exclude taxes and levies and are recognised when due.
All premiums are recognised as income other than amounts received under investment contracts which are
recorded as deposits to investment contract liabilities.
Health insurance premiums received in respect of annual contracts are recognised proportionally over the period
of the coverage. The portion of the premium received on in-force contracts that relates to unexpired risks at the
balance sheet date is reported as unearned premiums within liabilities arising from insurance contracts. The
unearned premium income is amortised on a straight-line basis.
22.8 Fees on investment contractsFees charged for investment management services provided in conjunction with asset management and
investment contracts are recognised as revenue as the services are provided. Fees on investment contracts are
included in fee income.
22.9 Policyholder benefitsPolicyholder benefits paid under insurance contracts include maturities, surrenders, death, disability and severe
illness payments.
Maturity and income disability are recorded as incurred. Death, disability and severe illness and surrender claims are
accounted for when notified.
Group life benefits and benefits payable under health insurance contracts are accounted for as incurred. Provision
is made for the estimated costs of benefits (together with anticipated recoveries under re-insurance arrangements)
notified but not settled at the balance sheet date.
Amounts paid under investment contracts are recorded as deductions from investment contract liabilities.
22.10 Acquisition costsCommission payments for insurance contracts comprise all direct costs arising from the sale of insurance
contracts. Commissions are expensed as incurred except for commissions relating to short-term health insurance
business where commissions are deferred.
22.11 Deferred acquisition costs (“DAC”)The direct costs (commissions) of acquiring short-term health insurance business which are incurred during the
year but which are expected to be recoverable out of future revenue margins are deferred and disclosed as an
asset in the balance sheet, gross of tax. The costs are deferred over the period of the contract and amortised on
a straight-line basis in line with unearned premiums.
22.12 Liability adequacy testAt balance sheet date, liability adequacy tests are performed to ensure the adequacy of the contract liabilities net
of related DAC. In performing these tests, current best estimates of future contractual cash flows and claims
handling and administration expenses, as well as investment income from the assets backing such liabilities are
used. Any deficiency is immediately charged to profit or loss initially by writing off DAC and by subsequently
establishing a provision for losses arising from liability adequacy test.
D I S C O V E R Y A N N U A L R E P O R T 2 0 0 6 1 0 1
23. REVENUE23.1 Insurance premiums revenue
Insurance premium revenue includes individual life premiums, group life premiums, health insurance premiums. These
are accounted for as described in accounting policy 22.7.
23.2 Fee income on health administration businessAdministration fees and managed care fees are included in fee income. These are accounted for as the services
are provided.
23.3 Investment incomeInvestment income comprises interest and dividends received on available-for-sale investments, assets held at
amortised cost and cash and cash equivalents.
Discovery recognises dividends on the “last day to trade” for listed shares, and on the “date of declaration” for
unlisted shares. Dividend income includes scrip dividends, irrespective of whether there is an option to receive cash
instead of shares.
Interest is accounted for on an accrual basis using the effective interest rate method.
23.4 Net realised gainsNet realised gains comprise realised gains and losses received on available-for-sale financial instruments. These
gains and losses are accounted for on disposal of the investment.
23.5 Net fair value gains on financial assets at fair value through profit and lossNet fair value gains on financial assets at fair value through profit and loss include gains arising from interest,
dividends and net realised and unrealised gains on financial instruments held at fair value through profit and loss.
23.6 Vitality incomeVitality income includes Vitality contributions and sales of benefits offered by Vitality which are accounted for as
the services are rendered.
24. MARKETING AND ADMINISTRATION EXPENSESMarketing and administration expenses include marketing and development expenditure as well as all other non-
commission related expenditure and benefits paid under the Vitality programme and are expensed as incurred.
25. FINANCE COSTSBorrowing costs are expensed when incurred and these are included in finance costs.
26. TAXATIONTaxation includes South African and foreign jurisdiction corporate tax payable, as well as secondary tax on
companies and capital gains tax.
The charge for current tax is based on the results for the year as adjusted for items which are non-taxable or
disallowed. It is calculated using taxation rates that have been enacted or substantively enacted by the balance
sheet date, in each particular jurisdiction within which the Discovery entities operate.
Taxation in respect of the South African life insurance operations is determined using the four fund method
applicable to life insurance companies.
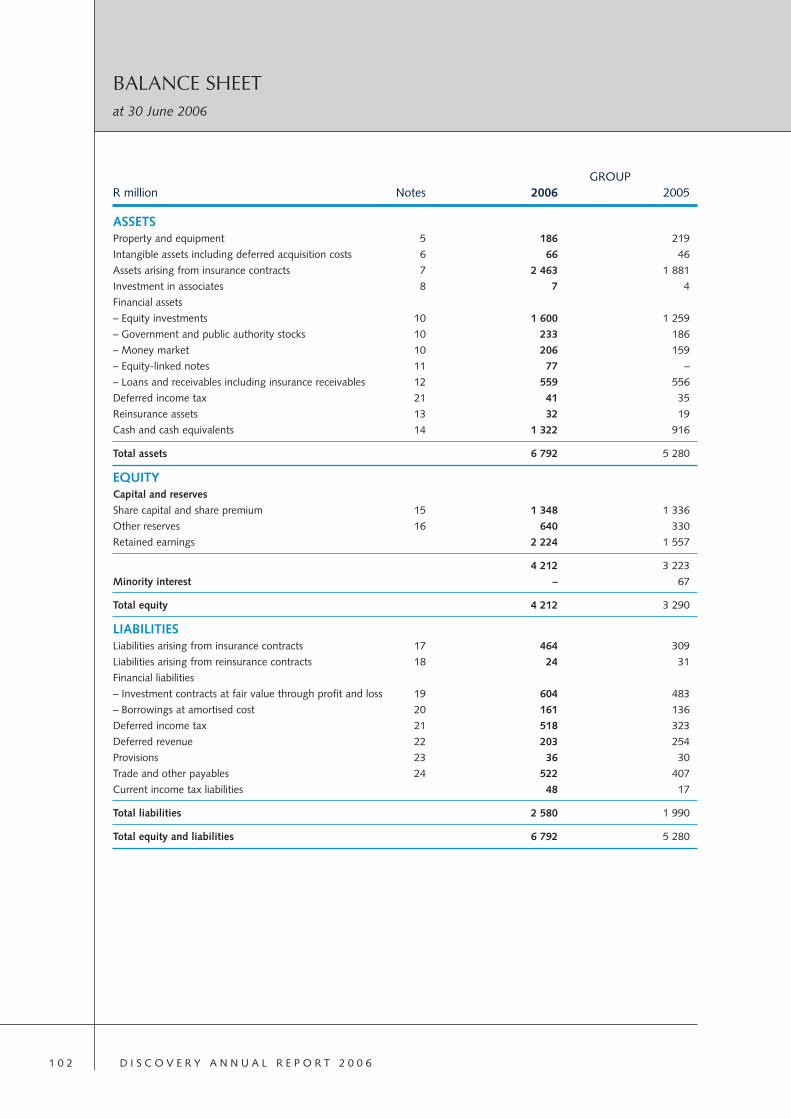
D I S C O V E R Y A N N U A L R E P O R T 2 0 0 61 0 2
BALANCE SHEETat 30 June 2006
ASSETSProperty and equipment 5 186 219
Intangible assets including deferred acquisition costs 6 66 46
Assets arising from insurance contracts 7 2 463 1 881
Investment in associates 8 7 4
Financial assets
– Equity investments 10 1 600 1 259
– Government and public authority stocks 10 233 186
– Money market 10 206 159
– Equity-linked notes 11 77 –
– Loans and receivables including insurance receivables 12 559 556
Deferred income tax 21 41 35
Reinsurance assets 13 32 19
Cash and cash equivalents 14 1 322 916
Total assets 6 792 5 280
EQUITYCapital and reserves
Share capital and share premium 15 1 348 1 336
Other reserves 16 640 330
Retained earnings 2 224 1 557
4 212 3 223
Minority interest – 67
Total equity 4 212 3 290
LIABILITIESLiabilities arising from insurance contracts 17 464 309
Liabilities arising from reinsurance contracts 18 24 31
Financial liabilities
– Investment contracts at fair value through profit and loss 19 604 483
– Borrowings at amortised cost 20 161 136
Deferred income tax 21 518 323
Deferred revenue 22 203 254
Provisions 23 36 30
Trade and other payables 24 522 407
Current income tax liabilities 48 17
Total liabilities 2 580 1 990
Total equity and liabilities 6 792 5 280
GROUPR million Notes 2006 2005

D I S C O V E R Y A N N U A L R E P O R T 2 0 0 6 1 0 3
Insurance premium revenue 2 824 1 838
Reinsurance premiums (456) (378)
Net insurance premiums 25 2 368 1 460
Fee income 1 961 1 670
Investment income 26 161 106
Net realised gains 27 157 53
Net fair value gains on financial assets at fair value
through profit and loss 28 121 122
Vitality income 654 521
Net income 5 422 3 932
Insurance benefits and claims (1 348) (828)
Insurance claims recovered from reinsurers 374 251
Net insurance benefits and claims 29 (974) (577)
Acquisition costs 30 (908) (714)
Marketing and administration expenses 31,32 (2 624) (2 168)
Transfer from assets/liabilities under
insurance contracts 7,17,18 468 572
Fair value adjustment to liabilities under
investment contracts 19 (121) (122)
Profit before BEE expenses 1 263 923
BEE expenses 32 (161) –
Profit from operations 1 102 923
Finance costs 33 (21) (64)
Foreign exchange loss – unrealised 34 (7) (8)
Share of profit from associate 8 2 2
Profit before taxation 1 076 853
Taxation 35 (410) (305)
Profit for the year 666 548
Attributable to:
Equity holders 669 557
Minority interests (3) (9)
666 548
Earnings per share for profit attributable to the
equity holders during the year (cents): 36
– basic 126.5 107.3
– diluted 121.0 103.0
GROUPR million Notes 2006 2005
INCOME STATEMENTfor the year ended 30 June 2006

D I S C O V E R Y A N N U A L R E P O R T 2 0 0 61 0 4
Cash flow from operating activities 580 408
Cash generated by operations 37.1 656 585
Dividends received 33 23
Interest received 122 72
Interest paid (22) (93)
Taxation paid 37.2 (209) (179)
Cash flow from investing activities (138) (210)
Net purchases of investments (46) (77)
Purchases of property and equipment (59) (106)
Proceeds on disposal of property and equipment 1 –
Purchase of intangible assets (34) (30)
Decrease in loans receivable – 3
Cash flow from financing activities (39) (134)
Proceeds from issuance of ordinary shares 37.3 23 71
Share issue costs written off against share capital (4) (1)
Dividends paid to Destiny Health preference shareholders (1) (1)
Minority share buy-back (6) (1)
Redemption of Destiny preference shares (67) –
Increase/(repayment) of borrowings 37.4 16 (202)
Net increase in cash and cash equivalents 403 64
Cash and cash equivalents at beginning of year 916 845
Exchange gains on cash and cash equivalents 3 7
Cash and cash equivalents at end of year 14 1 322 916
GROUPR million Notes 2006 2005
CASH FLOW STATEMENTfor the year ended 30 June 2006

D I S C O V E R Y A N N U A L R E P O R T 2 0 0 6 1 0 5
(note 15) (note 16)
30 June 2005
Balance at 1 July 2004 1 276 1 002 114 67 2 459
Issue of capital 61 – – 9 70
Share issue expenses (1) – – – (1)
Profit for the period – 557 – (9) 548
Dividends paid to Destiny Health
preference shareholders – (1) – – (1)
Realised loss on minority share buy-back – (1) – – (1)
Unrealised gains on investments – – 240 – 240
Capital gains tax on unrealised gains on investments – – (34) – (34)
Realised gains on investments transferred to
income statement – – (53) – (53)
Capital gains tax on realised gains on investments – – 5 – 5
Translation of foreign entities – – 29 – 29
Movement in share-based payment reserve – – 20 – 20
Transfer to hedging reserve – – 9 – 9
Balance at 30 June 2005 1 336 1 557 330 67 3 290
30 June 2006
Balance at 1 July 2005 1 336 1 557 330 67 3 290
Issue of capital 16 – – 3 19
Share issue expenses (4) – – – (4)
Profit for the period – 669 – (3) 666
Dividends paid to Destiny Health
preference shareholders – (1) – – (1)
Realised loss on minority share buy-back – (1) – – (1)
Unrealised gains on investments – – 288 – 288
Capital gains tax on unrealised gains on investments – – (39) – (39)
Realised gains on investments transferred to
income statement – – (157) – (157)
Capital gains tax on realised gains on investments – – 18 – 18
Movement in share-based payment reserve – – 185 – 185
Translation of foreign entities – – 14 – 14
Transfer to hedging reserve – – 1 – 1
Redemption of Destiny preference shares – – – (67) (67)
Balance at 30 June 2006 1 348 2 224 640 – 4 212
Of the R2 224 million held in retained income, R665 million is distributable. The balance is held to meet the capital
requirements in various Group companies.
Attributable to equity holders
Share capital and share Retained Other Minority
R million premium earnings reserves interest Total
STATEMENT OF CHANGES IN EQUITYfor the year ended 30 June 2006
D I S C O V E R Y A N N U A L R E P O R T 2 0 0 61 0 6
NOTES TO THE ANNUAL FINANCIAL STATEMENTSfor the year ended 30 June 2006
1. ACCOUNTING POLICIESThe accounting policies of the Group are set out on pages 85 to 101.
2. MANAGEMENT OF INSURANCE AND FINANCIAL RISKDiscovery is exposed to financial risk through its financial assets, financial liabilities, reinsurance assets and insuranceliabilities. In particular the key financial risk is that the proceeds from its financial assets are not sufficient to fund theobligations arising from its insurance and investment contracts. The most important components of this financial risk areforeign currency risk, liquidity risk, credit risk, interest rate risk and market risk.
Discovery manages these risks through various risk management processes, all forming part of an asset liabilitymanagement framework. This framework has been developed to ensure that the long-term investment return on assetssupporting policy liabilities are sufficient to fund policyholders’ reasonable benefit expectations and the shareholders’dividend expectations. The following committees have been established to implement and monitor these risk managementprocesses:
– executive committees in each business unit;– Discovery Holdings executive committee;– audit and risk committee;– actuarial committee; and– an investment committee.
2.1 Discovery LifeProduct descriptionsDiscovery Life offers policyholders a range of insurance and financial solutions. The Discovery Life products reflectDiscovery’s underlying philosophy to make members healthier and to enhance and protect their lives.
Discovery Life offers some unique benefits that integrate with the benefits offered by Discovery Health and Vitality.
Discovery Life PlanThe Discovery Life Plan provides protection against a comprehensive spectrum of risks. The plan covers:
• Life Cover Benefits;
• Disability Benefits;
• Severe Illness Benefits; and
• Income Continuation Benefits.
The Life Fund forms the financial foundation of the Life Plan. The Life Fund can be linked to a benefit escalation rate, forexample inflation, and will then automatically increase at each policy anniversary. The Life Fund can also be linked to globalinvestment markets and a selection of currencies via the Global Linkage Benefit to provide additional protection in realterms and in foreign currencies.
The key risk benefits are then defined as a percentage of the Life Fund. The Life Fund is reduced by the amount of benefitspaid from the Life Fund. The Life Fund can be protected against claims by means of the Minimum Protected Fund. Multipleclaims are allowed against the Life Fund from the same benefit.
There are a number of risk benefits that are defined in monetary terms or in form of indemnity benefits, rather than beingexpressed as a percentage of the Life Fund. These benefits include:
• Income Continuation Benefit;
• Global Education Benefit; and
• Global Health Protector.
The Life plan has unique features allowing policyholders to add benefits for other family members. The Global EducationProtector, Global Health Protector, Childbirth Benefit, Child Severe Illness Benefit, Parent Severe Illness Benefit and FamilyTrauma Benefit allow protection for the whole immediate family.
By actively maintaining and improving their health Discovery Life policyholders, through the Integrator benefit, couldreceive premium discounts and refunds of premiums.
D I S C O V E R Y A N N U A L R E P O R T 2 0 0 6 1 0 7
2. MANAGEMENT OF INSURANCE AND FINANCIAL RISK (continued)
The Life Plan provides whole of life cover. Premium guarantees are offered and quantified on most benefits. For example,the premiums for Life Cover are guaranteed not to increase by more than 25% for any ten-year period.
Premiums are payable monthly. There are four funding methods that allow policyholders a choice of premium fundingpatterns. A combination of level premium funding patterns, annually increasing premium patterns and ten-yearly steppedpremium funding patterns are offered. The higher the compulsory future premium increase, the lower the starting premium.
At 30 June 2006 there were 146 000 Life Plans with an annualised premium income of R1 709 million.
Health Plan ProtectorThe Health Plan Protector will fund contributions to the Discovery Health Medical Scheme in the event of death, disability
or severe illness. It further rewards members for positive health management through the payback benefit. The Health
Plan Protector can be added to the Life Plan or can be bought on a stand-alone basis. The Health Plan Protector provides
cover up to age 65.
At 30 June 2006 there were 55 000 Health Plan Protector policies with an annualised premium income of R122 million.
Discovery Retirement OptimiserThe Retirement Optimiser offers funding for retirement and offers unique benefits that could together with the Life Plan,
capitalise unneeded risk cover to boost retirement funding. Policyholders have a choice of linked investment portfolios or
a portfolio that offers a guaranteed return in real terms.
Group LifeDiscovery Life offers a comprehensive spectrum of protection benefits on a group basis. Life Cover, Severe Illness, Disability
and Income Continuation Benefits are offered on a group basis. The policies offered under Group Life can be cancelled or the
premiums adjusted at the end of the contract term (usually one year).
At 30 June 2006 there were 129 000 lives covered under group policies with an annualised premium income of
R247 million.
Insurance and financial risksMarket and mismatching risk
• Shareholder fundsShareholder investments are reflected at fair value and thus susceptible to market fluctuation. The shareholder portfolio is
a well diversified portfolio to reduce specific risk.
• Insurance contractsThe insurance related cash outflows (e.g. benefit payments, administrations expenses, etc.) have been matched with future
cash inflows (predominantly future premiums). This can clearly be seen by considering the expected future cash flows
arising from insurance contracts:
Years Years Years Years R million Year 1 2 to 5 5 to 10 11 to 20 21+
Cash flow 563 1 540 1 077 681 (2 575)
The value of assets under insurance contracts is calculated by discounting the expected future cash flows shown above.
The effect of discounting is R1 196 million. The discount rate is set with reference to the prevailing risk-free gilt yield.
There is thus a risk that a change in the risk-free gilt yield could cause a change in the value of the assets under insurance
contracts.
The positive insurance liability held are mostly short-term in nature and have consequently been matched with cash.
The risk under the Global Linkage Benefit is fully reinsured and Discovery does not face any net direct market risk. In the
event of the reinsurer defaulting, the investments held by the reinsurer to hedge their risk relating to the Global Linkage
Benefit, will be ceded to Discovery Life.

D I S C O V E R Y A N N U A L R E P O R T 2 0 0 61 0 8
NOTES TO THE ANNUAL FINANCIAL STATEMENTS (continued)
for the year ended 30 June 2006
2. MANAGEMENT OF INSURANCE AND FINANCIAL RISK (continued)
• Investment contractsDiscovery Life has written business with linked benefits under the Discovery Retirement Optimiser product.
Although Discovery Life is not exposed to significant market risk as the policyholder’s return is linked to the return on the
underlying asset, Discovery Life is exposed to market risk to the extent that management fees and charges are dependant
on the market value of the assets under the linked policies. There is thus a risk that the management fees could be
insufficient to cover operational expenses.
• Embedded derivativesDiscovery Life does not currently have significant embedded derivatives that do not meet the definition of insurancecontracts.
Automatic increase take-up rateThe majority of Discovery Life policyholders have selected policies with automatic premium and benefit increases. Theautomatic increases increase the profitability of the plans over time since the cash flows under the policy are maintainedin real terms.
These automatic increases are contractual, however, if a policyholder is no longer in a position to meet the premiumincreases, they may elect to change their policy to a plan with lower premium and benefit increases. In practice it has beenfound that most of the policyholders continue with their initial funding plans. However, for valuation purposes it has beenassumed that all policyholders change to plans with minimum premium increases without changing the cover levels as atthe valuation date. This is the worst-case scenario and thus acts as a margin.
Lapse and surrender riskPolicyholders have the option to discontinue or reduce contributions at any time.
There is a risk of financial loss due to the withdrawal rate being higher than expected. The risk is highest during the earlyduration of the policy since the acquisition costs and commission incurred at the inception of the policy will not yet havebeen recouped. There is also a risk of lower than expected withdrawals at late durations of the policy since no surrendervalue is payable on withdrawal from a risk policy.
There is a further risk that the withdrawals are selective from a claims experience point of view. For example, healthy livesmay find it easier to obtain cover elsewhere compared to less healthy lives.
Future earnings are dependant on the number of policies remaining in future years and thus future earnings are dependanton the lapse rate. The future expected earnings vary by the premium funding method chosen by the policyholder. Ingeneral, the withdrawal risk to future earning increases, the higher the compulsory increase.
The lapse risk is managed as follows:
• Product designProducts are designed to be sustainable in the long-term. New product offerings are made available to existing policyholdersas far as possible to prevent lapse and re-entry risk.
Integration between different product offerings across Discovery enhances the value proposition of the overall package ofproducts from Discovery. For example, Vitality provides unique rewards and benefits to members which has proven to bea credible risk differentiator. Premium discounts are available to policyholders who actively engage in a healthier lifestyleand utilise the Vitality benefit. Better terms are thus offered to healthy lives compared to less healthy lives.
On the Health Plan Protector a payback benefit is offered. The Payback Benefit returns a percentage of policyholder’spremiums, less claims, at regular intervals. The Payback Benefit improves the value proposition of the policy.
No surrender benefit is offered on risk benefits and thus the loss on withdrawal is reduced.
• DistributionDiscovery Life predominantly distributes via independent intermediaries. The intermediary sales channel typicallyexperiences lower lapse rates than a direct channel.
Commissions are also clawed back from intermediaries where a policy lapses within the first two years of inception. Theamount of commission clawback depends on the duration of the policy in months and gradually reduces from 100% to0% over the two-year period.

D I S C O V E R Y A N N U A L R E P O R T 2 0 0 6 1 0 9
2. MANAGEMENT OF INSURANCE AND FINANCIAL RISK (continued)
• Client relationshipsAll premiums are collected via debit order. Clients are contacted after a failed debit order and after notification of acancellation. The reason for the cancellation is established and wherever possible the policies are conserved.
• ReinsuranceDiscovery has reinsurance treaties that protect a part of the assets under insurance contracts against a substantial increasein lapses. The reinsurance protects Discovery Life against the loss of assets under insurance contracts in the event that theaggregate lapse rate exceeds a predefined level.
• Experience monitoringLapse experience is monitored on a monthly basis and the data is analysed to establish possible trends for which
management action can be taken.
Reinsurance credit riskThere is a risk that a reinsurer does not perform in accordance with the reinsurance contract.
This risk is limited as risk premiums are paid monthly to reinsurers and claims can be offset against risk premiums. Further
it is expected that there will be little build-up of actuarial liability on the reinsurers’ side. Liabilities under reinsurance
contracts are primarily premiums payable on reinsurance contracts covering lapse risk. The risk thus mainly arises following
a period of higher than expected claims.
The risk is mitigated by the choice of reinsurers. Only reinsurers that have appropriate credit ratings and are subsidiaries
of large multi-national reinsurance groups are used.
Underwriting experience riskThere is a risk that actual mortality and morbidity experience is higher than expected. This could arise as a result of the
number of claims or the value of claims being higher than expected.
Selection is the risk that worse risks than expected are attracted and these risks are then charged inadequate premiums.
Selection could also lead to higher than expected mortality and morbidity experience.
There is a risk that the emergence of a new disease or epidemic can increase the number of claims, for example anoutbreak of avian flu.
The risks are managed through:
• Product design and pricingProducts are carefully designed to minimise adverse selection. Rating factors are applied to standard premium rates todifferentiate between different levels of risk. For example, premiums are differentiated by income, education level, smokerstatus, gender, medical history and age. Discovery Life has the unique ability to take additional rating factors into account,for example the current medical scheme claims and life style factors.
All new premium rates are reviewed and approved by the statutory actuary.
Product integration between the different product offerings in the Discovery Group helps to attract healthier lives than
average in the market leading to positive selection.
For certain of the product-options offered under the Life Plan, Discovery Life has retained the option to review premium
rates annually throughout the life of the contract because of uncertainties underlying the value of the benefits offered.
Only premiums that can be predicted with confidence are guaranteed. Where guarantees are offered, Discovery
guarantees that premiums can only be reviewed every ten years and increased by a maximum of 25%. The guarantee
provided to the policyholder will however be strengthened based on policyholder’s actual annual historic Vitality status.
Discovery Life predominantly operates in the high end of the insurance market where the risk to AIDS is lower than for
the market as a whole. The impact of HIV/AIDS is considered and allowed for during the product development and pricing.
Group business can be reviewed at least once every two years. AIDS risk is specifically allowed for in the pricing of
individual groups.
Overall, Discovery Life has experienced better than estimated claims experience during every reporting period since its
inception in 2001.
D I S C O V E R Y A N N U A L R E P O R T 2 0 0 61 1 0
NOTES TO THE ANNUAL FINANCIAL STATEMENTS (continued)
for the year ended 30 June 2006
2. MANAGEMENT OF INSURANCE AND FINANCIAL RISK (continued)
• UnderwritingUnderwriting ensures that only insurable risks are accepted and that premiums reflect the unique circumstances of eachrisk. For individual policies with lump sum life cover, the minimum requirement will be an HIV test.
Financial underwriting is applied to ensure that the policyholder can justify the amount of cover applied for.
Premium loadings and exclusions are applied where high risks are identified. Discovery Life can dynamically adjustpremiums using the information from the health claims experience of a policyholder who is also a member of the DiscoveryHealth Medical Scheme and Vitality. This provides Discovery Life with an advantageous position in the market.
Group business is underwritten on an employer by employer basis and additional allowance is made for the impact ofindustry class, income and geographic location on expected claims experience. The free cover limit is the sum assured thatwill be given automatically to a specific life without further specific underwriting. The free cover limits are set separatelyfor each scheme depending on the size and cover chosen by the specific scheme.
Quality assurance audits are performed on underwriting to minimise the risk of incorrect underwriting decisions.
• ReinsuranceReinsurance protects against volatility in claims experience and against an accumulation of risk. Reinsurance is furtherutilised on a facultative basis if uncertainty exists over the terms that should be offered to a particular risk.
In addition, reinsurers provide specialist advice when designing new products.
Discovery Life utilises surplus reinsurance to reinsure the proportion of each risk in excess of R2.25 million as at the policyinception. Discovery Life is thus protected against large individual claims.
In addition catastrophe reinsurance reduces the risk of an accumulation of risk due to a single event. Both individual andgroup business are covered by the catastrophe reinsurance.
• Experience monitoringExperience investigations are conducted and corrective action is taken where adverse experience is noted. Experiencemonitoring is done on at least a quarterly basis.
ExpensesExpense risk is the risk of actual expenses being higher than expected. Expenses could exceed expectations due to anincrease in the expense inflation or due to a reduction in the number of in-force policies. Expenses are monitored on amonthly basis against budgeted expenses. Any deviation from the budget is investigated, reported and where necessary,remedial action is taken.
Modelling and data riskThe actuarial liabilities are calculated using complex discounted cash flow models. There is thus a risk that the modeldoesn’t accurately project the policy cash flows in the future.
The risk is controlled using specialist actuarial software that is widely used and accepted in the life insurance industrythroughout the world.
The original actuarial model was tested and verified using an independent but identical parallel model. Any changes madeare externally and independently reviewed. Parallel models are developed to test any modelling changes.
The model relies on data from the administration system and there is thus a further risk that the data does not accuratelyreflect the policies being valued.
The data is extracted from a single modern administration system and subjected to detailed checks together with high levelreasonability checks. Discovery Life does not have any legacy systems that could impact on the data quality.
Operational/implementation riskDiscovery faces operational risk due to factors such as management failure, inadequate systems, inadequate controls,internal and external fraud, human error and a disruption in the normal operating environment.
Discovery’s core values serves as an overall guidance to staff and aims to create a culture of prudence, accountability andintegrity. Discovery further manages these risks through internal controls, internal audit, forensic functions, back-up facilitiesand insurance.
Segregation of duties ensure multiple checks on process and further protects against the risk of fraud.
Discovery does not have any legacy systems and processes to deal with thereby reducing operational risk.
D I S C O V E R Y A N N U A L R E P O R T 2 0 0 6 1 1 1
2. MANAGEMENT OF INSURANCE AND FINANCIAL RISK (continued)Regulatory riskDiscovery Life operates in a highly regulated environment which is currently being scrutinised and questioned by bothconsumers and regulators. This has resulted in the constant review of the in-force regulations and the interpretationthereof. The regulatory risk can thus be defined as the potential detrimental impact of unexpected changes in regulations(or interpretation thereof) may have on Discovery Life.
Discovery Life is a member of the Life Offices Association, an industry-wide body that engages in discussions withpolicymakers and regulators.
Although Discovery endeavors to design insurance solutions which meet the requirements of the current regulations inforce, the risk does exist that changes in the regulations, or the interpretation of the regulations, over time may result inthe current products not fully complying with the regulations in force in future. This risk is managed through constantlyseeking legal advice on new product developments. Further, all products issued by Discovery Life has to be signed off bythe independent Statutory Actuary.
In addition, Discovery Life further does not have legacy retirement business that is affected by the recent rulings made bythe Pension Fund Adjudicator.
Discovery Life’s compliance department enhances regulatory compliance through audits and by monitoring developments in the
regulatory environment.
Tax risk is the risk that the actual future tax liability is different to what is currently expected. This could be as a result of an
incorrect interpretation or application of tax legislation or as a result of changes to taxation legislation.
External tax advice is obtained as required to ensure that products are structured in a tax efficient way.
Currency riskAll of Discovery Life’s benefits are rand-denominated, with the exception of the Global Linkage Benefit, a benefit where
the sum insured can be linked to global investment markets or a selection of currencies. The Global Linkage Benefit is fully
reinsured. Discovery Life does therefore not have significant net currency risk.
Investment returnThe value of the assets under insurance contracts is dependant on the underlying assumption of future investment returns.
There is thus a risk that actual investment returns are different to expected. Discovery Life currently has negative
policyholder liabilities overall and the exposure to fluctuations in actual market returns is thus low.
Capital adequacy requirements and protection against adverse experienceThere is a risk that future premiums and estimates used to calculate liabilities are insufficient to provide for variations inactual future experience. Margins are maintained in all liabilities. In addition, Discovery maintains shareholder capital tomeet substantial deviations in experience.
In accordance with the Long-term Insurance Act (1998) Discovery Life is required to demonstrate solvency to the Registrarof Long-term insurance. Discovery Life thus needs to maintain sufficient shareholder assets, over and above the assetsrequired to fund shareholder liabilities, to fund the Capital Adequacy Requirement (CAR).
The CAR is calculated in accordance with the Professional Guidance Note (PGN) 104 as issued by the ActuarialSociety of South Africa (ASSA). The CAR calculation is intended to approximate a risk based capital measure andcovers the major areas of insurance risk. It explicitly covers the following areas of risk:
• Lapse and withdrawal risk;
• Fluctuations in mortality and morbidity experience;
• Fluctuation in expense experience;
• AIDS risk;
• Risk of asset liability mismatches; and
• Risk of worse than expected investment returns.
No management action was allowed for to offset adverse conditions.
At 30 June 2006 the Statutory Capital Adequacy Requirement was R95 million and was covered 14.0 times.
D I S C O V E R Y A N N U A L R E P O R T 2 0 0 61 1 2
NOTES TO THE ANNUAL FINANCIAL STATEMENTS (continued)
for the year ended 30 June 2006
2. MANAGEMENT OF INSURANCE AND FINANCIAL RISK (continued)Liquidity riskThe liquidity risk is the risk that Discovery Life has insufficient cash available to meet commitments as and when they falldue. Liquidity risk arises due to a timing mismatch between the assets and liabilities.
Discovery maintains sufficient liquid assets to meet short-term liabilities and to allow for the initial cash flow strain whenwriting new business.
Currently, Discovery Life’s expected liabilities are mostly long-term and the main liquidity requirement is to fund acquisitionexpenses on new business. The liquidity risk on the existing portfolio is thus relatively small.
Large individual claims in excess of R3 million are reinsured providing stability in claims experience and further reducingthe liquidity risk.
The net of tax and net of reinsurance expected cash inflows under in-force insurance and investment contracts as at
30 June 2006 were as follows:
Year Years Years Years Years R million 1 2 to 5 5 to 10 11 to 20 21+
Cash flow 472 1 675 2 140 4 328 10 557
Note that these cash flows differ from those disclosed on page 107, since these are based on best estimate cash flows not
taking into account the margins included within the liability calculations. No allowance has been made for new business
and related expenses.
Policy wording/legal risksThere is a risk that Discovery could be financially exposed to obligations that are different to expected and not adequately
provided for. The risk could also arise from legal proceedings.
The risk is managed when new products are developed and all policy wordings are reviewed by legal advisors and external
advice is obtained where necessary to ensure that terms and conditions are clearly defined and unambiguous.
Reputational riskReputational risk is the risk of negative market reaction towards Discovery Life. Discovery Life may thus not be able to
apply management policies to reduce risk.
Reputational risks are controlled in that all decisions to repudiate claims are reviewed by the chief medical officer and legal
advice is obtained where necessary.
Marketing material and policy wordings are reviewed and designed to be clear and unambiguous to avoid creating
unreasonable policyholder expectations.
Discovery Life offers policies that integrate with the product offerings within the Discovery Group. The reputational risk to
Discovery Life is thus extended to the reputational risk of the entire Discovery Group. Discovery Life management review
all product offerings to minimise the reputational risk. All products are approved by the statutory actuary prior to launch.
Concentration risk
• Claims experience riskThere is a risk that a concentration of risk can lead to worse than expected experience. The concentration risk is the highest
in group business, since assured lives live in the same geographical location and generally work in the same industry or at
the same location.
Discovery’s exposure to group business is however small at this stage and this risk is mitigated through catastrophe
reinsurance.
Discovery Life maintains a well diversified portfolio of policies. Reinsurance is further used to protect against the
concentration of risk. Catastrophe reinsurance protects against accumulation of claims from a single event, for example an
airplane crash.
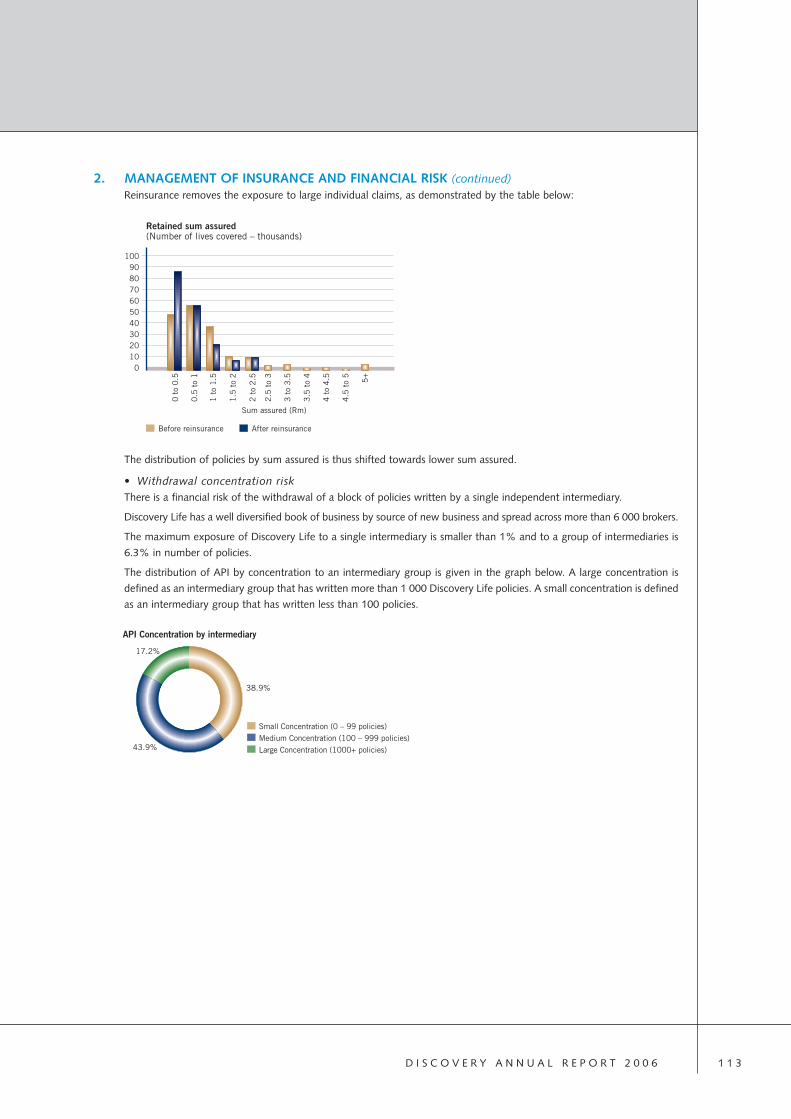
D I S C O V E R Y A N N U A L R E P O R T 2 0 0 6 1 1 3
2. MANAGEMENT OF INSURANCE AND FINANCIAL RISK (continued)Reinsurance removes the exposure to large individual claims, as demonstrated by the table below:
The distribution of policies by sum assured is thus shifted towards lower sum assured.
• Withdrawal concentration riskThere is a financial risk of the withdrawal of a block of policies written by a single independent intermediary.
Discovery Life has a well diversified book of business by source of new business and spread across more than 6 000 brokers.
The maximum exposure of Discovery Life to a single intermediary is smaller than 1% and to a group of intermediaries is
6.3% in number of policies.
The distribution of API by concentration to an intermediary group is given in the graph below. A large concentration is
defined as an intermediary group that has written more than 1 000 Discovery Life policies. A small concentration is defined
as an intermediary group that has written less than 100 policies.
100908070605040302010
0
Retained sum assured(Number of lives covered – thousands)
Before reinsurance After reinsurance
0.5
to
1
1 t
o 1
.5
1.5
to
2
2 t
o 2
.5
2.5
to
3
3 t
o 3
.5
3.5
to
4
4 t
o 4
.5
4.5
to
5
5+
Sum assured (Rm)
0 t
o 0
.5
API Concentration by intermediary
Small Concentration (0 – 99 policies)Medium Concentration (100 – 999 policies)Large Concentration (1000+ policies)
38.9%
43.9%
17.2%

D I S C O V E R Y A N N U A L R E P O R T 2 0 0 61 1 4
NOTES TO THE ANNUAL FINANCIAL STATEMENTS (continued)
for the year ended 30 June 2006
2. MANAGEMENT OF INSURANCE AND FINANCIAL RISK (continued)2.2 Destiny Health
The Destiny Health business is written in seven jurisdictions (Illinois, Wisconsin, Massachusetts, Washington DC, Virginia,
Maryland and Texas) and on the paper of four insurance carriers (Destiny Health Insurance Company, Guardian Life
Insurance Company, Clarendon National Insurance Company and Tufts Insurance Company). Apart from the Destiny
Health Insurance Company, all other paper is rated A- and higher by A.M. Best Company. Different reinsurance and risk
sharing agreements govern the retained risk to Destiny Health in each of these markets and on each of the licences. The
distribution of business and effective risk sharing is illustrated in the chart below:
Product descriptionThe Destiny Health Plan comprises a medical plan providing medical coverage with a number of benefit options.
The plan typically covers the following health insurance benefits:
• Hospital benefits covering a range of inpatient hospital care and related services;
• Surgery benefits apply for outpatient surgery that is medically necessary; and the surgery cannot be performed in a
physician’s office; and
• Day-to-day benefits relate to physician office visits and in-office treatment.
Optional coverage is provided for:
• Chronic medication, which covers prescribed medications, including insulin, that are required for the treatment of certain
chronic illnesses;
• Total medication, which covers all prescribed medications;
• Preventive medications, covering prescription drugs, as defined by the plan, for the preventive treatment of various
health conditions;
• Preventative care, covering costs for services such as childhood immunizations and mammograms; and
• Hospital and surgery benefit, providing coverage for hospital and surgery services subject to a separate deductible.
Insurance and financial risksDestiny Health writes contracts providing health insurance coverage to individuals and employer groups in select markets
within the United States of America. Destiny Health retains all or part of the insurance risk obligation.
Effective risk share
Markets concentration (Monthly premium $’000 excluding savings)
Illinois 4 144 3 942 862 0
Pre-GLIC alliance (100% retained) 2 695 n/a n/a n/a
GLIC alliance (48% retained) 1 449 3 942 n/a n/a
Wisconsin 0 0 756 0
Massachusetts 0 0 0 2 830
Washington DC, Virginia and Maryland 0 2 312 0 0
Texas 0 269 0 0
Varied 48% 100% 50%
DESTINY HEALTH
DESTINY HEALTHINSURANCE COMPANY
(DHIC)
TUFTS INSURANCECOMPANY (TICO)
GUARDIAN LIFEINSURANCE COMPANY
(GLIC)
CLARENDONINTERNATIONAL
INSURANCE COMPANY(CNIC)

D I S C O V E R Y A N N U A L R E P O R T 2 0 0 6 1 1 5
2. MANAGEMENT OF INSURANCE AND FINANCIAL RISK (continued)Underwriting experience riskDestiny is exposed to uncertainty surrounding the timing and severity of claims under its contracts of insurance. Risk
premium rates are estimated using statistical techniques at a level reflective of expected annual claims cost per member,
on a pooled basis. Insurance events are, by nature, random and the actual number and size of events during any one year
may vary from those estimated using established statistical techniques.
Destiny Health strengthened its reinsurance program on 1 October 2005 by lowering the attachment points from
US$300 000 to US$250 000. More than 93% of the new business written by Destiny Health has 50% quota share coverage.
These risks are further managed through:
• Underwriting to screen risk and rate appropriatelyDestiny Health requires medical tests on individual policies. In smaller groups a statement of health disclosure is required.
Lifestyle information is used in addition to medical history. Key risk factors considered in individual and small group
underwriting are: age, gender, region, industry, height and weight and medical and lifestyle information. Industry data
sources are used to augment information obtained.
In the large group segment (51 and more employees) underwriting mainly comprises experience rating using claims history,
aligned with industry practice. Non-disclosure, participation and pre-existing condition monitoring are further mechanisms
used to manage upfront selection risk.
• PricingPremiums are annually renewable and policies are cancellable upon non-payment (all size groups), non-disclosure (groups
with 51 or more employees) and fraud (all size groups). Some states require small group rates to be within a particular
band, i.e. the highest rate cannot exceed the lower by more than mandated percentage. The distribution of business
quoted and sold is monitored on a weekly basis and the aggregate of business sold at the highest rates are aimed to be
fewer than 10%. Pricing is monitored on an ongoing basis and changes to pricing occur monthly. Pricing information
sources include internal analysis, provider data, industry pricing tables, and partner data. Destiny Health’s pricing is also
reviewed from time-to-time by external consultants.
• Managing healthDestiny Health uses specialist external consultants for the following services:
– Pharmacy benefit management;
– In-patient and outpatient utilisation management, case management, disease management and maternity
management; and
– Mental health benefit and case management.
The disease management program uses risk screening and predictive modelling to identify members for outreach.
Destiny Health’s wellness program, Vitality plays an integral part in promoting health awareness, incentivising healthy
behaviour and providing access to wellness programs and facilities.
• Claims managementClaims payment patterns are short tailed by nature, and 90% of claims are typically settled within three months from dates
of service. Destiny Health does not have exposure to latent claims, as all original claims are required to be submitted
within 12 months from date of service. Average receipt of claims differs by territory, and currently runs at 45 days for all
markets combined.
Provider network contracts provide some claim-cost relief. Groups, and in some circumstances members, choose regional
provider networks. Services outside the region are available through PHCS, a national network of providers. In addition,
specialist mental health network and transplant networks are used to control the costs on related services. Overseas
coverage is only available for a 90 day period outside of the United States. Limited benefits are paid when non-
participating providers are used.

D I S C O V E R Y A N N U A L R E P O R T 2 0 0 61 1 6
NOTES TO THE ANNUAL FINANCIAL STATEMENTS (continued)
for the year ended 30 June 2006
2. MANAGEMENT OF INSURANCE AND FINANCIAL RISK (continued)Controls and procedures also exist to identify fraud, inaccurate billing, non-disclosure, and pre-existing conditions. A coordination of benefits provision applies when a member has health care coverage under more than one plan, includingMedicare.
• Ongoing risk monitoringThe Destiny Health Risk Committee meets weekly focusing on new business and underwriting, renewals, and claimsexperience and medical management respectively. The meeting comprises executives from Destiny Health and representativesfrom Discovery in South Africa. Destiny Health also reports through to the Discovery Holdings Actuarial Committee, a sub-committee of the Discovery Holdings’ board, meeting at least four times per year.
Within the framework of Destiny Health’s quality management program the Medical Management Committee convenesquarterly to review medical practices and procedures and overall medical management. This committee comprises internalexecutives and external medical experts. Destiny Health’s vendor oversight program requires quarterly meetings with allmanaged care vendors.
Concentration riskConcentration of risk increases Destiny Health’s exposure to factors impacting the severity and frequency of claims.Destiny Health management is focused to diversify geographical, group size exposure and quality of business risk topromote a balanced portfolio.
Concentration metrics are summarised below (gross premium in R million):
Distribution by age and market
R million Illinois Massachusetts Mid-Atlantic* Texas Wisconsin Total
Age range:Under 20 2 1 1 – – 420 to 29 85 21 31 3 11 15130 to 39 159 43 55 5 18 28040 to 49 212 61 51 6 19 34950 to 59 170 49 33 4 13 26960 plus 61 15 12 1 3 92
Total 689 190 183 19 64 1 145
* Washington DC, Virginia and Maryland
Distribution by group size and market
R million Illinois Massachusetts Mid-Atlantic* Texas Wisconsin Total
1 5 1 0 0 0 62 to 50 472 109 84 12 26 70351 to 100 143 39 36 7 26 251101 to 500 64 41 63 0 12 180500 plus 5 0 0 0 0 5
Total 689 190 183 19 64 1 145
* Washington DC, Virginia and Maryland

D I S C O V E R Y A N N U A L R E P O R T 2 0 0 6 1 1 7
2. MANAGEMENT OF INSURANCE AND FINANCIAL RISK (continued)
IBNR calculationThe IBNR calculation is an estimate of claims incurred but not yet paid at 30 June 2006. The provision is calculated as thedifference between the expected fully incurred claims for all months up to the calculation date, and the actual claimsalready paid for each month as at the calculation date. The calculation of the incurred claims estimate requires assumptionsand actuarial judgment. Actual experience will differ from these estimates and impact profits in the post calculation period.The calculation methodology, key assumptions and the sensitivity of the estimate to changes in the key assumptions areoutlined below.
Description of IBNR methodologyA monthly outstanding claims liability estimate is calculated for each of the four separate licenses. Sub-categories aredeveloped per license for claims with different completion characteristics.
Claim lag triangles are populated for each category using paid claim information (chain ladder method). Triangles are alsogenerated at the license level.
Completion factors are developed for each triangle. In each case, the final completion factors are a blending of various
methods, where the weighting applied to each method varies based on the availability of data, maturity of the block and
other notable characteristics. Where insufficient data exists for a particular block, the final completion factors used may be
based in part or in full on other similar business. Large claims are removed from the triangle for factor development
purposes where these result in disproportionate distortions to the lag pattern.
Sensitivity analysisThe IBNR provision is most sensitive to changes in claims development patterns. Another relevant assumption is medical
inflation (trend). The table below shows the impact of a change in these assumptions on the 30 June 2006 IBNR.
5% increase in claims Base development patterns 1% increase in trend
R million Gross Net Gross Net Gross Net
DHIC 50 42 51 43 50 42
CNIC 20 20 20 20 20 20
GLIC 71 33 72 34 71 33
TICO 19 9 20 10 20 10
160 104 163 107 161 105
D I S C O V E R Y A N N U A L R E P O R T 2 0 0 61 1 8
NOTES TO THE ANNUAL FINANCIAL STATEMENTS (continued)
for the year ended 30 June 2006
2. MANAGEMENT OF INSURANCE AND FINANCIAL RISK (continued)2.3 PruHealth
Product descriptionPruHealth offers three main product types:
Individual productThis is offered to the retail market either direct or via a broker. The product features include:
• Private Medical Insurance: Cover is offered for a range of private healthcare related claims. The cover is dependent onthe plan type chosen and includes hospital and outpatient cover for selected conditions. It specifically excludesemergency cover, maternity cover and cover for chronic conditions;
• Starter discounts: Up to 30% based on answers to healthcare questions;
• Renewal discounts: Discounts are offered at renewal depending on claims and Vitality status; and
• Vitality rewards: Full Vitality package including gym offering and healthcare related rewards.
SME productThis is an age-rated product offered to small groups (2 – 100) via the broker market. The product features include:
• Private Medical Insurance: Cover is offered for a range of private healthcare related claims. The cover is dependent onthe plan type chosen and includes hospital and outpatient cover for selected conditions. It specifically excludesemergency cover, maternity cover and cover for chronic conditions;
• Renewal discounts for employers: Discounts are offered at renewal depending on loss ratio;
• Cashback: Employees are eligible for cash bonuses depending on the amount claimed during the period and their Vitalitystatus; and
• Vitality rewards: A full Vitality package is offered including gym offering and healthcare related rewards.
Corporate productThis is a product with fixed premiums by age that is fully experience rated each year. It is offered by brokers and employeebenefit consultants. The product features include:
• Private Medical Insurance: Cover is offered for a range of private healthcare related claims. The cover is dependent onthe plan type chosen and includes hospital and outpatient cover for selected conditions. It specifically excludesemergency cover, maternity cover and cover for chronic conditions.
• Cashback: Companies can select their desired level of cashback. If selected, employees are eligible for cash bonusesdepending on the amount claimed during the period and their Vitality status.
• Vitality rewards: A full Vitality package is offered including gym offering and healthcare related rewards.
Insurance and financial risksPruHealth takes a proactive approach to managing its risk and each business unit responsible for the five risk groupingsidentified below have initiated a series of risk management processes to ensure that they are adequately controlled.
Insurance riskThe key areas of risk are premium pricing, claims volatility and failing to meet target levels of business. Monthly meetingsare held to review actual experience against original pricing assumptions. Current claims experience is monitored againstexpected to ensure that PruHealth’s current pricing assumptions are reasonable. Information is fed into the pricing reviewsconducted by the Actuarial and Underwriting department. On a quarterly basis, the financial forecast is reviewed againstemerging experience. The financial model uses the product pricing assumptions and profitability output to produce amodel office with financial statements that provide an overview of future company profitability and capital requirementsof the business.
PruHealth uses Milliman, an external actuarial consultancy, for external peer review and formal product sign off. Millimanwill continue to perform ongoing reviews of the results of emerging experience against our pricing assumptions. Theirreview will focus on underwriting, claims experience, reserving, demographics and new product pricing.
A recent project has been completed to evaluate reinsurance options to PruHealth in the market and an excess of lossreinsurance treaty has been concluded with a joint syndicate consisting of Wellington (a Lloyds syndicate) and Sirius, aninternational reinsurer.

D I S C O V E R Y A N N U A L R E P O R T 2 0 0 6 1 1 9
2. MANAGEMENT OF INSURANCE AND FINANCIAL RISK (continued)Liquidity riskThe key areas of risk here are asset mismatching, the inability to sell financial assets quickly enough and unexpected cash
flows. At present the first two risks are minimised as all financial assets are held as cash and hence our liquidity position is
strong. To manage unexpected cash flows monthly financials are compared to budget and quarterly budget re-forecasting
is conducted to ensure that any additional financing required from PruHealth’s shareholders is identified at least three to
six months ahead.
Credit riskKey counter-parties identified that may result in a credit risk to PruHealth are premium debtors and brokers. Premium
debtors are managed by strong collection processes to ensure that the identification of any unpaid debt exists and this is
reported on a monthly basis. Most commission claw-backs are off set against future payments and hence the risk of
outstanding commission is minimal. Whilst PruHealth’s entry into a reinsurance arrangement will have an impact on their
credit risk it is not significant at present.
Market riskThe key areas of risk are the movement on interest rates and exchange rate movements resulting in reduced income.
PruHealth invests its cash assets on the overnight money market, seeking the best interest rate it can achieve in accordance
with its investment policy. At present budgeted interest rate is being achieved. Should there be a change in the market,
PruHealth’s budgets would be adjusted accordingly to reflect the reduced investment income achievable. Exchange rate
movements have been largely managed through the creation of an annual expense contract with Discovery and the fixing
of exchange rates.
Operational riskA detailed risk management framework has been implemented across PruHealth through the implementation of individual
business unit risk registers, a complaints management process and regular business continuity reviews.
IBNR calculationThe PruHealth IBNR calculation is performed using the chain ladder approach. This allows for the historic patterns of claims
payment in determining the likely future emergence of claims. Due to the variability of estimates for the recent months,
an adjustment is made to the claims for more recent months to allow for the number of pre-authorised claims and the
expected cost per pre-authorised event.
The data used for the chain ladder calculation includes all claims processed from April 2005 to the end of June 2006.
Adjustments are made to the IBNR using pre-authorised claims for the period February 2006 to June 2006.
A 10% increase in assumed IBNR will result in a R1.9 million increase in the IBNR provision.
2.4 Discovery HealthProduct descriptionSelect benefitThe select benefit provides cover to members of Discovery Health Medical Scheme who selected the Select plan option.
This product has been closed to new business since 2000. The following benefits are provided:
• The Private Ward Benefit provides a stated benefit of R825 per day when the policyholder is admitted to hospital.
There is no overall benefit limit and the benefit ceases at age 65.
• The US Benefit covers the cost of treatment in the United States where the procedure is not available in South Africa.
There is a lifetime benefit limit of US$1 million, and cover ceases at age 65.
The private ward benefit is reinsured on a quota share basis, and the overseas cover benefit is fully reinsured.
As at 30 June 2006 there were 9 649 lives covered under the select benefit with an annual premium income of R17 million.

D I S C O V E R Y A N N U A L R E P O R T 2 0 0 61 2 0
NOTES TO THE ANNUAL FINANCIAL STATEMENTS (continued)
for the year ended 30 June 2006
2. MANAGEMENT OF INSURANCE AND FINANCIAL RISK (continued)Primary care networkWith effect from 1 January 2006, Discovery Health Medical Scheme pays Discovery Health a monthly fee for each
beneficiary on the Scheme’s KeyCare Plus plan. In return for the monthly fee, Discovery Health covers both the cost of
healthcare services provided by the Primary Care Network for these beneficiaries and the cost of administration of the
Primary Care Network. The covered Primary Care Network services include unlimited visits to a specified GP, basic
pathology, radiology, optometry, dentistry and acute and chronic medication.
As at 30 June 2006 there were 126 864 lives covered under the Primary Care Network benefit with an annual premium
income of R144 million.
2.5 Financial instrument risksCurrency riskCurrency risk is the risk that the value of a financial instrument will fluctuate due to changes in foreign exchange rates.
Discovery operates internationally and its exposures to foreign exchange risk arise primarily with respect to the US dollar
and the UK pound. As a result, foreign exchange risk arises from net investments in foreign operations.
Discovery manages short-term foreign currency exposures. Forward exchange contracts are utilised to reduce exposure to
currency risk and are designated as cash flow hedges.
The following assets and liabilities, denominated in foreign currencies, where the currency risk resides with Discovery, are
included in the Group balance sheet:
R million Rand GBP US$ Euro Other Total
30 June 2006
Insurance and investment contractsAssets
Intangible assets including
deferred acquisition costs 1 1 – – – 2
Financial assets –
– Equity investments 367 11 19 12 15 424
– Government and public
authority stocks 44 – 2 4 2 52
– Money market 142 – 4 2 – 148
– Equity-linked notes 21 – – – – 21
Reinsurance assets 32 – – – – 32
Cash and cash equivalents 389 – – – – 389
Total assets 996 12 25 18 17 1 068
Liabilities
Liabilities arising from insurance
contracts 306 20 138 – – 464
Financial liabilities
– Investment contracts at fair value
through profit and loss 604 – – – – 604
Total liabilities 910 20 138 – – 1 068

D I S C O V E R Y A N N U A L R E P O R T 2 0 0 6 1 2 1
2. MANAGEMENT OF INSURANCE AND FINANCIAL RISK (continued)
R million Rand GBP US$ Euro Other Total
ShareholdersAssets
Property and equipment 175 2 9 – – 186
Intangible assets 46 10 8 – – 64
Assets arising from
insurance contracts 2 463 – – – – 2 463
Investment in associate company 7 – – – – 7
Financial assets
– Equity investments 1 046 11 46 58 15 1 176
– Government and public
authority stocks 45 1 129 3 3 181
– Money market 50 – 5 2 1 58
– Equity-linked notes 56 – – – – 56
– Loans and receivables 358 63 138 – – 559
Deferred income tax 41 – – – – 41
Cash and cash equivalents 726 95 112 – – 933
Total assets 5 013 182 447 63 19 5 724
Equity
Share capital and share premium 1 348 – – – – 1 348
Reserves/(losses) 3 891 (246) (781) – – 2 864
Total equity 5 239 (246) (781) – – 4 212
Liabilities
Liabilities arising from
reinsurance contracts 24 – – – – 24
Borrowings at amortised cost 42 – 119 – – 161
Deferred income tax 518 – – – – 518
Deferred revenue 203 – – – – 203
Provisions 36 – – – – 36
Trade and other payables 341 37 144 – – 522
Current income tax liabilities 48 – – – – 48
Total liabilities 1 212 37 263 – – 1 512
Total equity and liabilities 6 451 (209) (518) – – 5 724
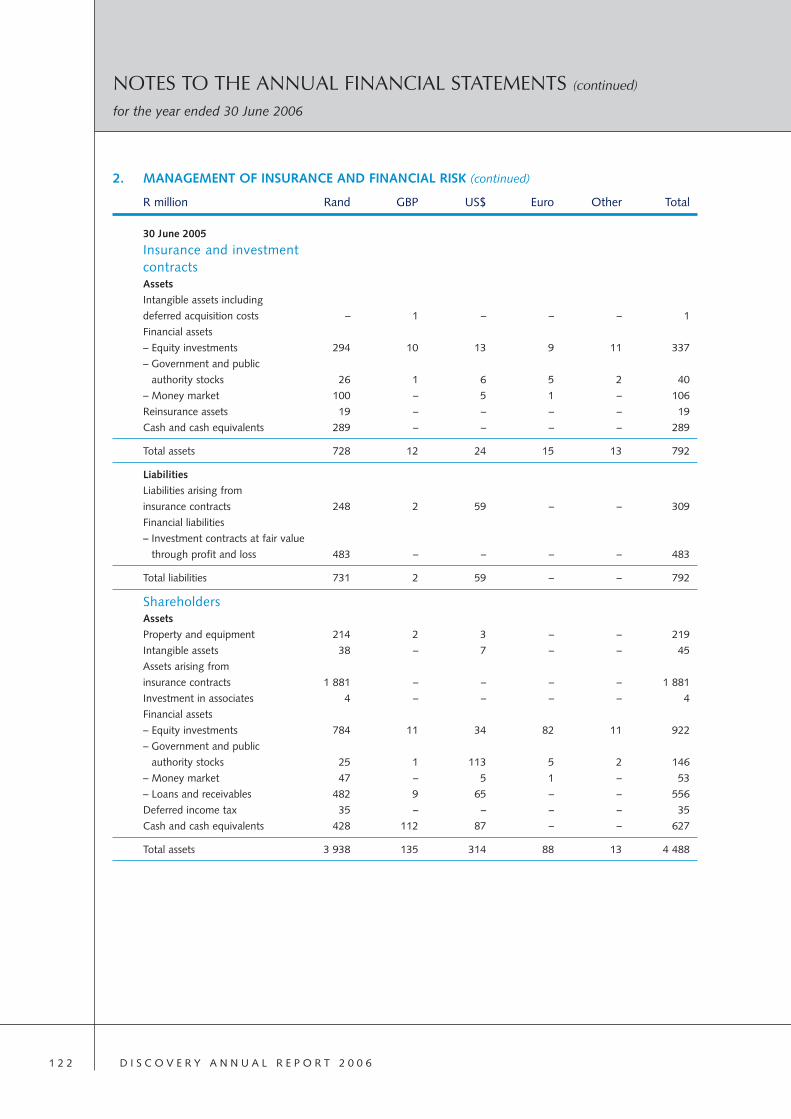
D I S C O V E R Y A N N U A L R E P O R T 2 0 0 61 2 2
NOTES TO THE ANNUAL FINANCIAL STATEMENTS (continued)
for the year ended 30 June 2006
2. MANAGEMENT OF INSURANCE AND FINANCIAL RISK (continued)
R million Rand GBP US$ Euro Other Total
30 June 2005
Insurance and investment contractsAssets
Intangible assets including
deferred acquisition costs – 1 – – – 1
Financial assets
– Equity investments 294 10 13 9 11 337
– Government and public
authority stocks 26 1 6 5 2 40
– Money market 100 – 5 1 – 106
Reinsurance assets 19 – – – – 19
Cash and cash equivalents 289 – – – – 289
Total assets 728 12 24 15 13 792
Liabilities
Liabilities arising from
insurance contracts 248 2 59 – – 309
Financial liabilities
– Investment contracts at fair value
through profit and loss 483 – – – – 483
Total liabilities 731 2 59 – – 792
ShareholdersAssets
Property and equipment 214 2 3 – – 219
Intangible assets 38 – 7 – – 45
Assets arising from
insurance contracts 1 881 – – – – 1 881
Investment in associates 4 – – – – 4
Financial assets
– Equity investments 784 11 34 82 11 922
– Government and public
authority stocks 25 1 113 5 2 146
– Money market 47 – 5 1 – 53
– Loans and receivables 482 9 65 – – 556
Deferred income tax 35 – – – – 35
Cash and cash equivalents 428 112 87 – – 627
Total assets 3 938 135 314 88 13 4 488
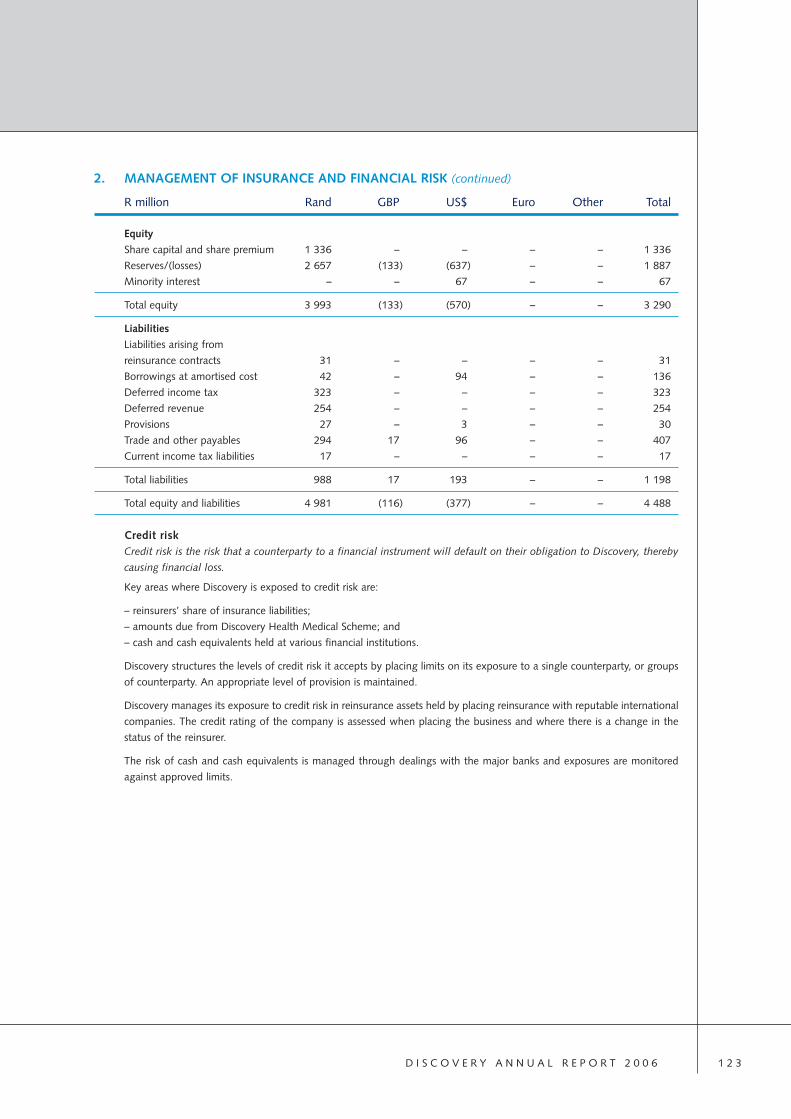
D I S C O V E R Y A N N U A L R E P O R T 2 0 0 6 1 2 3
2. MANAGEMENT OF INSURANCE AND FINANCIAL RISK (continued)
R million Rand GBP US$ Euro Other Total
Equity
Share capital and share premium 1 336 – – – – 1 336
Reserves/(losses) 2 657 (133) (637) – – 1 887
Minority interest – – 67 – – 67
Total equity 3 993 (133) (570) – – 3 290
Liabilities
Liabilities arising from
reinsurance contracts 31 – – – – 31
Borrowings at amortised cost 42 – 94 – – 136
Deferred income tax 323 – – – – 323
Deferred revenue 254 – – – – 254
Provisions 27 – 3 – – 30
Trade and other payables 294 17 96 – – 407
Current income tax liabilities 17 – – – – 17
Total liabilities 988 17 193 – – 1 198
Total equity and liabilities 4 981 (116) (377) – – 4 488
Credit riskCredit risk is the risk that a counterparty to a financial instrument will default on their obligation to Discovery, thereby
causing financial loss.
Key areas where Discovery is exposed to credit risk are:
– reinsurers’ share of insurance liabilities;
– amounts due from Discovery Health Medical Scheme; and
– cash and cash equivalents held at various financial institutions.
Discovery structures the levels of credit risk it accepts by placing limits on its exposure to a single counterparty, or groups
of counterparty. An appropriate level of provision is maintained.
Discovery manages its exposure to credit risk in reinsurance assets held by placing reinsurance with reputable international
companies. The credit rating of the company is assessed when placing the business and where there is a change in the
status of the reinsurer.
The risk of cash and cash equivalents is managed through dealings with the major banks and exposures are monitored
against approved limits.

D I S C O V E R Y A N N U A L R E P O R T 2 0 0 61 2 4
NOTES TO THE ANNUAL FINANCIAL STATEMENTS (continued)
for the year ended 30 June 2006
2. MANAGEMENT OF INSURANCE AND FINANCIAL RISK (continued)Interest rate riskInterest rate risk is the risk that the value of a financial instrument will fluctuate due to changes in market interest rates.
Investments in government and public authority stocks and money market securities and deposits are managed by
qualified asset managers.
As can be seen from the following table, a majority of the non-equity investments are short-term in nature thereby limiting
Discovery’s interest rate risk. The following assets will be affected by changes in market interest rates:
Maturity date
Shorter Between Between Longerthan 1 and 5 and than
R million Total 1 year 5 years 10 years 10 years
2006
Insurance and investment contracts:Cash and cash equivalents 389 389 – – –
Money market 148 148 – – –
Government and public authority stocks 52 8 21 11 12
589 545 21 11 12
Shareholders:Cash and cash equivalents 933 933 – – –
Money market 58 58 – – –
Government and public authority stocks 181 136 22 11 12
1 172 1 127 22 11 12
2005
Insurance and investment contracts:Cash and cash equivalents 289 289 – – –
Money market 106 106 – – –
Government and public authority stocks 40 16 10 6 8
435 411 10 6 8
Shareholders:Cash and cash equivalents 627 627 – – –
Money market 53 53 – – –
Government and public authority stocks 146 123 9 6 8
826 803 9 6 8
Legal riskLegal risk is the risk that the Group will be exposed to contractual obligations which have not been provided for.
The Group has a policy of ensuring all contractual obligations are documented and appropriately evidenced to agreements
with the relevant parties to the contract.
All significant claims are reviewed by independent legal resources and amounts are immediately provided for if there is
consensus as to any possible Group exposure. At 30 June 2006, the directors are not aware of any significant obligation
not provided for.

D I S C O V E R Y A N N U A L R E P O R T 2 0 0 6 1 2 5
2. MANAGEMENT OF INSURANCE AND FINANCIAL RISK (continued)Liquidity riskLiquidity risk is the risk that Discovery will encounter difficulty in raising cash to meet commitments associated with
financial instruments. Liquidity risk arises when there is mismatching between the maturities of liabilities and assets.
Policyholder funds are invested in appropriate assets, taking into account expected cash outflows. Discovery has significant
liquid resources.
Market riskMarket risk is the risk that the value of a financial instrument will fluctuate due to changes in market prices.
Equity investments are made on behalf of policyholders and shareholders. Equities are reflected at market values,
which are susceptible to fluctuation. Of the total investments subject to equity price risk being R1 600 million
(2005: R1 299 million), R1 176 million (2005: R932 million) are designated shareholder specific assets not linked to
policyholders’ liabilities. All market securities are managed by qualified asset managers in line with a mandate approved
by the investment committee.
3. CRITICAL ACCOUNTING ESTIMATES AND JUDGMENTS IN APPLYING ACCOUNTING POLICIESAssumptions and estimates form an integral part of financial reporting and have an impact on the amounts reported.
Assumptions are based on historical experience and expectations of future outcomes and anticipated changes in the
environment. Assumptions are further regularly reviewed in the light of emerging experience and adjusted where required.
Policyholder liabilities assumptions and estimates (Assets arising from insurance contracts)The insurance policies issued by Discovery Life are valued using various methodology and assumptions. The methodology
is described in the accounting policies on pages 97 to 100. The assumptions used are best estimate assumptions, with the
addition of explicit compulsory margins required by PGN 104 of the Actuarial Society of South Africa and the discretionary
margins described on page 98 of the accounting policies. The process used to decide on best-estimate assumptions is
described below:
Experience investigationsExperience investigations into lapse, mortality, morbidity, expenses and other key accounting estimates are performed at
every valuation date.
The data for the months since the previous valuation date forms the basis of each investigation. The experience of prior
periods is also considered to establish trends and add credibility to the results.
The most recent experience investigations were performed at 30 June 2006.
Mortality and morbidityAssumptions of future mortality and morbidity experience are derived based on data from reinsurers and compared to
actual past experience. Where appropriate, the assumptions are adjusted to reflect actual past experience or for expected
changes in future experience.
The assumptions are modified for each policy based on actual data available from underwriting performed on the policy.
The assumptions are compared against standard industry tables for reasonability. The key mortality and morbidity
assumptions are reviewed and benchmarked against the industry by independent actuarial consultants to ensure that the
assumptions are reasonable, upon implementation of significant new products.
An allowance is made for the impact of AIDS. This is described in detail under the AIDS assumption on page 128.

D I S C O V E R Y A N N U A L R E P O R T 2 0 0 61 2 6
NOTES TO THE ANNUAL FINANCIAL STATEMENTS (continued)
for the year ended 30 June 2006
3. CRITICAL ACCOUNTING ESTIMATES AND JUDGMENTS IN APPLYING ACCOUNTING POLICIES (continued)Surrender and lapse ratesLapse and surrender rates are based on actual past experience where available. The lapse analysis is done by considering
the in-force duration of policies. For durations longer than existing actual data, lapse rates are set based on expectations
of future experience based on internal and external expert advice. The lapse experience investigation covers at least the
last two years of lapse experience to allow trends to be identified.
Lapse assumptions are varied between different types of policies where the lapse experience is expected to
differ significantly.
TaxationFuture tax is allowed for according to the current tax legislation and current tax rates.
The current and expected future tax position of each policyholders’ tax fund is taken into account in setting the
tax assumption.
The individual policyholders’ fund (IPF) is currently in an excess expense (XE) position and hence no tax is payable on the
interest earned on policyholder’s funds’ within the IPF. Consequently, no allowance is made for tax relief on expenses
within the IPF. Current forecasts are that the IPF will remain in an XE position.
Deferred tax arises as the difference between the accounting basis and the tax basis. This difference arises due to the
special transfers from the IPF to the Corporate Fund that are available under the statutory tax basis.
It is assumed that the future tax will be payable at the prevailing company tax rate of 29%.
Economic assumptions/Investment returnsThe discount rate is set equal to the estimate of the risk-free investment return rate. The risk-free rate is calculated with
reference to the risk-free yield curve. A single risk-free rate is then derived appropriate to the weighted duration of the
cash flows and rounded to the nearest quarter of a percent. The risk-free rate at 30 June 2006 was set at 9% p.a.
Other investment returns and economic assumptions are set relative to this yield. The assumptions are as follows:
Cash Risk-free -1.5%
Fixed interest Risk-free
Equity Risk-free +2%
Consumer Price Inflation Risk-free -4%
The investment fees and tax rates are taken into account in setting the economic assumptions.
Expense assumptionsRenewal expense assumptions are based on the results of the latest expense and budget information.
The allocation of expenses between initial and renewal expenses is based on the latest expense analysis where expenses
are directly allocated based on the source of the expense. Where an expense could relate to both initial and renewal
functions, the expenses are allocated proportionately based on estimates of the functions performed.
Per policy expenses are projected to increase in line with consumer price inflation.
Material non-recurring expenses are excluded from the expense analysis used to derive the assumption.

D I S C O V E R Y A N N U A L R E P O R T 2 0 0 6 1 2 7
3. CRITICAL ACCOUNTING ESTIMATES AND JUDGMENTS IN APPLYING ACCOUNTING POLICIES (continued)HIV/AIDSFor individual business a fixed loading is applied to the expected best estimate mortality rates to allow for the expected
effect of AIDS. The loading varies based on socio-economic class. A HIV test is required for all individual policies with lump
sum life cover. Discovery Life further operates in the high end of the market where the AIDS risk is lower compared to the
full market. The additional loading for AIDS is set in consultation with external independent actuaries and reinsurers.
For group policies a loading is applied at the underwriting stage to allow for the expected effect of AIDS. The loading varies
based on the industry and geographic area and composition of the group and is derived from advice received from the
reinsurers. The loading then forms the AIDS assumption for group policies.
ReinsuranceAll prospective liabilities are valued gross of reinsurance and then adjusted for the expected effect of reinsurance. For
outstanding reported claims and incurred but not reported claims liabilities (IBNR), a specific allowance is made for
reinsurance recoveries.
The Global Linkage Benefit is fully reinsured. The cost of the future reinsurance is dependant on the cost at which the
reinsurer can hedge the liabilities under this benefit. Assumptions are made around the cost at which the reinsurer can
hedge the benefits, based on current and historic costs of the hedging structures.
Automatic premium increasesAutomatic premium increases could include both contractual and voluntary increases. No allowance is made for voluntary
premium increases when calculating liabilities under insurance contracts. Contractual premium increases are defined as
increases that cannot be cancelled by the policyholder without altering the terms of the benefits provided under the policy.
Contractual increases are included in the calculation of policyholder liabilities.
Policy alterationsIn the calculation of policyholder liabilities, no allowance is made for policy alterations over time in accordance with
actuarial guidance.
Changes in assumptionsAssumptions and methodologies are reviewed during each valuation. The impact of changes in the assumptions is reflected
in the income statement as the changes occur.
Modelling and assumptions changes were made to the valuation at 30 June 2006 to ensure that assumptions are in line
with the best estimate of future experience. The total effect of these changes was an increase in the liabilities on the
Financial Soundness Valuation basis of R0.4 million.
The key items of change were:
Reason for change Change in liabilities (R million)
Modelling changes1 (10.6)
Economic assumptions 25.8
Expense assumptions (5.5)
Automatic premium increases2 (141.9)
Surrender and lapse rates 87.1
Benefit enhancements3 46.1
Other (0.6)
Total 0.4
1 Modelling changes refers to refinements in the actuarial calculations. The model is reviewed at every valuation date and continual improvementsare made.
2 Due to greater credibility of past experience the discretionary margin for automatic premium increases was released.3 Benefit enhancements relate primarily to enhancements on the Integrator product.

D I S C O V E R Y A N N U A L R E P O R T 2 0 0 61 2 8
NOTES TO THE ANNUAL FINANCIAL STATEMENTS (continued)
for the year ended 30 June 2006
3. CRITICAL ACCOUNTING ESTIMATES AND JUDGMENTS IN APPLYING ACCOUNTING POLICIES (continued)SensitivitiesThe sensitivity of the policyholder liabilities on the Financial Soundness Valuation basis is set out below.
For each sensitivity illustrated, all other assumptions have been left unchanged. No allowance has been made for any
management action, for example premium increases, to react to the worse than expected experience.
Assets under Change frominsurance basecontracts assumptionR million %
Base: June 2006 assumptions 2 421
Lapses +10% (e.g. from x% to 1.1x%) 2 323 4.0%
Lapses -10% (e.g. from x% to 0.9x%) 2 519 (4.1%)
Investment return and inflation -1% (e.g. from 5% to 4%) 2 452 (1.3%)
Investment return and inflation +1% (e.g. from 5% to 6%) 2 382 1.6%
Expense assumption +10% 2 372 2.0%
Expense assumption -10% 2 468 (1.9%)
Mortality and Morbidity +10% 1 927 20.4%
Mortality and Morbidity -10% 2 934 (21.2%)
The sensitivities are purely for illustration purposes and do not represent the extremes of possible experience.
4. SEGMENT INFORMATION(a) Primary reporting format – business segments
At 30 June 2006, Discovery is organised into five business segments:
1) Health South Africa: administers and provides managed care services to medical schemes and renders administration
services to other business segments within the Group.
2) Health United States of America: offers consumer-driven health insurance products to employer groups and
individuals in the United States of America, together with Guardian Life Insurance Company of America and Tufts
Health Plan of Boston, Massachusetts. All contracts in this segment are short-term insurance contracts.
3) Health United Kingdom: offers consumer-engaged private medical insurance products to employer groups and
individuals in the United Kingdom, together with Prudential Assurance Company Limited. All contracts in this segment
are short-term insurance contracts.
4) Life: offers a range of insurance and financial solutions to the Group’s clients against the financial impact of lifestyle-
changing events. All contracts in this segment are long-term assurance contracts offered to both employer groups and
individuals in South Africa.
5) Vitality: offers health and lifestyle benefits with selected partners to the Group’s clients. This segment includes the
DiscoveryCard which is offered to clients within South Africa.

D I S C O V E R Y A N N U A L R E P O R T 2 0 0 6 1 2 9
Health
UnitedSouth States of United
R million Africa America Kingdom Life Vitality Total
4. SEGMENT INFORMATION (continued)30 June 2006
New business annualised
premium income* 2 505 796 282 789 107 4 479
Gross inflows under management* 16 542 1 322 141 1 768 654 20 427
Income statementInsurance premium revenue 74 911 71 1 768 – 2 824
Reinsurance premiums (2) (81) – (373) – (456)
Fee income 1 961 – – – – 1 961
Investment income and gains 34 9 4 382 10 439
Vitality income – – – – 654 654
Net income 2 067 839 75 1 777 664 5 422
Insurance benefits and claims (57) (656) (43) (592) – (1 348)
Insurance claims recovered
from reinsurers 2 76 – 296 – 374
Acquisition costs – (82) (8) (752) (66) (908)
Marketing and administration
expenses (1 319) (242) (153) (363) (547) (2 624)
Transfer from assets/liabilities
under insurance contracts (4) (77) (13) 562 – 468
Fair value adjustment to liabilities
under investment contracts – – – (121) – (121)
Expenses (1 378) (981) (217) (970) (613) (4 159)
Profit from operation 689 (142) (142) 807 51 1 263
BEE expenses (161)
Finance costs (21)
Foreign exchange loss – unrealised (7)
Share of profit from associate 2
Profit before taxation 1 076
Taxation (410)
Profit for the year 666
Other segment items included
in the income statement:
Depreciation (Note 5) 84 3 1 2 – 90
Amortisation (Note 6) 18 3 – 4 – 25
* New business annualised premium income and gross inflows under management includes flows of the schemes Discovery administers and 100%of the business conducted together with its joint venture partners.
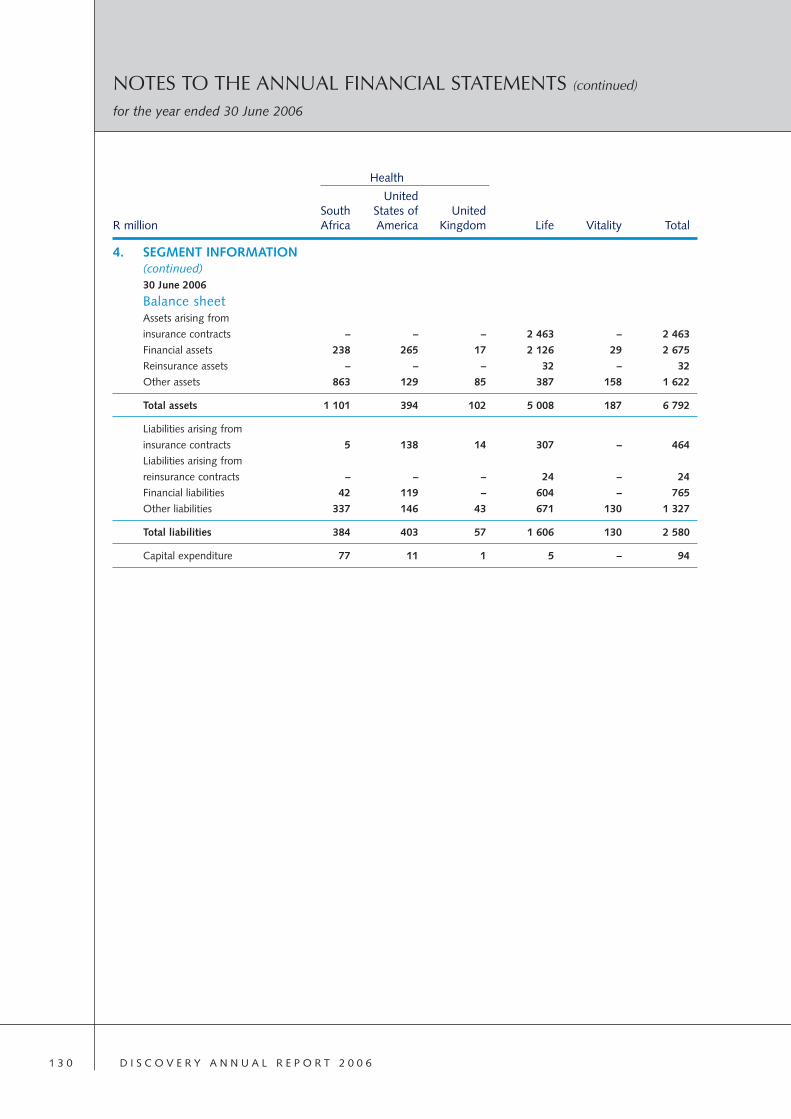
D I S C O V E R Y A N N U A L R E P O R T 2 0 0 61 3 0
NOTES TO THE ANNUAL FINANCIAL STATEMENTS (continued)
for the year ended 30 June 2006
Health
UnitedSouth States of United
R million Africa America Kingdom Life Vitality Total
4. SEGMENT INFORMATION (continued)30 June 2006
Balance sheetAssets arising from
insurance contracts – – – 2 463 – 2 463
Financial assets 238 265 17 2 126 29 2 675
Reinsurance assets – – – 32 – 32
Other assets 863 129 85 387 158 1 622
Total assets 1 101 394 102 5 008 187 6 792
Liabilities arising from
insurance contracts 5 138 14 307 – 464
Liabilities arising from
reinsurance contracts – – – 24 – 24
Financial liabilities 42 119 – 604 – 765
Other liabilities 337 146 43 671 130 1 327
Total liabilities 384 403 57 1 606 130 2 580
Capital expenditure 77 11 1 5 – 94

D I S C O V E R Y A N N U A L R E P O R T 2 0 0 6 1 3 1
Health
UnitedSouth States of United
R million Africa America Kingdom Life Vitality Total
4. SEGMENT INFORMATION (continued)30 June 2005
New business annualised
premium income* 2 776 809 35 629 93 4 342
Gross inflows under management* 14 571 914 11 1 278 521 17 295
Income statementInsurance premium revenue 18 537 5 1 278 – 1 838
Reinsurance premiums (3) (53) – (322) – (378)
Fee income 1 670 – – – – 1 670
Investment income and gains 27 4 5 237 8 281
Vitality income – – – – 521 521
Net income 1 712 488 10 1 193 529 3 932
Insurance benefits and claims (3) (392) (3) (430) – (828)
Insurance claims recovered
from reinsurers – 43 – 208 – 251
Acquisition costs – (42) – (617) (55) (714)
Marketing and administration
expenses (1 134) (183) (150) (272) (429) (2 168)
Transfer from assets/liabilities
under insurance contracts – – – 572 – 572
Fair value adjustment to liabilities
under investment contracts – – – (122) – (122)
Expenses (1 137) (574) (153) (661) (484) (3 009)
Profit from operations 575 (86) (143) 532 45 923
Finance costs (64)
Foreign exchange loss – unrealised (8)
Share of profit from associate 2
Profit before taxation 853
Taxation (305)
Profit for the year 548
Other segment items included
in the income statement:
Depreciation (Note 5) 105 4 – 4 – 113
Amortisation (Note 6) 19 2 – 2 – 23
* New business annualised premium income and gross inflows under management includes flows of the schemes Discovery administers and 100%of the business conducted together with its joint venture partners.

D I S C O V E R Y A N N U A L R E P O R T 2 0 0 61 3 2
NOTES TO THE ANNUAL FINANCIAL STATEMENTS (continued)
for the year ended 30 June 2006
Health
UnitedSouth States of United
R million Africa America Kingdom Life Vitality Total
4. SEGMENT INFORMATION (continued)30 June 2005
Balance sheetAssets arising from
insurance contracts – – – 1 881 – 1 881
Financial assets 221 172 10 1 710 47 2 160
Reinsurance contracts – – – 19 – 19
Other assets 633 98 114 293 82 1 220
Total assets 854 270 124 3 903 129 5 280
Liabilities arising from
insurance contracts – 59 2 248 – 309
Liabilities arising from
reinsurance contracts – – – 31 – 31
Financial liabilities 42 94 – 483 – 619
Other liabilities 312 109 20 498 92 1 031
Total liabilities 354 262 22 1 260 92 1 990
Capital expenditure 120 6 2 8 – 136
Inter-segment transfers or transactions are entered into under normal commercial terms and conditions that would be
available to unrelated third parties.
(b) Secondary reporting format – geographical segmentsDiscovery’s five business segments operate in three main geographical areas:
United States South Africa of America United Kingdom Total
R million 2006 2005 2006 2005 2006 2005 2006 2005
Insurance
premium revenue 1 842 1 296 911 537 71 5 2 824 1 838
Fee income 1 961 1 670 – – – – 1 961 1 670
Vitality income 654 521 – – – – 654 521
Total assets 6 296 4 886 394 270 102 124 6 792 5 280
Capital expenditure 82 128 11 6 1 2 94 136
Revenues are allocated based on the country in which the insurance or investment contracts are issued or fee income
and investment returns are earned.
Total assets and capital expenditure are allocated based on where the assets are located.

D I S C O V E R Y A N N U A L R E P O R T 2 0 0 6 1 3 3
5. PROPERTY AND EQUIPMENTYear ended 30 June 2005
Opening carrying amount 24 69 122 7 3 225
Foreign currency adjustments
on translation
– Cost – 1 1 – – 2
– Depreciation – – (1) – – (1)
Additions – 27 50 28 1 106
Disposals
– Cost – – (2) – (1) (3)
– Accumulated depreciation – – 2 – 1 3
Depreciation charge (1) (25) (83) (3) (1) (113)
Closing carrying amount 23 72 89 32 3 219
At 30 June 2005
Cost 27 184 452 39 5 707
Accumulated depreciation (4) (112) (363) (7) (2) (488)
Carrying amount 23 72 89 32 3 219
Year ended 30 June 2006
Opening carrying amount 23 72 89 32 3 219
Foreign currency adjustments
on translation
– Cost – – 1 1 – 2
– Depreciation – – (1) – – (1)
Additions – 18 23 19 – 60
Disposals
– Cost – (8) – (1) (2) (11)
– Accumulated depreciation – 7 – 1 1 9
Depreciation charge (1) (25) (59) (4) (1) (90)
Impairments recognised – – (2) – – (2)
Fully depreciated assets no longer
in use
– Cost – (35) (120) – – (155)
– Accumulated depreciation – 35 120 – – 155
Closing carrying amount 22 64 51 48 1 186
At 30 June 2006
Cost 27 159 345 58 3 592
Accumulated depreciation (5) (95) (294) (10) (2) (406)
Carrying amount 22 64 51 48 1 186
* The Group’s land and buildings are under a finance lease and therefore restricted. Refer to note 20 for details regarding the finance lease liability.The directors’ valuation of the land and buildings is R95 million.
ComputerLand Furniture, equipment Leaseholdand fittings and & operating improve- Motor
R million buildings* equipment systems ments vehicles Total
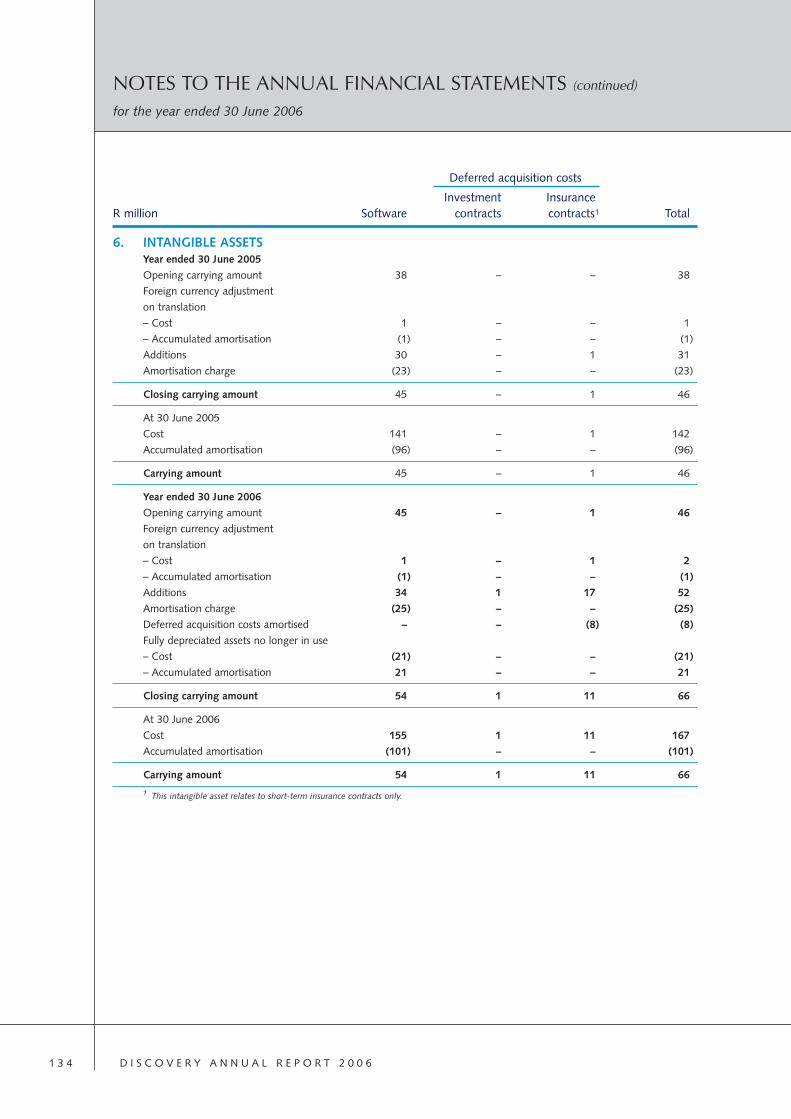
D I S C O V E R Y A N N U A L R E P O R T 2 0 0 61 3 4
NOTES TO THE ANNUAL FINANCIAL STATEMENTS (continued)
for the year ended 30 June 2006
Deferred acquisition costs
Investment InsuranceR million Software contracts contracts1 Total
6. INTANGIBLE ASSETSYear ended 30 June 2005
Opening carrying amount 38 – – 38
Foreign currency adjustment
on translation
– Cost 1 – – 1
– Accumulated amortisation (1) – – (1)
Additions 30 – 1 31
Amortisation charge (23) – – (23)
Closing carrying amount 45 – 1 46
At 30 June 2005
Cost 141 – 1 142
Accumulated amortisation (96) – – (96)
Carrying amount 45 – 1 46
Year ended 30 June 2006
Opening carrying amount 45 – 1 46
Foreign currency adjustment
on translation
– Cost 1 – 1 2
– Accumulated amortisation (1) – – (1)
Additions 34 1 17 52
Amortisation charge (25) – – (25)
Deferred acquisition costs amortised – – (8) (8)
Fully depreciated assets no longer in use
– Cost (21) – – (21)
– Accumulated amortisation 21 – – 21
Closing carrying amount 54 1 11 66
At 30 June 2006
Cost 155 1 11 167
Accumulated amortisation (101) – – (101)
Carrying amount 54 1 11 66
1 This intangible asset relates to short-term insurance contracts only.

D I S C O V E R Y A N N U A L R E P O R T 2 0 0 6 1 3 5
7. ASSETS ARISING FROM INSURANCE CONTRACTSLong-term insurance contracts – gross 2 522 1 935Less: recovery from reinsurers (59) (54)
Long-term insurance contracts – net 2 463 1 881
Non-current 2 463 1 881
Movement in long-term insurance contract liabilitiesBalance at the beginning of the year 1 881 1 318Movement for the year:Expected release of liability (70) (26)New business 563 575Experience variances 89 (48)
Mortality 2 –Reinsurance – (29)Lapses (39) (5)Policy alterations 72 (11)Premium increases 54 (3)
Modelling changes 11 (19)Benefit enhancements (46) (5)Changes in assumptions 35 86
Lapses (87) 10Economic basis (26) 27Premium increases 142 36Mortality and morbidity – 16Other 6 (3)
Balance at the end of the year 2 463 1 881
8. INVESTMENT IN ASSOCIATESHealthbridge (Proprietary) Limited 5 4PFM Financial Services (Proprietary) Limited 1 –Sedibeng (Proprietary) Limited 1 –
7 4
All the associates above are incorporated in South Africa.
Healthbridge (Proprietary) LimitedHealthbridge (Proprietary) Limited (Healthbridge) is a provider of electronic commerce communication infrastructure. Theinvestment consists of 300 shares of R1 each representing 30% of the issued ordinary share capital (2005: 30%).
Healthbridge prepares its financial statements to 30 September. As the most recent audited financial statements ofHealthbridge are for a period ended more than six months before the company’s year-end, unaudited results covering the period from its financial year-end have been used in determining the loss attributable to Discovery.
The cash flow requirements of Healthbridge are funded by the three main shareholders, Discovery Holdings Limited,Dimension Data Holdings Limited and Medscheme Holdings (Proprietary) Limited.
Discovery’s share of the accumulated deficit of Healthbridge of R15 million has been accounted for as the loan has beensubordinated.
GROUPR million 2006 2005
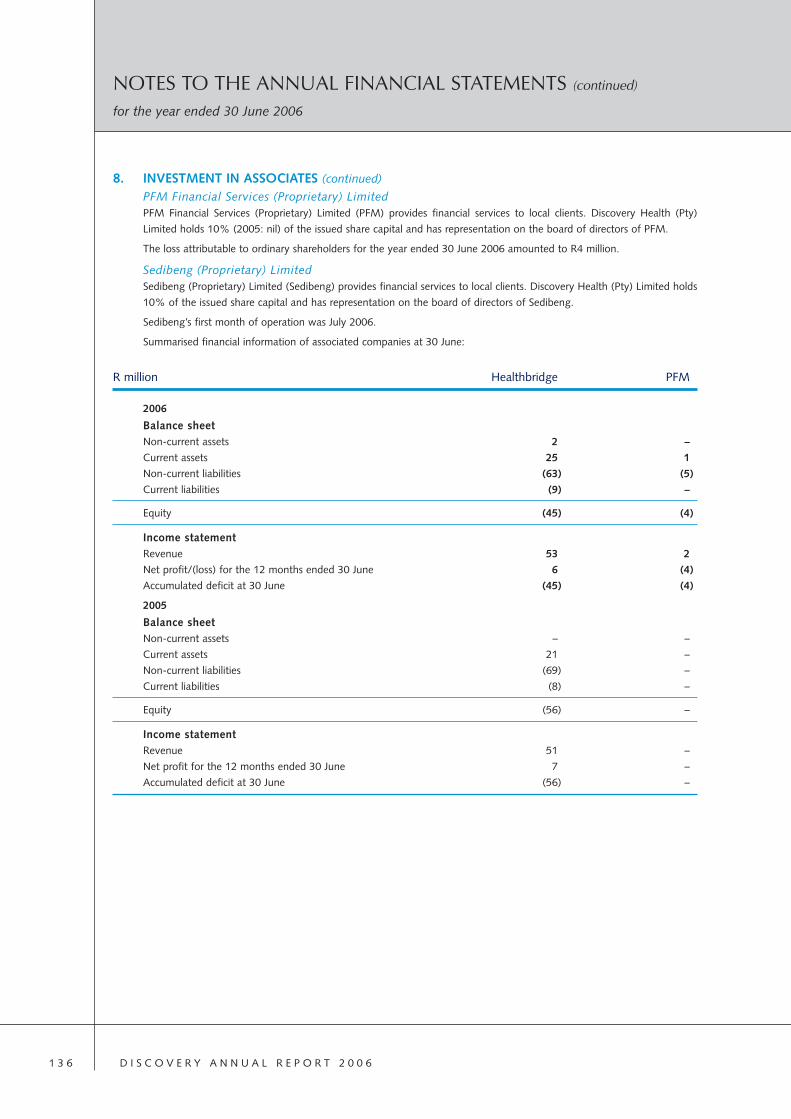
D I S C O V E R Y A N N U A L R E P O R T 2 0 0 61 3 6
NOTES TO THE ANNUAL FINANCIAL STATEMENTS (continued)
for the year ended 30 June 2006
8. INVESTMENT IN ASSOCIATES (continued)
PFM Financial Services (Proprietary) LimitedPFM Financial Services (Proprietary) Limited (PFM) provides financial services to local clients. Discovery Health (Pty)
Limited holds 10% (2005: nil) of the issued share capital and has representation on the board of directors of PFM.
The loss attributable to ordinary shareholders for the year ended 30 June 2006 amounted to R4 million.
Sedibeng (Proprietary) LimitedSedibeng (Proprietary) Limited (Sedibeng) provides financial services to local clients. Discovery Health (Pty) Limited holds
10% of the issued share capital and has representation on the board of directors of Sedibeng.
Sedibeng’s first month of operation was July 2006.
Summarised financial information of associated companies at 30 June:
R million Healthbridge PFM
2006
Balance sheetNon-current assets 2 –
Current assets 25 1
Non-current liabilities (63) (5)
Current liabilities (9) –
Equity (45) (4)
Income statementRevenue 53 2
Net profit/(loss) for the 12 months ended 30 June 6 (4)
Accumulated deficit at 30 June (45) (4)
2005
Balance sheetNon-current assets – –
Current assets 21 –
Non-current liabilities (69) –
Current liabilities (8) –
Equity (56) –
Income statementRevenue 51 –
Net profit for the 12 months ended 30 June 7 –
Accumulated deficit at 30 June (56) –

D I S C O V E R Y A N N U A L R E P O R T 2 0 0 6 1 3 7
9. INVESTMENT IN JOINT VENTUREPruHealth (Proprietary) LimitedPruHealth (Proprietary) Limited (PruHealth) provides consumer-engagedprivate medical insurance to clients in the United Kingdom. Discoveryholds 50% (2005: 50%) of the issued share capital of PruHealth.Discovery accounts for interests in jointly controlled entities byproportionate consolidation.
Summarised financial information of the joint venture company at 30 June:
Balance sheetNon-current assets 4 86Current assets 291 245Non-current liabilities – –Current liabilities (127) (48)
Equity 168 283
Income statementRevenue 141 11Expenses (340) (188)Net loss for the 12 months ended 30 June (238) (233)Accumulated deficit at 30 June (505) (267)
10. FINANCIAL ASSETSThe Group’s financial assets are summarised below by measurementcategory in the table below:
Available-for-sale 1 415 1 121
Equity investments 1 176 922Government and public authority stocks 181 146Money market 58 53
Fair value through profit and loss 624 483
Equity investments 424 337Government and public authority stocks 52 40Money market 148 106
Equity-linked notes – note 11 77 –Loans and receivables including insurance receivables – note 12 559 556
Total financial assets 2 675 2 160
Current 596 –Non-current 2 079 2 160
2 675 2 160
Listed 1 825 1 437Unlisted 850 723
2 675 2 160
The ten largest equity holdings comprise the following (in alphabetical order):
Anglo American plc, BHP Billiton plc, Bidvest Group Limited, Impala Platinum Holdings, MTN Group Limited, RemgroLimited, Richemont Securities AG, RMB Holdings Limited, Standard Bank Group Limited, Steinhoff International
GROUPR million 2006 2005

D I S C O V E R Y A N N U A L R E P O R T 2 0 0 61 3 8
NOTES TO THE ANNUAL FINANCIAL STATEMENTS (continued)
for the year ended 30 June 2006
GROUP% 2006 2005
10. FINANCIAL ASSETS (continued)Sectoral analysis of listed equities:Financial 25 33Resources 19 11Cyclical services 13 9Non-cyclical services 9 7Overseas instruments 7 7Non-cyclical consumer goods 7 12Basic industries 7 5Cyclical consumer goods 7 4Unit trusts 4 7General industrial 1 4Other 1 1
100 100
GROUPR million 2006 2005
11. EQUITY-LINKED NOTESAvailable-for-sale 56 – Fair value through profit and loss 21 –
77 –
The equity-linked notes are unlisted rand-denominated investments providing equity exposure together with a floor of 80% of the highest price observed since inception.
12. LOANS AND RECEIVABLESReceivables arising from insurance and reinsurance contracts:– premiums debtors 166 88– less provision for impairment of premiums debtors (24) (14)– reinsurance debtors 120 104Other loans and receivables:– Discovery Health Medical Scheme 202 189– deposits held by reinsurer – 79– closed scheme debtors 13 15– prepayments 25 12– forward exchange contract asset 3 31
– other debtors 108 126– less provision for impairment of other loans and receivables (54) (46)
Total loans and receivables 559 5562
Current portion 558 555Non-current portion 1 1
559 556
1 The forward exchange contract has been entered into to hedge administration fees receivable from PruHealth.2 The directors believe that the fair value approximates the carrying value of the loans and receivables.

D I S C O V E R Y A N N U A L R E P O R T 2 0 0 6 1 3 9
13. REINSURANCE ASSETSReinsurers’ share of insurance liabilities 32 19
Current 32 19
14. CASH AND CASH EQUIVALENTSCash at bank and in hand 301 313
Short-term deposits 1 021 603
1 322 916
The effective interest rate on short-term deposits was 6.9% and has an average maturity of 31 days.
Ordinary ShareNumber of shares premium Total
shares R million R million R million
15. SHARE CAPITAL AND SHARE PREMIUM15.1 Ordinary share capital and share premium
At 1 July 2004 532 415 681 1 1 440 1 441
Issued during the year 16 541 060 * 223 223
Share issue expenses – (1) (1)
At 30 June 2005 – Company share capital 548 956 741 1 1 662 1 663
Consolidation of share incentive trust (20 717 144) * (219) (219)
Shares issued at no value on redemption of
preference shares – * (108) (108)
At 30 June 2005 – Group share capital 528 239 597 1 1 335 1 336
At 1 July 2005 548 956 741 1 1 662 1 663
Issued during the year 42 996 439 * 58 58
Share issue expenses – (4) (4)
At 30 June 2006 – Company share capital 591 953 180 1 1 716 1 717
Consolidation of share incentive trusts and special
purpose vehicles (58 075 353) * (207) (207)
Shares issued at no value on redemption of
preference shares – * (162) (162)
At 30 June 2006 – Group share capital 533 877 827 1 1 347 1 348
* Amount is less than R500 000
The total authorised number of ordinary shares is 1 000 000 000 ordinary shares of 0.1 cents.
The unissued share capital is under the control of the directors of the company until the forthcoming annual general
meeting of shareholders.
GROUPR million 2006 2005

D I S C O V E R Y A N N U A L R E P O R T 2 0 0 61 4 0
NOTES TO THE ANNUAL FINANCIAL STATEMENTS (continued)
for the year ended 30 June 2006
15. SHARE CAPITAL AND SHARE PREMIUM (continued)15.2 Preference share capital
In June 2001, Discovery Life issued 1 500 000 “A” cumulative redeemable preference shares of 1 cent each to certain
directors and employees. The total authorised number of preference shares is 1 500 000 of 1 cent each.
All three tranches of one third each of the preference shares were redeemed on 31 August 2004, 30 June 2005 and
30 June 2006 respectively. All tranches were redeemed at a premium of R108.44 per share.
On redemption date, the preference shareholders were obliged to invest the full amount of cash received from Discovery
Life in Discovery Holdings ordinary shares. Discovery Holdings was, in turn, obliged to invest an equivalent amount in new
ordinary shares of Discovery Life.
Following the redemption of the all three tranches, the preference shareholders subscribed for 12 811 588 ordinary shares
in Discovery Holdings at a price of R12.57 per share. From a Group perspective, no cash has been received from the issue
of these shares and therefore on consolidation, the proceeds of these share issues have been eliminated.
15.3 Discovery Holdings share incentive trusts and special purpose vehicles
2006 2005Shares Shares
Number of ordinary shares allocated
at the beginning of the year 20 717 144 19 128 265
Number of ordinary shares issued during the year – 8 000 000
Number of ordinary shares issued in terms of the BEE transaction 38 725 909 –
Number of ordinary shares delivered to participants during the year (1 367 700) (6 411 121)
Number of ordinary shares allocated at the end of the year 58 075 353 20 717 144
For more details regarding the trusts refer to note 32.

D I S C O V E R Y A N N U A L R E P O R T 2 0 0 6 1 4 1
16. OTHER RESERVESReserve for revaluation of available-for-sale investments 319 209Currency translation reserve 112 98Share-based payment reserve 205 20Hedging reserve 4 3
Total other reserves at 30 June 640 330
Movements in the reserve for revaluation of available-for-sale investments were as follows:Balance at the beginning of the year 209 51Unrealised gains on investments 288 240Capital gains tax on unrealised gains on investments (39) (34)Realised gains on investments transferred to income statement (157) (53)Capital gains tax on realised gains on investments 18 5
Balance at end of year 319 209
Movements in the currency translation reserve were as follows:Balance at the beginning of the year 98 69Translation of foreign entities 14 29
Balance at end of year 112 98
Movements in the share-based payment reserve were as follows:Balance at the beginning of the year 20 –Increase in share-based payment reserve 185 20
Balance at end of year 205 20
Movements in the hedging reserve were as follows:Balance at the beginning of the year 3 (6)Transfer to hedging reserve 1 9
Balance at the end of the year 4 3
17. LIABILITIES ARISING FROM INSURANCE CONTRACTSGrossShort-term insurance contracts:– claims reported and loss adjustment expenses 228 196– claims incurred but not reported 228 102– unearned premiums 8 11
Total liabilities arising from insurance contracts, gross 464 309
Recoverable from reinsurersShort-term insurance contracts:– claims incurred but not reported (32) (19)
Total reinsurers’ share of liabilities arising from insurance contracts (32) (19)
NetShort-term insurance contracts:– claims reported and loss adjustment expenses 228 196– claims incurred but not reported 196 83– unearned premiums 8 11
Total liabilities arising from insurance contracts, net 432 290
Current 432 290
GROUPR million 2006 2005
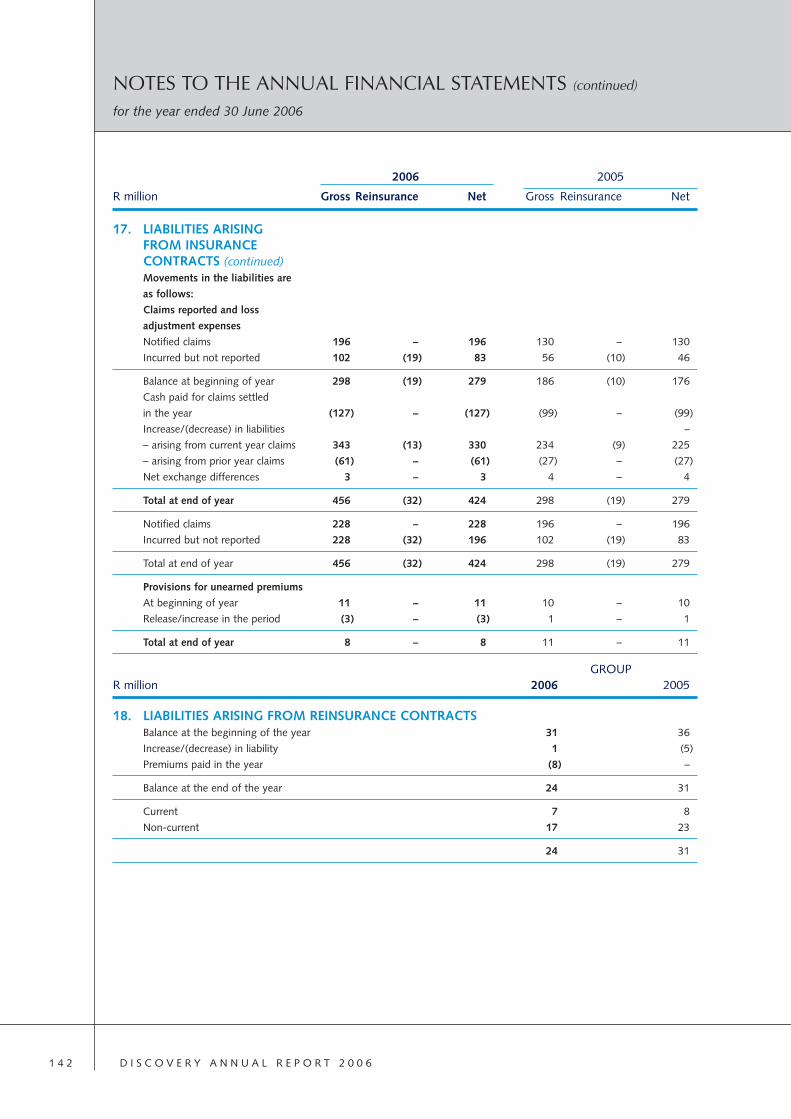
D I S C O V E R Y A N N U A L R E P O R T 2 0 0 61 4 2
NOTES TO THE ANNUAL FINANCIAL STATEMENTS (continued)
for the year ended 30 June 2006
2006 2005
R million Gross Reinsurance Net Gross Reinsurance Net
17. LIABILITIES ARISING FROM INSURANCE CONTRACTS (continued)Movements in the liabilities are
as follows:
Claims reported and loss
adjustment expenses
Notified claims 196 – 196 130 – 130
Incurred but not reported 102 (19) 83 56 (10) 46
Balance at beginning of year 298 (19) 279 186 (10) 176
Cash paid for claims settled
in the year (127) – (127) (99) – (99)
Increase/(decrease) in liabilities –
– arising from current year claims 343 (13) 330 234 (9) 225
– arising from prior year claims (61) – (61) (27) – (27)
Net exchange differences 3 – 3 4 – 4
Total at end of year 456 (32) 424 298 (19) 279
Notified claims 228 – 228 196 – 196
Incurred but not reported 228 (32) 196 102 (19) 83
Total at end of year 456 (32) 424 298 (19) 279
Provisions for unearned premiums
At beginning of year 11 – 11 10 – 10
Release/increase in the period (3) – (3) 1 – 1
Total at end of year 8 – 8 11 – 11
GROUPR million 2006 2005
18. LIABILITIES ARISING FROM REINSURANCE CONTRACTSBalance at the beginning of the year 31 36
Increase/(decrease) in liability 1 (5)
Premiums paid in the year (8) –
Balance at the end of the year 24 31
Current 7 8
Non-current 17 23
24 31

D I S C O V E R Y A N N U A L R E P O R T 2 0 0 6 1 4 3
19. INVESTMENT CONTRACTS AT FAIR VALUE THROUGH PROFIT AND LOSSThe movements during the year were as follows:
Balance at the beginning of the year 483 400
Premiums received 38 19
Fees deducted from account balances (13) (19)
Account balances paid on withdrawal and other terminations in the year (25) (39)
Investment return 121 122
Balance at the end of the year 604 483
Current 585 –
Non-current 19 483
604 483
The benefits offered under the Group’s unit-linked investment contracts
are based on the return of selected equities, debt securities and money
market instruments. This investment mix is unique, and it cannot be associated
to an individual benchmark index with a sufficiently high correlation with the
asset selection operated by the Group for its linked funds. The Group
communicates the actual performance of these contracts to its contract holders.
All financial liabilities at fair value through profit and loss are
designated by the Group to be in this measurement category.
20. BORROWINGS AT AMORTISED COSTBank loan 120 94
Finance lease liability 41 42
161 136
Current 121 94
Non-current 40 42
161 136
Bank loanOn 25 April 2005 Destiny Health entered into a revolving credit facility in an aggregate principal amount up to but not
exceeding US$20 million with HSBC Bank. The loan carries an interest rate of LIBOR plus 1.25%. The loan originally
matured on 25 April 2006 and was extended to 25 July 2006. The loan is guaranteed by Discovery Holdings Limited.
At 30 June 2006, US$16.5 million (June 2005: US$14 million) was outstanding under this facility. The carrying amount of
the bank loan approximates fair value.
GROUPR million 2006 2005

D I S C O V E R Y A N N U A L R E P O R T 2 0 0 61 4 4
NOTES TO THE ANNUAL FINANCIAL STATEMENTS (continued)
for the year ended 30 June 2006
20. BORROWINGS AT AMORTISED COST (continued)Finance lease liabilityThe finance lease is in respect of land and buildings purchased in
July 1998. The effective interest rate on the lease is at 25%. The fair
value of the finance lease liability is R59 million at 30 June 2006.
The minimum lease payments are as follows:
Not later than 1 year 11 10
Later than 1 year and not later than 5 years 68 55
Later than 5 years – 25
79 90
Future finance charges on finance lease (38) (48)
Finance lease liability 41 42
21. DEFERRED INCOME TAXDeferred tax asset 41 35
– Current 2 1
– Non-current 39 34
Deferred tax liability (518) (323)
– Current (23) (3)
– Non-current (495) (320)
(477) (288)
Movement summary:Balance at beginning of year (288) (98)
Income statement charge (165) (156)
Capital gains taxation on market value adjustments:
– charged to equity (22) (29)
– charged to investment contracts at fair value through profit and loss (2) (5)
Balance at end of year (477) (288)
GROUPR million 2006 2005

D I S C O V E R Y A N N U A L R E P O R T 2 0 0 6 1 4 5
21. DEFERRED INCOME TAX (continued)Deferred taxation comprises:Year ended 30 June 2006Deferred tax asset 35 – 6 41
Provisions 11 – 2 13Other deductible temporary differences– Operating leases 16 – 3 19– Finance lease 6 – – 6– Income received in advance 1 – – 1Share-based payments – – 1 1Value of company policyholder fundliabilities in excess of assets 1 – (1) –Value of untaxed fund liabilities in excess of assets – – 1 1
Deferred tax liability (323) – (195) (518)
Difference between accounting and tax balances arising from insurance contracts (252) – (169) (421)Capital gains tax on available-for-sale financial instruments (41) – (22) (63)Capital gains tax on at fair value through profit and lossfinancial instruments (10) – (2) (12)Difference between wear and tear and depreciation (14) – 1 (13)Other deductible temporary differences– Prepayments (3) – (3) (6)– Other (3) – – (3)
(288) – (189) (477)
Year ended 30 June 2005Deferred tax asset 30 (2) 7 35
Provisions 7 – 4 11Other deductible temporary differences– Operating leases 14 (1) 3 16– Finance lease 6 (1) 1 6– Income received in advance – – 1 1Value of company policyholder fundliabilities in excess of assets 3 – (2) 1
Deferred tax liability (128) 5 (200) (323)
Difference between accounting and tax balances arising from insurance contracts (87) 3 (168) (252)Capital gains tax on available-for-sale financial instruments (13) 1 (29) (41)Capital gains tax on at fair value through profit and lossfinancial instruments (5) – (5) (10)Difference between wear and tear and depreciation (15) 1 – (14)Other deductible temporary differences– Prepayments (6) – 3 (3)– Other (2) – (1) (3)
(98) 3 (193) (288)
Opening Tax rate Charge for ClosingR million balance reduction the year balance
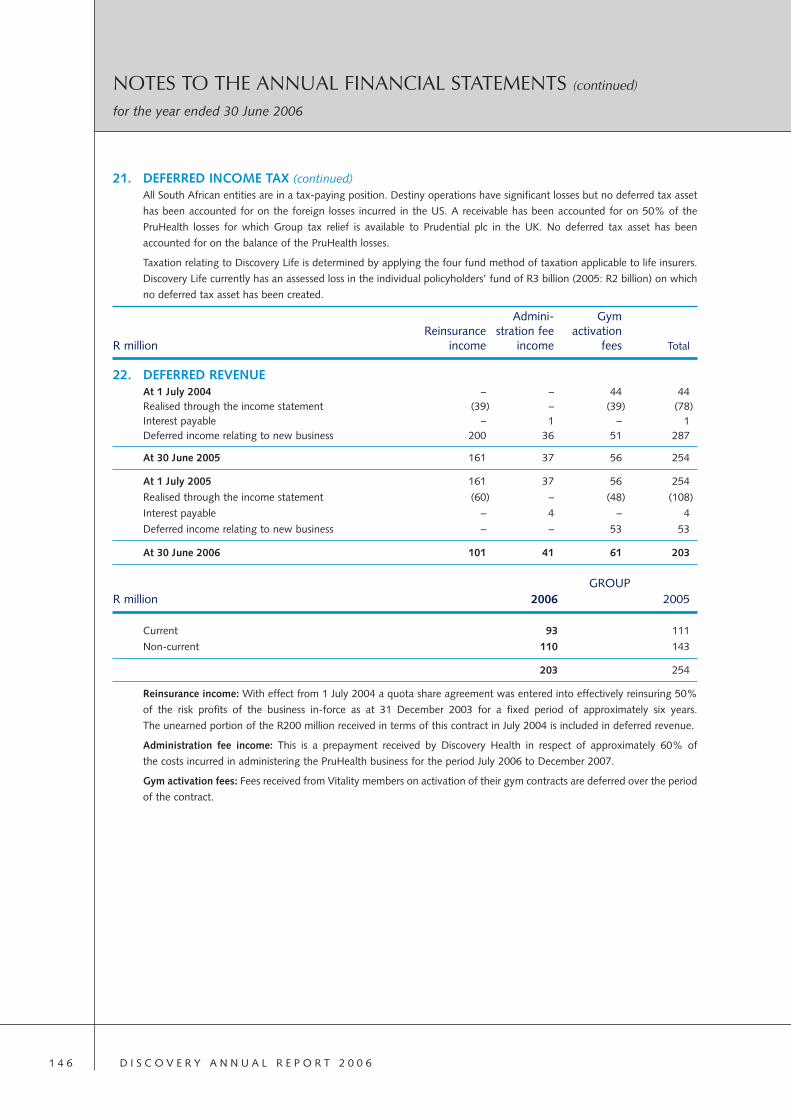
D I S C O V E R Y A N N U A L R E P O R T 2 0 0 61 4 6
NOTES TO THE ANNUAL FINANCIAL STATEMENTS (continued)
for the year ended 30 June 2006
21. DEFERRED INCOME TAX (continued)All South African entities are in a tax-paying position. Destiny operations have significant losses but no deferred tax asset
has been accounted for on the foreign losses incurred in the US. A receivable has been accounted for on 50% of the
PruHealth losses for which Group tax relief is available to Prudential plc in the UK. No deferred tax asset has been
accounted for on the balance of the PruHealth losses.
Taxation relating to Discovery Life is determined by applying the four fund method of taxation applicable to life insurers.
Discovery Life currently has an assessed loss in the individual policyholders’ fund of R3 billion (2005: R2 billion) on which
no deferred tax asset has been created.
Admini- GymReinsurance stration fee activation
R million income income fees Total
22. DEFERRED REVENUEAt 1 July 2004 – – 44 44Realised through the income statement (39) – (39) (78)Interest payable – 1 – 1Deferred income relating to new business 200 36 51 287
At 30 June 2005 161 37 56 254
At 1 July 2005 161 37 56 254
Realised through the income statement (60) – (48) (108)
Interest payable – 4 – 4
Deferred income relating to new business – – 53 53
At 30 June 2006 101 41 61 203
GROUPR million 2006 2005
Current 93 111
Non-current 110 143
203 254
Reinsurance income: With effect from 1 July 2004 a quota share agreement was entered into effectively reinsuring 50%
of the risk profits of the business in-force as at 31 December 2003 for a fixed period of approximately six years.
The unearned portion of the R200 million received in terms of this contract in July 2004 is included in deferred revenue.
Administration fee income: This is a prepayment received by Discovery Health in respect of approximately 60% of
the costs incurred in administering the PruHealth business for the period July 2006 to December 2007.
Gym activation fees: Fees received from Vitality members on activation of their gym contracts are deferred over the period
of the contract.

D I S C O V E R Y A N N U A L R E P O R T 2 0 0 6 1 4 7
23. PROVISIONSLeave pay
Opening balance 30 22
Charged to income statement 6 8
Closing balance 36 30
24. TRADE AND OTHER PAYABLESPayables and accrued liabilities 246 210
Personal medical funds 81 65
Payroll creditors 43 30
Value-added tax 20 16
Due to reinsurers 11 8
Other creditors 121 78
522 407
Current 522 407
25. NET INSURANCE PREMIUMSHealth 973 505
Recurring premiums 1 056 561
Reinsurance premiums (83) (56)
Individual life 1 252 864
Recurring premiums 1 542 1 125
Single premiums 5 –
Reinsurance premiums (295) (261)
Group life 143 91
Recurring premiums 221 152
Reinsurance premiums (78) (61)
2 368 1 460
Gross income of Group 2 824 1 838
Outward reinsurance premiums (456) (378)
2 368 1 460
26. INVESTMENT INCOMEAvailable-for-sale 35 25
– interest 7 5
– dividends 33 23
– investment charges (5) (3)
At amortised cost interest income 46 11
Cash and cash equivalents interest income 80 70
161 106
GROUPR million 2006 2005
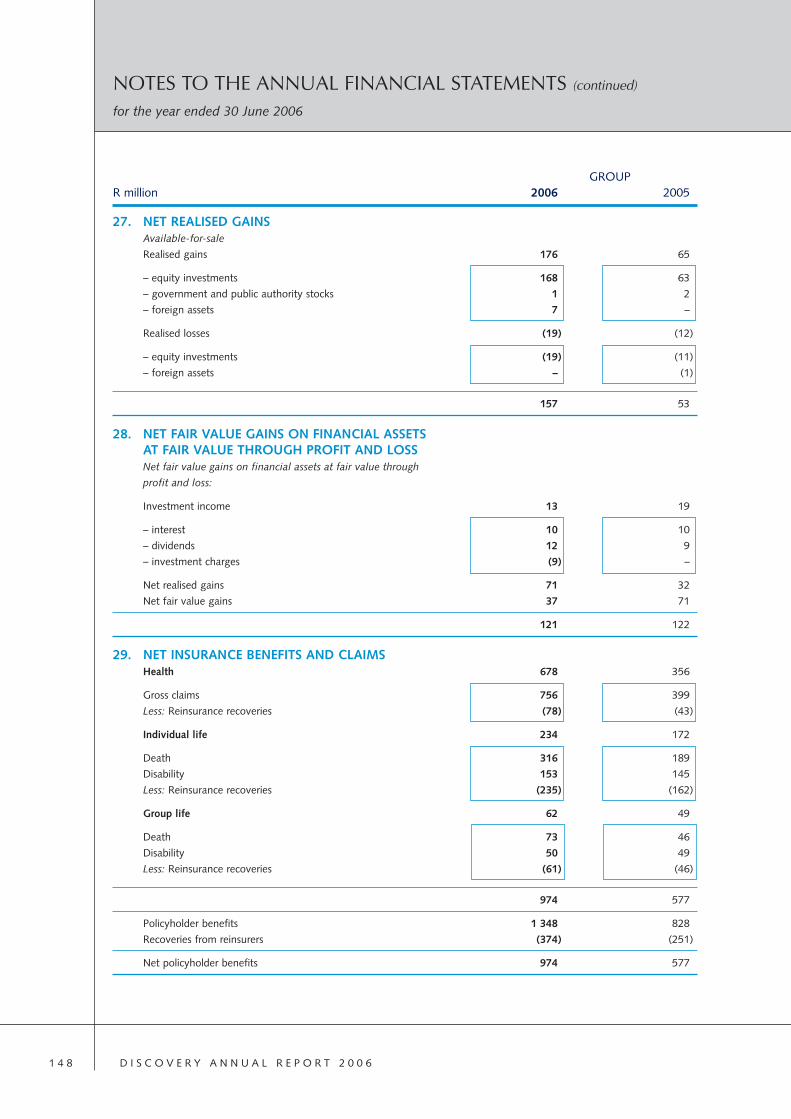
D I S C O V E R Y A N N U A L R E P O R T 2 0 0 61 4 8
NOTES TO THE ANNUAL FINANCIAL STATEMENTS (continued)
for the year ended 30 June 2006
27. NET REALISED GAINSAvailable-for-sale
Realised gains 176 65
– equity investments 168 63
– government and public authority stocks 1 2
– foreign assets 7 –
Realised losses (19) (12)
– equity investments (19) (11)
– foreign assets – (1)
157 53
28. NET FAIR VALUE GAINS ON FINANCIAL ASSETS AT FAIR VALUE THROUGH PROFIT AND LOSSNet fair value gains on financial assets at fair value through
profit and loss:
Investment income 13 19
– interest 10 10
– dividends 12 9
– investment charges (9) –
Net realised gains 71 32
Net fair value gains 37 71
121 122
29. NET INSURANCE BENEFITS AND CLAIMSHealth 678 356
Gross claims 756 399
Less: Reinsurance recoveries (78) (43)
Individual life 234 172
Death 316 189
Disability 153 145
Less: Reinsurance recoveries (235) (162)
Group life 62 49
Death 73 46
Disability 50 49
Less: Reinsurance recoveries (61) (46)
974 577
Policyholder benefits 1 348 828
Recoveries from reinsurers (374) (251)
Net policyholder benefits 974 577
GROUPR million 2006 2005

D I S C O V E R Y A N N U A L R E P O R T 2 0 0 6 1 4 9
30. ACQUISITION COSTSCommission expenses 917 716
Amortisation of deferred acquisition costs (9) (2)
908 714
31. MARKETING AND ADMINISTRATION EXPENSESMarketing and administration expenses comprises:
Employee costs 1 142 853
Marketing and distribution costs 253 277
IT systems and consumables 170 164
Building related and office costs 257 212
Depreciation and amortisation 115 136
Vitality benefit costs 523 412
Other costs 164 114
2 624 2 168
Marketing and administration expenses include the following:
Amortisation of intangible assets (note 6)
Software 25 23
Auditors’ remuneration
Audit fees
– current year 6 5
– prior year 1 (1)
Fees for other services – 3
7 7
Depreciation on property and equipment (note 5)
Land and buildings 1 1
Furniture, fittings and equipment 25 25
Computer equipment and operating systems 59 83
Leasehold improvements 4 3
Motor vehicles 1 1
90 113
GROUPR million 2006 2005
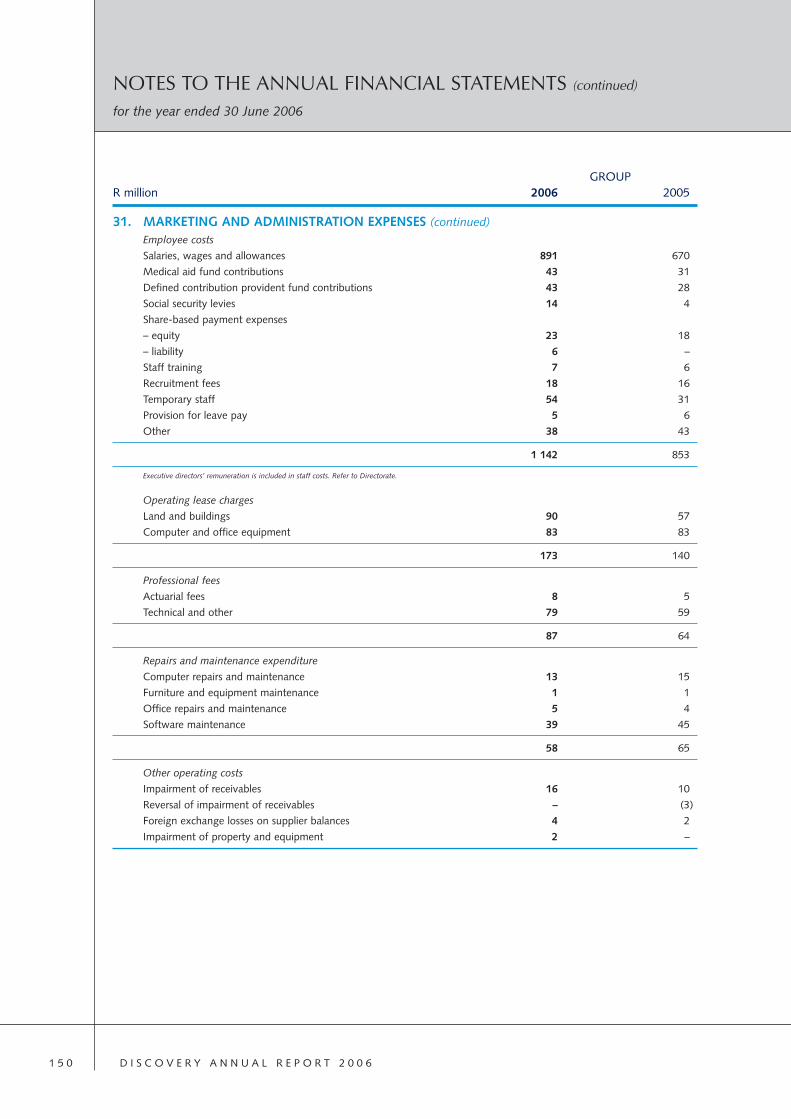
D I S C O V E R Y A N N U A L R E P O R T 2 0 0 61 5 0
NOTES TO THE ANNUAL FINANCIAL STATEMENTS (continued)
for the year ended 30 June 2006
31. MARKETING AND ADMINISTRATION EXPENSES (continued)Employee costs
Salaries, wages and allowances 891 670
Medical aid fund contributions 43 31
Defined contribution provident fund contributions 43 28
Social security levies 14 4
Share-based payment expenses
– equity 23 18
– liability 6 –
Staff training 7 6
Recruitment fees 18 16
Temporary staff 54 31
Provision for leave pay 5 6
Other 38 43
1 142 853
Executive directors’ remuneration is included in staff costs. Refer to Directorate.
Operating lease charges
Land and buildings 90 57
Computer and office equipment 83 83
173 140
Professional fees
Actuarial fees 8 5
Technical and other 79 59
87 64
Repairs and maintenance expenditure
Computer repairs and maintenance 13 15
Furniture and equipment maintenance 1 1
Office repairs and maintenance 5 4
Software maintenance 39 45
58 65
Other operating costs
Impairment of receivables 16 10
Reversal of impairment of receivables – (3)
Foreign exchange losses on supplier balances 4 2
Impairment of property and equipment 2 –
GROUPR million 2006 2005

D I S C O V E R Y A N N U A L R E P O R T 2 0 0 6 1 5 1
32. SHARE-BASED PAYMENT EXPENSES32.1 Staff incentive schemes
Discovery Holdings operates four share-based payment arrangements with employees. The details of these arrangements
are described below:
1. The Discovery Holdings Limited share trust
The Discovery Holdings incentive scheme is a “deferred implementation” incentive scheme. Options are exercised at the
market share price ruling on the date the options are allocated and must be exercised on that date. Shares offered to
participants are issued to the trust on the same date.
For options allocated prior to 2004, of the shares offered at option date, delivery may only be taken by the participant 2,
3, 4 and 5 years after the option is exercised at a rate of 25% per annum. Any shares not taken delivery of by the end of
the 5th year from the date the option is exercised, must be delivered to the participant.
For options allocated in 2004, of the shares offered at option date, delivery may only be taken by the participant 2, 3 and
4 years after the option is exercised at a rate of 33.3% per annum. Any shares not taken delivery of by the end of the 4th
year from the date the option is exercised, must be delivered to the participant.
No payment is required from the participant until delivery of the shares is taken. Payment for the shares must be made
before delivery of the shares can be taken. The trust has not offered loans to participants. All staff are eligible to participate
in the share incentive scheme.
2. BEE staff trust
5 290 000 Discovery Holdings’ shares were issued to the BEE staff trust for current and future employees. The trust consists
of two components; the allocation scheme and the option scheme as described below:
Allocation scheme
1 236 000 number of shares have been allocated to senior black employees based on level of seniority and length of past
service. The shares vest to employees 2, 3, 4 and 5 years after allocation at a rate of 25% per annum. On each vesting
date, the trustees shall distribute to the employees the allocated shares and cash, if any, to which the employee may
be entitled.
Option scheme
Options granted to black employees may be exercised 2, 3, 4 and 5 years after the option is granted at a rate of 25% per
annum. Any options not exercised by the end of the 5th year from the grant date shall lapse. On exercise of the option,
the employee pays cash to the trust for the full purchase price of the option.
3. The Destiny Health Inc. stock option plan
Options are granted at the fair value price at date of grant, currently US$3.33. Options vest 25% per year for 4 years and
must be exercised within 6 years of the date that 100% vest or the options expire.
The share option schemes mentioned in 1,2 and 3 above have been classified as equity-settled schemes and therefore, a
share-based payment reserve has been recognised.
4. The phantom scheme
Participants earn a cash bonus based on allocation of bonus scheme units which in turn are linked to the performance of
the Discovery share price. The bonus is earned if the participant is employed on each vesting date. The vesting of the
scheme is 2, 3, 4 and 5 years after allocation of the bonus units. The bonus may not be carried forward.
In the calculation of the bonus, the participants may choose to replicate the economics of a Discovery share or a call option
over a Discovery share or a combination of both. This scheme has been classified as a cash-settled scheme.

D I S C O V E R Y A N N U A L R E P O R T 2 0 0 61 5 2
NOTES TO THE ANNUAL FINANCIAL STATEMENTS (continued)
for the year ended 30 June 2006
32. SHARE-BASED PAYMENT EXPENSES (continued)The following is a summary of the terms and conditions of the share options granted:
Sharesunder Shares
Price Final option at Options Options Options underDate payable vesting beginning granted delivered cancelled rights atgranted per share date of year during year during year during year end of year
1. The Discovery Holdings Limited share trust01/11/2000 R10.32 01/11/2005 399 000 – (339 250) – 59 75001/11/2001 R10.20 01/11/2006 2 540 250 – (419 450) – 2 120 80001/03/2002 R7.80 01/03/2007 375 000 – – – 375 00001/09/2002 R7.20 01/09/2007 5 600 250 – (559 000) – 5 041 25030/09/2004 R14.40 30/09/2008 11 139 500 – (50 000) – 11 089 500
2. BEE staff trust13/09/2005 R21.47 13/09/2010 – 1 236 000 – – 1 236 00013/09/2005 R0.00 13/09/2010 – 3 766 600 – (518 650) 3 247 950
3. The phantom scheme30/09/2005 R21.50 30/09/2010 – 6 110 527 – (184 553) 5 925 97430/09/2005 R0.00 30/09/2010 – 616 406 – (49 475) 566 931
4. The Destiny Health Inc. stock option plan01/08/2001 $2.00 31/07/2005 16 250 – – – 16 25020/08/2001 $2.00 19/08/2005 10 000 – – – 10 00029/08/2001 $2.00 28/08/2005 10 000 – – – 10 00001/10/2001 $2.00 30/09/2005 375 – – – 37501/11/2001 $2.00 30/09/2005 15 000 – – – 15 00012/11/2001 $2.00 11/11/2005 1 250 – – – 1 25012/12/2001 $2.00 11/12/2005 2 000 – – – 2 00022/01/2002 $2.00 21/01/2006 1 000 – – – 1 00001/02/2002 $2.00 31/01/2006 2 000 – – – 2 00022/03/2002 $2.00 21/03/2006 1 000 – – – 1 00006/05/2002 $2.00 05/05/2006 1 000 – – – 1 00003/06/2002 $2.00 02/06/2006 15 000 – – – 15 00001/08/2002 $2.00 31/07/2006 2 000 – – – 2 00014/08/2002 $2.00 13/08/2006 2 000 – – – 2 00001/10/2002 $2.00 30/09/2006 1 000 – – – 1 00015/10/2002 $2.00 14/10/2006 1 000 – – – 1 00012/12/2002 $2.00 11/12/2006 2 000 – – – 2 00001/01/2003 $2.00 31/12/2006 30 000 – – – 30 00001/03/2003 $2.00 28/02/2007 33 250 – (5 000) – 28 25013/03/2003 $2.00 12/03/2007 1 000 – – – 1 00003/06/2003 $2.11 02/06/2007 3 000 – – – 3 00007/07/2003 $2.11 06/07/2007 75 272 – – – 75 27216/07/2003 $2.11 15/07/2007 5 000 – – – 5 00016/09/2003 $2.11 15/09/2007 432 000 – – (12 500) 419 50001/12/2003 $2.11 30/11/2007 18 750 – – – 18 75026/01/2004 $2.11 25/01/2008 300 000 – (150 000) (150 000) – 01/04/2004 $2.11 31/03/2008 5 000 – – – 5 00030/04/2004 $2.11 29/04/2008 5 000 – – – 5 00001/05/2004 $2.11 30/04/2008 5 000 – – – 5 00001/06/2004 $2.11 31/05/2008 50 000 – – – 50 00002/08/2004 $3.38 01/08/2008 80 000 – – – 80 00001/09/2004 $3.38 31/08/2008 5 000 – – – 5 00022/06/2005 $3.38 21/06/2009 702 000 – – (161 000) 541 00020/08/2005 $3.38 19/08/2009 – 30 000 – (30 000) – 17/01/2006 $3.33 16/01/2010 – 282 500 – – 282 50026/01/2006 $3.33 25/01/2010 – 20 000 – – 20 000
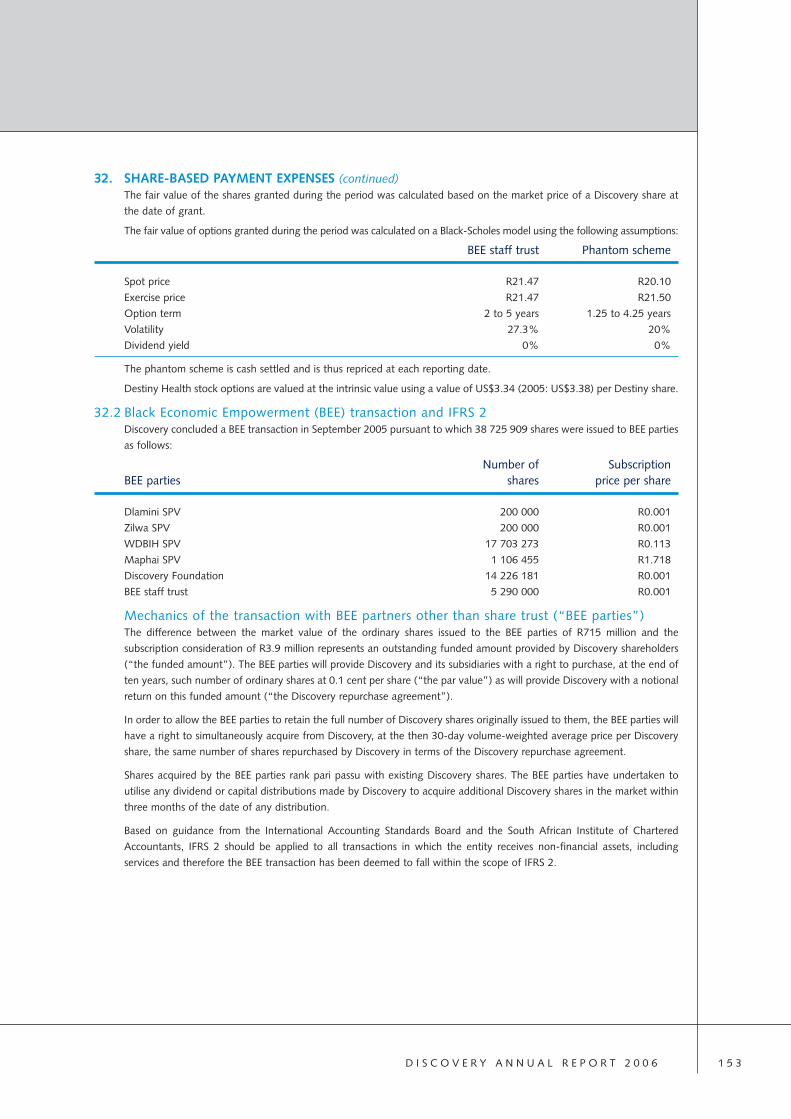
D I S C O V E R Y A N N U A L R E P O R T 2 0 0 6 1 5 3
32. SHARE-BASED PAYMENT EXPENSES (continued)The fair value of the shares granted during the period was calculated based on the market price of a Discovery share at
the date of grant.
The fair value of options granted during the period was calculated on a Black-Scholes model using the following assumptions:
BEE staff trust Phantom scheme
Spot price R21.47 R20.10
Exercise price R21.47 R21.50
Option term 2 to 5 years 1.25 to 4.25 years
Volatility 27.3% 20%
Dividend yield 0% 0%
The phantom scheme is cash settled and is thus repriced at each reporting date.
Destiny Health stock options are valued at the intrinsic value using a value of US$3.34 (2005: US$3.38) per Destiny share.
32.2 Black Economic Empowerment (BEE) transaction and IFRS 2Discovery concluded a BEE transaction in September 2005 pursuant to which 38 725 909 shares were issued to BEE parties
as follows:
Number of SubscriptionBEE parties shares price per share
Dlamini SPV 200 000 R0.001
Zilwa SPV 200 000 R0.001
WDBIH SPV 17 703 273 R0.113
Maphai SPV 1 106 455 R1.718
Discovery Foundation 14 226 181 R0.001
BEE staff trust 5 290 000 R0.001
Mechanics of the transaction with BEE partners other than share trust (“BEE parties”)The difference between the market value of the ordinary shares issued to the BEE parties of R715 million and the
subscription consideration of R3.9 million represents an outstanding funded amount provided by Discovery shareholders
(“the funded amount”). The BEE parties will provide Discovery and its subsidiaries with a right to purchase, at the end of
ten years, such number of ordinary shares at 0.1 cent per share (“the par value”) as will provide Discovery with a notional
return on this funded amount (“the Discovery repurchase agreement”).
In order to allow the BEE parties to retain the full number of Discovery shares originally issued to them, the BEE parties will
have a right to simultaneously acquire from Discovery, at the then 30-day volume-weighted average price per Discovery
share, the same number of shares repurchased by Discovery in terms of the Discovery repurchase agreement.
Shares acquired by the BEE parties rank pari passu with existing Discovery shares. The BEE parties have undertaken to
utilise any dividend or capital distributions made by Discovery to acquire additional Discovery shares in the market within
three months of the date of any distribution.
Based on guidance from the International Accounting Standards Board and the South African Institute of Chartered
Accountants, IFRS 2 should be applied to all transactions in which the entity receives non-financial assets, including
services and therefore the BEE transaction has been deemed to fall within the scope of IFRS 2.
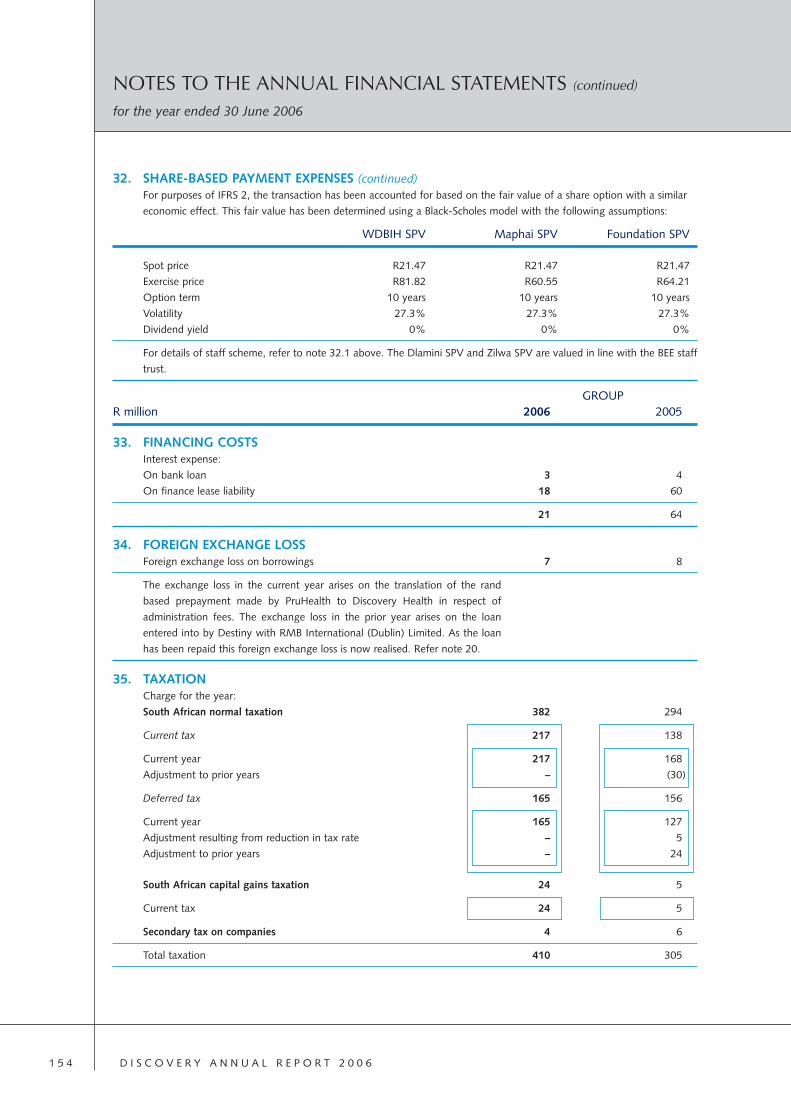
D I S C O V E R Y A N N U A L R E P O R T 2 0 0 61 5 4
NOTES TO THE ANNUAL FINANCIAL STATEMENTS (continued)
for the year ended 30 June 2006
32. SHARE-BASED PAYMENT EXPENSES (continued)For purposes of IFRS 2, the transaction has been accounted for based on the fair value of a share option with a similar
economic effect. This fair value has been determined using a Black-Scholes model with the following assumptions:
WDBIH SPV Maphai SPV Foundation SPV
Spot price R21.47 R21.47 R21.47
Exercise price R81.82 R60.55 R64.21
Option term 10 years 10 years 10 years
Volatility 27.3% 27.3% 27.3%
Dividend yield 0% 0% 0%
For details of staff scheme, refer to note 32.1 above. The Dlamini SPV and Zilwa SPV are valued in line with the BEE staff
trust.
GROUPR million 2006 2005
33. FINANCING COSTSInterest expense:
On bank loan 3 4
On finance lease liability 18 60
21 64
34. FOREIGN EXCHANGE LOSSForeign exchange loss on borrowings 7 8
The exchange loss in the current year arises on the translation of the rand
based prepayment made by PruHealth to Discovery Health in respect of
administration fees. The exchange loss in the prior year arises on the loan
entered into by Destiny with RMB International (Dublin) Limited. As the loan
has been repaid this foreign exchange loss is now realised. Refer note 20.
35. TAXATIONCharge for the year:
South African normal taxation 382 294
Current tax 217 138
Current year 217 168
Adjustment to prior years – (30)
Deferred tax 165 156
Current year 165 127
Adjustment resulting from reduction in tax rate – 5
Adjustment to prior years – 24
South African capital gains taxation 24 5
Current tax 24 5
Secondary tax on companies 4 6
Total taxation 410 305

D I S C O V E R Y A N N U A L R E P O R T 2 0 0 6 1 5 5
GROUP% 2006 2005
35. TAXATION (continued)Taxation rate reconciliationEffective taxation rate 38.1 35.8Destiny Health losses (4.0) (4.6)PruHealth losses (2.1) (2.1)Capital profits and dividend income 5.0 2.4Change in prior year estimate – (0.4)Secondary tax on companies (0.3) (0.7)Disallowed expenditure (5.2) (1.2)Deferred tax adjustment resulting from reduction in tax rate – 0.5Other permanent differences (2.5) (0.7)
Standard rate of taxation 29.0 29.0
Current taxation relating to Discovery Life is determined by applying the four fund method of taxation applicable to lifeinsurers.
Destiny Health has federal tax losses of US$115 million (R820 million) (2005: US$83 million (R554 million)) to carry
forward against future taxable income. These tax losses have not been recognised in the financial statements and are
available for set-off against future taxable profits.
GROUP2006 2005
36. EARNINGS PER SHAREBasic earnings per share
Earnings per share is based on net profit after tax attributable to equityholders and the weighted number of ordinary shares in issue.
Earnings attributable to equity holders (R’m) 669 557Weighted number of ordinary shares in issue (000’s) 528 946 519 188Basic earnings per share (cents) 126.5 107.3
Diluted earnings per share
Diluted earnings per share is calculated adjusting the weighted averagenumber of ordinary shares outstanding to assume conversion of alldilutive potential ordinary shares. Discovery has two categories ofdilutive potential ordinary shares namely:
– “A” cumulative redeemable preference shares which are convertedinto the number of ordinary shares that equates to the redemptionvalue of these shares; and
– shares issued from the share incentive trust which have not beendelivered to participants.
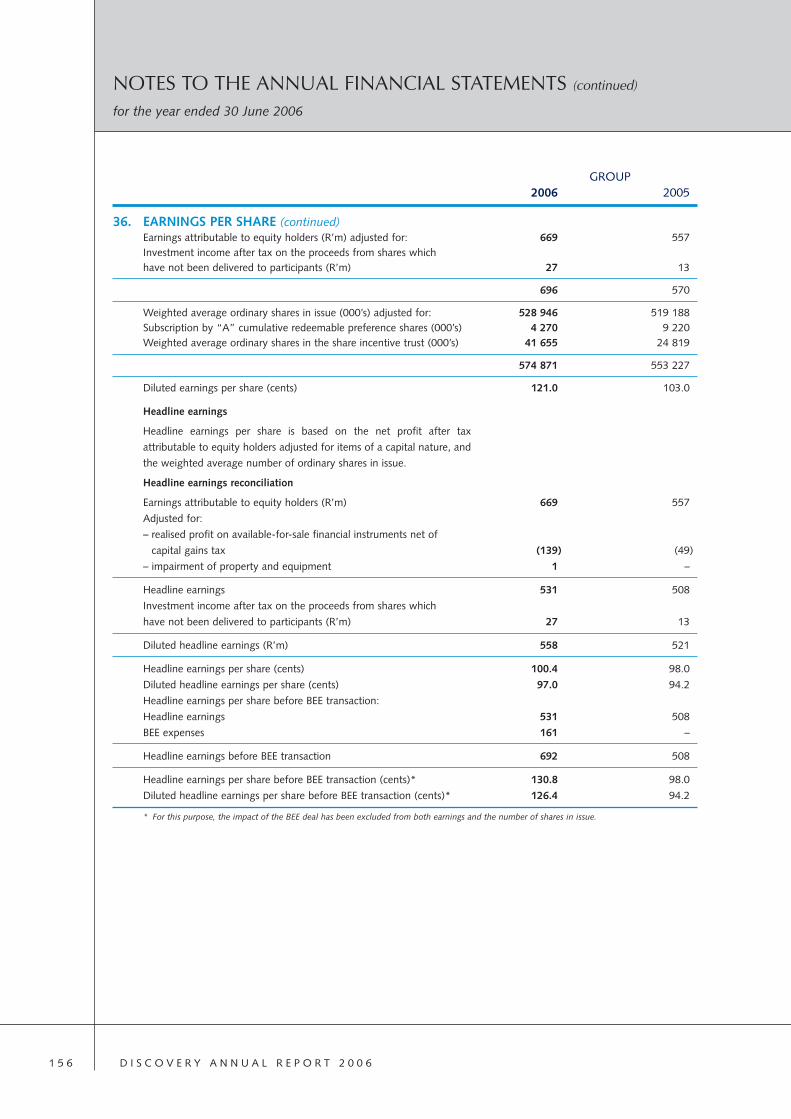
D I S C O V E R Y A N N U A L R E P O R T 2 0 0 61 5 6
NOTES TO THE ANNUAL FINANCIAL STATEMENTS (continued)
for the year ended 30 June 2006
36. EARNINGS PER SHARE (continued)Earnings attributable to equity holders (R’m) adjusted for: 669 557Investment income after tax on the proceeds from shares whichhave not been delivered to participants (R’m) 27 13
696 570
Weighted average ordinary shares in issue (000’s) adjusted for: 528 946 519 188Subscription by “A” cumulative redeemable preference shares (000’s) 4 270 9 220Weighted average ordinary shares in the share incentive trust (000’s) 41 655 24 819
574 871 553 227
Diluted earnings per share (cents) 121.0 103.0
Headline earnings
Headline earnings per share is based on the net profit after tax
attributable to equity holders adjusted for items of a capital nature, and
the weighted average number of ordinary shares in issue.
Headline earnings reconciliation
Earnings attributable to equity holders (R’m) 669 557
Adjusted for:
– realised profit on available-for-sale financial instruments net of
capital gains tax (139) (49)
– impairment of property and equipment 1 –
Headline earnings 531 508
Investment income after tax on the proceeds from shares which
have not been delivered to participants (R’m) 27 13
Diluted headline earnings (R’m) 558 521
Headline earnings per share (cents) 100.4 98.0
Diluted headline earnings per share (cents) 97.0 94.2
Headline earnings per share before BEE transaction:
Headline earnings 531 508
BEE expenses 161 –
Headline earnings before BEE transaction 692 508
Headline earnings per share before BEE transaction (cents)* 130.8 98.0
Diluted headline earnings per share before BEE transaction (cents)* 126.4 94.2
* For this purpose, the impact of the BEE deal has been excluded from both earnings and the number of shares in issue.
GROUP2006 2005
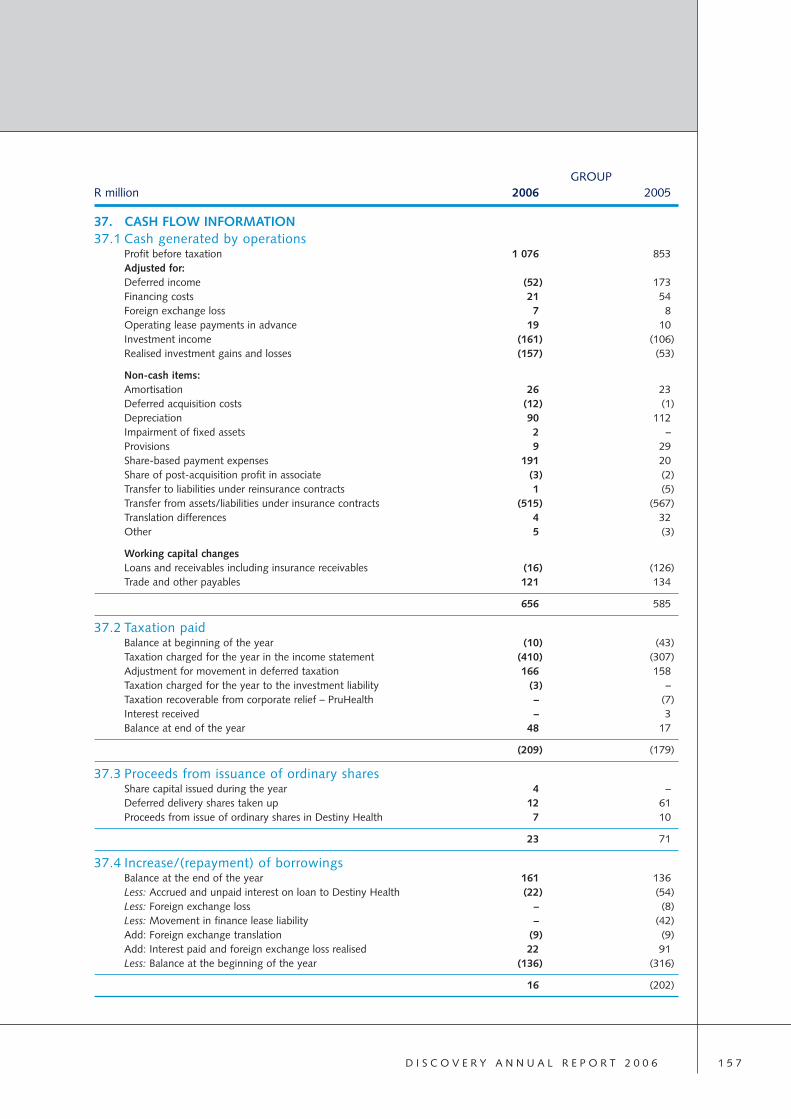
D I S C O V E R Y A N N U A L R E P O R T 2 0 0 6 1 5 7
37. CASH FLOW INFORMATION37.1 Cash generated by operations
Profit before taxation 1 076 853Adjusted for:Deferred income (52) 173Financing costs 21 54Foreign exchange loss 7 8Operating lease payments in advance 19 10Investment income (161) (106)Realised investment gains and losses (157) (53)
Non-cash items:Amortisation 26 23Deferred acquisition costs (12) (1)Depreciation 90 112Impairment of fixed assets 2 –Provisions 9 29Share-based payment expenses 191 20Share of post-acquisition profit in associate (3) (2)Transfer to liabilities under reinsurance contracts 1 (5)Transfer from assets/liabilities under insurance contracts (515) (567)Translation differences 4 32Other 5 (3)
Working capital changesLoans and receivables including insurance receivables (16) (126)Trade and other payables 121 134
656 585
37.2 Taxation paidBalance at beginning of the year (10) (43)Taxation charged for the year in the income statement (410) (307)Adjustment for movement in deferred taxation 166 158Taxation charged for the year to the investment liability (3) –Taxation recoverable from corporate relief – PruHealth – (7)Interest received – 3Balance at end of the year 48 17
(209) (179)
37.3 Proceeds from issuance of ordinary sharesShare capital issued during the year 4 –Deferred delivery shares taken up 12 61Proceeds from issue of ordinary shares in Destiny Health 7 10
23 71
37.4 Increase/(repayment) of borrowingsBalance at the end of the year 161 136Less: Accrued and unpaid interest on loan to Destiny Health (22) (54)Less: Foreign exchange loss – (8)Less: Movement in finance lease liability – (42)Add: Foreign exchange translation (9) (9)Add: Interest paid and foreign exchange loss realised 22 91Less: Balance at the beginning of the year (136) (316)
16 (202)
GROUPR million 2006 2005

D I S C O V E R Y A N N U A L R E P O R T 2 0 0 61 5 8
NOTES TO THE ANNUAL FINANCIAL STATEMENTS (continued)
for the year ended 30 June 2006
38. COMMITMENTS38.1 Capital commitments
Approved but not contracted for 159 155
These capital commitments relate to telecommunication, softwarepackages, software development, leasehold improvements, computer andother equipment. The capital commitments are to be incurred in theforthcoming year and are to be funded from internally generated funds.
38.2 Operating lease commitmentsDiscovery has various operating lease agreements for equipment andoffices. Most leases contain renewal options. Lease terms do not containrestrictions on Discovery’s activities concerning dividends, additionaldebt or further leasing.
Discovery leases certain land and buildings under operating leases.The remaining periods of the leases are from five months to seven years.The future minimum commitments in terms of the leases of land andbuildings, including Discovery’s operational head office, are as follows:
Due within one year 76 98Due within two to five years 268 325Due after five years 117 199
Cash flow commitment 461 622Accrued to a liability (64) (55)
Net commitment 397 567
Discovery leases certain computer and office equipment under operating leases.The remaining periods of the leases are from three months to three years. Thefuture minimum commitments are as follows:
Due within one year 55 59Due within two to five years 45 58
Cash flow commitment 100 117
39. CONTINGENCIESThe Group is exposed to various actual or potential claims. No material claims have been instituted against Discovery
Holdings Limited or any of its subsidiaries.
40. RELATED PARTIESList of related parties as defined:Holding company
Direct holding company: FirstRand Limited – controls 57.09% (2005: 62.29%) of the issued ordinary shares including BEEtransaction shares.Ultimate holding company: RMB Holdings Limited.
Fellow subsidiariesAll subsidiaries of the FirstRand Limited Group are fellow subsidiaries of Discovery Holdings Limited – a full list can beobtained from the company secretary and details are contained in the published annual report of FirstRand Limited.
SubsidiariesDirectly ownedDetails of subsidiaries directly owned by the Group are contained in company note 1.1.
GROUPR million 2006 2005

D I S C O V E R Y A N N U A L R E P O R T 2 0 0 6 1 5 9
40. RELATED PARTIES (continued)Joint venturesDetails of the joint venture of the Group is contained in note 9.
AssociatesDetails of associates of the Group are contained in note 8.
Key management personnelKey management personnel have been defined as Discovery Holdings Limited directors and executive committee members.
Details of the directors of Discovery Holdings Limited are to be found on page 64.
It is not considered necessary to disclose details of key management family members and their influenced or controlledseparate entities. To the extent specific transactions have occurred between the Group and these related parties (as definedin IAS 24) the details are included in the aggregate disclosure contained below under key management and wheresignificant, full details of all relationships and terms of the transactions are provided.
Summary of related party transactions:
For purposes of this section Discovery Holdings Limited will be referred to as the Company and where relevant, amountsare excluding value added taxation.
Direct holding company – FirstRand Limited
Investment in sharesDiscovery invests from time to time in securities issued by its holding company, FirstRand Limited for the benefit ofshareholders and policyholders.
Nominal holding Market value
FirstRand ordinary shares included in 2006 2005 2006 2005equity investments 000’s 000’s R’m R’m
– available-for-sale 845 1 717 14 285 23 816
– at fair value through profit and loss 313 643 5 282 8 921
Holdings as at 30 June 1 158 2 360 19 567 32 737
Ultimate holding company – RMB Holdings Limited
Investment in shares
Discovery invests from time to time in securities issued by its ultimate holding company, RMB Holdings Limited for the
benefit of shareholders and policyholders.
Nominal holding Market value
RMB Holdings ordinary shares included in 2006 2005 2006 2005equity investments 000’s 000’s R’m R’m
– available-for-sale 1 347 1 279 33 268 28 455
– at fair value through profit and loss 459 479 11 330 10 657
Holdings as at 30 June 1 806 1 758 44 598 39 112
GROUPR million 2006 2005
D I S C O V E R Y A N N U A L R E P O R T 2 0 0 61 6 0
NOTES TO THE ANNUAL FINANCIAL STATEMENTS (continued)
for the year ended 30 June 2006
40. RELATED PARTIES (continued)Transactions with entities in the RMB Holdings Limited GroupFirst National Bank, a division of FirstRand Bank Limited
Discovery has certain bank accounts with First National Bank. All bank charges and interest are calculated on an arm’s
length basis. Funds held at First National Bank at 30 June 2006 totalled R115 million (2005: R109 million).
Discovery Health administers call accounts on behalf of First National Bank. These call accounts comprise funds deposited
by Discovery Health’s clients to be used for (but not limited to) payment of their daily medical expenses not covered
by DHMS and the managed closed medical schemes. These call accounts amounted to R113 million at year-end
(2005: R159 million). These call accounts are neither assets nor liabilities of Discovery as it acts solely as administrator.
During the prior review, Discovery launched a joint venture with FNB card division whereby members of the Vitality
programme are offered substantial discounts on a Discovery branded credit card. In terms of the joint venture, Discovery
markets the card, manages the loyalty and related aspects of the card and operates a call centre to interact with
cardholders. FNB provides the banking licence required, provide all necessary credit and take the credit risk on the card. In
terms of this venture, Discovery received R82 million (2005: R46 million) in fees from FNB to fund the marketing spend,
loyalty programme and the card call centre.
Discovery Health (Pty) Limited enters into forward exchange contracts with First National Bank. In terms of these
contracts, Discovery Health agreed to sell GBP6 million (2005: GBP1 million) to First National Bank.
FirstRand Limited
Certain insured risks of Discovery are negotiated and/or included in the FirstRand Limited insurance programme. These
include R2.5 billion cover for professional indemnity and/or computer crime, R2.5 billion directors’ and officers’ cover and
R2.5 billion fidelity guarantee insurance.
Rand Merchant Bank, a division of FirstRand Bank Limited
Discovery has certain call accounts with Rand Merchant Bank. All bank charges and interest are calculated on an arm’s
length basis. Funds held at Rand Merchant Bank at 30 June 2006 totalled R2 million (2005: R1 million).
Rand Merchant Bank provided consulting and sponsor services to Discovery during the year totalling R6 million
(2005: R1 million).
Rand Merchant Bank International (Dublin) Limited (“RMBI”)
RMBI loaned Destiny Health R279 million in 2003 and a further US$10 million in 2005. Interest charged in 2005 totalled
R29 million. Both loans were repaid in 2005 resulting in an early settlement penalty of R25 million and realised forex losses
of R8 million.
RMB Asset Management (Proprietary) Limited
Discovery utilises RMB Asset Management to manage its investment portfolios. Investment management commission
percentages are fixed on an arm’s length basis. Discovery paid RMB Asset Management fees of R7 million (2005: R3 million).
The total assets under management amounted to R1 782 million (2005: R1 409 million).
RMB Properties (Proprietary) Limited
Discovery entered into property lease agreements with RMB Properties. These leases are based on market-related terms and
conditions. Discovery paid R10 million (2005: R9 million) in terms of a finance lease and R36 million (2005: R32 million) in
terms of an operating lease.
Transactions with other related partiesPrudential Health Limited (“PruHealth”)
In October 2004, Discovery launched PruHealth as a joint venture with Prudential Assurance Company Limited. In terms
of the joint venture arrangement, Discovery provides administration and other services to the joint venture. During the
year under review, Discovery received fees for these services of R92 million (2005: R74 million).

D I S C O V E R Y A N N U A L R E P O R T 2 0 0 6 1 6 1
40. RELATED PARTIES (continued)Discovery Health Medical Scheme (“DHMS”)
Discovery Health administers DHMS and provides managed care services for which it charges an administration fee and amanaged health care fee respectively. These fees are determined on an arm’s length basis and totalled R1 853 million(2005: R1 532 million) net of VAT. Discovery offers the members of DHMS access to the Vitality programme.
Interest paid to DHMS amounted to Rnil (2005: R1 million). DHMS owes Discovery R202 million (2005: R197 million) atyear-end.
Managed medical schemes
Discovery Health administers the following closed medical schemes:– Anglovaal Group Medical Scheme– CSIR Medical Scheme– Edcon Medical Aid Scheme– IBM (SA) Medical Aid Society– Tsogo Sun Group Medical Scheme– LA Health Medical Scheme– Quantum Medical Aid Society– Retail Medical Scheme– Lonmin Medical Scheme
Discovery Consulting Services
Discovery has established a network of 32 franchises in order to establish a national footprint for its products. Discoveryhas paid R173 million (2005: R167 million) in fees to the franchises.
The Discovery Foundation
The Discovery Foundation was established as part of Discovery’s BEE transaction announced on 13 September 2005.As part of the BEE transaction, the Foundation will have the majority of its trustees being black South Africans. Its objectivewill be the economic upliftment of black South Africans. Amongst its initial programmes, the Foundation will focus on theeducational and professional development of black South Africans for the medical and health care industry.
The Discovery Foundation received contributions from Discovery of R5 million during the year.
Transactions with share trusts
Interest-free loans to share trusts amounted to R206 million at 30 June 2006 (2005: R219 million).
Key management personnel of Discovery Holdings Limited, families of key management (as defined in IAS 24) and
entities significantly influenced or controlled by key management
(i) Discovery Holdings Limited directors’ and executive committee members’ aggregate compensation paid by the companyor on behalf of the company for services rendered to Discovery Holdings Limited:
COMPANYR million 2006 2005
Salaries and other short-term employee benefits 36 30Share-based payments– Non-executive directors : BEE transaction 5 – – Other key management personnel: BEE transaction 1 – – Other key management personnel: Other share-based payments 7 4Directors’ fees 2 1
Total 51 35Less: paid by subsidiaries (36)
Paid by holding company 15 35

D I S C O V E R Y A N N U A L R E P O R T 2 0 0 61 6 2
NOTES TO THE ANNUAL FINANCIAL STATEMENTS (continued)
for the year ended 30 June 2006
40. RELATED PARTIES (continued)(ii) Aggregate details of insurance, annuity and investment transactions between Discovery Holdings Limited, any subsidiary,
associate or joint venture of Discovery Holdings Limited and key management personnel, their families (as defined per IAS 24) and entities significantly influenced or controlled by key management:
Insurance contractsAggregate insured cover Premiums received Claims paid
R’000 2006 2005 2006 2005 2006 2005
Life 180 326 168 921 737 535 0 413
Investment contractsFund value
R’000 2006 2005
Balance at 1 July – – Premiums received 92 – Investment return credited net of charges 4 –
Balance at 30 June 96 –
(iii) Aggregate details of transactions between Vitality Healthstyle (Pty) Limited and key management personnel, their families(as defined per IAS 24) and entities significantly influenced or controlled by key management:
Vitality loyalty programmePremiums received Amounts paid
R’000 2006 2005 2006 2005
Vitality benefits 24 24 50 79
DiscoveryCard productCard fees received Discounts paid
R’000 2006 2005 2006 2005
DiscoveryCard 5 4 227 95
Key management personnel, their families (as defined per IAS 24) and entities significantly influenced or controlled by keymanagement accrued 1 357 919 Discovery miles as part of the DiscoveryCard loyalty programme for the year ended 30 June 2006 (2005: 343 687).
(iv) Aggregate shareholdings of key management personnel, their families (as defined per IAS 24) and entities significantlyinfluenced or controlled by key management, in Discovery Holdings Limited as at 30 June 2006 was 92 403 894 ordinaryshares (2005: 88 142 796 ordinary shares).
41. COMPARATIVE FIGURESWith the adoption of International Financial Reporting Standards, a number of comparatives have been restated and aredetailed on pages 164 to 167.
In addition substantial changes have been made to the format of the primary statements and notes.

D I S C O V E R Y A N N U A L R E P O R T 2 0 0 6 1 6 3
42. POST-BALANCE SHEET EVENTSWith effect from 1 July 2006, Destiny Health and Tufts Health Plan agreed to end their alliance formed three years ago tooffer a consumer-directed health plan in Massachusetts. The existing 10 000 members on the Liberty plan – the plan jointlymarketed by Destiny Health and Tufts Health Plan – will continue through to the completion of their respective plan years,with no change in benefits, networks and service levels until December 2007.
Subsequent to the year-end, Discovery Life has concluded a contract with Prudential Assurance Company Limited(“Prudential Assurance”), a wholly-owned subsidiary of Prudential plc, for the development and marketing of a newprotection product in the United Kingdom. The product will be marketed under the Prudential brand. Prudential Assurancehave begun initial marketing and roll-out of the product. The partnership is not expected to have a material impact onDiscovery’s earnings in the short-term.
With effect from 1 July 2006, Discovery Health has agreed to reduce the administration fee charged per member permonth to the Discovery Health Medical Scheme by approximately 10%.
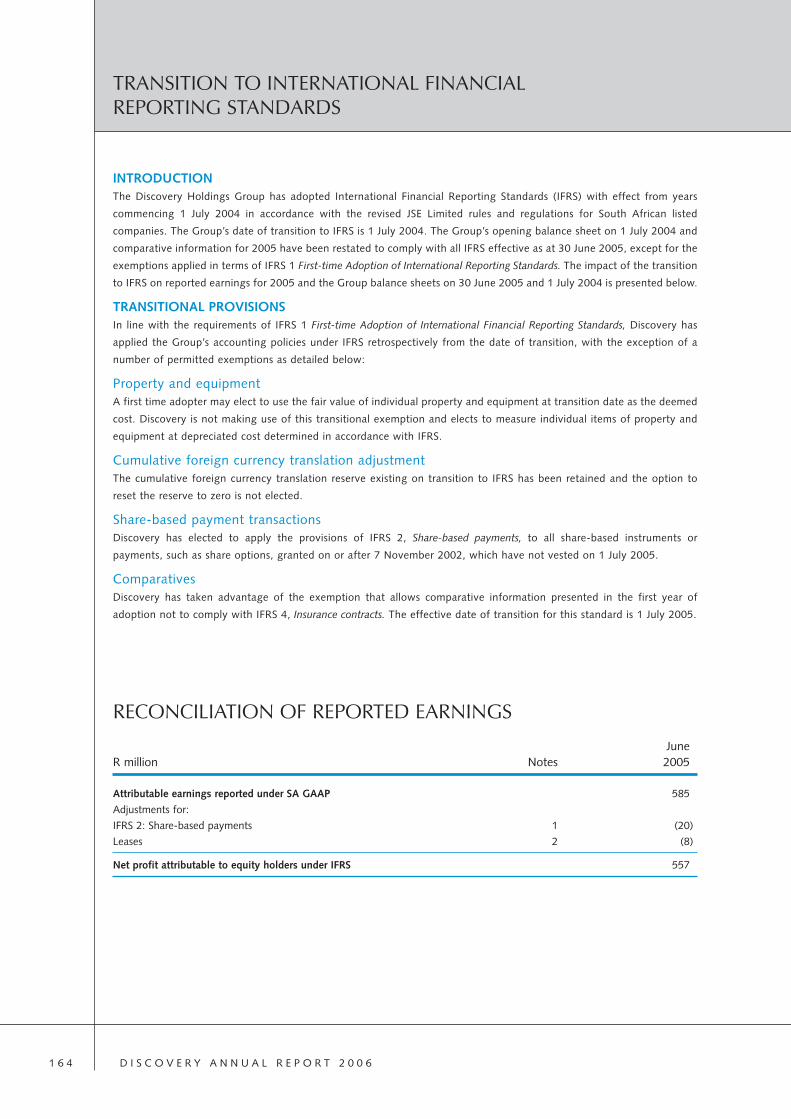
D I S C O V E R Y A N N U A L R E P O R T 2 0 0 61 6 4
TRANSITION TO INTERNATIONAL FINANCIALREPORTING STANDARDS
INTRODUCTIONThe Discovery Holdings Group has adopted International Financial Reporting Standards (IFRS) with effect from years
commencing 1 July 2004 in accordance with the revised JSE Limited rules and regulations for South African listed
companies. The Group’s date of transition to IFRS is 1 July 2004. The Group’s opening balance sheet on 1 July 2004 and
comparative information for 2005 have been restated to comply with all IFRS effective as at 30 June 2005, except for the
exemptions applied in terms of IFRS 1 First-time Adoption of International Reporting Standards. The impact of the transition
to IFRS on reported earnings for 2005 and the Group balance sheets on 30 June 2005 and 1 July 2004 is presented below.
TRANSITIONAL PROVISIONSIn line with the requirements of IFRS 1 First-time Adoption of International Financial Reporting Standards, Discovery has
applied the Group’s accounting policies under IFRS retrospectively from the date of transition, with the exception of a
number of permitted exemptions as detailed below:
Property and equipmentA first time adopter may elect to use the fair value of individual property and equipment at transition date as the deemed
cost. Discovery is not making use of this transitional exemption and elects to measure individual items of property and
equipment at depreciated cost determined in accordance with IFRS.
Cumulative foreign currency translation adjustmentThe cumulative foreign currency translation reserve existing on transition to IFRS has been retained and the option to
reset the reserve to zero is not elected.
Share-based payment transactionsDiscovery has elected to apply the provisions of IFRS 2, Share-based payments, to all share-based instruments or
payments, such as share options, granted on or after 7 November 2002, which have not vested on 1 July 2005.
ComparativesDiscovery has taken advantage of the exemption that allows comparative information presented in the first year of
adoption not to comply with IFRS 4, Insurance contracts. The effective date of transition for this standard is 1 July 2005.
RECONCILIATION OF REPORTED EARNINGS
JuneR million Notes 2005
Attributable earnings reported under SA GAAP 585
Adjustments for:
IFRS 2: Share-based payments 1 (20)
Leases 2 (8)
Net profit attributable to equity holders under IFRS 557

D I S C O V E R Y A N N U A L R E P O R T 2 0 0 6 1 6 5
ASSETSProperty and equipment 219 224
Intangible assets including deferred acquisition costs 46 38
Assets arising from insurance contracts 1 881 1 318
Investment in associate 4 2
Financial assets
– Equity investments 1 239 841
– Equity-linked notes 20 12
– Government and public authority stocks 186 182
– Money market 159 153
– Loans and receivables including insurance receivables 556 430
Deferred taxation 35 29
Reinsurance assets 19 10
Cash and cash equivalents 916 845
Total assets 5 280 4 084
EQUITYCapital and reserves
Share capital and share premium 1 336 1 276
Other reserves 330 114
Retained earnings 1 557 1 002
3 223 2 392
Minority interest 67 67
Total equity 3 290 2 459
LIABILITIESLiabilities arising from insurance contracts 298 193
Liabilities arising from reinsurance contracts 31 36
Financial liabilities
– Investment contracts at fair value through profit and loss 483 400
– Borrowings at amortised cost 136 356
Deferred income tax 323 128
Deferred revenue 265 54
Provisions 30 22
Trade and other payables 407 393
Taxation 17 43
Total liabilities 1 990 1 625
Total liabilities and shareholders’ funds 5 280 4 084
30 June 1 July2005 2004
R million Audited Audited
BALANCE SHEETPrepared in accordance with IFRS

D I S C O V E R Y A N N U A L R E P O R T 2 0 0 61 6 6
As previously reported 5 235 4 042 1 893 1 539 3 342 2 503
Adjustments for:
IFRS 2: Share-based payments 1 – – – – – –
Leases 2 45 42 97 86 (52) (44)
As reported under IFRS 5 280 4 084 1 990 1 625 3 290 2 459
RECONCILIATION OF CHANGES IN EQUITY
Attributable to ordinary shareholders
Share capital Share-
and based Invest-share payment ment Translation Hedging Retained Minority
R million Notes premium reserve reserve reserve reserve earnings interest Total
As at 1 July 2004
As previously
reported 1 276 – 51 69 (6) 1 046 67 2 503
Income statement
movements
Share-based payments 1 – – – – – – – –
Leases 2 – – – – – (44) – (44)
As reported under
IFRS 1 276 – 51 69 (6) 1 002 67 2 459
As at 30 June 2005
As previously
reported 1 336 – 209 98 3 1 629 67 3 342
Income statement
movements
Share-based payments 1 – 20 – – – (20) – –
Leases 2 – – – – – (52) – (52)
As reported under
IFRS 1 336 20 209 98 3 1 557 67 3 290
RECONCILIATION OF ASSETS, LIABILITIES AND EQUITY
Assets Liabilities Equity
30 June 1 July 30 June 1 July 30 June 1 JulyR million Notes 2005 2004 2005 2004 2005 2004

D I S C O V E R Y A N N U A L R E P O R T 2 0 0 6 1 6 7
NOTES ON THE TRANSITION TO IFRS
The basis of material adjustments, net of the associated tax impact, as shown in the accompanying restatement reconciliations
are noted below:
IFRS ADJUSTMENTS1. IFRS 2, Share-based Payments
Discovery grants share options to employees under employee share incentive schemes. Other than costs incurred in
administering the schemes, which were expensed as incurred, the schemes did not previously result in any expense in the
income statement, but rather a dilution in earnings per share when the shares were issued. In accordance with the
requirements of IFRS 2, Discovery now recognises an expense in the income statement, with a corresponding credit to
equity, representing the value of employee share options granted, recognised on a straight-line basis over the vesting
periods of the options.
Other adjustments
The process of using IFRS implies not only the use of such standards, but also uniformity in the way in which the standards
are applied. Increased global usage of international standards focuses attention on the way in which standards should be
applied, which in some cases may differ from South African practice.
2. Leases
In adopting IFRS, Discovery reassessed its lease contracts and disclosures and made the following adjustments:
Operating leases
In the past, a common interpretation of IAS 17 (AC 105) in South Africa allowed companies to recognise lease payments
on a cash basis as this was considered the most appropriate representation of the time pattern of the entity’s benefit
obtained from the leased asset. In aligning itself with IFRS, The South African Institute of Chartered Accountants (SAICA)
has revised its interpretation of IAS 17 (AC 105). As a result, operating lease expenses are now recognised on a straight-
line basis over the lease term, and not as cash is paid. This adjustment has been accounted for in terms of IAS 8 (AC 103)
with restatement of prior year figures where necessary.
Finance leases
In implementing IFRS, Discovery reassessed its lease contracts and has subsequently reclassified one lease as a finance
lease. This adjustment has been accounted for in terms of IAS 8 (AC 103) with restatement of prior year figures.
3. Cash equivalents and investments
In implementing IFRS, Discovery reassessed its disclosure of cash equivalents. Cash equivalents which are held in
investment portfolios have been reclassified to investments. In line with IAS 7, cash equivalents only include items held for
the purpose of meeting short-term cash commitments rather than for investing or other purposes.

D I S C O V E R Y A N N U A L R E P O R T 2 0 0 61 6 8
ASSETSInvestments in subsidiaries and associates 1 1 487 2 002
Loan to share incentive trust 2 207 194
Cash and cash equivalents 3 1 20
Total assets 1 695 2 216
EQUITYCapital and reserves
Share capital and share premium 4 1 716 1 663
Other reserves 200 –
Retained income (226) 553
Total equity 1 690 2 216
LIABILITIESTrade and other payables 5 –
Total liabilities 5 –
Total liabilities and equity 1 695 2 216
COMPANY INCOME STATEMENTfor the year ended 30 June 2006
Investment income 202 587
Marketing and administration expenses (6) (1)
Impairment of investment in subsidiaries (1 000) –
Fair value adjustment to the loan to share incentive trust 25 (11)
Profit for the year (779) 575
COMPANYR million Notes 2006 2005
Discovery Holdings Limited
COMPANY BALANCE SHEETat 30 June 2006
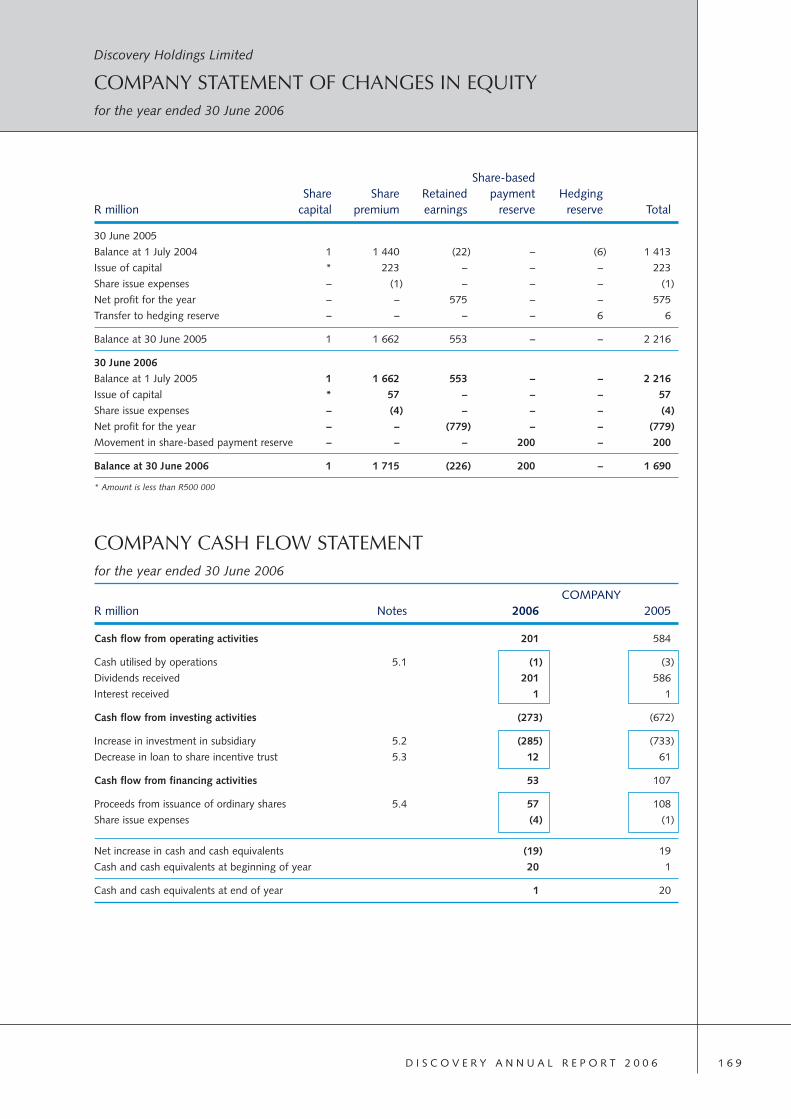
D I S C O V E R Y A N N U A L R E P O R T 2 0 0 6 1 6 9
Discovery Holdings Limited
COMPANY STATEMENT OF CHANGES IN EQUITYfor the year ended 30 June 2006
30 June 2005
Balance at 1 July 2004 1 1 440 (22) – (6) 1 413
Issue of capital * 223 – – – 223
Share issue expenses – (1) – – – (1)
Net profit for the year – – 575 – – 575
Transfer to hedging reserve – – – – 6 6
Balance at 30 June 2005 1 1 662 553 – – 2 216
30 June 2006
Balance at 1 July 2005 1 1 662 553 – – 2 216
Issue of capital * 57 – – – 57
Share issue expenses – (4) – – – (4)
Net profit for the year – – (779) – – (779)
Movement in share-based payment reserve – – – 200 – 200
Balance at 30 June 2006 1 1 715 (226) 200 – 1 690
* Amount is less than R500 000
COMPANY CASH FLOW STATEMENTfor the year ended 30 June 2006
COMPANYR million Notes 2006 2005
Cash flow from operating activities 201 584
Cash utilised by operations 5.1 (1) (3)
Dividends received 201 586
Interest received 1 1
Cash flow from investing activities (273) (672)
Increase in investment in subsidiary 5.2 (285) (733)
Decrease in loan to share incentive trust 5.3 12 61
Cash flow from financing activities 53 107
Proceeds from issuance of ordinary shares 5.4 57 108
Share issue expenses (4) (1)
Net increase in cash and cash equivalents (19) 19
Cash and cash equivalents at beginning of year 20 1
Cash and cash equivalents at end of year 1 20
Share-basedShare Share Retained payment Hedging
R million capital premium earnings reserve reserve Total

D I S C O V E R Y A N N U A L R E P O R T 2 0 0 61 7 0
1. INVESTMENTS IN SUBSIDIARIES AND ASSOCIATES
1.1 Investments in subsidiariesDiscovery Life Limited 1 016 962 100 100 1 282 1 148 – –
Discovery Health
(Proprietary) Limited * * 100 100 117 * 4 –
Vitality Healthstyle
(Proprietary) Limited * * 100 100 3 * – –
Destiny Health Inc1 768 590 98 98 0 578 – –
Discovery Nominees
(Proprietary) Limited ** ** 100 100 ** ** – –
Discovery Offshore
Holdings Limited2 331 276 100 100 85 276 – –
1 487 2 002 4 –
* Issued ordinary capital and shares at cost are R1 000.
** Issued ordinary capital and shares at cost are R1.
*** Issued ordinary capital and shares at cost are £1.
**** The amounts owing to a subsidiary are included in the balance sheet with current liabilities.1 Incorporated in the United States of America. Year-end is 31 December.2 Incorporated in England and Wales.
1.2 Investment in associateDiscovery has an investment in an associate company Healthbridge (Proprietary) Limited (“Healthbridge”), a provider of
electronic commerce communication infrastructure. The investment consists of 300 shares of R1 each representing 30%
of the issued ordinary share capital (2005: 30%). For more information refer to Group note 8.
1.3 Investment in joint ventureDiscovery has an investment in a joint venture, PruHealth (Proprietary) Limited (“PruHealth”), a provider of consumer-
engaged private medical insurance to clients in the United Kingdom. The investment consists of 283 500 shares of GBP1
each issued at GBP100 and 1 share issued at GBP1, representing 50% of the issued ordinary share capital (2005: nil). For
more information refer to Group note 9.
Issued ordinary Effective Shares at cost Amounts owingcapital percentage holding less impairment to subsidiary ****
Rm % Rm Rm2006 2005 2006 2005 2006 2005 2006 2005
Discovery Holdings Limited
NOTES TO THE ANNUAL FINANCIAL STATEMENTSfor the year ended 30 June 2006

D I S C O V E R Y A N N U A L R E P O R T 2 0 0 6 1 7 1
2. LOAN TO SHARE INCENTIVE TRUSTLoan to share incentive trust 207 219
Less: Fair value adjustments – (25)
207 194
The loan will be repaid on delivery of the shares under the
share incentive scheme. Refer to Group note 32.
3. CASH AND CASH EQUIVALENTSCash at bank and in hand 1 20
Ordinary ShareNumber of shares premium Total
shares R million R million R million
4. SHARE CAPITAL AND SHARE PREMIUMAt 1 July 2004 532 415 681 1 1 440 1 441
Issued during the year 16 541 060 * 223 223
Share issue expenses – (1) (1)
At 30 June 2005 548 956 741 1 1 662 1 663
At 1 July 2005 548 956 741 1 1 662 1 663
Issued during the year 42 996 439 * 57 57
Share issue expenses – (4) (4)
At 30 June 2006 591 953 180 1 1 715 1 716
* Amount is less than R500 000
The total authorised number of ordinary shares is 1 000 000 000 ordinary shares of 0.1 cents.
The unissued share capital is under the control of the directors of the company until the forthcoming annual general
meeting of shareholders.
COMPANYR million 2006 2005
D I S C O V E R Y A N N U A L R E P O R T 2 0 0 61 7 2
Discovery Holdings Limited
NOTES TO THE ANNUAL FINANCIAL STATEMENTS (continued)
for the year ended 30 June 2006
COMPANYR million 2006 2005
5. CASH FLOW INFORMATION5.1 Cash utilised by operations
Profit before taxation (779) 575
Adjusted for:
Investment income (202) (587)
Non-cash items:
Impairment of investment in subsidiaries 1 000 –
Fair value adjustment against loan to share incentive trust (25) 11
Working capital changes
Loans and receivables – (2)
Trade and other payables 5 –
(1) (3)
5.2 Increase in investment in subsidiaryBalance at the beginning of the year 2 002 1 269
Impairment of investment in subsidiaries (1 000) –
Share-based payment expense in respect of subsidiaries 200 –
Balance at the end of the year (1 487) (2 002)
Increase in investment in subsidiary (285) (733)
5.3 Decrease in loan to share incentive trustBalance at the beginning of the year 194 151
Shares issued to the trust – 115
Reversal/(provision) against loan to share incentive trust 25 (11)
Balance at the end of the year (207) (194)
12 61
5.4 Proceeds for shares issuedShare capital issued during the year 57 108
6. CONTINGENCIESDiscovery Holdings Limited has provided a guarantee in favour of HSBC Bank in the amount of US$20 million for the
working capital facility of Destiny Health Inc.
Discovery Holdings Limited has provided a guarantee in favour of HSBC Bank in the amount of GBP6.6 million in respect
of a guarantee issued by HSBC Bank for the future capital contributions of Discovery Offshore Holdings Limited to
Prudential Health Limited.
Discovery Holdings Limited has also provided the following guarantees:
– In terms of the alliance agreement with Guardian Life Insurance Company (“GLIC”), Discovery Holdings Limited has
guaranteed the obligations of Destiny to GLIC in terms of this agreement.
– In terms of the shareholders agreement between Discovery Offshore Holdings Limited, The Prudential Assurance
Company Limited and Prudential Health Limited, Discovery Holdings Limited has guaranteed the obligations of
Discovery Offshore Holdings Limited to The Prudential Assurance Company Limited and Prudential Health Limited in
terms of this agreement.
– Discovery Health provides certain administration and ancillary services to PruHealth in terms of the Insurance
Intermediary Services agreement. Discovery Holdings Limited has guaranteed the obligations of Discovery Health in
terms of this agreement.

D I S C O V E R Y A N N U A L R E P O R T 2 0 0 6 1 7 3
REMUNERATION AND FEESPayments to directors for the year ended 30 June 2006 for services rendered are as follows:
Provident Services Perform- fund
as Basic ance contri- Other TotalR’000 directors salary related butions benefits1 2006
EXECUTIVE
A Gore – 1 612 1 300 231 157 3 300NS Koopowitz – 1 840 1 330 92 44 3 306HP Mayers – 1 521 980 304 153 2 958JM Robertson – 1 231 1 056 245 26 2 558B Swartzberg – 1 421 1 110 143 36 2 710SD Whyte – 2 093 193 113 333 2 732
Subtotal – 9 718 5 969 1 128 749 17 564
NON-EXECUTIVE
Dr BA Brink2 111 – – – – 111JP Burger3 182 – – – – 182LL Dippenaar3 224 – – – – 224Dr NJ Dlamini 166 – – – – 166SB Epstein 300 – – – – 300MI Hilkowitz 91 – – – – 91Dr TV Maphai 78 – – – – 78S Sebotsa4 136 – – – – 136SV Zilwa 276 – – – – 276
Subtotal 1 564 – – – – 1 564
Total 1 564 9 718 5 969 1 128 749 19 128Less: paid by subsidiaries (1 564) (9 718) (5 969) (1 128) (749) (19 128)
Paid by holding company – – – – – –
DIRECTORATE

D I S C O V E R Y A N N U A L R E P O R T 2 0 0 61 7 4
REMUNERATION AND FEES (continued)Payments to directors for the year ended 30 June 2005 for services rendered are as follows:
Provident Services Perform- fund
as Basic ance contri- Other TotalR’000 directors salary related butions benefits1 2005
EXECUTIVEA Gore – 1 373 1 036 172 156 2 737
NS Koopowitz – 1 725 1 130 86 44 2 985
HP Mayers – 1 462 1 130 244 201 3 037
JM Robertson – 1 035 760 181 55 2 031
B Swartzberg – 1 205 829 120 36 2 190
SD Whyte – 1 911 533 129 – 2 573
Subtotal – 8 711 5 418 932 492 15 553
NON-EXECUTIVE
Dr BA Brink2 72 – – – – 72
JP Burger3 120 – – – – 120
LL Dippenaar3 115 – – – – 115
Dr NJ Dlamini 92 – – – – 92
SB Epstein 156 – – – – 156
MI Hilkowitz 89 – – – – 89
SV Zilwa 134 – – – – 134
Subtotal 778 – – – – 778
Total 778 8 711 5 418 932 492 16 331
Less: paid by subsidiaries (778) (8 711) (5 418) (932) (492) (16 331)
Paid by holding company – – – – – –
1 Other benefits comprises medical aid contributions, travel and other allowances.2 Directors’ fees for services rendered by Dr BA Brink are paid to Anglo American South Africa Limited.3 Directors’ fees for services rendered by JP Burger are paid to FirstRand Limited. Directors’ fees for services rendered by LL Dippenaar for the period
1 July 2005 to 31 December 2005 were paid to FirstRand Limited.4 Directors’ fees for services rendered by S Sebotsa are paid to WDB Holdings (Pty) Ltd.
The executive directors participate in group share incentive schemes. Their participation is subject to the approval of the Discovery
remuneration committee and allocations are done on pricing parameters consistent with those extended to other senior executives.
DIRECTORATE (continued)

D I S C O V E R Y A N N U A L R E P O R T 2 0 0 6 1 7 5
DIRECTORS’ INTERESTSAccording to the Register of Directors’ interests, maintained by Discovery in accordance with the provisions of section 140A
of the Companies Act, directors of Discovery have disclosed the following interest in the ordinary shares of the company at
30 June 2006.
Direct Indirect Total Totalbeneficial beneficial 2006 2005
Dr BA Brink 25 000 – 25 000 12 000
LL Dippenaar 159 938 405 535 565 473 565 473
Dr NJ Dlamini – 200 000 200 000 –
SB Epstein 34 750 – 34 750 –
A Gore 434 667 46 847 133 47 281 800 47 281 800
NS Koopowitz 342 029 1 703 863 2 045 892 1 671 664
Dr TV Maphai – 1 106 455 1 106 455 –
HP Mayers 94 753 6 120 499 6 215 252 4 208 419
JM Robertson 426 246 3 789 727 4 215 973 4 129 700
B Swartzberg 3 706 027 18 754 719 22 460 746 22 460 746
SD Whyte 2 412 056 – 2 412 056 2 762 056
SV Zilwa – 200 000 200 000 –
7 635 466 79 127 931 86 763 397 83 091 858
DISCOVERY LIFE PREFERENCE SHARESDuring the 2001 financial year, Discovery Life issued 1 500 000 preference shares to employees at a par value of 1 cent per share.
These shares are redeemable as set out in note 15.2 of the financial statements.
Of the total number of preference shares issued, the following were issued to directors:
Number of Benefit Benefitpreference derived derived
shares June 2006 June 2005
NS Koopowitz 175 000 6 326 250 12 652 500
HP Mayers 750 000 27 112 500 54 225 000
JM Robertson 30 000 1 084 500 2 169 000
Following the redemption, the preference shareholders subscribed for ordinary shares in Discovery Holdings Limited at a price of
R12.57 per share for the full value of the benefit derived.

D I S C O V E R Y A N N U A L R E P O R T 2 0 0 61 7 6
DIRECTORATE (continued)
SHARE OPTIONSOutstanding shares under options offered to and accepted by directors in terms of the share incentive schemes are as follows:
StrikeDiscovery share Outstanding price Strikeincentive scheme shares cents date
A Gore 100 000 780 01/03/2007
200 000 720 01/09/2007
250 000 1440 30/09/2008
200 0 13/09/2007
NS Koopowitz 375 000 780 01/03/2007
150 000 720 01/09/2007
250 000 1440 30/09/2008
200 0 13/09/2007
HP Mayers 100 000 780 01/03/2007
100 000 720 01/09/2007
250 000 1440 30/09/2008
200 0 13/09/2007
JM Robertson 100 000 780 01/03/2007
200 000 720 01/09/2007
250 000 1440 30/09/2008
200 0 13/09/2007
B Swartzberg 100 000 780 01/03/2007
200 000 720 01/09/2007
250 000 1440 30/09/2008
200 0 13/09/2007
SD Whyte 100 000 780 01/03/2007
200 000 720 01/09/2007
200 0 13/09/2007
StrikeDestiny stock Outstanding price Strikeoption plan shares US$ date
SD Whyte 15 000 2.00 01/11/2006
5 000 2.00 01/03/2007
20 000 2.11 16/09/2007
13 125 3.38 22/06/2009
4 375 – 22/06/2009
D I S C O V E R Y A N N U A L R E P O R T 2 0 0 6 1 7 7
SHAREHOLDERS ’INFORMAT ION
FOR THE YEAR ENDED 30 JUNE 2006
CONTENTS
Analysis of shareholders 178
Administration 179
Triple bottom line reporting 180
Notice of annual general meeting of shareholders 183
Form of Proxy 185
Notes to the form of proxy 186

1 – 1 000 shares 1 693 49.10 769 020 0.13
1 001 – 10 000 shares 1 270 36.83 4 353 799 0.74
10 001 – 100 000 shares 328 9.51 10 853 453 1.83
100 001 – 1 000 000 shares 120 3.48 40 705 046 6.88
1 000 001 shares and over 37 1.07 535 271 862 90.42
3 448 100.00 591 953 180 100.00
Number of Number ofDistribution of shares shareholders % shares %
Banks 52 1.51 6 490 245 1.10
Close Corporations 42 1.22 700 859 0.12
Empowerment 3 0.09 37 219 454 6.29
Endowment Funds 27 0.78 1 328 900 0.22
Individuals 2 649 76.83 23 798 196 4.02
Insurance Companies 32 0.93 10 083 706 1.70
Investment Companies 21 0.61 14 991 164 2.53
Medical Aid Schemes 4 0.12 321 910 0.05
Mutual Funds 106 3.07 27 145 306 4.58
Nominees and Trusts 225 6.53 55 039 870 9.30
Other Corporations 51 1.48 953 658 0.16
Pension Funds 143 4.15 27 165 530 4.59
Private Companies 82 2.38 28 587 617 4.83
Public Companies 10 0.29 338 967 026 57.26
Share Trust 1 0.03 19 159 739 3.24
3 448 100.00 591 953 180 100.00
Number of Number ofPublic/non-public shareholders shareholders % shares %
Non-public shareholders 17 0.49 481 069 228 81.27
Directors of the Company 12 0.35 86 763 397 14.65
Strategic Holdings (more than 10%) 1 0.03 337 926 638 57.09
Empowerment 3 0.08 37 219 454 6.29
Share Trust 1 0.03 19 159 739 3.24
Public shareholders 3 431 99.51 110 883 952 18.73
3 448 100.00 591 953 180 100.00
NumberBeneficial shareholders holding of 5% or more of shares %
FirstRand Limited 337 926 638 57.09
A Gore 47 281 800 7.99
D I S C O V E R Y A N N U A L R E P O R T 2 0 0 61 7 8
Discovery Holdings Limited
ANALYSIS OF SHAREHOLDERSfor the year ended 30 June 2006
Number of Number ofShareholding spread shareholders % shares %
D I S C O V E R Y A N N U A L R E P O R T 2 0 0 6 1 7 9
ADMINISTRATION
DISCOVERY HOLDINGS LIMITED(Registration number 1999/007789/06)
Share code: DSY
ISIN code: ZAE000022331
REGISTERED OFFICE155 West Street
Sandton
PO Box 786722
Sandton
2146
Telephone (011) 529 2888
Fax (011) 539 2958
E-mail: [email protected]
COMPANY SECRETARYMJ Botha
AUDITORSPricewaterhouseCoopers Inc.
STATUTORY VALUATORRD Williams
TRANSFER SECRETARIESComputershare Investor Services 2004 (Pty) Limited
Ground Floor
70 Marshall Street
Johannesburg
2001
PO Box 61051
Marshalltown
2017
SPONSORS (In terms of JSE Limited Listings Requirements)RMB Corporate Finance
1 Merchant Place
Cnr Fredman Drive and Rivonia Road
Sandton
2196
FINANCIAL CALENDARFinancial year-end 30 June
Annual general meeting 7 December 2006
REPORTSInterim results February
Annual results August
Annual report November
Dates are subject to change

D I S C O V E R Y A N N U A L R E P O R T 2 0 0 61 8 0
COMPLIANCE WITH GLOBAL REPORTING INITIATIVEThe schedule below references the GRI indices to this annual report and the accompanying abridged sustainability report.
GRIindicator Topic Page Section in these reports
GENERAL PERFORMANCE INDICATORS
Vision and strategy
1.1 Vision and strategy ifc Introductory section
9 Chief executive’s report
1.2 Key elements of report ifc Contents
Profile
2.1 Name of organisation – Front cover
2.2 Major products and services 2 Group operating structure
2.3 Operating structure 2 Group operating structure
2.4 Description of major divisions 2 Group operating structure
2.5 Countries in which the organisation is located 2 Group operating structure
2.6 Nature of ownership 178 Analysis of shareholders
2.7 Nature of markets served 10 Chief executive’s report
2.8 Scale of organisation 51 Embedded value
72 Annual financial statements
2.9 List of stakeholders – Website, Sustainability report
2.10 Contact details 179 Administration
2.11 Reporting period – Year to 30 June 2006
2.12 Date of previous report – 2005 annual report
2.13 Scope of report – Mainly South African
2.14 Significant changes to Group – Not applicable
2.15 Basis of reporting 85 Accounting policies
2.16 Restatement of information 164 Transition to IFRS
2.17 Decisions not to apply GRI principles – Not applicable
2.18 Definitions 52 Embedded value statement
85 Accounting policies
2.19 Significant changes in measurement methods 127 Notes to the annual financial statements
2.20 Practices to enhance quality reporting – Not commissioned
2.21 Independent assurance – Not commissioned
2.22 Access to additional information – www.discovery.co.za
Governance structure and management systems
3.1 Governance structures 67 Corporate governance
3.2 Independence of directors 67 Corporate governance
3.3 Expertise of board members 64 Directorate, secretary and corporate governance committees
3.4 Board processes 68 Corporate governance
3.5 Executive compensation 173 Directorate
TRIPLE BOTTOM LINE REPORTING

D I S C O V E R Y A N N U A L R E P O R T 2 0 0 6 1 8 1
GRIindicator Topic Page Section in these reports
Governance structure and management systems
3.6 Organisational structure and key 2 Group operating structureresponsible individuals 6 Group at a glance
3.7 Value statements 1 Introductory section8 Chief executive’s report
3.8 Communication with shareholders 179 Administration
3.9 Identification of major shareholders 178 Analysis of shareholders
3.10 Stakeholder consultation – Website, Sustainability report
3.11 Information from stakeholder consultations – Website, Sustainability report
3.12 Use of stakeholder consultation information – Website, Sustainability report
3.13 Precautionary principles 67 Corporate governance
3.14 Charters and principles – Website, Sustainability report67 Corporate governance
3.15 Membership of industry and business – Board of Healthcare Fundersassociation Private Healthcare Forum
The Life Offices’ Association of South AfricaThe Office of the Ombudsman for Long-Term Insurance
3.16 Procurement – Website, Sustainability report
3.17 Approach to managing indirect impacts of activities – Website, Sustainability report
3.18 Decisions regarding location and change 8 Chief executive’s report
3.19 Performance improvement 6 Group at a glance
3.20 Certification status – Not applicable
ECONOMIC PERFORMANCE INDICATORS
Economic performance indicators
EC1 Net sales/income 103 Income statement
EC2 Geographic breakdown of markets 128 Notes to the annual financial statements
EC3 Costs of all goods and material purchased 50 Value-added statement
EC4 Percentage of contract paid in accordancewith terms – Not available
EC5 Payroll and benefits 50 Value-added statement
EC6 Distribution to providers of capital 83 Directors’ report

D I S C O V E R Y A N N U A L R E P O R T 2 0 0 61 8 2
TRIPLE BOTTOM LINE REPORTING (continued)
GRIindicator Topic Page Section in these reports
ECONOMIC PERFORMANCE INDICATORS
Economic performance indicators
EC7 Increase/decrease in retained earnings 105 Statement of changes in equity
EC8 Total taxes 103 Income statement
EC9 Subsidies received – Not available
EC10 Donations to community and other groups – Website, Sustainability report
Environmental performance indicators
E1-E16 – Not material
SOCIAL PERFORMANCE INDICATORS
Labour practices
LA1 Breakdown of workforce – Website, Sustainability report
LA2 Net employment creation – Website, Sustainability report
LA3 Union representation – Not applicable
LA4 Consultation with employees – Website, Sustainability report
LA5 Notification of accidents and diseases – Website, Sustainability report
LA6 Health and safety committees – Website, Sustainability report
LA7 Work days lost – Website, Sustainability report
LA8 Policies and programmes on AIDS – Website, Sustainability report
LA9 Training per employee – Website, Sustainability report
LA10 Employment equity – Website, Sustainability report
LA11 Categorisation of staff – Website, Sustainability report
Human rights
HR1 – HR7 Aspects of human rights – Human rights are recognised and observed. The Groupabides with the South African Constitution in this regard.
Society
SO1 Policies to manage impacts on communities – Website, Sustainability report
SO2 Bribery and corruption – Website, Sustainability report
SO3 Political contributions – Contributions to political parties are not permitted
Product responsibility
PR1 Customer health and safety – Limited relevance
PR2 Product information – Website, Sustainability report
PR3 Consumer privacy – Website, Sustainability report

D I S C O V E R Y A N N U A L R E P O R T 2 0 0 6 1 8 3
DISCOVERY HOLDINGS LIMITED
(Registration number: 1999/007789/06)
ISIN: ZAE000022331
Share code: DSY
Notice is hereby given that the seventh annual general
meeting of the shareholders of Discovery Holdings
Limited (“the company”) will be held in the Auditorium,
Ground Floor, 155 West Street, Sandton, on Thursday,
7 December 2006 at 09:00 for the following purposes:
ORDINARY BUSINESS1. To receive, consider and approve the annual financial
statements for the year ended 30 June 2006 and the
report of the directors and the auditors thereon.
2. To confirm the appointment of Dr TV Maphai as a
director on 8 December 2005.
3. To confirm the appointment of Ms S Sebotsa as a
director on 8 December 2005.
4. To elect a director in place of Mr LL Dippenaar who retires
in accordance with the company’s Articles of Association,
but, being eligible, offers himself for re-election.
5. To elect a director in place of Mr JP Burger who retires in
accordance with the company’s Articles of Association,
but, being eligible, offers himself for re-election.
6. To elect a director in place of Dr BA Brink who retires in
accordance with the company’s Articles of Association,
but, being eligible, offers himself for re-election.
7. To elect a director in place of Dr NJ Dlamini who retires
in accordance with the company’s Articles of Association,
but, being eligible, offers herself for re-election.
8. To confirm the directors’ fees paid by the company
for the year ended 30 June 2006 as per note 40 of
the annual financial statements.
9. To confirm the reappointment of Pricewaterhouse-
Coopers Inc. as auditors until the forthcoming annual
general meeting.
10. To authorise the directors to fix and pay the auditors’
remuneration for the year ended 30 June 2006.
11. To transact such other business as may be transacted
at an annual general meeting.
SPECIAL BUSINESSShareholders will be asked to consider and, if deemed fit,
to pass the following resolutions with or without
amendments:
Ordinary resolution number 1Resolved that the authorised but unissued ordinary shares
in the capital of the company be placed under the control
of the directors who shall be authorised to allot these
shares on such terms and conditions and at such times as
they deem fit subject to the provisions of the Companies
Act, (Act 61 of 1973), as amended (“the Companies
Act”), the Articles of Association of the company, and the
Listings Requirements of the JSE Limited Securities
Exchange South Africa (“JSE”) when applicable.
Ordinary resolution number 2Resolved that the company’s directors be authorised by
way of a general authority to issue ordinary unissued
shares in the company for cash as and when suitable
opportunities arise, subject to the Companies Act, the
Articles of Association of the company, the JSE Listings
Requirements, when applicable and following the
limitations, namely that:
• the equity securities which are the subject of the issue
for cash must be a class already in issue, or where this
is not the case, must be limited to such securities or
rights that are convertible into a class already in issue;
• this authority shall not extend beyond 15 months from
the date of this meeting or the date of the next annual
general meeting, whichever is the earlier date;
• the issue shall be to public shareholders, as defined
in paragraphs 4.25 to 4.27 of the JSE Listings
Requirements, and not to related parties;
• a paid press release, giving full details, including the
impact on net asset value and earnings per share, be
published at the time of any issue representing, on a
cumulative basis within one financial year, 5% or more of
the number of ordinary shares in issue prior to the issue;
• issues in the aggregate in any financial year shall not
exceed 15% of the number of ordinary shares of the
company’s issued share capital, including instruments
which are convertible into ordinary shares; and
• in determining the price at which an issue for shares will
be made in terms of this authority, the maximum discount
NOTICE OF ANNUAL GENERAL MEETING OF SHAREHOLDERS
D I S C O V E R Y A N N U A L R E P O R T 2 0 0 61 8 4
permitted be 10% of the weighted average traded price
of the shares in question over the 30 business days prior
to the date that the price of the issue is determined or
agreed to by the company’s directors.
The approval of 75% of the votes cast by shareholders
present or represented by proxy at this meeting is
required for these ordinary resolution number 2 to
become effective.
VOTING AND PROXIESShareholders who have not dematerialised their shares or
who have dematerialised their shares with “own name”
registration are entitled to attend and vote at the meeting
and are entitled to appoint a proxy or proxies to attend,
speak and vote in their stead. The person so appointed
need not be a shareholder. Proxy forms must be
forwarded to reach the registered office of the company/
company’s transfer secretaries, Computershare Investor
Services 2004 (Pty) Limited at Ground Floor,
70 Marshall Street, Johannesburg, or PO Box 61051,
Marshalltown, 2107 by no later than 09:00 on Tuesday,
5 December 2006.
On a show of hands, every shareholder of the company
present in person or represented by proxy shall have one
vote only. On a poll, every shareholder of the company
shall have one vote for every share held in the company
by such shareholder.
Shareholders who have dematerialised their shares, other
than those shareholders who have dematerialised their
shares with “own name” registration, should contact
their CSDP or broker in the manner and time stipulated in
their agreement:
• to furnish them with their voting instructions; and
• in the event that they wish to attend the meeting, to
obtain the necessary authority to do so.
By order of the board
MJ Botha
Company Secretary
NOTICE OF ANNUAL GENERAL MEETING OF SHAREHOLDERS (continued)
D I S C O V E R Y A N N U A L R E P O R T 2 0 0 6 1 8 5
FORM OF PROXYDISCOVERY HOLDINGS LIMITED(Registration number: 1999/007789/06)ISIN: ZAE000022331 Share code: DSY
For completion by shareholders who have not dematerialised their shares or who have dematerialised their shares butwith own name registration.
DISCOVERY HOLDINGS LIMITED(“Discovery” or “the company”)
For use by shareholders, who have not dematerialised their shares or who have dematerialised their shares but withown name registration (“entitled shareholders”), at the annual general meeting to be held at 09:00 on Thursday,7 December 2006, in the Auditorium, Ground Floor, 155 West Street, Sandton.
Shareholders who have not dematerialised their shares, other than those shareholders who have dematerialised their shareswith “own name” registration should contact their CSDP or broker in the manner and time stipulated in their agreement:
• to furnish them with their voting instructions; and• in the event that they wish to attend the meeting, to obtain the necessary authority to do so.
FORM OF PROXY FOR THE SEVENTH ANNUAL GENERAL MEETING OF DISCOVERY HOLDINGS LIMITED
I/We (name in block letters)
of (address)being a shareholder of Discovery Holdings Limited and entitled to vote do hereby appoint:
1. of or failing him
2. of or failing him
3. the chairman of the company, or failing him, the chairman of the annual general meeting as my/our proxy to vote forme/us on my/our behalf at the annual general meeting of the company to be held in the Auditorium, Ground Floor,155 West Street, Sandton, on Thursday, 7 December 2006 at 09:00 for the following purposes:
I/We desire to vote as follows:
In favour* Against* Abstain*
1. To receive, consider and approve the annual financial statements for the year ended 30 June 2006
2. To confirm the appointment of director Dr TV Maphai
3. To confirm the appointment of director Ms S Sebotsa
4. To re-elect director Mr LL Dippenaar
5. To re-elect director Mr JP Burger
6. To re-elect director Dr BA Brink
7. To re-elect director Dr NJ Dlamini
8. To confirm the directors’ fees paid by the company for the year ended 30 June 2006
9. To confirm the re-appointment of PricewaterhouseCoopers Inc. as auditors until the forthcoming annual general meeting
10. To authorise the directors to fix and pay the auditors’ remuneration for the year ended 30 June 2006
11. To transact such other business as may be transacted at an annual general meeting
Ordinary resolution number 1To place the unissued ordinary shares in the capital of the company under the control of the directors
Ordinary resolution number 2To authorise the directors by way of general authority to issue authorised butunissued shares in the company for cash
*Note: Insert an “X” in the relevant spaces above according to the manner in which you wish your votes to be cast.However, if you wish to cast your votes in respect of a lesser number of shares than you own in Discovery, insert thenumber of shares held in respect of which you desire to vote (see note 6 overleaf).
Signed at on 2006
Signature of shareholder
Assisted by (where applicable) (state capacity and full name)
Please read the notes appearing on the reverse hereof

D I S C O V E R Y A N N U A L R E P O R T 2 0 0 61 8 6
1. Only shareholders who have dematerialised their shares
or who have dematerialised their shares and registered
them in their own name (“certificated or own name
dematerialised shareholders”) may complete a form of
proxy or alternatively attend the meeting.
2. Certificated shareholders whose shares are not
registered in their own names but in the name of
another person, eg a nominee, may NOT complete a
form of proxy nor attend the meeting unless a form of
proxy is issued to them by the registered shareholder.
3. A certificated or own name dematerialised shareholder
may insert the name of a proxy or the name of two
alternate proxies of his/her choice in the space
provided, with or without deleting “the chairman of the
annual general meeting”. Such shareholder must initial
any such deletion. The person whose name stands first
on the form of proxy and who is present at one general
meeting will be entitled to act as proxy to the exclusion
of those whose names follow.
4. A certificated or own name dematerialised shareholder’s
instructions to the proxy must be indicated by the
insertion of an “X” in the appropriate space/s provided
(or, if such shareholder wishes to cast his/her votes in
respect of a lesser number of shares than he/she owns in
the company, he/she must insert the number of shares
held in respect of which he/she wishes to vote). Failure
to comply with the above will be deemed to authorise
the proxy to vote or to abstain from voting at the annual
general meeting as he/she deems fit in respect of all such
shareholder’s votes exercisable thereat but, where the
proxy is the chairman, failure to comply will be deemed
to authorise the proxy to vote in favour of the resolution.
A certificated or own name dematerialised shareholder or
his/her proxy is not obliged to use all the votes
exercisable by such shareholder or by his/her proxy, but
the total of the votes cast and in respect of which
abstention is recorded, may not exceed the total of the
votes exercisable by the shareholder or by his/her proxy.
5. Certificated or own name dematerialised shareholders
are advised that the company has appointed
Computershare as the shareholder communications
consultant. To be effective, forms of proxy must be
received by Computershare Investor Services 2004
(Pty) Limited at Ground Floor, 70 Marshall Street,
Johannesburg, or PO Box 61051, Marshalltown, 2107,
by no later than 09:00 on Tuesday, 5 December 2006.
6. The completion and lodging of this form of proxy will
not preclude the relevant certificated or own name
dematerialised shareholder from attending the annual
general meeting and speaking and voting in person
thereat instead of the proxy should such shareholder
wish to do so.
7. The chairman of the annual general meeting may reject
or accept any form of proxy which is completed and/or
received other than in compliance with these notes.
8. Any alteration to this form of proxy other than a deletion
of alternatives must be initialled by the signatories.
9. Documentary evidence establishing the authority of a
person signing this form of proxy in a representative
capacity must be attached to this form of proxy unless
recorded by the company or waived by the chairman.
10. Where there are joint holders of shares:
10.1 any holder may sign the form of proxy; and
10.2 the vote of the senior shareholder (for that purpose
seniority will be determined by the order in which
the names of the shareholders appear in the
company’s register) who tenders a vote (whether in
person or by proxy) will be accepted to the exclusion
of the vote(s) of the other joint shareholders.
11. Shareholders who have dematerialised their shares and
registered them in a name other than their own name
(“dematerialised shareholders”) and who wish to
attend the meeting in person may only do so by
timeously requesting their Central Security Depositary
Participant (“CSDP”) or broker to issue them with a
letter of representation in terms of the custody
agreements entered into with the registered holder.
12. Dematerialised shareholders who do not wish to
attend the meeting in person must contact their
CSDP or broker and provide them timeously with
their voting instructions, in the manner and cut-off
time stipulated by their CSDP or broker.
NOTES TO FORM OF PROXY

www.discovery.co.za
annual report 2006
DISC
OV
ERY
AN
NU
AL R
EPO
RT
20
06
Discovery covers 9/11/06 0:36 Page 1