annual financial results for the 12 months ended 31 August ...€¦ · Octodec Investments Limited...
44
>1 Octodec Investments Limited | Annual Financial Results Presentation annual financial results for the 12 months ended 31 August 2016
Transcript of annual financial results for the 12 months ended 31 August ...€¦ · Octodec Investments Limited...

>1
Octodec Investments Limited | Annual Financial Results Presentation
annual financial results
for the 12 months ended
31 August 2016

>2
Octodec Investments Limited | Annual Financial Results Presentation
About us 03
Overview for 04
the year
Our property 07
portfolio
Our results 25
Outlook 36
Questions and 39
answers
Contact details 40
Appendices 41
agenda

>3
Octodec Investments Limited | Annual Financial Results Presentation
about us
• Listed on the JSE in 1990: REIT status on 1 September 2013
• Provided shareholders with an annual compounded return
over 10 years of 14%
• 324 properties (including joint ventures) in portfolio
• Properties managed by City Property Administration (Pty) Ltd
› Seven-year management contract in place (effective
1 July 2011)
› New contract in process of negotiation, separate
subcommittee formed comprising of non-executive
directors
› Over 40 years’ property management experience
› Solid track record of managing residential, retail, office
and industrial property
• The strategy remains the same
› Focus on Tshwane and Johannesburg CBD’s
› Continually improving the quality of our portfolio
› Focus on growing our residential portfolio
About us

>4
Octodec Investments Limited | Annual Financial Results Presentation
overview for the year
• Distribution growth per share of 6.5%, in line with guidance of approximately 6%
• Total property assets value at R12.3 billion, up by R692 million
• NAV up by 5.2% to R29.13 per share
• 4 major developments in progress
Overview
Highlights
› Strategic greenfield developments underway to uplift key Tshwane CBD node
› Entrance to new market outside the CBD through joint venture
› Profitable recycling of non-core assets
› Operating cost efficiencies
› Prudent capital management
Context
› Tough economic, political and operating environment
› Property fundamentals sound
› Residential increasingly competitive
› Rising costs (construction and operating costs)
› Council service delivery issues

>5
Octodec Investments Limited | Annual Financial Results Presentation
overview of Tshwane CBD
Sharon’s
Place
1 on
Mutual
Sustaining city life:
TWO decades of
building a city bears fruit
Overview
Octodec properties – current developments
Van Riebeeck Medical Building
• Concentration of investments
• Increased urbanisation
• New developments improving
node
• New Tshwane House
› GLA of 37 000 m2
› Housing in excess of
1 500 staff
Tshwane
Midtown
Octodec properties – developments under consideration

>6
Octodec Investments Limited | Annual Financial Results Presentation
overview of Johannesburg CBD
Frank’s
Place
Sustaining city life:
TWO decades of building
a city bears fruit
Overview
Octodec properties
• Urban renewal gaining
momentum
• Increasing private sector
investment
• Higher demand for property
• New residential development –
Frank’s Place fully let

>7
Octodec Investments Limited | Annual Financial Results Presentation
>7
Rental income by sector (%)
our property
portfolio
Retail:shops
28.7%
Offices
18.9%
Residential
30.6%
Retail:shoppingcentres
10.0%
Industrial
7.7%
Parking
4.1%
• Inclusive of 4 Joint Ventures

>8
Octodec Investments Limited | Annual Financial Results Presentation
12.8%
3.7%
4.4%
5.3%
7.1%
12.0%
22.5%
32.2.0%
0 10 20 30 40
Tshwane Other
Waverley, Gezina, Moot
Silverton andsurrounding areas
Tshwane Arcadia
Hatfield
Johannesburg andsurrounding areas
Johannesburg CBD
Tshwane CBD
a geographical analysis of our rental income & GLA for the year - 31 August 2016
Our property portfolio
%
157 301
64 974
70 274
78 422
99 228
126 752
141 423
426 330
504 417
0 200 000 400 000 600 000
Tshwane Other
Waverley, Gezina, Moot
Hatfield
Tshwane Arcadia
Tshwane West
Silverton and surroundingareas
Johannesburg and surroundingareas
Johannesburg CBD
Tshwane CBD
m2
Rental
income
(%)
GLA
(m2)
>9
Octodec Investments Limited | Annual Financial Results Presentation
18.9%(2015: 19.9%)
10.0%(2015: 10.2%)
7.7%(2015: 8.0%)
4.1%(2015: 4.0%)
Residential
Retail: shops
Offices
Retail: shopping centres
Industrial
Parking
Rental
income
(%)
portfolio sectors: rental income & GLA (%)12 months to 31 August 2016 (inclusive of joint ventures)
Our property portfolio
28.7%
(2015:
27.6%)
30.6%
(2015:
30.3%)
29.4%(2015: 27.2%)
5.4%(2015: 5.4%)
17.3%(2015: 18.6%)
Residential
Retail: shops
Offices
Retail: shopping centres
Industrial
25.9%
(2015:
27.1%)
GLA
(%)
22.0%
(2015:
21.7%)

>10
Octodec Investments Limited | Annual Financial Results Presentation
residential• 8 840 high quality residential units (Johannesburg 38%,
Tshwane 62%)
• Average monthly rentals
› Bachelor unit – R3 692 per unit (average size 30 m2)
› One bedroom – R4 302 per unit (average size 44 m2)
› Two bedroom – R5 633 per unit (average size 63 m2)
• Strong demand for residential accommodation
• Total vacancies 4.0 % of sector GLA
• Core vacancies 3.6% of sector GLA
• Vacancies higher due to units under refurbishment
• Bad debts at below 1% reflect strong collection
• Increased competition in Johannesburg CBD and Hatfield,
no major impact at this stage
• Tenant profile analysis, ongoing
Portfolio sectors:
Rental income (%)
5.6%Growth in
rental income
30.6%Rental income
Our property portfolio
› Employed by government –
26% of occupants
› Students – 27% of
occupants
› churn reduced to 45% per
annum
› Average gross salary per
application of R30 000
(6 month increase of 5.0%)
› Gross salary above R35 000
– 16% of occupants

>11
Octodec Investments Limited | Annual Financial Results Presentation
retail: shops• Average monthly rentals of R84/m² (31 August 2015: R80/m²)
• Strong demand from national retailers for well-located CBD retail space
(e.g. Shoprite, Pick n Pay, Clicks, Foschini, Truworths)
• Retailers are demanding larger tenant installation contributions
• CBD retail offers more growth opportunities than traditional shopping centres
• Lower cost structures (common area costs, security, cleaning)
• Total and core vacancies – 9.1% of sector GLA
• These vacancies are situated outside of the strong CBD retail nodes
• Major national tenants:
Our property portfolio
Portfolio sectors:
Rental income (%)
5.4%Growth in
rental income
28.7%Rental income
Top 10 retailers by rentable area
Lessee m2
Shoprite Checkers 55 586
Pepkor 15 100
Edcon 13 852
Standard Bank 9 599
McCarthy Limited 6 891
Mr Price Group 6 342
Foschini Retail Group 6 098
Autozone 5 501
Nedbank 5 453
Cambridge Food 4 489
Top 10 retailers by total annual rental FY2016
Lessee Rental (R’000)
Shoprite Checkers R22 802
Pepkor R21 186
Edcon R13 643
Nedbank R10 838
Foschini Retail Group R10 774
Mr Price Group R8 429
Standard Bank R8 005
McCarthy Limited R7 886
KFC R7 683
Chrysler South Africa R6 606

>12
Octodec Investments Limited | Annual Financial Results Presentation
retail: shopping centres
• Average rentals – R129/m² (31 August 2015: R115/m²)
• Increase in vacancies during period at Elardus Park Shopping
Centre, which is in need of an upgrade. Strong interest in vacant
space
• Woodmead Value Mart – 100% let and strong rental growth
(new tenant Nike)
• Killarney Mall:
› Increase in trading density by 14%
› Upgrade of air-conditioning system, security, ceilings,
generator and other improvements at a total cost of
R46 million (FY 2016 & 2017)
• Total and core vacancies – 5.4% of sector GLA
Our property portfolio
Portfolio sectors:
Rental income (%)
4.7%Growth in
rental income
10.0%Rental income

>13
Octodec Investments Limited | Annual Financial Results Presentation
offices• Average rentals – R72/m² (31 August 2015: R70/m²)
• Offices comprise of
› Government office space
› Corporates
› Smaller units occupied by SME’s, where occupancy levels stable
• Government tenants
› 12.8% of total rental income
› Lease renewals 2 – 3 years with net additional take up of space
› 9 365m² let to government tenant effective from 1 March 2016 –
R870 800 per month
› Managed risk
› Renewals with positive reversions
• Total vacancies – 34.7% of sector GLA
• Core vacancies – 15.3% of sector GLA
• Increase in core vacancies mainly relates to Inner Court in Jhb CBD
• Mothballed office space – 19.4% of sector GLA (95 000 m2)
› Opportunity to sell, redevelop or enter into partnerships
• Upgrading of offices
› Inner Court – R19.6m
› Wits Technikon – R18.9m (let effective from 1 January 2017)
Our property portfolio
Portfolio sectors:
Rental income (%)
18.9%Rental income
5.2%Growth in
rental income

>14
Octodec Investments Limited | Annual Financial Results Presentation
industrial
• Average monthly rental – R36/m² (31 August 2015:
R33/m²)
• Successful redevelopment of properties – demand for
upgraded properties
› Upgrade largely tenant driven
› The Tannery Industrial Park (R10 million) – improved
occupancy and rentals expected
• Lower demand for mini units – tough trading environment
• Low cost of occupation – competitive advantage
• Total and core vacancies – 10.8 % of sector GLA
Our property portfolio
Portfolio sectors:
Rental income (%)
3.3%Growth in
rental income
7.7%Rental income
>15
Octodec Investments Limited | Annual Financial Results Presentation
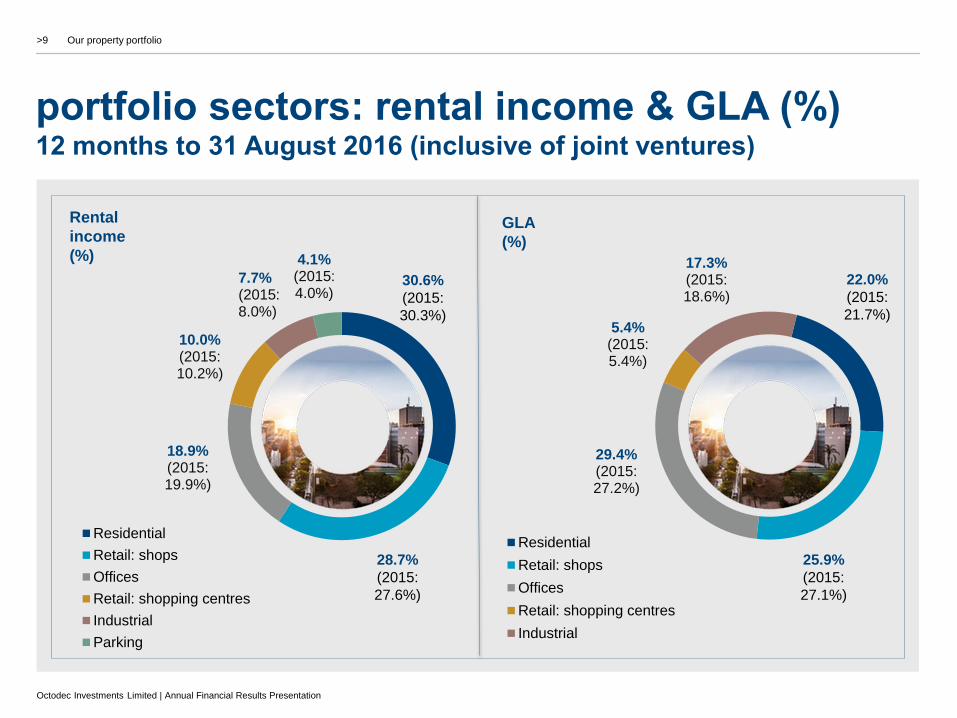
parking
• Monthly rental per bay – average R600
• Focused strategy to increase number of parking bays in CBD,
due to high demand
• Strong demand for parking in well located areas
› Government tenants
› Residential – increased requirement from tenants -
approximately 0.5 to 1 per unit
• Greater focus on increasing revenue through improved
efficiencies
Our property portfolio
Portfolio sectors:
Rental income (%)
4.1%Rental income
7.2%Growth in
rental income

>16
Octodec Investments Limited | Annual Financial Results Presentation
34.7%
9.1%
5.4%
10.8%
4.0%
15.6%15.3%
9.1%
5.4%
10.8%
3.6%
9.8%
0%
5%
10%
15%
20%
25%
30%
35%
40%
Offices Retail shops Retail: Shoppingcentres
Industrial Residential Total
Perc
en
tag
e o
f g
ross l
ett
ab
le a
rea (
by s
ecto
r)
Total vacancies
Core vacancies
vacancies by sectoras at 31 August 2016
Note: Core vacancies exclude lettable area of properties that are held for development or properties that are currently being developed
Our property portfolio

>17
Octodec Investments Limited | Annual Financial Results Presentation
vacancies• Total vacancies were at 15.6% of total GLA
(31 August 2015: 15.1%)
• Core vacancies were at 9.8% of total GLA
(31 August 2015: 9.1%)
• Core vacancies increased slightly in the residential, office, and
industrial sectors. Retail – shopping centre vacancies increased
mainly at Killarney Mall and Elardus Park Shopping Centre
• Total office vacancies increased due to the acquisition of the
Van Riebeeck Medical Building, comprising 11 497m² of
mothballed offices for residential conversion
• Residential vacancies increased slightly due to upgrades
underway. Strong demand for well-located quality
accommodation
• In recent years, certain properties were acquired where little
consideration was paid for vacant space. These vacancies
represent opportunities for future unlocking of value
(for example Frank’s Place and Centre Walk redeveloped into
residential & upgraded office space respectively)
• 95 000 m2 of office space available to unlock value
(redevelopment or disposal)
Total core
vacancies at
9.8%
Our property portfolio

>18
Octodec Investments Limited | Annual Financial Results Presentation
lease expiry profile
Gross lettable
area m² GLA (%)
Monthly
contractual rent
R
Rental
income (%)
Residential (12 months and less) 352 002 21.1% 40 044 955 34.4%
Monthly commercial 177 805 10.7% 9 378 771 8.1%
to 31 August 2017 329 973 19.8% 24 286 707 20.9%
to 31 August 2018 237 239 14.2% 17 123 906 14.7%
to 31 August 2019 112 104 6.7% 9 370 768 8.0%
to 31 August 2020 92 075 5.5% 7 496 738 6.4%
Thereafter 107 265 6.4% 8 773 790 7.5%
Vacancies 260 657 15.6% - -
Total 1 669 120 100.0% 116 475 635 100.0%
Our property portfolio

>19
Octodec Investments Limited | Annual Financial Results Presentation
lease expiry profile
• Government leases concluded for 3-year term on average
• Residential leases – short term leases (12 month contracts
providing for a month to month arrangement on expiry)
• Majority of leases for non-national tenants concluded for
1- to 10-year term
• National tenants – leases concluded for 3- to 10-year term
• No major concern other than loss of government tenant in
Hatfield (3 448 m2 / R 518 000 per month, effective from
1 March 2017)
Octodec’s portfolio features a mix of short- to long-term
leases with the majority of short-term leases providing for
a monthly agreement at expiry, which is typical of the
residential market
Our property portfolio

>20
Octodec Investments Limited | Annual Financial Results Presentation
recent acquisitions
Property Location Details Rentable m²
Total purchase
price R’million
Initial yield
%
Date of
transfer
Van Riebeeck
Medical
Building
Corner Lilian Ngoyi and
Francis Baard Streets,
Tshwane CBD
Mothballed offices and
shops for residential
development
11 497 28.9 Development
under
consideration
February 2016
Ross
Electrical
389 Johannes
Ramakhoase Street,
Tshwane CBD
Retail – forms part of
site assembly
525 2.6 8.0 April 2016
Our property portfolio

>21
Octodec Investments Limited | Annual Financial Results Presentation
Property Location Details
Rentable
m²
Total
sales price
R’million
Exit
yield
%
Date of
transfer
Dirk du Toit
(1) & (2)
323, 325, 327 Charlotte
Maxeke Street, Tshwane West
Shops and workshop 2 909 9.5 11.0 November 2015
Herriotdale Green Street,
Herriotdale
Open parking 7 307 5.5 9.0 November 2015
Eloff Street 17 & 19 Eloff Street,
Johannesburg
Warehouse 596 2.5 10.0 April 2016
Mitchbuit 590 Charlotte Maxeke Street,
Tshwane West
Shops 1 692 4.8 11.0 June 2016
Landkirk 568 Bonita Crescent, Tshwane Warehouse 1 265 3.2 11.0 June 2016
Works@
Registry
Corner of Kerk and Troye
Streets, Johannesburg CBD
Retail offices and parking
(includes 5 565m² of mothballed
office space)
10 505 30.0 4.0 July 2016
Total 55.5 7.0
recent salesIn line with our strategy to dispose of non-core assets, the following properties
were sold and transferred during the period under review
• The profit on the disposal consideration of R55.5 million amounted to R8.5 million, a premium of 15.3% above book value at 31 August 2015
• A further 10 properties have been sold and transfer is expected to take place shortly
• The total expected proceeds from the disposals after 31 August 2016 amount to R179 million, at well above book value
Our property portfolio
>22
Octodec Investments Limited | Annual Financial Results Presentation
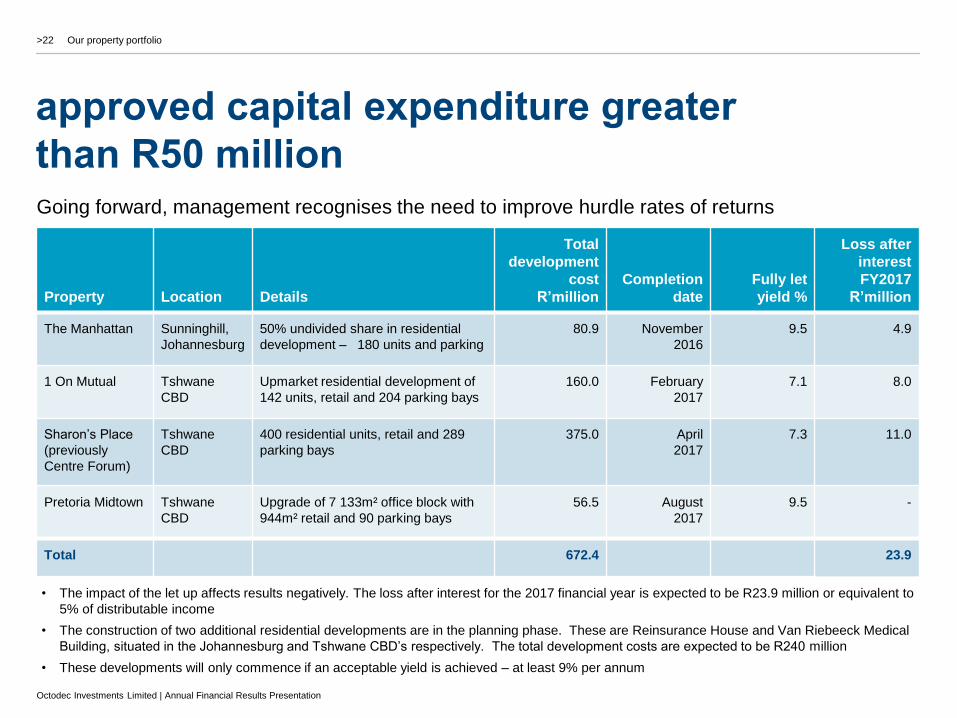
approved capital expenditure greater
than R50 millionGoing forward, management recognises the need to improve hurdle rates of returns
Property Location Details
Total
development
cost
R’million
Completion
date
Fully let
yield %
Loss after
interest
FY2017
R’million
The Manhattan Sunninghill,
Johannesburg
50% undivided share in residential
development – 180 units and parking
80.9 November
2016
9.5 4.9
1 On Mutual Tshwane
CBD
Upmarket residential development of
142 units, retail and 204 parking bays
160.0 February
2017
7.1 8.0
Sharon’s Place
(previously
Centre Forum)
Tshwane
CBD
400 residential units, retail and 289
parking bays
375.0 April
2017
7.3 11.0
Pretoria Midtown Tshwane
CBD
Upgrade of 7 133m² office block with
944m² retail and 90 parking bays
56.5 August
2017
9.5 -
Total 672.4 23.9
• The impact of the let up affects results negatively. The loss after interest for the 2017 financial year is expected to be R23.9 million or equivalent to
5% of distributable income
• The construction of two additional residential developments are in the planning phase. These are Reinsurance House and Van Riebeeck Medical
Building, situated in the Johannesburg and Tshwane CBD’s respectively. The total development costs are expected to be R240 million
• These developments will only commence if an acceptable yield is achieved – at least 9% per annum
Our property portfolio

>23
Octodec Investments Limited | Annual Financial Results Presentation
1 on mutual
Pick n Pay
and
Mugg & Bean
Tshwane CBD development
cost of: R160.0m
Residential units: 142
Retail: 1 746m2
Offices: 443m2
Parking bays: 204
Our property portfolio

>24
Octodec Investments Limited | Annual Financial Results Presentation
sharon’s place (centre forum)
Tshwane CBD development
cost of: R375m
Residential units: 400
Retail: 5 660m²
Parking bays: 289
Retail fully let
Shoprite and
Clicks as
anchors
Our property portfolio

>25
Octodec Investments Limited | Annual Financial Results Presentation
>25
our results
>26
Octodec Investments Limited | Annual Financial Results Presentation
achievements
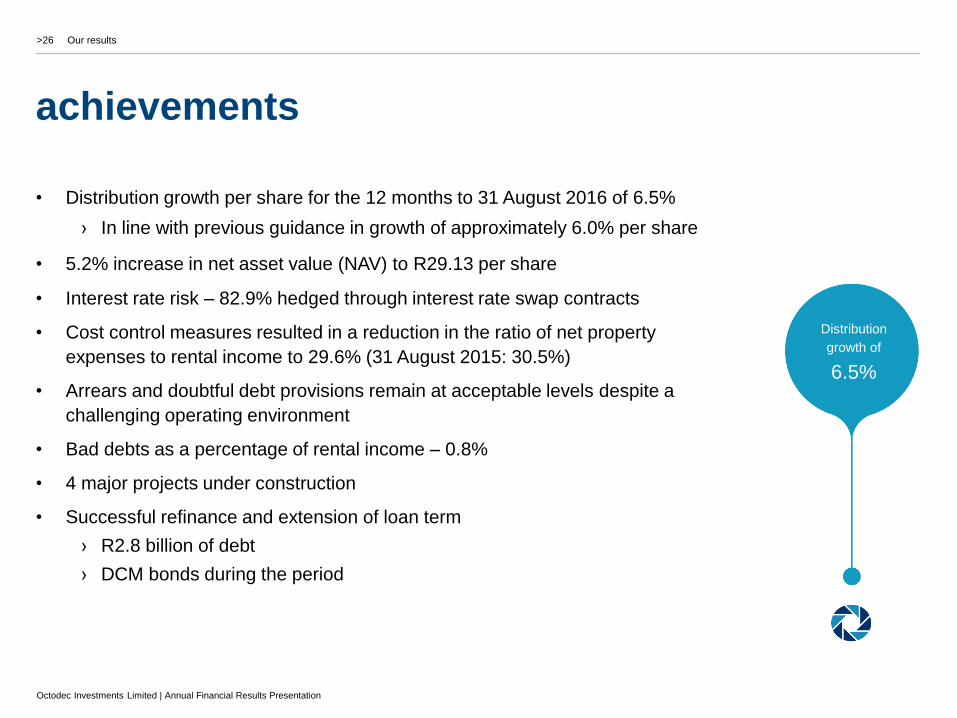
• Distribution growth per share for the 12 months to 31 August 2016 of 6.5%
› In line with previous guidance in growth of approximately 6.0% per share
• 5.2% increase in net asset value (NAV) to R29.13 per share
• Interest rate risk – 82.9% hedged through interest rate swap contracts
• Cost control measures resulted in a reduction in the ratio of net property
expenses to rental income to 29.6% (31 August 2015: 30.5%)
• Arrears and doubtful debt provisions remain at acceptable levels despite a
challenging operating environment
• Bad debts as a percentage of rental income – 0.8%
• 4 major projects under construction
• Successful refinance and extension of loan term
› R2.8 billion of debt
› DCM bonds during the period
Distribution
growth of
6.5%
Our results

>27
Octodec Investments Limited | Annual Financial Results Presentation
challenges
New development
impact
• Tough economic environment
• Like-for-like growth in rental income of 5.3%, under pressure
• Rise in costs (utilities, assessment rates)
• Core vacancies in portfolio (excludes properties held for
redevelopment) at 9.8% (31 August 2015: 9.1%)
• Higher interest rates (all-in weighted average cost of funding at 9.0%
at 31 August 2016)
• Dilutionary impact on distribution due to:
› Let up phase of new residential developments –
6 to 12 months
› major upgrades to properties
› acquisition of vacant buildings (Van Riebeeck Medical
Building R28.9 million)
Our results
>28
Octodec Investments Limited | Annual Financial Results Presentation
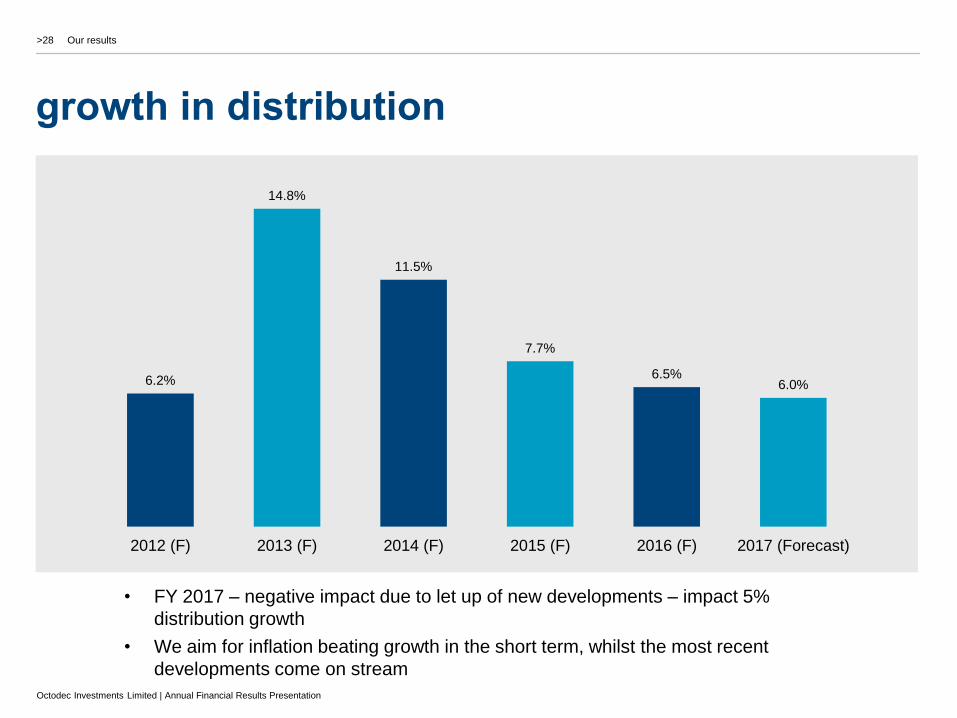
growth in distribution
6.2%
14.8%
11.5%
7.7%
6.5%6.0%
2012 (F) 2013 (F) 2014 (F) 2015 (F) 2016 (F) 2017 (Forecast)
Our results
• FY 2017 – negative impact due to let up of new developments – impact 5%
distribution growth
• We aim for inflation beating growth in the short term, whilst the most recent
developments come on stream

>29
Octodec Investments Limited | Annual Financial Results Presentation
R’000
%
Change
Reviewed
year to
31 August
2016
Audited
Year to
31 August
2015
Revenue – earned on contractual basis 6.7% 1 742 871 1 634 159 Core growth of 5.3%
Operating costs 1.1% (790 529) (742 212) Tight cost control
Net rental income from properties 6.8% 952 342 891 947
Administrative costs (71 005) (72 915) Reduction in asset management fee
Operating profit 7.6% 881 337 819 032
Interest received 10 138 5 953
Share of income from Joint Ventures 14 026 13 493 4 JV’s – each 50% held
Distributable profit before finance costs 8.0% 905 501 838 478
Finance costs 4.9% (394 751) (376 491) Increased loans to fund developments
Distributable income before taxation 10.6% 510 750 461 987
Taxation charge ̶ 15
Shareholder distributable earnings 10.6% 510 750 462 002
Number of shares in issue (000) 254 551 252 322
Dividend per share (cents) 201.5 189.2
First six months 98.4 96.8
Second six months 103.1 92.4
% growth in distribution 6.5%
distributable earnings
Note: Shareholders will be entitled to elect to reinvest the cash dividend in return for shares
Our results

>30
Octodec Investments Limited | Annual Financial Results Presentation
condensed consolidatedstatement of financial position
Reviewed Audited
31 August 31 August
R'000 2016 2015
ASSETS
Non-current assets 12 219 234 11 644 922
Investment property 11 956 631 11 449 157 320 properties
Other financial assets 51 849 -
Derivative financial instruments 38 172 34 451
Investment in joint ventures 172 582 161 314 4 JV’s – equity accounting
Current assets 200 661 158 091
Trade and other receivables 131 552 102 822
Bank and Cash 69 109 55 269
Non-current assets held for sale 173 000 - 30 properties available for sale
12 592 895 11 803 013
EQUITY AND LIABILITIES
Equity 7 413 800 6 987 679
Stated capital 3 958 207 3 907 819
Non-distributable reserves 3 112 885 2 799 231
Distributable reserves 342 708 280 629
Non-current liabilities 4 106 208 3 012 937
Interest-bearing borrowings 4 023 911 2 917 174
Derivative financial instruments 9 308 22 778
Deferred taxation 72 989 72 985
Current liabilities 1 072 887 1 802 397
Interest-bearing borrowings 755 116 1 463 699 loan terms extended
Non-interest-bearing borrowings 315 698 335 216
Dividends payable 2 073 3 482
12 592 895 11 803 013
Shares in issue ('000) 254 551 252 322
Net asset value (NAV) per share (cents) 2 913 2 769
Loan to investment value (LTV) ratio (%) 38.3% 37.3%
Our results

>31
Octodec Investments Limited | Annual Financial Results Presentation
capital management
• Domestic medium term note (DMTN) programme at
R3bn – issuance at R755.1 million at 31 August 2016
• Interest rates hedged – 82.9% of borrowings
(31 August 2015: 94.2%)
• All-in cost of debt at 9.0% (31 August 2015: 8.9%)
• Loan to value 38.3% (31 August 2015: 37.3%)
• Dividend reinvestment programme
› R2.2 million shares issued
› R50 million proceeds
9.0%All-in cost
Of debt
Our results
>32
Octodec Investments Limited | Annual Financial Results Presentation
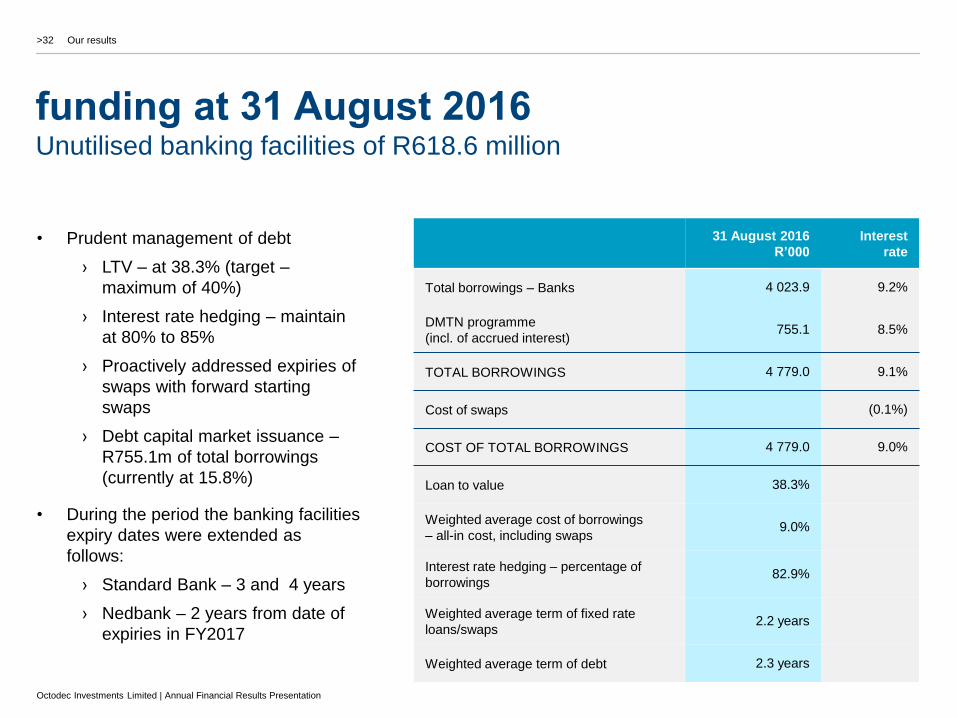
funding at 31 August 2016Unutilised banking facilities of R618.6 million
31 August 2016
R’000
Interest
rate
Total borrowings – Banks 4 023.9 9.2%
DMTN programme
(incl. of accrued interest)755.1 8.5%
TOTAL BORROWINGS 4 779.0 9.1%
Cost of swaps (0.1%)
COST OF TOTAL BORROWINGS 4 779.0 9.0%
Loan to value 38.3%
Weighted average cost of borrowings
– all-in cost, including swaps9.0%
Interest rate hedging – percentage of
borrowings82.9%
Weighted average term of fixed rate
loans/swaps2.2 years
Weighted average term of debt 2.3 years
Our results
• Prudent management of debt
› LTV – at 38.3% (target –
maximum of 40%)
› Interest rate hedging – maintain
at 80% to 85%
› Proactively addressed expiries of
swaps with forward starting
swaps
› Debt capital market issuance –
R755.1m of total borrowings
(currently at 15.8%)
• During the period the banking facilities
expiry dates were extended as
follows:
› Standard Bank – 3 and 4 years
› Nedbank – 2 years from date of
expiries in FY2017

>33
Octodec Investments Limited | Annual Financial Results Presentation
Nedbank –R2 745m
Standard Bank –R955m
DCM Commercial-
paper –R681m
31 August 2015
Nedbank Standard Bank DCM-commercial paper
funding as at
Nedbank –R2 999m
Standard Bank –
R1 025m
DCM Commercial-
paper –R755m
31 August 2016
Nedbank Standard Bank DCM-commercial paper
Our results
>34
Octodec Investments Limited | Annual Financial Results Presentation
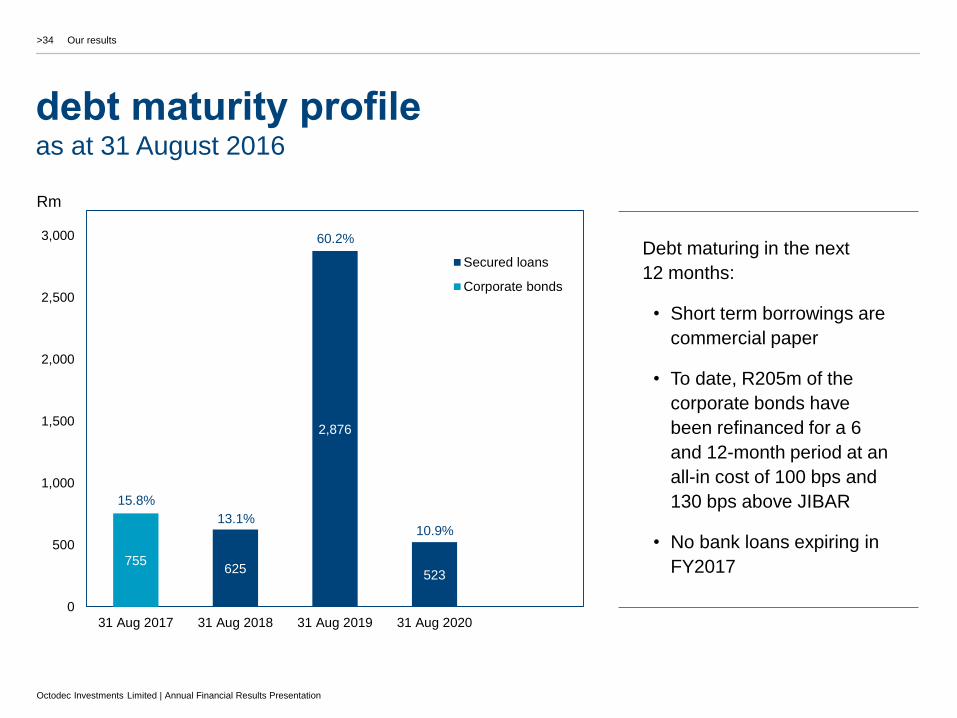
625
2,876
523755
0
500
1,000
1,500
2,000
2,500
3,000
31 Aug 2017 31 Aug 2018 31 Aug 2019 31 Aug 2020
Secured loans
Corporate bonds
debt maturity profile as at 31 August 2016
Our results
Debt maturing in the next
12 months:
• Short term borrowings are
commercial paper
• To date, R205m of the
corporate bonds have
been refinanced for a 6
and 12-month period at an
all-in cost of 100 bps and
130 bps above JIBAR
• No bank loans expiring in
FY2017
Rm
15.8%
13.1%
60.2%
10.9%

>35
Octodec Investments Limited | Annual Financial Results Presentation
1,2501,351 1,361
500
750
0
500
1,000
1,500
2,000
2017 2018 2019 2020 2021
interest rate hedges expiry profile
Our results
Fixed rate loans – R412 million
Swaps – total of R4.8 billion
Average weighted expiry – 2.2 years
• At 31 August 2016, interest rates in
respect of 82.9% of borrowings
hedged
• Subsequent to 31 August 2017
R1.250 billion of swaps entered into
› Weighted term 3.6 years
› All-in weighted cost of 8.11%
› Commencing 3 January 2017
› Forecast hedge position –
31 August 2017 – 79 %
Rm
24.0%
25.9% 26.1%
9.6%
14.4%

>36
Octodec Investments Limited | Annual Financial Results Presentation
>36
outlook

>37
Octodec Investments Limited | Annual Financial Results Presentation
outlook
• Continued weakness in the domestic economy
• Country downgrade and political uncertainty
• Increasing competition – CBD Johannesburg and Hatfield (residential)
• Well-positioned to continue to take advantage of opportunities in the CBDs
› CBD retail continues to generate strong demand from National tenants
› Strong demand for affordable and secure, quality residential accommodation – forecast of 6% core rental income growth
• Residential developments to significantly uplift the Tshwane CBD node where we have a strategic concentration of assets
› 1 on Mutual and Sharon’s Place will be ready for occupation in the 2017 financial year
• Continue to unlock value – exciting future development opportunities under discussion
• Project returns will be improved, hurdle yield required of above 9%
Forecast
• Impact on distributions during let up phase amounting to R23.9m or 5% of distribution growth
• Current forecast growth in distributable income per share of approximately 6%
6%forecast
growth
Outlook

>38
Octodec Investments Limited | Annual Financial Results Presentation
investment case
Well-positioned to continue to unlock value and
navigate the challenging economic environment
Steady and
sustainable
value
creation
Outlook
• Strategy to remain the same
• Sustainable model – urban renewal and middle-class
growth
• Well-balanced portfolio with significant synergies across
sectors in the CBDs
• Strong development pipeline – unlock value of current
portfolio (new and redevelopments)
• Proven track record – hands-on approach delivering
above average returns
• Negotiation of City Property contract well underway
>39
Octodec Investments Limited | Annual Financial Results Presentation
>39
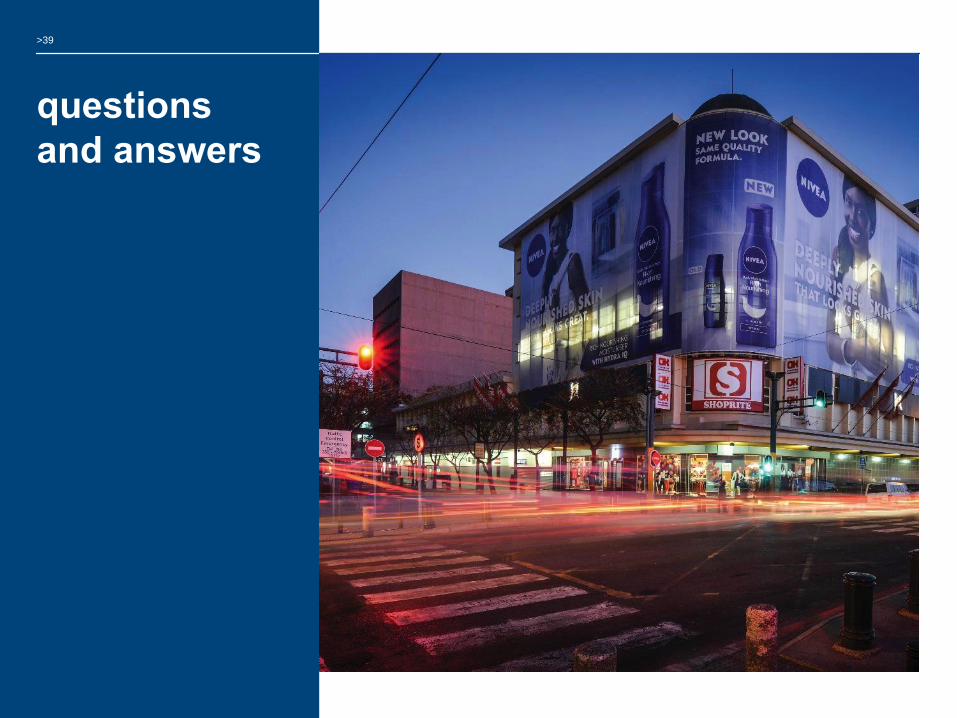
questions
and answers

>40
Octodec Investments Limited | Annual Financial Results Presentation
>40
www.octodec.co.za
contact us
Jeffrey WapnickManaging Director
Tel: +27 12 319 8708
e-mail: [email protected]
Anthony SteinFinancial Director
Tel: +27 12 319 8780
e-mail: [email protected]

>41
Octodec Investments Limited | Annual Financial Results Presentation
5.9%Government
Employees
Pension Fund
5.8%Stanlib
4.9%Old Mutual
Group
2.5%Eskom Pension &
Provident Fund
2.2%Nedbank
Group
corporate structure
38%Institutional investors
24%Other
38%Wapnick family & directors
Top 5Beneficial institutional
shareholders
Appendix I

>42
Octodec Investments Limited | Annual Financial Results Presentation
our strategy
• Offer innovative property investment opportunities that
create and deliver long-term sustainable returns by:
› Building a diversified portfolio in the Tshwane and
Johannesburg CBDs and surrounding areas with
an exposure to residential, office, retail and
industrial sectors
› Actively promoting urban renewal in the Tshwane
and Johannesburg CBDs
• Increase the profitability of our existing portfolio by:
› Continually improving the quality of our portfolio
› Enhancing our tenant profile
› Developing well-located properties
Appendix II

>43
Octodec Investments Limited | Annual Financial Results Presentation
our strategy
• Increase the profitability of our existing portfolio by
(continued):
› Concentration of properties in Tshwane and
Johannesburg CBDs, which makes it easier to
manage and extract value from our portfolio
› Pursuing acquisitions that offer strategic value
and sustainable yield-enhancing opportunities
› Focusing on growing our residential portfolio in
the medium term
› Recycling capital from low growth, poor quality
assets to high growth, high quality assets
› Enhancing returns through effective mix of debt
and equity to optimise capital structure
› Management of interest and liquidity risk
Appendix II (continued)
>44
Octodec Investments Limited | Annual Financial Results Presentation
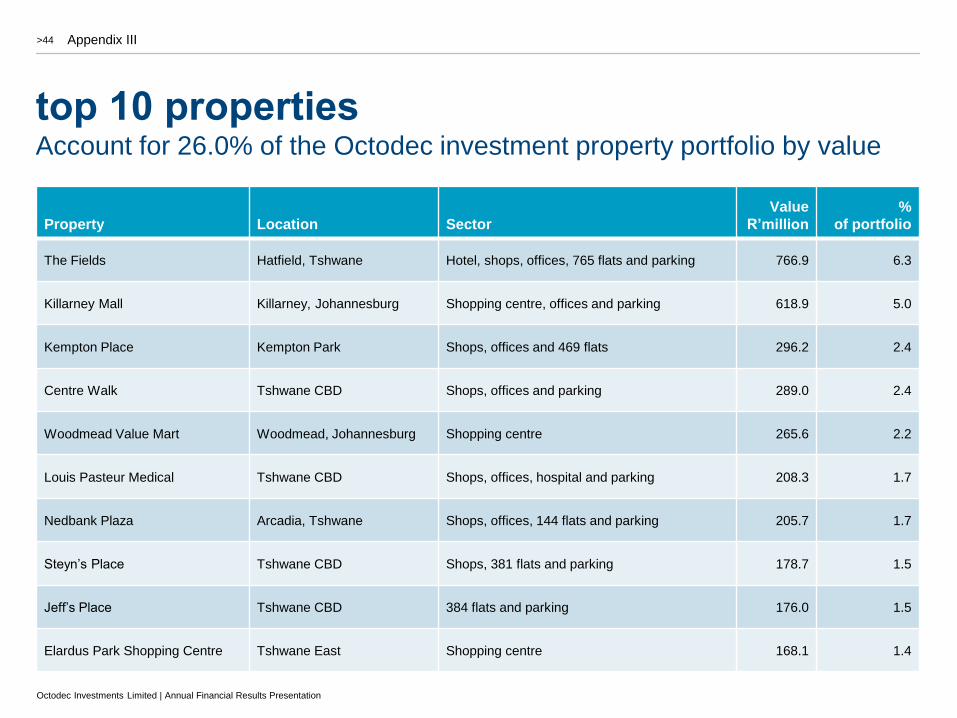
top 10 propertiesAccount for 26.0% of the Octodec investment property portfolio by value
Property Location Sector
Value
R’million
%
of portfolio
The Fields Hatfield, Tshwane Hotel, shops, offices, 765 flats and parking 766.9 6.3
Killarney Mall Killarney, Johannesburg Shopping centre, offices and parking 618.9 5.0
Kempton Place Kempton Park Shops, offices and 469 flats 296.2 2.4
Centre Walk Tshwane CBD Shops, offices and parking 289.0 2.4
Woodmead Value Mart Woodmead, Johannesburg Shopping centre 265.6 2.2
Louis Pasteur Medical Tshwane CBD Shops, offices, hospital and parking 208.3 1.7
Nedbank Plaza Arcadia, Tshwane Shops, offices, 144 flats and parking 205.7 1.7
Steyn’s Place Tshwane CBD Shops, 381 flats and parking 178.7 1.5
Jeff’s Place Tshwane CBD 384 flats and parking 176.0 1.5
Elardus Park Shopping Centre Tshwane East Shopping centre 168.1 1.4
Appendix III