Annual coastal monitoring report for the Wellington …...Annual coastal monitoring report, 2008/09...
35
Annual coastal monitoring report for the Wellington region, 2008/09
Transcript of Annual coastal monitoring report for the Wellington …...Annual coastal monitoring report, 2008/09...

Annual coastal monitoring report for the Wellington region, 2008/09

Annual coastal monitoring report for the Wellington region, 2008/09
Juliet R Milne
Environmental Monitoring and Investigations Department
For more information, contact:
Greater Wellington 142 Wakefield Street PO Box 11646 Manners Street Wellington 6142 T 04 384 5708 F 04 385 6960 www.gw.govt.nz
GW/EMI-G-09/236
October 2009
Contents
1. Introduction 1
2. Overview of coastal monitoring programme 2 2.1 Background 2 2.2 Monitoring objectives 2 2.3 Monitoring and investigations during 2008/09 2
3. Microbiological water quality monitoring 4 3.1 Introduction 4 3.2 Monitoring protocol 4 3.3 Results 5
4. Porirua Harbour subtidal sediment quality monitoring 9 4.1 Introduction and background 9 4.2 Monitoring sites, methods and variables 9 4.2.1 Sediments 10 4.2.2 Benthic fauna 10 4.2.3 Guidelines 10 4.3 Key findings 10 4.4 Future monitoring 12
5. Porirua Harbour intertidal ecological monitoring 13 5.1 Introduction and background 13 5.2 Monitoring sites, variables and methods 13 5.3 Key findings 14 5.4 Future monitoring 15
6. Porirua Harbour sediment “hotspot” investigation 16 6.1 Introduction and background 16 6.2 Sampling sites, methods and variables 16 6.3 Key findings 18
7. Whareama Estuary intertidal ecological monitoring 21 7.1 Introduction and background 21 7.2 Monitoring sites, methods and variables 21 7.3 Key findings 22 7.4 Future monitoring 22
8. Castlepoint Beach ecological monitoring 23 8.1 Introduction and background 23 8.2 Monitoring sites, variables and methods 23 8.3 Key findings 23 8.4 Future monitoring 24
9. References 25
Acknowledgements 27
Appendix 1: Microbiological water quality monitoring sites 28
Appendix 2: Sediment and benthic fauna sampling sites 30

Annual coastal monitoring report, 2008/09
WGN_DOCS-#679712-V2 PAGE 1 OF 31
1. Introduction
Greater Wellington Regional Council (Greater Wellington) has a responsibility to manage and monitor the Wellington region’s near-shore coastal environment; the area extending from mean high water springs to 12 nautical miles offshore. This near-shore environment contains significant habitats for a wide variety of plants and animals, and also provides for a diverse range of human activities and values.
Greater Wellington’s Environmental Monitoring and Investigations Department oversees monitoring and investigations of water quality, sediment quality and ecological health in the Wellington region’s near-shore coastal environment. This report summarises the results of such monitoring and investigations undertaken over the period 1 June 2008 to 30 June 2009. Note that the suitability of coastal waters for contact recreation purposes is assessed separately under Greater Wellington’s recreational water quality monitoring programme (see Warr 2009).

Annual coastal monitoring report, 2008/09
PAGE 2 OF 31 WGN_DOCS-#679712-V1
2. Overview of coastal monitoring programme
2.1 Background
Coastal monitoring in the Wellington region began over 20 years ago, with a focus on microbiological water quality – a reflection of the high usage of much of the region’s coastline for contact recreation such as swimming and surfing. Periodic assessments of contaminants in shellfish flesh commenced around 1997, with the most recent assessment undertaken at 20 sites in 2006 (see Milne 2006). In 2004 monitoring expanded into coastal ecology and sediment quality, with a key focus being the effects of urban stormwater on our coastal harbour environments. In addition, over 2004-2008 broad-scale surveys of the region’s coastal habitats were carried out, with fine-scale sediment and ecological assessments undertaken at representative intertidal locations of selected estuaries and sandy beaches. The information gained from these surveys was combined with ecological vulnerability assessments to identify priorities for a long-term monitoring programme that will enable Greater Wellington to fulfil state of the environment monitoring obligations with respect to coastal ecosystems.
2.2 Monitoring objectives
The aims of Greater Wellington’s coastal monitoring programme are to:
1. Assist in the detection of spatial and temporal changes in near-shore coastal waters;
2. Contribute to our understanding of coastal biodiversity in the region;
3. Determine the suitability of coastal waters for designated uses;
4. Provide information to assist in targeted investigations where remediation or mitigation of poor water quality is desired; and
5. Provide a mechanism to determine the effectiveness of policies and plans.
Note: the suitability of coastal waters for contact recreation purposes is assessed separately under Greater Wellington’s recreational water quality monitoring programme.
2.3 Monitoring and investigations during 2008/09
Coastal monitoring and investigations undertaken over the period 1 June 2008 to 30 June 2009 included:
• Microbiological water quality monitoring at 77 sites across the region (Section 3);
• Sediment quality monitoring at five subtidal sites in Porirua Harbour (Section 4);

Annual coastal monitoring report, 2008/09
WGN_DOCS-#679712-V2 PAGE 3 OF 31
• fine-scale ecological monitoring, sedimentation rate monitoring and macroalgal cover mapping at four intertidal sites in Porirua Harbour (Section 5);
• A targeted investigation of contaminants in Porirua Harbour sediments, focussing on intertidal areas close to contaminant sources such as stormwater outfalls and stream outflows (Section 6);
• Fine-scale ecological monitoring at two intertidal sites in Whareama Estuary (Section 7); and
• Fine-scale ecological monitoring at two sites on Castlepoint Beach (Section 8).

Annual coastal monitoring report, 2008/09
PAGE 4 OF 31 WGN_DOCS-#679712-V1
3. Microbiological water quality monitoring
3.1 Introduction
Microbiological water quality was monitored at 77 coastal sites across the Wellington region over 2008/09 (Figure 3.1, Appendix 1), as follows:
• Kapiti Coast District – 20 sites • Porirua City – 15 sites • Hutt City – 15 sites • Wellington City – 22 sites • Wairarapa – 5 sites
Monitoring was a joint effort involving Greater Wellington, Kapiti Coast District Council, Porirua City Council, Hutt City Council, and Wellington City Council. The sites monitored reflect their use by the public for contact recreation; in particular, swimming, surfing, and boating.
Figure 3.1: Coastal water quality sites monitored over 2008/09
3.2 Monitoring protocol
Sites were sampled weekly during the summer bathing season (1 November to 31 March inclusive) as part of Greater Wellington’s recreational water quality monitoring programme (see Warr 2009), and at least monthly during the remainder of the year1. On each sampling occasion a single water sample was collected 0.2 metres below the surface in 0.5 metres water depth and analysed for enterococci indicator bacteria using a membrane filtration method. In addition, water samples from six sites popular for recreational shellfish
1 Camp Bay (Hutt City), Breaker Bay (Wellington City), Princess Bay (Wellington City) and Riversdale Beach South (Wairarapa) were sampled fortnightly during the summer months (see Warr 2009).

Annual coastal monitoring report, 2008/09
WGN_DOCS-#679712-V2 PAGE 5 OF 31
gathering, and three sites in Porirua Harbour, were tested for faecal coliform indicator bacteria (Appendix 1).
Observations of weather and the state of the tide, and visual estimates of seaweed cover, were made at each site to assist with the interpretation of the monitoring results. For example:
• Rainfall may increase enterococci counts by flushing accumulated debris from urban and agricultural areas into coastal waters.
• Wind direction can influence the movement of currents along the coastline and can therefore affect water quality at a particular site.
• In some cases, an increase in enterococci counts may be due to the presence of seaweed. Under warm conditions when seaweed is excessively photosynthesising or decaying, enterococci may feed off the increased carbonaceous material produced during photosynthesis or off the decaying seaweed.
An estimate of the daily rainfall in the catchment adjoining each site over the bathing season was made by obtaining records from the nearest rain gauge.
A list of field and laboratory methods can be found in Warr (2009).
3.3 Results
The results of microbiological water quality testing undertaken during the official summer bathing season are discussed in detail in On the Beaches 2008/09: Annual recreational water quality monitoring report for the Wellington region (Warr 2009). Tables 3.1 and 3.2 summarise the median, 95th percentile and maximum enterococci and faecal bacteria counts recorded from all sampling conducted during the period 1 July 2008 to 30 June 2009 for each of the 77 marine sites (i.e., these statistics include the results of additional follow-up sampling conducted in response to an exceedance of the Ministry for the Environment/Ministry of Health (2003) microbiological water quality guidelines). In the majority of instances, elevated indicator bacteria counts coincided with rainfall.
The highest enterococci counts were recorded in water samples from Porirua Harbour (including Pauatahanui Inlet), with the monitoring site adjacent to the Rowing Club exceeding counts of 1,000 cfu/100 mL on five separate sampling occasions. The highest counts at this site were 1,600 cfu/100 mL on both 15 July 2008 and 17 February 2009. A small unnamed stream that enters the Porirua Harbour immediately adjacent to the Rowing Club may be linked to the elevated bacteria counts (Warr 2009). Further sampling is to be undertaken in the stream catchment to identify the source of these high indicator bacteria counts.

Annual coastal monitoring report, 2008/09
PAGE 6 OF 31 WGN_DOCS-#679712-V1
Table 3.1: Summary of enterococci counts recorded at 77 coastal sites monitored over 1 July 2008 to 30 June 2009 inclusive
Enterococci (cfu/100 mL) Bathing Site Total no. of
samples Median 95th percentile Max
Kapiti Coast Otaki Beach @ Surf Club 29 5 63 490 Otaki Beach @ Rangiuru Rd 28 4 68 113 Te Horo Beach S of Mangaone Strm 28 15 52 74 Te Horo Beach @ Kitchener St 28 5 37 40 Peka Peka Beach @ Rd End 28 6 37 45 Waikanae Beach @ William St 28 8 32 50 Waikanae Beach @ Tutere St T.C. 28 5 31 110 Waikanae Beach @ Ara Kuaka C.P. 28 5 57 91 Paraparaumu Beach @ Ngapotiki St 28 10 89 115 Paraparaumu Beach @ Nathan Ave 29 10 63 150 Paraparaumu Beach @ Maclean Pk 31 15 148 170 Paraparaumu Beach @ Toru Rd 30 13 154 220 Paraparaumu Beach @ Wharemauku Rd 28 8 103 135 Raumati Beach @ Tainui St 28 5 50 105 Raumati Beach @ Marine Gardens 30 7 106 180 Raumati Beach @ Aotea Rd 28 6 37 120 Raumati Beach @ Hydes Rd 28 5 28 55 Paekakariki Beach @ Whareroa Rd 28 6 44 85 Paekakariki Beach @ Surf Club 28 4 27 35 Paekakariki Beach @ Memorial Hall 28 5 30 70 Porirua Pukerua Bay 30 4 122 1,300 Karehana Bay @ Cluny Rd 31 32 355 900 Plimmerton Beach @ Bath St 33 32 402 1,400 Plimmerton Beach @ Queens Ave 30 24 191 600 South Beach @ Plimmerton 35 32 410 790 Paremata Beach @ Pascoe Ave 32 30 250 400 Pauatahanui Inlet @ Water Ski Club 35 60 325 850 Pauatahanui Inlet @ Motukaraka Pt 32 24 211 1,400 Pauatahanui Inlet @ Browns Bay 37 48 318 1,900 Pauatahanui Inlet @ Paremata Bridge 28 18 113 130 Porirua Harbour @ Rowing Club 46 130 1,425 1,600 Titahi Bay @ Bay Drive 34 38 233 390 Titahi Bay at Toms Rd 29 12 68 380 Titahi Bay @ South Beach Access Rd 31 20 850 1,500 Onehunga Bay 28 4 78 100 Hutt Petone Beach @ Water Ski Club 29 8 59 160 Petone Beach @ Sydney St 30 14 147 240 Petone Beach @ Settlers Museum 31 8 240 590 Petone Beach @ Kiosk 28 10 100 120

Annual coastal monitoring report, 2008/09
WGN_DOCS-#679712-V2 PAGE 7 OF 31
Table 3.1 cont.: Summary of enterococci counts recorded at 77 coastal sites monitored over 1 July 2008 to 30 June 2009 inclusive
Enterococci (cfu/100 mL) Bathing Site Total no. of
samples Median 95th percentile Max
Hutt Sorrento Bay 28 8 64 130 Lowry Bay @ Cheviot Rd 28 10 102 130 York Bay 28 2 28 48 Days Bay @ Wellesley College 29 12 90 450 Days Bay @ Wharf 28 4 110 130 Days Bay @ Moana Rd 28 4 88 96 Rona Bay @ N end of Cliff Bishop Pk 29 12 96 680 Rona Bay @ Wharf 28 4 38 120 Robinson Bay @ HW Shortt Rec Grd 28 8 71 88 Robinson Bay @ Nikau St 29 4 100 210 Camp Bay 18 2 24 72 Wellington City Aotea Lagoon 29 8 84 920 Oriental Bay @ Freyberg Beach 28 8 31 64 Oriental Bay @ Wishing Well 30 10 636 1,200 Oriental Bay @ Band Rotunda 28 6 64 130 Balaena Bay 29 2 51 270 Kio Bay 28 2 79 130 Hataitai Beach 28 3 68 130 Shark Bay 28 4 42 130 Mahanga Bay 29 2 101 500 Scorching Bay 28 2 61 68 Worser Bay 28 3 35 120 Seatoun Beach @ Wharf 28 2 32 84 Seatoun Beach @ Inglis St 28 4 52 92 Breaker Bay 19 2 41 340 Lyall Bay @ Tirangi Rd 28 4 53 100 Lyall Bay @ Onepu Rd 28 3 20 76 Lyall Bay @ Queens Drive 29 4 109 240 Princess Bay 18 2 5 8 Island Bay @ Surf Club 29 8 198 460 Island Bay @ Reef St Recreation Grd 28 4 90 120 Island Bay @ Derwent St 28 4 35 60 Owhiro Bay 31 40 245 630 Wairarapa Castlepoint Beach @ Castlepoint Strm 30 2 148 890 Castlepoint Beach @ Smelly Creek 28 2 31 130 Riversdale Beach @ Lagoon Mouth 29 2 46 72 Riversdale Beach Between the Flags 28 2 7 20 Riversdale Beach South 18 2 5 12

Annual coastal monitoring report, 2008/09
PAGE 8 OF 31 WGN_DOCS-#679712-V1
Table 3.2: Summary of faecal coliform counts recorded at nine coastal sites monitored over 1 July 2008 to 30 June 2009 inclusive
Faecal coliforms (cfu/100 mL) Site Total no. of
samples Median 95th percentile Max
Kapiti Coast Otaki Beach @ Surf Club 29 20 246 570 Peka Peka Beach @ Rd End 28 18 115 172 Raumati Beach @ Hydes Rd 28 15 103 170 Porirua Pauatahanui Inlet @ Motukaraka Point 32 4 332 860 Pauatahanui Inlet @ Browns Bay 36 17 235 770 Porirua Harbour @ Rowing Club 42 36 608 1,100 Hutt Sorrento Bay 28 3 225 420 Wellington City Shark Bay 28 2 46 830 Mahanga Bay 29 2 232 740

Annual coastal monitoring report, 2008/09
WGN_DOCS-#679712-V2 PAGE 9 OF 31
4. Porirua Harbour subtidal sediment quality monitoring
4.1 Introduction and background
Contaminants in urban stormwater discharges have been identified as a potential medium to long-term risk to the health of the marine organisms living in our harbours, largely through the accumulation of these contaminants in the sediments. Greater Wellington’s Porirua Harbour subtidal sediment quality monitoring programme primarily focuses on heavy metals and several classes of organic contaminants which tend to be bound to the mud fraction of sediments. The subtidal basins in each arm of the harbour are dominated by fine muds and provide a “sink” in which contaminants accumulate. Regular assessments of contaminant concentrations in the surface sediments of these basins, together with surveys of the health of benthic fauna present, allow an ongoing evaluation of urban stormwater management actions directed at maintaining or enhancing the Porirua Harbour receiving environment.
This section briefly summarises the results of the third survey of sediment quality and benthic community health at five subtidal sites in Porirua Harbour, based on a report by Milne et al. (2009). The 2008 survey was narrower in scope than the first two surveys (May 2004 and October 2005), with the sediment chemistry component restricted to assessing concentrations of just one group of contaminants, the heavy metals.
4.2 Monitoring sites, methods and variables
Five subtidal sites were sampled in Porirua Harbour in November 2008, three in the Pauatahanui Arm and two in the Onepoto Arm (Figure 4.1 & Table A2.1,
Figure 4.1: The five subtidal monitoring sites sampled in Porirua Harbour during November 2008

Annual coastal monitoring report, 2008/09
PAGE 10 OF 31 WGN_DOCS-#679712-V1
Appendix 2). Samples were collected by the use of a boat, GPS and scuba divers using similar protocol to previous surveys of contaminants in Porirua Harbour sediments (Williamson et al. 2005, Stephenson & Mills 2006).
4.2.1 Sediments
At each site 25 sediment core samples were collected from a sampling area 20 m in diameter, with samples randomly assigned into five replicate groups for analysis (top 30 mm). Samples were tested for:
• particle size distribution (sediment texture); • total organic carbon (TOC); and • weak acid-extractable and total heavy metals2.
4.2.2 Benthic fauna
Eight benthic (sediment-dwelling) fauna samples were collected from an area adjacent to each sediment sampling site. Processing of the samples included:
• identification (to the lowest taxonomic level practicable) and enumeration of benthic fauna;
• measurement of shell lengths of selected species (e.g., bivalve molluscs); and
• selection and labelling of specimens for a reference collection.
4.2.3 Guidelines
Both the ANZECC (2000) Interim Sediment Quality Guidelines (ISQG) and the Auckland Regional Council’s (2004) Environmental Response Criteria (ERC) were used to assess the sediment chemistry results. These guidelines are not “pass or fail” numbers; they are set at the concentrations which experimental and/or field evidence suggests are likely to result in impacts on aquatic life. Both the ANZECC and ERC guidelines have “low” (effectively “alert”) and “high” values3; exceedances of these “low” and “high” values are indicated by orange and red colouring respectively in the graphs in subsection 4.3.
4.3 Key findings
Consistent with the results of the previous surveys, concentrations of total copper, lead and zinc are above “early warning” sediment quality guidelines in the subtidal sediments of the Onepoto Arm of Porirua Harbour (Figure 4.2). Concentrations of the other metals analysed are currently below guideline levels in the Onepoto Arm, as are the concentrations of all metals in the subtidal sediments of the Pauatahanui Arm.
2 Five replicate sediment samples from each site were analysed for weak acid-extractable metals while one composite sediment sample from each site was tested for total metals (see Milne et al. 2009). 3 These two sets of guidelines differ with respect to how they were derived and how they are interpreted– see Stephenson et al. (2008) for details.

Annual coastal monitoring report, 2008/09
WGN_DOCS-#679712-V2 PAGE 11 OF 31
Site
PAH1 PAH2 PAH3 POR1 POR2
Cu
(mg/
kg)
0
10
20
30
ARC ERC Red
ARC ERC Amber
200420052008
Site
PAH1 PAH2 PAH3 POR1 POR2
Pb (m
g/kg
)
0
10
20
30
40
50 ISQG Low/ARC ERC Red
ARC ERC Amber
200420052008
Site
PAH1 PAH2 PAH3 POR1 POR2
Zn (m
g/kg
)
0
50
100
150
200 ISQG Low
ARC ERC Red
ARC ERC Amber
200420052008
Site
PAH1 PAH2 PAH3 POR1 POR2TO
C (%
)0.0
0.5
1.0
1.5
2.0
2.5
3.0
200420052008
Figure 4.2: Concentrations of total copper, lead and zinc in sediments of five sites sampled in Porirua Harbour in 2004, 2005 and 2008, based on the <500 µm fraction of a single composite sample from each site. Mean concentrations of total organic carbon (± 95% CI) are also shown, based on five composite samples from each site. Note: assessment of this sediment fraction is appropriate for comparison against sediment quality guidelines but a different – and more “precise” – assessment is used to determine trends in heavy metal concentrations over time
A total of 64 species of benthic fauna were identified, with all but two found in the samples taken from sites in the Pauatahanui Arm. In contrast, only 32 of the 64 species were found in the samples taken from two sites in the Onepoto Arm. Overall, the fauna were composed predominantly of polychaetes (25 species), crustaceans (17 species), and bivalve and gastropod molluscs (6 and 4 species respectively). The biomass at each site was dominated either by the bivalve Cyclomactra ovatra, Sipunculida #2, the echinoderm Paracaudina chilensis, or a combination of these. A second bivalve, Nucula hartvigiana, was also a significant contributor to the biomass at some sites.
Multivariate statistical analysis of the monitoring data indicates that some of the environmental variables measured are influencing lower-order benthic community structure. However, at this stage, any effects of metal contamination cannot be separated from the effects of differences in sediment texture and organic carbon content. Both monitoring sites in the Onepoto Arm clearly have higher sediment metal contaminant concentrations and support a lower diversity of benthic species than sites in the Pauatahanaui Arm, but the mud and organic carbon contents are also higher in the sediments of these sites (Figure 4.2).
Although, statistically significant trends in the concentrations of weak acid-extractable copper, lead and zinc have been detected since 2004, it is still too early to tell whether these trends are ecologically significant and whether they

Annual coastal monitoring report, 2008/09
PAGE 12 OF 31 WGN_DOCS-#679712-V1
will continue into the future4. The reliability of trend detection, and the ability to form meaningful conclusions from any detected trends, should continue to improve as more monitoring data are added and the length of the time-series increases.
4.4 Future monitoring
The next subtidal sediment chemistry survey will be undertaken in Porirua Harbour in late 2010 to continue the monitoring of trends in contaminant concentrations over time. This will coincide with another benthic fauna survey in order to continue monitoring for changes in benthic community structure with possible links to changes in sediment quality. The sediment chemistry survey is to include analysis of sediment samples for polycyclic aromatic hydrocarbons and organochlorine pesticides.
4 A mixture of both increasing and decreasing temporal trends were evident but these are based on only three data points.

Annual coastal monitoring report, 2008/09
WGN_DOCS-#679712-V2 PAGE 13 OF 31
5. Porirua Harbour intertidal ecological monitoring
5.1 Introduction and background
Routine intertidal sediment quality and ecological monitoring in Porirua Harbour began in January 2008, with the monitoring programme designed primarily to assess common estuary issues of sedimentation, eutrophication (nutrient enrichment), contamination and habitat loss (e.g., changes in substrate or vegetation cover). This section briefly summarises the results of the second round of intertidal monitoring undertaken in early 2009. This survey focused primarily on assessing indicators of sedimentation, eutrophication and, to a lesser extent, contamination. Full details of the monitoring are reported in Robertson & Stevens (2009a) and Stevens & Robertson (2009).
5.2 Monitoring sites, variables and methods
The second intertidal survey was undertaken in January 2009 at two sites in each arm of Porirua Harbour (Figure 5.1 & Table A2.2, Appendix 2). This monitoring included assessments of up to 10 plots per site for selected “fine-scale” sediment condition indicators (including grain size or texture, “oxygenation”, nutrient and organic content, and heavy metal concentrations) and benthic (sediment-dwelling) fauna abundance and diversity. The methods used were based on an extension of the tools included in the National Estuary Monitoring Protocol (Robertson et al. 2002). The depths to 15 sedimentation monitoring plates buried in various locations in December 2007 were also measured (with four additional plates buried near the Paremata boatsheds) and the percentage cover of macroalgae (e.g., sea lettuce) mapped.
Figure 5.1: Intertidal monitoring sites and sedimentation plates in Porirua Harbour, including the locations of the five subtidal monitoring sites reported on in Section 4

Annual coastal monitoring report, 2008/09
PAGE 14 OF 31 WGN_DOCS-#679712-V1
5.3 Key findings
In terms of the key estuary issues the monitoring addresses, the January 2009 survey showed:
• Sedimentation: After one year, sedimentation rates at most sites are low. The exception is one site in the upper Onepoto Arm (average of 7mm in 13 months); further plates need to be put in place at this site as the variability across the two sedimentation plates was high (0-14 mm).
• Eutrophication: Similar to last year’s findings, sediment nutrient concentrations and the depth of the oxygenated surface sediment layer indicate that both arms of the harbour are moderately eutrophic or enriched. This conclusion is supported by the presence of elevated numbers of benthic fauna that tolerate moderate levels of mud and/or organic enrichment, and the widespread coverage of macroalgae. More than 10% of the intertidal habitat in the Pauatahanui Arm, and more than 30% of the intertidal habitat in the Onepoto Arm had greater than 50% coverage of macroalgae (Figure 5.2), resulting in localised nuisance conditions (rotting macroalgae and poorly oxygenated and sulphide-rich sediments). At this stage, enrichment is not a major problem, but there is a need for caution in relation to factors that could increase nutrient concentrations and fine sediment in the harbour.
• Toxicants: Total heavy metal concentrations in the sediments of all sites (measured as an indicator of potential toxicants) are well within national sediment quality guidelines. As noted in Section 4, the situation is different in the mud-dominated subtidal basins, particularly in the Onepoto Arm.
Figure 5.2: Dense cover of sea lettuce (Ulva sp.) in the Onepoto Arm of Porirua Harbour

Annual coastal monitoring report, 2008/09
WGN_DOCS-#679712-V2 PAGE 15 OF 31
5.4 Future monitoring
The 2009 fine-scale ecological assessment is the second in a proposed series of three or four annual assessments to establish a “baseline” of existing conditions in the intertidal habitats of Porirua Harbour. After the baseline has been established, the frequency of monitoring is likely to be reduced to five-yearly intervals or as determined otherwise by the monitoring results.

Annual coastal monitoring report, 2008/09
PAGE 16 OF 31 WGN_DOCS-#679712-V1
6. Porirua Harbour sediment “hotspot” investigation
6.1 Introduction and background
Routine monitoring and various investigations have reported elevated concentrations of persistent contaminants in the surface sediments of Porirua Harbour, in particular the heavy metals copper, lead and zinc (e.g., Glasby et al. 1990, Botherway & Gardner 2002, Stephenson & Mills 2006, Milne et al. 2009). The highest contaminant concentrations have generally been recorded in sediments at the southern end of the Onepoto Arm, with urban stormwater outfalls and the Porirua Stream identified as the primary contaminant sources (e.g., Glasby 1990, Robertson & Stevens 2008) (Figure 6.1). With this area of the harbour ear-marked for possible future development, Greater Wellington, in association with Porirua City Council, carried out a targeted sediment investigation to obtain further information on the magnitude and spatial extent of sediment contamination. The investigation – summarised briefly here from a report by Sorensen & Milne (2009) – was designed primarily as a screening exercise, with spatial coverage favoured over sample replication.
Figure 6.1: Outflow from the Semple Street stormwater outfall at the southern end of the Onepoto Arm of Porirua Harbour
6.2 Sampling sites, methods and variables
A total of 17 intertidal sites in Porirua Harbour were selected for sediment sampling (Figure 6.2 & Table A2.3, Appendix 2). Ten of these sites were located at the southern-most end of the Onepoto Arm, in the area between several large stormwater outfalls and the outflow from the Porirua Stream. The other seven sites were located near the mouths of several urban streams that discharge into the harbour, including an unnamed stream that runs through Onepoto Park (for the purposes of this report referred to as Onepoto Stream), and Browns Stream and Duck Creek in the Pauatahanui Arm.

Annual coastal monitoring report, 2008/09
WGN_DOCS-#679712-V2 PAGE 17 OF 31
Figu
re 6.
2: M
ap o
f Por
irua H
arbo
ur sh
owin
g th
e 200
9 sed
imen
t sam
plin
g lo
catio
ns, a
nd th
e sed
imen
t sam
plin
g lo
catio
ns in
oth
er re
levan
t mon
itorin
g pr
ogra
mm
es an
d in
vest
igat
ions
(see
Sor
ense
n &
Miln
e 200
9 for
det
ails)
. Th
e red
lines
on
the i
nset
map
den
ote s
torm
wate
r inp
uts.

Annual coastal monitoring report, 2008/09
PAGE 18 OF 31 WGN_DOCS-#679712-V1
Four streambed sites were also selected for sampling: the Porirua Stream upstream and downstream of the Kenepuru Stream confluence, the lower reaches of the Kenepuru Stream, and the lower reaches of the Onepoto Stream (Figure 6.2). These streams all receive urban stormwater inputs.
A single composite surface (top 20 mm) sediment sample was collected from each site and analysed (sub-2 mm fraction5) for:
• Particle size distribution (sediment texture); • Total organic carbon; • Total nitrogen and total recoverable phosphorus; • Total recoverable arsenic, cadmium, chromium, copper, mercury, nickel,
lead and zinc; • 16 USEPA priority polycyclic aromatic hydrocarbons (PAHs); and • Organochlorine pesticides (OCPs), including DDT and dieldrin.
A sediment core sample was also collected at two sites close to the Semple Street stormwater outfall (POR-H and POR-I). Sample results were compared against both the ANZECC (2000) and ARC (2004) sediment quality guidelines (refer subsection 4.2.3).
6.3 Key findings
The results of the targeted investigation confirm that there is clear evidence of stormwater-derived contamination at intertidal sites in Porirua Harbour. Zinc is present above sediment quality guidelines at all 10 sites sampled between the Semple Street stormwater outfall and the Porirua Stream channel at the southern end of the Onepoto Arm (Figure 6.3). Copper, lead and total high molecular weight polycyclic aromatic hydrocarbon (HMW PAH) concentrations are also present above guideline values at some sites in this area, and total DDT is present above guidelines at all sites. Although only two sediment core samples were taken, zinc was present in one at a concentration equal to the ANZECC (2000) “high” guideline value. This suggests that contamination may exist to some depth, at least in the vicinity of the Semple Street stormwater outfall.
Sediments at the mouth of the ‘Onepoto’ Stream beside the Porirua Rowing Club contain concentrations of lead, zinc, total DDT and various PAH compounds above sediment quality guidelines. Sediments adjacent to the mouths of Browns Stream and Duck Creek have total DDT concentrations above guideline values, with lead and total HMW PAH concentrations also above guidelines in the sediments adjacent to the mouth of Browns Stream.
Stormwater-derived contaminants are also present in the sediments from the beds of streams that discharge into the Porirua Harbour. Concentrations of total DDT, and to a lesser extent zinc, exceed sediment quality guidelines in Porirua, Kenepuru and ‘Onepoto’ streams. Sediments in the ‘Onepoto’ Stream also contain concentrations of several HMW PAH compounds and dieldrin above guideline values.
5 The exceptions were particle size and PAHs, where the laboratory analysed the samples on an “as received” basis.

Annual coastal monitoring report, 2008/09
WGN_DOCS-#679712-V2 PAGE 19 OF 31
Figu
re 6.
3: C
once
ntra
tion
of to
tal z
inc i
n se
dim
ents
of s
ites s
ampl
ed as
par
t of t
he P
oriru
a Har
bour
targ
eted
in
terti
dal s
edim
ent q
ualit
y ass
essm
ent i
n Fe
brua
ry 20
09, b
ased
on
the <
2 mm
frac
tion
of a
singl
e com
posit
e sa
mpl
e fro
m ea
ch si
te. T
he co
ncen
tratio
ns p
rese
nt ar
e col
oure
d in
acco
rdan
ce w
ith se
dim
ent q
ualit
y gu
ideli
nes e
xcee
ded,
with
the l
engt
h of
each
bar
dire
ctly
prop
ortio
nal t
o th
e zin
c con
cent
ratio
n pr
esen
t.

Annual coastal monitoring report, 2008/09
PAGE 20 OF 31 WGN_DOCS-#679712-V1
In most cases, sediment contaminant concentrations only exceed “alert level” or “early warning” guidelines. This indicates that there is an opportunity for management intervention to limit the extent of degradation and prevent adverse environmental effects from occurring. Zinc and DDT are the contaminants of greatest concern; these are persistent contaminants and stormwater and stream investigations to date confirm inputs of both are ongoing (e.g., KML 2005, Milne & Watts 2008).
Annual coastal monitoring report, 2008/09
WGN_DOCS-#679712-V2 PAGE 21 OF 31
7. Whareama Estuary intertidal ecological monitoring
7.1 Introduction and background
In January 2009 a second round of fine-scale ecological monitoring was undertaken in Whareama Estuary, a 12 km long, tidal river lagoon estuary located on Wairarapa’s eastern coast. This monitoring, summarised here from a report by Robertson & Stevens (2009b), followed an earlier assessment of Wairarapa coastal habitats (Robertson & Stevens 2007) which recommended a long-term monitoring programme for Wairarapa coastal habitats. Included in the programme was monitoring of the long-term condition of the Whareama Estuary, focusing on core indicators of sedimentation, eutrophication and, to a lesser extent, contamination.
7.2 Monitoring sites, methods and variables
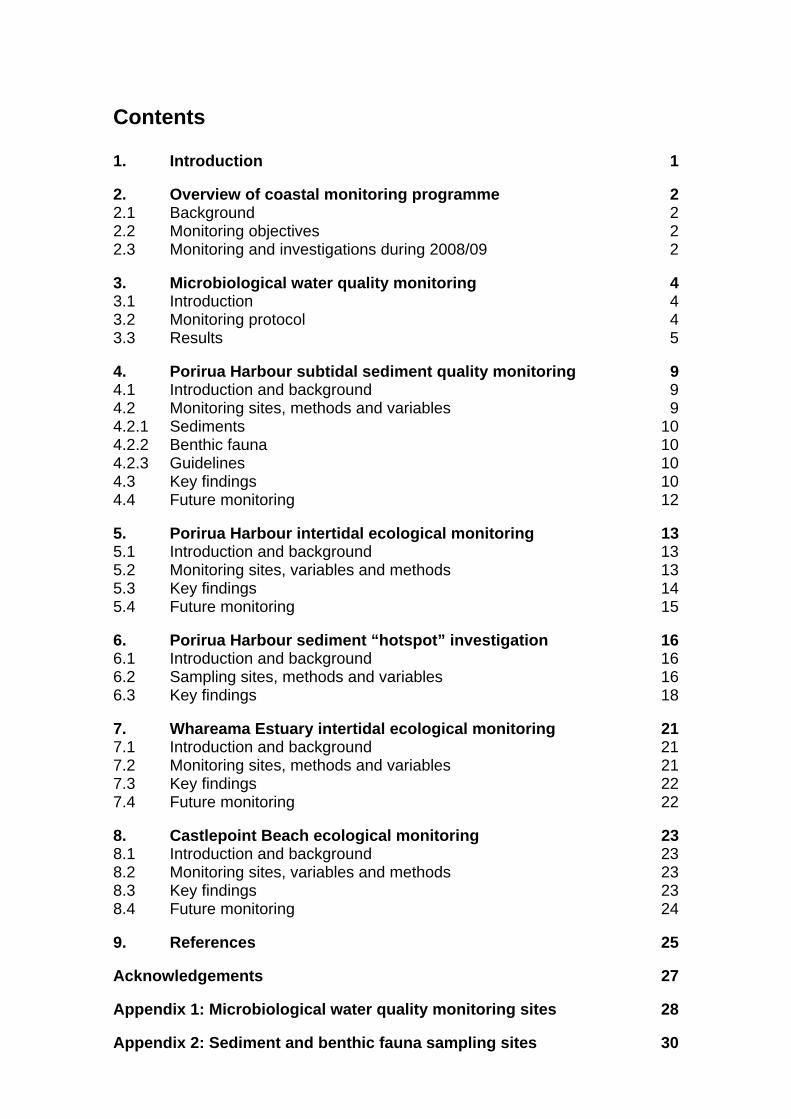
Monitoring was undertaken at two sites located on the unvegetated intertidal mudflats (Figure 7.1 & Table A2.4, Appendix 2). This monitoring included assessments of up to 10 plots per site for selected “fine-scale” sediment condition indicators – including grain size (texture), the degree of oxygenation, nutrient and organic content, and heavy metal concentrations – and benthic (sediment-dwelling) fauna abundance and diversity. The fine-scale monitoring methods were based on an extension of the tools included in the National Estuary Monitoring Protocol (Robertson et al. 2002). The depths to four sedimentation monitoring plates deployed at right angles to the Whareama River channel in January 2008 were also measured.
(Source: Robertson & Stevens (2009b)
Figure 7.1: Sampling the Whareama Estuary intertidal mudflats in January 2009

Annual coastal monitoring report, 2008/09
PAGE 22 OF 31 WGN_DOCS-#679712-V1
7.3 Key findings
The results for the selected physical, chemical and biological indicators of estuary condition showed that the dominant intertidal habitat was generally in “fair” to “good” condition. Nitrogen, phosphorus and organic carbon concentrations were classed as low to moderate, and heavy metal concentrations were very low. However, the sediments comprise 70% muds (i.e., <63 micron in size) and have a shallow oxygenated surface layer (1-3 cm depth). While such conditions result in a benthic community largely dominated by small subsurface deposit-feeding organisms that prefer moderate mud and organic enrichment levels (e.g., the bivalve Arthritica sp. and polychaete Scolecolepides benhami), the 2009 benthic fauna results indicate that there was a slight improvement in the diversity of the estuary's biological community over the last year.
Measurements from the sediment plates reveal a high sedimentation rate over January 2008 to January 2009 (average 14.5 mm). Excessive inputs of sediment are largely a natural phenomenon given the erosion-prone mudstone soils in the catchment. Greater Wellington has a soil conservation programme in place within the Whareama catchment designed to reduce soil erosion.
7.4 Future monitoring
The 2009 fine-scale ecological assessment is the second in a proposed series of three or four annual assessments to establish a “baseline” of existing conditions in the Whareama Estuary. After the baseline has been established, the frequency of monitoring will probably be reduced to five-yearly intervals.

Annual coastal monitoring report, 2008/09
WGN_DOCS-#679712-V2 PAGE 23 OF 31
8. Castlepoint Beach ecological monitoring
8.1 Introduction and background
In January 2009 a second round of fine-scale ecological monitoring was undertaken at Castlepoint Beach, a 4.5 km long exposed beach located on the Wairarapa’s northeastern coast. This monitoring, summarised here from a report by Robertson & Stevens (2009c), followed an earlier assessment of Wairarapa coastal habitats (Robertson & Stevens 2007) which recommended a long-term monitoring programme for the Wairarapa coast. Included in the programme was the establishment of one long-term monitoring site for dissipative6 beach types between Castlepoint and the Whakataki River.
8.2 Monitoring sites, variables and methods
Monitoring was undertaken along two transects, 50 m apart, located towards the northern end of Castlepoint Beach, approximately 750 m south of the Whakataki Estuary (Table A2.5, Appendix 2). Six stations were sampled along each transect (Figure 8.1), with assessments made of sediment grain size (texture), sediment oxygenation and benthic (sediment-dwelling) fauna. Sediment nutrient and contaminant concentrations were not assessed; there are no major nutrient inputs on semi-exposed beaches like Castlepoint, and the risk of toxic contamination is very low.
(Source: Robertson & Stevens (2009c)
Figure 8.1: Cross-section of sampling transect at Castlepoint Beach
8.3 Key findings
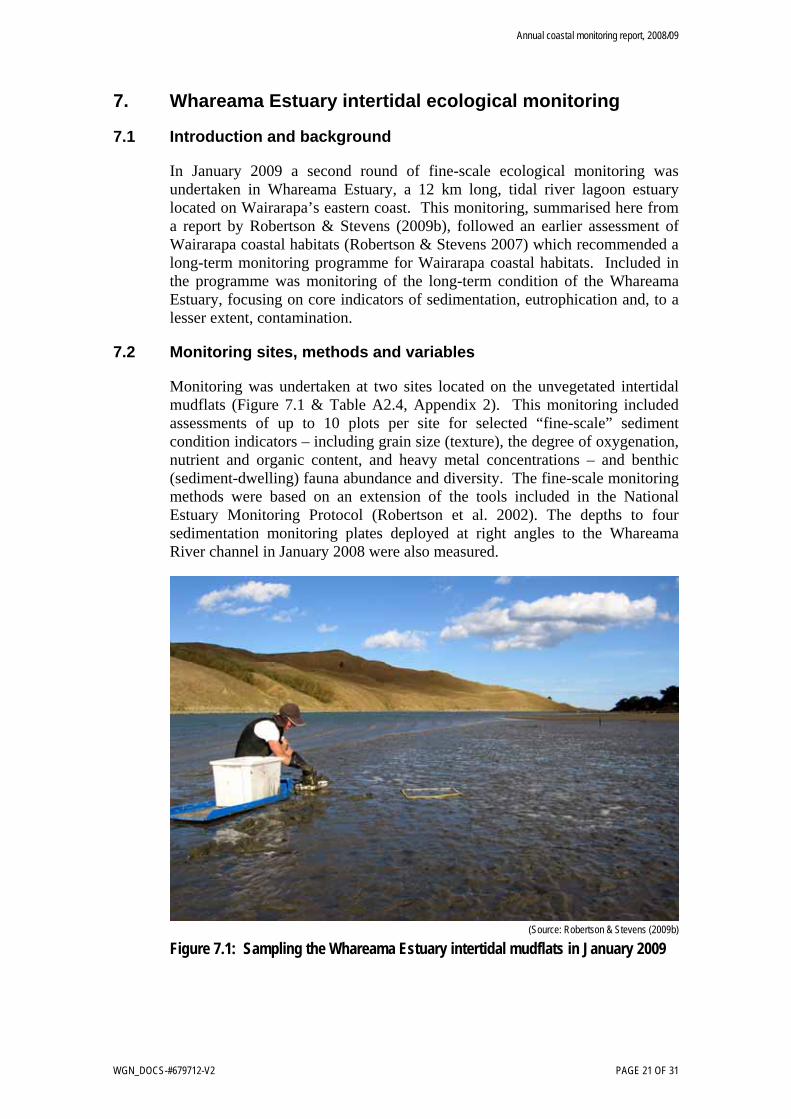
Similar to the first survey (undertaken in January 2008), the results for the selected physical and biological indicators of beach condition showed that the dominant intertidal habitat was generally in “good” condition. The beach sediments consisted of well-oxygenated sands and support benthic invertebrates that are typical of exposed oligotrophic (nutrient-poor) beach environments, such as isopods, amphipods, beetles and polychaete worms (Figure 8.2).
6 Castlepoint Beach is classified as dissipative-intermediate beach, meaning that is relatively flat, and fronted by a moderately wide surf zone in which waves dissipate much of their energy.
Annual coastal monitoring report, 2008/09
PAGE 24 OF 31 WGN_DOCS-#679712-V1
(Source: Robertson & Stevens (2009c)
Figure 8.2: Examples of some of the benthic fauna found at Castlepoint Beach in January 2009
8.4 Future monitoring
The 2009 fine-scale ecological assessment is the second in a proposed series of three annual assessments to establish a “baseline” of existing conditions at Castlepoint Beach. After the baseline has been established, the frequency of monitoring will reduce to five-yearly intervals.

Annual coastal monitoring report, 2008/09
WGN_DOCS-#679712-V2 PAGE 25 OF 31
9. References
ANZECC 2000. Australian and New Zealand Guidelines for Fresh and Marine Water Quality, Volume 1, The Guidelines. Australian and New Zealand Environment and Conservation Council. Agriculture and Resource Management Councils of Australia and New Zealand, Canberra.
ARC 2004. Blueprint for monitoring urban receiving environments. Auckland Regional Council, Technical Publication No. 168, revised edition. 66 p.
Botherway, K. J.; Gardner, J.P.A. 2002. Effect of storm drain discharge on the soft shore ecology of Porirua Inlet, New Zealand. New Zealand Journal of Marine and Freshwater Research, 26: 241-255.
Glasby, P.; Moss, R.L.; Stoffers, P. 1990. Heavy-metal pollution in Porirua Harbour, New Zealand. New Zealand Journal of Marine and Freshwater Research, 24: 233-237.
KML 2005. Assessment of urban stormwater quality in the greater Wellington region. Report prepared for the Greater Wellington Regional Council by Kingett Mitchell Limited.
Milne, J.R. 2006. Contaminants in shellfish flesh: An investigation into microbiological and trace metal contaminants in shellfish from selected locations in the Wellington region. Greater Wellington Regional Council, Publication No. GW/EMI-G-06/285.
Milne, J.R.; Sorensen, P.G.; Kelly, S. 2009. Porirua Harbour subtidal sediment quality monitoring: Results from the 2008/09 survey. Greater Wellington Regional Council, Publication No. GW/EMI-T-09/137.
Milne, J.R.; Watts, L. 2008. Stormwater contaminants in urban streams in the Wellington region. Greater Wellington Regional Council, Publication No. GW/EMI-T-08/82.
Ministry for the Environment, Ministry of Health. 20037. Microbiological water quality guidelines for marine and freshwater recreational areas. Ministry for the Environment, Wellington.
Robertson, B.M.; Gillespie, P.A.; Asher, R.A.; Frisk, S.; Keeley, N.B.; Hopkins, G.A.; Thompson, S.J.; Tuckey, B.J. 2002. Estuarine environmental assessment and monitoring: A national protocol. Part A: Development, Part B: Appendices, and Part C: Application. A report prepared for supporting councils and the Ministry for the Environment, Sustainable Management Fund Contract No. 5096.
Robertson, B.; Stevens, L. 2007. Wairarapa coastal habitats: Mapping, risk assessment and monitoring. Report prepared for Greater Wellington Regional Council. Wriggle Limited.
7 Published June 2002, updated June 2003.
Annual coastal monitoring report, 2008/09
PAGE 26 OF 31 WGN_DOCS-#679712-V1
Robertson, B.; Stevens, L. 2008. Porirua Harbour: Fine scale monitoring 2007/08. Report prepared for Greater Wellington Regional Council. Wriggle Limited.
Robertson, B.; Stevens, L. 2009a. Porirua Harbour: Fine scale intertidal monitoring 2008/09. Report prepared for Greater Wellington Regional Council. Wriggle Limited.
Robertson, B.; Stevens, L. 2009b. Whareama Estuary: Fine scale monitoring 2008/09. Report prepared for Greater Wellington Regional Council. Wriggle Limited.
Robertson, B.; Stevens, L. 2009c. Castlepoint Beach: Fine scale monitoring 2008/09. Report prepared for Greater Wellington Regional Council. Wriggle Limited.
Sorensen, P.G.; Milne, J.R. 2009. Porirua Harbour targeted intertidal sediment quality assessment. Greater Wellington Regional Council, Publication No. GW/EMI-T-09/136.
Stephenson, G.; Mills, G. 2006. Porirua Harbour long-term baseline monitoring programme: Sediment chemistry and benthic ecology results from the October 2005 survey. Report prepared for the Greater Wellington Regional Council. Coastal Marine Ecology Consultants & Diffuse Sources Limited.
Stevens, L.; Robertson, B. 2009. Porirua Harbour: Intertidal macroalgal monitoring 2008/09. Report prepared for Greater Wellington Regional Council. Wriggle Limited.
Warr, S. 2009. On the Beaches 2008/09: Annual recreational water quality monitoring report for the Wellington region. Greater Wellington Regional Council, Publication No. GW/EMI-T-09/79.
Williamson, B.; Green, M.; Olsen, G. 2005. Greater Wellington Regional Council long-term baseline monitoring of marine sediments in Porirua Harbour. NIWA Client Report HAM2004-129, revised September 2005.

Annual coastal monitoring report, 2008/09
WGN_DOCS-#679712-V2 PAGE 27 OF 31
Acknowledgements
Alice Ryan compiled the microbiological summary statistics. Alton Perrie kindly reviewed a draft version of this report.

Annual coastal monitoring report, 2008/09
PAGE 28 OF 31 WGN_DOCS-#679712-V1
Appendix 1: Microbiological water quality monitoring sites
Area Site Name NZ Map Grid Type Easting Northing
Kapiti Otaki Beach @ Surf Club 2688639 6050044 Marine* Kapiti Otaki Beach @ Rangiuru Road 2688028 6048783 Marine Kapiti Te Horo Beach S of Mangaone Stream 2685797 6044192 Marine Kapiti Te Horo Beach @ Kitchener Street 2685513 6043648 Marine Kapiti Peka Peka Beach @ Road End 2683233 6039620 Marine* Kapiti Waikanae Beach @ William Street 2681406 6037299 Marine Kapiti Waikanae Beach @ Tutere St Tennis Courts 2680673 6036577 Marine Kapiti Waikanae Beach @ Ara Kuaka Carpark 2679532 6035693 Marine Kapiti Paraparaumu Beach @ Ngapotiki Street 2677561 6034477 Marine Kapiti Paraparaumu Beach @ Nathan Avenue 2677051 6033889 Marine Kapiti Paraparaumu Beach @ Maclean Park 2676712 6032982 Marine Kapiti Paraparaumu Beach @ Toru Road 2676595 6032430 Marine Kapiti Paraparaumu Beach @ Wharemauku Road 2676521 6031785 Marine Kapiti Raumati Beach @ Tainui Street 2676549 6030944 Marine Kapiti Raumati Beach @ Marine Gardens 2676535 6030156 Marine Kapiti Raumati Beach @ Aotea Road 2676433 6029244 Marine Kapiti Raumati Beach @ Hydes Road 2676337 6028550 Marine* Kapiti Paekakariki Beach @ Whareroa Road 2675617 6025843 Marine Kapiti Paekakariki Beach @ Surf Club 2674810 6023988 Marine Kapiti Paekakariki Beach @ Memorial Hall 2674452 6023305 Marine
Porirua Pukerua Bay 2669309 6017968 Marine Porirua Karehana Bay @ Cluny Road 2666113 6013074 Marine Porirua Plimmerton Beach @ Bath Street 2666726 6012030 Marine Porirua Plimmerton Beach @ Queens Avenue 2666790 6011888 Marine Porirua South Beach @ Plimmerton 2666830 6011588 Marine Porirua Paremata Beach @ Pascoe Avenue 2667137 6010447 Marine Porirua Pauatahanui Inlet @ Water Ski Club 2668094 6011307 Marine Porirua Pauatahanui Inlet @ Motukaraka Point 2669506 6011052 Marine* Porirua Pauatahanui Inlet @ Paremata Bridge 2667173 6009998 Marine Porirua Pauatahanui Inlet @ Browns Bay 2668059 6009547 Marine* Porirua Porirua Harbour @ Rowing Club 2664911 6008661 Marine* Porirua Porirua
Titahi Bay @ Bay Drive Titahi Bay at Toms Road
2664152 2664130
6009883 6009571
Marine Marine
Porirua Titahi Bay @ South Beach Access Road 2663926 6009396 Marine Porirua Onehunga Bay 2665816 6010895 Marine
Hutt Petone Beach @ Water Ski Club 2665765 5996304 Marine Hutt Petone Beach @ Sydney Street 2667067 5995961 Marine Hutt Petone Beach @ Settlers Museum 2667577 5995770 Marine Hutt Petone Beach @ Kiosk 2668348 5995425 Marine Hutt Sorrento Bay 2669654 5993098 Marine* Hutt Lowry Bay @ Cheviot Road 2670228 5992605 Marine Hutt York Bay 2669999 5991874 Marine Hutt Days Bay @ Wellesley College 2669639 5990243 Marine Hutt Days Bay @ Wharf 2669677 5990027 Marine Hutt Days Bay @ Moana Road 2669605 5989834 Marine Hutt Rona Bay @ N end of Cliff Bishop Park 2669132 5989367 Marine Hutt Rona Bay @ Wharf 2668753 5989084 Marine Hutt Robinson Bay @ HW Shortt Rec Ground 2668542 5988387 Marine Hutt Robinson Bay @ Nikau Street 2668154 5987569 Marine Hutt Camp Bay 2667013 5986001 Marine

Annual coastal monitoring report, 2008/09
WGN_DOCS-#679712-V2 PAGE 29 OF 31
Area Site Name NZ Map Grid Type Easting Northing
Wellington Aotea Lagoon 2659007 5989395 Marine Wellington Oriental Bay @ Freyberg Beach 2659942 5989176 Marine Wellington Oriental Bay @ Wishing Well 2660140 5989098 Marine Wellington Oriental Bay @ Band Rotunda 2660265 5989087 Marine Wellington Balaena Bay 2660980 5988979 Marine Wellington Kio Bay 2661163 5988311 Marine Wellington Hataitai Beach 2660654 5987442 Marine Wellington Shark Bay 2662233 5987909 Marine* Wellington Mahanga Bay 2663490 5988828 Marine* Wellington Scorching Bay 2663539 5988360 Marine Wellington Worser Bay 2663097 5986535 Marine Wellington Seatoun Beach @ Wharf 2663152 5985946 Marine Wellington Seatoun Beach @ Inglis Street 2663428 5985706 Marine Wellington Breaker Bay 2663335 5984682 Marine Wellington Lyall Bay @ Tirangi Road 2660770 5984942 Marine Wellington Lyall Bay @ Onepu Road 2660309 5984828 Marine Wellington Lyall Bay @ Queens Drive 2660013 5984580 Marine Wellington Princess Bay 2659609 5983216 Marine Wellington Island Bay @ Surf Club 2658400 5983302 Marine Wellington Island Bay @ Reef St Recreation Ground 2658252 5983254 Marine Wellington Island Bay @ Derwent Street 2658178 5983127 Marine Wellington Owhiro Bay 2657145 5983174 Marine Wairarapa Castlepoint Beach @ Castlepoint Stream 2781366 6029287 Marine Wairarapa Castlepoint Beach @ Smelly Creek 2781670 6028931 Marine Wairarapa Riversdale Beach @ Lagoon Mouth 2768974 6009275 Marine Wairarapa Riversdale Beach Between the Flags 2768445 6008680 Marine Wairarapa Riversdale Beach South 2767844 6007246 Marine
* Water quality is also monitored for recreational shellfish gathering purposes (see Warr 2009)

Annual coastal monitoring report, 2008/09
PAGE 30 OF 31 WGN_DOCS-#679712-V1
Appendix 2: Sediment and benthic fauna sampling sites
Table A2.1: Site position and collection details for the Porirua Harbour subtidal sediment quality monitoring undertaken in November 2008
Site Location Date Position (NZMG coordinates) Easting Northing
Depth1 (m)
PAH1 PAH1B
Pauatahanui Arm off Browns Bay
10/11/2008 10/11/2008
2668177 2668156
6009767 6009789 2.0
PAH2 PAH2B
Pauatahanui Arm off Duck Creek
10/11/2008 10/11/2008
2669747 2669779
6009854 6009831 1.8
PAH3 PAH3B
Pauatahanui Arm off Camborne
10/11/2008 10/11/2008
2668171 2668174
6010921 6010937 1.7
POR1 POR1B
Onepoto Arm South 20/11/2008 20/11/2008
2664884 2664854
6007585 6007604 2.0
POR2 POR2B
Porirua Harbour North 20/11/2008 20/11/2008
2665199 2665178
6008220 6008252 2.9
1 Approximate water depth at mean low water neap tide B = Benthic fauna collection area
Table A2.2: Porirua Harbour intertidal sampling locations (Jan 2009) Sampling Station NZ Map Grid
Easting Northing
Porirua A 2666477 (Plot 01) 2666514 (Plot 10)
6009488 (Plot 01) 6009525 (Plot 10)
Porirua B1 2664635 (Plot 01) 2664607 (Plot 10)
6007136 (Plot 01) 6007217 (Plot 10)
Pauatahanui A 2667263 (Plot 01) 2667266 (Plot 10)
6010358 (Plot 01) 6010315 (Plot 10)
Pauatahanui B 2670378 (Plot 01) 2670398 (Plot 10)
6010057 (Plot 01) 6010055 (Plot 10)
1 The location details for this site were incorrectly listed in the 2007/08 annual coastal monitoring report

Annual coastal monitoring report, 2008/09
WGN_DOCS-#679712-V2 PAGE 31 OF 31
Table A2.3: Site position and collection details for the Porirua Harbour targeted intertidal sediment quality assessment undertaken in February 2009
Position (NZMG coordinates) Site Location Date Easting Northing
POR-A Onepoto Arm, adjacent to Porirua Stream, true right bank 02/02/2009 2664714 6006981 POR-B Onepoto Arm, adjacent to Porirua Stream, true right bank 02/02/2009 2664722 6006885 POR-C Onepoto Arm, adjacent to Porirua Stream, true left bank 02/02/2009 2664684 6006846 POR-D Onepoto Arm, adjacent to Porirua Stream, true left bank 02/02/2009 2664682 6006927 POR-E Onepoto Arm, midway Porirua Stream & stormwater outfall 02/02/2009 2664649 6006897 POR-F Onepoto Arm, 100 m NE from a stormwater outfall 02/02/2009 2664617 6006865 POR-G Onepoto Arm, adjacent to Porirua Stream, true left bank 02/02/2009 2664672 6007011 POR-H Onepoto Arm, 100 m NE of Semple St stormwater outfall 02/02/2009 2664615 6006965 POR-I Onepoto Arm, 50 m N of Semple St stormwater outfall 02/02/2009 2664560 6006967 POR-J Onepoto Arm, 50 m SE of Semple St stormwater outfall 02/02/2009 2664589 6006925 OP-A Onepoto Stream mouth, adjacent to jetty 03/02/2009 2664950 6008665 OP-B Onepoto Stream mouth 03/02/2009 2664985 6008665 BB-A Browns Bay, 50 m W of stream outflow 03/02/2009 2668003 6009539 BB-B Browns Bay, 100 m W stream outflow 03/02/2009 2667966 6009593 BB-C Browns Bay, stream channel banks 03/02/2009 2668003 6009516 DC-A Duck Creek, 50 m N from creek outflow 03/02/2009 2669646 6009491 DC-B Duck Creek, 20 m W of creek outflow 03/02/2009 2669614 6009506 SMS043 Porirua Stream, upstream of Kenepuru Stream 02/02/2009 2664697 6005900 SMS011 Kenepuru Stream upstream of Porirua S confluence 02/02/2009 2664762 6006321 SMS044 Porirua Stream, downstream of Kenepuru Stream 02/02/2009 2664711 6006398 SMS045 Onepoto stream, upstream of Onepoto Road 02/02/2009 2664954 6008734
Table A2.4: Whareama Estuary intertidal sampling locations (Jan 2009) Sampling Station NZ Map Grid
Easting Northing
Whareama A 2770710 (Plot 01) 2770691 (Plot 10)
6017073 (Plot 01) 6017068 (Plot 10)
Whareama B 2770091 (Plot 01) 2770074 (Plot 10)
6017048 (Plot 01) 6017024 (Plot 10)
Table A2.5: Castlepoint Beach sampling locations (Jan 2009) Sampling Station NZ Map Grid
Easting Northing
Castlepoint A 2781628 (Plot 01) 2781679 (Plot 06)
6031520 (Plot 01) 6031502 (Plot 06)
Castlepoint B 2781609 (Plot 01) 2781664 (Plot 06)
6031467 (Plot 01) 6031458 (Plot 06)

Water, air, earth and energy – elements in Greater Wellington’s logo that combine to create and sustain life. Greater Wellington promotes Quality for Life by ensuring our environment is protected while meeting the economic, cultural and social needs of the community
Wellington officePO Box 11646Manners StreetWellington 6142T 04 384 5708F 04 385 6960
Masterton officePO Box 41Masterton 5840 T 06 378 2484F 06 378 2146
Photo CreditLow tide at Browns Bay, Pauatahanui Inlet
GW/EMI-G-09/236October 2009
www.gw.govt.nz
For more information, contact Greater Wellington: