Annual Report · casing includes our newly developed Blue® Max and Blue® Heavy Wall connections...
168
Annual Report 2015
Transcript of Annual Report · casing includes our newly developed Blue® Max and Blue® Heavy Wall connections...

Annual Report 2015

Certain defined terms
Unless otherwise specified or if the context so requires:
References in this annual report to “the Company” refer exclusively
to Tenaris S.A., a Luxembourg public limited liability company (société
anonyme).
References in this annual report to “Tenaris”, “we”, “us” or “our”
refer to Tenaris S.A. and its consolidated subsidiaries. See Accounting
Policies A, B and L to our audited consolidated financial statements
included in this annual report.
References in this annual report to “San Faustin” refer to San Faustin S.A.,
a Luxembourg public limited liability company (société anonyme) and the
Company’s controlling shareholder.
“Shares” refers to ordinary shares, par value $1.00, of the Company.
“ADSs” refers to the American Depositary Shares, which are evidenced
by American Depositary Receipts, and represent two Shares each.
“OCTG” refers to oil country tubular goods.
“tons” refers to metric tons; one metric ton is equal to 1,000
kilograms, 2,204.62 pounds, or 1.102 U.S. (short) tons.
“billion” refers to one thousand million, or 1,000,000,000.
“U.S. dollars”, “US$”, “USD” or “$” each refers to the United States dollar.
Presentation of certain financial and other information
ACCOUNTING PRINCIPLES
We prepare our consolidated financial statements in conformity
with International Financial Reporting Standards, as issued by the
International Accounting Standards Board, or IFRS, and adopted by the
European Union, or E.U.
We publish consolidated financial statements expressed in U.S.
dollars. Our consolidated financial statements included in this annual
report are those as of December 31, 2015 and 2014, and for the
years ended December 31, 2015, 2014 and 2013. Information as of
December 31, 2014, included in this annual report is derived from our
audited restated consolidated financial statements for the year ended
December 31, 2014.
ROUNDING
Certain monetary amounts, percentages and other figures included
in this annual report have been subject to rounding adjustments.
Accordingly, figures shown as totals in certain tables may not be the
arithmetic aggregation of the figures that precede them, and figures
expressed as percentages in the text may not total 100% or, as
applicable, when aggregated may not be the arithmetic aggregation
of the percentages that precede them.
Cautionary statement concerning
forward-looking statements
This annual report and any other oral or written statements made by
us to the public may contain “forward-looking statements”. Forward
looking statements are based on management’s current views and
assumptions and involve known and unknown risks that could cause
actual results, performance or events to differ materially from those
expressed or implied by those statements.
We use words such as “aim”, “will likely result”, “will continue”,
“contemplate”, “seek to”, “future”, “objective”, “goal”, “should”,
“will pursue”, “anticipate”, “estimate”, “expect”, “project”,
“intend”, “plan”, “believe” and words and terms of similar substance
to identify forward-looking statements, but they are not the only way
we identify such statements. This annual report contains forward-
looking statements, including with respect to certain of our plans and
current goals and expectations relating to Tenaris’s future financial
condition and performance. Sections of this annual report that by
their nature contain forward-looking statements include, but are not
limited to, “Business Overview”, “Principal Risks and Uncertainties”,
and “Operating and Financial Review and Prospects”. In addition
to the risks related to our business discussed under “Principal Risks
and Uncertainties”, other factors could cause actual results to differ
materially from those described in the forward-looking statements.
These factors include, but are not limited to:
our ability to implement our business strategy or to grow through
acquisitions, joint ventures and other investments;
the competitive environment in our business and our industry;
our ability to price our products and services in accordance with our
strategy;
our ability to absorb cost increases and to secure supplies of essential
raw materials and energy;
our ability to adjust fixed and semi-fixed costs to fluctuations in
product demand;
trends in the levels of investment in oil and gas exploration and drilling
worldwide; and
general macroeconomic and political conditions in the countries in
which we operate or distribute pipes.
By their nature, certain disclosures relating to these and other risks
are only estimates and could be materially different from what actually
occurs in the future. As a result, actual future gains or losses that may
affect our financial condition and results of operations could differ
materially from those that have been estimated. You should not place
undue reliance on the forward-looking statements, which speak only as
of the date of this annual report. Except as required by law, we are not
under any obligation, and expressly disclaim any obligation to update
or alter any forward-looking statements, whether as a result of new
information, future events or otherwise.
•
•
•
•
•
•
•
•
•
•
•
•
•
•
•
•

3.
Ann
ual R
epor
t
Index
Leading indicators
Letter from the Chairman
Company profile
Management report
Information on Tenaris
The Company
Overview
History and Development of Tenaris
Business Overview
Research and Development
Tenaris in numbers
Principal Risks and Uncertainties
Operating and Financial Review and Prospects
Quantitative and Qualitative Disclosure
about Market Risk
Recent Developments
Environmental Regulation
Related Party Transactions
Employees
Corporate Governance
Management certification
Financial information
Consolidated Financial Statements
Tenaris S.A. Annual Accounts (Luxembourg GAAP)
Investor information
05.
06.
08.
09.
09.
09.
09.
09.
10.
13.
14.
16.
19.
35.
40.
40.
41.
42.
43.
61.
63.
155.
167.

4.
Tena
ris
5.
Ann
ual R
epor
t
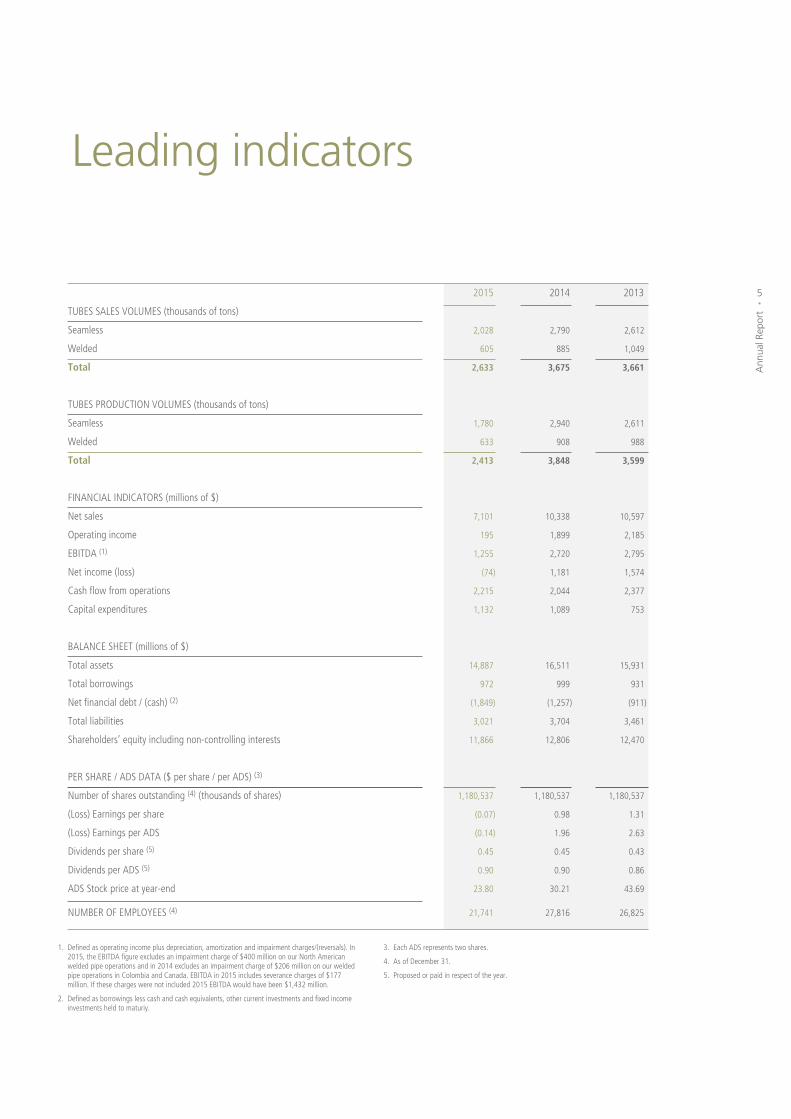
Leading indicators
TUBES SALES VOLUMES (thousands of tons)
Seamless
Welded
Total
TUBES PRODUCTION VOLUMES (thousands of tons)
Seamless
Welded
Total
FINANCIAL INDICATORS (millions of $)
Net sales
Operating income
EBITDA (1)
Net income (loss)
Cash flow from operations
Capital expenditures
BALANCE SHEET (millions of $)
Total assets
Total borrowings
Net financial debt / (cash) (2)
Total liabilities
Shareholders’ equity including non-controlling interests
PER SHARE / ADS DATA ($ per share / per ADS) (3)
Number of shares outstanding (4) (thousands of shares)
(Loss) Earnings per share
(Loss) Earnings per ADS
Dividends per share (5)
Dividends per ADS (5)
ADS Stock price at year-end
NUMBER OF EMPLOYEES (4)
2014
2,790
885
3,675
2,940
908
3,848
10,338
1,899
2,720
1,181
2,044
1,089
16,511
999
(1,257)
3,704
12,806
1,180,537
0.98
1.96
0.45
0.90
30.21
27,816
2015
2,028
605
2,633
1,780
633
2,413
7,101
195
1,255
(74)
2,215
1,132
14,887
972
(1,849)
3,021
11,866
1,180,537
(0.07)
(0.14)
0.45
0.90
23.80
21,741
2013
2,612
1,049
3,661
2,611
988
3,599
10,597
2,185
2,795
1,574
2,377
753
15,931
931
(911)
3,461
12,470
1,180,537
1.31
2.63
0.43
0.86
43.69
26,825
1. Defined as operating income plus depreciation, amortization and impairment charges/(reversals). In 2015, the EBITDA figure excludes an impairment charge of $400 million on our North American welded pipe operations and in 2014 excludes an impairment charge of $206 million on our welded pipe operations in Colombia and Canada. EBITDA in 2015 includes severance charges of $177 million. If these charges were not included 2015 EBITDA would have been $1,432 million.
2. Defined as borrowings less cash and cash equivalents, other current investments and fixed income investments held to maturiy.
3. Each ADS represents two shares.
4. As of December 31.
5. Proposed or paid in respect of the year.

6.
Tena
ris
Letter from the Chairman Dear Shareholders,
The collapse in the price of oil and the decline in oil and gas drilling activity worldwide are resulting in profound changes in the markets where we operate. This is the most severe downturn in our industry I have experienced and, this month, the number of active rigs drilling for oil and gas reached the lowest level recorded since Baker Hughes began publishing this statistic over 60 years ago.
Our operating and financial results are clearly being affected. In a market where demand for OCTG products fell from 17.7 million tons in 2014 to 11.2 million tons in 2015, reflecting sharply lower drilling activity and inventory adjustments, particularly in the USA and Canada, our sales for the year fell 31% to $7.1 billion. EBITDA declined to $1.3 billion, or 18% of sales, and we recorded a net loss for shareholders of $80 million, or $0.07 per share, after impairment and other charges.
These results reflect ongoing efforts to adjust Tenaris to the changing market environment. We have focused strongly on reducing costs using the flexibility of our industrial structure, maintaining high levels of efficiency in our mills even with low volumes, improving the efficiency of our purchasing processes and reducing our fixed cost structure.
We have focused on cash flow management, generating $2.2 billion from operations during the year, including a $1.4 billion reduction in working capital, and maintained investments in strategic projects including the Bay City mill and service development for our customers.
Our financial position remains solid with net cash of $1.8 billion at the end of the year. In this context, we are proposing to maintain our dividend at $0.45 per share for the 2015 fiscal year.
Around the world, we are strengthening our market position in the many distinct geographical and product segments where we operate. Each of our business units is developing strategies to take advantage of the eventual recovery, leveraging on our competitive advantages of financial strength, product technology, service development and on-the-ground customer relationships. In a low price environment, customers are looking for ways to transform the costs in their supply chain on a sustainable basis and we stand out as a supplier that can guarantee continuity, commitment, quality and innovation in every operational situation.
In the United States, we rolled out our Rig Direct™ service program in the Eagle Ford and Permian regions, investing in new service centers in Freeport and Midland. This way of operating the tubular supply chain, where we synchronize deliveries from our mills and manage the supply of pipes and accessories directly to the rig, contributes to a more sustainable, cost-efficient operation, reducing working capital and inventory obsolescence and simplifying operating procedures. By the end of the year we were supplying 50 rigs and the program will be strengthened when our Bay City mill starts operations later this year.
In the North Sea, we were awarded a multi-year contract to supply Maersk’s Culzean development, which is expected to supply 5% of the UK’s natural gas requirements from 2020. The supply package of sour service casing includes our newly developed Blue® Max and Blue® Heavy Wall connections fully tested under the API 5C5 CAL IV protocol, our Dopeless® technology and a full scope of pipe management services supported by local threading and repair capabilities.
We are in the final stages of negotiation of a global long-term agreement with Chevron. As part of the process, we recently concluded agreements to serve their operations in Thailand and Permian. In Thailand, we are preparing two local service centers to supply pipes and accessories ready for running offshore on a just-in-time basis using an innovative pipe by pipe tracking solution to optimize material and quality management. In the Permian, Chevron’s operation is being served under our Rig Direct™ program.

7.
Ann
ual R
epor
t
Through the year we have consolidated our leading position in the offshore line pipe segment supplying major projects in the Gulf of Mexico and sub-Saharan Africa and our coating facility in Nigeria made an important contribution to our results.
In the difficult environment for the energy sector, other segments of our business are receiving more visibility. In the automotive sector, for example, we have built a leading position in tubular components for airbags, where we have a 40% global market share. In 2015 we delivered a record 70 million pieces. This year, we have been awarded a long-term contract for the supply of tubes for the ring gears in the new 10-speed gearbox transmission developed for Ford and GM. This is a sector which requires constant effort and focus on the long-term to develop products, service, quality and reliability for demanding customers.
We are taking care to maintain the long-term values on which the company has been founded. Safety is a key value for an industrial company like ours, essential for our competitive differentiation and the long-term sustainability of our operations. Our main safety indicators improved as we implemented a zero tolerance program alongside our safe hour and safe start programs. Our average injury frequency rate declined 15% in 2015 compared to 2014 and has declined 46% over the past four years.
I would also like to mention the recognition that TenarisUniversity has achieved over the past year. The MOOCs (Massive Online Open Courses) on OCTG products and services that it produced in 2015 for the edX platform founded by Harvard and MIT achieved outstanding performance ratings and completion rates around the world. And Tenaris was included within the top ten companies for its employee training and development practices in 2016 by Training Magazine, an established US publication.
As we enter 2016, oil and gas prices have declined further and oil and gas companies are making further substantial cutbacks on their investment programs. Demand for OCTG continues to decline, particularly in the United States and Canada where drilling activity is falling rapidly and inventory levels remain high in relation to consumption.
In this difficult context, we are organizing the company and defining our strategies to be prepared for an extended period of low oil prices. At the same time, we are concentrating on preparing for the inevitable recovery in each of our business units. Thus we are maintaining our strategic investments in the Bay City mill, product development, service development and human resources.
Our customers need to develop transformational changes to their supply structures with partners having the global reach and financial strength to support them in their operations worldwide. We think we are well positioned to help them. Ours is a cyclical industry, and however long this downturn lasts, we are confident that we will emerge from it with a stronger market position.
I am aware of the profound impact this downturn is having on our employees and our communities: we are making many difficult decisions to secure the future growth and competitiveness of the company. I especially want to thank them for the spirit, commitment and support that I see in all areas. I would also like to express my thanks to our customers, suppliers and shareholders for their continuing support and confidence in Tenaris.
March 30, 2016
/s/ Paolo Rocca
Paolo Rocca

8.
Tena
ris
Tenaris is a leading supplier of tubes and related services for the world’s energy industry and certain other industrial applications. Our mission is to deliver value to our customers through product development, manufacturing excellence and supply chain management. We seek to minimize risk for our customers and help them reduce costs, increase flexibility and improve time-to-market. Our employees around the world are committed to continuous improvement by sharing knowledge across a single global organization.
Company profile

9.
Ann
ual R
epor
t
Information on Tenaris
The Company
Our holding company’s legal and commercial name is Tenaris S.A. The Company was established as a public limited liability company (société anonyme) organized under the laws of the Grand Duchy of Luxembourg. The Company’s registered office is located at 29 avenue de la Porte-Neuve, 3rd Floor, L-2227, Luxembourg, telephone (352) 2647-8978.
The Company has no branches. For information on the Company’s subsidiaries, see note 29 “Principal subsidiaries” to our audited consolidated financial statements included in this annual report.
Overview
We are a leading global manufacturer and supplier of steel pipe products and related services for the world’s energy industry and for other industrial applications. Our customers include most of the world’s leading oil and gas companies as well as engineering companies engaged in constructing oil and gas gathering, transportation, processing and power generation facilities. Our principal products include casing, tubing, line pipe, and mechanical and structural pipes.
We operate an integrated worldwide network of steel pipe manufacturing, research, finishing and service facilities with industrial operations in the Americas, Europe, Asia and Africa and a direct presence in most major oil and gas markets.
Our mission is to deliver value to our customers through product development, manufacturing excellence, and supply chain management. We seek to minimize risk for our customers and help them reduce costs, increase flexibility and improve time-to-market. Our employees around the world are committed to continuous improvement by sharing knowledge across a single global organization.
History and Development of Tenaris
Tenaris began with the formation of Siderca S.A.I.C., or Siderca, the sole Argentine producer of seamless steel pipe products, by San Faustin’s predecessor in Argentina in 1948. We acquired Siat, an Argentine welded steel pipe manufacturer, in 1986. We grew organically in Argentina and then, in the early 1990s, began to evolve beyond this initial base into a global business through a series of strategic investments. As of to date, our investments include controlling or strategic interests in: Tubos de Acero de México S.A., or Tamsa, the sole Mexican producer of seamless steel pipe products; Dalmine S.p.A., or Dalmine, a leading Italian producer of seamless steel pipe products; Confab Industrial S.A., or Confab, the leading Brazilian producer of welded steel pipe products; NKKTubes, a leading Japanese producer of seamless steel pipe products; Algoma Tubes Inc., or AlgomaTubes, the sole Canadian producer of seamless steel pipe products; S.C. Silcotub S.A., or Silcotub, a leading Romanian producer of seamless steel pipe products; Maverick Tube Corporation, or Maverick, a leading North American producer of welded steel pipe products with operations in the United States, Canada and Colombia; Hydril Company, or Hydril, a leading North American manufacturer of premium connection products for oil and gas drilling production; Seamless Pipe Indonesia Jaya, or SPIJ, an Indonesian oil country tubular goods, or OCTG, processing business with heat treatment and premium connection threading facilities; Pipe Coaters Nigeria Ltd, the leading company in the Nigerian coating industry; Usinas Siderúrgicas de Minas Gerais S.A., or Usiminas, a Brazilian producer of high quality flat steel products used in the energy, automotive and other industries; and a sucker rod business, in Campina, Romania.
In addition, we have established a global network of pipe finishing, distribution and service facilities

10.
Tena
ris
with a direct presence in most major oil and gas markets and a global network of research and development centers.
Business Overview
Our business strategy is to continue expanding our operations worldwide and further consolidate our position as a leading global supplier of high-quality tubular products and services to the energy and other industries by:
pursuing strategic investment opportunities in order to strengthen our presence in local and global markets;expanding our comprehensive range of products and developing new high-value products designed to meet the needs of customers operating in increasingly challenging environments; securing an adequate supply of production inputs and reducing the manufacturing costs of our core products; andenhancing our offer of technical and pipe management services designed to enable customers to optimize their selection and use of our products and reduce their overall operating costs.
Pursuing strategic investment opportunities
and alliances
We have a solid record of growth through strategic investments and acquisitions. We pursue selective strategic investments and acquisitions as a means to expand our operations and presence in select markets, enhance our global competitive position and capitalize on potential operational synergies. Our track record on companies’ acquisitions is described above (See “History and Development of Tenaris”). In addition, we continue to build a new greenfield seamless mill in Bay City, Texas. The new
•
•
•
•
facility will include a state-of-the-art rolling mill as well as finishing and heat treatment lines. We plan to bring the 600,000 tons per year capacity mill and logistics center into operation in 2017, within a budget of approximately $1.5 billion to $1.8 billion. As of December 31, 2015, approximately $0.8 billion had already been invested and an additional $0.3 billion had been committed.
Developing high-value products
We have developed an extensive range of high-value products suitable for most of our customers’ operations using our network of specialized research and testing facilities and by investing in our manufacturing facilities. As our customers expand their operations, we seek to supply high-value products that reduce costs and enable them to operate safely in increasingly challenging environments.
Securing inputs for our manufacturing
operations
We seek to secure our existing sources of raw material and energy inputs, and to gain access to new sources, of low-cost inputs which can help us maintain or reduce the cost of manufacturing our core products over the long term. For example, in February 2014, we entered into an agreement with our affiliates Ternium S.A., or Ternium and Tecpetrol International S.A. (a wholly-owned subsidiary of San Faustin, the controlling shareholder of both Tenaris and Ternium) to build a natural gas-fired combined cycle electric power plant in Mexico¸ expected to be completed in 2016, which will supply Tenaris’s and Ternium’s respective Mexican industrial facilities. For information on the new power plant, see note 12 c) “Investments in non-consolidated companies – Techgen S.A. de C.V.” to our audited consolidated financial statements included in this annual report.

11.
Ann
ual R
epor
t
Enhancing our offer of technical and pipe
management services
We continue to enhance our offer of technical and pipe management services for our customers worldwide. Through the provision of these services, we seek to enable our customers to optimize their operations, reduce costs and to concentrate on their core businesses. They are also intended to differentiate us from our competitors and further strengthen our relationships with our customers worldwide through long-term agreements. For example, in Mexico, since 1994, we supply Pemex, the state-owned oil company, one of the world’s largest crude oil and condensates producers under just-in-time, or JIT, agreements, which allow us to provide it with comprehensive pipe management services on a continuous basis.
Our Competitive Strengths
We believe our main competitive strengths include:our global production, commercial and distribution capabilities, offering a full product range with flexible supply options backed up by local service capabilities in important oil and gas producing and industrial regions around the world;our ability to develop, design and manufacture technologically advanced products;our solid and diversified customer base and historic relationships with major international oil and gas companies around the world, and our strong and stable market shares in the countries in which we have manufacturing operations;our proximity to our customers;our human resources around the world with their diverse knowledge and skills;our low-cost operations, primarily at state-of-the-art, strategically located production facilities with
favorable access to raw materials, energy and labor, and more than 60 years of operating experience; andour strong financial condition.
Business Segments
Tenaris has one major business segment, Tubes, which is also the reportable operating segment.
The Tubes segment includes the production and sale of both seamless and welded steel tubular products and related services mainly for the oil and gas industry, particularly oil country tubular goods (OCTG) used in drilling operations, and for other industrial applications with production processes that consist in the transformation of steel into tubular products. Business activities included in this segment are mainly dependent on the oil and gas industry worldwide, as this industry is a major consumer of steel pipe products, particularly OCTG used in drilling activities. Demand for steel pipe products from the oil and gas industry has historically been volatile and depends primarily upon the number of oil and natural gas wells being drilled, completed and reworked, and the depth and drilling conditions of these wells. Sales are generally made to end users, with exports being done through a centrally managed global distribution network and domestic sales made through local subsidiaries. Corporate general and administrative expenses have been allocated to the Tubes segment.
Others include all other business activities and operating segments that are not required to be separately reported, including the production and selling of sucker rods, welded steel pipes for electric conduits, industrial equipment, coiled tubing, energy and raw materials that exceed internal requirements.
•
•
•
••
•
•

12.
Tena
ris
For more information on our business segments, see accounting policy C “Segment information” to our audited consolidated financial statements included in this annual report.
Our Products
Our principal finished products are seamless and welded steel casing and tubing, line pipe and various other mechanical and structural steel pipes for different uses. Casing and tubing products are also commonly referred to as OCTG products. We manufacture our steel pipe products in a wide range of specifications, which vary in diameter, length, thickness, finishing, steel grades, coating, threading and coupling. For most complex applications, including high pressure and high temperature applications, seamless steel pipes are usually specified and, for some standard applications, welded steel pipes can also be used.
Casing
Steel casing is used to sustain the walls of oil and gas wells during and after drilling.
Tubing
Steel tubing is used to conduct crude oil and natural gas to the surface after drilling has been completed.
Line pipe
Steel line pipe is used to transport crude oil and natural gas from wells to refineries, storage tanks and loading and distribution centers.
Mechanical and structural pipes
Mechanical and structural pipes are used by general industry for various applications, including
the transportation of other forms of gas and liquids under high pressure.
Cold-drawn pipe
The cold-drawing process permits the production of pipes with the diameter and wall thickness required for use in boilers, superheaters, condensers, heat exchangers, automobile production and several other industrial applications.
Premium joints and couplings
Premium joints and couplings are specially designed connections used to join lengths of steel casing and tubing for use in high temperature or high pressure environments. A significant portion of our steel casing and tubing products are supplied with premium joints and couplings. We own an extensive range of premium connections, and following the integration of the premium connections business of Hydril , we market our premium connection products under the TenarisHydril brand name. In addition, we hold licensing rights to manufacture and sell the Atlas Bradford range of premium connections outside of the United States.
Coiled tubing
Coiled tubing is used for oil and gas drilling and well workovers and for subsea pipelines.
Other Products
We also manufacture sucker rods used in oil extraction activities, industrial equipment of various specifications and diverse applications, including liquid and gas storage equipment, and welded steel pipes for electric conduits used in the construction industry. In addition, we sell raw materials that exceed our internal requirements.

13.
Ann
ual R
epor
t
Research and Development
Research and development, or R&D, of new products and processes to meet the increasingly stringent requirements of our customers is an important aspect of our business.
R&D activities are carried out primarily at our specialized research facilities located at Campana in Argentina, at Veracruz in Mexico, at Dalmine in Italy, at the product testing facilities of NKKTubes in Japan and at the new R&D center at Ilha do Fundao, Rio de Janeiro, Brazil (which commenced operations in 2014). We strive to engage some of the world’s leading industrial research institutions to solve the problems posed by the complexities of oil and gas projects with innovative applications. In addition, our global technical sales team is made up of experienced engineers who work with our customers to identify solutions for each particular oil and gas drilling environment.
Product development and research currently being undertaken are focused on the increasingly challenging energy markets and include:
proprietary premium joint products including Dopeless® technology;heavy wall deep water line pipe, risers and welding technology;proprietary steels;tubes and components for the car industry and mechanical applications;tubes for boilers; welded pipes for oil and gas and other applications; sucker rods; andcoatings.
•
•
••
••
••
In addition to R&D aimed at new or improved products, we continuously study opportunities to optimize our manufacturing processes. Recent projects in this area include modeling of rolling and finishing process and the development of different process controls, with the goal of improving product quality and productivity at our facilities. We seek to protect our intellectual property, from R&D and innovation, through the use of patents and trademarks that allow us to differentiate ourselves from our competitors.
We spent $89 million for R&D in 2015, compared to $107 million in 2014 and $106 million in 2013.

14.
Tena
ris
Tenaris in numbers
EBITDA MARGIN
5
25
30
20
15
2011 2012 2013 2014 20150
10
%
RETURN ON EQUITY
15
20
10
25
5
0
-5
%
20152011 2012 2013 2014
4
3
2
3.5
2.5
1.5
1
0.5
LOST TIME ACCIDENTS INDEX
ACCI
DEN
TSPE
R M
ILLI
ON
MAN
/HO
URS
2.7
2.2
3.03.2
20152011 2012 2013 2014
PERSONNEL EMPLOYEDPER COUNTRY
ROMANIA7%
INDONESIA2%
JAPAN2%
CANADA3%
COLOMBIA3%
OTHERCOUNTRIES
5%
ITALY9%
MEXICO23%
UNITEDSTATES10% BRAZIL
9%
ARGENTINA25%
USD
EARNINGS PER SHARE
1.4
1.0
0.6
0.2
1.2
1.6
0.8
0.4
2015
0.95
2011 2012 2013 2014
0.98
1.311.44
1.13
-0.2
RIG COUNT INTERNATIONAL
1200
1000
800
600
400
200
20152011 2012 2013 2014
Source: Baker Hughes
RIG
S
GAS MISCOIL
894
229
44
1050
248
38
1004
242
50
960
226
48
897
228
41
0
NET SALES BY REGIONAL AREA
FAR EAST & OCEANIA
4%
EUROPE10%
NORTHAMERICA
40%
SOUTH AMERICA30%
MIDDLE EAST& AFRICA15%
USD
MIL
LIO
N
NET SALES
12000
10000
8000
6000
4000
2000
20152011 2012 2013 2014
1033810597108349972
7101
0
Source: Baker Hughes
RIG COUNT USA AND CANADA
GASOIL
RIG
S
201320122011
494
1745
503
1606
658
1621
1027
1263334
835
2014 2015
NET SALES BY BUSINESS SEGMENT
TUBES91%
OTHER9%
-0.07
0
0
2.5
Trend information Leading indicators
EBITDA MARGIN
5
25
30
20
15
2011 2012 2013 2014 20150
10
%
RETURN ON EQUITY
15
20
10
25
5
0
-5
%
20152011 2012 2013 2014
4
3
2
3.5
2.5
1.5
1
0.5
LOST TIME ACCIDENTS INDEX
ACCI
DEN
TSPE
R M
ILLI
ON
MAN
/HO
URS
2.7
2.2
3.03.2
20152011 2012 2013 2014
PERSONNEL EMPLOYEDPER COUNTRY
ROMANIA7%
INDONESIA2%
JAPAN2%
CANADA3%
COLOMBIA3%
OTHERCOUNTRIES
5%
ITALY9%
MEXICO23%
UNITEDSTATES10% BRAZIL
9%
ARGENTINA25%
USD
EARNINGS PER SHARE
1.4
1.0
0.6
0.2
1.2
1.6
0.8
0.4
2015
0.95
2011 2012 2013 2014
0.98
1.311.44
1.13
-0.2
RIG COUNT INTERNATIONAL
1200
1000
800
600
400
200
20152011 2012 2013 2014
Source: Baker Hughes
RIG
S
GAS MISCOIL
894
229
44
1050
248
38
1004
242
50
960
226
48
897
228
41
0
NET SALES BY REGIONAL AREA
FAR EAST & OCEANIA
4%
EUROPE10%
NORTHAMERICA
40%
SOUTH AMERICA30%
MIDDLE EAST& AFRICA15%
USD
MIL
LIO
N
NET SALES
12000
10000
8000
6000
4000
2000
20152011 2012 2013 2014
1033810597108349972
7101
0
Source: Baker Hughes
RIG COUNT USA AND CANADA
GASOIL
RIG
S
201320122011
494
1745
503
1606
658
1621
1027
1263334
835
2014 2015
NET SALES BY BUSINESS SEGMENT
TUBES91%
OTHER9%
-0.07
0
0
2.5

15.
Ann
ual R
epor
t
EBITDA MARGIN
5
25
30
20
15
2011 2012 2013 2014 20150
10
%
RETURN ON EQUITY
15
20
10
25
5
0
-5
%
20152011 2012 2013 2014
4
3
2
3.5
2.5
1.5
1
0.5
LOST TIME ACCIDENTS INDEX
ACCI
DEN
TSPE
R M
ILLI
ON
MAN
/HO
URS
2.7
2.2
3.03.2
20152011 2012 2013 2014
PERSONNEL EMPLOYEDPER COUNTRY
ROMANIA7%
INDONESIA2%
JAPAN2%
CANADA3%
COLOMBIA3%
OTHERCOUNTRIES
5%
ITALY9%
MEXICO23%
UNITEDSTATES10% BRAZIL
9%
ARGENTINA25%
USD
EARNINGS PER SHARE
1.4
1.0
0.6
0.2
1.2
1.6
0.8
0.4
2015
0.95
2011 2012 2013 2014
0.98
1.311.44
1.13
-0.2
RIG COUNT INTERNATIONAL
1200
1000
800
600
400
200
20152011 2012 2013 2014
Source: Baker Hughes
RIG
S
GAS MISCOIL
894
229
44
1050
248
38
1004
242
50
960
226
48
897
228
41
0
NET SALES BY REGIONAL AREA
FAR EAST & OCEANIA
4%
EUROPE10%
NORTHAMERICA
40%
SOUTH AMERICA30%
MIDDLE EAST& AFRICA15%
USD
MIL
LIO
N
NET SALES
12000
10000
8000
6000
4000
2000
20152011 2012 2013 2014
1033810597108349972
7101
0
Source: Baker Hughes
RIG COUNT USA AND CANADA
GASOIL
RIG
S
201320122011
494
1745
503
1606
658
1621
1027
1263334
835
2014 2015
NET SALES BY BUSINESS SEGMENT
TUBES91%
OTHER9%
-0.07
0
0
2.5

16.
Tena
ris
Principal risks and uncertainties
We face certain risks associated to our business and the industry in which we operate. We are a global steel pipe manufacturer with a strong focus on manufacturing products and related services for the oil and gas industry. Demand for our products depends primarily on the level of exploration, development and production activities of oil and gas companies and the corresponding capital spending by oil and gas companies depends primarily on current and expected future prices of oil and natural gas and is sensitive to the industry’s view of future economic growth and the resulting impact on demand for oil and natural gas. The level of drilling activity has been severely affected by a strong decline in prices of oil and natural gas. Several factors, such as the supply and demand for oil and gas, and political and global economic conditions, affect, and may continue to affect, these prices. Oil and gas prices are reaching levels which, in some areas, are close to or even below operating costs; accordingly, oil and gas companies may cut back further on their investment plans and consequently, absent a significant improvement in market conditions, demand for our products may decline further. Inventory levels of steel pipe in the oil and gas industry can vary significantly and these fluctuations can affect demand for our products. When oil and gas prices fall, as has recently happened, oil and gas companies draw from existing inventory and are generally expected to hold or reduce purchases of additional steel pipe products. Furthermore, competition in the global market for steel pipe products may cause us to lose market share and hurt our sales and our profitability may be hurt if increases in the cost of raw materials and energy cannot be offset by higher selling prices. In addition, there is an increased risk that unfairly-traded steel pipe imports in markets in which Tenaris produces and sells its products may affect Tenaris’s market share, deteriorate the pricing environment and hurt sales and profitability. A recession in the developed
countries, a cooling of emerging market economies or an extended period of below-trend growth in the economies that are major consumers of steel pipe products would likely result in reduced demand of our products, adversely affecting our revenues, profitability and financial condition.
We have temporarily suspended certain of our operations given the impact to our business of the sharp decline of oil prices and high levels of unfairly traded imports of products. Temporary suspensions of operations may give rise to labor conflicts and affect operations, profitability and may trigger impairment assessments of assets. Performance may also be affected by changes in governmental policies, the impact of credit restrictions on our customers’ ability to perform their payment obligations with us, and any adverse economic, political or social developments in our major markets. We have significant operations in various countries, including Argentina, Brazil, Canada, Colombia, Italy, Japan, Mexico, Nigeria, Romania and the United States, and we sell our products and services throughout the world. Therefore, like other companies with worldwide operations, our business and operations have been, and could in the future be, affected from time to time to varying degrees by political, economic and social developments and changes in, laws and regulations. These developments and changes may include, among others, nationalization, expropriations or forced divestiture of assets; restrictions on production, imports and exports, interruptions in the supply of essential energy inputs; exchange and/or transfer restrictions, inability or increasing difficulties to repatriate income or capital or to make contract payments; inflation; devaluation; war or other international conflicts; civil unrest and local security concerns, including high incidences of crime and violence involving drug trafficking organizations that threaten the safe operation of our facilities

17.
Ann
ual R
epor
t
and operations; direct and indirect price controls; tax increases and changes in the interpretation, application or enforcement of tax laws and other retroactive tax claims or challenges; changes in laws, norms and regulations; cancellation of contract rights; and delays or denials of governmental approvals. As a global company, a portion of our business is carried out in currencies other than the U.S. dollar, which is the Company’s functional currency. As a result, we are exposed to foreign exchange rate risk, which could adversely affect our financial position and results of operations.
Beginnig in 2009, Venezuela nationalized our investments in, and assumed exclusive operation control over the assets of, Tubos de Acero de Venezuela S.A. or Tavsa, Matesi, Materiales Siderúrgicos S.A., or Matesi, and Complejo Siderurgico de Guayana, C.A., or Comsigua. Our investments in Tavsa, Matesi and Comsigua are protected under applicable bilateral investment treaties, including the bilateral investment treaty between Venezuela and the Belgian-Luxembourgish Union, and Tenaris continues to reserve all of its rights under contracts, investment treaties and Venezuelan and international law. Tenaris has consented to the jurisdiction of the International Centre for Settlement of Investment Disputes, or ICSID, in connection with the nationalization process. The Company and its wholly-owned subsidiary Talta - Trading e Marketing Sociedad Unipessoal Lda, or Talta, initiated arbitration proceedings against Venezuela before the ICSID seeking adequate and effective compensation for the expropriation of their investments in Matesi, Tavsa and Comsigua. On January 29, 2016, the ICSID released its award for the expropriation of our investment in Matesi and granted compensation in the amount of $87 million for the breaches and ordered Venezuela to pay an additional amount of $86 million in pre-award interest, aggregating
to a total award of $173 million, payable in full and net of any applicable Venezuelan tax, duty or charge. However, given the current economic and political situation of Venezuela, we can give no assurance that the Venezuelan government will honor the award for the expropriation of our investments in Matesi nor agree to pay a fair and adequate compensation for our interest in Tavsa and Comsigua, or that any such compensation will be freely convertible into or exchangeable for foreign currency. For further information on the nationalization of the Venezuelan subsidiaries, see note 30 “Nationalization of Venezuelan Subsidiaries” to our audited consolidated financial statements included in this annual report.
A key element of our business strategy is to develop and offer higher value-added products and services and to continue to pursue growth-enhancing strategic opportunities. Any of the components of our overall business strategy could cost more than anticipated or may not be successfully implemented or could be delayed or abandoned. We must necessarily base any assessment of potential acquisitions, joint ventures and investments, on assumptions with respect to operations, profitability and other matters that may subsequently prove to be incorrect. Failure to successfully implement our strategy, or to integrate future acquisitions and strategic investments, or to sell acquired assets or business unrelated to our business under favorable terms and conditions, could affect our ability to grow, our competitive position and our sales and profitability.
We may be required to record a significant charge to earnings if we must reassess our goodwill or other assets as a result of changes in assumptions underlying the carrying value of certain assets, particularly as a consequence of deteriorating market conditions. At December 31, 2015 we had $1,334 million in goodwill corresponding mainly to

18.
Tena
ris
the acquisition of Hydril, in 2007 ($920 million) and Maverick, in 2006 ($275 million). As of December 31, 2015, we recorded an impairment charge of $400 million on the goodwill of our welded pipe assets in the United States, reflecting the decline in oil prices, and their impact on drilling activity and the demand outlook for welded pipe products in the United States. Additionally, as of December 31, 2015 we also recorded a $29 million impairment on the carrying value of our investment in Usiminas. If our management were to determine in the future that the goodwill or other assets were impaired, particularly as a consequence of deteriorating market conditions, we would be required to recognize a non-cash charge to reduce the value of these assets, which would adversely affect our results of operations.
Potential environmental, product liability and other claims arising from the inherent risks associated with the products we sell and the services we render, including well failures, line pipe leaks, blowouts, bursts and fires, that could result in death, personal injury, property damage, environmental pollution or loss of production could create significant liabilities for us. Environmental laws and regulations may, in some cases, impose strict liability (even joint and several strict liability) rendering a person liable for damages to natural resources or threats to public health and safety without regard to negligence or fault. In addition, we are subject to a wide range of local, provincial and national laws, regulations, permit requirements and decrees relating to the protection of human health and the environment, including laws and regulations relating to hazardous materials and radioactive materials and environmental protection governing air emissions, water discharges and waste management. Laws and regulations protecting the environment have become increasingly complex and more stringent and expensive to implement in recent years. The cost of complying with such regulations is not
always clearly known or determinable since some of these laws have not yet been promulgated or are under revision. These costs, along with unforeseen environmental liabilities, may increase our operating costs or negatively impact our net worth.
We conduct business in certain countries known to experience governmental corruption. Although we are committed to conducting business in a legal and ethical manner in compliance with local and international statutory requirements and standards applicable to our business, there is a risk that our employees or representatives may take actions that violate applicable laws and regulations that generally prohibit the making of improper payments to foreign government officials for the purpose of obtaining or keeping business, including laws relating to the 1997 OECD Convention on Combating Bribery of Foreign Public Officials in International Business Transactions such as the U.S. Foreign Corrupt Practices Act, and the U.K Bribery Act 2010.
As a holding company, our ability to pay expenses, debt service and cash dividends depends on the results of operations and financial condition of our subsidiaries, which could be restricted by legal, contractual or other limitations, including exchange controls or transfer restrictions, and other agreements and commitments of our subsidiaries.
The Company’s controlling shareholder may be able to take actions that do not reflect the will or best interests of other shareholders.
Our financial risk management is described in Section III. Financial Risk Management, and our provisions and contingent liabilities are described in accounting policy P and notes 22, 23 and 25 of our audited consolidated financial statements included in this annual report.

19.
Ann
ual R
epor
t
The following discussion and analysis of our financial condition and results of operations are based on, and should be read in conjunction with, our audited consolidated financial statements and the related notes included elsewhere in this annual report. This discussion and analysis presents our financial condition and results of operations on a consolidated basis. We prepare our consolidated financial statements in conformity with IFRS, as issued by the IASB and adopted by the E.U.
Certain information contained in this discussion and analysis and presented elsewhere in this annual report, including information with respect to our plans and strategy for our business, includes forward looking statements that involve risks and uncertainties. See “Cautionary Statement Concerning Forward-Looking Statements”. In evaluating this discussion and analysis, you should specifically consider the various risk factors identified in “Principal Risks and Uncertainties”, other risk factors identified elsewhere in this annual report and other factors that could cause results to differ materially from those expressed in such forward looking statements.
Overview
We are a leading global manufacturer and supplier of steel pipe products and related services for the energy industry and other industries.We are a leading global manufacturer and supplier of steel pipe products and related services for the world’s energy industry as well as for other industrial applications. Our customers include most of the world’s leading oil and gas companies as well as engineering companies engaged in constructing oil and gas gathering and processing and power facilities. We operate an integrated worldwide network of steel pipe manufacturing, research, finishing and service facilities with
industrial operations in the Americas, Europe, Asia and Africa and a direct presence in most major oil and gas markets.
Our main source of revenue is the sale of products and services to the oil and gas industry, and the level of such sales is sensitive to international oil and gas prices and their impact on drilling activities.Demand for our products and services from the global oil and gas industry, particularly for tubular products and services used in drilling operations, represents a substantial majority of our total sales. Our sales, therefore, depend on the condition of the oil and gas industry and our customers’ willingness to invest capital in oil and gas exploration and development as well as in associated downstream processing activities. The level of these expenditures is sensitive to oil and gas prices as well as the oil and gas industry’s view of such prices in the future. Crude oil prices have fallen from over $100 per barrel in June 2014 to their current levels of around $40 per barrel, as rapid production growth in the U.S. and Canada, slowing global demand growth and OPEC’s decision not to cut production levels have combined to create an excess of supply in the market. Natural gas prices have also fallen on increased supply and limited demand growth. In this context, oil and gas operators are cutting back further on their investment plans, with a second successive year of substantial capital expenditure reductions expected in North America and the rest of the world.
In 2015, worldwide drilling activity declined 35% compared to the level of 2014. In the United States the rig count in 2015 declined by 48% and in Canada by 49%. In the rest of the world, the rig count declined 13% in 2015.
A growing proportion of exploration and production spending by oil and gas companies has been directed
Operating and Financial Review and Prospects

20.
Tena
ris
at offshore, deep drilling and non-conventional drilling operations in which high-value tubular products, including special steel grades and premium connections, are usually specified. Technological advances in drilling techniques and materials are opening up new areas for exploration and development. More complex drilling conditions are expected to continue to demand new and high value products and services in most areas of the world. However, in the current low oil price environment this trend will be temporarily affected as some complex projects have been cancelled or postponed.
Our business is highly competitive.The global market for steel pipes is highly competitive, with the primary competitive factors being price, quality, service and technology. We sell our products in a large number of countries worldwide and compete primarily against European and Japanese producers in most markets outside North America. In the United States and Canada we compete against a wide range of local and foreign producers. Competition in markets worldwide has been increasing, particularly for products used in standard applications, as producers in countries like China and Russia increase production capacity and enter export markets.
In addition, there is an increased risk of unfairly-traded steel pipe imports in markets in which we produce and sell our products. In August 2014, the United States imposed anti-dumping duties on
OCTG imports from various countries, including Korea. However, despite the trade case ruling, imports from Korea continued at a very high level for some months and in September 2015 the petitioners filed for the initiation of the annual review. Similarly, in Canada, the Canada Border Services Agency introduced anti-dumping duties on OCTG imports from Korea and other countries in March 2015.
Our production costs are sensitive to prices of steelmaking raw materials and other steel products.We purchase substantial quantities of steelmaking raw materials, including ferrous steel scrap, direct reduced iron (DRI), pig iron, iron ore and ferroalloys, for use in the production of our seamless pipe products. In addition, we purchase substantial quantities of steel coils and plate for use in the production of our welded pipe products. Our production costs, therefore, are sensitive to prices of steelmaking raw materials and certain steel products, which reflect supply and demand factors in the global steel industry and in the countries where we have our manufacturing facilities.
The costs of steelmaking raw materials and of steel coils and plates declined during 2015. As a reference, prices for hot rolled coils, HRC Midwest USA Mill, published by CRU, averaged $506 per ton in 2015 and $724 per ton in 2014. However, our costs were negatively affected by lower absorption of fixed costs on lower sales.

21.
Ann
ual R
epor
t
Summary of resultsIn 2015, our net sales declined 31% compared to 2014, affected by adverse market conditions. Sales of Tubes were down 45% in North America and 21% in the rest of the world where they were supported by our positioning in Argentina and a good level of shipments to South American pipeline projects. EBITDA, which included restructuring costs of $177 million, declined 54% year on year to $1.3 billion in 2015, with the margin affected by lower absorption of fixed costs on lower sales. In our operating income, we recorded an impairment charge of $400 million on the goodwill of our welded pipe assets in the United States, reflecting the decline in oil prices, and their impact on drilling activity and the demand outlook for welded pipe products in the regions served by these facilities. Our net result was further affected by noncash deferred income tax charges of $152 million resulting from currency depreciation in Argentina and Mexico and a net loss of $40 million on our share of the earnings of non-consolidated companies. Net loss attributable to owners of the parent during 2015 was $80 million.
Cash flow from operations amounted to $2.2 billion for the year. After capital expenditure of $1.1 billion and dividend payments of $531 million, we had a net cash position (cash and cash equivalents, other current investments and fixed income investments held to maturity less total borrowings) of $1.8 billion at December 31, 2015, compared with $1.3 billion at December 31, 2014.
OutlookAs we enter 2016, oil and gas prices have fallen further and are now reaching levels which, in some areas, are close to or even below operating costs. At these levels, oil and gas companies are cutting back further on their investment plans, with a second successive year of substantial capital expenditure reductions expected in North America and the rest of the world. Drilling activity continues to decline and the U.S. rig count has reached levels below those seen in previous downturns.
Global demand for OCTG will decline further in 2016, particularly in the United States and Canada where substantial activity reductions are expected and inventories remain high in relation to the level of consumption. In the rest of the world, demand in the Middle East will benefit from the end of last year’s inventory reductions but in many other regions it will be affected by further declines in activity and inventory reductions. Absent a significant improvement in market conditions during the year, we expect global OCTG demand in 2016 to fall around 20% over the level of 2015.
Our sales in 2016 will be further affected by lower selling prices reflecting the intense competitive environment and lower shipments for South American pipeline projects. We will continue to adjust our operations in these unfavorable conditions, reducing costs and strengthening our market position in preparation for an eventual recovery.

22.
Tena
ris
Results of Operations
FOR THE YEAR ENDED DECEMBER 31
Selected consolidated income statement data
CONTINUING OPERATIONS
Net sales
Cost of sales
Gross profit
Selling, general and administrative expenses
Other operating income (expenses), net
Operating income
Finance income
Finance cost
Other financial results
Income before equity in earnings of non-consolidated companies and income tax
Equity in earnings (losses) of non-consolidated companies
Income before income tax
Income tax
(Loss) Income for the year (1)
(LOSS) INCOME ATTRIBUTABLE TO (1)
Owners of the parent
Non-controlling interests
(Loss) Income for the year (1)
Depreciation and amortization
Weighted average number of shares outstanding
Basic and diluted (loss) earnings per share
Dividends per share (2)
2014
10,338
(6,287)
4,051
(1,964)
(188)
1,899
38
(44)
39
1,932
(165)
1,767
(586)
1,181
1,159
23
1,181
(616)
1,180,536,830
0.98
0.45
2015
7,101
(4,885)
2,216
(1,624)
(396)
195
35
(23)
3
210
(40)
170
(245)
(74)
(80)
6
(74)
(659)
1,180,536,830
(0.07)
0.45
(1) International Accounting Standard No. 1 (“IAS 1”) (revised), requires that income for the year as shown on the income statement does not exclude non-controlling interests. Earnings per share, however, continue to be calculated on the basis of income attributable solely to the owners of the parent.
(2) Dividends per share correspond to the dividends proposed or paid in respect of the year.
Millions of U.S. dollars (except number of shares and per share amounts)

23.
Ann
ual R
epor
t
2014
7,396
5,160
3,955
16,511
2,603
31
714
357
3,704
12,654
152
12,806
16,511
1,181
1,180,536,830
2015
5,743
5,672
3,472
14,887
1,755
223
750
293
3,021
11,713
153
11,866
14,887
1,181
1,180,536,830
AT DECEMBER 31
Selected consolidated financial position data
Current assets
Property, plant and equipment, net
Other non-current assets
Total assets
Current liabilities
Non-current borrowings
Deferred tax liabilities
Other non-current liabilities
Total liabilities
Capital and reserves attributable to the owners of the parent
Non-controlling interests
Total Equity
Total liabilities and equity
Share capital
Number of shares outstanding
Millions of U.S. dollars (except number of shares)

24.
Tena
ris
The following table sets forth our operating and other costs and expenses as a percentage of net sales for the periods indicated.
FOR THE YEAR ENDED DECEMBER 31
CONTINUING OPERATIONS
Net sales
Cost of sales
Gross profit
Selling, general and administrative expenses
Other operating income (expenses), net
Operating income
Finance income
Finance cost
Other financial results
Income before equity in earnings of non-consolidated companies and income tax
Equity in earnings (losses) of non-consolidated companies
Income before income tax
Income tax
(Loss) Income for the year
(LOSS) INCOME ATTRIBUTABLE TO
Owners of the parent
Non-controlling interests
2014
100.0
(60.8)
39.2
(19.0)
(1.8)
18.4
0.4
(0.4)
0.4
18.7
(1.6)
17.1
(5.7)
11.4
11.2
0.2
2015
100.0
(68.8)
31.2
(22.9)
(5.6)
2.8
0.5
(0.3)
0.0
3.0
(0.6)
2.4
(3.4)
(1.0)
(1.1)
0.1
Percentage of net sales

25.
Ann
ual R
epor
t
Fiscal Year Ended December 31, 2015,Compared to Fiscal Year Ended December 31, 2014
Tubes
The following table indicates, for our Tubes business segment, sales volumes of seamless and welded pipes for the periods indicated below:
FOR THE YEAR ENDED DECEMBER 31
Tubes
Others
Total
FOR THE YEAR ENDED DECEMBER 31
Seamless
Welded
Total
93%
7%
100%
91%
9%
100%
6,444
657
7,101
2,028
605
2,633
9,582
756
10,338
2,790
885
3,675
Increase / (Decrease)
(33%)
(13%)
(31%)
Increase / (Decrease)
(27%)
(32%)
(28%)
2014
2014
2015
2015
Millions of U.S. dollars
Thousands of tons
The following table shows our net sales by business segment for the periods indicated below:

26.
Tena
ris
The following table indicates, for our Tubes business segment, net sales by geographic region, operating income and operating income as a percentage of net sales for the periods indicated below:
FOR THE YEAR ENDED DECEMBER 31
NET SALES
North America
South America
Europe
Middle East & Africa
Far East & Oceania
Total net sales
Operating income (1)
Operating income (% of sales)
2,538
1,858
695
1,082
272
6,444
138
2.1%
4,609
1,823
924
1,817
408
9,582
1,866
19.5%
Increase / (Decrease)
(45%)
2%
(25%)
(40%)
(33%)
(33%)
(93%)
20142015
Millions of U.S. dollars
(1) Tubes operating income includes severance charges of $164 million in 2015. Additionally, in 2015 includes a goodwill impairment charge of $400 million on our welded pipe operations in the United States and in 2014 includes an impairment charge of $206 million on our welded pipe operations in Colombia and Canada.

27.
Ann
ual R
epor
t
Net sales of tubular products and services decreased 33% to $6,444 million in 2015, compared to $9,582 million in 2014, reflecting a 28% decline in volumes and a 6% decrease in average selling prices. Sales were negatively affected by the adjustment in oil and gas drilling activity in response to the collapse in oil and gas prices and inventory adjustments taking place particularly in the Middle East and Africa and in the United States. We estimate that demand for OCTG products in 2015 declined 37% when compared to 2014. In North America, sales decreased 45%, mainly due to lower sales in the U.S. onshore and Canada reflecting a decline in average drilling activity and pricing pressures due to inventory adjustments. In South America, sales remained stable as higher sales of tubular products for pipeline projects in Brazil and Argentina were offset by lower shipments of OCTG products in the region. In Europe, sales decreased mainly due to a lower level of sales of OCTG and line pipe products in continental Europe. In the Middle East and Africa, sales decreased mainly due to lower sales
in the Middle East reflecting OCTG destocking and lower sales to offshore projects in sub-Saharan Africa. In the Far East and Oceania, sales decreased due to lower activity in the region.
Operating income from tubular products and services, decreased 93% to $138 million in 2015, from $1,866 million in 2014. Operating income in 2015 includes an impairment charge of $400 million on our welded pipe operations in the United States, while in 2014 it includes an impairment charge of $206 million on our welded pipe operations in Colombia and Canada. Additionally, in 2015 we had severance costs in the Tubes segment, to adjust the workforce to current market conditions, which amounted to $164 million. Excluding these non-recurring events, Tubes operating income declined 66%, as it was negatively affected by a decline in sales of 33% and a decline in operating margins of 10 percentage points, mostly due to industrial inefficiencies associated with low levels of capacity utilization.

28.
Tena
ris
Net sales of other products and services decreased 13% to $657 million in 2015, compared to $756 million in 2014, mainly due to lower sales of energy related products, e.g., sucker rods and coiled tubing, following the decline in oil and gas drilling activity in response to the collapse in oil and gas prices.
Operating income from other products and services, increased 74% to $58 million in 2015, from $33 million in 2014, mainly reflecting an improved operating performance and margins at our industrial equipment business in Brazil.
Selling, general and administrative expenses, or SG&A, decreased by $ 340 million (17%) in 2015 from $1,964 million in 2014 to $1,624 million in 2015, mainly reflecting lower selling expenses due to the decline in sales. However, SG&A expenses
increased as a percentage of net sales to 22.9% in 2015 compared to 19.0% in 2014, mainly due to the effect of fixed and semi fixed expenses on lower sales (e.g., depreciation and amortization and labor costs). During 2015, SG&A labor costs include $73 million of severance charges related to workforce adjustments to the difficult market conditions.
Other operating income and expenses resulted in losses of $396 million in 2015, compared to losses of $188 million in 2014, mainly due to asset impairment charges amounting to $400 million in 2015 and $206 million in 2014. These impairment charges mainly reflect the decline in oil prices, and its impact on drilling activity and therefore on the expected demand for OCTG products, particularly on our welded pipe operations in the United States, Colombia and Canada.
Others
The following table indicates, for our Others business segment, net sales, operating income and operating income as a percentage of net sales for the periods indicated below:
FOR THE YEAR ENDED DECEMBER 31
Net sales
Operating income
Operating income (% of sales)
657
58
8.8%
756
33
4.4%
Increase / (Decrease)
(13%)
74%
20142015
Millions of U.S. dollars

29.
Ann
ual R
epor
t
Financial results amounted to a gain of $14 million in 2015, compared to a gain of $33 million in 2014.
Equity in (losses) earnings of non-consolidated companies generated a loss of $40 million in 2015, compared to a loss of $165 million in 2014. During 2015 we recorded an impairment charge of $29 million on our direct investment in Usiminas, while during 2014 we recorded an impairment charge of $161 million related to our direct investment in Usiminas. Apart from the impairment result, these results were mainly derived from our equity investment in Ternium (NYSE:TX).
Income tax charges totalled $245 million in 2015, including a deferred tax charge of $152 million on the effect of currency translation on tax base.
Net loss for the year amounted to $74 million in 2015, compared to a gain of $1,181 million in 2014.
The decline in net income mainly reflects a challenging operating environment affected by lower shipments and prices, inefficiencies associated with low utilization of production capacity, severance costs to adjust the workforce to current market conditions, impairments and a high deferred-tax charge affected by the effect of currency translation on tax base.
Income attributable to non-controlling interest
was $6 million in 2015, compared to $23 million in 2014. These results are mainly attributable to NKKTubes, our Japanese subsidiary.
Liquidity and Capital Resources
The following table provides certain information related to our cash generation and changes in our cash and cash equivalents position for each of the last two years:
FOR THE YEAR ENDED DECEMBER 31
Net cash provided by operating activities
Net cash used in investing activities
Net cash used in financing activities
Decrease in cash and cash equivalents
Cash and cash equivalents at the beginning of year (excluding overdrafts)
Effect of exchange rate changes
Decrease in cash and cash equivalents
Cash and cash equivalents at the end of year (excluding overdrafts)
Cash and cash equivalents at the end of year (excluding overdrafts)
Bank overdrafts
Other current investments
Fixed income investments held to maturity
Borrowings
Net cash
Millions of U.S. dollars
2015
2,215
(1,774)
(535)
(94)
416
(37)
(94)
286
286
0
2,141
393
(972)
1,849
2014
2,044
(1,786)
(424)
(165)
598
(16)
(165)
416
416
1
1,838
–
(999)
1,257

30.
Tena
ris
Our financing strategy aims at maintaining adequate financial resources and access to additional liquidity. During 2015 we generated $2.2 billion of operating cash flow, our capital expenditures amounted to $1.1 billion and we paid dividends amounting to $531 million. At the end of the year we had a net cash position of $1.8 billion, compared to $1.3 billion at the beginning of the year.
We believe that funds from operations, the availability of liquid financial assets and our access to external borrowing through the financial markets will be sufficient to satisfy our working capital needs, to finance our planned capital spending program, to service our debt in the foreseeable future and to address short-term changes in business conditions.
We have a conservative approach to the management of our liquidity, which consists
mainly of cash and cash equivalents and other current investments, comprising cash in banks, liquidity funds and highly liquid short and medium-term securities. These assets are carried at fair market value, or at historical cost which approximates fair market value.
At December 31, 2015, liquid financial assets as a whole (i.e., cash and cash equivalents, other current investments and fixed income investments held to maturity) were 19% of total assets compared to 14% at the end of 2014.
We hold primarily investments in liquidity funds and variable or fixed-rate securities from investment grade issuers. We hold our cash and cash equivalents primarily in U.S. dollars and in major financial centers. As of December 31, 2015, U.S. dollar denominated liquid assets represented 87%, of total liquid financial assets compared to 83% at the end of 2014.

31.
Ann
ual R
epor
t
Operating activities
Net cash provided by operations during 2015 was $2.2 billion, compared to $2.0 billion during 2014. This 8% increase was mainly attributable to a decrease in working capital needs. During 2015 working capital decreased $1.4 billion, while during 2014 it increased $72 million. The main yearly variation was related to a decrease in inventories during 2015, amounting to $936 million, which compares with an increase in inventory of $73 million in 2014. Additionally, during 2015 trade receivables decreased $828 million, partially offset by an increase in trade payables of $328 million and an increase in other liabilities of $124 million. For more information on cash flow disclosures and changes to working capital, see note 27 “Cash flow disclosures” to our audited consolidated financial statements included in this annual report.
Investing activities
Net cash used in investing activities was $1.8 billion in 2015, similar to 2014. Capital expenditures were also stable at $1.1 billion during each year, as we advanced with the construction of the greenfield seamless mill in Bay City, Texas.
Financing activities
Net cash used in financing activities, including dividends paid, proceeds and repayments of borrowings and acquisitions of non-controlling interests, was $535 million in 2015, compared to $424 million in 2014.
Dividends paid during 2015 amounted to $531 million, equal to 2014.
During 2015 we had no significant net proceeds/repayments from borrowings as our short-term facilities were mostly renewed as they became due, while in 2014 we had net proceeds from borrowings of $156 million.
Our total liabilities to total assets ratio was 0.20:1 as of December 31, 2015 and 0.22:1 as of December 31, 2014.
Principal Sources of Funding
During 2015, we funded our operations with operating cash flows and bank financing. Short-term bank borrowings were used as needed throughout the year.
Financial liabilities
During 2015, borrowings decreased by $28 million, to $972 million at December 31, 2015, from $999 million at December 31, 2014.
Borrowings consist mainly of bank loans. As of December 31, 2015 U.S. dollar-denominated borrowings plus borrowings denominated in other currencies swapped to the U.S. dollar represented 82% of total borrowings.
For further information about our financial debt, please see note 19 “Borrowings” to our audited consolidated financial statements included in this annual report.

32.
Tena
ris
The following table shows the composition of our financial debt at December 31, 2015 and 2014:
Our weighted average interest rates before tax (considering hedge accounting), amounted to 1.5% at December 31, 2015 and to 1.9% at December 31, 2014.
Bank borrowings
Bank overdrafts
Finance lease liabilities
Total borrowings
Millions of U.S. dollars
2015
971
0
1
972
2014
997
1
1
999

33.
Ann
ual R
epor
t
The maturity of our financial debt is as follows:
Our current borrowings to total borrowings ratio decreased from 0.97:1 as of December 31, 2014 to 0.77:1 as of December 31, 2015. Our liquid financial assets exceeded our total borrowings, we had a net cash position (cash and cash equivalents, other current investments and fixed income investments held to maturity less total borrowings) of $1.8 billion at December 31, 2015, compared to $1.3 billion at December 31, 2014.
For information on our derivative financial instruments, please see “Quantitative and Qualitative Disclosure about Market Risk – Accounting for Derivative Financial Instruments and Hedging Activities” and note 24 “Derivative financial instruments” to our audited consolidated financial statements included in this annual report.
For information regarding the extent to which borrowings are at fixed rates, please see “Quantitative and Qualitative Disclosure about Market Risk”.
Millions of U.S. dollars
AT DECEMBER 31, 2015
Borrowings
Interests to be accrued
Total
Over 5 years
18
2
20
4-5 years
1
1
2
3-4 years
1
1
2
2-3 years
1
1
2
1-2 years
201
1
202
1 yearor less
748
1
749
Total
972
6
978

34.
Tena
ris
Millions of U.S. dollars
2015
Mainly 2015
2015
Original & Outstanding
607
105
200
Type
Bank loans
Bank loans
Bank loans
Borrower
Tamsa
Siderca
Tubocaribe
Final Maturity
2016
2016
January 2017
Disbursement date
Significant borrowings
Our most significant borrowings as of December 31, 2015 were as follows:
As of December 31, 2015, Tenaris was in compliance with all of its covenants.

35.
Ann
ual R
epor
t
The multinational nature of our operations and customer base expose us to a variety of risks, including the effects of changes in foreign currency exchange rates, interest rates and commodity prices. In order to reduce the impact related to these exposures, management evaluates exposures on a consolidated basis to take advantage of natural exposure netting. For the residual exposures, we may enter into various derivative transactions in order to reduce potential adverse effects on our financial performance. Such derivative transactions are executed in accordance with internal policies and hedging practices. We do not enter into derivative financial instruments for
trading or other speculative purposes, other than non-material investments in structured products.
The following information should be read together with section III, “Financial risk management” to our audited consolidated financial statements included elsewhere in this annual report.
Debt Structure
The following tables provide a breakdown of our debt instruments at December 31, 2015 and 2014 which included fixed and variable interest rate obligations, detailed by maturity date:
Quantitative and Qualitative Disclosure about Market Risk
In millions of U.S. dollars
(1) As most borrowings are based on short-term fixed rates, or floating rates that approximate market rates, with interest rate resetting every 3 to 6 months, the fair value of the borrowings approximates its carrying amount and is not disclosed separately.
AT DECEMBER 31, 2015
NON-CURRENT DEBT
Fixed rate
Floating rate
CURRENT DEBT
Fixed rate
Floating rate
AT DECEMBER 31, 2014
NON-CURRENT DEBT
Fixed rate
Floating rate
CURRENT DEBT
Fixed rate
Floating rate
2016
–
–
732
16
748
2015
–
–
725
243
968
2017
201
0
–
–
201
2016
7
0
–
–
8
2018
1
0
–
–
1
2017
1
0
–
–
1
2019
1
0
–
–
1
2018
1
0
–
–
1
2020
1
0
–
–
1
2019
1
0
–
–
1
Thereafter
18
–
–
–
18
Thereafter
19
–
–
–
19
Total (1)
223
1
732
16
972
Total (1)
30
1
725
243
999
EXPECTED MATURITY DATE
EXPECTED MATURITY DATE

36.
Tena
ris
Our weighted average interest rates before tax (considering hedge accounting), amounted to 1.5% at December 31, 2015 and to 1.9% at December 31, 2014.
Our financial liabilities (other than trade payables and derivative financial instruments) consist mainly of bank loans. As of December 31, 2015 U.S. dollar denominated financial debt plus debt denominated in other currencies swapped to the U.S. dollar represented 82% of total financial debt. For further information about our financial debt, please see note 19 “Borrowings” to our audited consolidated financial statements included in this annual report.
Interest Rate Risk
Fluctuations in market interest rates create a degree of risk by affecting the amount of our interest payments. At December 31, 2015, we had variable interest rate debt of $17 million and fixed rate debt of $955 million ($732 million of the fixed rate debt are short-term).
Foreign Exchange Rate Risk
We manufacture and sell our products in a number of countries throughout the world and consequently we are exposed to foreign exchange rate risk. Since the Company’s functional currency is the U.S. dollar, the purpose of our foreign currency hedging program is mainly to reduce the risk caused by changes in the exchange rates of other currencies against the U.S. dollar.
Most of our revenues are determined or influenced by the U.S. dollar. In addition, most of our costs correspond to steelmaking raw materials and steel coils and plates, also determined or influenced by the U.S. dollar. However, outside the United States, a portion of our expenses is incurred in foreign currencies (e.g. labor costs). Therefore, when the U.S. dollar weakens in relation to the foreign currencies of the countries where we manufacture our products, the U.S. dollar-reported expenses increase. In 2015, had the U.S. dollar average exchange rate been weaker by 5% against the currencies of the countries where we have labor

37.
Ann
ual R
epor
t
costs, operating income (excluding impairment charges) would have decreased approximately by 10%, compared with 3% in 2014, mainly because these foreign currency expenses were less affected by the downturn of the activity.
Our consolidated exposure to currency fluctuations is reviewed on a periodic basis. A number of hedging transactions are performed in order to achieve an efficient coverage in the absence of operative or natural hedges. Almost all of these transactions are forward exchange rate contracts.
Because certain subsidiaries have functional currencies other than the U.S. dollar, the results of hedging activities as reported in the income statement under IFRS may not reflect entirely management’s assessment of its foreign exchange risk hedging needs. Also, intercompany balances between our subsidiaries may generate exchange rate results to the extent that their functional currencies differ.
The value of our financial assets and liabilities is subject to changes arising out of the variation of foreign currency exchange rates. The following table provides a breakdown of our main financial assets and liabilities (including foreign exchange derivative contracts) that impact our profit and loss as of December 31, 2015.
The main relevant exposures as of December 31, 2015 corresponds to Euro-denominated intercompany liabilities at certain subsidiaries which functional currency is the U.S. dollar and Argentine peso-denominated financial, trade, social and fiscal payables at our Argentine subsidiaries which functional currency is the U.S. dollar.
All amounts in millions of U.S. dollars
CURRENCY EXPOSURE / FUNCTIONAL CURRENCY
Euro / U.S. dollar
Argentine Peso / U.S. dollar
Brazilian real / U.S. dollar
Long / (Short) Position
(335)
(73)
(67)

38.
Tena
ris
standard pricing techniques and, as a general rule, we recognize the full amount related to the change in its fair value under financial results in the current period.
We designate for hedge accounting certain derivatives that hedge risks associated with recognized assets, liabilities or highly probable forecast transactions. These instruments are classified as cash flow hedges. The effective portion of the fair value of such derivatives is accumulated in a reserve account in equity. Amounts accumulated in equity are then recognized in the income statement in the same period than the offsetting losses and gains on the hedged item are recorded. The gain or loss relating to the ineffective portion is recognized immediately in the income statement. The fair value of our derivative financial instruments (assets
Foreign Currency Derivative Contracts
The net fair value of our foreign currency derivative contracts amounted to a liability of $16 million at December 31, 2015 and $31 million at December 31, 2014. For further detail on our foreign currency derivative contracts, please see note 24 “Derivative financial instruments – Foreign exchange derivative contracts and hedge accounting” to our audited consolidated financial statements included in this annual report.
Accounting for Derivative Financial Instruments
and Hedging Activities
Derivative financial instruments are classified as financial assets (or liabilities) at fair value through profit or loss. Their fair value is calculated using

39.
Ann
ual R
epor
t
or liabilities) continues to be reflected on the consolidated statement of financial position.
At December 31, 2015, the effective portion of designated cash flow hedges, included in other reserves in shareholders’ equity amounted to a gain of $3 million.
Concentration of credit risk
There is no significant concentration of credit from customers. No single customer comprised more than 10% of our net sales in 2015.
Our credit policies related to sales of products and services are designed to identify customers with acceptable credit history, and to allow us
to use credit insurance, letters of credit and other instruments designed to minimize credit risk whenever deemed necessary. We maintain allowances for potential credit losses.
Commodity Price Sensitivity
We use commodities and raw materials that are subject to price volatility caused by supply conditions, political and economic variables and other unpredictable factors. As a consequence, we are exposed to risk resulting from fluctuations in the prices of these commodities and raw materials. Although we fix the prices of such raw materials and commodities for short-term periods, typically not in excess of one year, in general we do not hedge this risk.

40.
Tena
ris
Recent developments
Annual Dividend Approval
On February 24, 2016 the Company’s board of directors proposed, for the approval of the annual general shareholders' meeting to be held on May 4, 2016, the payment of an annual dividend of $0.45 per share ($0.90 per ADS), or approximately $531 million, which includes the interim dividend of $0.15 per share ($0.30 per ADS) or approximately $177 million, paid in November 2015. If the annual dividend is approved by the shareholders, a dividend of $0.30 per share ($0.60 per ADS), or approximately $354 million will be paid on May 25, 2016, with an ex-dividend date of May 23, 2016 and record date on May 24, 2016.
We are subject to a wide range of local, provincial and national laws, regulations, permit requirements and decrees relating to the protection of human health and the environment, including laws and regulations relating to hazardous materials and radioactive materials and environmental protection governing air emissions, water discharges and waste management. Laws and regulations protecting the environment have become increasingly complex and more stringent and expensive to implement in recent years. International environmental requirements vary.
The ultimate impact of complying with existing laws and regulations is not always clearly known or determinable since regulations under some of these laws have not yet been promulgated or are undergoing revision. The expenditures necessary to remain in compliance with these laws and regulations, including site or other remediation costs, or costs incurred from potential environmental liabilities, could have a material adverse effect on our financial condition and profitability. While we incur and will continue to incur expenditures to comply with applicable laws and regulations, there always remains a risk that environmental incidents or accidents may occur that may negatively affect our reputation or our operations.
Compliance with applicable environmental laws and regulations is a significant factor in our business. We have not been subject to any material penalty for any material environmental violation in the last five years, and we are not aware of any current material legal or administrative proceedings pending against us with respect to environmental matters which could have an adverse material impact on our financial condition or results of operations.
Environmental regulation

41.
Ann
ual R
epor
t
Tenaris is a party to several related party transactions, which include, among others, purchases and sales of goods (including steel pipes, flat steel products, steel bars, raw materials, gas and electricity) and services (including engineering services and related services) from or to entities controlled by San Faustin or in which San Faustin holds significant interests. Material related party transactions, as explained in Corporate Governance – Audit Committee, are subject to the review of the audit committee of the Company’s board of directors and the requirements of the Company’s articles of association and Luxembourg law. For further detail on Tenaris’s related party transactions, see Note 28 “Related party transactions” to our audited consolidated financial statements, included in this annual report.
Related party transactions

42.
Tena
ris
Employees
The following table shows the number of persons employed by Tenaris:
At December 31, 2014 and December 31, 2013, the number of persons employed by Tenaris was 27,816 and 26,825 respectively.
We estimate that global OCTG demand declined 37% in 2015 and in 2016 it could fall around 20% over the level of 2015. The number of our employees declined 22% during 2015 as we adjusted our operations to face the new environment. We are reducing our labor costs worldwide through a wide set of measures, while preserving our key competences and maintaining our focus on the relation with our communities.
Approximately 55% of our employees are unionized. We believe that we enjoy good or satisfactory relations with our employees and their unions in each of the countries in which we have manufacturing facilities, and we have not experienced any major strikes or other labor conflicts with a material impact on our operations over the last five years. In some of the countries in which we have significant production facilities (e.g., Argentina and Brazil), significant fluctuations in exchange rates, together with inflationary pressures, affect our costs, increase labor demands and could eventually generate higher levels of labor conflicts.
AT DECEMBER 31
Argentina
Mexico
United States
Brazil
Italy
Romania
Colombia
Canada
Indonesia
Japan
Other Countries
Total employees
2015
5,388
5,101
2,190
2,050
2,030
1,624
636
546
532
508
1,136
21,741

43.
Ann
ual R
epor
t
Corporate Governance
The Company’s corporate governance practices are governed by Luxembourg Law (including, among others, the law of August 10, 1915 on commercial companies, the law of January 11, 2008, implementing the European Union’s transparency directive, and the law of May 24, 2011, implementing the European Union’s directive on the exercise of certain shareholders’ rights in general meetings of listed companies) and the Company’s articles of association. As a Luxembourg company listed on the New York Stock Exchange (the NYSE), the Bolsa Mexicana de Valores, S.A. de C.V. (the Mexican Stock Exchange), the Bolsa de Comercio de Buenos Aires (the Buenos Aires Stock Exchange) and the Borsa Italiana S.p.A. (the Italian Stock Exchange), the Company is required to comply with some, but not all, of the corporate governance standards of these exchanges. The Company, however, believes that its corporate governance practices meet, in all material respects, the corporate governance standards that are generally required for controlled companies by all of the exchanges on which the Company’s securities trade.
For a summary of the significant ways in which the Company’s corporate governance practices differ from the corporate governance standards required for controlled companies by the exchanges on which the Company’s shares trade, please visit our website at http://www.tenaris.com/investors/
Shareholders’ Meetings; Voting Rights;
Election of Directors
Each Share entitles the holder thereof to one vote at the Company’s general shareholders’ meetings. Shareholder action by written consent is not permitted, but proxy voting is permitted. Notices of general shareholders’ meetings are
governed by the provisions of Luxembourg law. Pursuant to applicable Luxembourg law, the Company must give notice of the calling of any general shareholders’ meeting at least 30 days prior to the date for which the meeting is being called, by publishing the relevant convening notice in the Luxembourg Official Gazette and in a leading newspaper having general circulation in Luxembourg and by issuing a press release informing of the calling of such meeting. In case Shares are listed on a foreign regulated market, notices of general shareholders’ meetings shall also comply with the requirements (including as to content and publicity) and follow the customary practices of such regulated market.
Pursuant to our articles of association, for as long as the Shares or other securities of the Company are listed on a regulated market within the European Union (as they currently are), and unless otherwise provided by applicable law, only shareholders holding Shares as of midnight, central European time, on the day that is fourteen days prior to the day of any given general shareholders’ meeting can attend and vote at such meeting. The board of directors may determine other conditions that must be satisfied by shareholders in order to participate in a general shareholders’ meeting in person or by proxy, including with respect to deadlines for submitting supporting documentation to or for the Company.
No attendance quorum is required at ordinary general shareholders’ meetings, and resolutions may be adopted by a simple majority vote of the Shares validly cast at the meeting. Unless otherwise provided by applicable law, an extraordinary general shareholders’ meeting may not validly deliberate on proposed amendments to the Company’s articles of association unless a quorum

44.
Tena
ris
of at least half of the Shares is represented at the meeting. If a quorum is not reached at the first extraordinary shareholders’ meeting, a second extraordinary shareholders’ meeting may be convened in accordance with the Company’s articles of association and applicable law and such second extraordinary general shareholders’ meeting shall validly deliberate regardless of the number of Shares represented. In both cases, the Luxembourg Companies Law and the Company’s articles of association require that any resolution of an extraordinary general shareholders’ meeting as to amendments to the Company’s articles of association be adopted by a two-thirds majority of the votes validly cast at the meeting. If a proposed resolution consists of changing the Company’s nationality or of increasing the shareholders’ commitments, the unanimous consent of all shareholders is required. Directors are elected at ordinary general shareholders’ meetings.
Cumulative voting is not permitted. The Company’s articles of association do not provide for staggered terms and directors are elected for a maximum of one year and may be reappointed or removed by the general shareholders’ meeting at any time, with or without cause, by resolution passed by a simple majority vote of the Shares validly cast at the meeting. In the case of a vacancy occurring in the Board of Directors, the remaining directors may temporarily fill such vacancy with a temporary director appointed by resolution adopted with the affirmative vote of a majority of the remaining directors; provided that the next general shareholder’s meeting shall be called
upon to ratify such appointment. The term of any such temporary director shall expire at the end of the term of office of the director whom such temporary director replaced.
The next Company’s annual general shareholders’ meeting, that will consider, among other things our restated consolidated financial statements for the year 2014 and our consolidated financial statements and annual accounts included in this report, will take place in the Company’s registered office in Luxembourg, on Wednesday May 4, 2016, at 9:30 A.M., Luxembourg time.
The rights of the shareholders attending the meetings are governed by the Luxembourg law of 24 May 2011 on the exercise of certain rights of shareholders in general meetings of listed companies. For a description of the items of the agenda of the meetings and the procedures for attending and voting the meetings, please see the “Notice of the Annual General Meeting of Shareholders” on the Company’s website at www.tenaris.com/investors.
Board of Directors
Management of the Company is vested in a board of directors with the broadest power to act on behalf of the Company and accomplish or authorize all acts and transactions of management and disposal that are within its corporate purpose and not specifically reserved in the articles of association or by applicable law to the general shareholders’ meeting. The Company’s articles of association provide for a board of directors

45.
Ann
ual R
epor
t
consisting of a minimum of three and a maximum of fifteen directors; however, for as long as the Company’s shares are listed on at least one regulated market, the minimum number of directors must be five. The Company’s current board of directors is composed of ten directors; however, at the next annual general shareholders’ meeting, it will be proposed that the number of members of the board of directors be reduced to nine.
The board of directors is required to meet as often as required by the interests of the Company and at least four times per year. A majority of the members of the board of directors in office present or represented at the board of directors’ meeting constitutes a quorum, and resolutions may be adopted by the vote of a majority of the directors present or represented. In the case of a tie, the chairman is entitled to cast the deciding vote.
Directors are elected at the annual ordinary general shareholders’ meeting to serve one-year renewable terms, as determined by the general shareholders’ meeting. The general shareholders’ meeting also determines the number of directors that will constitute the board and their compensation. The general shareholders’ meeting may dismiss all or any one member of the board of directors at any time, with or without cause, by resolution passed by a simple majority vote, irrespective of the number of Shares represented at the meeting.
Under the Company’s articles of association the board of directors is authorized until 2020, to
increase the issued share capital in whole or in part from time to time, through issues of Shares within the limits of the authorized share capital against compensation in cash, compensation in kind at a price or if Shares are issued by way of incorporation of reserves, at an amount, which shall not be less than the par value and may include such issue premium as the board of directors shall decide. Under the Company’s articles of association, however, the Company’s existing shareholders shall have a preferential right to subscribe for any new Shares issued pursuant to the authorization granted to its board of directors, except in the following cases (in which cases no preferential subscription rights shall apply):
any issuance of Shares (including, without limitation, the direct issuance of Shares or upon the exercise of options, rights convertible into shares, or similar instruments convertible or exchangeable into Shares) against a contribution other than in cash;any issuance of Shares (including by way of free Shares or at discount), up to an amount of 1.5% of the issued share capital of the Company, to directors, officers, agents, employees of the Company, its direct or indirect subsidiaries, or its affiliates (collectively, the “Beneficiaries”), including, without limitation, the direct issuance of Shares or upon the exercise of options, rights convertible into Shares, or similar instruments convertible or exchangeable into Shares, issued for the purpose of compensation or incentive of the Beneficiaries or in relation thereto (which the board of directors shall be authorized to issue upon such terms and conditions as it deems fit).
•
•

46.
Tena
ris
Principal Occupation
President of San Faustin
Director of Tenaris and Ternium
President of Inverban
Member of the board of directors of Petrobras Energia
Chairman of the board of directors of San Faustin
Chairman and chief executive officer of Tenaris
Chairman of SAI Consultores
Director of Tenaris
Director of Tenaris
Vice chairman of Tamsa
Position
Director
Director
Director
Director
Director
Director
Director
Director
Director
Director
Name
Roberto Bonatti (1)
Carlos Condorelli
Carlos Franck
Roberto Monti
Gianfelice Mario Rocca (1)
Paolo Rocca (1)
Jaime Serra Puche
Alberto Valsecchi
Amadeo Vázquez y Vázquez
Guillermo Vogel
Years as Director
13
9
13
11
13
14
13
8
13
13
Age at December 31, 2015
66
64
65
76
67
63
64
71
73
65
(1) Paolo Rocca and Gianfelice Rocca are brothers, and Roberto Bonatti is Paolo and Gianfelice Rocca’s first cousin.
The following table sets forth the name of the Company’s current directors, their respective positions on the board, their principal occupation, their years of service as board members and their age. At the next annual general shareholders’ meeting, it will be proposed
that all of the current directors, except for Mr. Carlos Franck, be reappointed to the board of directors, each to hold office until the next annual general shareholders’ meeting that will be convened to decide on the Company’s 2016 annual accounts.

47.
Ann
ual R
epor
t
Roberto Bonatti
Mr. Bonatti is a member of the Company’s board of directors. He is a grandson of Agostino Rocca, founder of the Techint group, a group of companies controlled by San Faustin. Throughout his career in the Techint group he has been involved specifically in the engineering and construction and corporate sectors. He was first employed by the Techint group in 1976, as deputy resident engineer in Venezuela. In 1984, he became a director of San Faustin, and since 2001 he has served as its president. In addition, Mr. Bonatti currently serves as president of Sadma Uruguay S.A. He is also a member of the board of directors of Ternium. Mr. Bonatti is an Italian citizen.
Carlos Condorelli
Mr. Condorelli is a member of the Company’s board of directors. He served as our chief financial officer from October 2002 until September 2007. He is also a board member of Ternium. He began his career within the Techint group in 1975 as an analyst in the accounting and administration department of Siderar S.A.I.C., or Siderar. He has held several positions within Tenaris and other Techint group companies, including finance and administration director of Tamsa and president of the board of directors of Empresa Distribuidora La Plata S.A., or Edelap, an Argentine utilities company. Mr. Condorelli is an Argentine citizen.
Carlos Franck
Mr. Franck is a member of the Company’s board of directors. He is president of Inverban S.A. and a member of the board of directors of Siderca, Techint Holdings S.à r.l. and Siderar. He has financial planning and control responsibilities in subsidiaries of San Faustin. He serves as treasurer of the board of the Di Tella University and as president of Adobe, an Argentine NGO. Mr. Franck is an Argentine citizen. Mr. Franck intends to retire and accordingly, at the next annual general shareholders’s meeting, he will not be proposed as candidate to the board of directors.
Roberto Monti
Mr. Monti is a member of the Company’s board of directors. He is a member of the board of directors of Petrobras Energia. He has served as vice president of Exploration and Production of Repsol YPF and as chairman and chief executive officer of YPF. He was also the president of Dowell, a subsidiary of Schlumberger and the president of Schlumberger Wire & Testing division for East Hemisphere Latin America. Mr. Monti is an Argentine citizen.
Gianfelice Mario Rocca
Mr. Rocca is a member of the Company’s board of directors. He is a grandson of Agostino Rocca. He is the chairman of the board of directors of San Faustin, a member of the board of directors of Ternium, the president of the Humanitas Group and the president of Tenova S.p.A. In addition, he sits on the board of directors or executive committees of several companies, including Allianz S.p.A., Brembo and Buzzi Unicem. He is president of Assolombarda, the largest territorial association of entrepreneurs in Italy and part of Confindustria (Italian employers’ organization). In addition, he is member of the EIT Governing Board (European Institute of Innovation and Technology). He is chairman of Humanitas University, board member of Bocconi University, member of the Advisory Board of Politecnico di Milano, the Allianz Group, the Aspen Institute Executive Committee, the Trilateral Commission, and the European Advisory Board of Harvard Business School. Mr. Rocca is an Italian citizen.

48.
Tena
ris
Paolo Rocca
Mr. Rocca is the chairman of the Company’s board of directors and our chief executive officer. He is a grandson of Agostino Rocca. He is also chairman of the board of directors of Tamsa. He is also the chairman of the board of directors of Ternium, a director and vice president of San Faustin, and a director of Techint Financial Corporation N.V. He is a member of the Executive Committee of the World Steel Association. Mr. Rocca is an Italian citizen.
Jaime Serra Puche
Mr. Serra Puche is a member of the Company’s board of directors. He is the chairman of SAI Consultores, a Mexican consulting firm, and a member of the board of directors of the Mexico Fund, Grupo Vitro, Grupo Modelo and Alpek S.A.. Mr. Serra Puche served as Mexico’s Undersecretary of Revenue, Secretary of Trade and Industry, and Secretary of Finance. He led the negotiation and implementation of NAFTA. Mr. Serra Puche is a Mexican citizen.
Alberto Valsecchi
Mr. Valsecchi is a member of the Company’s board of directors. He served as our chief operating officer from February 2004 until July 2007. He joined the Techint group in 1968 and has held various positions within Tenaris and other Techint group companies. He has retired from his executive positions. He is also a member of the board of directors of San Faustin and chairman of the board of directors of Dalmine, a position he assumed in May 2008. Mr. Valsecchi is an Italian citizen.
Amadeo Vázquez y Vázquez
Mr. Vázquez y Vázquez is a member of the Company’s board of directors. He is an independent alternate director of Gas Natural BAN, S.A, of Grupo Gas Natural Fenosa. He is a member of the advisory board of the Fundación de Investigaciones Económicas Latinoamericanas and member of the Asociación Empresaria Argentina. He served as chief executive officer of Banco Río de la Plata S.A. until August 1997, independent director and chairman of the Audit Committee of BBVA Banco Francés S.A. until 2003, and chairman of the board of directors of Telecom Argentina S.A. until April 2007. Mr. Vázquez y Vázquez is a Spanish and Argentine citizen.
Guillermo Vogel
Mr. Vogel is vicepresident finance of the Company’s board of directors. He is the vice chairman of Tamsa, the chairman of Grupo Collado, Exportaciones IM Promoción and Canacero, a member of the board of directors of each of Techint, S.A. de C.V., Corporación Alfa, the Universidad Panamericana – IPADE, Rassini, Corporación Mexicana de Inversiones de Capital, Innovare, Grupo Assa and the American Iron and Steel Institute. In addition, he is a member of The Trilateral Commission and member of the International Board of The Manhattan School of Music. Mr. Vogel is a Mexican citizen.
Messrs. Monti, Serra Puche and Vázquez y Vázquez qualify as independent directors under the Company’s articles of association.

49.
Ann
ual R
epor
t
Director Liability
Each director must act in the interest of the Company, and in accordance with applicable laws, regulations, and the Company’s articles of association. Directors are also bound by a general duty of care owed to the Company.
Under Luxembourg law, a director may be liable to the Company for any damage caused by management errors, such as wrongful acts committed during the execution of his or her mandate, and to the Company, its shareholders and third parties in the event that the Company, its shareholders or third parties suffer a loss due to an infringement of either the Luxembourg law on commercial companies or the Company’s articles of association.
Under Luxembourg law, any director having a conflict of interest in respect of a transaction submitted for approval to the board of directors may not take part in the deliberations concerning such transaction and must inform the board of such conflict and cause a record of his statement to be included in the minutes of the meeting. Subject to certain exceptions, transactions in which any directors may have had an interest conflicting with that of the Company must be reported at the next general shareholders’ meeting following any such transaction.
A director will not be liable for acts committed pursuant to a board resolution if, notwithstanding his or her presence at the board meeting at which such resolution was adopted, such director advised the board of directors that he or she opposed the
resolution and caused a record of such opposition to be included in the minutes of the meeting.
Causes of action against directors for damages may be initiated by the Company upon a resolution of the general shareholders’ meeting passed by a simple majority vote, irrespective of the number of Shares represented at the meeting. Causes of action against directors who misappropriate corporate assets or commit a breach of trust may be brought by any shareholder for personal losses different from those of the Company.
It is customary in Luxembourg that the shareholders expressly discharge the members of the board of directors from any liability arising out of or in connection with the exercise of their mandate when approving the annual accounts of the Company at the annual general shareholders meeting. However, such discharge will not release the directors from liability for any damage caused by wrongful acts committed during the execution of their mandate or due to an infringement of either the Luxembourg law on commercial companies or the Company’s articles of association vis-à-vis third parties.
Audit Committee
Pursuant to the Company’s articles of association, as supplemented by the audit committee’s charter, for as long as the Company’s shares are listed on at least one regulated market, the Company must have an audit committee composed of three members, all of which must qualify as independent directors under the Company’s articles of association.

50.
Tena
ris
Under the Company’s articles of association, an independent director is a director who:
is not and has not been employed by us or our subsidiaries in an executive capacity for the preceding five years; is not a person that controls us, directly or indirectly, and is not a member of the board of directors of a company controlling us, directly or indirectly;does not have (and is not affiliated with a company or a firm that has) a significant business relationship with us, our subsidiaries or our controlling shareholder; is not and has not been affiliated with or employed by a present or former auditor of us, our subsidiaries or our controlling shareholder for the preceding five years; andis not a spouse, parent, sibling or relative up to the third degree of any of the above persons.
The Company’s board of directors has an audit committee consisting of three members. On May 6, 2015, the Company’s board of directors reappointed Jaime Serra Puche, Amadeo Vázquez y Vázquez and Roberto Monti as members of the Company’s audit committee. All three members of the audit committee qualify as independent directors under the Company’s articles of association.
Under the Company’s articles of association, the audit committee is required to report to the board of directors on its activities from time to time, and on the adequacy of the systems of internal control over
financial reporting once a year at the time the annual accounts are approved. In addition, the charter of the audit committee sets forth, among other things, the audit committee’s purpose and responsibilities. The audit committee assists the board of directors in its oversight responsibilities with respect to our financial statements, and the independence, performance and fees of our independent auditors. The audit committee also performs other duties entrusted to it by the Company’s board of directors.
In addition, the audit committee is required by the Company’s articles of association to review “material transactions”, as such term is defined under the Company’s articles of association, to be entered into by the Company or its subsidiaries with “related parties”, as such term is defined in the Company’s articles of association, in order to determine whether their terms are consistent with market conditions or are otherwise fair to the Company and/or its subsidiaries. In the case of material transactions entered into by the Company’s subsidiaries with related parties, the Company’s audit committee will review those transactions entered into by those subsidiaries whose boards of directors do not have independent members.
Under the Company’s articles of association, as supplemented by the audit committee’s charter, a material transaction is:
any transaction between the Company or its subsidiaries with related parties (x) with an
•
•
•
•
•
•

51.
Ann
ual R
epor
t
individual value equal to or greater than $10 million, or (y) with an individual value lower than $10 million, when the aggregate sum – as reflected in the financial statements of the four fiscal quarters of the Company preceding the date of determination- of any series of transactions for such lower value that can be deemed to be parts of a unique or single transaction (but excluding any transactions that were reviewed and approved by Company’s audit committee or board of directors, as applicable, or the independent members of the board of directors of any of its subsidiaries) exceeds 1.5% of the Company’s consolidated net sales made in the fiscal year preceding the year on which the determination is made; any corporate reorganization transaction (including a merger, spin-off or bulk transfer of a business) affecting the Company for the benefit of, or involving, a related party; andany corporate reorganization transaction (including a merger, spin-off or bulk transfer of a business) not reviewed and approved by the independent members of the board of directors of any of the Company’s direct or indirect subsidiaries, affecting any of the Company’s direct or indirect subsidiaries for the benefit of, or involving, a related party.
The audit committee has the power (to the maximum extent permitted by applicable laws) to request that the Company or relevant subsidiary provide any information necessary for it to review any material transaction. A material related party transaction shall not be entered into without prior review by the Company’s audit committee and approval by the board of directors unless (i) the circumstances underlying the proposed transaction justify that it be entered into before it can be reviewed by the Company’s audit committee or approved by the board of directors and (ii) the related party agrees to unwind the transaction if the Company’s audit committee or board of directors does not approve it.
The audit committee has the authority to engage independent counsel and other advisors to review specific issues as the committee may deem necessary to carry out its duties and to conduct any investigation appropriate to fulfill its responsibilities, and has direct access to the Company’s internal and external auditors as well as to the Company’s management and employees and, subject to applicable laws, its subsidiaries.
•
•

52.
Tena
ris
Senior management
Our current senior management as of the date of this annual report consists of:
Position
Chairman and Chief Executive Officer
Chief Financial Officer
Supply Chain Director
Industrial Director
Planning Director
Human Resources Director
Chief Process and Information Officer
Technology Director
North American Area Manager
Central American Area Manager
Brazilian Area Manager
Southern Cone Area Manager
Eastern Hemisphere Area Manager
European Area Manager
Name
Paolo Rocca
Edgardo Carlos
Gabriel Casanova
Vincenzo Crapanzano
Alejandro Lammertyn
Paola Mazzoleni
Carlos Pappier
Marcelo Ramos
Germán Curá
Sergio de la Maza
Renato Catallini
Javier Martínez Alvarez
Gabriel Podskubka
Sergio Tosato
Age at December 31, 2015
63
49
57
63
50
39
54
52
53
59
49
49
42
66

53.
Ann
ual R
epor
t
Paolo Rocca
Mr. Rocca is the chairman of the Company’s board of directors and our chief executive officer. He is a grandson of Agostino Rocca. He is also the chairman of the board of directors of Ternium, a director and vice president of San Faustin, and a director of Techint Financial Corporation N.V. He is a member of the Executive Committee of the World Steel Association. Mr. Rocca is an Italian citizen.
Edgardo Carlos
Mr. Carlos currently serves as our chief financial officer, a position that he assumed on July 1, 2013. He joined the Techint Group in 1987 in the accounting department of Siderar. After serving as financial manager for Sidor, in Venezuela, in 2001 he joined Tenaris as our financial director. In 2005 he was appointed administration and financial manager for North America and in 2007 he became administration and financial director for Central America. In 2009 he was appointed economic and financial planning director, until he assumed his current position. Mr. Carlos is an Argentine citizen.
Gabriel Casanova
Mr. Casanova currently serves as our supply chain director, with responsibility for the execution of all contractual deliveries to customers. After graduating as a marine and mechanical engineer, he joined Siderca’s export department in 1987. In 1995 he became Siderca’s Chief Representative in China and from 1997 to 2009 he held several positions in the commercial area in Dalmine. In 2009 he became the head of our supply chain network and in October 2012 he assumed his current position. Mr. Casanova is an Argentine citizen.
Vincenzo Crapanzano
Mr. Crapanzano currently serves as our industrial director, a position he assumed in April 2011. Previously he served as our European area manager, Mexican area manager and executive vice president of Tamsa. Prior to joining Tenaris, he held various positions at Grupo Falck from 1979 to 1989. When Dalmine acquired the tubular assets of Grupo Falck in 1990, he was appointed managing director of the cold drawn tubes division. Mr. Crapanzano is an Italian citizen.
Alejandro Lammertyn
Mr. Lammertyn currently serves as our planning director, a position he assumed in April 2013. Mr. Lammertyn began his career with Tenaris in 1990. Previously he served as assistant to the CEO for marketing, organization and mill allocation, supply chain director, commercial director and Eastern Hemisphere area manager. Mr. Lammertyn is an Argentine citizen.
Paola Mazzoleni
Ms. Mazzoleni currently serves as our human resources director, a position she assumed on January 1, 2016. After receiving a degree in Philosophy, she started her career in Dalmine in 2001 in the human resources department, working in recruitment and selection. She next coordinated the company’s Global Trainee Program and then served as the regional head in Italy of TenarisUniversity. Ms. Mazzoleni was appointed as human resources director in Romania in 2008, in Italy in 2012 and in the United States in 2014. Ms. Mazzoleni is an Italian citizen.

54.
Tena
ris
Carlos Pappier
Mr. Pappier currently serves as our chief process and information officer. Previously, he served as planning director. He began his career within the Techint group in 1984 as a cost analyst in Siderar. After holding several positions within Tenaris and other Techint group companies in 2002, he became chief of staff of Tenaris. He assumed his current position in May 2010. Mr. Pappier is an Argentine citizen.
Marcelo Ramos
Mr. Ramos currently serves as our technology director, with responsibility over technology and quality. Previously he served as corporate quality director and managing director of NKKTubes in our Japanese operations. He joined the Techint group in 1987 and has held various positions within Tenaris. He assumed his current position in April 2010, when both, the quality and technology departments were combined. Mr. Ramos is an Argentine citizen.
Renato Catallini
Mr. Catallini currently serves as our Brazilian area manager, a position that he assumed in October 2012, after having served as our supply chain director since August 2007. He joined Tenaris in 2001 in the supply management area, as a general manager of Exiros Argentina. In July 2002, he was appointed operations director and subsequently, in January 2005, became managing director of Exiros. Before joining Tenaris, he worked for ten years in the energy sector, working for TGN, Nova Gas Internacional, TransCanada Pipelines and TotalFinaElf, among others. Mr. Catallini is an Argentine and Italian citizen.
Javier Martínez Alvarez
Mr. Martínez Alvarez currently serves as our Southern Cone area manager, a position he assumed in June 2010, having previously served as our Andean area manager. He began his career in the Techint group in 1990, holding several positions including planning manager of Siderar and commercial director of Ternium-Sidor. In 2006, he joined Tenaris as our Venezuela area manager. Mr. Martínez Alvarez is an Argentine citizen.
Germán Curá
Mr. Curá currently serves as our North American area manager. He is a marine engineer and was first employed with Siderca in 1988. Previously, he served as Siderca’s exports director, Tamsa’s exports director and commercial director, sales and marketing manager of our Middle East office, president of Algoma Tubes, president and chief executive officer of Maverick Tubulars and president and chief executive officer of Hydril, director of our Oilfield Services business unit and Tenaris commercial director. He was also a member of the board of directors of API. He assumed his current position in October 2006. Mr. Curá is a U.S. citizen.
Sergio de la Maza
Mr. de la Maza currently serves as our Central American area manager and also serves as a director and executive vice-president of Tamsa. Previously he served as our Mexican area manager. He first joined Tamsa in 1980. From 1983 to 1988, Mr. de la Maza worked in several positions in Tamsa and Dalmine. He then became manager of Tamsa’s new pipe factory and later served as manufacturing manager and quality director of Tamsa. Subsequently, he was named manufacturing director of Siderca. He assumed his current position in 2006. Mr. de la Maza is a Mexican citizen.

55.
Ann
ual R
epor
t
Gabriel Podskubka
Mr. Podskubka currently serves as our Eastern Hemisphere area manager, based in Dubai. He assumed his current position in April 2013 after serving as the head of our operations in Eastern Europe for 4 years. After graduating as an industrial engineer Mr. Podskubka joined the Techint group in 1995 in the marketing department of Siderca. He held various positions in the marketing, commercial, and industrial areas until he was appointed as oil & gas sales director in the United States in 2006. Mr. Podskubka is an Argentine citizen.
Sergio Tosato
Mr. Tosato currently serves as our European Area Manager, a position he assumed in April 2015. Mr. Tosato first joined Dalmine in 1974 in the personnel organization area, and has held many positions within Tenaris, including industrial coordination director, director of operations in Siderca and manufacturing director in Dalmine. Since 2013, he was the director for industrial expansion, with responsibility over the greenfield seamless mill project in Bay City, Texas, until he assumed his current position. Mr. Tosato is an Italian citizen.

56.
Tena
ris
Directors’ and senior management compensation
The compensation of the members of the Company’s board of directors is determined at the annual ordinary general shareholders’ meeting. Each member of the board of directors received as compensation for their services for the year 2015 a fee of $85,000. The chairman of the audit committee received as additional compensation a fee of $65,000 while the other members of the audit committee received an additional fee of $55,000. Under the Company’s articles of association, the members of the audit committee are not eligible to participate in any incentive compensation plan for employees of the Company or any of its subsidiaries.
During the years ended December 31, 2015, 2014 and 2013, the cash compensation of directors and senior managers amounted to $29.2 million, $26.0 million and $28.1 million, respectively. In addition, directors and senior managers received 540, 567 and 534 thousand units for a total amount of $5.4 million, $6.2 million and $5.6 million, respectively, in connection with the Employee retention and long term incentive program described in note O (2) “Employee benefits –Other long term benefits” to our audited consolidated financial statements included in this annual report.
There are no service contracts between any director and Tenaris that provide for material benefits upon termination of employment.
Auditors
The Company’s articles of association require the appointment of an independent audit firm in accordance with applicable law. The primary responsibility of the auditor is to audit the
Company’s annual accounts and to submit a report on the accounts to shareholders at the annual shareholders’ meeting. In accordance with applicable law, auditors are chosen from among the members of the Luxembourg Institute of Independent Auditors (Institut des réviseurs d’entreprises). Auditors are appointed by the general shareholders’ meeting upon recommendation from our audit committee through a resolution passed by a simple majority vote, irrespective of the number of Shares represented at the meeting, to serve one-year renewable terms. Auditors may be dismissed by the general shareholders meeting at any time, with or without cause. Luxembourg law does not allow directors to serve concurrently as independent auditors. As part of their duties, the auditors report directly to the audit committee.
The Company’s audit committee is responsible for, among other things, the oversight of the Company’s independent auditors. The audit committee has adopted in its charter a policy of pre-approval of audit and permissible non-audit services provided by its independent auditors. Under the policy, the audit committee makes its recommendations to the shareholders’ meeting concerning the continuing appointment or termination of the Company’s independent auditors. On a yearly basis, the audit committee reviews together with management and the independent auditor, the audit plan, audit related services and other non-audit services and approves, ad-referendum of the general shareholders’ meeting, the related fees. The general shareholders’ meeting normally approves such audit fees and authorizes the audit committee to approve any increase or reallocation of such audit fees as may be necessary, appropriate or desirable under the circumstances. The audit committee delegates to its Chairman the authority

57.
Ann
ual R
epor
t
to consider and approve, on behalf of the audit committee, additional non-audit services that were not recognized at the time of engagement, which must be reported to the other members of the audit committee at its next meeting. No services outside the scope of the audit committee’s approval can be undertaken by the independent auditor.
Our independent auditor for the fiscal year ended December 31, 2015, appointed by the shareholders’ meeting held on May 6, 2015, was PricewaterhouseCoopers Société Coopérative., Cabinet de révision agréé, in connection with all of our annual accounts and financial statements.
Fees Paid to the Company’s Independent Auditor
In 2015, PwC served as the principal external auditor for the Company. Fees payable to PwC in 2015 are detailed below.
Audit Fees
Audit fees were paid for professional services rendered by the auditors for the audit of the consolidated financial statements and internal control over financial reporting of the Company, the statutory financial statements of the Company and its subsidiaries, and any other audit services required for the SEC or other regulatory filings.
FOR THE YEAR ENDED DECEMBER 31
Audit Fees
Audit-Related Fees
Tax Fees
All Other Fees
Total
2015
4,372
78
25
15
4,490
Thousands of U.S. dollars
Audit-Related Fees
Audit-related fees are typically services that are reasonably related to the performance of the audit or review of the consolidated financial statements of the Company and the statutory financial statements of the Company and its subsidiaries and are not reported under the audit fee item above. This item includes fees for attestation services on financial information of the Company and its subsidiaries included in their annual reports that are filed with their respective regulators.
Tax Fees
Fees paid for tax compliance professional services.
All Other Fees
Fees paid for the support in the development of training courses.
Share Ownership
To our knowledge, the total number of Shares (in the form of ordinary shares or ADSs) beneficially owned by our directors and senior management as of the date of this annual report, was 1,400,603, which represents 0.12% of our outstanding Shares.
The following table provides information regarding share ownership by our directors and senior management:
Director or Officer
Guillermo Vogel
Carlos Condorelli
Edgardo Carlos
Gabriel Podskubka
Total
Number of Shares Held
1,325,446
67,211
4,000
3,946
1,400,603

58.
Tena
ris
the Company’s knowledge, any agreements among shareholders of the Company that might result in restrictions on the transfer of securities or the exercise of voting rights.
The Company does not know of any significant agreements or other arrangements to which the Company is a party and which take effect, alter or terminate in the event of a change of control of the Company. The Company does not know of any arrangements, the operation of which may at a subsequent date result in a change of control of the Company.
Information required under the Luxembourg Law
on takeovers of May 19, 2006
The Company has an authorized share capital of a single class of 2,500,000,000 shares with a par value of $ 1.00 per share. Our authorized share capital is fixed by the Company’s articles of association as amended from time to time with the approval of our shareholders in an extraordinary shareholders’ meeting. There were 1,180,536,830 shares issued as of December 31, 2015. All issued shares are fully paid.
The Company’s articles of association authorize the board of directors until 2020, to increase the issued share capital in whole or in part from time to time, through issues of shares within the limits of the authorized share capital against compensation in cash, compensation in kind at a price or if shares are issued by way of incorporation of reserves, at an amount, which shall not be less than the par value and
The voting rights of the Company’s major shareholders do not differ from the voting rights of other shareholders. None of its outstanding shares have any special control rights. There are no restrictions on voting rights, nor are there, to
Major shareholders
The following table shows the beneficial ownership of the Shares by (1) the Company’s major shareholders (persons or entities that have notified the Company of holdings in excess of 5% of the Company’s share capital), (2) non-affiliated public shareholders, and (3) the Company’s directors and senior management as a group. The information below is based on the most recent information provided to the Company.
Identity of Person or Group
San Faustin (1)
Aberdeen Asset
Management PLC (2)
Directors and senior
management as a group
Public
Total
Percent
60.45%
6.94%
0.12%
32.50%
100.00%
Number
713,605,187
81,903,771
1,400,603
383,627,269
1,180,536,830
(1) San Faustin owns all of its shares in the Company through its wholly-owned subsidiary Techint Holdings S.à r.l. The Dutch private foundation (Stichting) Rocca & Partners Stichting Administratiekantoor Aandelen San Faustin ("RP STAK") holds voting rights in San Faustin sufficient to control San Faustin. No person or group of persons controls RP STAK.
(2) On March 1, 2016, Aberdeen Asset Management PLC filed a Schedule 13(G) with the SEC informing that, as of December 31, 2015, it is deemed to be the beneficial owner of 79,833,738 Shares of Tenaris, representing 6.8% of Tenaris’s issued and outstanding capital share. In addition, Aberdeen Asset Management PLC informed Tenaris that, as of December 31, 2015, (i) it held 2,070,033 Shares, representing 0.14% (in addition to its ADSs holdings reported in the above mentioned Schedule 13(G)); and (i) based on it ADSs and Shares’ holdings, it held 5.41% of Tenaris’s votes.

59.
Ann
ual R
epor
t
may include such issue premium as the board of directors shall decide. However, under the Company’s articles of association, the Company’s existing shareholders shall have a preferential right to subscribe for any new Shares issued pursuant to the authorization granted to its board of directors, except in the following cases (in which cases no preferential subscription rights shall apply):
any issuance of Shares (including, without limitation, the direct issuance of Shares or upon the exercise of options, rights convertible into shares, or similar instruments convertible or exchangeable into Shares) against a contribution other than in cash; any issuance of Shares (including by way of free Shares or at discount), up to an amount of 1.5% of the issued share capital of the Company, to directors, officers, agents or employees of the Company, its direct or indirect subsidiaries, or its affiliates (collectively, the “Beneficiaries”), including, without limitation, the direct issuance of Shares or upon the exercise of options, rights convertible into Shares, or similar instruments convertible or exchangeable into Shares, issued for the purpose of compensation or incentive of the Beneficiaries or in relation thereto (which the board of directors shall be authorized to issue upon such terms and conditions as it deems fit).
The Company’s articles of association do not contain any redemption or sinking fund provisions, nor do they impose any restrictions on the transfer of the Company’s shares.
Amendment of the Company’s articles of association requires the approval of shareholders at an extraordinary shareholders’ meeting with a two-thirds majority vote of the Shares represented at the meeting.
The Company is controlled by San Faustin, which owns 60.45% of the Company’s outstanding shares, through its wholly owned subsidiary Techint Holdings S.à r.l. The Dutch private foundation (Stichting) RP STAK holds voting rights in San Faustin sufficient to control San Faustin. No person or group of persons controls RP STAK.
Our directors and senior management as a group own 0.12% of the Company’s outstanding shares, while the remaining 39.44% are publicly traded. The Company’s shares trade on the Italian Stock Exchange, the Buenos Aires Stock Exchange and the Mexican Stock Exchange; in addition, the Company’s ADSs trade on the New York Stock Exchange. See “Corporate Governance – Major Shareholders”.
None of the Company’s outstanding securities has any special control rights. There are no restrictions on voting rights, nor are there, to our knowledge, any agreements among our shareholders that might result in restrictions on the transfer of securities or the exercise of voting rights.
There are no significant agreements to which the Company is a party and which take effect, alter or terminate in the event of a change in the control of the Company following a takeover bid, thereby
•
•

60.
Tena
ris
materially and adversely affecting the Company, nor are there any agreements between us and members of our board of directors or employees that provide for compensation if they resign or are made redundant without reason, or if their employment ceases pursuant to a takeover bid.
Management is vested in a board of directors. Directors are elected at the annual ordinary shareholders’ meeting to serve one-year renewable terms. See “Corporate Governance – Board of Directors”.
Internal control over financial reporting
Management is responsible for establishing and maintaining adequate internal control over financial reporting. Tenaris’s internal control over financial reporting was designed by management to provide reasonable assurance regarding the reliability of financial reporting and the preparation and fair presentation of its consolidated financial statements for external purposes in accordance with IFRS.
In addition, under the Company’s articles of association, the audit committee is required to report to the board of directors on its activities from time to time, and on the adequacy of the systems of internal control over financial reporting once a year at the time the annual accounts are approved.
Because of its inherent limitations, internal control over financial reporting may not prevent or detect misstatements or omissions. In addition, projections of any evaluation of effectiveness to future periods are subject to the risk that controls may become inadequate because of changes in conditions, or that the degree of compliance with the policies or procedures may deteriorate.
On a yearly basis, management conducts its assessment of the effectiveness of Tenaris’s internal control over financial reporting based on the framework in Internal Control- Integrated Framework issued by the Committee of Sponsoring Organizations of the Treadway Commission.
On February 24, 2016, management reported to the audit committee of the Company’s board of directors that management had conducted its assessment of the effectiveness of the Company’s internal controls over financial reporting for the year ended December 31, 2015, and that, based on management’s evaluation and considering the inherent limitations to the effectiveness of any internal control system, management had concluded that the Company’s internal controls over financial reporting were effective as of December 31, 2015.

61.
Ann
ual R
epor
t
Management certification
We confirm, to the best of our knowledge, that:
the consolidated financial statements prepared in conformity with International Financial Reporting Standards as issued by the International Accounting Standards Board and as adopted by the European Union, included in this annual report, give a true and fair view of the assets, liabilities, financial position and profit or loss of Tenaris S.A. and its consolidated subsidiaries, taken as a whole;
the annual accounts prepared in accordance with Luxembourg legal and regulatory requirements, included in this annual report, give a true and fair view of the assets, liabilities, financial position and profit or loss of Tenaris S.A.; and
the consolidated management report on the consolidated financial statements included in this annual report, which has been combined with the management report on the annual accounts included in this annual report, gives a fair review of the development and performance of the business and the position of Tenaris S.A., or Tenaris S.A. and its consolidated subsidiaries, taken as a whole, as applicable, together with a description of the principal risks and uncertainties they face.
/s/ Paolo Rocca
Chief Executive OfficerPaolo Rocca
March 30, 2016
/s/ Edgardo Carlos
Chief Financial OfficerEdgardo Carlos
March 30, 2016
1.
2.
3.

62.
Tena
ris

63.
Ann
ual R
epor
t
Tenaris S.A.Consolidated Financial Statements
For the years ended December 31, 2015, 2014 and 2013

64.
Tena
ris

65.
Ann
ual R
epor
t
Audit report
To the Shareholders
of Tenaris S.A.
Report on the consolidated financial statements
We have audited the accompanying consolidated financial statements of Tenaris S.A. and its subsidiaries, which comprise the consolidated statement of financial position as at 31 December 2015, and the consolidated income statement, consolidated statement of comprehensive income, consolidated statement of changes in equity and consolidated statement of cash flows for the year then ended and a summary of significant accounting policies and other explanatory information.
Board of Directors’ responsibility for the consolidated financial statements
The Board of Directors is responsible for the preparation and fair presentation of these consolidated financial statements in accordance with International Financial Reporting Standards as issued by the International Accounting Standards Board and as adopted by the European Union, and for such internal control as the Board of Directors determines is necessary to enable the preparation of consolidated financial statements that are free from material misstatement, whether due to fraud or error.
Responsibility of the “Réviseur d’entreprises agréé”
Our responsibility is to express an opinion on these consolidated financial statements based on our audit. We conducted our audit in accordance with International Standards on Auditing as adopted for Luxembourg by the “Commission de Surveillance du Secteur Financier”. Those standards require that we comply with ethical requirements and plan and perform the audit to obtain reasonable assurance about whether the consolidated financial statements are free from material misstatement. An audit involves performing procedures to obtain audit evidence about the amounts and disclosures in the consolidated financial statements. The procedures selected depend on the judgment of the “Réviseur d’entreprises agréé” including the assessment of the risks of material misstatement of the consolidated financial statements, whether due to fraud or error. In making those risk assessments, the “Réviseur d’entreprises agréé” considers internal control relevant to the entity’s preparation and fair presentation of the consolidated financial statements in order to design audit procedures that are appropriate in the circumstances, but not for the purpose of expressing an opinion on the effectiveness of the entity’s internal control. An audit also includes evaluating

66.
Tena
ris
the appropriateness of accounting policies used and the reasonableness of accounting estimates made by the Board of Directors, as well as evaluating the overall presentation of the consolidated financial statements.
We believe that the audit evidence we have obtained is sufficient and appropriate to provide a basis for our audit opinion.
Opinion
In our opinion, these consolidated financial statements give a true and fair view of the consolidated financial position of Tenaris S.A. and its subsidiaries as of 31 December 2015, and of its consolidated financial performance and its consolidated cash flows for the year then ended in accordance with International Financial Reporting Standards as issued by the International Accounting Standards Board and as adopted by the European Union.
Report on other legal and regulatory requirements
The management report, including the corporate governance statement, which is the responsibility of the Board of Directors, is consistent with the consolidated financial statements and includes the information required by the law with respect to the corporate governance statement.
Luxembourg, 30 March 2016
PricewaterhouseCoopers, Société coopérative Represented byRepresented by
/s/ Mervyn R. Martins
Mervyn R. Martins
PricewaterhouseCoopers, Société coopérative, 2, rue Gerhard Mercator, B.P. 1443, L-1014 LuxembourgT: +352 494848 1, F: +352 494848 2900, www.pwc.lu
Cabinet de révision agréé. Expert-comptable (autorisation gouvernementale n°10028256)R.C.S. Luxembourg B 65 477 - TVA LU25482518

67.
Ann
ual R
epor
t
Consolidated Income Statement
YEAR ENDED DECEMBER 31
CONTINUING OPERATIONS
Net sales
Cost of sales
Gross profit
Selling, general and administrative expenses
Other operating income
Other operating expenses
Operating income
Finance Income
Finance Cost
Other financial results
Income before equity in earnings of non-consolidated companies and income tax
Equity in earnings (losses) of non-consolidated companies
Income before income tax
Income tax
(Loss) Income for the year
ATTRIBUTABLE TO
Owners of the parent
Non-controlling interests
EARNINGS PER SHARE ATTRIBUTABLE TO THE OWNERS
OF THE PARENT DURING THE PERIOD
Weighted average number of ordinary shares (thousands)
CONTINUING OPERATIONS
Basic and diluted (loss) earnings per share (U.S. dollars per share)
Basic and diluted (loss) earnings per ADS (U.S. dollars per ADS) (*)
2014
10,337,962
(6,287,460)
4,050,502
(1,963,952)
27,855
(215,589)
1,898,816
38,211
(44,388)
39,214
1,931,853
(164,616)
1,767,237
(586,061)
1,181,176
1,158,517
22,659
1,181,176
1,180,537
0.98
1.96
2015
7,100,753
(4,885,078)
2,215,675
(1,624,275)
14,603
(410,575)
195,428
34,574
(23,058)
2,694
209,638
(39,558)
170,080
(244,505)
(74,425)
(80,162)
5,737
(74,425)
1,180,537
(0.07)
(0.14)
2013
10,596,781
(6,456,786)
4,139,995
(1,941,213)
14,305
(28,257)
2,184,830
34,767
(70,450)
7,004
2,156,151
46,098
2,202,249
(627,877)
1,574,372
1,551,394
22,978
1,574,372
1,180,537
1.31
2.63
All amounts in thousands of U.S. dollars, unless otherwise stated
Notes
1
2
3
5
5
6
6
6
7
8
(*) Each ADS equals two shares.

68.
Tena
ris
Consolidated Statement of comprehensive income
YEAR ENDED DECEMBER 31
(Loss) Income for the year
ITEMS THAT WILL NOT BE RECLASSIFIED TO PROFIT OR LOSS
Remeasurements of post employment benefit obligations
Income tax on items that will not be reclassified
ITEMS THAT MAY BE SUBSEQUENTLY RECLASSIFIED TO PROFIT OR LOSS
Currency translation adjustment
Change in value of cash flow hedges and available for sale financial instruments
Share of other comprehensive income of non-consolidated companies:
Currency translation adjustment
Changes in the fair value of derivatives held as cash flow hedges and others
Income tax related to cash flow hedges and available for sale financial instruments
Other comprehensive (loss) for the year, net of tax
Total comprehensive (loss) income for the year
ATTRIBUTABLE TO
Owners of the parent
Non-controlling interests
2014
1,181,176
1,850
(513)
1,337
(197,711)
(10,483)
(54,688)
(3,857)
400
(266,339)
(265,002)
916,174
894,929
21,245
916,174
2015
(74,425)
14,181
(4,242)
9,939
(256,260)
13,185
(92,914)
(4,239)
(284)
(340,512)
(330,573)
(404,998)
(410,187)
5,189
(404,998)
2013
1,574,372
18,314
(4,865)
13,449
(1,941)
2,941
(87,666)
2,682
478
(83,506)
(70,057)
1,504,315
1,480,572
23,743
1,504,315
The accompanying notes are an integral part of these Consolidated Financial Statements.
All amounts in thousands of U.S. dollars

69.
Ann
ual R
epor
t
Consolidated Statement of financial position
AT DECEMBER 31
ASSETS
NON-CURRENT ASSETS
Property, plant and equipment, net
Intangible assets, net
Investments in non-consolidated companies
Available for sale assets
Other investments
Deferred tax assets
Receivables
CURRENT ASSETS
Inventories
Receivables and prepayments
Current tax assets
Trade receivables
Other investments
Cash and cash equivalents
Total assets
EQUITY
Capital and reserves attributable to owners of the parent
Non-controlling interests
Total equity
LIABILITIES
NON-CURRENT LIABILITIES
Borrowings
Deferred tax liabilities
Other liabilities
Provisions
CURRENT LIABILITIES
Borrowings
Current tax liabilities
Other liabilities
Provisions
Customer advances
Trade payables
Total liabilities
Total equity and liabilities
5,159,557
2,757,630
643,630
21,572
1,539
268,252
262,176
2,779,869
267,631
129,404
1,963,394
1,838,379
417,645
30,833
714,123
285,865
70,714
968,407
352,353
296,277
20,380
133,609
831,803
9,143,943
5,743,031
14,886,974
11,713,344
152,712
11,866,056
1,266,143
1,754,775
3,020,918
14,886,974
5,672,258
2,143,452
490,645
21,572
394,746
200,706
220,564
1,843,467
148,846
188,180
1,135,129
2,140,862
286,547
223,221
750,325
231,176
61,421
748,295
136,018
222,842
8,995
134,780
503,845
Notes
10
11
12
30
18
20
13
14
15
16
17
18
18
19
20
21 (I)
22 (II)
19
16
21 (II)
23 (II)
9,114,356
7,396,322
16,510,678
12,654,114
152,200
12,806,314
1,101,535
2,602,829
3,704,364
16,510,678
Contingencies, commitments and restrictions on the distribution of profits are disclosed in Note 25.
The accompanying notes are an integral part of these Consolidated Financial Statements.
All amounts in thousands of U.S. dollars
2015
2014

70.
Tena
ris
Consolidated Statement of changes in equity
Balance at December 31, 2014
(Loss) income for the year
Currency translation adjustment
Remeasurements of post employment benefit
obligations, net of taxes
Change in value of available for sale financial
instruments and cash flow hedges net of tax
Share of other comprehensive income of
non-consolidated companies
Other comprehensive (loss) income for the year
Total comprehensive (loss) income for the year
Acquisition of non-controlling interests
Dividends paid in cash
Balance at December 31, 2015
Other Reserves (2)
(317,799)
–
–
10,213
12,484
(4,239)
18,458
18,458
659
–
(298,682)
Currency Translation Adjustment
(658,284)
–
(255,569)
–
–
(92,914)
(348,483)
(348,483)
–
–
(1,006,767)
Share Premium
609,733
–
–
–
–
–
–
–
–
–
609,733
Legal Reserves
118,054
–
–
–
–
–
–
–
–
–
118,054
Share Capital (1)
1,180,537
–
–
–
–
–
–
–
–
–
1,180,537
ATTRIBUTABLE TO OWNERS OF THE PARENT
(1) The Company has an authorized share capital of a single class of 2.5 billion shares having a nominal value of $1.00 per share. As of December 31, 2015 there were 1,180,536,830 shares issued. All issued shares are fully paid.
(2) Other reserves include mainly the result of transactions with non-controlling interest that do not result in a loss of control, the remeasurement of post-employment benefit obligations and the changes in value of cash flow hedges and in available for sale financial instruments.
(3) The Distributable Reserve and Retained Earnings calculated according to Luxembourg Law are disclosed in Note 25
The accompanying notes are an integral part of these Consolidated Financial Statements.
All amounts in thousands of U.S. dollars

71.
Ann
ual R
epor
t
Non-controlling Interests
152,200
5,737
(691)
(274)
417
–
(548)
5,189
(1,727)
(2,950)
152,712
Total
12,806,314
(74,425)
(256,260)
9,939
12,901
(97,153)
(330,573)
(404,998)
(1,068)
(534,192)
11,866,056
Retained Earnings (3)
11,721,873
(80,162)
–
–
–
–
–
(80,162)
–
(531,242)
11,110,469
ATTRIBUTABLE TO OWNERS OF THE PARENT
Total
12,654,114
(80,162)
(255,569)
10,213
12,484
(97,153)
(330,025)
(410,187)
659
(531,242)
11,713,344

72.
Tena
ris
Balance at December 31, 2013
Income for the year
Currency translation adjustment
Remeasurements of post employment benefit
obligations, net of taxes
Change in value of available for sale financial
instruments and cash flow hedges net of tax
Share of other comprehensive income of non-
consolidated companies
Other comprehensive (loss) income for the year
Total comprehensive income for the year
Acquisition and increase of non-controlling interests
Dividends paid in cash
Balance at December 31, 2014
Balance at December 31, 2012
Income for the year
Currency translation adjustment
Effect of adopting IAS 19R
Hedge reserve, net of tax
Share of other comprehensive income of
non-consolidated companies
Other comprehensive (loss) income for the year
Total comprehensive income for the year
Acquisition and increase of non-controlling interests
Dividends paid in cash
Balance at December 31, 2013
Other Reserves (2)
(305,758)
–
–
1,503
(9,694)
(3,857)
(12,048)
(12,048)
7
–
(317,799)
(314,297)
–
–
13,449
2,960
2,682
19,091
19,091
(10,552)
–
(305,758)
Currency Translation Adjustment
(406,744)
–
(196,852)
–
–
(54,688)
(251,540)
(251,540)
–
–
(658,284)
(316,831)
–
(2,247)
–
–
(87,666)
(89,913)
(89,913)
–
–
(406,744)
Share Premium
609,733
–
–
–
–
–
–
–
–
–
609,733
609,733
–
–
–
–
–
–
–
–
–
609,733
Legal Reserves
118,054
–
–
–
–
–
–
–
–
–
118,054
118,054
–
–
–
–
–
–
–
–
–
118,054
Share Capital (1)
1,180,537
–
–
–
–
–
–
–
–
–
1,180,537
1,180,537
–
–
–
–
–
–
–
–
–
1,180,537
ATTRIBUTABLE TO OWNERS OF THE PARENT
All amounts in thousands of U.S. dollars
Consolidated Statement of changes in equity (cont.)
(1) The Company has an authorized share capital of a single class of 2.5 billion shares having a nominal value of $1.00 per share. As of December 31, 2014 and 2013 there were 1,180,536,830 shares issued. All issued shares are fully paid.
(2) Other reserves include mainly the result of transactions with non-controlling interest that do not result in a loss of control, the remeasurement of post-employment benefit obligations and the changes in value of cash flow hedges and in available for sale financial instruments.
The accompanying notes are an integral part of these Consolidated Financial Statements.

73.
Ann
ual R
epor
t
Non-controlling Interests
179,446
22,659
(859)
(166)
(389)
–
(1,414)
21,245
(152)
(48,339)
152,200
171,561
22,978
306
–
459
–
765
23,743
2,784
(18,642)
179,446
Total
12,469,866
1,181,176
(197,711)
1,337
(10,083)
(58,545)
(265,002)
916,174
(145)
(579,581)
12,806,314
1,499,592
1,574,372
(1,941)
13,449
3,419
(84,984)
(70,057)
1,504,315
(7,768)
(526,273)
12,469,866
Retained Earnings
11,094,598
1,158,517
–
–
–
–
–
1,158,517
–
(531,242)
11,721,873
10,050,835
1,551,394
–
–
–
–
–
1,551,394
–
(507,631)
11,094,598
ATTRIBUTABLE TO OWNERS OF THE PARENT
Total
12,290,420
1,158,517
(196,852)
1,503
(9,694)
(58,545)
(263,588)
894,929
7
(531,242)
12,654,114
11,328,031
1,551,394
(2,247)
13,449
2,960
(84,984)
(70,822)
1,480,572
(10,552)
(507,631)
12,290,420

74.
Tena
ris
Consolidated Statement of cash flows
YEAR ENDED DECEMBER 31
CASH FLOWS FROM OPERATING ACTIVITIES
(Loss) income for the year
ADJUSTMENTS FOR:
Depreciation and amortization
Impairment charge
Income tax accruals less payments
Equity in (earnings) losses of non-consolidated companies
Interest accruals less payments, net
Changes in provisions
Changes in working capital
Other, including currency translation adjustment
Net cash provided by operating activities
CASH FLOWS FROM INVESTING ACTIVITIES
Capital expenditures
Changes in advance to suppliers of property, plant and equipment
Investment in non-consolidated companies
Acquisition of subsidiaries and non-consolidated companies
Net loan to non-consolidated companies
Proceeds from disposal of property, plant and equipment and intangible assets
Dividends received from non-consolidated companies
Changes in investments in securities
Net cash used in investing activities
CASH FLOWS FROM FINANCING ACTIVITIES
Dividends paid
Dividends paid to non-controlling interest in subsidiaries
Acquisitions of non-controlling interests
Proceeds from borrowings (*)
Repayments of borrowings (*)
Net cash used in financing activities
Decrease in cash and cash equivalents
MOVEMENT IN CASH AND CASH EQUIVALENTS
At the beginning of the year
Effect of exchange rate changes
Decrease in cash and cash equivalents
At December 31
CASH AND CASH EQUIVALENTS
Cash and bank deposits
Bank overdrafts
All amounts in thousands of U.S. dollars
2014
1,181,176
615,629
205,849
79,062
164,616
(37,192)
(4,982)
(72,066)
(88,025)
2,044,067
(1,089,373)
(63,390)
(1,380)
(28,060)
(21,450)
11,156
17,735
(611,049)
(1,785,811)
(531,242)
(48,339)
(145)
3,046,837
(2,890,717)
(423,606)
(165,350)
598,145
(16,350)
(165,350)
416,445
417,645
(1,200)
416,445
2015
(74,425)
658,778
400,314
(91,080)
39,558
(1,975)
(20,678)
1,373,985
(69,473)
2,215,004
(1,131,519)
49,461
(4,400)
–
(22,322)
10,090
20,674
(695,566)
(1,773,582)
(531,242)
(2,950)
(1,068)
2,064,218
(2,063,992)
(535,034)
(93,612)
416,445
(36,635)
(93,612)
286,198
286,547
(349)
286,198
2013
1,574,372
610,054
–
125,416
(46,098)
(29,723)
(1,800)
188,780
(43,649)
2,377,352
(753,498)
(22,234)
–
–
–
33,186
16,334
(582,921)
(1,309,133)
(507,631)
(18,642)
(7,768)
2,460,409
(3,143,241)
(1,216,873)
(148,654)
772,656
(25,857)
(148,654)
598,145
614,529
(16,384)
598,145
Notes
10 & 11
5
27 (ii)
7
27 (iii)
27 (i)
10 & 11
12c
26
12
9
27 (iv)
18
19
(*) Mainly related to the renewal of short-term local facilities carried out during the years 2015, 2014 and 2013.
The accompanying notes are an integral part of these Consolidated Financial Statements

75.
Ann
ual R
epor
t
Index to the notes to the Consolidated Financial Statements
Other notes to the Restated Consolidated Financial Statements
Segment information
Cost of sales
Selling, general and administrative expenses
Labor costs (included in Cost of sales and in Selling,
general and administrative expenses)
Other operating income and expenses
Financial results
Equity in earnings (losses) of non-consolidated companies
Income tax
Dividends distribution
Property, plant and equipment, net
Intangible assets, net
Investments in non-consolidated companies
Receivables - non current
Inventories
Receivables and prepayments
Current tax assets and liabilities
Trade receivables
Cash and cash equivalents and Other investments
Borrowings
Deferred income tax
Other liabilities
Non-current allowances and provisions
Current allowances and provisions
Derivative financial instruments
Contingencies, commitments and restrictions
on the distribution of profits
Acquisition of subsidiaries and
non-consolidated companies
Cash flow disclosures
Related party transactions
Principal subsidiaries
Nationalization of Venezuelan Subsidiaries
Fees paid to the Company's principal accountant
Subsequent event
I.
II.
A.
B.
C.
D.
E.
F.
G.
H.
I.
J.
K.
L.
M.
N.
O.
P.
Q.
R.
S.
T.
U.
III.
A.
B.
C.
D.
E.
IV.
1.
2.
3.
4.
5.
6.
7.
8.
9.
10.
11.
12.
13.
14.
15.
16.
17.
18.
19.
20.
21.
22.
23.
24.
25.
26.
27.
28.
29.
30.
31.
32.
General Information
Accounting policies (“AP”)
Basis of presentation
Group accounting
Segment information
Foreign currency translation
Property, plant and equipment
Intangible assets
Impairment of non-financial assets
Other investments
Inventories
Trade and other receivables
Cash and cash equivalents
Equity
Borrowings
Current and Deferred income tax
Employee benefits
Provisions
Trade payables
Revenue recognition
Cost of sales and sales expenses
Earnings per share
Financial instruments
Financial risk management
Financial Risk Factors
Financial instruments by category
Fair value hierarchy
Fair value estimation
Accounting for derivative financial instruments
and hedging activities

76.
Tena
ris
Tenaris S.A. (the “Company”) was established as a public limited liability company (societé anonyme) under the laws of the Grand-Duchy of Luxembourg on December 17, 2001. The Company holds, either directly or indirectly, controlling interests in various subsidiaries in the steel pipe manufacturing and distribution businesses. References in these Consolidated Financial Statements to “Tenaris” refer to Tenaris S.A. and its consolidated subsidiaries. A list of the principal Company’s subsidiaries is included in Note 29 to these Consolidated Financial Statements.
The Company’s shares trade on the Buenos Aires Stock Exchange, the Italian Stock Exchange and the Mexican Stock Exchange; the Company’s American Depositary Securities (“ADS”) trade on the New York Stock Exchange.
These Consolidated Financial Statements were approved for issuance by the Company’s Board of Directors on February 24, 2016.
Restatement of 2014 Financial Statements
On May 28, 2015, the Company restated its Consolidated Financial Statements for the year ended December 31, 2014 to reduce the carrying amount of the Company’s investment in Usinas Siderúrgicas de Minas Gerais S.A. Usiminas (“Usiminas”). All information as of December 31, 2014 included in these Consolidated Financial Statements is derived from the Company's audited Restated Consolidated Financial Statements for the year ended December 31, 2014.
I. General information II. Accounting policies
The principal accounting policies applied in the preparation of these Consolidated Financial Statements are set out below. These policies have been consistently applied to all the years presented, unless otherwise stated.
A. Basis of presentation
The Consolidated Financial Statements of Tenaris have been prepared in accordance with International Financial Reporting Standards (“IFRS”), as issued by the International Accounting Standards Board (“IASB”) and adopted by the European Union, under the historical cost convention, as modified by the revaluation of available for sale financial assets and financial assets and liabilities (including derivative instruments) at fair value through profit or loss. The Consolidated Financial Statements are, unless otherwise noted, presented in thousands of U.S. dollars (“$”).
Whenever necessary, certain comparative amounts have been reclassified to conform to changes in presentation in the current year.
The preparation of Consolidated Financial Statements in conformity with IFRS requires management to make certain accounting estimates and assumptions that might affect the reported amounts of assets and liabilities and the disclosure of contingent assets and liabilities at the reporting dates, and the reported amounts of revenues and expenses during the reporting years. Actual results may differ from these estimates.

77.
Ann
ual R
epor
t
1. New and amended standards not yet adopted
and relevant for Tenaris
IFRS 15, “Revenue from contracts with customers”In May 2014, the IASB issued IFRS 15, “Revenue from contracts with customers”, which sets out the requirements in accounting for revenue arising from contracts with customers and which is based on the principle that revenue is recognized when control of a good or service is transferred to the customer. IFRS 15 must be applied on annual periods beginning on or after January 1, 2018.
IFRS 9, “Financial instruments”In July 2014, the IASB issued IFRS 9, “Financial instruments”, which replaces the guidance in IAS 39. It includes requirements on the classification and measurement of financial assets and liabilities, as well as an expected credit losses model that replaces the current incurred loss impairment model. IFRS 9 must be applied on annual periods beginning on or after January 1, 2018.
Amendments to IFRS 10, “Consolidated financial statements” and IAS 28, “Investments in associates and joint ventures”In September 2014, the IASB issued the Amendments to IFRS 10, “Consolidated financial statements” and IAS 28, “Investments in associates and joint ventures”, which addresses an acknowledged inconsistency between the requirements of both standards in dealing with the sale or contribution of assets between an investor and its associate or joint venture. These amendments must be applied on annual periods beginning on or after January 1, 2016.
These standards are not effective for the financial year beginning January 1, 2015 and have not been early adopted.
These standards have not been endorsed by the EU.
•
•
•
The Company’s management has not yet assessed the potential impact that the application of these standards may have on the Company’s financial condition or results of operations.
2. New and amended standards adopted
for Tenaris
Amendments to IAS 32, ‘Financial instruments: Presentation’, IAS 36, ‘Impairment of assets' and IAS 39, ‘Financial instruments: Recognition and measurement’ All the amendments to the standards IAS 32, ‘Financial instruments: Presentation’ – Offsetting financial assets and financial liabilities, IAS 36, ‘Impairment of assets’ – Recoverable amount disclosures for non-financial assets and IAS 39,‘Financial instruments: Recognition and measurement’ – Novation of derivatives and continuation of hedge accounting have been analyzed by the Company. The application of these standards did not materially affect the Company’s financial condition or results of operations.
B. Group accounting
1. Subsidiaries and transactions with
non-controlling interests
Subsidiaries are all entities over which Tenaris has control. Tenaris controls an entity when it is exposed to, or has rights to, variable returns from its involvement with the entity and has the ability to affect those returns through its power over the entity. Subsidiaries are fully consolidated from the date on which control is exercised by the Company and are no longer consolidated from the date control ceases.
The purchase method of accounting is used to account for the acquisition of subsidiaries by Tenaris. The cost of an acquisition is measured as the fair value of the assets given, equity instruments issued
•

78.
Tena
ris
of between 20% and 50% of the voting rights. Investments in non-consolidated companies (associated and joint ventures) are accounted for by the equity method of accounting and are initially recognized at cost. The Company’s investment in non-consolidated companies includes goodwill identified in acquisition, net of any accumulated impairment loss.
Unrealized results on transactions between Tenaris and its non-consolidated companies are eliminated to the extent of Tenaris’ interest in the non-consolidated companies. Unrealized losses are also eliminated unless the transaction provides evidence of an impairment indicator of the asset transferred. Financial statements of non-consolidated companies have been adjusted where necessary to ensure consistency with IFRS.
The Company’s pro-rata share of earnings in non-consolidated companies is recorded in the Consolidated Income Statement under Equity in earnings (losses) of non-consolidated companies. The Company’s pro-rata share of changes in other reserves is recognized in the Consolidated Statement of Changes in Equity under Other Reserves.
At December 31, 2015, Tenaris holds 11.46% of Ternium’s common stock. The following factors and circumstances evidence that Tenaris has significant influence (as defined by IAS 28, “Investments in associates companies”) over Ternium, and as a result the Company’s investment in Ternium has been accounted for under the equity method: Both the Company and Ternium are under the indirect common control of San Faustin S.A.;Four out of eight members of Ternium’s Board of Directors (including Ternium’s chairman) are also members of the Company’s Board of Directors;
and liabilities incurred or assumed at the date of exchange. Acquisition-related costs are expensed as incurred. Identifiable assets acquired, liabilities and contingent liabilities assumed in a business combination are measured initially at their fair values at the acquisition date. Any non-controlling interest in the acquiree is measured either at fair value or at the non-controlling interest’s proportionate share of the acquiree’s net assets. The excess of the aggregate of the consideration transferred and the amount of any non-controlling interest in the acquiree over the fair value of the identifiable net assets acquired is recorded as goodwill. If this is less than the fair value of the net assets of the subsidiary acquired, the difference is recognized directly in the Consolidated Income Statement.
Transactions with non-controlling interests that do not result in a loss of control are accounted as transactions with equity owners of the Company. For purchases from non-controlling interests, the difference between any consideration paid and the relevant share acquired of the carrying value of net assets of the subsidiary is recorded in equity. Gains or losses on disposals to non-controlling interests are also recorded in equity.
Material inter-company transactions, balances and unrealized gains (losses) on transactions between Tenaris subsidiaries have been eliminated in consolidation. However, since the functional currency of some subsidiaries is its respective local currency, some financial gains (losses) arising from inter-company transactions are generated. These are included in the Consolidated Income Statement under Other financial results.
2. Non-consolidated companies
Non-consolidated companies are all entities in which Tenaris has significant influence but not control, generally accompanying a shareholding
•
•

79.
Ann
ual R
epor
t
Under the shareholders’ agreement by and between the Company and Techint Holdings S.à r.l, a wholly owned subsidiary of San Faustin S.A. and Ternium’s main shareholder, dated January 9, 2006, Techint Holdings S.à r.l, is required to take actions within its power to cause (a) one of the members of Ternium’s Board of Directors to be nominated by the Company and (b) any director nominated by the Company to be only removed from Ternium’s Board of Directors pursuant to previous written instructions of the Company. The Company’s investment in Ternium is carried at incorporation cost plus proportional ownership of Ternium’s earnings and other shareholders’ equity accounts. Because the exchange of its holdings in Amazonia and Ylopa for shares in Ternium was considered to be a transaction between companies under common control of San Faustin S.A. (formerly San Faustin N.V.), Tenaris recorded its initial ownership $22.6 million less than its proportional ownership of Ternium’s shareholders’ equity at the transaction date. As a result of this treatment, Tenaris’ investment in Ternium will not reflect its proportional ownership of Ternium’s net equity position.
At December 31, 2015, Tenaris holds through its Brazilian subsidiary Confab Industrial S.A. (“Confab”), 5.0% of the shares with voting rights and 2.5% of Usiminas’s total share capital. The acquisition of Usiminas shares was part of a larger transaction performed on January 16, 2012, pursuant to which Ternium, certain of its subsidiaries and Confab joined Usiminas’s existing control group through the acquisition of ordinary shares representing 27.7% of Usiminas’ total voting capital and 13.8% of Usiminas’ total share capital. The rights of Ternium and its subsidiaries and Confab within the Ternium/Tenaris Group are governed under a separate shareholders agreement.
Those circumstances evidence that Tenaris has significant influence over Usiminas, consequently, accounted it for under the equity method (as defined by IAS 28, “Investments in Associates and Joint Ventures”).
Tenaris reviews investments in non-consolidated companies for impairment whenever events or changes in circumstances indicate that the asset’s carrying amount may not be recoverable, such as a significant or prolonged decline in fair value below the carrying value.
Tenaris carries its investment in Ternium and Usiminas at its proportional equity value, with no additional goodwill or intangible assets recognized. At December 31, 2015, 2014 and 2013, no impairment provisions were recorded on Tenaris’ investment in Ternium while in 2014 and 2015, impairment charges were recorded on Tenaris’ investment in Usiminas. See Note 7 and Note 12.
C. Segment information
The Company is organized in one major business segment, Tubes, which is also the reportable operating segment. The Tubes segment includes the production and sale of both seamless and welded steel tubular products and related services mainly for the oil and gas industry, particularly oil country tubular goods (OCTG) used in drilling operations, and for other industrial applications with production processes that consist in the transformation of steel into tubular products. Business activities included in this segment are mainly dependent on the oil and gas industry worldwide, as this industry is a major consumer of steel pipe products, particularly OCTG used in drilling activities. Demand for steel pipe products from the oil and gas industry has
•

80.
Tena
ris
historically been volatile and depends primarily upon the number of oil and natural gas wells being drilled, completed and reworked, and the depth and drilling conditions of these wells. Sales are generally made to end users, with exports being done through a centrally managed global distribution network and domestic sales are made through local subsidiaries. Corporate general and administrative expenses have been allocated to the Tubes segment.
Others include all other business activities and operating segments that are not required to be separately reported, including the production and selling of sucker rods, welded steel pipes for electric conduits, industrial equipment, coiled tubing, energy and raw materials that exceed internal requirements.
Tenaris’ Chief Operating Decision Maker (CEO) holds monthly meetings with senior management, in which operating and financial performance information is reviewed, including financial information that differs from IFRS principally as follows:
The use of direct cost methodology to calculate the inventories, while under IFRS it is at full cost, including absorption of production overheads and depreciations;The use of costs based on previously internally defined cost estimates, while, under IFRS, costs are calculated at historical cost;Other timing differences.
Tenaris groups its geographical information in five areas: North America, South America, Europe, Middle East and Africa, and Far East and Oceania. For purposes of reporting geographical information, net sales are allocated to geographical
areas based on the customer’s location; allocation of assets, capital expenditures and associated depreciations and amortizations are based on the geographical location of the assets.
D. Foreign currency translation
1. Functional and presentation currency
IAS 21 (revised) defines the functional currency as the currency of the primary economic environment in which an entity operates.
The functional and presentation currency of the Company is the U.S. dollar. The U.S. dollar is the currency that best reflects the economic substance of the underlying events and circumstances relevant to Tenaris global operations.
Except for the Brazilian and Italian subsidiaries whose functional currencies are their local currencies, Tenaris determined that the functional currency of its other subsidiaries is the U.S. dollar, based on the following principal considerations:
Sales are mainly negotiated, denominated and settled in U.S. dollars. If priced in a currency other than the U.S. dollar, the sales price considers exposure to fluctuation in the exchange rate versus the U.S. dollar;Prices of their critical raw materials and inputs are priced and settled in U.S. dollars; Transaction and operational environment and the cash flow of these operations have the U.S. dollars as reference currency; Significant level of integration of the local operations within Tenaris’ international global distribution network;Net financial assets and liabilities are mainly received and maintained in U.S. dollars;
•
•
•
•
•
•
•
•

81.
Ann
ual R
epor
t
The exchange rate of certain legal currencies has long-been affected by recurring and severe economic crises.
2. Transactions in currencies other than the
functional currency
Transactions in currencies other than the functional currency are translated into the functional currency using the exchange rates prevailing at the date of the transactions or valuation where items are re-measured.
At the end of each reporting period: (i) monetary items denominated in currencies other than the functional currency are translated using the closing rates; (ii) non-monetary items that are measured in terms of historical cost in a currency other than the functional currency are translated using the exchange rates prevailing at the date of the transactions; and (iii) non-monetary items that are measured at fair value in a currency other than the functional currency are translated using the exchange rates prevailing at the date when the fair value was determined.
Foreign exchange gains and losses resulting from the settlement of such transactions and from the translation at year-end exchange rates of monetary assets and liabilities denominated in currencies other than the functional currency are recorded as gains and losses from foreign exchange and included in “Other financial results” in the Consolidated Income Statement, except when deferred in equity as qualifying cash flow hedges and qualifying net investment hedges. Translation differences in non-monetary financial assets and liabilities such as equities held at fair value through profit or loss are recognized in profit or loss as part of the “fair value gain or loss,” while translation differences on non-monetary financial assets such as equities classified
as available for sale are included in the “available for sale reserve” in equity. Tenaris had no such assets or liabilities for any of the periods presented.
3. Translation of financial information in
currencies other than the functional currency
Results of operations for subsidiaries whose functional currencies are not the U.S. dollar are translated into U.S. dollars at the average exchange rates for each quarter of the year. Financial Statement positions are translated at the end-of-yearexchange rates. Translation differences are recognized in a separate component of equity as currency translation adjustments. In the case of a sale or other disposal of any of such subsidiaries, any accumulated translation difference would be recognized in income as a gain or loss from the sale.
E. Property, plant and equipment
Property, plant and equipment are recognized at historical acquisition or construction cost less accumulated depreciation and impairment losses. Historical cost includes expenditure that is directly attributable to the acquisition of the items. Property, plant and equipment acquired through acquisitions accounted for as business combinations have been valued initially at the fair market value of the assets acquired.
Major overhaul and rebuilding expenditures are capitalized as property, plant and equipment only when it is probable that future economic benefits associated with the item will flow to the group and the investment enhances the condition of assets beyond its original condition. The carrying amount of the replaced part is derecognized. Ordinary maintenance expenses on manufacturing properties are recorded as cost of products sold in the year in which they are incurred.
•

82.
Tena
ris
Borrowing costs that are attributable to the acquisition or construction of certain capital assets are capitalized as part of the cost of the asset, in accordance with IAS 23(R) (“Borrowing Costs”). Assets for which borrowing costs are capitalized are those that require a substantial period of time to prepare for their intended use.
Depreciation method is reviewed at each year end. Depreciation is calculated using the straight-line method to depreciate the cost of each asset to its residual value over its estimated useful life, as follows:
Land No Depreciation
Buildings and improvements 30-50 years
Plant and production equipment 10-40 years
Vehicles, furniture and fixtures, and other equipment 4-10 years
The assets’ residual values and useful lives of significant plant and production equipment are reviewed and adjusted, if appropriate, at each year-end date.
Management’s re-estimation of assets useful lives, performed in accordance with IAS 16 (“Property, Plant and Equipment”), did not materially affect depreciation expenses for 2015, 2014 and 2013.
Tenaris depreciates each significant part of an item of property, plant and equipment for its different production facilities that (i) can be properly identified as an independent component with a cost that is significant in relation to the total cost of the item, and (ii) has a useful operating life that is different from another significant part of that same item of property, plant and equipment.
Gains and losses on disposals are determined by comparing the proceeds with the carrying amount
of assets and are recognized under Other operating income or Other operating expenses in the Consolidated Income Statement.
F. Intangible assets
1. Goodwill
Goodwill represents the excess of the acquisition cost over the fair value of Tenaris’ share of net identifiable assets acquired as part of business combinations determined mainly by independent valuations. Goodwill is tested annually for impairment and carried at cost less accumulated impairment losses. Impairment losses on goodwill are not reversed. Goodwill is included in the Consolidated Statement of Financial Position under Intangible assets, net.
For the purpose of impairment testing, goodwill is allocated to a subsidiary or group of subsidiaries that are expected to benefit from the business combination which generated the goodwill being tested.
2. Information systems projects
Costs associated with maintaining computer software programs are generally recognized as an expense as incurred. However, costs directly related to the development, acquisition and implementation of information systems are recognized as intangible assets if it is probable that they have economic benefits exceeding one year. Information systems projects recognized as assets are amortized using the straight-line method over their useful lives, generally not exceeding a period of 3 years. Amortization charges are mainly classified as Selling, general and administrative expenses in the Consolidated Income Statement.

83.
Ann
ual R
epor
t
Management’s re-estimation of assets useful lives, performed in accordance with IAS 38 (“Intangible Assets”), did not materially affect depreciation expenses for 2015, 2014 and 2013.
3. Licenses, patents, trademarks and
proprietary technology
Licenses, patents, trademarks, and proprietary technology acquired in a business combination are initially recognized at fair value at the acquisition date. Licenses, patents, proprietary technology and those trademarks that have a finite useful life are carried at cost less accumulated amortization. Amortization is calculated using the straight-line method to allocate the cost over their estimated useful lives, and does not exceed a period of 10 years.
The balance of acquired trademarks that have indefinite useful lives according to external appraisal amounts to $86.7 million at December 31, 2015 and 2014, included in Hydril CGU. Main factors considered in the determination of the indefinite useful lives, include the years that they have been in service and their recognition among customers in the industry.
Management’s re-estimation of assets useful lives, performed in accordance with IAS 38 (“Intangible Assets”), did not materially affect depreciation expenses for 2015, 2014 and 2013.
4. Research and development
Research expenditures as well as development costs that do not fulfill the criteria for capitalization are recorded as Cost of sales in the Consolidated Income Statement as incurred. Research and development expenditures included in Cost of sales for the years 2015, 2014 and 2013 totaled $89.0 million, $106.9 million and $105.6 million, respectively.
5. Customer relationships
In accordance with IFRS 3 and IAS 38, Tenaris has recognized the value of customer relationships separately from goodwill attributable to the acquisition of Maverick and Hydril groups. Customer relationships acquired in a business combination are recognized at fair value at the acquisition date, have a finite useful life and are carried at cost less accumulated amortization. Amortization is calculated using the straight line method over the expected life of approximately 14 years for Maverick and 10 years for Hydril.
Prudential, a welded pipe mill producing OCTG and line pipe products in Canada, has been negatively affected by current market conditions (including an increase in unfairly traded imports of OCTG and line pipe products), reflected in a loss of market share and in the decline in the level of its profitability. Based on these circumstances, the Company has reviewed the useful life of Prudential’s customer relationships and decided to reduce the remaining amortization period from 5 years to 2 years, consequently a higher amortization charge of approximately $31.2 million was included in Consolidated Income Statement under Selling, general and administrative expenses for the year ended December 31, 2015.
G. Impairment of non-financial assets
Long-lived assets including identifiable intangible assets are reviewed for impairment at the lowest level for which there are separately identifiable cash flows (cash generating units, or CGU). Most of the Company’s principal subsidiaries that constitute a CGU have a single main production facility and, accordingly, each of such subsidiary represents the lowest level of asset aggregation that generates largely independent cash inflows.

84.
Tena
ris
Assets that are subject to amortization are reviewed for impairment whenever events or changes in circumstances indicate that the carrying amount may not be recoverable. Intangible assets with indefinite useful life, including goodwill, are subject to at least an annual impairment test.
In assessing whether there is any indication that a CGU may be impaired, external and internal sources of information are analyzed. Material facts and circumstances specifically considered in the analysis usually include the discount rate used in Tenaris’ cash flow projections and the business condition in terms of competitive and economic factors, such as the cost of raw materials, oil and gas prices, competitive environment, capital expenditure programs for Tenaris’ customers and the evolution of the rig count.
An impairment loss is recognized for the amount by which the asset’s carrying amount exceeds its recoverable amount. The recoverable amount is the higher between the asset’s value in use and fair value less costs to sell. Any impairment loss is allocated to reduce the carrying amount of the assets of the CGU in the following order:
(a) first, to reduce the carrying amount of any goodwill allocated to the CGU; and(b) then, to the other assets of the unit (group of units) pro-rata on the basis of the carrying amount of each asset in the unit (group of units), considering not to reduce the carrying amount of the asset below the highest of its fair value less cost to sell, its value in use or zero.
The value in use of each CGU is determined on the basis of the present value of net future cash flows which would be generated by such CGU.
Tenaris uses cash flow projections for a five year period with a terminal value calculated based on perpetuity and appropriate discount rates.
For purposes of calculating the fair value less costs to sell, Tenaris uses the estimated value of future cash flows that a market participant could generate from the corresponding CGU.
Management judgment is required to estimate discounted future cash flows. Actual cash flows and values could vary significantly from the forecasted future cash flows and related values derived using discounting techniques.
Non-financial assets other than goodwill that suffered an impairment are reviewed for possible reversal at each reporting date.
H. Other investments
Other investments consist primarily of investments in financial instruments and time deposits with a maturity of more than three months at the date of purchase.
Certain non-derivative financial assets that the Company has both the ability and the intention to hold to maturity have been categorized as held to maturity financial assets. They are carried at amortized cost and the results are recognized in “Financial Results” in the Consolidated Income Statement using the effective interest method. Held to maturity instruments with maturities greater than 12 months after the balance sheet date are included in the non-current assets.
All other investments in financial instruments and time deposits are categorized as financial assets

85.
Ann
ual R
epor
t
“at fair value through profit or loss” because such investments are both (i) held for trading and (ii) designated as such upon initial recognition because they are managed and their performance is evaluated on a fair value basis. The results of these investments are recognized in Financial Results in the Consolidated Income Statement.
Purchases and sales of financial investments are recognized as of their settlement date.
The fair values of quoted investments are generally based on current bid prices. If the market for a financial investment is not active or the securities are not listed, Tenaris estimates the fair value by using standard valuation techniques (see Section III Financial Risk Management).
I. Inventories
Inventories are stated at the lower between cost and net realizable value. The cost of finished goods and goods in process is comprised of raw materials, direct labor and utilities (based on FIFO method) and other direct costs and related production overhead costs. It excludes borrowing costs. Tenaris estimates net realizable value of inventories by grouping, where applicable, similar or related items. Net realizable value is the estimated selling price in the ordinary course of business, less any estimated costs of completion and selling expenses. Goods in transit at year end are valued based on supplier’s invoice cost.
Tenaris establishes an allowance for obsolete or slow-moving inventory related to finished goods, supplies and spare parts. For slow moving or obsolete finished products, an allowance is established based on management’s analysis of
product aging. An allowance for obsolete and slow-moving inventory of supplies and spare parts is established based on management's analysis of such items to be used as intended and the consideration of potential obsolescence due to technological changes.
J. Trade and other receivables
Trade and other receivables are recognized initially at fair value, generally the original invoice amount. Tenaris analyzes its trade receivables on a regular basis and, when aware of a specific counterparty’s difficulty or inability to meet its obligations, impairs any amounts due by means of a charge to an allowance for doubtful accounts. For this purpose, trade accounts receivable overdue by more than 180 days and which are not covered by a credit collateral, guarantee, insurance or similar surety, are fully provisioned.
K. Cash and cash equivalents
Cash and cash equivalents are comprised of cash in banks, liquidity funds and short-term investments with a maturity of less than three months at the date of purchase which are readily convertible to known amounts of cash. Assets recorded in cash and cash equivalents are carried at fair market value or at historical cost which approximates fair market value.
In the Consolidated Statement of Financial Position, bank overdrafts are included in Borrowings in current liabilities.
For the purposes of the Consolidated Statement of Cash Flows, cash and cash equivalents includes overdrafts.

86.
Tena
ris
L. Equity
1. Equity components
The Consolidated Statement of Changes in Equity includes:
The value of share capital, legal reserve, share premium and other distributable reserves calculated in accordance with Luxembourg law;The currency translation adjustment, other reserves, retained earnings and non-controlling interest calculated in accordance with IFRS.
2. Share capital
The Company has an authorized share capital of a single class of 2.5 billion shares having a nominal value of $1.00 per share. Total ordinary shares issued and outstanding as of December 31, 2015, 2014 and 2013 are 1,180,536,830 with a par value of $1.00 per share with one vote each. All issued shares are fully paid.
3. Dividends distribution by the Company to
shareholders
Dividends distributions are recorded in the Company’s financial statements when Company’s shareholders have the right to receive the payment, or when interim dividends are approved by the Board of Directors in accordance with the by-laws of the Company.
Dividends may be paid by the Company to the extent that it has distributable retained earnings, calculated in accordance with Luxembourg law (see Note 25).
M. Borrowings
Borrowings are recognized initially at fair value net of transaction costs incurred and subsequently measured at amortized cost.
N. Current and Deferred income tax
The tax expense for the period comprises current and deferred tax. Tax is recognized in the Consolidated Income Statement, except for tax items recognized in the Consolidated Statement of Other Comprehensive Income.
The current income tax charge is calculated on the basis of the tax laws enacted or substantively enacted at the reporting date in the countries where the Company’s subsidiaries operate and generate taxable income. Management periodically evaluates positions taken in tax returns with respect to situations in which applicable tax regulations are subject to interpretation and establishes provisions when appropriate.
Deferred income tax is recognized applying the liability method on temporary differences arising between the tax basis of assets and liabilities and their carrying amounts in the financial statements. The principal temporary differences arise from fair value adjustments of assets acquired in business combinations, the effect of currency translation on depreciable fixed assets and inventories, depreciation on property, plant and equipment, valuation of inventories and provisions for pension plans. Deferred tax assets are also recognized for net operating loss carry-forwards. Deferred tax assets and liabilities are measured at the tax rates that are expected to apply in the time period when the asset is realized or the liability is settled, based on tax laws that have been enacted or substantively enacted at the reporting date.
Deferred tax assets are recognized to the extent it is probable that future taxable income will be available against which the temporary differences can be utilized. At the end of each reporting period, Tenaris reassesses unrecognized deferred tax assets. Tenaris recognizes a previously
•
•

87.
Ann
ual R
epor
t
unrecognized deferred tax asset to the extent that it has become probable that future taxable income will allow the deferred tax asset to be recovered.
O. Employee benefits
1. Post employment benefits
The Company has defined benefit and defined contribution plans. A defined benefit plan is a pension plan that defines an amount of pension benefit that an employee will receive on retirement, usually dependent on one or more factors such as age, years of service and compensation.
The Company applied IAS 19 (amended 2011), “Employee Benefits”, as from January 1, 2013. In accordance with the amended standard, post-employment benefits are accounted as follows.
The liability recognized in the statement of financial position in respect of defined benefit pension plans is the present value of the defined benefit obligation at the end of the reporting period less the fair value of plan assets, if any. The defined benefit obligation is calculated annually (at year end) by independent actuaries using the projected unit credit method. The present value of the defined benefit obligation is determined by discounting the estimated future cash outflows using interest rates of high-quality corporate bonds that are denominated in the currency in which the benefits will be paid, and that have terms to maturity approximating to the terms of the related pension obligation.
Actuarial gains and losses arising from experience adjustments and changes in actuarial assumptions are charged or credited to equity in “Other comprehensive income” in the period in which they arise. Past-service costs are recognized immediately in the income statement.
For defined benefit plans, net interest income/expense is calculated based on the surplus or deficit derived by the difference between the defined benefit obligations less plan assets. For defined contribution plans, the Company pays contributions to publicly or privately administered pension insurance plans on a mandatory, contractual or voluntary basis. The Company has no further payment obligations once the contributions have been paid. The contributions are recognized as employee benefit expense when they are due. Prepaid contributions are recognized as an asset to the extent that a cash refund or a reduction in the future payments is available.
Tenaris sponsors funded and unfunded defined benefit pension plans in certain subsidiaries. The most significant are:
An unfunded defined benefit employee retirement plan for certain senior officers. The plan is designed to provide certain benefits to those officers (additional to those contemplated under applicable labor laws) in case of termination of the employment relationship due to certain specified events, including retirement. This unfunded plan provides defined benefits based on years of service and final average salary.Employees’ service rescission indemnity: the cost of this obligation is charged to the Consolidated Income Statement over the expected service lives of employees. This provision is primarily related to the liability accrued for employees at Tenaris’s Italian subsidiary. As from January 1, 2007 as a consequence of a change in an Italian law, employees were entitled to make contributions to external funds, thus, Tenaris’s Italian subsidiary pays every year the required contribution to the funds with no further obligation. As a result, the plan changed from a defined benefit plan to a defined contribution plan effective from that date, but only limited to the contributions of 2007 onwards.
•
•

88.
Tena
ris
Funded retirement benefit plans held in Canada for salary and hourly employees hired prior a certain date based on years of service and, in the case of salaried employees, final average salary. Plan assets consist primarily of investments in equities and money market funds. Both plans were replaced for defined contribution plans. Effective June 2016 the salary plan will be frozen for the purposes of credited service as well as determination of final average pay.Funded retirement benefit plan held in the US for the benefit of some employees hired prior a certain date, frozen for the purposes of credited service as well as determination of final average pay for the retirement benefit calculation. Plan assets consist primarily of investments in equities and money market funds. Additionally, an unfunded postretirement health and life plan that offers limited medical and life insurance benefits to the retirees, hired before a certain date.
2. Other long term benefits
During 2007, Tenaris launched an employee retention and long term incentive program (the “Program”) applicable to certain senior officers and employees of the Company, who will be granted a number of Units throughout the duration of the Program. The value of each of these Units is based on Tenaris’ shareholders’ equity (excluding non-controlling interest). Also, the beneficiaries of the Program are entitled to receive cash amounts based on (i) the amount of dividend payments made by Tenaris to its shareholders, and (ii) the number of Units held by each beneficiary to the Program. Units vest ratably over a period of four years and will be redeemed by the Company ten years after grant date, with the option of an early redemption at seven years after grant date. As the cash payment of the benefit is
tied to the book value of the shares, and not to their market value, Tenaris valued this long-term incentive program as a long term benefit plan as classified in IAS 19.
As of December 31, 2015 and 2014, the outstanding liability corresponding to the Program amounts to $84.0 million and $98.1 million, respectively. The total value of the units granted to date under the program, considering the number of units and the book value per share as of December 31, 2015 and 2014, is $105.3 million and $107.4 million, respectively.
3. Other compensation obligations
Employee entitlements to annual leave and long-service leave are accrued as earned.
Compensation to employees in the event of dismissal is charged to income in the year in which it becomes payable.
P. Provisions
Tenaris is subject to various claims, lawsuits and other legal proceedings, including customer claims, in which a third party is seeking payment for alleged damages, reimbursement for losses or indemnity. Tenaris’ potential liability with respect to such claims, lawsuits and other legal proceedings cannot be estimated with certainty. Management periodically reviews the status of each significant matter and assesses potential financial exposure. If, as a result of past events, a potential loss from a claim or proceeding is considered probable and the amount can be reasonably estimated, a provision is recorded. Accruals for loss contingencies reflect a reasonable estimate of the losses to be incurred based on
•
•

89.
Ann
ual R
epor
t
information available to management as of the date of preparation of the financial statements, and take into consideration Tenaris’ litigation and settlement strategies. These estimates are primarily constructed with the assistance of legal counsel. As the scope of liabilities become better defined, there may be changes in the estimates of future costs which could have a material adverse effect on its results of operations, financial condition and cash flows.
If Tenaris expects to be reimbursed for an accrued expense, as would be the case for an expense or loss covered under an insurance contract, and reimbursement is considered virtually certain, the expected reimbursement is recognized as a receivable.
Q. Trade payables
Trade payables are recognized initially at fair value, generally the nominal invoice amount.
R. Revenue recognition
Revenue comprises the fair value of the consideration received or receivable for the sale of goods and services in the ordinary course of Tenaris’ activities. Revenue is shown net of value-added tax, returns, rebates and discounts and after eliminating sales within the group.
Tenaris’ products and services are sold based upon purchase orders, contracts or upon other persuasive evidence of an arrangement with customers, including that the sales price is known or determinable. Sales are recognized as revenue upon delivery, when neither continuing managerial involvement nor effective control over the products is retained by Tenaris and when collection is
reasonably assured. Delivery is defined by the transfer of risk and may include delivery to a storage facility located at one of the Company’s subsidiaries. For bill and hold transactions revenue is recognized only to the extent (a) it is highly probable delivery will be made; (b) the products have been specifically identified and are ready for delivery; (c) the sales contract specifically acknowledges the deferred delivery instructions; (d) the usual payment terms apply.
The percentage of total sales that were generated from bill and hold arrangements for products located in Tenaris’ storage facilities that have not been shipped to customers amounted to 2.9%, 1.1% and 1.3% as of December 31, 2015, 2014 and 2013, respectively. The Company has not experienced any material claims requesting the cancellation of bill and hold transactions.
Other revenues earned by Tenaris are recognized on the following basis:
Construction contracts (mainly applicable to Tenaris Brazilian subsidiaries and amounted to 1.55% of total sales). The revenue recognition of the contracts follows the IAS 11 guidance, that means, when the outcome of a construction contract can be estimated reliably and it is probable that the contract will be profitable, contract revenue is recognized over the period of the contract by reference to the stage of completion (measured by reference to the contract costs incurred up to the end of the reporting period as a percentage of total estimated costs for each contract). Interest income: on the effective yield basis. Dividend income from investments in other companies: when Tenaris’ right to receive payment is established.
•
••

90.
Tena
ris
S. Cost of sales and sales expenses
Cost of sales and sales expenses are recognized in the Consolidated Income Statement on the accrual basis of accounting.
Commissions, freight and other selling expenses, including shipping and handling costs, are recorded in “Selling, general and administrative expenses” in the Consolidated Income Statement.
T. Earnings per share
Earnings per share are calculated by dividing the income attributable to owners of the parent by the daily weighted average number of common shares outstanding during the year.
U. Financial instruments
Non derivative financial instruments comprise investments in financial debt instruments and equity, time deposits, trade and other receivables, cash and cash equivalents, borrowings and trade and other payables. Tenaris’ non derivative financial instruments are classified into the following categories:
Financial instruments at fair value through profit and loss: comprise mainly Other Investments
expiring in less than ninety days from the measurement date (included within cash and cash equivalents) and investments in certain financial debt instruments and time deposits held for trading. Loans and receivables: comprise cash and cash equivalents, trade receivables and other receivables and are measured at amortized cost using the effective interest rate method less any impairment.Available for sale assets: comprise the Company’s interest in the Venezuelan Companies (see Note 30).Held to maturity: comprise financial assets that the Company has both the ability and the intention to hold to maturity. They are measured at amortized cost using the effective interest method.Other financial liabilities: comprise borrowings, trade and other payables and are measured at amortized cost using the effective interest rate method.
The categorization depends on the nature and purpose that the Company sets to the financial instrument.
Financial assets and liabilities are recognized and derecognized on their settlement date.
Accounting for derivative financial instruments and hedging activities is included within the Section III, Financial Risk Management.
•
•
•
•
•

91.
Ann
ual R
epor
t
The multinational nature of Tenaris’ operations and customer base exposes the Company to a variety of risks, mainly related to market risks (including the effects of changes in foreign currency exchange rates and interest rates), credit risk and capital market risk. In order to manage the volatility related to these exposures, the management evaluates exposures on a consolidated basis, taking advantage of logical exposure netting. The Company or its subsidiaries may then enter into various derivative transactions in order to prevent potential adverse impacts on Tenaris’ financial performance. Such derivative transactions are executed in accordance with internal policies and hedging practices. The Company’s objectives, policies and processes for managing these risks remained unchanged during 2015.
A. Financial risk factors
I. Capital Market Risk
Tenaris seeks to maintain a low debt to total equity ratio considering the industry and the markets where it operates. The year-end ratio of debt to total equity (where “debt” comprises financial borrowings and “total equity” is the sum of financial borrowings and equity) is 0.08 as of December 31, 2015 and 0.07 as of December 31, 2014. The Company does not have to comply with regulatory capital adequacy requirements as known in the financial services industry.
II. Foreign exchange risk
Tenaris manufactures and sells its products in a number of countries throughout the world and consequently is exposed to foreign exchange rate risk. Since the Company’s functional currency is the U.S. dollar the purpose of Tenaris’ foreign currency hedging program is mainly to reduce the risk caused by changes in the exchange rates of other currencies against the U.S. dollar.
Tenaris’ exposure to currency fluctuations is reviewed on a periodic consolidated basis. A number of derivative transactions are performed in order to achieve an efficient coverage in the absence of operative or natural hedges. Almost all of these transactions are forward exchange rates contracts (see Note 24 Derivative financial instruments).
Tenaris does not enter into derivative financial instruments for trading or other speculative purposes, other than non-material investments in structured products.
Because certain subsidiaries have functional currencies other than the U.S. dollar, the results of hedging activities, reported in accordance with IFRS, may not reflect entirely the management’s assessment of its foreign exchange risk hedging program. Inter-company balances between Tenaris’ subsidiaries may generate financial gains (losses) to the extent that functional currencies differ.
III. Financial risk management

92.
Tena
ris
The value of Tenaris’ financial assets and liabilities is subject to changes arising out of the variation of foreign currency exchange rates. The following table provides a breakdown of Tenaris’ main financial assets and liabilities (including foreign exchange derivative contracts) which impact the Company’s profit and loss as of December 31, 2015 and 2014:
The main relevant exposures correspond to:
Argentine Peso / U.S. dollarAs of December 31, 2015 and 2014 consisting primarily of Argentine Peso-denominated financial, trade, social and fiscal payables at certain Argentine subsidiaries which functional currency is the U.S. dollar. A change of 1% in the ARS/USD exchange rate would have generated a pre-tax gain / loss of $0.7 million and $1.9 million as of December 31, 2015 and 2014, respectively.
Euro / U.S. dollarAs of December 31, 2015 and 2014, consisting primarily of Euro-denominated intercompany liabilities at certain subsidiaries which functional currency is the U.S. dollar. A change of 1% in the
EUR/USD exchange rate would have generated a pre-tax gain / loss of $3.3 million and $1.9 million as of December 31, 2015 and 2014, respectively, which would have been to a large extent offset by changes to Tenaris’ net equity position.
Considering the balances held as of December 31, 2015 on financial assets and liabilities exposed to foreign exchange rate fluctuations, Tenaris estimates that the impact of a simultaneous 1% favorable / unfavorable movement in the levels of foreign currencies exchange rates relative to the U.S. dollar, would be a pre-tax gain / loss of $5.1 million (including a loss / gain of $5.3 million due to foreign exchange derivative contracts), which would be partially offset by changes to Tenaris’ net equity position of $3.9 million. For balances held as of December 31, 2014, a simultaneous 1% favorable / unfavorable movement in the foreign currencies exchange rates relative to the U.S. dollar, would have generated a pre-tax gain / loss of $7.5 million (including a loss / gain of $2.8 million due to foreign exchange derivative contracts), which would have been partially offset by changes to Tenaris’ net equity position of $1.8 million.
III. Interest rate risk
Tenaris is subject to interest rate risk on its investment portfolio and its debt. The Company uses a mix of variable and fixed rate debt in combination with its investment portfolio strategy. From time to time, the Company may choose to enter into foreign exchange derivative contracts and / or interest rate swaps to mitigate the exposure to changes in the interest rates.
(191,095)
(189,366)
150,486
All amounts Long / (Short) in thousands of U.S.dollars
AS OF DECEMBER 31
Argentine Peso / U.S. dollar
Euro / U.S. dollar
Brazilian Real / U.S. dollar
CURRENCY EXPOSURE / FUNCTIONAL CURRENCY
(73,399)
(334,831)
(66,826)
2015 2014

93.
Ann
ual R
epor
t
The following table summarizes the proportions of variable-rate and fixed-rate debt as of each year end.
The Company estimates that, if market interest rates applicable to Tenaris’ borrowings had been 100 basis points higher, then the additional pre-tax loss would have been $10.8 million in 2015 and $6.3 million in 2014.
IV. Credit risk
Credit risk arises from cash and cash equivalents, deposits with banks and financial institutions, as well as credit exposures to customers, including outstanding receivables and committed transactions. The Company also actively monitors the creditworthiness of its treasury, derivative and insurance counterparties in order to minimize its credit risk.
There is no significant concentration of credit risk from customers. No single customer comprised more than 10% of Tenaris’ net sales in 2015, 2014 and 2013.
Tenaris’ credit policies related to sales of products and services are designed to identify customers with acceptable credit history, and to allow Tenaris to require the use of credit insurance, letters of credit and other instruments designed to minimize credit risks whenever deemed necessary. Tenaris maintains allowances for impairment for potential credit losses (See Section II J).
As of December 31, 2015 and 2014 trade receivables amount to $1,135.1 million and $1,963.4 million respectively. Trade receivables have guarantees under credit insurance of $325.1 million and $460.5 million, letter of credit and other bank guarantees of $20.5 million and $98.4 million, and other guarantees of $7.9 million and $12.3 million as of December 31, 2015 and 2014 respectively.
As of December 31, 2015 and 2014 past due trade receivables amounted to $333.8 million and
AS OF DECEMBER 31
Fixed rate (short term financing)
Variable rate
Total (*)
Percentage
98%
2%
2015
Amount in thousands of
U.S. dollars
954,681
16,835
971,516
Amount in thousands of
U.S. dollars
755,498
243,742
999,240
Percentage
76%
24%
2014
(*) As of December 31, 2015 approximately 59% of the total debt balance corresponded to fixed-rate borrowings where the original period was nonetheless equal to or less than 360 days. This compares to approximately 73% of the total outstanding debt balance as of December 31, 2014.

94.
Tena
ris
$350.1 million, respectively. Out of those amounts $84.9 million and $75.8 million are guaranteed trade receivables while $101.5 million and $69.0 million are included in the allowance for doubtful accounts. Past due receivable not provisioned relate to a number of customers for whom there is no recent history of default. The allowance for doubtful accounts and the existing guarantees are sufficient to cover doubtful trade receivables.
V. Counterparty risk
Tenaris has investment guidelines with specific parameters to limit issuer risk on marketable securities. Counterparties for derivatives and cash transactions are limited to high credit quality financial institutions, normally investment grade.
Approximately 92% of Tenaris’ liquid financial assets correspond to Investment Grade-rated instruments as of December 31, 2015, in comparison with approximately 89% as of December 31, 2014. VI. Liquidity risk
Tenaris financing strategy aims to maintain adequate financial resources and access to additional liquidity. During 2015, Tenaris has counted on cash flows from operations as well as additional bank financing to fund its transactions.
Management maintains sufficient cash and marketable securities to finance normal operations and believes that Tenaris also has appropriate access to market for short-term working capital needs.
Liquid financial assets as a whole (comprising cash and cash equivalents and other investments) were 19% of total assets at the end of 2015 compared to 14% at the end of 2014.
Tenaris has a conservative approach to the management of its liquidity, which consists of cash in banks, liquidity funds and short-term investments mainly with a maturity of less than three months at the date of purchase.
Tenaris holds primarily investments in money market funds and variable or fixed-rate securities from investment grade issuers. As of December 31, 2015 and 2014, Tenaris does not have direct exposure to financial instruments issued by European sovereign counterparties.
Tenaris holds its investments primarily in U.S. dollars. As of December 31, 2015 and 2014, U.S. dollar denominated liquid assets represented approximately 87% and 83% of total liquid financial assets respectively.
VII. Commodity price risk
In the ordinary course of its operations, Tenaris purchases commodities and raw materials that are subject to price volatility caused by supply conditions, political and economic variables and other factors. As a consequence, Tenaris is exposed to risk resulting from fluctuations in the prices of these commodities and raw materials. Tenaris fixes the prices of such raw materials and commodities for short-term periods, typically not in excess of one year, in general Tenaris does not hedge this risk.

95.
Ann
ual R
epor
t
B. Financial instruments by category
Accounting policies for financial instruments have been applied to the line items below:
DECEMBER 31, 2015
ASSETS AS PER STATEMENT OF FINANCIAL POSITION
Derivative financial instruments
Trade receivables
Other receivables
Available for sale assets (See note 30)
Other investments
Cash and cash equivalents
Total
DECEMBER 31, 2015
LIABILITIES AS PER STATEMENT OF FINANCIAL POSITION
Borrowings
Derivative financial instruments
Trade and other payables
Total
Loans and
receivables
–
1,135,129
131,896
–
–
101,019
1,368,044
Available for
sale
–
–
–
21,572
–
–
21,572
Other financial liabilities
971,516
–
518,714
1,490,230
Held to
maturity
–
–
–
–
393,084
–
393,084
Assets at fair value through profit and loss
18,248
–
–
–
2,142,524
185,528
2,346,300
Liabilities at fair value
through profit and loss
–
34,540
–
34,540
Total
18,248
1,135,129
131,896
21,572
2,535,608
286,547
4,129,000
Total
971,516
34,540
518,714
1,524,770

96.
Tena
ris
C. Fair value hierarchy
IFRS 13 requires for financial instruments that are measured in the statement of financial position at fair value, a disclosure of fair value measurements by level according to the following fair value measurement hierarchy:
Level 1 - Quoted prices (unadjusted) in active markets for identical assets or liabilities.
Level 2 - Inputs other than quoted prices included within Level 1 that are observable for the asset or liability, either directly (that is, as prices) or indirectly (that is, derived from prices).
Level 3 - Inputs for the asset or liability that are not based on observable market data (that is, unobservable inputs).
DECEMBER 31, 2014
ASSETS AS PER STATEMENT OF FINANCIAL POSITION
Derivative financial instruments
Trade receivables
Other receivables
Available for sale assets (See note 30)
Other investments
Cash and cash equivalents
Total
DECEMBER 31, 2014
LIABILITIES AS PER STATEMENT OF FINANCIAL POSITION
Borrowings
Derivative financial instruments
Trade and other payables
Total
Loans and
receivables
–
1,963,394
172,190
–
–
120,772
2,256,356
Available for
sale
–
–
–
21,572
387,759
–
409,331
Other financial liabilities
999,240
–
866,688
1,865,928
Assets at fair value through profit and loss
25,588
–
–
–
1,452,159
296,873
1,774,620
Liabilities at fair value
through profit and loss
–
56,834
–
56,834
Total
25,588
1,963,394
172,190
21,572
1,839,918
417,645
4,440,307
Total
999,240
56,834
866,688
1,922,762

97.
Ann
ual R
epor
t
The following table presents the assets and liabilities that are measured at fair value as of December 31, 2015 and 2014.
(*) For further detail regarding Available for sale assets, see Note 30.
DECEMBER 31, 2015
ASSETS
Cash and cash equivalents
Other investments
Derivatives financial instruments
Available for sale assets (*)
Total
LIABILITIES
Derivatives financial instruments
Total
DECEMBER 31, 2014
ASSETS
Cash and cash equivalents
Other investments
Derivatives financial instruments
Available for sale assets (*)
Total
LIABILITIES
Derivatives financial instruments
Total
Level 2
–
792,593
18,250
–
810,843
34,540
34,540
Level 2
–
560,914
25,588
–
586,502
56,834
56,834
Level 3 (*)
–
1,662
–
21,572
23,234
–
–
Level 3 (*)
–
1,539
–
21,572
23,111
–
–
Level 1
185,528
1,348,269
–
–
1,533,797
–
–
Level 1
296,873
1,277,465
–
–
1,574,338
–
–
Total
185,528
2,142,524
18,250
21,572
2,367,874
34,540
34,540
Total
296,873
1,839,918
25,588
21,572
2,183,951
56,834
56,834

98.
Tena
ris
There were no transfers between Level 1 and 2 during the period.
The fair value of financial instruments traded in active markets is based on quoted market prices at the reporting date. A market is regarded as active if quoted prices are readily and regularly available from an exchange, dealer, broker, industry group, pricing service, or regulatory agency, and those prices represent actual and regularly occurring market transactions on an arm’s length basis. The quoted market price used for financial assets held by Tenaris is the current bid price. These instruments are included in Level 1 and comprise primarily corporate and sovereign debt securities.
The fair value of financial instruments that are not traded in an active market (such as certain debt securities, certificates of deposits with original maturity of more than three months, forward and interest rate derivative instruments) is determined by using valuation techniques which maximize
the use of observable market data when available and rely as little as possible on entity specific estimates. If all significant inputs required to value an instrument are observable, the instrument is included in Level 2. Tenaris values its assets and liabilities included in this level using bid prices, interest rate curves, broker quotations, current exchange rates, forward rates and implied volatilities obtained from market contributors as of the valuation date.
If one or more of the significant inputs are not based on observable market data, the instruments are included in Level 3. Tenaris values its assets and liabilities in this level using observable market inputs and management assumptions which reflect the Company’s best estimate on how market participants would price the asset or liability at measurement date. Main balances included in this level correspond to Available for sale assets related to Tenaris’ interest in Venezuelan companies under process of nationalization (see Note 30).

99.
Ann
ual R
epor
t
D. Fair value estimation
Financial assets or liabilities classified as assets at fair value through profit or loss are measured under the framework established by the IASB accounting guidance for fair value measurements and disclosures.
The fair values of quoted investments are generally based on current bid prices. If the market for a financial asset is not active or no market is available, fair values are established using standard valuation techniques.
The following table presents the changes in Level 3 assets and liabilities:
Some of Tenaris investments are designated as held to maturity and measured at amortized cost. Tenaris estimates that the fair value of these financial assets is 99% of its carrying amount including interests accrued as of December 31, 2015.
The fair value of all outstanding derivatives is determined using specific pricing models that include inputs that are observable in the market or can be derived from or corroborated by observable data. The fair value of forward foreign exchange contracts is calculated as the net present value of
Assets / Liabilities
YEAR ENDED DECEMBER 31
At the beginning of the period
Currency translation adjustment and others
At the end of the year
2015
23,111
123
23,234
2014
24,070
(959)
23,111

100.
Tena
ris
the estimated future cash flows in each currency, based on observable yield curves, converted into U.S. dollars at the spot rate of the valuation date.
Borrowings are comprised primarily of fixed rate debt and variable rate debt with a short term portion where interest has already been fixed. They are classified under other financial liabilities and measured at their amortized cost. Tenaris estimates that the fair value of its main financial liabilities is approximately 99% of its carrying amount including interests accrued in 2015 as compared with 100% in 2014. Fair values were calculated using standard valuation techniques for floating rate instruments and comparable market rates for discounting flows.
E. Accounting for derivative financial instruments
and hedging activities
Derivative financial instruments are initially recognized in the statement of financial position at fair value through profit and loss on each date a derivative contract is entered into and are subsequently remeasured at fair value. Specific tools are used for calculation of each instrument’s
fair value and these tools are tested for consistency on a monthly basis. Market rates are used for all pricing operations. These include exchange rates, deposit rates and other discount rates matching the nature of each underlying risk.
As a general rule, Tenaris recognizes the full amount related to the change in fair value of derivative financial instruments in Financial results in the Consolidated Income Statement.
Tenaris designates certain derivatives as hedges of particular risks associated with recognized assets or liabilities or highly probable forecast transactions. These transactions (mainly currency forward contracts on highly probable forecast transactions) are classified as cash flow hedges. The effective portion of the fair value of derivatives that are designated and qualify as cash flow hedges is recognized in equity. Amounts accumulated in equity are then recognized in the income statement in the same period than the offsetting losses and gains on the hedged item. The gain or loss relating to the ineffective portion is recognized immediately in the income statement. The fair value of Tenaris’ derivative financial instruments (assets or liabilities)

101.
Ann
ual R
epor
t
continues to be reflected in the statement of financial position. The full fair value of a hedging derivative is classified as a current or non current asset or liability according to its expiry date.
For transactions designated and qualifying for hedge accounting, Tenaris documents at the inception of the transaction the relationship between hedging instruments and hedged items, as well as its risk management objectives and strategy for undertaking various hedge transactions. Tenaris also documents its assessment on an ongoing basis, of whether the derivatives that are used in hedging transactions are highly effective in offsetting changes in the fair value or cash flow of hedged items. At December 31, 2015 and 2014, the effective portion of designated cash flow hedges which is included in “Other Reserves” in equity amounts to $2.8 million credit and $7.9 million debit (see Note 24 Derivative financial instruments).
The fair values of various derivative instruments used for hedging purposes are disclosed in Note 24. Movements in the hedging reserve included within “Other Reserves” in equity are also shown in Note 24.

102.
Tena
ris
IV. Other notes to the Consolidated financial statements
1. Segment information
Reportable operating segments
(In the notes all amounts are shown in thousands of U.S. dollars, unless otherwise stated)
YEAR ENDED DECEMBER 31, 2015
IFRS - Net Sales
MANAGEMENT VIEW
Operating income
Differences in cost of sales and others
Differences in impairment / Depreciation and amortization
IFRS - Operating income
Financial income (expense), net
Income before equity in earnings of non-consolidated companies and income tax
Equity in losses of non-consolidated companies
Income before income tax
Capital expenditures
Depreciation and amortization
Total
7,100,753
752,301
(238,742)
(318,131)
195,428
14,210
209,638
(39,558)
170,080
1,131,519
658,778
Other
656,939
66,431
(9,794)
1,162
57,799
42,618
20,322
Tubes
6,443,814
685,870
(228,948)
(319,293)
137,629
1,088,901
638,456
All amounts in thousands of U.S. dollars
As mentioned in section II. AP – C, the Segment Information is disclosed as follows:

103.
Ann
ual R
epor
t
Transactions between segments, which were eliminated in consolidation, mainly related to sales of scrap, energy, surplus raw materials and others from the Other segment to the Tubes segment for $57,468, $233,863 and $276,388 in 2015, 2014 and 2013, respectively.
Net income under Management view amounted to $18.2 million, while under IFRS amounted to $74.4 million loss. In addition to the amounts reconciled above, the main differences arise from the impact of functional currencies on financial result, deferred income taxes as well as the result of investment in non-consolidated companies and changes on the valuation of inventories according to cost estimation internally defined.
YEAR ENDED DECEMBER 31, 2014
IFRS - Net Sales
MANAGEMENT VIEW
Operating income
Differences in cost of sales and others
Depreciation and amortization/Impairment
IFRS - Operating income
Financial income (expense), net
Income before equity in earnings of non-consolidated companies and income tax
Equity in losses of non-consolidated companies
Income before income tax
Capital expenditures
Depreciation and amortization
YEAR ENDED DECEMBER 31, 2013
IFRS - Net Sales
MANAGEMENT VIEW
Operating income
Differences in cost of sales and others
Depreciation and amortization
IFRS - Operating income
Financial income (expense), net
Income before equity in earnings of non-consolidated companies and income tax
Equity in earnings of non-consolidated companies
Income before income tax
Capital expenditures
Depreciation and amortization
Total
10,337,962
2,050,164
(30,266)
(121,082)
1,898,816
33,037
1,931,853
(164,616)
1,767,237
1,089,373
615,629
Total
10,596,781
2,189,425
(5,192)
597
2,184,830
(28,679)
2,156,151
46,098
2,202,249
753,498
610,054
Tubes
9,581,615
2,022,429
(35,463)
(121,289)
1,865,677
1,051,148
593,671
Tubes
9,812,295
2,098,160
(1,855)
711
2,097,016
721,869
589,482
Other
756,347
27,735
5,197
207
33,139
38,225
21,958
Other
784,486
91,265
(3,337)
(114)
87,814
31,629
20,572
All amounts in thousands of U.S. dollars

104.
Tena
ris
Geographical information
There are no revenues from external customers attributable to the Company’s country of incorporation (Luxembourg). For geographical information purposes, “North America” comprises Canada, Mexico and the USA (27.4%); “South America” comprises principally Argentina (18.8%), Brazil and Colombia; “Europe” comprises principally Italy, Norway and Romania; “Middle East and Africa” comprises principally Angola, Nigeria and Saudi Arabia and; “Far East and Oceania” comprises principally China, Japan and Indonesia.
(*) Includes Investments in non-consolidated companies and Available for sale assets for $21.6 million in 2015, 2014 and 2013 (see Note 12 and 30).
YEAR ENDED DECEMBER 31, 2015
Net sales
Total assets
Trade receivables
Property, plant and
equipment, net
Capital expenditures
Depreciation and amortization
YEAR ENDED DECEMBER 31, 2014
Net sales
Total assets
Trade receivables
Property, plant and
equipment, net
Capital expenditures
Depreciation and amortization
YEAR ENDED DECEMBER 31, 2013
Net sales
Total assets
Trade receivables
Property, plant and
equipment, net
Capital expenditures
Depreciation and amortization
Middle East & Africa
1,096,688
429,317
137,278
86,181
36,867
9,912
1,843,778
598,175
340,880
60,354
10,891
10,154
2,119,896
562,206
373,844
59,196
5,048
10,594
Far East & Oceania
276,675
423,479
52,494
155,299
20,566
19,716
411,919
498,694
74,993
158,995
18,003
20,159
519,948
592,065
124,550
163,140
28,222
21,440
Unallocated (*)
–
512,217
–
–
–
–
–
665,202
–
–
–
–
–
934,330
–
–
–
–
Total
7,100,753
14,886,974
1,135,129
5,672,258
1,131,519
658,778
10,337,962
16,510,678
1,963,394
5,159,557
1,089,373
615,629
10,596,781
15,930,970
1,982,979
4,673,767
753,498
610,054
South America
2,133,534
2,931,297
396,834
1,269,995
168,140
125,754
2,125,984
3,340,973
554,542
1,303,162
338,995
120,905
2,586,496
3,150,000
506,044
1,098,733
283,265
110,496
North America
2,865,041
8,713,235
367,439
3,253,317
823,602
390,654
4,977,239
9,550,349
733,864
2,953,763
610,252
345,185
4,412,263
8,130,812
613,735
2,292,811
285,413
327,344
Europe
728,815
1,877,429
181,084
907,466
82,344
112,742
979,042
1,857,285
259,115
683,283
111,232
119,226
958,178
2,561,557
364,806
1,059,887
151,550
140,180
All amounts in thousands of U.S. dollars

105.
Ann
ual R
epor
t
2. Cost of sales
For the year ended December 2015, labor cost includes approximately $104 million of severance indemnities related to the adjustment of the workforce to current market conditions.
YEAR ENDED DECEMBER 31
INVENTORIES AT THE BEGINNING OF THE YEAR
PLUS: CHARGES OF THE PERIOD
Raw materials, energy, consumables and other
Increase in inventory due to business combinations
Services and fees
Labor cost
Depreciation of property, plant and equipment
Amortization of intangible assets
Maintenance expenses
Allowance for obsolescence
Taxes
Other
LESS: INVENTORIES AT THE END OF THE YEAR
2014
2,702,647
3,944,283
4,338
453,818
1,204,720
366,932
17,324
217,694
4,704
20,024
130,845
6,364,682
(2,779,869)
6,287,460
2015
2,779,869
1,934,209
–
298,470
947,997
377,596
24,100
184,053
68,669
21,523
92,059
3,948,676
(1,843,467)
4,885,078
2013
2,985,805
3,749,921
–
422,142
1,199,351
368,507
8,263
202,338
70,970
4,956
147,180
6,173,628
(2,702,647)
6,456,786
All amounts in thousands of U.S. dollars

106.
Tena
ris
3. Selling, general and administrative expenses
YEAR ENDED DECEMBER 31
Services and fees
Labor cost
Depreciation of property, plant and equipment
Amortization of intangible assets
Commissions, freight and other selling expenses
Provisions for contingencies
Allowances for doubtful accounts
Taxes
Other
2014
178,700
594,660
20,197
211,176
598,138
35,557
21,704
165,675
138,145
1,963,952
2015
158,541
579,360
18,543
238,539
351,657
19,672
36,788
129,018
92,157
1,624,275
2013
177,996
575,588
19,132
214,152
600,239
31,429
23,236
170,659
128,782
1,941,213
All amounts in thousands of U.S. dollars
For the year ended December 2015, labor cost includes approximately $73 million of severance indemnities related to the adjustment of the workforce to current market conditions.

107.
Ann
ual R
epor
t
4. Labor costs
(included in Cost of sales and in Selling, general and administrative expenses)
YEAR ENDED DECEMBER 31
Wages, salaries and social security costs
Employees' service rescission indemnity (including those classified as defined contribution plans)
Pension benefits - defined benefit plans
Employee retention and long term incentive program
2014
1,743,253
17,431
18,645
20,051
1,799,380
2015
1,504,918
13,286
14,813
(5,660)
1,527,357
2013
1,714,471
10,978
32,112
17,378
1,774,939
All amounts in thousands of U.S. dollars
At the year-end, the number of employees was 21,741 in 2015, 27,816 in 2014 and 26,825 in 2013.
The following table shows the geographical distribution of the employees:
COUNTRY
Argentina
Mexico
Brazil
USA
Italy
Romania
Canada
Indonesia
Colombia
Japan
Other
2014
6,421
5,518
3,835
3,549
2,352
1,725
1,225
677
614
588
1,312
27,816
2015
5,388
5,101
2,050
2,190
2,030
1,624
546
532
636
508
1,136
21,741
2013
6,379
5,290
3,309
3,449
2,352
1,637
1,280
711
627
565
1,226
26,825

108.
Tena
ris
5. Other operating income and expenses
YEAR ENDED DECEMBER 31
(I) OTHER OPERATING INCOME
Net income from other sales
Net rents
Other
(II) OTHER OPERATING EXPENSES
Contributions to welfare projects and non-profits organizations
Provisions for legal claims and contingencies
Loss on fixed assets and material supplies disposed / scrapped
Impairment charge
Allowance for doubtful receivables
Other
2014
8,843
4,041
14,971
27,855
9,961
(760)
203
205,849
336
–
215,589
2015
7,480
6,462
661
14,603
9,052
1
94
400,314
1,114
–
410,575
2013
10,663
3,494
148
14,305
21,147
(2)
39
–
1,708
5,365
28,257
All amounts in thousands of U.S. dollars

109.
Ann
ual R
epor
t
Impairment charge
Tenaris’ main source of revenue is the sale of products and services to the oil and gas industry, and the level of such sales is sensitive to international oil and gas prices and their impact on drilling activities.
A continuous decline in oil prices and futures resulted in reductions in Tenaris customers` investments. Drilling activity and demand of products and services, particularly in North America, continues to decline. Selling prices of products in North America were also affected by high levels of unfairly traded imported products (including the accumulation of excess inventories of imported products).
Tenaris regularly conducts assessments of the carrying values of its assets. The value-in-use was used to determine the recoverable value. Value-in-use is calculated by discounting the estimated cash flows over a five year period based on forecasts approved by management. For the subsequent years beyond the five-year period, a terminal value is calculated based on perpetuity considering a nominal growth rate of 2%. The growth rate considers the long-term average growth rate for the oil and gas industry, the higher demand to offset depletion of existing fields and the Company’s expected market penetration.
The main key assumptions, used in estimating the value in use are oil and natural gas prices evolution, the level of drilling activity and Tenaris’ market share.
For purposes of assessing key assumptions, Tenaris uses external sources of information and management judgment based on past experience.
The discount rates used are based on the respective weighted average cost of capital (WACC) which is considered to be a good indicator of capital cost. For each CGU where assets are allocated, a specific WACC was determined taking into account the industry, country and size of the business. In 2015, the main discount rates used were in a range between 9% and 13%.
During the third quarter 2015 and as a result of the deterioration of business conditions for its welded pipe assets in the United States, Tenaris decided to write down the goodwill value on these assets recording an impairment charge of $400.3 million. Consequently, the carrying value of the assets impaired was as follows:
All amounts in thousands of U.S. dollars
Impairment
(400,314)
Assets before impairment
1,382,993
Assets after impairment
982,679OCTG - USA

110.
Tena
ris
The main factors that could result in additional impairment charges in future periods would be an increase in the discount rate / decrease in growth rate used in the Company’s cash flow projections and a further deterioration of the business, competitive and economic factors, such as the oil and gas prices, capital expenditure program of Tenaris’ clients, the evolution of the rig count, the competitive environment and the cost of raw materials.
As of December 31, 2015 for the OCTG – USA CGU an increase of 100 Bps in the discount rate, a decline of 100 Bps in the growth rate or a decline of 5% in the cash flow projections, would not generate a material effect on the carrying amount of the CGU as of that date.
Following the requirements of IAS 36, Tenaris has determined the CGU for which a reasonable possible change in a key assumptions would cause the CGU’s carrying amount to exceed its recoverable amount. For Tubocaribe an increase of 100 Bps in the discount rate would generate an impairment of $32 million; a decline of 100 Bps in the growth rate would generate an impairment of $19 million; and a decline of 5% in the cash flow projections would generate an impairment of $14 million.
At December 31, 2014, the Company recorded an impairment charge over its welded pipe assets in Colombia and Canada. The carrying value of the assets impaired (i.e., property, plant and equipment and intangible assets) was as follows:
All amounts in thousands of U.S. dollars
Tubocaribe – Colombia
Prudential – Canada
Total
Impairment
(174,239)
(31,610)
(205,849)
Assets before
impairment
255,060
261,497
516,557
Assets after
impairment
80,821
229,887
310,708

111.
Ann
ual R
epor
t
6. Financial results
YEAR ENDED DECEMBER 31
Interest Income
Interest from available-for-sale financial assets
Net result on changes in FV of financial assets at FVTPL
Net result on available-for-sale financial assets
Finance Income
Finance Cost
Net foreign exchange transactions results
Foreign exchange derivatives contracts results
Other
Other financial results
Net financial results
2014
34,582
4,992
(1,478)
115
38,211
(44,388)
50,298
(4,733)
(6,351)
39,214
33,037
2015
39,516
–
(4,942)
–
34,574
(23,058)
(13,301)
30,468
(14,473)
2,694
14,210
2013
34,046
191
540
(10)
34,767
(70,450)
37,179
4,414
(34,589)
7,004
(28,679)
All amounts in thousands of U.S. dollars
During the period Tenaris has derecognized all its fixed income financial instruments categorized as available for sale. Following is an evolution of the available for sale financial assets reserve in Other Comprehensive Income.
Available for sale
Total Available for sale reserve
Movements 2015
2,486
2,486
Movements 2014
(2,447)
(2,447)
Equity Reserve Dec-14
(2,486)
(2,486)
Equity Reserve Dec-13
(39)
(39)
Equity Reserve Dec-15
–
–

112.
Tena
ris
8. Income tax
YEAR ENDED DECEMBER 31
Current tax
Deferred tax
2014
695,136
(109,075)
586,061
2015
164,562
79,943
244,505
2013
594,179
33,698
627,877
All amounts in thousands of U.S. dollars
7. Equity in earnings (losses) of non-consolidated
companies
YEAR ENDED DECEMBER 31
From non-consolidated companies
Gain on equity interest (see Note 26)
Impairment loss on non-consolidated companies (see Note 12)
2014
(24,696)
21,302
(161,222)
(164,616)
2015
(10,674)
–
(28,884)
(39,558)
2013
46,098
–
–
46,098
All amounts in thousands of U.S. dollars

113.
Ann
ual R
epor
t
9. Dividends distribution
On November 4, 2015, the Company’s Board of Directors approved the payment of an interim dividend of $0.15 per share ($0.30 per ADS), or approximately $177 million, on November 25, 2015, with an ex-dividend date of November 23, 2015.
On May 6, 2015 the Company’s Shareholders approved an annual dividend in the amount of $0.45 per share ($0.90 per ADS). The amount approved included the interim dividend previously paid in November 27, 2014 in the amount of $0.15 per share ($0.30 per ADS). The balance, amounting to $0.30 per share ($0.60 per ADS), was paid on May 20, 2015. In the aggregate, the interim dividend paid in November 2014 and the balance paid in May 2015 amounted to approximately $531.2 million.
On May 7, 2014 the Company’s Shareholders approved an annual dividend in the amount of
$0.43 per share ($0.86 per ADS). The amount approved included the interim dividend previously paid in November 21, 2013 in the amount of $0.13 per share ($0.26 per ADS). The balance, amounting to $0.30 per share ($0.60 per ADS), was paid on May 22, 2014. In the aggregate, the interim dividend paid in November 2013 and the balance paid in May 2014 amounted to approximately $507.6 million.
On May 2, 2013, the Company’s shareholders approved an annual dividend in the amount of $0.43 per share ($0.86 per ADS). The amount approved included the interim dividend previously paid in November 2012, in the amount of $0.13 per share ($0.26 per ADS). The balance, amounting to $0.30 per share ($0.60 per ADS), was paid on May 23, 2013. In the aggregate, the interim dividend paid in November 2012 and the balance paid in May 2013 amounted to approximately $507.6 million.
YEAR ENDED DECEMBER 31
Income before income tax
Tax calculated at the tax rate in each country (*)
Non taxable income / Non deductible expenses, net (*)
Changes in the tax rates
Effect of currency translation on tax base (**)
Utilization of previously unrecognized tax losses
Tax charge
2014
1,767,237
312,714
132,551
3,249
138,925
(1,378)
586,061
2015
170,080
(61,624)
149,789
6,436
151,615
(1,711)
244,505
2013
2,202,249
465,029
72,768
8,287
92,695
(10,902)
627,877
All amounts in thousands of U.S. dollars
The tax on Tenaris’ income before tax differs from the theoretical amount that would arise using the tax rate in each country as follows:
(*) Include the effect of the impairment charges of approximately $400.3 million and $205.8 million in 2015 and 2014, respectively.
(**) Tenaris applies the liability method to recognize deferred income tax on temporary differences between the tax basis of assets and their carrying amounts in the financial statements. By application of this method, Tenaris recognizes gains and losses on deferred income tax due to the
effect of the change in the value on the tax basis in subsidiaries (mainly Argentinian, Colombia and Mexican), which have a functional currency different than their local currency. These gains and losses are required by IFRS even though the revalued / devalued tax basis of the relevant assets will not result in any deduction / obligation for tax purposes in future periods.

114.
Tena
ris
10. Property, plant and equipment, net
YEAR ENDED DECEMBER 31, 2015
COST
Values at the beginning of the year
Translation differences
Additions (*)
Disposals / Consumptions
Transfers / Reclassifications
Values at the end of the year
DEPRECIATION AND IMPAIRMENT
Accumulated at the beginning of the year
Translation differences
Depreciation charge
Transfers / Reclassifications
Disposals / Consumptions
Accumulated at the end of the year
At December 31, 2015
All amounts in thousands of U.S. dollars
Land, building and
improvements
1,633,797
(28,711)
13,065
(1,892)
149,844
1,766,103
418,210
(8,956)
45,644
2,474
(1,873)
455,499
1,310,604
Plant and production equipment
8,233,902
(250,470)
16,064
(55,452)
475,748
8,419,792
5,301,765
(135,538)
325,241
(4,114)
(54,639)
5,432,715
2,987,077
Vehicles, furniture and
fixtures
359,554
(9,382)
2,022
(8,940)
23,718
366,972
216,982
(7,528)
24,313
1,987
(6,788)
228,966
138,006
Work in progress
846,538
(10,352)
1,036,818
(5,691)
(649,631)
1,217,682
–
–
–
–
–
–
1,217,682
Spare parts and
equipment
38,075
(1,919)
(2,246)
(285)
(974)
32,651
15,352
(1,093)
941
(1,485)
47
13,762
18,889
Total
11,111,866
(300,834)
1,065,723
(72,260)
(1,295)
11,803,200
5,952,309
(153,115)
396,139
(1,138)
(63,253)
6,130,942
5,672,258
(*) The increase is mainly due to progress in the construction of the greenfield seamless facility in Bay City, Texas.

115.
Ann
ual R
epor
t
YEAR ENDED DECEMBER 31, 2014
COST
Values at the beginning of the year
Translation differences
Additions (*)
Disposals / Consumptions
Increase due to business combinations
Transfers / Reclassifications
Values at the end of the year
DEPRECIATION AND IMPAIRMENT
Accumulated at the beginning of the year
Translation differences
Depreciation charge
Transfers / Reclassifications
Increase due to business combinations
Impairment charge (See Note 5)
Disposals / Consumptions
Accumulated at the end of the year
At December 31, 2014
All amounts in thousands of U.S. dollars
Land, building and
improvements
1,498,188
(15,137)
56,078
(2,179)
5,059
91,788
1,633,797
373,304
(5,996)
47,132
23
2,044
3,019
(1,316)
418,210
1,215,587
Plant and production equipment
8,073,413
(241,044)
3,359
(32,567)
20,803
409,938
8,233,902
5,131,501
(134,723)
313,745
(38)
12,745
7,905
(29,370)
5,301,765
2,932,137
Vehicles, furniture and
fixtures
339,314
(4,445)
4,959
(6,436)
2,758
23,404
359,554
197,555
(3,677)
25,088
603
2,291
–
(4,878)
216,982
142,572
Work in progress
441,902
(7,719)
937,927
–
859
(526,431)
846,538
–
–
–
–
–
–
–
–
846,538
Spare parts and
equipment
37,754
(854)
5,823
(4,922)
31
243
38,075
14,444
(256)
1,164
–
–
–
–
15,352
22,723
Total
10,390,571
(269,199)
1,008,146
(46,104)
29,510
(1,058)
11,111,866
5,716,804
(144,652)
387,129
588
17,080
10,924
(35,564)
5,952,309
5,159,557
Property, plant and equipment include capitalized interests for net amounts at December 31, 2015 and 2014 of $15.5 million and $3.3 million, respectively.
(*) The increase is mainly due to progress in the construction of the greenfield seamless facility in Bay City, Texas.

116.
Tena
ris
YEAR ENDED DECEMBER 31, 2015
COST
Values at the beginning of the year
Translation differences
Additions
Transfers / Reclassifications
Disposals
Values at the end of the year
AMORTIZATION AND IMPAIRMENT
Accumulated at the beginning of the year
Translation differences
Amortization charge
Impairment charge (See Note 5)
Transfers / Reclassifications
Accumulated at the end of the year
At December 31, 2015
All amounts in thousands of U.S. dollars
Information system
projects
471,935
(12,127)
65,022
95
(56)
524,869
283,679
(7,454)
59,342
–
(35)
335,532
189,337
Licenses, patents and
trademarks (*)
494,014
(127)
774
1,028
(1,027)
494,662
332,823
–
30,588
–
1,001
364,412
130,250
Goodwill
2,182,004
(11,295)
–
–
–
2,170,709
436,625
–
–
400,314
–
836,939
1,333,770
Customer relationships
2,059,946
–
–
–
–
2,059,946
1,397,142
–
172,709
–
–
1,569,851
490,095
Total
5,207,899
(23,549)
65,796
1,123
(1,083)
5,250,186
2,450,269
(7,454)
262,639
400,314
966
3,106,734
2,143,452
11. Intangible assets, net
(*) Includes Proprietary Technology.

117.
Ann
ual R
epor
t
YEAR ENDED DECEMBER 31, 2014
COST
Values at the beginning of the year
Translation differences
Additions
Transfers / Reclassifications
Increase due to business combinations
Disposals
Values at the end of the year
AMORTIZATION AND IMPAIRMENT
Accumulated at the beginning of the year
Translation differences
Amortization charge
Impairment charge (See Note 5)
Accumulated at the end of the year
At December 31, 2014
All amounts in thousands of U.S. dollars
Information system
projects
400,488
(9,590)
79,983
1,090
28
(64)
471,935
249,916
(6,425)
40,188
–
283,679
188,256
Licenses, patents and
trademarks (*)
492,829
(63)
1,244
556
–
(552)
494,014
302,444
–
30,379
–
332,823
161,191
Goodwill
2,147,242
(6,481)
–
–
41,243
–
2,182,004
340,488
–
–
96,137
436,625
1,745,379
Customer relationships
2,059,946
–
–
–
–
–
2,059,946
1,140,421
–
157,933
98,788
1,397,142
662,804
Total
5,100,505
(16,134)
81,227
1,646
41,271
(616)
5,207,899
2,033,269
(6,425)
228,500
194,925
2,450,269
2,757,630
(*) Includes Proprietary Technology.
The geographical allocation of goodwill for the year ended December 31, 2015 was $1.214.3 million for North America, $116.9 million for South America $1.9 million for Europe, and $0.7 million for Middle East & Africa.

118.
Tena
ris
The carrying amount of goodwill allocated by CGU, as of December 31, 2015, was as follows:
OCTG (USA)
Tamsa (Hydril and other)
Siderca (Hydril and other)
Hydril
Electric Conduits
Coiled Tubing
Other
Total
Tubes Segment Other Segment Total
Other
–
19
93
–
–
–
26
139
225
365
358
309
46
4
26
1,334
Hydril
Acquisition
–
346
265
309
–
–
–
920
Maverick
Acquisition
–
–
–
–
–
4
–
4
Maverick
Acquisition
225
–
–
–
46
–
–
271
CGU
As of December 31, 2015
All amounts in million U.S.dollars

119.
Ann
ual R
epor
t
2014
527,080
113,099
3,451
643,630
2015
449,375
36,109
5,161
490,645
2014
11.46% (*)
2.5% - 5%
–
2015
11.46% (*)
2.5% - 5%
–
Company
Ternium S.A.
Usiminas S.A.
Others
Country of incorporation
Luxembourg
Brazil
–
The principal non-consolidated companies are:
a) Ternium S.A.
Ternium S.A. (“Ternium”), is a steel producer with production facilities in Mexico, Argentina, Colombia, United States and Guatemala and is one of Tenaris’ main suppliers of round steel bars and flat steel products for its pipes business.
At December 31, 2015, the closing price of Ternium’s ADSs as quoted on the New York Stock Exchange
was $12.4 per ADS, giving Tenaris’ ownership stake a market value of approximately $285.5 million (Level 1). At December 31, 2015, the carrying value of Tenaris’ ownership stake in Ternium, based on Ternium’s IFRS financial statements, was approximately $449.4 million. See Section II.B.2.
The Company reviews periodically the recoverability of its investment in Ternium. To determine the
% ownership - voting rightsat December 31
Value at December 31
YEAR ENDED DECEMBER 31
At the beginning of the year
Translation differences
Equity in earnings of non-consolidated companies
Impairment loss in non-consolidated companies
Dividends and distributions received
Additions (c)
Decrease due to consolidation (*)
Decrease / increase in equity reserves
At the end of the period
12. Investments in non-consolidated companies
2014
912,758
(54,688)
(24,696)
(161,222)
(17,735)
1,380
(8,310)
(3,857)
643,630
2015
643,630
(92,914)
(10,674)
(28,884)
(20,674)
4,400
–
(4,239)
490,645
(*) Including treasury shares
(*) See Note 26

120.
Tena
ris
recoverable value, the Company estimates the value in use of the investment by calculating the present value of the expected cash flows. The key assumptions used by the Company are based on external and internal sources of information, and management judgment based on past experience and expectations of future changes in the market.
Value-in-use was calculated by discounting the estimated cash flows over a five year period based on forecasts approved by management. For the subsequent years beyond the five-year period, a terminal value was calculated based on perpetuity considering a nominal growth rate of 2%. The discount rates used are based on the respective weighted average cost of capital (WACC), which is considered to be a good indicator of capital cost. The discount rate used to test the investment in Ternium for impairment was 10.6%.
b) Usiminas S.A.
Usiminas is a Brazilian producer of high quality flat steel products used in the energy, automotive and other industries and it is Tenaris’ principal supplier of flat steel in Brazil for its pipes and industrial equipment businesses.
At December 31, 2015, the closing price of the Usiminas’ ordinary shares as quoted on the BM&F Bovespa Stock Exchange was BRL 4.0 (approximately $1.03) per share, giving Tenaris’ ownership stake a market value of approximately $25.7 million (Level 1). At December 31, 2015, the carrying value of Tenaris’ ownership stake in Usiminas, was approximately $36.1 million.
The Company reviews periodically the recoverability of its investment in Usiminas. To determine the recoverable value, the Company
estimates the value in use of the investment by calculating the present value of the expected cash flows. There is a significant interaction among the principal assumptions made in estimating Usiminas’ cash flow projections, which include iron ore and steel prices, foreign exchange and interest rates, Brazilian GDP and steel consumption in the Brazilian market. The key assumptions used by the Company are based on external and internal sources of information, and management judgment based on past experience and expectations of future changes in the market.
Usiminas’ financial statements as of December 31, 2015 described a downgraded economic scenario for the company that caused a significant impact on its financial leverage and cash generation. In addition, Usiminas’ auditors included in their report on these financial statements an emphasis of matter paragraph which, without qualifying their opinion, indicated the existence of “a material uncertainty that may cast significant doubt about the Company’s ability to continue as a going concern” as a result of the risk of not achieving an action plan defined by Usiminas’ management to equalize its financial obligations with cash generation. Consequently, Tenaris, in a conservative approach and considering the guidance of IAS 36, assessed the recoverable value of its investment in Usiminas based on Usiminas ordinary shares average market price for December 2015, and impaired its investment by $28.9 million.
c) Techgen, S.A. de C.V. (“Techgen”)
Techgen is a Mexican company currently undertaking the construction and operation of a natural gas-fired combined cycle electric power plant in the Pesquería area of the State of Nuevo León, Mexico, with a power capacity of between 850

121.
Ann
ual R
epor
t
and 900 megawatts. As of February 2014, Tenaris completed the initial investments in Techgen of 22% of its share capital, the remaining ownership is held by Ternium and Tecpetrol International S.A. (a wholly-owned subsidiary of San Faustin S.A., the controlling shareholder of both Tenaris and Ternium) by 48% and 30% respectively.
Techgen is a party to transportation capacity agreements for a purchasing capacity of 150,000 MMBtu/Gas per day starting on June 1, 2016 and ending on May 31, 2036, and a party to a contract for the purchase of power generation equipment and other services related to the equipment. As of December 31, 2015, Tenaris exposure under these agreements amount to $62.6 million and $2.2 million respectively.
Tenaris issued a Corporate Guarantee covering 22% of the obligations of Techgen under a syndicated loan agreement between Techgen and several banks. The loan agreement amounted to $800 million to be used in the construction of the facility. The main covenants under the Corporate Guarantee are limitations on the sale of certain assets and compliance with financial ratios (e.g. leverage ratio). As of December 31, 2015, disbursements under the loan agreement amounted $800 million, as a result the amount guaranteed by Tenaris was approximately $176 million.
Summarized selected financial information of Ternium and Usiminas, including the aggregated amounts of assets, liabilities, revenues and profit or loss is as follows:
Non-current assets
Current assets
Total assets
Non-current liabilities
Current liabilities
Total liabilities
Non-controlling interests
Revenues
Gross profit
Net (loss) income for the year attributable to owners of the parent
Total comprehensive loss for the year, net of tax, attributable to owners of the parent
2015 2014
Ternium S.A.
5,480,389
2,582,204
8,062,593
1,558,979
1,700,617
3,259,596
769,849
7,877,449
1,400,177
8,127
(457,750)
Ternium S.A.
6,341,290
3,348,869
9,690,159
1,964,070
2,091,386
4,055,456
937,502
8,726,057
1,800,888
(198,751)
(495,603)
Usiminas S.A.
5,343,038
1,765,733
7,108,771
2,117,536
1,151,383
3,268,919
405,880
3,115,551
70,801
(1,053,806)
Usiminas S.A.
8,372,431
3,104,137
11,476,568
2,617,657
1,795,583
4,413,240
768,749
5,016,528
447,311
61,531

122.
Tena
ris
YEAR ENDED DECEMBER 31
Government entities
Employee advances and loans
Tax credits
Receivables from related parties
Legal deposits
Advances to suppliers and other advances
Others
Allowances for doubtful accounts – see Note 22 (I)
2014
1,697
12,214
29,997
43,093
21,313
119,970
35,588
263,872
(1,696)
262,176
2015
1,113
11,485
25,660
62,675
14,719
70,509
35,515
221,676
(1,112)
220,564
13. Receivables – non current
YEAR ENDED DECEMBER 31
Finished goods
Goods in process
Raw materials
Supplies
Goods in transit
Allowance for obsolescence – see Note 23 (I)
14. Inventories
2014
1,012,297
622,365
396,847
554,946
386,954
2,973,409
(193,540)
2,779,869
2015
741,437
407,126
277,184
503,692
143,228
2,072,667
(229,200)
1,843,467

123.
Ann
ual R
epor
t
YEAR ENDED DECEMBER 31
Prepaid expenses and other receivables
Government entities
Employee advances and loans
Advances to suppliers and other advances
Government tax refunds on exports
Receivables from related parties
Derivative financial instruments
Miscellaneous
Allowance for other doubtful accounts – see Note 23 (I)
15. Receivables and prepayments
2014
40,377
3,189
16,478
42,832
16,956
63,733
25,588
66,470
275,623
(7,992)
267,631
2015
29,463
3,498
10,951
27,823
7,053
14,249
18,155
44,736
155,928
(7,082)
148,846

124.
Tena
ris
YEAR ENDED DECEMBER 31
CURRENT TAX ASSETS
V.A.T. credits
Prepaid taxes
CURRENT TAX LIABILITIES
Income tax liabilities
V.A.T. liabilities
Other taxes
16. Current tax assets and liabilities
2014
74,129
55,275
129,404
239,468
27,156
85,729
352,353
2015
60,730
127,450
188,180
46,600
24,661
64,757
136,018
YEAR ENDED DECEMBER 31
Current accounts
Receivables from related parties
Allowance for doubtful accounts – see Note 23 (I)
17. Trade receivables
2014
2,002,867
29,505
2,032,372
(68,978)
1,963,394
2015
1,216,126
20,483
1,236,609
(101,480)
1,135,129

125.
Ann
ual R
epor
t
AT DECEMBER 31, 2015
Guaranteed
Not guaranteed
Guaranteed and not guaranteed
Allowance for doubtful accounts
Net Value
AT DECEMBER 31, 2014
Guaranteed
Not guaranteed
Guaranteed and not guaranteed
Allowance for doubtful accounts
Net Value
> 180 days
51,225
96,649
147,874
(99,816)
48,058
5,595
71,128
76,723
(68,076)
8,647
1 - 180 days
33,706
152,173
185,879
(1,664)
184,215
70,239
203,116
273,355
(902)
272,453
Past dueNot Due
268,606
634,250
902,856
–
902,856
495,336
1,186,958
1,682,294
–
1,682,294
Trade Receivables
353,537
883,072
1,236,609
(101,480)
1,135,129
571,170
1,461,202
2,032,372
(68,978)
1,963,394
The following table sets forth details of the aging of trade receivables:
Trade receivables are mainly denominated in U.S. dollar.

126.
Tena
ris
YEAR ENDED DECEMBER 31
CASH AND CASH EQUIVALENTS
Cash at banks
Liquidity funds
Short – term investments
OTHER INVESTMENTS - CURRENT
Fixed Income (time-deposit, zero coupon bonds, commercial papers)
Bonds and other fixed Income
Fund Investments
OTHER INVESTMENTS - NON-CURRENT
Bonds and other fixed Income
Others
18. Cash and cash equivalents and Other investments
2014
120,772
110,952
185,921
417,645
718,877
817,823
301,679
1,838,379
–
1,539
1,539
2015
101,019
81,735
103,793
286,547
877,436
1,203,695
59,731
2,140,862
393,084
1,662
394,746

127.
Ann
ual R
epor
t
YEAR ENDED DECEMBER 31
NON-CURRENT
Bank borrowings
Finance lease liabilities
CURRENT
Bank borrowings and other loans including related companies
Bank overdrafts
Finance lease liabilities
Costs of issue of debt
Total Borrowings
19. Borrowings
2014
30,104
729
30,833
966,741
1,200
486
(20)
968,407
999,240
2015
223,050
171
223,221
747,704
349
371
(129)
748,295
971,516

128.
Tena
ris
AT DECEMBER 31, 2015
Financial lease
Other borrowings
Total borrowings
Interest to be accrued (*)
Total
AT DECEMBER 31, 2014
Financial lease
Other borrowings
Total borrowings
Interest to be accrued (*)
Total
Over 5 years
–
18,472
18,472
1,046
19,518
–
19,374
19,374
2,168
21,542
Total
542
970,974
971,516
6,279
977,795
1,216
998,024
999,240
27,338
1,026,578
4 - 5 years
–
880
880
990
1,870
21
1,207
1,228
1,055
2,283
3 - 4 years
4
1,285
1,289
1,010
2,299
97
1,259
1,356
1,057
2,413
2 - 3 years
29
1,261
1,290
1,031
2,321
219
1,147
1,366
1,074
2,440
1 - 2 years
138
201,152
201,290
1,050
202,340
392
7,117
7,509
2,586
10,095
1 year or less
371
747,924
748,295
1,152
749,447
487
967,920
968,407
19,398
987,805
The maturity of borrowings is as follows:
(*) Includes the effect of hedge accounting.

129.
Ann
ual R
epor
t
Significant borrowings include:
In million of USD
607
105
200
2016
2016
Jan-17
Original & Outstanding
2015
Mainly 2015
2015
Tamsa
Siderca
Tubocaribe
Bank loans
Bank loans
Bank loan
Disbursement date Final maturity Borrower Type
As of December 31, 2015, Tenaris was in compliance with all of its covenants.
The weighted average interest rates before tax shown below were calculated using the rates set for each instrument in its corresponding currency as of December 31, 2015 and 2014 (considering hedge accounting where applicable).
Total borrowings
2014
1.89%
2015
1.52%

130.
Tena
ris
Breakdown of long-term borrowings by currency and rate is as follows:
Non current borrowings
2014
21,079
4,933
3,981
840
30,833
2015
219,778
–
2,922
521
223,221
Currency
USD
ARS
EUR
Others
Total non-current borrowings
Interest rates
Fixed
Fixed
Fixed
Variable
Year ended December 31
Breakdown of short-term borrowings by currency and rate is as follows:
Current borrowings
2014
184,103
14,577
24,030
1,272
522,225
184,791
34,446
71
252
2,640
968,407
2015
16,046
2,482
66
1,047
614,916
113,326
–
37
165
210
748,295
Currency
USD
USD
EUR
EUR
MXN
ARS
BRL
ARS
Others
Others
Total current borrowings
Interest rates
Variable
Fixed
Variable
Fixed
Fixed
Fixed
Variable
Variable
Variable
Fixed
Year ended December 31

131.
Ann
ual R
epor
t
Deferred tax liabilities
At the beginning of the year
Translation differences
Charged directly to Other Comprehensive Income
Income statement credit / (charge)
At December 31, 2015
At the beginning of the year
Translation differences
Charged directly to Other Comprehensive Income
Income statement credit / (charge)
At December 31, 2014
Fixed assets
346,385
(13,641)
–
(18,903)
313,841
360,208
(3,067)
–
(10,756)
346,385
Inventories
44,234
–
682
(1,718)
42,516
21,526
–
682
22,026
44,234
Intangible and Other (*)
482,446
11,154
3,999
51,958
549,557
548,219
849
(906)
(65,716)
482,446
Total
873,065
(2,487)
3,999
31,337
905,914
929,953
(2,218)
(224)
(54,446)
873,065
20. Deferred income tax
Deferred income taxes are calculated in full on temporary differences under the liability method using the tax rate of each country.
The evolution of deferred tax assets and liabilities during the year are as follows:
(*) Includes the effect of currency translation on tax base explained in Note 8.

132.
Tena
ris
Deferred tax assets
At the beginning of the year
Translation differences
Charged directly to Other Comprehensive Income
Income statement charge / (credit)
At December 31, 2015
At the beginning of the year
Translation differences
Increase due to business combinations
Charged directly to Other Comprehensive Income
Income statement charge / (credit)
At December 31, 2014
Provisions and allowances
(45,336)
9,709
–
(11,500)
(47,127)
(53,636)
4,317
(1,255)
979
4,259
(45,336)
Inventories
(189,709)
4,049
–
78,282
(107,378)
(162,242)
2,334
(297)
(682)
(28,822)
(189,709)
Tax losses (*)
(41,652)
6,988
–
(64,730)
(99,394)
(25,810)
1,500
(3,535)
–
(13,807)
(41,652)
Other
(150,497)
1,020
527
46,554
(102,396)
(134,319)
322
(281)
40
(16,259)
(150,497)
Total
(427,194)
21,766
527
48,606
(356,295)
(376,007)
8,473
(5,368)
337
(54,629)
(427,194)
(*) As of December 31, 2015, the recognized deferred tax assets on tax losses amount to $99.4 million and the net unrecognized deferred tax assets amount to $33.7 million.

133.
Ann
ual R
epor
t
Deferred income tax assets and liabilities are offset when (1) there is a legally enforceable right to set-off current tax assets against current tax liabilities and (2) when the deferred income taxes relate to the same fiscal authority on either the same
YEAR ENDED DECEMBER 31
Deferred tax assets
Deferred tax liabilities
2014
(268,252)
714,123
445,871
2015
(200,706)
750,325
549,619
taxable entity or different taxable entities where there is an intention to settle the balances on a net basis. The following amounts, determined after appropriate set-off, are shown in the Consolidated Statement of Financial Position:
The recovery analysis of deferred tax assets and deferred tax liabilities is as follows:
YEAR ENDED DECEMBER 31
Deferred tax assets to be recovered after 12 months
Deferred tax liabilities to be recovered after 12 months
2014
(119,192)
868,289
2015
(109,025)
843,022
The movement in the net deferred income tax liability account is as follows:
2014
553,946
6,255
113
(109,075)
(5,368)
445,871
2015
445,871
19,279
4,526
79,943
–
549,619
At the beginning of the year
Translation differences
Charged directly to Other Comprehensive Income
Income statement credit (debit)
Increase due to business combinations
At the end of the period
YEAR ENDED DECEMBER 31

134.
Tena
ris
21. Other liabilities
I. Other liabilities – Non current
Post-employment benefits
Unfunded
YEAR ENDED DECEMBER 31
Post-employment benefits
Other-long term benefits
Miscellaneous
YEAR ENDED DECEMBER 31
Values at the beginning of the period
Current service cost
Interest cost
Curtailments and settlements
Remeasurements (*)
Translation differences
Benefits paid from the plan
Other
At the end of the year
2014
164,217
98,069
23,579
285,865
2014
136,931
7,582
9,254
(236)
(9,824)
(8,665)
(8,006)
(303)
126,733
2015
135,880
78,830
16,466
231,176
2015
126,733
5,918
6,164
(128)
(9,743)
(8,418)
(16,062)
3,137
107,601
(*) For 2015 and 2014, a gain of $9.1 and $12.2 million respectively is attributable to demographic assumptions, and a gain of $0.6 and a loss of $2.4 million respectively is attributable to financial assumptions.

135.
Ann
ual R
epor
t
The principal actuarial assumptions used were as follows:
YEAR ENDED DECEMBER 31
Discount rate
Rate of compensation increase
2014
2% - 7%
2% - 3%
2015
2% - 7%
0% - 3%
YEAR ENDED DECEMBER 31
Present value of funded obligations
Fair value of plan assets
Liability (*)
(*) In 2015 and 2014, $2.6 million and $2.4 million corresponding to an overfunded plan were reclassified within other non-current assets, respectively.
As of December 31, 2015, an increase / (decrease) of 1% in the discount rate assumption would have generated a (decrease) / increase on the defined benefit obligation of $8.6 million and $9.1 million respectively, and an increase / (decrease) of 1% in the rate of compensation assumption would have generated an increase / (decrease) impact on the defined benefit obligation of $4.7 million and $4.2 million respectively. The above sensitivity analyses are based on a change in discount rate and rate of
compensation while holding all other assumptions constant. In practice, this is unlikely to occur, and changes in some of the assumptions may be correlated.
FundedThe amounts recognized in the statement of financial position for the current annual period and the previous annual period are as follows:
2014
183,085
(147,991)
35,094
2015
153,974
(128,321)
25,653

136.
Tena
ris
The movement in the present value of funded obligations is as follows:
YEAR ENDED DECEMBER 31
At the beginning of the year
Translation differences
Current service cost
Interest cost
Remeasurements (*)
Benefits paid
Movement in the fair value of plan assets
2014
177,433
(10,000)
2,266
7,621
16,104
(10,339)
183,085
2015
183,085
(18,507)
1,155
6,725
(6,124)
(12,360)
153,974
(*) For 2015 and 2014, a gain of $1.1 and a loss of $1.5 million respectively is attributable to demographic assumptions, and a gain of $5 and a loss of $ 14.6 million respectively is attributable to financial assumptions.
The movement in the fair value of plan assets is as follows:
YEAR ENDED DECEMBER 31
At the beginning of the year
Return on plan assets
Remeasurements
Translation differences
Contributions paid to the plan
Benefits paid from the plan
Other
At the end of the year
2014
(145,777)
(7,842)
(8,130)
8,911
(5,548)
10,339
56
(147,991)
2015
(147,991)
(5,021)
1,686
15,651
(5,066)
12,360
60
(128,321)

137.
Ann
ual R
epor
t
The major categories of plan assets as a percentage of total plan assets are as follows:
AT DECEMBER, 31
Equity instruments
Debt instruments
Others
2014
52.7%
43.7%
3.6%
2015
52.3%
44.3%
3.4%
The principal actuarial assumptions used were as follows:
YEAR ENDED DECEMBER 31
Discount rate
Rate of compensation increase
2014
4%
2 % - 3 %
2015
4%
0 % - 2 %
The expected return on plan assets is determined by considering the expected returns available on the assets underlying the current investment policy. Expected return on plan assets is determined based on long-term, prospective rates of return as of the end of the reporting period.
As of December 31, 2015, an increase / (decrease) of 1% in the discount rate assumption would have generated a (decrease) / increase on the defined benefit obligation of $18 million and $22.2 million respectively, and an increase / (decrease) of 1%
in the compensation rate assumption would have generated an increase / (decrease) on the defined benefit obligation of $2.2 million and $2 million respectively. The above sensitivity analyses are based on a change in discount rate and rate of compensation while holding all other assumptions constant. In practice, this is unlikely to occur, and changes in some of the assumptions may be correlated.
The employer contributions expected to be paid for the year 2016 amount approximately to $3.9 million.

138.
Tena
ris
22. Non-current allowances and provisions
I. Deducted from non current receivables
YEAR ENDED DECEMBER 31
Values at the beginning of the year
Translation differences
Used
Values at the end of the year
2014
(2,979)
534
749
(1,696)
2015
(1,696)
584
–
(1,112)
II. Other liabilities – current
YEAR ENDED DECEMBER 31
Payroll and social security payable
Liabilities with related parties
Derivative financial instruments
Miscellaneous
2014
204,558
5,305
56,834
29,580
296,277
2015
173,528
351
34,445
14,518
222,842
The expected maturity of undiscounted post- employment benefits is as follows:
The methods and types of assumptions used in preparing the sensitivity analysis did not change compared to the previous period.
AT 31 DECEMBER 2015
Unfunded Post-employment
benefits
Funded Post-employment benefits
Total
Over 5 years
234,606
290,089
524,695
4 - 5 years
5,343
9,239
14,582
3 - 4 years
5,587
9,001
14,588
Less than 1 year
10,488
8,144
18,632
1 - 2 years
5,334
8,437
13,771
2 - 3 years
16,694
8,768
25,462

139.
Ann
ual R
epor
t
23. Current allowances and provisions
I. Deducted from assets
YEAR ENDED DECEMBER 31, 2015
Values at the beginning of the year
Translation differences
Additional allowances
Used
At December 31, 2015
YEAR ENDED DECEMBER 31, 2014
Values at the beginning of the year
Translation differences
Additional allowances
Increase due to business combinations
Used
At December 31, 2014
Allowance for doubtful accounts - Trade receivables
(68,978)
1,033
(36,788)
3,253
(101,480)
(51,154)
384
(21,704)
(88)
3,584
(68,978)
Allowance for other doubtful accounts - Other receivables
(7,992)
1,732
(1,114)
292
(7,082)
(9,396)
1,335
(336)
(38)
443
(7,992)
Allowance for inventory obsolescence
(193,540)
10,056
(68,669)
22,953
(229,200)
(228,765)
5,141
(4,704)
(875)
35,663
(193,540)
II. Liabilities
YEAR ENDED DECEMBER 31
Values at the beginning of the year
Translation differences
Additional provisions
Reclassifications
Used
Increase due to business combinations
Values at the end of the year
2014
66,795
(10,253)
18,029
(2,276)
(5,146)
3,565
70,714
2015
70,714
(20,725)
9,390
6,562
(4,520)
–
61,421

140.
Tena
ris
Sales risks
7,205
(517)
8,540
47
(8,985)
6,290
9,670
(747)
14,100
–
(15,818)
7,205
Other claims and contingencies
13,175
(973)
1,743
(6,610)
(4,630)
2,705
16,045
(1,777)
2,668
2,275
(6,036)
13,175
Total
20,380
(1,490)
10,283
(6,563)
(13,615)
8,995
25,715
(2,524)
16,768
2,275
(21,854)
20,380
24. Derivative financial instruments
Net fair values of derivative financial instruments
The net fair values of derivative financial instruments disclosed within Other Receivables and Other Liabilities at the reporting date, in accordance with IAS 39, are:
YEAR ENDED DECEMBER 31
Foreign exchange derivatives contracts
Contracts with positive fair values
Foreign exchange derivatives contracts
Contracts with negative fair values
Total
2014
25,588
25,588
(56,834)
(56,834)
(31,246)
2015
18,247
18,247
(34,540)
(34,540)
(16,293)
II. Liabilities
YEAR ENDED DECEMBER 31, 2015
Values at the beginning of the year
Translation differences
Additional allowances
Reclassifications
Used
At December 31, 2015
YEAR ENDED DECEMBER 31, 2014
Values at the beginning of the year
Translation differences
Additional allowances
Reclassifications
Used
At December 31, 2014

141.
Ann
ual R
epor
t
Foreign exchange derivative contracts and hedge
accounting
Tenaris applies hedge accounting to certain cash flow hedges of highly probable forecast transactions. The net fair values of exchange rate derivatives and those derivatives that were designated for hedge accounting as of December 2015 and 2014, were as follows:
2015
(24,364)
14,466
331
957
–
(24)
28
(8,639)
402
–
85
465
(16,293)
2015
320
(21)
–
(819)
–
–
28
3,175
–
–
–
100
2,783
Purchase currency
MXN
USD
EUR
USD
EUR
JPY
USD
ARS
USD
USD
USD
Others
Total
Sell currency
USD
MXN
USD
EUR
BRL
USD
KWD
USD
BRL
CNH
GBP
Term
2016
2016
2016
2016
2016
2016
2016
2016
2016
2016
2016
2014
(45,061)
18,105
(6,186)
982
(96)
(5,079)
1,908
1,632
1,089
95
438
927
(31,246)
2014
120
(66)
(6,186)
–
138
(1,797)
630
(1,245)
–
87
403
–
(7,916)
Fair Value Hedge Accounting Reserve
Equity Reserve Dec-13
120
120
Movements 2014
(8,036)
(8,036)
Equity Reserve Dec-14
(7,916)
(7,916)
Movements 2015
10,699
10,699
Equity Reserve Dec-15
2,783
2,783
Foreign Exchange
Total Cash flow Hedge
Following is a summary of the hedge reserve evolution:
Tenaris estimates that the cash flow hedge reserve at December 31, 2015 will be recycled to the Consolidated Income Statement during 2016.

142.
Tena
ris
25. Contingencies, commitments and restrictions
on the distribution of profits
Contingencies
Tenaris is from time to time subject to various claims, lawsuits and other legal proceedings, including customer claims, in which third parties are seeking payment for alleged damages, reimbursement for losses or indemnity. Some of these claims, lawsuits and other legal proceedings involve highly complex issues, and often these issues are subject to substantial uncertainties. Accordingly, the potential liability with respect to a large portion of such claims, lawsuits and other legal proceedings cannot be estimated with certainty. Management with the assistance of legal counsel periodically reviews the status of each significant matter and assesses potential financial exposure. If a potential loss from a claim, lawsuit or proceeding is considered probable and the amount can be reasonably estimated, a provision is recorded. Accruals for loss contingencies reflect a reasonable estimate of the losses to be incurred based on information available to management as of the date of preparation of the financial statements, and take into consideration litigation and settlement strategies. The Company believes that the aggregate provisions recorded for potential losses in these financial statements (Notes 22 and 23) are adequate based upon currently available information. However, if management’s estimates prove incorrect, current reserves could be inadequate and Tenaris could incur a charge to earnings which could have a material adverse effect on Tenaris’ results of operations, financial condition, net worth and cash flows.
Set forth below is a description of Tenaris’ material ongoing legal proceedings:
Tax assessment in ItalyAn Italian subsidiary of Tenaris, received on December 24, 2012 a tax assessment from the Italian tax authorities related to allegedly omitted withholding tax on dividend payments made in 2007. The assessment, which was for an estimated amount of EUR292 million (approximately $318 million), comprising principal, interest and penalties, was appealed with the first-instance tax court in Milan. In February 2014, the first-instance tax court issued its decision on this tax assessment, partially reversing the assessment and lowering the claimed amount to approximately EUR9 million (approximately $10 million), including principal, interest and penalties. On October 2, 2014, the Italian tax authorities appealed against the second-instance tax court decision on the 2007 assessment. On June 12, 2015, the second-instance tax court accepted the Tenaris subsidiary defense arguments and rejected the appeal by the Italian tax authorities, thus reversing the entire 2007 assessment and recognizing that the dividend payment was exempt from withholding tax. The Italian tax authorities have appealed the second-instance tax court decision before the Supreme Court.
On December 24, 2013, the Italian subsidiary received a second tax assessment from the Italian tax authorities, based on the same arguments as those in the first assessment, relating to allegedly omitted withholding tax on dividend payments made in 2008 – the last such distribution made by the Italian subsidiary. The assessment, which

143.
Ann
ual R
epor
t
was for an estimated amount of EUR254 million (approximately $276 million), comprising principal interest and penalties, was appealed with the first-instance tax court in Milan. On January 27, 2016, the first-instance tax court rejected the appeal filed by the Italian subsidiary. This first-instance ruling, which held that the Italian subsidiary is required to pay an amount of EUR220 million (approximately $240 million) including principal interest and penalties, contradicts the first- and second-instance tax court rulings in connection with the 2007 assessment. Tenaris continues to believe that the Italian subsidiary has correctly applied the relevant legal provisions; accordingly, the Italian subsidiary will appeal the January 2016 first-instance ruling against the second-instance tax court and will also request the suspension of its effects.
Based, among other things, on the tax court decisions on the 2007 assessment and the opinion of counsels, Tenaris believes that it is not probable that the ultimate resolution of either the 2007 or the 2008 tax assessment will result in a material obligation.
CSN claims relating to the January 2012 acquisition of Usiminas sharesIn 2013, Confab was notified of a lawsuit filed in Brazil by Companhia Siderúrgica Nacional (CSN) and various entities affiliated with CSN against Confab and the other entities that acquired a participation in Usiminas’ control group in January 2012.
The CSN lawsuit alleges that, under applicable Brazilian laws and rules, the acquirers were
required to launch a tag-along tender offer to all non-controlling holders of Usiminas ordinary shares for a price per share equal to 80% of the price per share paid in such acquisition, or BRL28.8, and seeks an order to compel the acquirers to launch an offer at that price plus interest. If so ordered, the offer would need to be made to 182,609,851 ordinary shares of Usiminas not belonging to Usiminas’ control group, and Confab would have a 17.9% share in that offer.
On September 23, 2013, the first instance court issued its decision finding in favor of Confab and the other defendants and dismissing the CSN lawsuit. The claimants appealed the court decision and the defendants filed their response to the appeal. It is currently expected that the court of appeals will issue its judgment on the appeal in the first half of 2016.
The Company is aware that on November 10, 2014, CSN filed a separate complaint with Brazil’s securities regulator Comissão de Valores Mobiliários (CVM) on the same grounds and with the same purpose as the lawsuit referred to above. The CVM proceeding is underway and the Company has not yet been served with process or requested to provide its response.
Finally, on December 11, 2014, CSN filed a claim with Brazil’s antitrust regulator Conselho Administrativo de Defesa Econômica (CADE). In its claim, CSN alleged that the antitrust clearance request related to the January 2012 acquisition, which was approved by CADE without restrictions in August 2012, contained a false and deceitful

144.
Tena
ris
•
•
description of the acquisition aimed at frustrating the minority shareholders’ right to a tag-along tender offer, and requested that CADE investigate and reopen the antitrust review of the acquisition and suspend the Company’s voting rights in Usiminas until the review is completed. On May 6, 2015, CADE rejected CSN’s claim. CSN did not appeal the decision and on May 19, 2015, CADE finally closed the file.
Tenaris believes that all of CSN's claims and allegations are groundless and without merit, as confirmed by several opinions of Brazilian legal counsel and previous decisions by CVM, including a February 2012 decision determining that the above mentioned acquisition did not trigger any tender offer requirement, and, more recently, the first instance court decision on this matter first referred to above. Accordingly, no provision was recorded in these Consolidated Financial Statements.
Commitments
Set forth is a description of Tenaris’ main outstanding commitments:
A Tenaris company is a party to a contract with Nucor Corporation under which it is committed
to purchase on a monthly basis a minimum volume of hot-rolled steel coils at prices that are negotiated annually by reference to prices to comparable Nucor customers. The contract became effective in May 2013 and will be in force until December 2017; provided, however, that either party may terminate the contract at any time after January 1, 2015 with a 12-month prior notice. Due to the current weak pipe demand associated with the reduction in drilling activity, the parties entered into a temporary agreement pursuant to which application of the minimum volume requirements were suspended, and Tenaris is temporarily allowed to purchase steel volumes in accordance with its needs. As of December 31, 2015, the estimated aggregate contract amount through December 31, 2016, calculated at current prices, is approximately $221 million.
A Tenaris company entered into various contracts with suppliers pursuant to which it committed to purchase goods and services for a total amount of approximately $347.9 million related to the investment plan to expand Tenaris’ U.S. operations with the construction of a state-of-the-art seamless pipe mill in Bay City, Texas. As of December 31, 2015 approximately $836.5 million had already been invested.

145.
Ann
ual R
epor
t
Share capital
Legal reserve
Share premium
Retained earnings including net income for the year ended December 31, 2015
Total equity in accordance with Luxembourg law
1,180,537
118,054
609,733
18,024,204
19,932,528
All amounts in thousands of U.S. dollars
At least 5% of the Company’s net income per year, as calculated in accordance with Luxembourg law and regulations, must be allocated to the creation of a legal reserve equivalent to 10% of the Company’s share capital. As of December 31, 2015, this reserve is fully allocated and additional allocations to the reserve are not required under Luxembourg law. Dividends may not be paid out of the legal reserve.
Retained earnings at December 31, 2014 under Luxembourg law
Other income and expenses for the year ended December 31, 2015 (*)
Dividends approved
Retained earnings at December 31, 2015 under Luxembourg law
Share premium
Distributable amount at December 31, 2015 under Luxembourg law
21,072,180
(2,516,734)
(531,242)
18,024,204
609,733
18,633,937
All amounts in thousands of U.S. dollars
The Company may pay dividends to the extent, among other conditions, that it has distributable retained earnings calculated in accordance with Luxembourg law and regulations.
At December 31, 2015, distributable amount under Luxembourg law totals $18.6 billion, as detailed below:
Restrictions to the distribution of profits and
payment of dividends
As of December 31, 2015, equity as defined under Luxembourg law and regulations consisted of:
(*) In 2015 result under Luxembourg GAAP was affected by the written down of the value of its investment.

146.
Tena
ris
26. Acquisition of subsidiaries and non-
consolidated companies
In September 2014, Tenaris closed the acquisition of 100% of the shares of Socobras Participações Ltda. (“Socobras”), a holding company that owned 50% of the shares of Socotherm Brasil S.A.(“Socotherm”). Tenaris already owned the other 50% interest in Socotherm, following completion of this transaction, Tenaris now owns 100% of Socotherm.
The purchase price amounted to $29.6 million, net assets acquired (including PPE, inventories and cash and cash equivalents) amounted to $9.6 million and goodwill for $20 million.
Tenaris accounted for this transaction as a step-acquisition whereby Tenaris’ ownership interest in Socotherm held before the acquisition was remeasured to fair value at that date. As a result, Tenaris recorded a result of approximately $21.3 million resulting from the difference between the carrying value of its initial investments in Socotherm and the fair value which was included in “Equity in earnings (losses) of non-consolidated companies” in the Consolidated Income Statement.
Had the transaction been consummated on January 1, 2014, then Tenaris’ unaudited pro forma net sales and net income from continuing operations would not have changed materially.

147.
Ann
ual R
epor
t
YEAR ENDED DECEMBER 31
(I) CHANGES IN WORKING CAPITAL
Inventories
Receivables and prepayments and Current tax assets
Trade receivables
Other liabilities
Customer advances
Trade payables
(II) INCOME TAX ACCRUALS LESS PAYMENTS
Tax accrued
Taxes paid
(III) INTEREST ACCRUALS LESS PAYMENTS, NET
Interest accrued
Interest received
Interest paid
(IV) CASH AND CASH EQUIVALENTS
Cash at banks, liquidity funds and short - term investments
Bank overdrafts
2014
(72,883)
(31,061)
20,886
(61,636)
76,383
(3,755)
(72,066)
586,061
(506,999)
79,062
6,174
31,306
(74,672)
(37,192)
417,645
(1,200)
416,445
2015
936,402
60,009
828,265
(123,904)
1,171
(327,958)
1,373,985
244,505
(335,585)
(91,080)
(11,517)
28,238
(18,696)
(1,975)
286,547
(349)
286,198
2013
287,874
62,114
129,939
(151,578)
(77,099)
(62,470)
188,780
627,877
(502,461)
125,416
37,356
42,091
(109,170)
(29,723)
614,529
(16,384)
598,145
27. Cash flow disclosures
As of December 31, 2015, 2014 and 2013, the components of the line item “other, including currency translation adjustment” are immaterial to net cash provided by operating activities.

148.
Tena
ris
28. Related party transactions
As of December 31, 2015:
San Faustin S.A., a Luxembourg Société Anonyme (“San Faustin”), owned 713,605,187 shares in the Company, representing 60.45% of the Company’s capital and voting rights.
San Faustin owned all of its shares in the Company through its wholly-owned subsidiary Techint Holdings S.à r.l., a Luxembourg Société à Responsabilité Limitée (“Techint”), who is the holder of record of the above-mentioned Tenaris shares.
Rocca & Partners Stichting Administratiekantoor Aandelen San Faustin, a Dutch private foundation
(Stichting) (“RP STAK”) held shares in San Faustin sufficient in number to control San Faustin.
No person or group of persons controls RP STAK.
Based on the information most recently available to the Company, Tenaris’ directors and senior management as a group owned 0.12% of the Company’s outstanding shares.
Transactions and balances disclosed as with “non-consolidated parties” are those with companies over which Tenaris exerts significant influence or joint control in accordance with IFRS, but does not have control. All other transactions and balances with related parties which are not non-consolidated parties and which are not consolidated are disclosed as “Other”.
•
•
•
•
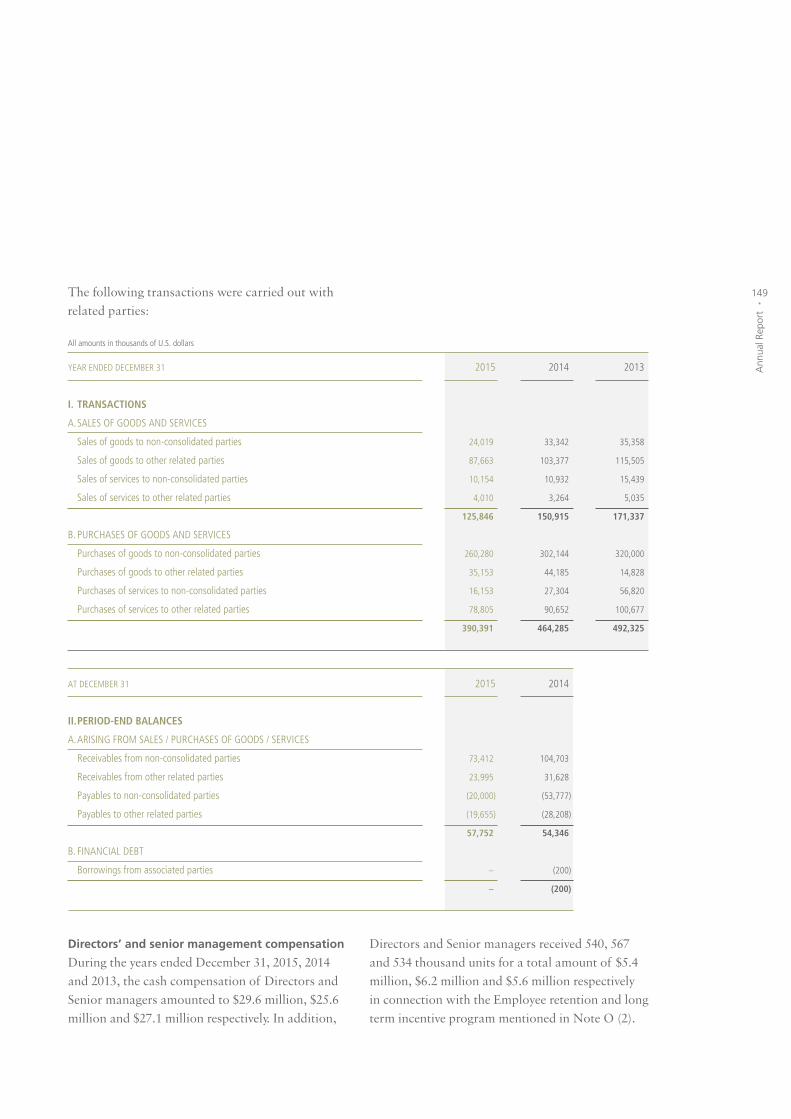
149.
Ann
ual R
epor
t
YEAR ENDED DECEMBER 31
I. TRANSACTIONS
A. SALES OF GOODS AND SERVICES
Sales of goods to non-consolidated parties
Sales of goods to other related parties
Sales of services to non-consolidated parties
Sales of services to other related parties
B. PURCHASES OF GOODS AND SERVICES
Purchases of goods to non-consolidated parties
Purchases of goods to other related parties
Purchases of services to non-consolidated parties
Purchases of services to other related parties
2014
33,342
103,377
10,932
3,264
150,915
302,144
44,185
27,304
90,652
464,285
2015
24,019
87,663
10,154
4,010
125,846
260,280
35,153
16,153
78,805
390,391
2015
73,412
23,995
(20,000)
(19,655)
57,752
–
–
2013
35,358
115,505
15,439
5,035
171,337
320,000
14,828
56,820
100,677
492,325
2014
104,703
31,628
(53,777)
(28,208)
54,346
(200)
(200)
AT DECEMBER 31
II. PERIOD-END BALANCES
A. ARISING FROM SALES / PURCHASES OF GOODS / SERVICES
Receivables from non-consolidated parties
Receivables from other related parties
Payables to non-consolidated parties
Payables to other related parties
B. FINANCIAL DEBT
Borrowings from associated parties
All amounts in thousands of U.S. dollars
Directors’ and senior management compensation
During the years ended December 31, 2015, 2014 and 2013, the cash compensation of Directors and Senior managers amounted to $29.6 million, $25.6 million and $27.1 million respectively. In addition,
Directors and Senior managers received 540, 567 and 534 thousand units for a total amount of $5.4 million, $6.2 million and $5.6 million respectively in connection with the Employee retention and long term incentive program mentioned in Note O (2).
The following transactions were carried out with related parties:

150.
Tena
ris
29. Principal subsidiaries
The following is a list of Tenaris’ principal subsidiaries and its direct and indirect percentage of ownership of each controlled company at December 31, 2015.
2014
100%
100%
99%
100%
100%
51%
77%
100%
100%
100%
100%
2013
100%
100%
99%
100%
100%
51%
77%
100%
100%
100%
100%
Percentage of ownership at December 31 (*)
2015
100%
100%
99%
100%
100%
51%
77%
100%
100%
100%
100%
Company
Algoma Tubes Inc.
Confab Industrial S.A. and subsidiaries
Dalmine S.p.A.
Hydril Company and subsidiaries (except detailed) (a)
Maverick Tube Corporation and subsidiaries
(except detailed)
NKKTubes
PT Seamless Pipe Indonesia Jaya
Prudential Steel ULC
S.C. Silcotub S.A.
Siat S.A.
Siderca S.A.I.C. and subsidiaries
(except detailed)
Main activity
Manufacturing of seamless steel pipes
Manufacturing of welded steel pipes
and capital goods
Manufacturing of seamless steel pipes
Manufacturing and marketing of
premium connections
Manufacturing of welded steel pipes
Manufacturing of seamless steel pipes
Manufacturing of seamless steel products
Manufacturing of welded steel pipes
Manufacturing of seamless steel pipes
Manufacturing of welded and seamless
steel pipes
Manufacturing of seamless steel pipes
Country of Incorporation
Canada
Brazil
Italy
USA
USA
Japan
Indonesia
Canada
Romania
Argentina
Argentina

151.
Ann
ual R
epor
t
2014
100%
100%
100%
100%
100%
100%
100%
100%
100%
100%
100%
100%
2013
100%
100%
100%
100%
100%
100%
100%
100%
100%
100%
100%
100%
Percentage of ownership at December 31 (*)
2015
100%
100%
100%
100%
100%
100%
100%
100%
100%
100%
100%
100%
Company
Talta - Trading e Marketing Sociedade Unipessoal Lda.
Tenaris Bay City
Tenaris Financial Services S.A.
Tenaris Global Services (Canada) Inc.
Tenaris Global Services (U.S.A.) Corporation
Tenaris Global Services Nigeria Limited
Tenaris Global Services S.A. and subsidiaries (b)
Tenaris Global Services (Uk) Ltd
Tenaris Investments S.àr.l.
Tenaris Investments S.àr.l., Luxemburg, Zug Branch
Tenaris Investments Switzerland AG and subsidiaries
(except detailed)
Tubos de Acero de Mexico S.A.
Main activity
Trading and holding Company
Manufacturing of seamless steel pipes
Financial Company
Marketing of steel products
Marketing of steel products
Marketing of steel products
Holding company and marketing of
steel products
Marketing of steel products
Holding Company
Holding company and financial services
Holding Company
Manufacturing of seamless steel pipes
Country of Incorporation
Madeira
USA
Uruguay
Canada
USA
Nigeria
Uruguay
United Kingdom
Luxembourg
Switzerland
Switzerland
Mexico
(*) All percentages rounded.
(a) Tenaris Investments S.a.r.l. holds 100% of Hydril's subsidiaries shares except for Technical Drilling & Production Services Nigeria. Ltd where it holds 80% for 2015, 2014 and 2013.
(b) Tenaris holds 97,5% of Tenaris Supply Chain S.A, 60% of Gepnaris S.A. and 40% of Tubular Technical Services and Pipe Coaters, and 49% of Amaja Tubular Services Limited.

152.
Tena
ris
30. Nationalization of Venezuelan Subsidiaries
In May 2009, within the framework of Decree Law 6058, Venezuela’s President announced the nationalization of, among other companies, the Company's majority-owned subsidiaries TAVSA - Tubos de Acero de Venezuela S.A. (“Tavsa”) and, Matesi Materiales Siderúrgicos S.A (“Matesi”), and Complejo Siderúrgico de Guayana, C.A (“Comsigua”), in which the Company has a non-controlling interest (collectively, the “Venezuelan Companies”).
In August 2009, Venezuela, acting through the transition committee appointed by the Minister of Basic Industries and Mines of Venezuela, unilaterally assumed exclusive operational control over Matesi, and in November, 2009, Venezuela, acting through PDVSA Industrial S.A. (a subsidiary of Petróleos de Venezuela S.A.), formally assumed exclusive operational control over the assets of Tavsa. Venezuela did not pay any compensation for these assets.
Tenaris’ investments in the Venezuelan Companies are protected under applicable bilateral investment treaties, including the bilateral investment treaty between Venezuela and the Belgium-Luxembourg Economic Union, and Tenaris continues to reserve all of its rights under contracts, investment treaties and Venezuelan and international law. Tenaris has also consented to the jurisdiction of the International Centre for Settlement of Investment Disputes (“ICSID”) in connection with the nationalization process.
In August 2011, Tenaris and its wholly-owned subsidiary Talta - Trading e Marketing Sociedad Unipessoal Lda (“Talta”), initiated arbitration proceedings against Venezuela before the ICSID in Washington D.C., seeking adequate and effective compensation for the expropriation of their investment in Matesi. On January 29, 2016, the tribunal released its award. The award upheld Tenaris’ and Talta’s claim that Venezuela had expropriated their investments in Matesi in violation of Venezuelan law as well as the bilateral investment treaties entered into by Venezuela with the Belgium-Luxembourg Economic Union and Portugal. The award granted compensation in the amount of $87.3 million for the breaches and ordered Venezuela to pay an additional amount of $85.5 million in pre-award interest, aggregating to a total award of $172.8 million, payable in full and net of any applicable Venezuelan tax, duty or charge. The tribunal granted Venezuela a grace period of six months from the date of the award to make payment in full of the amount due without incurring post-award interest, and resolved that if no, or no full, payment is made by then, post-award interest would apply at the rate of 9% per annum.
In July 2012, Tenaris and Talta initiated separate arbitration proceedings against Venezuela before the ICSID, seeking adequate and effective compensation for the expropriation of their respective investments in Tavsa and Comsigua. The tribunal in these proceedings was constituted in July 2013. Following the exchange of further written submissions by the Parties, an oral hearing

153.
Ann
ual R
epor
t
was held on June 15-23, 2015 in Washington DC. The parties submitted their post-hearing briefs on September 11, 2015; in their brief Tenaris and Talta claimed a principal sum of $243.7 million plus pre-award interest of $471.1 million, plus post-award interest. There is no procedural deadline by which the award must be rendered.
Based on the facts and circumstances described above and following the guidance set forth by IAS 27R, the Company ceased consolidating the results of operations and cash flows of the Venezuelan Companies as from June 30, 2009, and classified its investments in the Venezuelan Companies as financial assets based on the definitions contained in paragraphs 11(c)(i) and 13 of IAS 32.
The Company classified its interests in the Venezuelan Companies as available-for-sale investments since management believes they do not fulfil the requirements for classification within
any of the remaining categories provided by IAS 39 and such classification is the most appropriate accounting treatment applicable to non-voluntary dispositions of assets.
Tenaris or its subsidiaries have net receivables with the Venezuelan Companies as of December 31, 2015, for a total amount of approximately $27.0 million.
The Company records its interest in the Venezuelan Companies at its carrying amount at June 30, 2009, and not at fair value, following the guidance set forth by paragraphs 46(c), AG80 and AG81 of IAS 39.
31. Fees paid to the Company’s principal accountant
Total fees accrued for professional services rendered by PwC Network firms to Tenaris S.A. and its subsidiaries are detailed as follows:
YEAR ENDED DECEMBER 31
Audit Fees
Audit-Related Fees
Tax Fees
All Other Fees
Total
2014
5,231
142
89
35
5,497
2015
4,372
78
25
15
4,490
2013
5,723
143
117
51
6,034
All amounts in thousands of U.S. dollars

154.
Tena
ris
32. Subsequent events
Annual Dividend Proposal
On February 24, 2016 the Company’s Board of Directors proposed, for the approval of the Annual General Shareholders' meeting to be held on May 4, 2016, the payment of an annual dividend of $0.45 per share ($0.90 per ADS), or approximately $531.2 million, which includes the interim dividend of $0.15 per share ($0.30 per ADS) or approximately $177.1 million, paid on November 25, 2015. If the annual dividend is approved by the shareholders, a dividend of $0.30 per share ($0.60 per ADS), or approximately $354.1 million will be paid on May 25, 2016, with an ex-dividend date of May 24, 2016. These Consolidated Financial Statements do not reflect this dividend payable.
/s/ Edgardo Carlos
Chief Financial OfficerEdgardo Carlos

155.
Ann
ual R
epor
t
Tenaris S.A. Société AnonymeAnnual accounts
Luxembourg GAAP as at December 31, 2015

156.
Tena
ris

157.
Ann
ual R
epor
t
Audit report
To the Shareholders
of Tenaris S.A.
Report on the annual accounts
We have audited the accompanying annual accounts of Tenaris S.A., which comprise the balance sheet as at 31 December 2015, the profit and loss account for the year then ended, and a summary of significant accounting policies and other explanatory information.
Board of Directors’ responsibility for the annual accounts
The Board of Directors is responsible for the preparation and fair presentation of these annual accounts in accordance with Luxembourg legal and regulatory requirements relating to the preparation of the annual accounts, and for such internal control as the Board of Directors determines is necessary to enable the preparation of annual accounts that are free from material misstatement, whether due to fraud or error.
Responsibility of the “Réviseur d’entreprises agréé”
Our responsibility is to express an opinion on these annual accounts based on our audit. We conducted our audit in accordance with International Standards on Auditing as adopted for Luxembourg by the “Commission de Surveillance du Secteur Financier”. Those standards require that we comply with ethical requirements and plan and perform the audit to obtain reasonable assurance about whether the annual accounts are free from material misstatement.
An audit involves performing procedures to obtain audit evidence about the amounts and disclosures in the annual accounts. The procedures selected depend on the judgment of the “Réviseur d’entreprises agréé”, including the assessment of the risks of material misstatement of the annual accounts, whether due to fraud or error. In making those risk assessments, the “Réviseur d’entreprises agréé” considers internal control relevant to the entity’s preparation and fair presentation of the annual accounts in order to design audit procedures that are appropriate in the circumstances, but not for the purpose of expressing an opinion on the effectiveness of the entity’s internal control. An audit also includes evaluating the appropriateness of accounting policies used and the reasonableness of accounting estimates made by the Board of Directors, as well as evaluating the overall presentation of the annual accounts.

158.
Tena
ris
We believe that the audit evidence we have obtained is sufficient and appropriate to provide a basis for our audit opinion.
Opinion
In our opinion, the annual accounts give a true and fair view of the financial position of Tenaris S.A. as of 31 December 2015, and of the results of its operations for the year then ended in accordance with Luxembourg legal and regulatory requirements relating to the preparation of the annual accounts.
Report on other legal and regulatory requirements
The management report, which is responsibility of the Board of Directors, is consistent with the annual accounts and includes the information required by the law with respect to Corporate Governance Statements.
Luxembourg,30 March 2016
PricewaterhouseCoopers, Société coopérative Represented by
/s/ Mervyn R. Martins
Mervyn R. Martins
PricewaterhouseCoopers, Société coopérative, 2, rue Gerhard Mercator, B.P. 1443, L-1014 LuxembourgT: +352 494848 1, F: +352 494848 2900, www.pwc.lu
Cabinet de révision agréé. Expert-comptable (autorisation gouvernementale n°10028256)R.C.S. Luxembourg B 65 477 - TVA LU25482518

159.
Ann
ual R
epor
t
Balance Sheet as at December 31, 2015
19,955,026,411
19,955,026,411
4,305,445
85,725
551,150
4,942,320
19,959,968,731
1,180,536,830
609,732,757
118,053,683
20,718,019,221
(2,516,734,206)
(177,080,525)
19,932,527,760
7,035,793
18,460,359
1,944,819
27,440,971
19,959,968,731
23,006,961,885
23,006,961,885
2,528,182
285
317,613
2,846,080
23,009,807,965
1,180,536,830
609,732,757
118,053,683
21,545,028,256
(295,767,461)
(177,080,525)
22,980,503,540
7,186,486
20,082,849
2,035,090
29,304,425
23,009,807,965
The accompanying notes are an integral part of these annual accounts.
Expressed in United States Dollars
2015 2014
ASSETS
C. FIXED ASSETS
III. Financial fixed assets
1. Shares in affiliated undertakings
D. CURRENT ASSETS
II. Debtors
2. Amounts owed by affiliated undertakings
a) becoming due and payable within one year
4. Other receivables
a) becoming due and payable within one year
IV. Cash at bank and cash in hand
Total assets
LIABILITIES
A. CAPITAL AND RESERVES
I. Subscribed capital
II. Share premium and similar premiums
IV. Reserves
1. Legal reserve
V. Profit or loss brought forward
VI. Profit or loss for the financial year
VII. Interim dividend
D. NON-SUBORDINATED DEBTS
6. Amounts owed to affiliated undertakings
a) becoming due and payable within one year
b) becoming due and payable after more than one year
9. Other creditors
a) becoming due and payable within one year
Total liabilities
Note
4
10
5
5
5,6
5,8
10
10

160.
Tena
ris
Profit and loss account for the year ended December 31, 2015
A. CHARGES
5. Other operating charges
6. Value adjustments and fair value adjustments on financial fixed assets
8. Interest and other financial charges
a) concerning affiliated undertakings
b) other interest and similar financial charges
11. Income tax
Total charges
B. INCOME
6. Income from financial fixed assets
a) derived from affiliated undertakings
7. Income from financial current assets
a) derived from affiliated undertakings
b) other income from financial current assets
13. Loss for the financial year
Total income
22,982,906
2,493,111,324
713,713
125
3,626
2,516,811,694
–
70,835
6,653
2,516,734,206
2,516,811,694
28,563,073
288,522,631
772,069
67
4,357
317,862,197
22,000,000
19,715
75,021
295,767,461
317,862,197
The accompanying notes are an integral part of these annual accounts.
Expressed in United States Dollars
Note
11
4
9
12
2015 2013

161.
Ann
ual R
epor
t
Notes to audited annual accounts as at December 31, 2015
1. General information
Tenaris S.A. (the “Company” or “Tenaris”) was established on December 17, 2001 under the name of Tenaris Holding S.A. as a public limited liability company under Luxembourg’s 1929 holding company regime (societé anonyme holding). On June 26, 2002, the Company changed its name to Tenaris S.A. On January 1, 2011, the Company became an ordinary public limited liability company (Société Anonyme).
Tenaris’ object is to invest mainly in companies that manufacture and market steel tubes and other related businesses.
The financial year starts on January 1 and ends on December 31 of each year.
Tenaris prepares and publishes consolidated financial statements which include further information on Tenaris and its subsidiaries. The financial statements are available at the registered office of the Company, 29, Avenue de la Porte-Neuve –L-2227– 3rd Floor, Luxembourg.
2. Presentation of the comparative financial data
The comparative figures for the financial year ended December 31, 2014 relating to items of balance sheet, profit and loss and the notes to the accounts are reclassified whenever necessary to ensure comparability with the figures for the financial year ended December 31, 2015.
3. Summary of significant accounting policies
3.1. Basis of presentation
These annual accounts have been prepared in accordance with Luxembourg legal and regulatory requirements under the historical cost convention.
Accounting policies and valuation rules are, besides the ones laid down by the law of 19 December 2002, determined and applied by the Board of Directors.
The preparation of these annual accounts requires management to make certain accounting estimates and assumptions that might affect the reported amounts of assets and liabilities and the disclosure of contingent assets and liabilities at the reporting dates, and the reported amounts of income and charges during the reporting years. Actual results may differ from these estimates.
3.2. Foreign currency translation
Current and non-current assets and liabilities denominated in currencies other than the United States Dollar (“USD”) are translated into USD at the rate of exchange at the balance sheet date. Non-current assets remain at the exchange rate on the day of incorporation. The resulting gains or losses are reflected in the Profit and loss account for the financial year. Income and expenses in currencies other than the USD are translated into USD at the exchange rate prevailing at the date of each transaction.
3.3. Financial fixed assets
Shares in affiliated undertakings are stated at purchase price, adding to the price paid the expenses incidental thereto.
Whenever necessary, the Company conducts impairment tests on its fixed assets in accordance with Luxembourg regulations.
In case of other than a temporary decline in respect of the fixed assets value, its carrying value will be reduced to recognize this decline. If there is a change in the reasons for which the value adjustments were made, these adjustments could be reversed, if appropriate.

162.
Tena
ris
Expressed in United States Dollars
3.4. Debtors
Debtors are valued at their nominal value. They are subject to value adjustments where their recovery is compromised. These value adjustments are not continued if the reasons for which the value adjustments were made have ceased to apply.
3.5. Cash at bank and cash in hand
Cash at bank and cash in hand mainly comprise cash at bank and liquidity funds. Assets recorded in cash at bank and cash in hand are carried at fair market value or at historical cost which approximates fair market value.
3.6. Non-subordinated debts
Non-subordinated debts are stated at nominal value.
4. Financial fixed assets
Shares in affiliated undertakings
Tenaris holds the 100% shares of Tenaris Investments S.à r.l. (Tenaris Investments) with registered office in Luxembourg and holds, indirectly through this wholly-owned subsidiary, the 100% shares of Confab Industrial S.A., Hydril Company, Inversiones Lucerna Limitada, Maverick Tube Corporation, Siderca S.A.I.C., Talta - Trading e Marketing, Sociedade Unipessoal Lda., Tenaris Investments Switzerland AG, Tenaris Solutions AG, Tubos de Acero de México S.A., Tenaris Bay City, Inc., Tenaris Rods (USA), Inc., Algoma Tubes Inc., Siderca International ApS, Socobras Participações Ltda., Tubman Holdings (Gibraltar) Limited and Tenaris Connections BV, the 50% shares of Exiros B.V and the 11.5% of Ternium S.A.
Movements during the financial year are as follows:
(a) On December 7, 2010, Tenaris entered into a master credit agreement with Tenaris Investments pursuant to which, upon request from Tenaris, Tenaris Investments may, but shall not be required to, from time to time make loans to Tenaris. Any loan under the master credit agreement may be repaid or prepaid from time to time through a reduction of the capital of Tenaris Investments by an amount equivalent to the amount of the loan then outstanding (including accrued interest). As a result of reductions in the capital of Tenaris Investments made during the financial year ended December 31, 2015, in connection with cancellations of loans to Tenaris, the value of the participation of Tenaris in Tenaris Investments decreased by USD 558.8 million.
(b) In 2015, results of the Company’s subsidiaries indirectly held through its wholly-owned subsidiary Tenaris Investments were affected by adverse market conditions reflecting the decline in oil prices and their impact on drilling activity and on the demand outlook for tubular products. The management of the Company has assessed the value of its investment and recorded an impairment charge of USD 2.5 billion as of December 31, 2015 under Luxembourg GAAP.
Gross book value - opening balance
Decreases for the financial year (a)
Gross book value - closing balance
Accumulated value adjustments - opening balance
Allocations for the financial year (b)
Accumulated value adjustments - closing balance
Net book value - closing balance
Net book value - opening balance
23,453,141,905
(558,824,150)
22,894,317,755
(446,180,020)
(2,493,111,324)
(2,939,291,344)
19,955,026,411
23,006,961,885

163.
Ann
ual R
epor
t
As of December 31, 2015 Tenaris Investments reported an equity of USD 20.0 billion and a loss for the financial year of USD 5.2 billion.
5. Capital and reserves
The authorized capital of the Company amounts to USD 2.5 billion. The total authorized share capital of the Company is represented by 2,500,000,000 shares with a par value of USD 1 per share. The total capital issued and fully paid-up at December 31, 2015 was 1,180,536,830 shares with a par value of USD 1 per share.
The board of directors is authorized until June 5, 2020, to increase the issued share capital, through issues of shares within the limits of the authorized capital.
Expressed in United States Dollars
(1) As approved by the ordinary shareholders’ meeting held on May 6, 2015.
(2) As approved by the board of directors’ meeting held on November 4, 2015.
Item
Balance at the beginning of the financial year
Loss for the financial year
Dividend paid (1)
Interim Dividend (2)
Balance at the end of the financial year
Capital and reserves
22,980,503,540
(2,516,734,206)
(354,161,049)
(177,080,525)
19,932,527,760
Share premium
609,732,757
–
–
–
609,732,757
Legal reserve
118,053,683
–
–
–
118,053,683
Retained earnings
21,249,260,795
(2,516,734,206)
(531,241,574)
–
18,201,285,015
Interim dividend
(177,080,525)
–
177,080,525
(177,080,525)
(177,080,525)
Subscribed capital
1,180,536,830
–
–
–
1,180,536,830

164.
Tena
ris
6. Legal reserve
In accordance with Luxembourg law, the Company is required to set aside a minimum of 5% of its annual net profit for each financial year to a legal reserve. This requirement ceases to be necessary once the balance on the legal reserve has reached 10% of the issued share capital. The Company’s reserve has already reached this 10%. If the legal reserve later falls below the 10% threshold, at least 5% of net profits again must be allocated toward the reserve. The legal reserve is not available for distribution to the shareholders.
7. Distributable amounts
Dividends may be paid by Tenaris upon the ordinary shareholders’ meeting approval to the extent distributable retained earnings exist.
At December 31, 2015, profit brought forward after deduction of the loss and the interim dividend for the financial year of Tenaris under Luxembourg law totaled approximately USD 18.0 billion.
The share premium amounting to USD 0.6 billion can also be reimbursed.
8. Interim dividend paid
In November 2015, the Company paid an interim dividend of USD 177.1 million based on the board of directors’ decision of November 4, 2015 and in compliance with the conditions set out in the “Amended law of August 10, 1915 on commercial companies” regarding the payment of interim dividends.
9. Taxes
For the financial year ended December 31, 2015 the Company did not realize any profits subject to tax in Luxembourg and will therefore be only subject to the minimum income tax applicable to a Soparfi (société de participations financières). The Company is also liable to the minimum Net Wealth Tax.

165.
Ann
ual R
epor
t
10. Balances with affiliated undertakings
Expressed in United States Dollars
ASSETS
DEBTORS
becoming due and payable within one year
Tenaris Solutions A.G.
Others
Total
NON-SUBORDINATED DEBTS
becoming due and payable within one year
Siderca Sociedad Anónima Industrial y Comercial
Dalmine S.p.A.
Tenaris Solutions Uruguay S.A.
Tubos de Acero de México S.A.
Maverick Tube Corporation
Tenaris Solutions AG
SIAT Sociedad Anónima
Others
becoming due and payable after more than one year
Siderca Sociedad Anónima Industrial y Comercial
Tenaris Solutions AG
Tenaris Solutions Uruguay S.A.
Total
Total at December 31, 2014
2,527,543
639
2,528,182
3,155,569
1,577,664
363,670
277,331
277,592
94,586
1,423,769
16,305
13,085,389
6,733,038
264,422
27,269,335
Total atDecember 31, 2015
4,304,708
737
4,305,445
3,279,001
1,425,235
194,471
482,368
1,550,104
–
103,740
874
11,530,043
6,514,874
415,442
25,496,152
After morethan one year
–
–
–
–
–
–
–
–
–
–
–
11,530,043
6,514,874
415,442
18,460,359
Within a year
4,304,708
737
4,305,445
3,279,001
1,425,235
194,471
482,368
1,550,104
–
103,740
874
–
–
–
7,035,793

166.
Tena
ris
12. Parent Company
As of December 31, 2015:
San Faustin S.A., a Luxembourg Société Anonyme (“San Faustin”), owned 713,605,187 shares in the Company, representing 60.45% of the Company’s capital and voting rights.
San Faustin owned all of its shares in the Company through its wholly-owned subsidiary Techint Holdings S.à r.l., a Luxembourg Société à Responsabilité Limitée (“Techint”), who is the holder of record of the above-mentioned Tenaris shares.
Rocca & Partners Stichting Administratiekantoor Aandelen San Faustin, a Dutch private foundation (Stichting) (“RP STAK”) held shares in San Faustin sufficient in number to control San Faustin.
No person or group of persons controls RP STAK.
Based on the information most recently available to the Company, Tenaris’ directors and senior management as a group owned 0.12% of the Company’s outstanding shares.
13. Subsequent event
Annual Dividend Proposal
On February 24, 2016 the Company’s board of directors proposed, for the approval of the annual general shareholders' meeting to be held on May 4, 2016, the payment of an annual dividend of USD 0.45 per share (USD 0.90 per ADS) or approximately USD 531.2 million, which includes the interim dividend of USD 0.15 per share (USD 0.30 per ADS), or approximately USD 177.1 million, paid in November 2015. If the annual dividend is approved by the shareholders, a dividend of USD 0.30 per share (USD 0.60 per ADS), or approximately USD 354.1 million will be paid on May 25, 2016, with an ex-dividend date of May 23, 2016. These annual accounts do not reflect this dividend payable.
/s/ Edgardo CarlosChief Financial Officer
•
•
•
•
11. Other operating charges
Services and fees
Board of director’s accrued fees
Others
21,242,051
1,025,000
715,855
22,982,906
26,825,906
1,025,000
712,167
28,563,073
Expressed in United States Dollars
2015 2014

167.
Ann
ual R
epor
t
Investor Relations Director
Giovanni Sardagna
Luxembourg Office
29 avenue de la Porte-Neuve3rd FloorL-2227 Luxembourg(352) 26 47 89 78 tel(352) 26 47 89 79 fax
Phones
USA 1 888 300 5432Argentina (54) 11 4018 2928Italy (39) 02 4384 7654Mexico (52) 55 5282 9929
Stock information
New York Stock Exchange (TS)Mercato Telematico Azionario (TEN)Mercado de Valores de Buenos Aires (TS)Bolsa Mexicana de Valores, S.A. de C.V. (TS)
General inquiries
ADS depositary bank
Deutsche BankCUSIP No. 88031M019
Internet
www.tenaris.com
Investor information

www.tenaris.com