Animal Feed Phosphates Outlook to 2030€¦ · Figure 39: MGA Price Benchmarks, Q4 2015 to Q4 2019...
15
Agribusiness | Fertecon Animal Feed Phosphates Outlook to 2030 A study on the feed-grade phosphates market structure and future trends prepared by industry experts
Transcript of Animal Feed Phosphates Outlook to 2030€¦ · Figure 39: MGA Price Benchmarks, Q4 2015 to Q4 2019...
Agribusiness | Fertecon
Animal Feed Phosphates Outlook to 2030A study on the feed-grade phosphates market structure and future trends prepared by industry experts

Fertecon: Animal Feed Phosphates Outlook to 2030 Contents
Copyright © 2019 IHS Markit. All Rights Reserved 3 www.agribusinessintelligence.com
Executive Summary ............................................................................................................................. 9
1.1 Foreword: Welcome to Fertecon’s market outlook report for Feed Phosphates. ............................................... 9
1.2 Introduction: The Role of Feed-grade Phosphates ............................................................................................ 10
1.3 Potential competitors to feed-grade phosphates and their limitations ............................................................ 11
1.4 Feed-grade phosphates in the general context of dietary phosphorus ............................................................. 12
1.5 The supply side of the market: recent developments and a look at the future ................................................. 16
1.6 Price outlook through to 2030 – key concepts and assumptions ...................................................................... 20
2. Product Characteristics ............................................................................................................ 23
2.1 Regulatory issues ............................................................................................................................................... 23
3. Outlook for Supply and Trade ................................................................................................. 25
3.2 Regional Supply and Trade ................................................................................................................................. 28
4. A Review of Key Producers ...................................................................................................... 46
4.1 Aliphos/EcoPhos, Belgium ................................................................................................................................. 46
4.2 Phosphea, France ............................................................................................................................................... 46
4.3 Fosfitalia Group, Italy ......................................................................................................................................... 47
4.4 Yara, Norway ...................................................................................................................................................... 47
4.5 PhosAgro, Russia ................................................................................................................................................ 48
4.6 EuroChem, Russia .............................................................................................................................................. 48
4.7 Mosaic, USA ....................................................................................................................................................... 49
4.8 Nutrien, Canada ................................................................................................................................................. 49
4.9 J. R. Simplot, USA ............................................................................................................................................... 50
4.10 OCP Group, Morocco ......................................................................................................................................... 50
5. Outlook for Demand of Feed Phosphates ............................................................................... 52
5.1 Demand Drivers ................................................................................................................................................. 52
5.2 Global Feed phosphates Demand ...................................................................................................................... 57
5.3 Regional Demand ............................................................................................................................................... 58
6. Country Level Supply-Demand Balance .................................................................................. 69
6.1 Brazil .................................................................................................................................................................. 69
6.2 China .................................................................................................................................................................. 70
6.3 Egypt .................................................................................................................................................................. 72
6.4 Finland ............................................................................................................................................................... 73
6.5 France ................................................................................................................................................................ 74
6.6 Germany ............................................................................................................................................................ 75
6.7 Italy .................................................................................................................................................................... 76
6.8 Japan .................................................................................................................................................................. 77
6.9 Lithuania ............................................................................................................................................................ 78
Please find the contents and sample pages below. If you have any questions, or would like to speak to a member of our team about this report please use our contact us page.
Contents
Fertecon: Animal Feed Phosphates Outlook to 2030 Contents
Copyright © 2019 IHS Markit. All Rights Reserved 4 www.agribusinessintelligence.com
6.10 Morocco ............................................................................................................................................................. 79
6.11 Netherlands ....................................................................................................................................................... 80
6.12 Peru .................................................................................................................................................................... 81
6.13 Poland ................................................................................................................................................................ 82
6.14 Russia ................................................................................................................................................................. 83
6.15 Saudi Arabia ....................................................................................................................................................... 84
6.16 South Africa ........................................................................................................................................................ 85
6.17 Spain .................................................................................................................................................................. 86
6.18 Thailand ............................................................................................................................................................. 87
6.19 Tunisia ................................................................................................................................................................ 88
6.20 Turkey ................................................................................................................................................................ 89
6.21 United States ...................................................................................................................................................... 90
6.22 Vietnam .............................................................................................................................................................. 91
7. Production Cost ....................................................................................................................... 92
7.1 Methodology and Coverage ............................................................................................................................... 92
7.2 Production Processes ......................................................................................................................................... 93
7.3 Assumptions for Individual Producers ............................................................................................................... 94
7.4 Feed Phosphate Cost Curves for 2018 ............................................................................................................. 106
8. Prices ...................................................................................................................................... 111
8.1 Introduction, Methodology and Coverage ....................................................................................................... 111
8.2 Review of Marginal Cost .................................................................................................................................. 113
8.3 The Outlook for Feed Phosphate Prices to 2030 .............................................................................................. 114
9. Statistical Appendix ............................................................................................................... 118
9.1 Introduction ..................................................................................................................................................... 118
9.2 Feed Grade Calcium Phosphate Capacity (‘000 tonnes) .................................................................................. 119
9.3 Feed-Grade Calcium Phosphates – Operating Rate (%) ................................................................................... 127
9.4 Feed-Grade Calcium Phosphates – Production (‘000 tonnes) ......................................................................... 135
9.5 Feed Grade Calcium Phosphates – Exports (‘000 tonnes) ............................................................................... 143
9.6 Feed-Grade Calcium Phosphates – Imports (‘000 tonnes) ............................................................................... 151
9.7 Feed-Grade Calcium Phosphates – Apparent Demand (‘000 tonnes) .............................................................. 159
9.8 Feed-Grade Calcium Phosphates – Benchmark Prices (US$/t) ........................................................................ 167
List of Figures
Figure 1: Total Digestible Phosphorus Demand by Species ..................................................................................... 13
Figure 2: The Geography of Digestible Phosphorus by Species Class, 2018 ............................................................ 13
Figure 3: Total Digestible Phosphorus Demand by Region ...................................................................................... 14
Figure 4: Total Digestible Phosphorus Requirement Versus Feed-Grade Phosphate Demand ............................... 15
Figure 5: The role of Feed-Grade Phosphates in the Overall Digestible Phosphorus Market .................................. 16
Figure 6: Share of Global Production by Major Producing Countries, 2018 ............................................................ 17
Figure 7: Feed-Grade Calcium Phosphate Production by Region, 2010-2030 ......................................................... 17
Figure 8: DCP and MCP Cost Curves by Cost Entry, 2018 ......................................................................................... 19

Fertecon: Animal Feed Phosphates Outlook to 2030 Contents
Copyright © 2019 IHS Markit. All Rights Reserved 5 www.agribusinessintelligence.com
Figure 9: Fertecon’s long-term price forecast for feed-grade calcium phosphates through to 2030 ...................... 21
Figure 10: Global Calcium Phosphates Capacity Outlook by Region .......................................................................... 26
Figure 11: Global: Feed Phosphates Export by Region .............................................................................................. 28
Figure 12: European Capacity Share, 2019 (%) .......................................................................................................... 29
Figure 13: Europe Feed Phosphates Production 2015-2030 ...................................................................................... 30
Figure 14: Europe Feed Phosphates Exports By Exporting Country ........................................................................... 30
Figure 15: Eurasia, Central Asia & Southern Asia Feed Phosphates Production 2015-2030 ...................................... 32
Figure 16: Eurasia, Central Asia & Southern Asia Feed Phosphates Exports By Exporting Country .......................... 33
Figure 17: Africa Feed Phosphates Production 2015-2030 (‘000 tonnes) .................................................................. 35
Figure 18: Africa Feed Phosphates Exports By Exporting Country ............................................................................. 36
Figure 19: Middle East Feed Phosphates Production 2015-2030 .............................................................................. 37
Figure 20: Middle East Feed Phosphates Exports By Exporting Country ................................................................... 38
Figure 21: Eastern & South-Eastern Asia Excluding China Feed Phosphates Production 2015-2030 ........................ 39
Figure 22: Eastern & South-Eastern Asia Excluding China Feed Phosphates Exports By Exporting Country ............. 40
Figure 23: China Feed Phosphates Production 2015-2030 ........................................................................................ 41
Figure 24: China Feed Phosphates Exports as Part of Global Trade .......................................................................... 42
Figure 25: United States Feed Phosphates Exports ................................................................................................... 43
Figure 26: Latin America Feed Phosphates Production 2015-2030 ........................................................................... 44
Figure 27: Latin America Feed Phosphates Exports By Exporting Country ................................................................ 45
Figure 28: Global Meat Consumption and population growth, historic and Forecast ............................................... 52
Figure 29: Developing Countries Meat Consumption Forecast ................................................................................. 53
Figure 30: ASF situation in Asia (August 2018 to October 2019) ............................................................................... 55
Figure 31: Monthly Pig Meat Import to China 2017-2019 ......................................................................................... 56
Figure 32: DCP Cost Curve by Region ....................................................................................................................... 106
Figure 33: DCP Cost Curve by Cost Component ....................................................................................................... 106
Figure 34: MCP Cost Curve by Region ...................................................................................................................... 108
Figure 35: MCP Cost Curve by Cost Component ...................................................................................................... 108
Figure 36: DCP and MCP Cost Curves at FOB Point of Export .................................................................................. 110
Figure 37: DCP Price Benchmarks, 2012 to 2019 ($/t DCP Product) ........................................................................ 113
Figure 38: MCP Price Benchmarks, 2012 to 2019 ($/t MCP Product) ...................................................................... 113
Figure 39: MGA Price Benchmarks, Q4 2015 to Q4 2019 ($/t P2O5) ........................................................................ 115
Figure 40: Fertecon’s long-term price forecast for feed-grade calcium phosphates through to 2030 .................... 116
List of Tables
Table 1: Feed Phosphates Price History and Forecast to 2030 ($/t) ....................................................................... 22
Table 2: Feed phosphates Material Classification and Typical Composition .......................................................... 23
Table 3: Minerals and products derived thereof, defines the Compulsory declarations ....................................... 23
Table 4: Global Feed Phosphates Capacity by Region (‘000 tonnes product) ........................................................ 25
Table 5: Global Feed Grade Calcium Phosphates Capacity by Region (‘000 tonnes product) ................................ 26
Table 6: Global Feed phosphates Production by Region (‘000 tonnes product) .................................................... 27
Table 7: Europe Feed Phosphates Capacity (‘000 tonnes product) ........................................................................ 28
Table 8: Eurasia, Central Asia & Southern Asia Capacity [‘000 tonnes] .................................................................. 31
Table 9: Russian Exports of MCP, 2018 (tonnes) .................................................................................................... 33

Fertecon: Animal Feed Phosphates Outlook to 2030 Contents
Copyright © 2019 IHS Markit. All Rights Reserved 6 www.agribusinessintelligence.com
Table 10: Africa Feed phosphates capacity [‘000 tonnes] ........................................................................................ 34
Table 11: Middle East Feed phosphates capacity [‘000 tonnes] ............................................................................... 36
Table 12: Eastern Asia, Southeast Asia Excluding China Feed phosphates capacity [‘000 tonnes] .......................... 38
Table 13: China Feed phosphates capacity [‘000 tonnes] ........................................................................................ 40
Table 14: North America Feed phosphates capacity [‘000 tonnes] .......................................................................... 42
Table 15: Latin America Feed phosphates capacity [‘000 tonnes] ........................................................................... 43
Table 16: Phosphea Capacity by Plant 2019 [‘000 tonnes/year] .............................................................................. 47
Table 17: MCP Production 2013-2018 [‘000 tonnes/year] ....................................................................................... 48
Table 18: Nutrien Capacity by Plant 2019 [‘000 tonnes/year] .................................................................................. 50
Table 19: Global Animal Count Forecast [million head] ........................................................................................... 54
Table 20: Global Feed phosphates Apparent Demand by Region [‘000 Tonne] ....................................................... 57
Table 21: Europe Animal Count Forecast [‘000 head] .............................................................................................. 58
Table 22: Europe Feed phosphates Apparent Demand by Country (‘000 tonnes) ................................................... 59
Table 23: Eurasia Animal Head Count [million head] ............................................................................................... 60
Table 24: Eurasia Feed phosphates Apparent Demand by Country (‘000 tonnes) ................................................... 60
Table 25: Africa Animal Head Count [million head] .................................................................................................. 61
Table 26: Africa Feed phosphates Apparent Demand by Country (‘000 tonnes) ..................................................... 61
Table 27: Middle East Animal Head Count [million head] ........................................................................................ 62
Table 28: Middle East Feed Phosphates Apparent Demand by Country (‘000 tonnes) ............................................ 62
Table 29: Central & Southern Asia Animal Head Count [million head] ..................................................................... 63
Table 30: Central & Southern Asia Feed phosphates Apparent Demand by Country (‘000 tonnes) ........................ 63
Table 31: Eastern Asia Animal Head Count [million head] ....................................................................................... 64
Table 32: Eastern Asia Feed phosphates Apparent Demand by Country (‘000 tonnes) ........................................... 64
Table 33: Europe Animal Head Count [million head] ................................................................................................ 66
Table 34: Oceania Feed phosphates Apparent Demand by Country (‘000 tonnes) .................................................. 66
Table 35: North America Animal Head Count [million head] ................................................................................... 66
Table 36: North America Feed phosphates Apparent Demand by Country (‘000 tonnes) ....................................... 67
Table 37: Latin America Animal Head Count [million head] ..................................................................................... 67
Table 38: Latin America Feed phosphates Apparent Demand by Country (‘000 tonnes) ........................................ 67
Table 39: Brazil Animal Count Forecast [‘000 head] ................................................................................................. 69
Table 40: Brazil Feed Phosphates S/D Balance [‘000 tonnes] ................................................................................... 69
Table 41: China Animal Count Forecast [‘000 head] ................................................................................................. 70
Table 42: China Feed Phosphates S/D Balance [‘000 tonnes]................................................................................... 71
Table 43: Egypt Animal Count Forecast [‘000 head] ................................................................................................. 72
Table 44: Egypt Feed Phosphates S/D Balance [‘000 tonnes] ................................................................................... 72
Table 45: Finland Animal Count Forecast [‘000 head] .............................................................................................. 73
Table 46: Finland Feed Phosphates S/D Balance [‘000 tonnes] ................................................................................ 73
Table 47: France Animal Count Forecast [‘000 head] ............................................................................................... 74
Table 48: France Feed Phosphates S/D Balance [‘000 tonnes] ................................................................................. 74
Table 49: Germany Animal Count Forecast [‘000 head] ........................................................................................... 75
Table 50: Germany Feed Phosphates S/D Balance [‘000 tonnes] ............................................................................. 75
Table 51: Italy Animal Count Forecast [‘000 head] ................................................................................................... 76
Table 52: Italy Feed Phosphates S/D Balance [‘000 tonnes] ..................................................................................... 76
Table 53: Japan Animal Count Forecast [‘000 head] ................................................................................................. 77

Fertecon: Animal Feed Phosphates Outlook to 2030 Contents
Copyright © 2019 IHS Markit. All Rights Reserved 7 www.agribusinessintelligence.com
Table 54: Japan Feed Phosphates S/D Balance [‘000 tonnes] .................................................................................. 77
Table 55: Lithuania Animal Count Forecast [‘000 head] ........................................................................................... 78
Table 56: Lithuania Feed Phosphates S/D Balance [‘000 tonnes] ............................................................................. 78
Table 57: Morocco Animal Count Forecast [‘000 head] ........................................................................................... 79
Table 58: Morocco Feed Phosphates S/D Balance [‘000 tonnes] ............................................................................. 79
Table 59: Netherlands Animal Count Forecast [‘000 head] ...................................................................................... 80
Table 60: Netherlands Feed Phosphates S/D Balance [‘000 tonnes] ........................................................................ 80
Table 61: Peru Animal Count Forecast [‘000 head] .................................................................................................. 81
Table 62: Peru Feed Phosphates S/D Balance [‘000 tonnes] .................................................................................... 81
Table 63: Poland Animal Count Forecast [‘000 head] ............................................................................................... 82
Table 64: Poland Feed Phosphates S/D Balance [‘000 tonnes] ................................................................................ 82
Table 65: Russia Animal Count Forecast [‘000 head] ................................................................................................ 83
Table 66: Russia Feed Phosphates S/D Balance [‘000 tonnes] ................................................................................. 83
Table 67: Saudi Arabia Animal Count Forecast [‘000 head] ...................................................................................... 84
Table 68: Saudi Arabia Feed Phosphates S/D Balance [‘000 tonnes] ....................................................................... 84
Table 69: South Africa Animal Count Forecast [‘000 head] ...................................................................................... 85
Table 70: South Africa Feed Phosphates S/D Balance [‘000 tonnes] ........................................................................ 85
Table 71: Spain Animal Count Forecast [‘000 head] ................................................................................................. 86
Table 72: Spain Feed Phosphates S/D Balance [‘000 tonnes] ................................................................................... 86
Table 73: Thailand Animal Count Forecast [‘000 head] ............................................................................................ 87
Table 74: Thailand Feed Phosphates S/D Balance [‘000 tonnes] .............................................................................. 87
Table 75: Tunisia Animal Count Forecast [‘000 head] .............................................................................................. 88
Table 76: Tunisia Feed Phosphates S/D Balance [‘000 tonnes] ................................................................................ 88
Table 77: Turkey Animal Count Forecast [‘000 head] ............................................................................................... 89
Table 78: Turkey Feed Phosphates S/D Balance [‘000 tonnes] ................................................................................. 89
Table 79: United States Animal Count Forecast [‘000 head] .................................................................................... 90
Table 80: United States Feed Phosphates S/D Balance [‘000 tonnes] ...................................................................... 90
Table 81: Vietnam Animal Count Forecast [‘000 head] ............................................................................................ 91
Table 82: Vietnam Feed Phosphates S/D Balance [‘000 tonnes] .............................................................................. 91
Table 83: Western and Northern European Production Cost Assessment, 2019 ($/t) ............................................. 95
Table 84: Southern Europe Cost Assessment, 2019 ($/t) ......................................................................................... 96
Table 85: Eurasia and Eastern European Cost Assessment, 2019 ($/t) .................................................................... 97
Table 86: Africa Cost Assessment, 2019 ($/t) ........................................................................................................... 98
Table 87: Middle East Cost Assessment, 2019 ($/t).................................................................................................. 99
Table 88: China Cost Assessment, 2019 ($/t) ......................................................................................................... 101
Table 89: Asia excluding China Cost assessment, 2019 ($/t) .................................................................................. 102
Table 90: North America Cost Assessment, 2019 ($/t) ........................................................................................... 103
Table 91: Latin America Cost Assessment, 2019 ($/t) ............................................................................................ 105
Table 92: Correlations between fob Feed Phosphate Price Points, 2010 – 2019 ................................................... 116
Table 93: Correlations between DCP Price Points, 2010 - 2019 ............................................................................. 116
Table 94: Correlations between MCP Price Points, 2010 – 2019 ............................................................................ 116
Table 95: Feed Phosphates Price History and Forecast to 2030 ($/t) ..................................................................... 117
Fertecon: Animal Feed Phosphates Outlook to 2030 Executive Summary
Copyright © 2019 IHS Markit. All Rights Reserved 9 www.agribusinessintelligence.com
Executive Summary
1.1 Foreword: Welcome to Fertecon’s market outlook report for Feed Phosphates.
This edition marks the first multi-client study prepared by Fertecon analysts on this subject. This felt almost like an
obvious subject matter choice given our team’s significant joint experience on feed phosphate markets, which
complements our typical analysis focussing on fertilizer-grade phosphate products and their upstream raw materials
(phosphate rock, phosphoric acid, sulphur, ammonia).
The market for feed-grade phosphates is considerably smaller in size (on a phosphate basis) compared to fertilizer-
grade products: we estimate about 3.5 million tonnes P2O5 for feed-grade compared to 48 million tonnes for fertilizer-
grade phosphates). Nonetheless, there are three main aspects which we felt were of particular interest when we
chose to undertake this effort:
- Fertecon has long been part of Agribusiness Intelligence, a business unit covering all aspects of the
agricultural value chain “from farm to fork” – this business unit has now become IHS Markit Agribusiness, our
current home. Thanks to this integration, we have direct access to industry experts, proprietary market
intelligence and data projections for various aspects of the livestock industry – both for the short and long
term. This gives us confidence that our forecasts for market fundamentals are uniquely rooted in expert
knowledge, and therefore we hope these will be a useable reference for our readership in their business
activities.
- The markets for feed-grade and fertilizer-grade phosphates share many features: companies involved in
either of these two industries are in many cases also significant players in the other; common macro-drivers
such as food demand, population growth, climate change, circular economy, or precision agriculture are
common across industries; also, from a supply point of view, much of the value chain is common across feed-
grade and fertilizer-grade phosphates. This significant overlap allows for knowledge transfer across the two
markets, mutually reinforcing our analytical offering on each of these two industries – and importantly
providing a holistic view of phosphate markets based on common assumptions.
- While relatively small in size, the market for feed-grade phosphates is a very important driver of merchant
demand for phosphoric acid in various areas, notably in Europe, Turkey, Southeast Asia, Brazil, Mexico to
name some of the most important markets. This is of particular interest in today’s market conditions, with
many companies aiming at investing either in additional merchant phosphoric acid capacity (for which the
feed industry would be an important demand-side factor) or directly in feed-grade phosphate capacity. Feed-
grade phosphate producers are also important contributors to import demand for phosphate rock.
This report aims at being a first step towards a more comprehensive Fertecon offering of market intelligence services
for the feed phosphate industry. We hope that this study will prove to a broad audience that Fertecon has the
capability of performing good-quality, insightful analysis on this market, encouraging us to progressively add more
regular and even deeper tools for players exposed to this fascinating industry.
Thanks for your attention and we wish you an interesting read.
The Fertecon Team
SAMPLE
Fertecon: Animal Feed Phosphates Outlook to 2030 Chapter 3
Copyright © 2019 IHS Markit. All Rights Reserved 38 www.agribusinessintelligence.com
3.2.4.2 Regional Trade
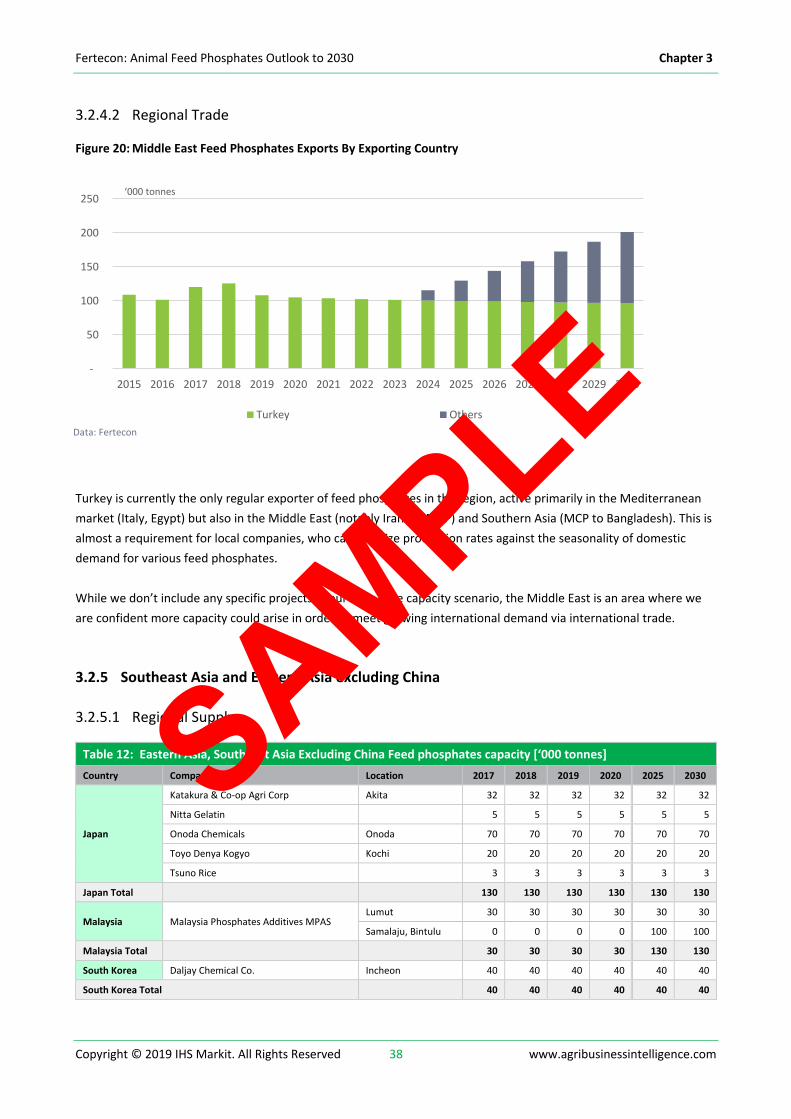
Figure 20: Middle East Feed Phosphates Exports By Exporting Country
Turkey is currently the only regular exporter of feed phosphates in the region, active primarily in the Mediterranean
market (Italy, Egypt) but also in the Middle East (notably Iran for MCP) and Southern Asia (MCP to Bangladesh). This is
almost a requirement for local companies, who can stabilize production rates against the seasonality of domestic
demand for various feed phosphates.
While we don’t include any specific projects in our base-case capacity scenario, the Middle East is an area where we
are confident more capacity could arise in order to meet growing international demand via international trade.
3.2.5 Southeast Asia and Eastern Asia excluding China
3.2.5.1 Regional Supply
Table 12: Eastern Asia, Southeast Asia Excluding China Feed phosphates capacity [‘000 tonnes]
Country Company Location 2017 2018 2019 2020 2025 2030
Japan
Katakura & Co-op Agri Corp Akita 32 32 32 32 32 32
Nitta Gelatin 5 5 5 5 5 5
Onoda Chemicals Onoda 70 70 70 70 70 70
Toyo Denya Kogyo Kochi 20 20 20 20 20 20
Tsuno Rice 3 3 3 3 3 3
Japan Total 130 130 130 130 130 130
Malaysia Malaysia Phosphates Additives MPAS Lumut 30 30 30 30 30 30
Samalaju, Bintulu 0 0 0 0 100 100
Malaysia Total 30 30 30 30 130 130
South Korea Daljay Chemical Co. Incheon 40 40 40 40 40 40
South Korea Total 40 40 40 40 40 40
-
50
100
150
200
250
2015 2016 2017 2018 2019 2020 2021 2022 2023 2024 2025 2026 2027 2028 2029 2030
‘000 tonnes
Turkey Others
Data: Fertecon
SAMPLE

Fertecon: Animal Feed Phosphates Outlook to 2030 Chapter 4
Copyright © 2019 IHS Markit. All Rights Reserved 47 www.agribusinessintelligence.com
DCP. In 2014 the company acquired the feed phosphates activities of a Spanish company Ercros. With two additional
production plants in Cartagena and Flix. Following the acquisition, the company changes its name from Timab to
Phosphea. Phosphea also owns marketing rights for MCP exports out of the Prahovo plant in Serbia, managed by Elixir
Group.
The company operates three plants in Western Europe and two in Tunisia
Table 16: Phosphea Capacity by Plant 2019 [‘000 tonnes/year]
Plant Capacity Products
Saint-Malo, France 200 MCP, DCP, MDCP, MAG 26, NEOPHOS
Flix, Spain 100 DCP
Cartagena, Spain 100 DCP
Gabès I & II, Tunisia 170 MCP, DCP
Total 570
Source: Fertecon, 2019 and Phosphea5
4.3 Fosfitalia Group, Italy
Fosfitalia Group s.p.a is a sizeable Italian producer of inorganic feed phosphates. The company was established in 1975
and operates two plants, one in Forli, with 125,000 tonnes per year capacity and one in Ravenna with a capacity of
120,000 tonnes. One of the most important advantages is the location of the company’s premises in Ravenna Port
which provides efficient delivery of raw materials and export activities.
Fosfitalia produces a wide range of phosphate products distributed all around the world:
• Dicalcium Phosphate 17% and 18% P.
• Monodicalcium Phosphate, 20% P.
• Monocalcium Phosphate F, 22.5% P (Fine).
• Monocalcium Phosphate G, 22.5% P (Granular).
4.4 Yara, Norway
Yara International ASA provides environmental and industrial solutions in Norway6 and internationally. It operates
through three segments: Crop Nutrition, Industrial, and Production. The Crop Nutrition segment offers nitrogen-based
fertilizers. It also sells phosphate- and potash-based fertilizers sourced from third parties. It provides its products
5 https://phosphea.com/our-company/phosphea-in-facts-figures/
6 "Yara International (yar.ol) Company Profile & Facts." Insert Name of Site in Italics. N.p., n.d. Web. 23 Oct. 2019
https://finance.yahoo.com/quote/YAR.OL/profile
SAMPLE

Fertecon: Animal Feed Phosphates Outlook to 2030 Chapter 5
Copyright © 2019 IHS Markit. All Rights Reserved 55 www.agribusinessintelligence.com
Figure 30: ASF situation in Asia (August 2018 to October 2019)
Source: FAO14
Official FAO-led monitoring15 efforts are undertaken in close cooperation with local authorities and China’s Ministry of
Agriculture and Rural Affairs (MARA). While official sources confirm a rapid spread of the disease, both the speed and
severity of the spread could prove more pronounced than currently assumed. For instance, reports by government
officials, industry sources and news media suggest that around 20% of China’s pig inventories had already been culled
in the first few months of 2019, amid fears of ASF spreading more rapidly. IHS Markit’s experts suggest numbers
around the low-30% level.
The effect of ASF will be felt even more since pork is the preferred meat in China. For this reason, demand does not
always respond directly to changes in prices, which may see a sustained increase as a result. To avoid soaring pork
prices, with potential impacts on the overall consumer price level and general inflation, China may have to turn
further to the world market to cover some of its domestic production shortfalls. To what extent is a question that is
impossible to answer precisely but given the size of China’s meat market and the production shortfall now caused by
ASF, repercussions for the global meat markets could be significant.
As can be seen from the figure below, China has already started to increase its import of pig meat to fulfil domestic
deficiency. Thus, the consumption of feed phosphates could shift accordingly from China to the meat exporting
countries. With US-China trade tensions still very much in play, Germany and Spain (and other European countries)
14 FAO – Food Outlook, May 2019
15 FAO – Food Outlook, May 2019
SAMPLE
Fertecon: Animal Feed Phosphates Outlook to 2030 Chapter 5
Copyright © 2019 IHS Markit. All Rights Reserved 68 www.agribusinessintelligence.com
Guatemala 9 16 7 14 14 14 14 15 0.65%
Venezuela 60 56 32 13 13 14 13 13 -0.34%
Dominican Republic
23 18 12 13 13 14 16 19 3.03%
Cuba 11 11 5 11 11 11 12 12 0.88%
Costa Rica 6 8 11 9 9 9 9 10 1.03%
Paraguay 4 6 8 9 10 10 15 19 6.80%
Others 26 24 26 26 26 27 32 38 3.05%
Total 780 929 878 685 715 748 910 1075 3.82%
Source: Fertecon
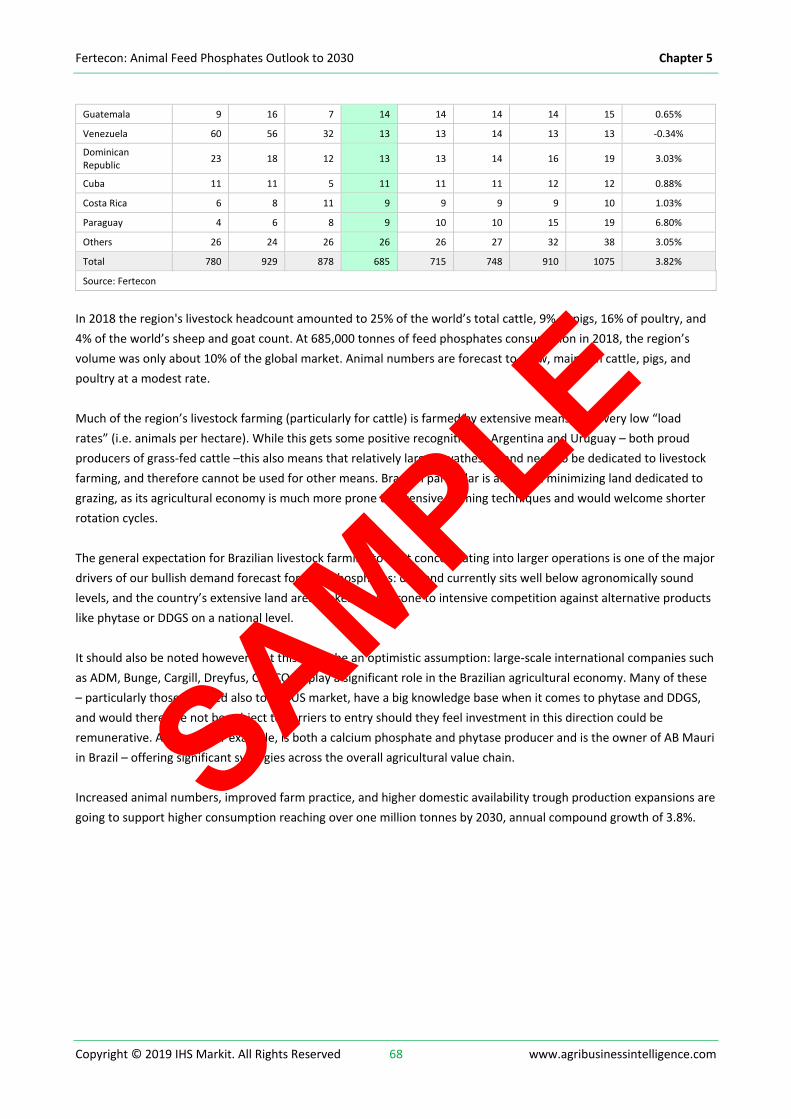
In 2018 the region's livestock headcount amounted to 25% of the world’s total cattle, 9% of pigs, 16% of poultry, and
4% of the world’s sheep and goat count. At 685,000 tonnes of feed phosphates consumption in 2018, the region’s
volume was only about 10% of the global market. Animal numbers are forecast to grow, mainly in cattle, pigs, and
poultry at a modest rate.
Much of the region’s livestock farming (particularly for cattle) is farmed by extensive means, with very low “load
rates” (i.e. animals per hectare). While this gets some positive recognition in Argentina and Uruguay – both proud
producers of grass-fed cattle –this also means that relatively larger swathes of land need to be dedicated to livestock
farming, and therefore cannot be used for other means. Brazil in particular is aiming at minimizing land dedicated to
grazing, as its agricultural economy is much more prone to intensive farming techniques and would welcome shorter
rotation cycles.
The general expectation for Brazilian livestock farming to start concentrating into larger operations is one of the major
drivers of our bullish demand forecast for feed phosphates: demand currently sits well below agronomically sound
levels, and the country’s extensive land area makes it less prone to intensive competition against alternative products
like phytase or DDGS on a national level.
It should also be noted however that this might be an optimistic assumption: large-scale international companies such
as ADM, Bunge, Cargill, Dreyfus, COFCO all play a significant role in the Brazilian agricultural economy. Many of these
– particularly those exposed also to the US market, have a big knowledge base when it comes to phytase and DDGS,
and would therefore not be subject to barriers to entry should they feel investment in this direction could be
remunerative. AB foods, for example, is both a calcium phosphate and phytase producer and is the owner of AB Mauri
in Brazil – offering significant synergies across the overall agricultural value chain.
Increased animal numbers, improved farm practice, and higher domestic availability trough production expansions are
going to support higher consumption reaching over one million tonnes by 2030, annual compound growth of 3.8%. SAMPLE

Fertecon: Animal Feed Phosphates Outlook to 2030 Chapter 7
Copyright © 2019 IHS Markit. All Rights Reserved 92 www.agribusinessintelligence.com
7. Production Cost
7.1 Methodology and Coverage
This chapter presents an assessment of cash costs incurred by key global producers of feed-grade calcium phosphates.
We focussed our research efforts on producers with a stronger connection to international markets, either because
regularly active on export markets or because of their role in determining import requirements in their
domestic/regional markets.
All of the cost estimates provided are generated by Fertecon’s in-house bottom-up model.
The cost curves presented cover about 90% of DCP capacity excluding China, and 75% of MCP capacity excluding
China. Only Chinese producers heavily active in export markets are included in our assessment, accounting for about 1
million tonnes/year DCP capacity and 0.9 million tonnes/year for MCP.
For plants with the flexibility of producing both DCP and MCP, we have included the full plant capacity in both curves –
in other words, the cost curves for DCP and MCP are not additive, as this will result in the double-counting of capacity
for flexible units.
Each production unit around the world follows specific processes that have been developed in many cases by
progressive adaptation and continued improvements that are specific to each site. Details of these processes
constitute an important component of each company’s intellectual property and are covered by commercial secret. In
the absence of visibility on these finer details, our analysis focusses instead on key components such as raw material
pricing, freight costs, and costs related to key utilities such as labour, power, fuel, and process water. Our cost
estimates do not include some important items such as licensing costs, financing costs, or interest charges required to
support working capital flows.
For integrated producers, raw materials are transferred at cost, while producers known to purchase raw materials are
charged raw materials at market prices. A full review of assumptions for each plant is presented in the following
sections.
Hydrochloric acid is transferred at zero price for plants receiving HCl directly from other operations at the same
chemical complex (e.g. from SOP production). While it could be argued that some of the HCl available is indeed sold to
external customers at market price, our assumption is that feed phosphate production was required in order to
balance the outflow of hydrochloric acid in the first instance, and therefore it remains a necessary addition to avoid
disposal costs.
While raw materials are transferred at plant-specific rates which factor in site-specific process flows and logistics,
utilities (i.e. wages, electricity, fuel) are transferred at rates in line with national averages.
SAMPLE
Fertecon: Animal Feed Phosphates Outlook to 2030 Chapter 7
Copyright © 2019 IHS Markit. All Rights Reserved 110 www.agribusinessintelligence.com
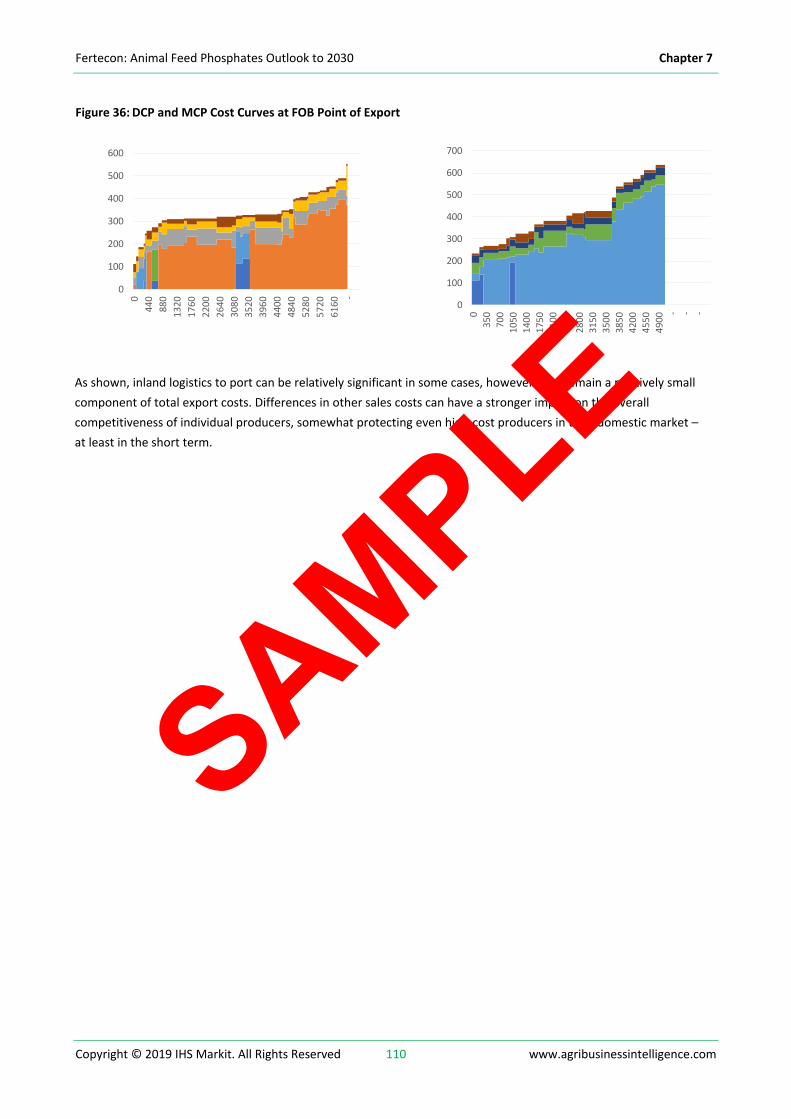
Figure 36: DCP and MCP Cost Curves at FOB Point of Export
As shown, inland logistics to port can be relatively significant in some cases, however they remain a relatively small
component of total export costs. Differences in other sales costs can have a stronger impact on the overall
competitiveness of individual producers, somewhat protecting even high-cost producers in their domestic market –
at least in the short term.
0
100
200
300
400
500
600
0
440
880
13
20
17
60
22
00
26
40
30
80
35
20
39
60
44
00
48
40
52
80
57
20
61
60 -
0
100
200
300
400
500
600
700
0
350
700
1050
1400
1750
2100
2450
2800
3150
3500
3850
4200
4550
4900
- - -
SAMPLE

Fertecon: Animal Feed Phosphates Outlook to 2030 Chapter 8
Copyright © 2019 IHS Markit. All Rights Reserved 113 www.agribusinessintelligence.com
Figure 37: DCP Price Benchmarks, 2012 to 2019 ($/t DCP Product)
Figure 38: MCP Price Benchmarks, 2012 to 2019 ($/t MCP Product)
8.2 Review of Marginal Cost
When thinking about long-term price forecasts, it is important to try and identify the development in the industry’s
marginal cost of production. This could change for a variety of reasons: strong demand growth for example could
make some idled capacity necessary to meet demand irrespective of its cost, or similarly sharp decreases in demand
could make some high-cost suppliers redundant in the market and decrease marginal cost. Clearly each plant’s cost
will also have its own internal dynamic, following for example changes in input costs.
0
100
200
300
400
500
600
700
800
20
12
Q1
20
12
Q2
20
12
Q3
20
12
Q4
20
13
Q1
20
13
Q2
20
13
Q3
20
13
Q4
20
14
Q1
20
14
Q2
20
14
Q3
20
14
Q4
20
15
Q1
20
15
Q2
20
15
Q3
20
15
Q4
20
16
Q1
20
16
Q2
20
16
Q3
20
16
Q4
20
17
Q1
20
17
Q2
20
17
Q3
20
17
Q4
20
18
Q1
20
18
Q2
20
18
Q3
20
18
Q4
20
19
Q1
20
19
Q2
20
19
Q3
$/t fob Med cfr SE Asia cfr Brazil
0
100
200
300
400
500
600
700
800
20
12
Q1
20
12
Q2
20
12
Q3
20
12
Q4
20
13
Q1
20
13
Q2
20
13
Q3
20
13
Q4
20
14
Q1
20
14
Q2
20
14
Q3
20
14
Q4
20
15
Q1
20
15
Q2
20
15
Q3
20
15
Q4
20
16
Q1
20
16
Q2
20
16
Q3
20
16
Q4
20
17
Q1
20
17
Q2
20
17
Q3
20
17
Q4
20
18
Q1
20
18
Q2
20
18
Q3
20
18
Q4
20
19
Q1
20
19
Q2
20
19
Q3
$/tfob Baltic fob Med fob Tampa cfr SE Asia cfr Brazil
SAMPLE
Fertecon: Animal Feed Phosphates Outlook to 2030 Chapter 9
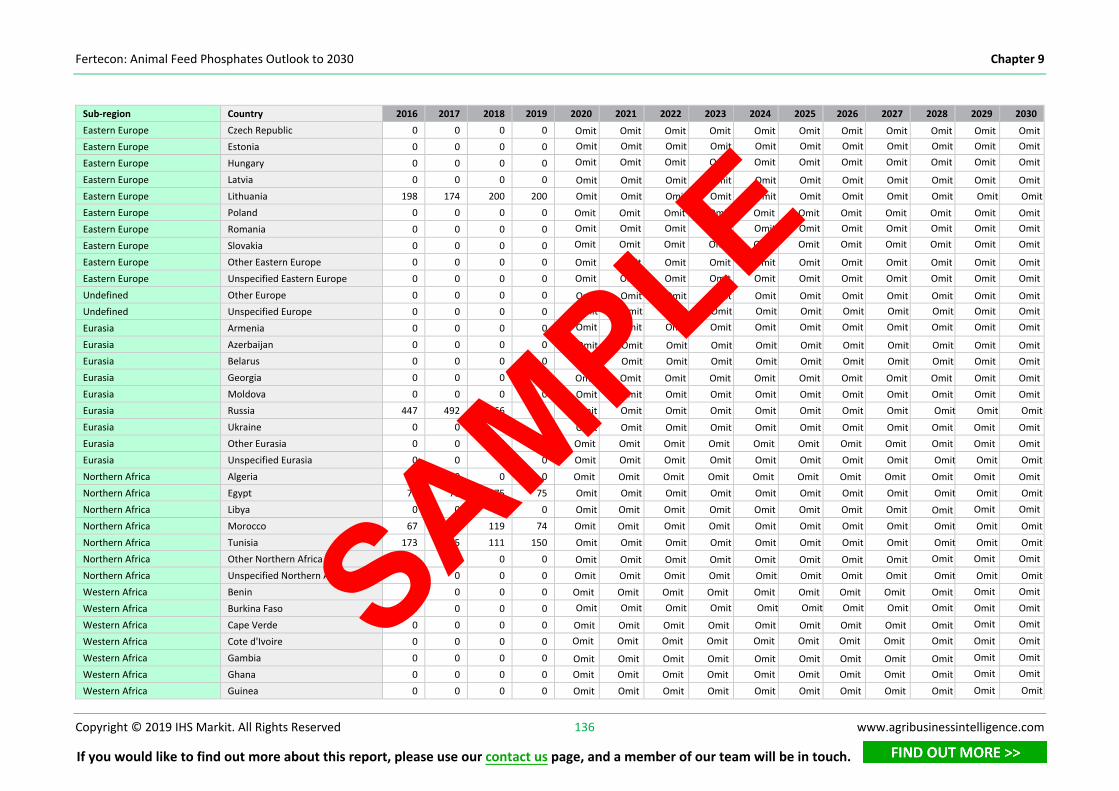
Copyright © 2019 IHS Markit. All Rights Reserved 136 www.agribusinessintelligence.com
Sub-region Country 2016 2017 2018 2019 2020 2021 2022 2023 2024 2025 2026 2027 2028 2029 2030
Eastern Europe Czech Republic 0 0 0 0
Eastern Europe Estonia 0 0 0 0
Eastern Europe Hungary 0 0 0 0
Eastern Europe Latvia 0 0 0 0
Eastern Europe Lithuania 198 174 200 200 Omit Omit Omit Omit Omit Omit Omit Omit Omit Omit Omit Eastern Europe Poland 0 0 0 0
Eastern Europe Romania 0 0 0 0
Eastern Europe Slovakia 0 0 0 0
Eastern Europe Other Eastern Europe 0 0 0 0
Eastern Europe Unspecified Eastern Europe 0 0 0 0
Undefined Other Europe 0 0 0 0
Undefined Unspecified Europe 0 0 0 0
Eurasia Armenia 0 0 0 0
Eurasia Azerbaijan 0 0 0 0
Eurasia Belarus 0 0 0 0
Eurasia Georgia 0 0 0 0
Eurasia Moldova 0 0 0 0
Eurasia Russia 447 492 466 480 Omit Omit Omit Omit Omit Omit Omit Omit Omit Omit Omit Eurasia Ukraine 0 0 0 0
Eurasia Other Eurasia 0 0 0 0
Eurasia Unspecified Eurasia 0 0 0 0 Omit Omit Omit Omit Omit Omit Omit Omit Omit Omit Omit Northern Africa Algeria 0 0 0 0
Northern Africa Egypt 75 75 75 75 Omit Omit Omit Omit Omit Omit Omit Omit Omit Omit Omit Northern Africa Libya 0 0 0 0 Omit Omit Omit Northern Africa Morocco 67 93 119 74 Omit Omit Omit Omit Omit Omit Omit Omit Omit Omit Omit Northern Africa Tunisia 173 145 111 150 Omit Omit Omit Omit Omit Omit Omit Omit Omit Omit Omit Northern Africa Other Northern Africa 0 0 0 0
Northern Africa Unspecified Northern Africa 0 0 0 0 Omit Omit Omit Omit Omit Omit OmitWestern Africa Benin 0 0 0 0
Western Africa Burkina Faso 0 0 0 0
Western Africa Cape Verde 0 0 0 0
Western Africa Cote d'Ivoire 0 0 0 0
Western Africa Gambia 0 0 0 0
Western Africa Ghana 0 0 0 0
Western Africa Guinea 0 0 0 0
If you would like to find out more about this report, please use our contact us page, and a member of our team will be in touch.
Omit Omit Omit Omit Omit Omit Omit Omit Omit Omit Omit Omit Omit Omit Omit Omit Omit Omit Omit Omit Omit Omit Omit Omit Omit Omit Omit Omit Omit Omit Omit Omit Omit
Omit Omit Omit Omit Omit Omit Omit Omit Omit Omit Omit
Omit Omit Omit Omit Omit Omit Omit Omit Omit Omit Omit
Omit Omit Omit Omit Omit Omit Omit Omit Omit Omit Omit Omit Omit Omit Omit Omit Omit Omit Omit Omit Omit Omit Omit Omit Omit Omit Omit Omit Omit Omit Omit Omit Omit
Omit Omit Omit Omit Omit Omit Omit Omit Omit Omit Omit
Omit Omit Omit Omit Omit Omit Omit Omit Omit Omit Omit
Omit Omit Omit Omit Omit Omit Omit Omit Omit Omit Omit Omit Omit Omit Omit Omit Omit Omit Omit Omit Omit Omit Omit Omit Omit Omit Omit Omit Omit Omit Omit Omit Omit
Omit Omit Omit Omit Omit Omit Omit Omit Omit Omit Omit
Omit Omit Omit Omit Omit Omit Omit Omit Omit Omit Omit Omit Omit Omit Omit Omit Omit Omit Omit Omit Omit Omit
Omit Omit Omit Omit Omit Omit Omit Omit Omit Omit Omit Omit Omit Omit Omit Omit Omit Omit Omit Omit Omit Omit
Omit Omit Omit Omit Omit Omit Omit Omit Omit Omit Omit
Omit Omit Omit Omit Omit
Omit Omit Omit Omit Omit Omit Omit Omit Omit Omit Omit Omit
Omit
Omit
Omit Omit Omit Omit Omit Omit Omit Omit Omit Omit Omit Omit Omit Omit Omit Omit Omit Omit
Omit Omit Omit Omit Omit Omit Omit Omit Omit Omit Omit Omit Omit Omit Omit Omit Omit Omit
Omit Omit Omit Omit Omit Omit Omit Omit Omit Omit Omit Omit Omit Omit Omit Omit Omit Omit Omit Omit Omit Omit Omit Omit Omit Omit Omit
Omit Omit
Omit Omit
Omit Omit
Omit Omit Omit Omit
Omit Omit
Omit Omit
Omit Omit
Omit Omit
SAMPLE