ANGUS B. GRIEVE-SMITH SAINT JOHN’S UNIVERSITY [email protected] @GRVSMTH How type frequency...
34
ANGUS B. GRIEVE-SMITH SAINT JOHN’S UNIVERSITY [email protected] @GRVSMTH How type frequency gives us S-curves
-
Upload
clarence-rice -
Category
Documents
-
view
226 -
download
0
Transcript of ANGUS B. GRIEVE-SMITH SAINT JOHN’S UNIVERSITY [email protected] @GRVSMTH How type frequency...
ANGUS B. GRIEVE-SMITHSAINT JOHN’S UNIVERSITY
[email protected]@GRVSMTH
How type frequencygives us S-curves
How type frequency gives us S-curves
S-curvesType frequencyProductivity and language changeType frequency in French negation
A recurring pattern in language change
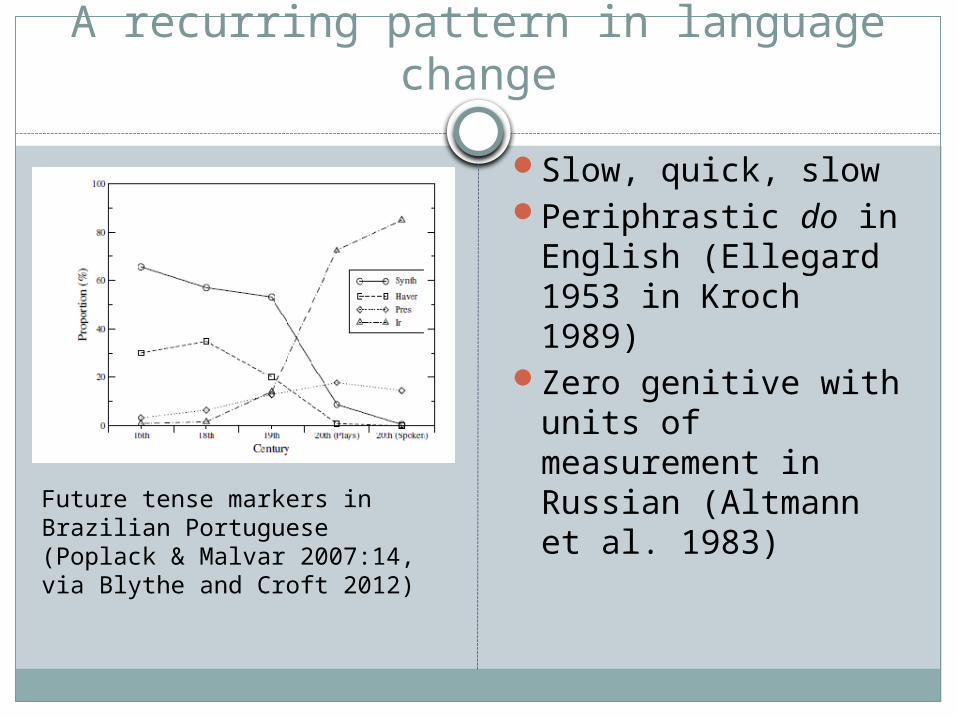
Slow, quick, slowPeriphrastic do in
English (Ellegard 1953 in Kroch 1989)
Zero genitive with units of measurement in Russian (Altmann et al. 1983)
Future tense markers in Brazilian Portuguese (Poplack & Malvar 2007:14, via Blythe and Croft 2012)
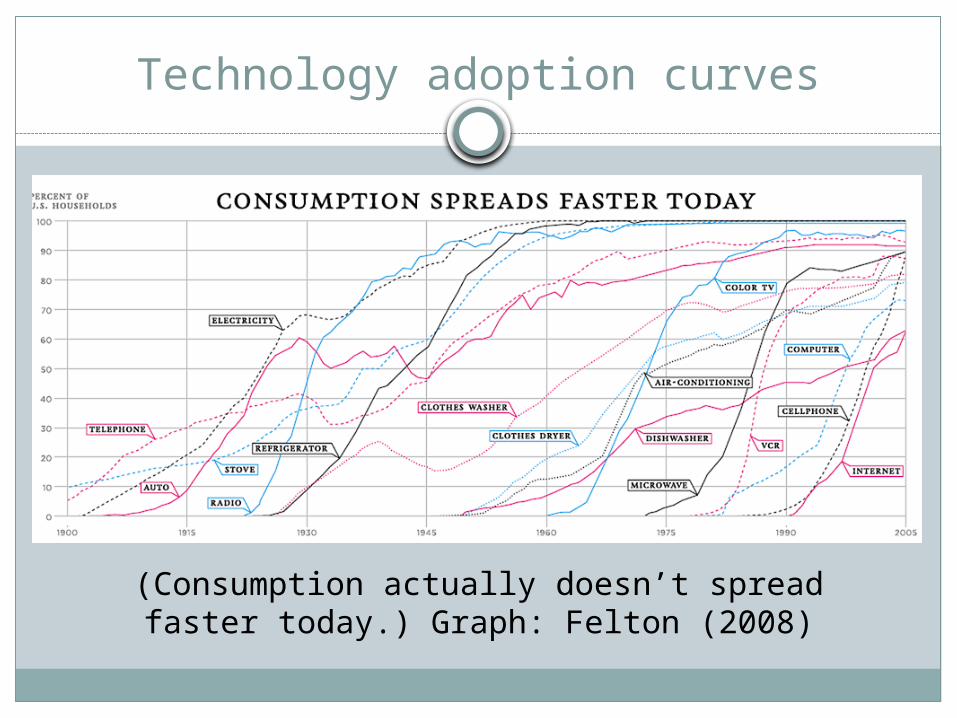
Technology adoption curves
(Consumption actually doesn’t spread faster today.) Graph: Felton (2008)
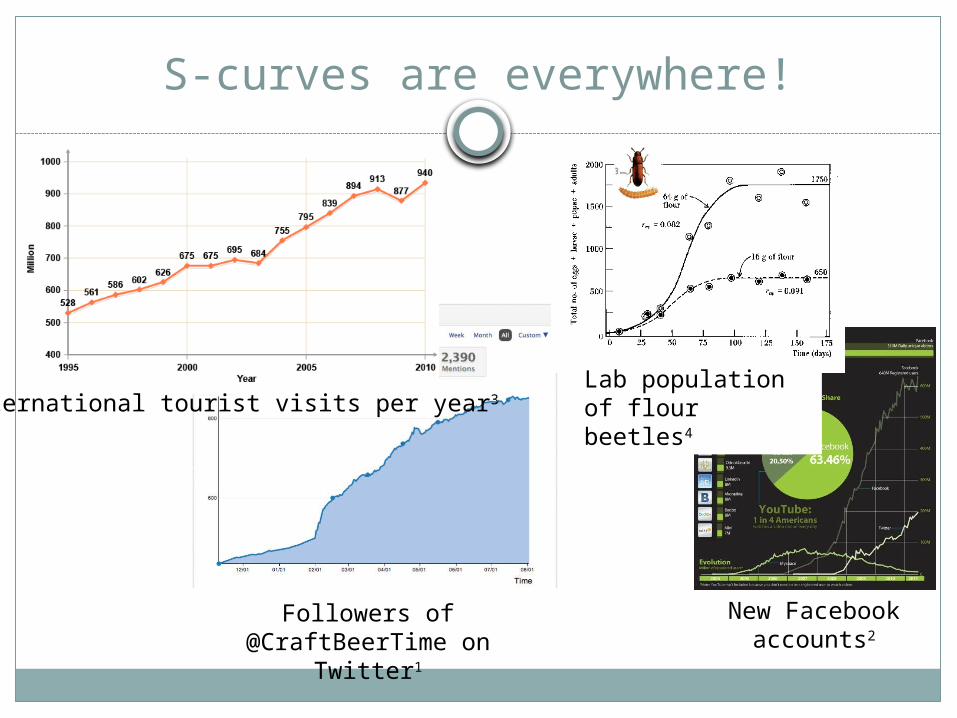
S-curves are everywhere!
Followers of @CraftBeerTime on Twitter1
New Facebook accounts2
International tourist visits per year3Lab population of flour beetles4
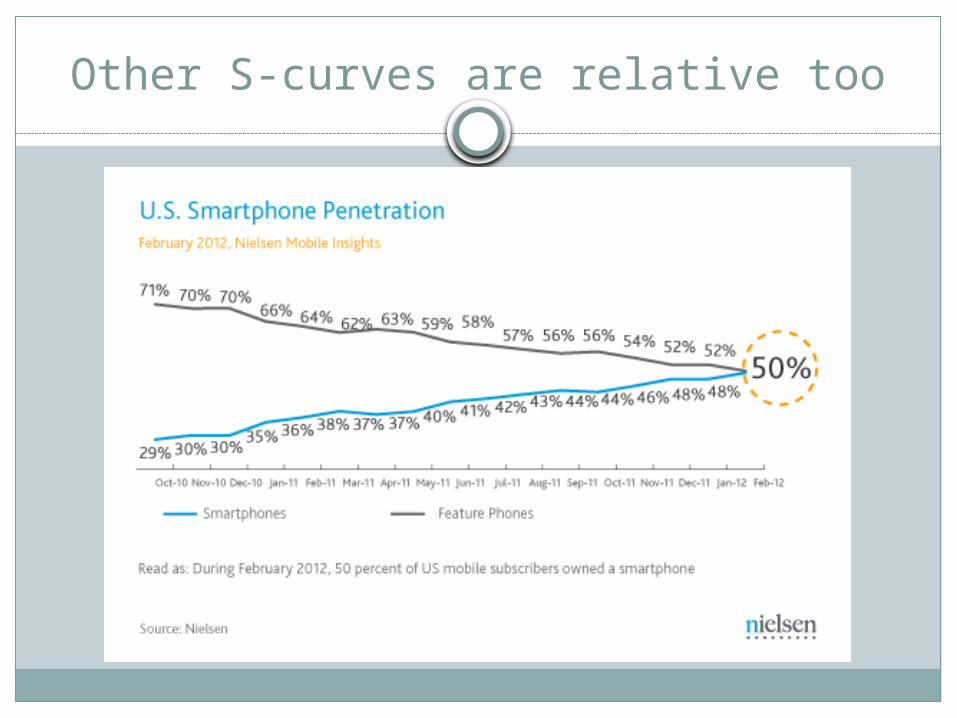
Other S-curves are relative too
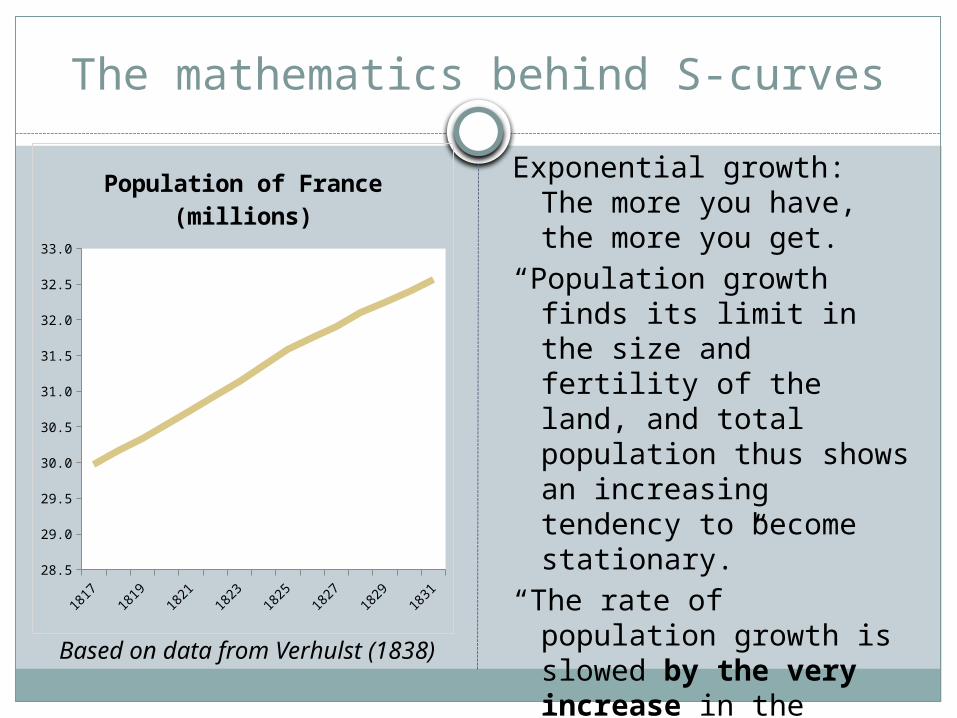
The mathematics behind S-curves
Exponential growth: The more you have, the more you get.
“Population growth finds its limit in the size and fertility of the land, and total population thus shows an increasing tendency to become stationary.”
“The rate of population growth is slowed by the very increase in the number of inhabitants.”
– Verhulst (1838)Based on data from Verhulst
(1838)
1817
1818
1819
1820
1821
1822
1823
1824
1825
1826
1827
1828
1829
1830
1831
28.5
29.0
29.5
30.0
30.5
31.0
31.5
32.0
32.5
33.0
Population of France (millions)
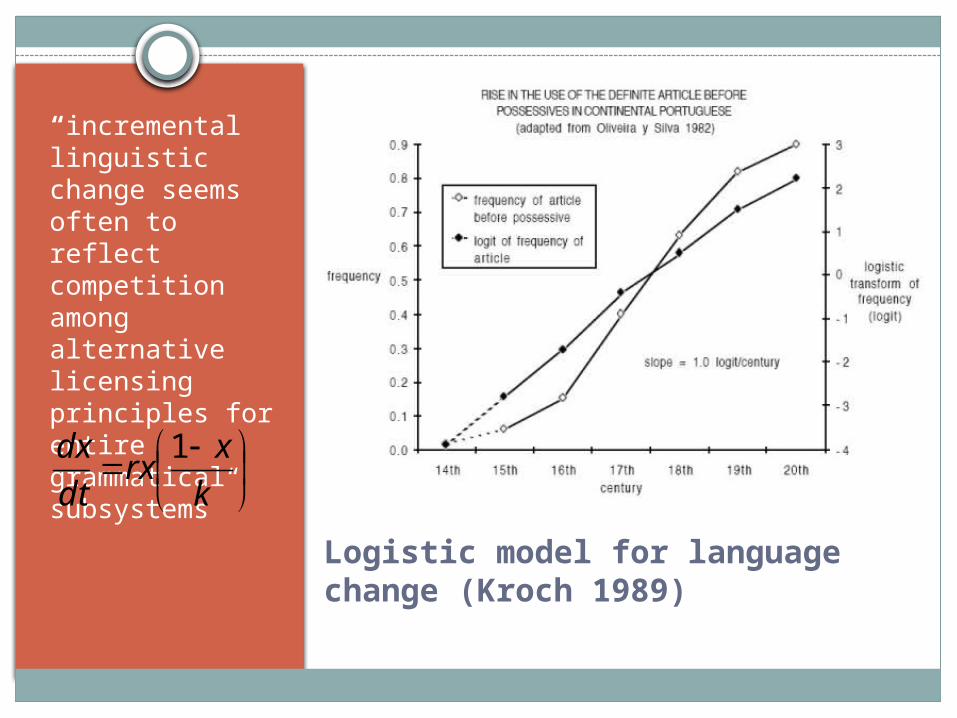
Logistic model for language change (Kroch 1989)
“incremental linguistic change seems often to reflect competition among alternative licensing principles for entire grammatical subsystems”
k
xrx
dt
dx 1

The ingredients of the logistic
Population
Cell phones Language
Exponential growth
Birth Word of mouth ?
Limits Extent and fertility of the land
Language-using population
Checks Misery and vice
Conservatism and lack of interest

What are the forces producing S-curves in language?
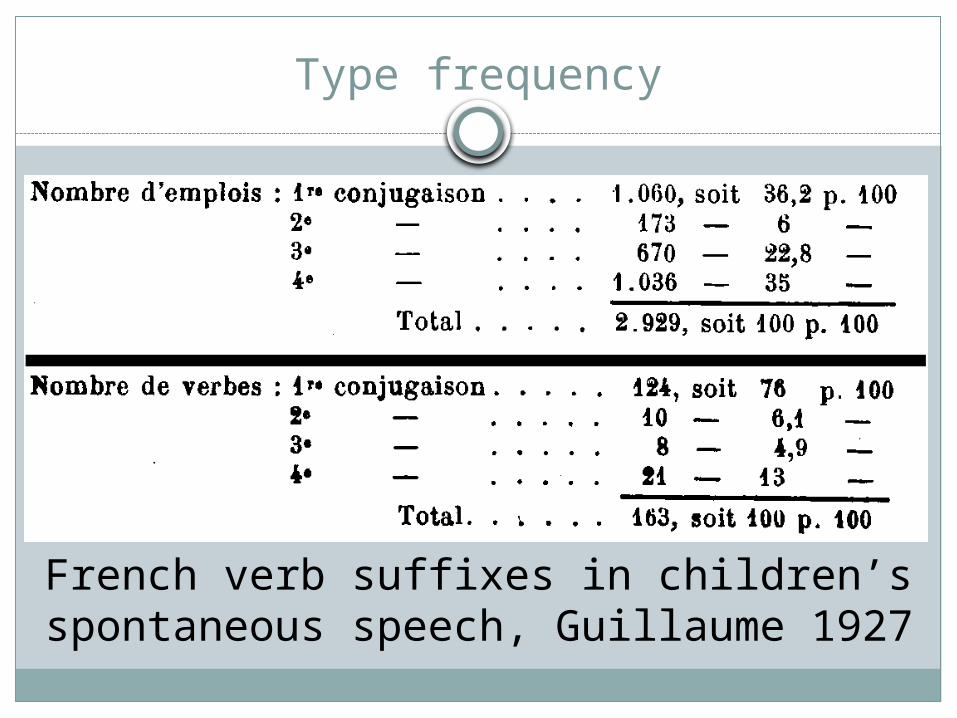
Type frequency
French verb suffixes in children’s spontaneous speech, Guillaume 1927
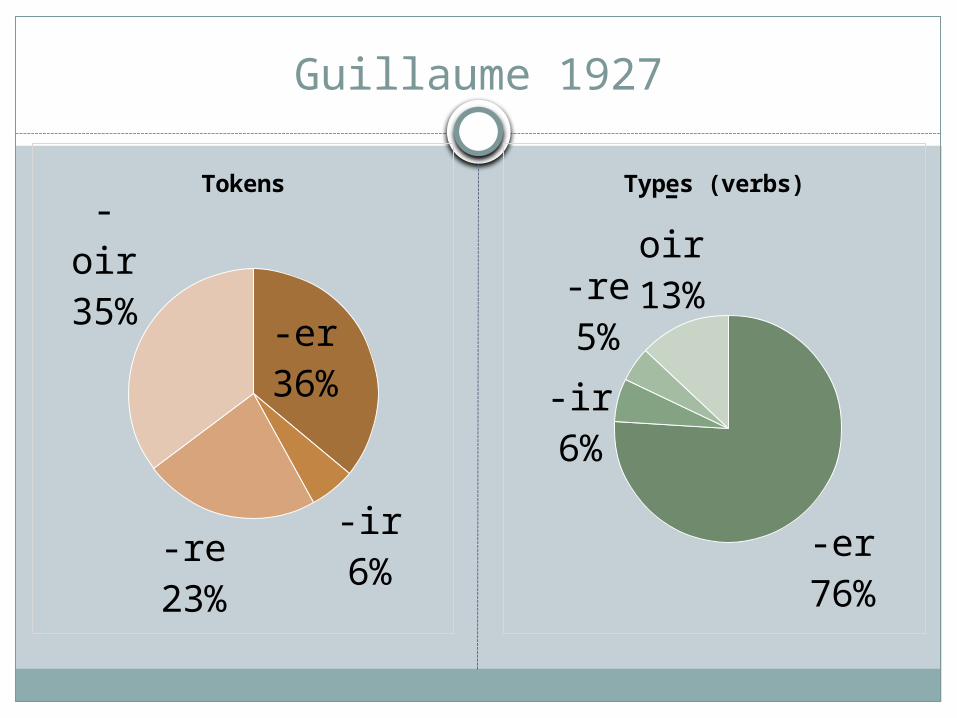
Guillaume 1927
-er36%
-ir6%-re
23%
-oir35%
Tokens
-er76%
-ir6%
-re5%
-oir13%
Types (verbs)
Morphological paradigms as categories
“Rather than seeing names as referring to classes of objects, in morphology we have modifications where classes of forms refer to classes of meanings or concepts. The difference is that, whereas the names are simple, formal realizations of modifications are themselves categories.” –Zager 1981 (45)
Cue validity in categories
“Categories form to maximize the information-rich clusters of attributes in the environment, and, thus, the cue-validity of the attributes of the categories. Prototypes of categories appear to form in such a manner as to maximize the clusters and cue validity within categories.“ – Rosch et al. 1976
Cue validity and productivity
“Return to the speech act where the speaker has no rote form and no automatic modification, and so searches for the nearest semantic/pragmatic equivalent. If they find the intended product is a member of a locally prototypical category (i,e, if, -say, the preterite of a given verb is autonomous) then the nearest; form to select is -the autonomous form of the requisite intended form - say the 2s.” – Zager 1981 (46-47)

Is this just paradigmatic?
“Not only paradigms, however, will fit into this model. Any morphological modification would do equally well — negation, denominals, adverb formation and so on. All cases where a word is not stored by itself, but is formed by altering the form and meaning of some other word obtain.” – Zager 1981 (48)
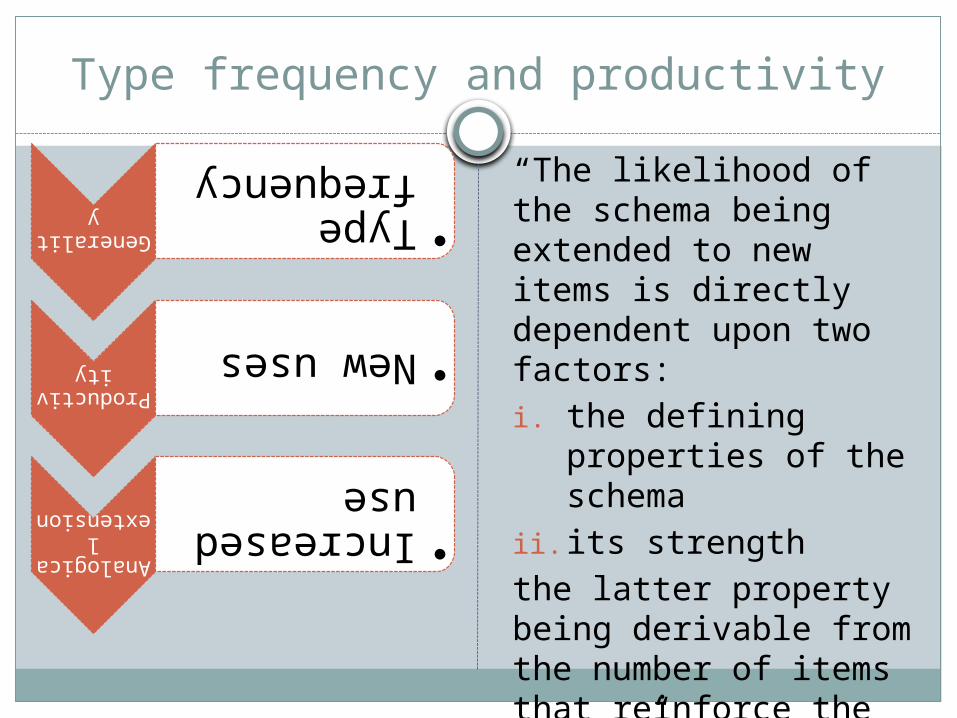
Type frequency and productivity
“The likelihood of the schema being extended to new items is directly dependent upon two factors:i. the defining
properties of the schema
ii. its strengththe latter property being derivable from the number of items that reinforce the schema” – Bybee 1995
Generali
ty
•Type frequency
Productivity
•New uses
Analogical
extensio
n
•Increased use
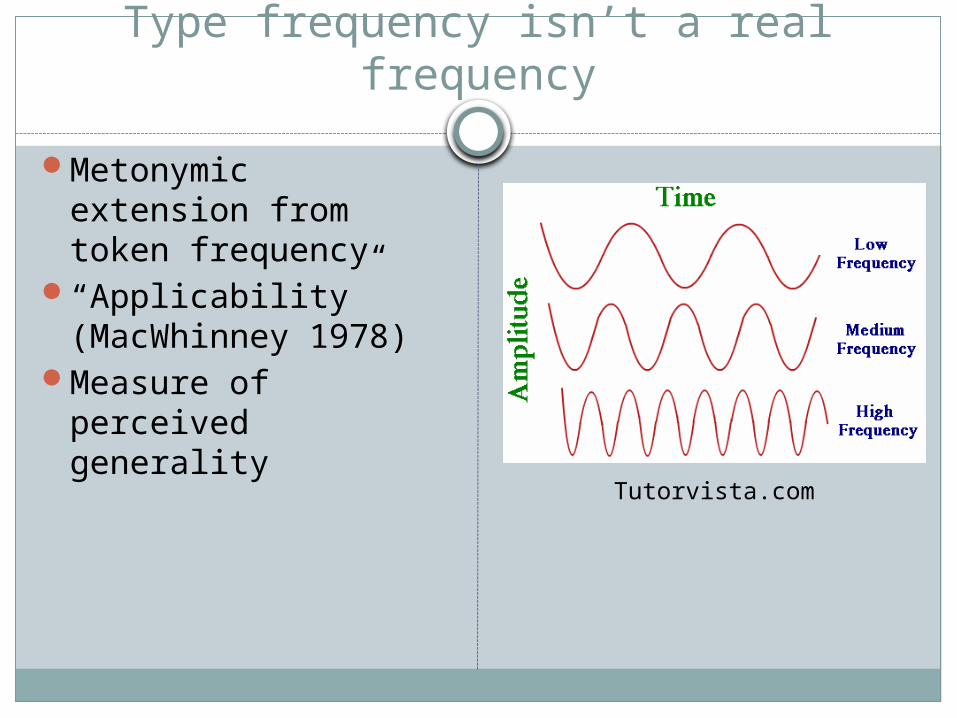
Type frequency isn’t a real frequency
Metonymic extension from token frequency
“Applicability” (MacWhinney 1978)
Measure of perceived generality
Tutorvista.com
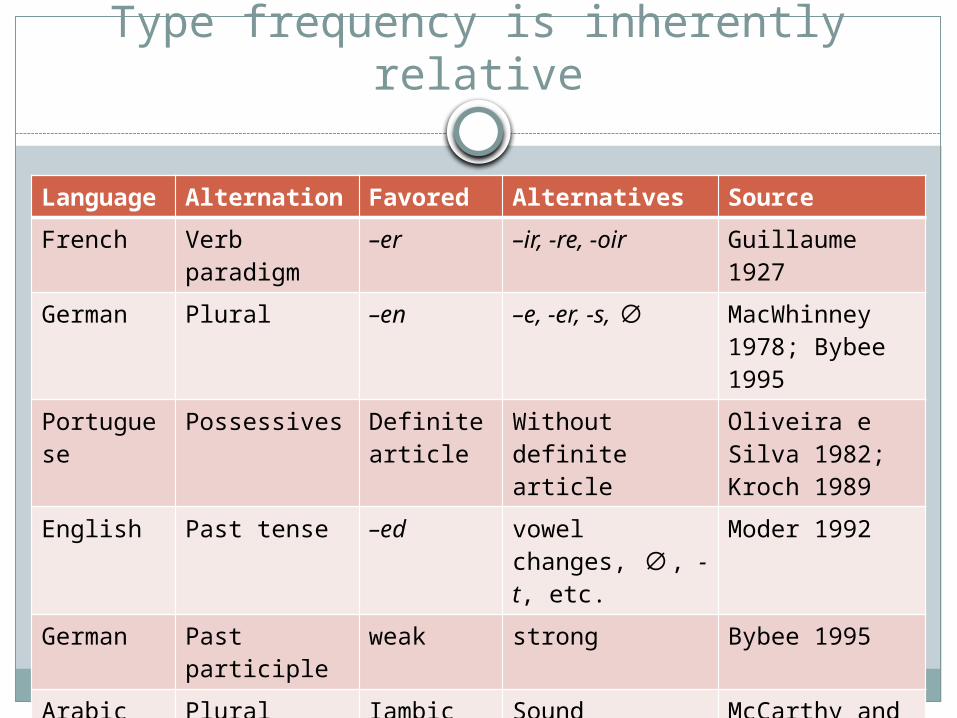
Type frequency is inherently relative
Language
Alternation Favored Alternatives Source
French Verb paradigm
–er –ir, -re, -oir Guillaume 1927
German Plural –en –e, -er, -s, ∅ MacWhinney 1978; Bybee 1995
Portuguese
Possessives Definite article
Without definite article
Oliveira e Silva 1982; Kroch 1989
English Past tense –ed vowel changes, , ∅ -t, etc.
Moder 1992
German Past participle
weak strong Bybee 1995
Arabic Plural Iambic Sound McCarthy and Prince 1990; Bybee 1995
Hausa Plural High -óoCíi
-úCàa etc. Lobben 1991; Bybee 1995
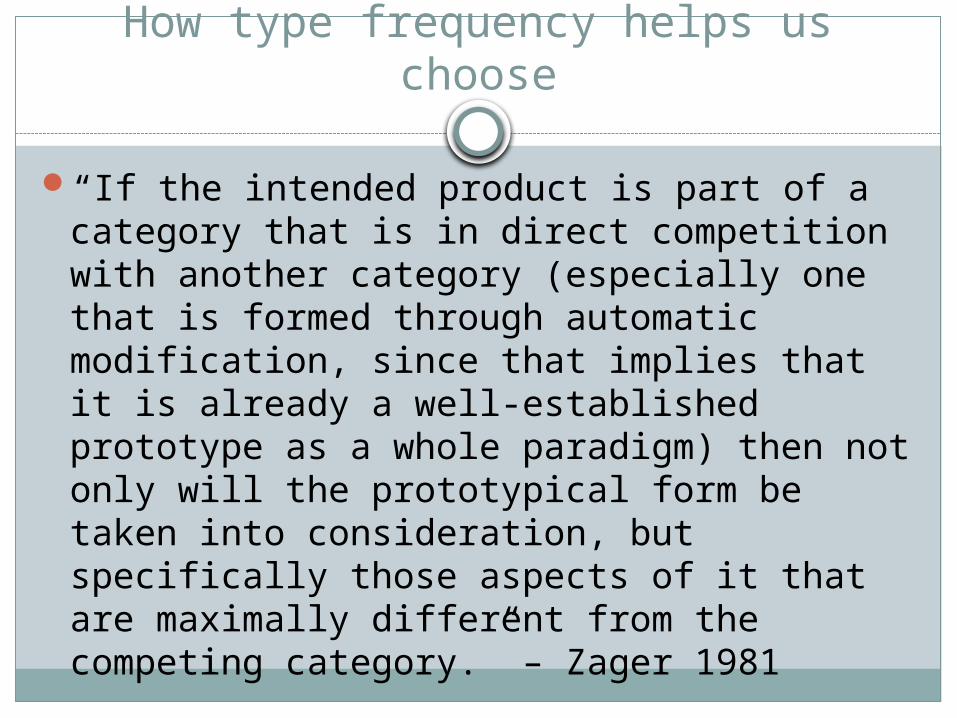
How type frequency helps us choose
“If the intended product is part of a category that is in direct competition with another category (especially one that is formed through automatic modification, since that implies that it is already a well-established prototype as a whole paradigm) then not only will the prototypical form be taken into consideration, but specifically those aspects of it that are maximally different from the competing category.” – Zager 1981
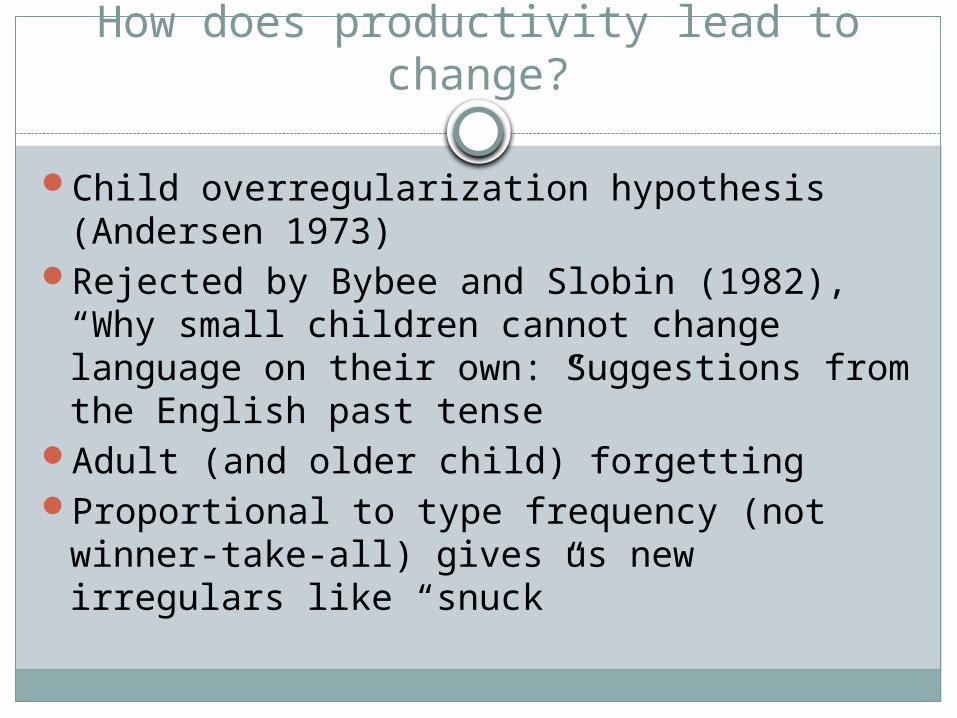
How does productivity lead to change?
Child overregularization hypothesis (Andersen 1973)
Rejected by Bybee and Slobin (1982), “Why small children cannot change language on their own: Suggestions from the English past tense”
Adult (and older child) forgettingProportional to type frequency (not winner-
take-all) gives us new irregulars like “snuck”
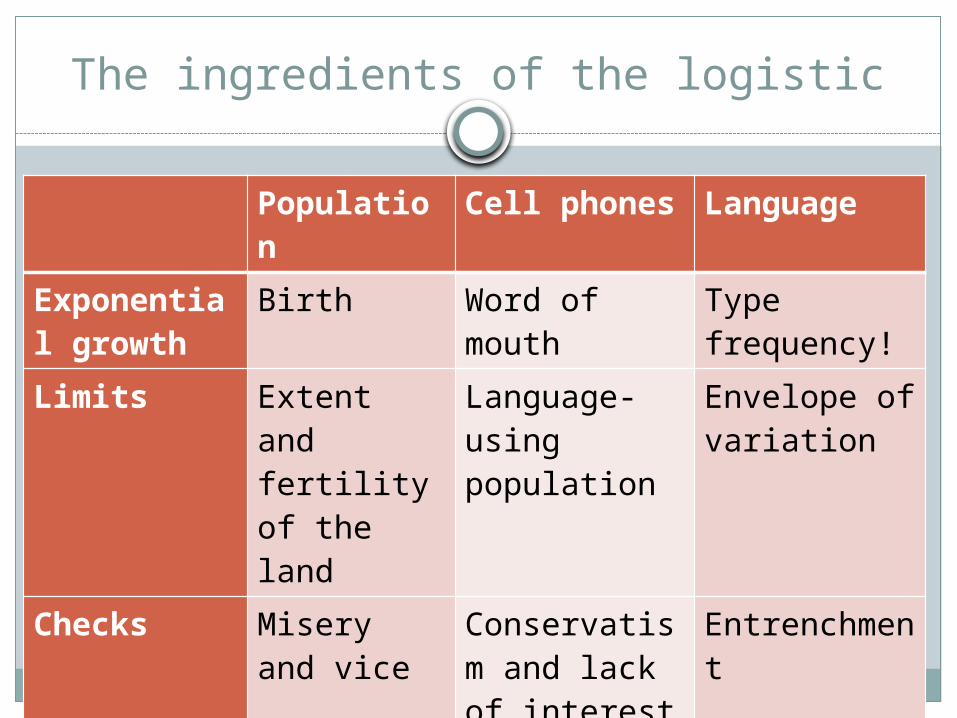
The ingredients of the logistic
Population
Cell phones Language
Exponential growth
Birth Word of mouth
Type frequency!
Limits Extent and fertility of the land
Language-using population
Envelope of variation
Checks Misery and vice
Conservatism and lack of interest
Entrenchment
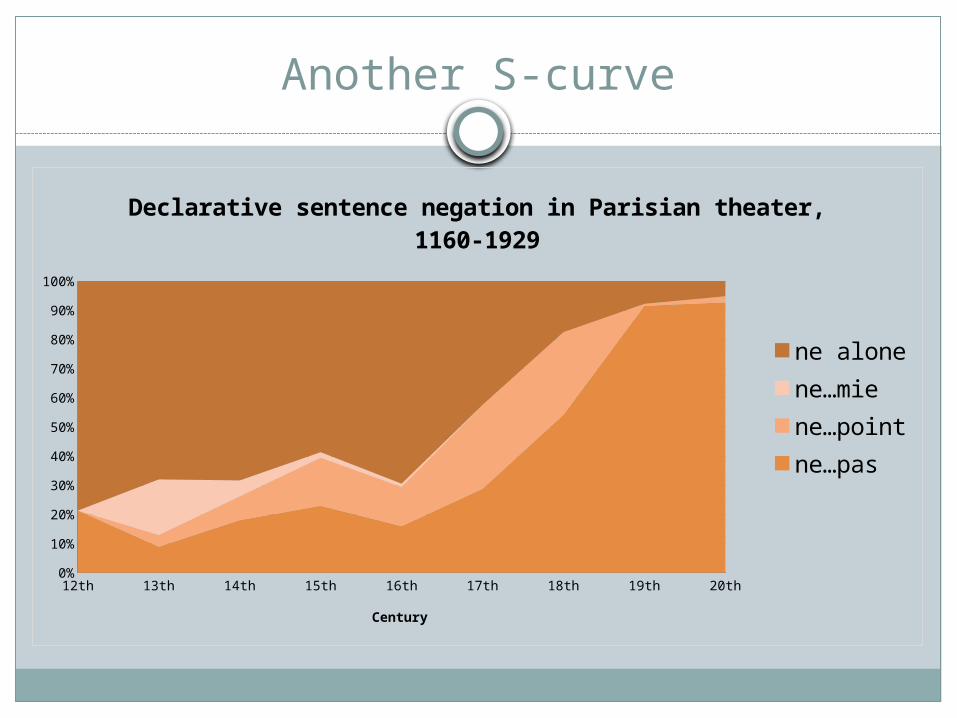
Another S-curve
12th 13th 14th 15th 16th 17th 18th 19th 20th0%
10%
20%
30%
40%
50%
60%
70%
80%
90%
100%
Declarative sentence negation in Parisian theater, 1160-1929
ne alonene…miene…pointne…pas
Century

Variation within plays, and within characters
REcos A1-Tabarin Clitd Eudox PsychM These1601 1622 1631 1641 1671 1675
0%
10%
20%
30%
40%
50%
60%
70%
80%
90%
100%
alonepointpas
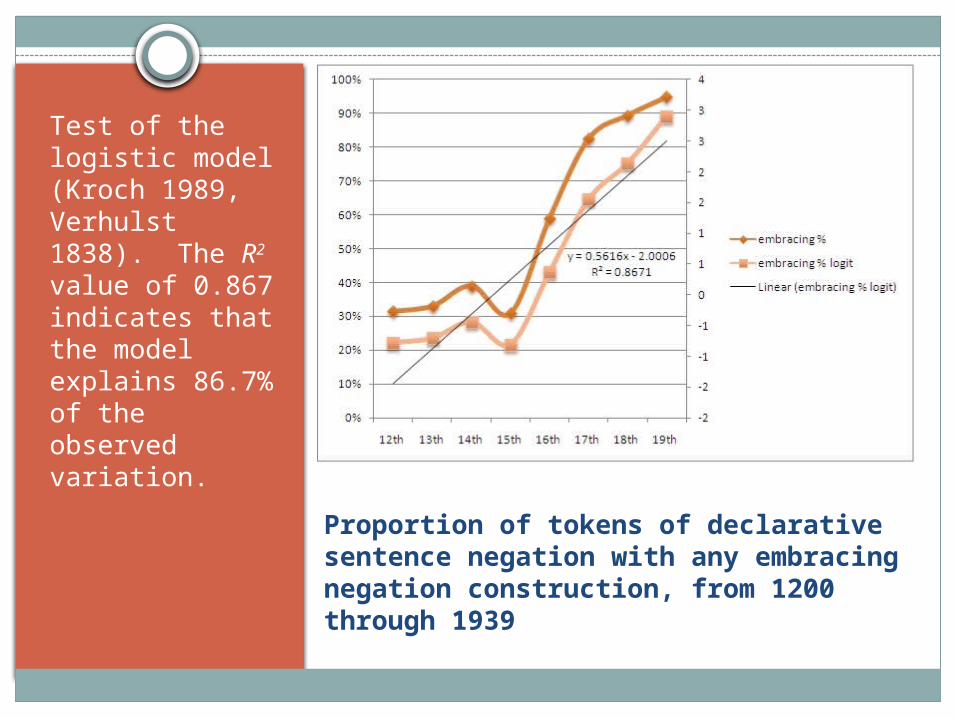
Proportion of tokens of declarative sentence negation with any embracing negation construction, from 1200 through 1939
Test of the logistic model (Kroch 1989, Verhulst 1838). The R2 value of 0.867 indicates that the model explains 86.7% of the observed variation.
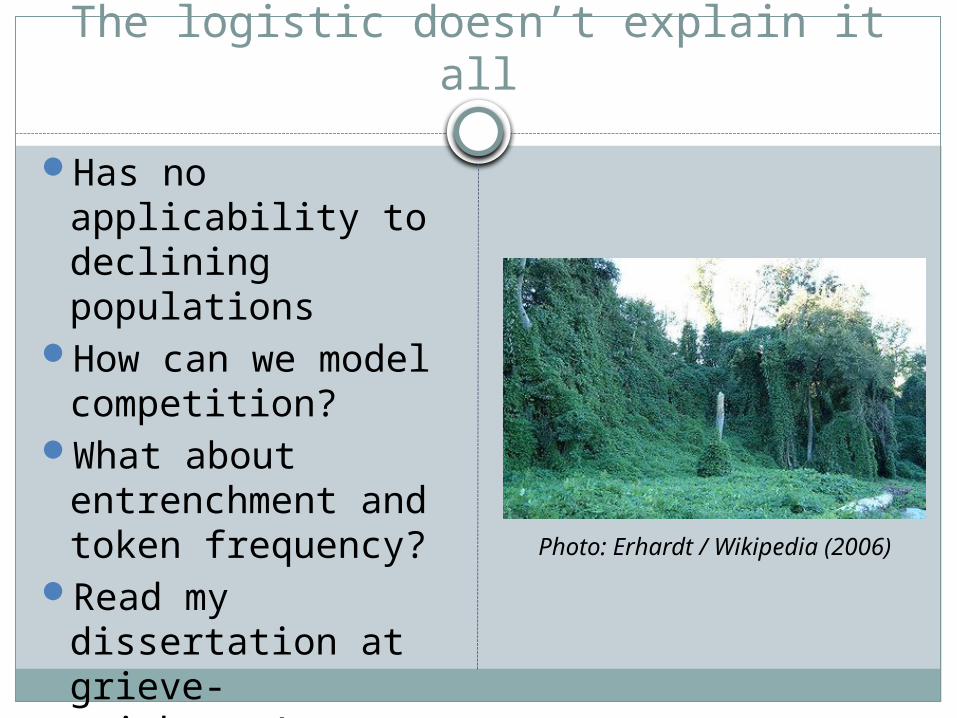
The logistic doesn’t explain it all
Has no applicability to declining populations
How can we model competition?
What about entrenchment and token frequency?
Read my dissertation at grieve-smith.com!
Photo: Erhardt / Wikipedia (2006)
Conclusion
S-curves in language are driven by productivity
Productivity is primarily driven by type frequency/applicability
Productivity is resisted by high-token-frequency items
This is illustrated by the French shift from ne to ne…pas

Future directions
How did ne and ne…pas come to be seen as “the same”?
More representative corpus
Bigger corpusOther negation
contexts
http://grieve-smith.com
http://stjohns.academia.edu/grvsmth
@grvsmth
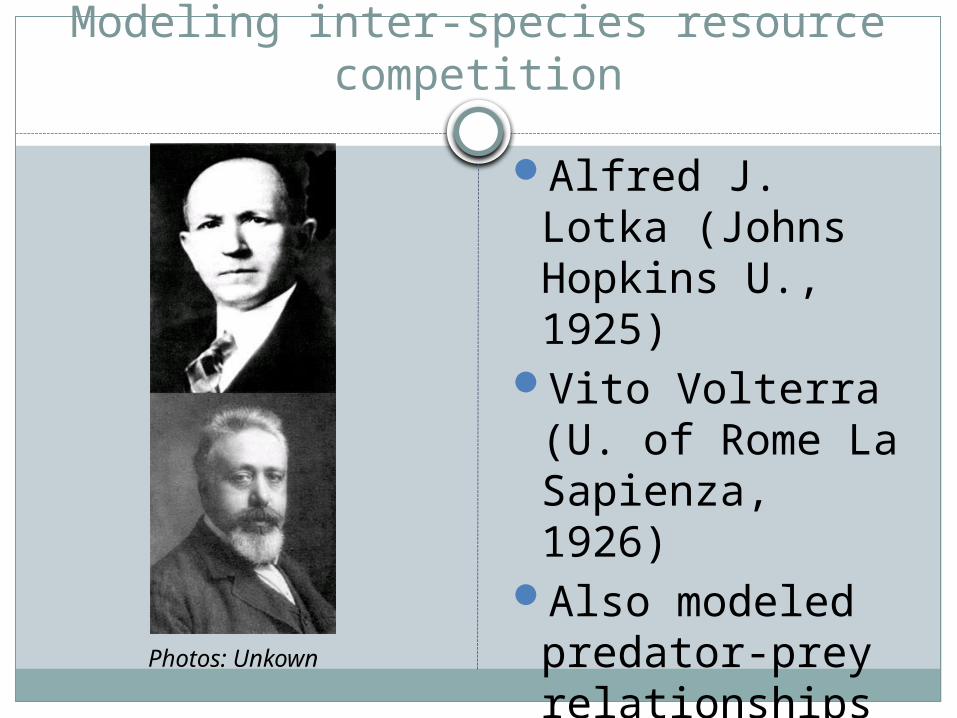
Modeling inter-species resource competition
Alfred J. Lotka (Johns Hopkins U., 1925)
Vito Volterra (U. of Rome La Sapienza, 1926)
Also modeled predator-prey relationships
Photos: Unkown
i
jijiii
i
K
xaKxr
dt
dx
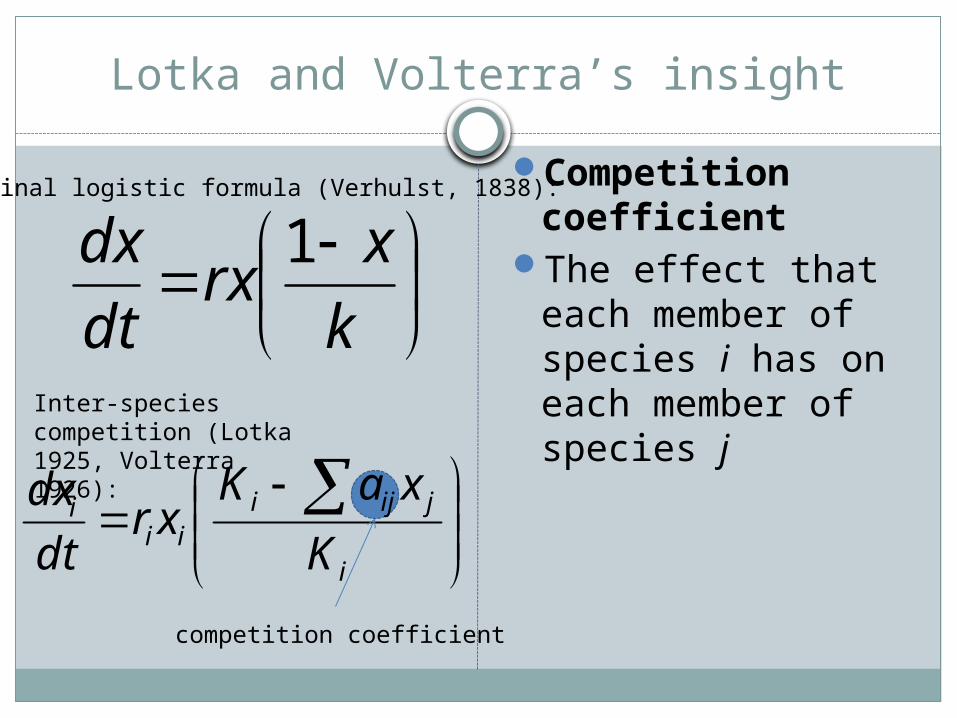
Lotka and Volterra’s insight
Competition coefficient
The effect that each member of species i has on each member of species j
k
xrx
dt
dx 1
competition coefficient
Original logistic formula (Verhulst, 1838):
Inter-species competition (Lotka 1925, Volterra 1926):
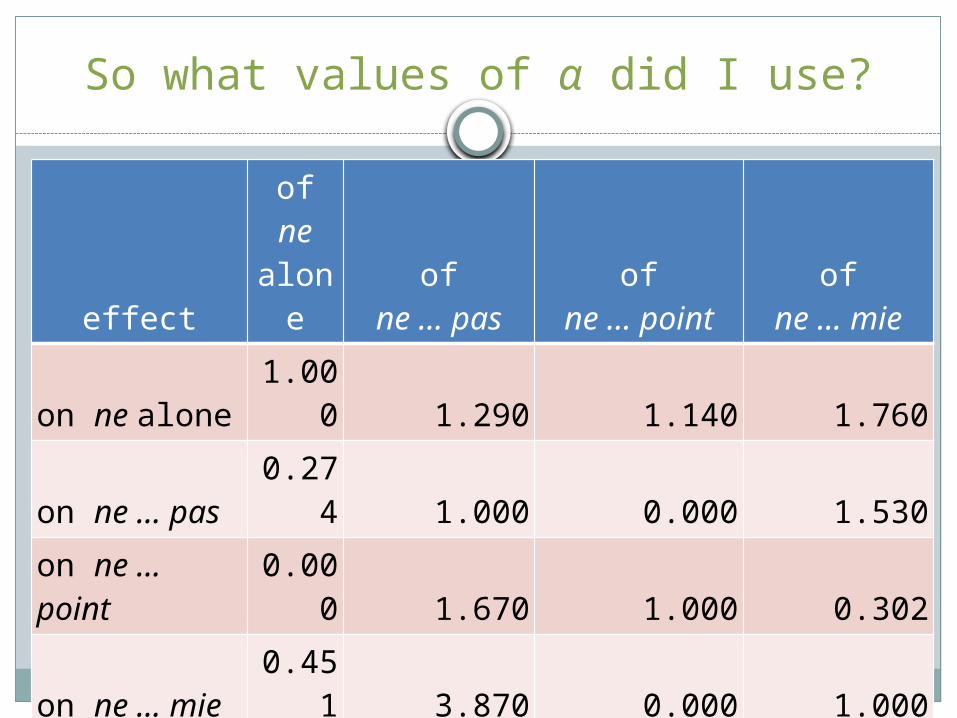
So what values of α did I use?
effectof ne alone of ne … pas of ne … point of ne … mie
on ne alone 1.000 1.290 1.140 1.760
on ne … pas 0.274 1.000 0.000 1.530
on ne … point 0.000 1.670 1.000 0.302
on ne … mie 0.451 3.870 0.000 1.000
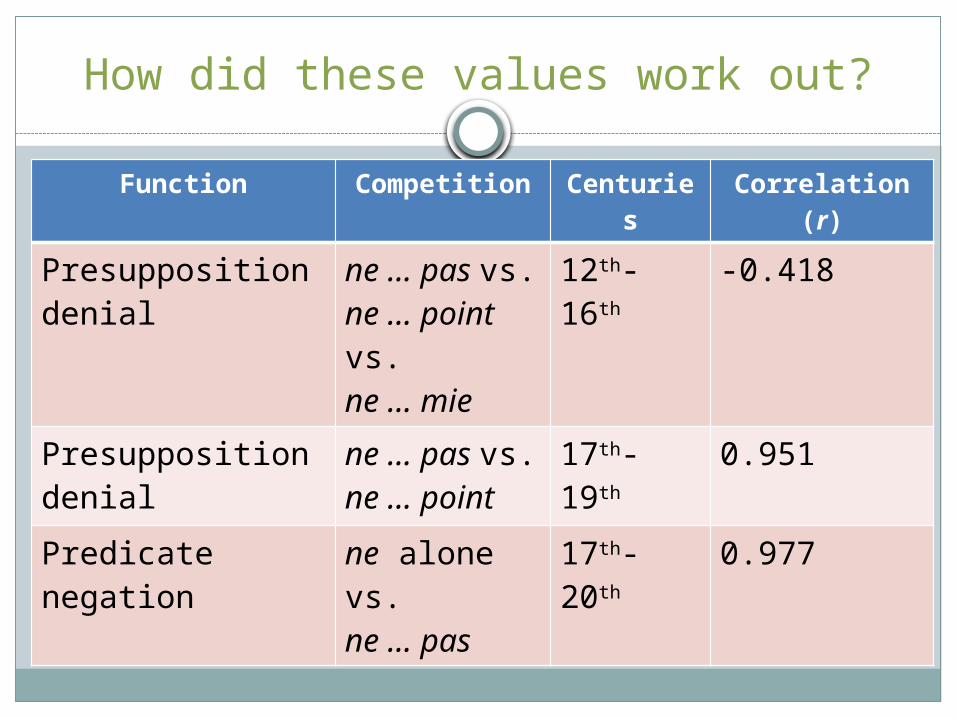
How did these values work out?
Function Competition Centuries
Correlation (r)
Presupposition denial
ne … pas vs. ne … point vs. ne … mie
12th-16th -0.418
Presupposition denial
ne … pas vs. ne … point
17th-19th 0.951
Predicate negation
ne alone vs. ne … pas
17th-20th 0.977

Modeling the evolution of embracing ne … pas (αij = 1.29)
Type frequency, predicted change and measured change in type frequency of embracing ne ... pas for main verbs, excluding high-frequency verbs and hapaxes.
r = 0.977

Image credits
1. http://www.craftbeertime.com/off-topic/crowdbooster-social-media-tool-review/attachment/crowdbooster2
2. http://ogilvyentertainmentblog.com/2011/10/on-social-media-the-magic-is-in-the-outliers/growth-graph-4/
3. http://www.bbc.co.uk/schools/gcsebitesize/geography/tourism/tourism_trends_rev1.shtml
4. http://www.bio.georgiasouthern.edu/bio-home/harvey/lect/lectures.html?flnm=grop&ttl=Population%20Growth&ccode=el&mda=scrn