Anemia and Cardiovascular Disease · 2019-02-13 · Anemia and Cardiovascular Disease: The Good,...
103
Anemia and Cardiovascular Disease: The Good, The Bad, The Ugly Scott D. Solomon, MD Director, Noninvasive Cardiology Brigham and Women’s Hospital Associate Professor of Medicine Harvard Medical School
Transcript of Anemia and Cardiovascular Disease · 2019-02-13 · Anemia and Cardiovascular Disease: The Good,...

Anemia and Cardiovascular Disease:
The Good, The Bad, The Ugly
Scott D. Solomon, MD Director, Noninvasive Cardiology Brigham and Women’s Hospital Associate Professor of Medicine
Harvard Medical School
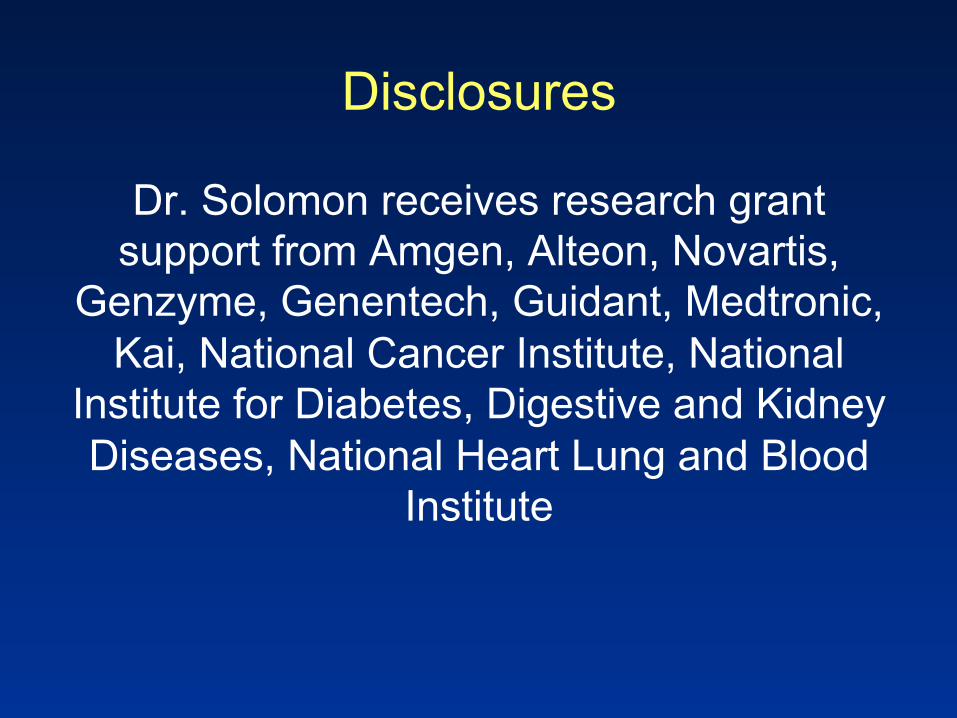
Disclosures
Dr. Solomon receives research grant support from Amgen, Alteon, Novartis,
Genzyme, Genentech, Guidant, Medtronic, Kai, National Cancer Institute, National
Institute for Diabetes, Digestive and Kidney Diseases, National Heart Lung and Blood
Institute

0
200
400
600
800
1000
1200
6 14 22 30 38 46 54 62 70 78 86 94 102 110 118 126 134
Num
ber o
f Pat
ient
s
eGFR (mL/min/1.73m2)
< 45 n = 1644
45–59.9 n = 3218
60–74.9 n = 4105
≥ 75 n = 5560

0
0.1
0.2
0.3
0.4
0.5
0.6
0 6 12 18 24 30 36
Pro
bab
ilit
y o
f E
ven
t
CV Death, MI, HF, RSD, or Stroke by Renal Function
≤ 45 1644 1029 894 776 469 220 40
Months
≥ 75 5560 4719 4472 4200 2804 1593 438 60–74.9 4105 3314 3106 2893 1900 973 233 45–59.9 3218 2365 2143 1953 1177 646 148
≥ 75 (95.0 ± 33.4)
45–59.9 (53.3 ± 4.3)
60–74.9 (67.5 ± 4.3)
< 45 (37.3 ± 5.8) eGFR (mL/min/1.73m2):
1.7 ± 0.4 (154.5)
1.3 ± 0.2 (118.2)
1.1 ± 0.1 (100.0)
0.9 ± 0.1(81.8)

0
10
20
30
40
50
60
% o
f P
atie
nts
Cardiovascular Events
CV Death Reinfarction CHF Stroke RSD Composite
>75 60-74.9 45-59.9 <45 eGFR (mL/min/1.73m2):

Spectrum of Risk (CV events)
eGFR (mL/min/1.73m2)
Ad
just
ed (
70
) H
azar
d R
atio
p < 0.0001
< 45 n = 1644
45–59.9
n = 3218
60–74.9
n = 4105
≥ 75 n = 5560
0 15 30 45 60 75 90 105 120 135
Anavekar NS et al NEJM 2004; 351:1285
0
2
14
4
6
8
10
12
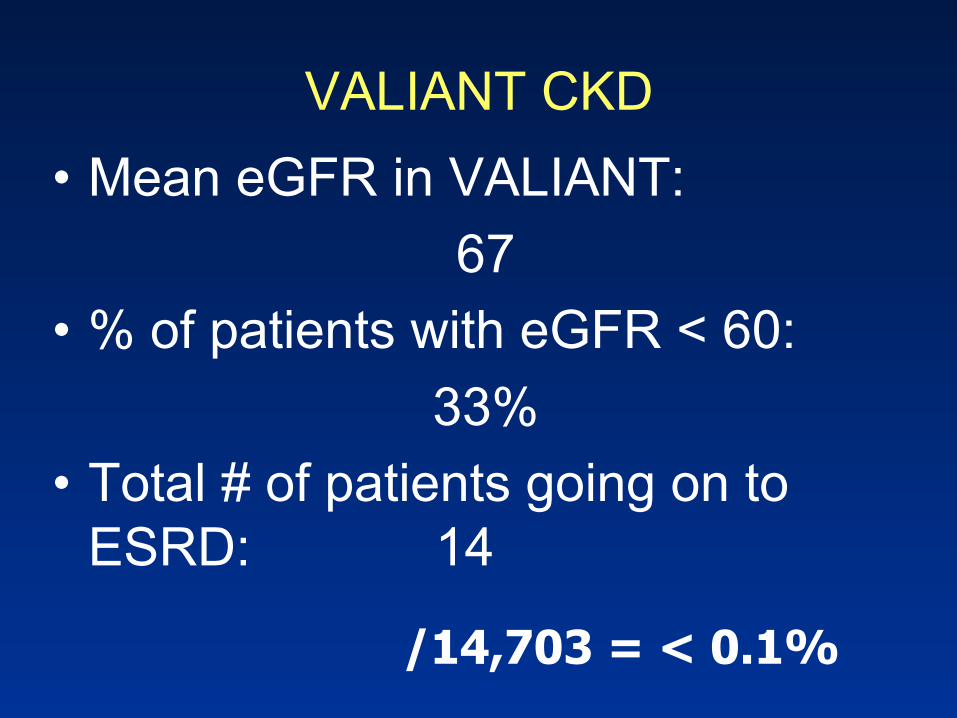
VALIANT CKD • Mean eGFR in VALIANT:
67 • % of patients with eGFR < 60:
33% • Total # of patients going on to
ESRD: 14
/14,703 = < 0.1%

Anemia and CV Risk

Hemoglobin (g/dL)
Freq
uenc
y
0
500
1000
1500
2000
2500
3000
10 10.5 11 11.5 12 12.5 13 13.5 14 14.5 15 15.5 16 16.5 17 17.5 18
1. World Health Organization. Geneva, Switzerland; 2001. 2. Dallman et al. In: Iron Nutrition in Health and Disease. London, UK: John Libbey & Co; 1996:65-74.
World Health Organization (WHO) Anemia Definition1
Women: <12 g/dL
Men: <13 g/dL
Female 13.3 ± 0.9 g/dL
Male 15.2 ± 0.9 g/dL

Based on WHO Definition, 9% of Adults Have Anemia: ARIC Study*
*The Atherosclerosis Risk in Communities (ARIC) study enrolled subjects in 4 US communities: Forsyth County, NC; Jackson, Miss; Minneapolis, Minn; and Washington County, Md. 1. Sarnak et al. J Am Coll Cardiol. 2002;40:27-33. 2. World Health Organization. Geneva, Switzerland; 2001.
ARIC Study1 Population: Ages 45 to 64; N = 15,792
Anemia definition:2 Men = Hgb <13 g/dL Women = Hgb <12 g/dL
Men Women
5%
95% 87%
13%
9%
91%
All Anemic

Causes of Anemia in CVD
• Normally, bone marrow generates ~ 200 billion new cells per day to match the cells lost or removed from circulation.
• The expected compensatory response to anemia is a heightened rate of erythropoiesis.
• Failure to demonstrate a compensatory response signifies slowed or defective erythropoiesis.
• Most common cause of defective erythropoiesis in CAD population is chronic kidney disease (even mild CKD).
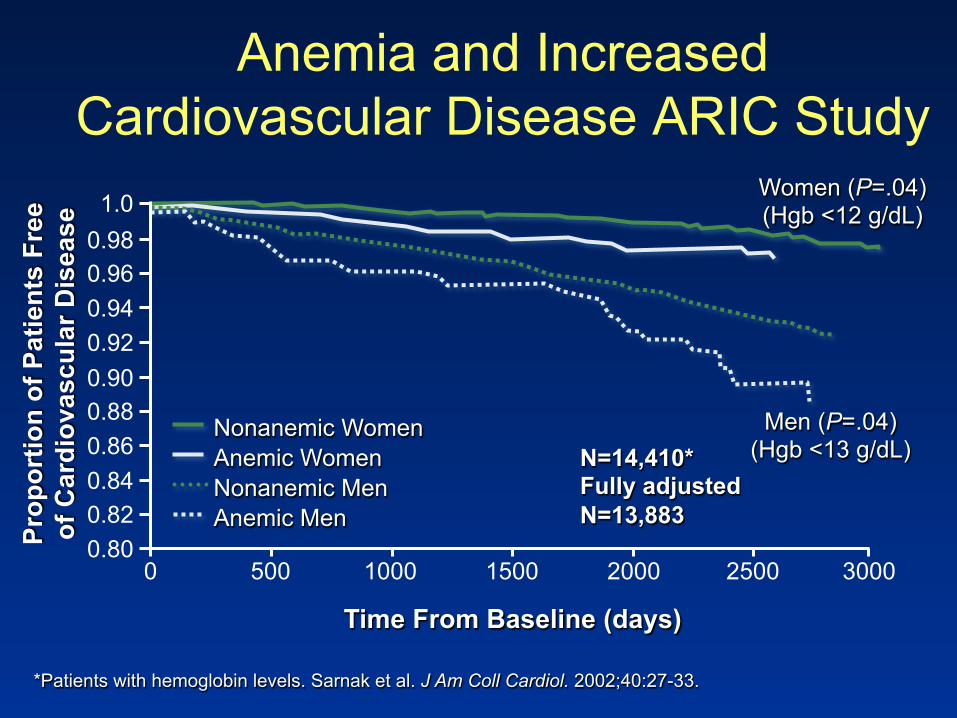
Anemia and Increased Cardiovascular Disease ARIC Study
*Patients with hemoglobin levels. Sarnak et al. J Am Coll Cardiol. 2002;40:27-33.
Women (P=.04) (Hgb <12 g/dL)
0 500 1000 1500 2000 2500 3000 0.80
0.84
0.88 0.90
0.94
0.98 1.0
Time From Baseline (days)
Nonanemic Women Anemic Women Nonanemic Men Anemic Men
Prop
ortio
n of
Pat
ient
s Fr
ee
of C
ardi
ovas
cula
r Dis
ease
0.96
0.92
0.86
0.82
Men (P=.04) (Hgb <13 g/dL) N=14,410*
Fully adjusted N=13,883

>17 968 1.27 (0.90-1.79) 1.79 (1.18-2.71) 0.007
16-17 2783 0.85 (0.65-1.10) 1.08 (0.78-1.52) 0.637
15-16 5702 0.86 (0.70-1.05) 1.08 (0.84-1.39) 0.5302
14-15 6926 1.0 reference 1.0 reference
13-14 5077 1.47 (1.22-1.77) 1.17 (0.93-1.47) 0.175
12-13 2502 2.22 (1.82-2.72) 1.40 (1.09-1.80) 0.009
11-12 962 3.29 (2.57-4.21) 1.63 (1.19-2.24) 0.003
10-11 288 3.97 (2.71-5.82) 1.98 (1.24-3.15) 0.004
<10 191 5.07 (3.32-7.73) 2.50 (1.42-4.39) 0.001
2.0 5.0 1.0 0.5
OR & 95% CI for CV Death by 30 d
Unadjusted Adjusted for Baseline Characteristics Hgb (g/dl) n OR (95% CI) OR (95% CI) P value
Anemia and CV Death in ACS
Sabatine et al. Circulation 2005

Acute MI: Higher Hematocrit is Associated with Lower Risk of Death
Langston, Kid Int 2003, 64:1398-1405 Retrospective cohort of 709 Medicare patients admitted to community hospitals for acute MI Odds Ratio Adjusted for age, sex, race, kidney function and cardiovascular co-morbidities 4% decrease in one year risk of death per 1% increase in hematocrit
0.00%5.00%
10.00%15.00%20.00%25.00%
30.00%35.00%40.00%45.00%
> 40% 36-39% 30-35% < 30%
1.0 1.35
1.94
3.16 Odds Ratio
% M
orta
lity
at 1
yea
r
Hematocrit

ESRD - USRDS: Higher Hematocrit is Associated with Fewer Hospital Days
13.0
8.6
4.93.7 4.0
0
2
4
6
8
10
12
14
<30 30-33 33-36 36-39 >39Hemtocrit (%)
Mea
n N
umbe
r of H
ospi
tal D
ays
Li & Collins, Kid Int 2004, 65:626-633 50,579 incident HD patients in the US between Jan 98 – Dec 1999 Follow-up 2.5 yrs (hospitalization) and 3.0 yrs (mortality) Unadjusted data
N 4,308 11,558 22,192 10,265 2,256

Anemia, Diabetes and CKD Have Similar Impact on Mortality
Collins, AJ. Adv Stud in Med. 2003;3(3C):S14-S17.
3.7
1.5 2.0 2.0
1.0
0.0
1.0
2.0
3.0
4.0
5.0
Rel
ativ
e R
isk
3.6

Unit Change RR (95% CI)
Hematocrit 1% decrease 1.06 (1.04–1.08)
GFR 10 mL/min decrease 1.06 (1.03–1.10)
Retrospective analysis of 6,635 patients – SOLVD database
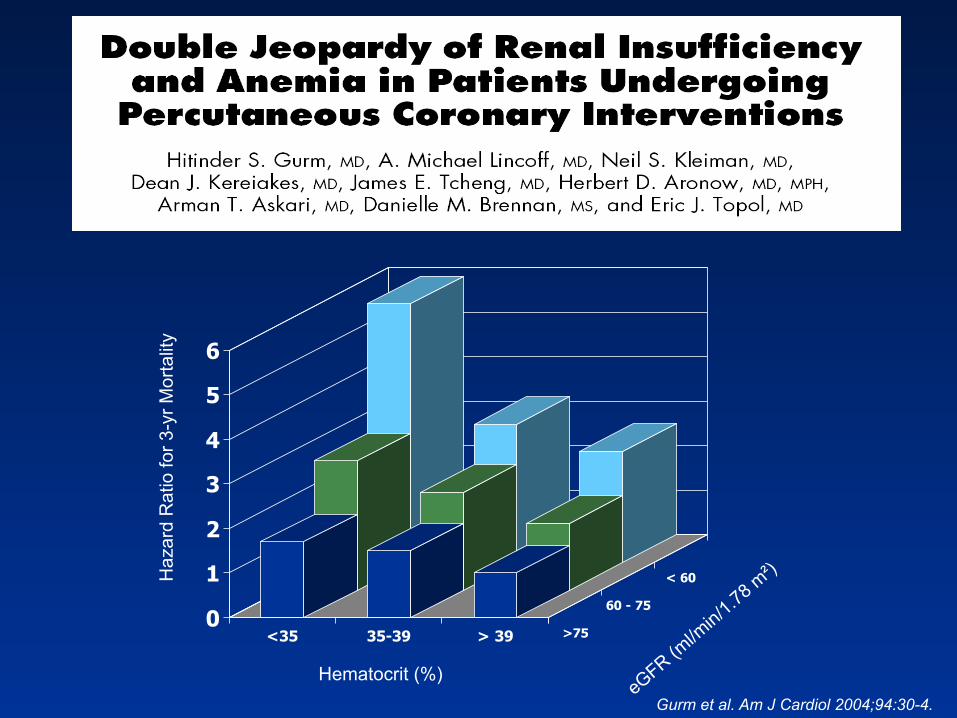
Anemia and CKD are Risk Factors for Mortality
Al-Ahmad A, et al. J Am Coll Cardiol. 2001;38(4):955-962.
0
1
2
3
4
5
6
<35 35-39 > 39 >75
60 - 75
< 60
Hematocrit (%)
Haz
ard
Rat
io fo
r 3-y
r Mor
talit
y
Gurm et al. Am J Cardiol 2004;94:30-4.

.229503 1 4.35725
Study % Weight Risk ratio (95% CI)
2.92 (1.96,4.36) MATCH 40.5 1.78 (1.25,2.54) CURE 59.5
2.24 (1.72,2.92) Overall (95% CI)
Dual Antiplatelet Agents Increase Risk of GI Bleeding in Cardiac Patients
In VALIANT, dual antiplatelet agent use was associated with an 85% increased adjusted risk of GI bleeding (each 10 points of reduced eGFR increased
GI bleeding risk by 20%)
ANEMIA IN HF

Anemia In Patients With Heart Failure
Hb = hemoglobin Hct = hematocrit HF = heart failure
The prevalence of anemia in heart failure patients is approximately: – 30% for Inpatients
– 20% for Outpatients
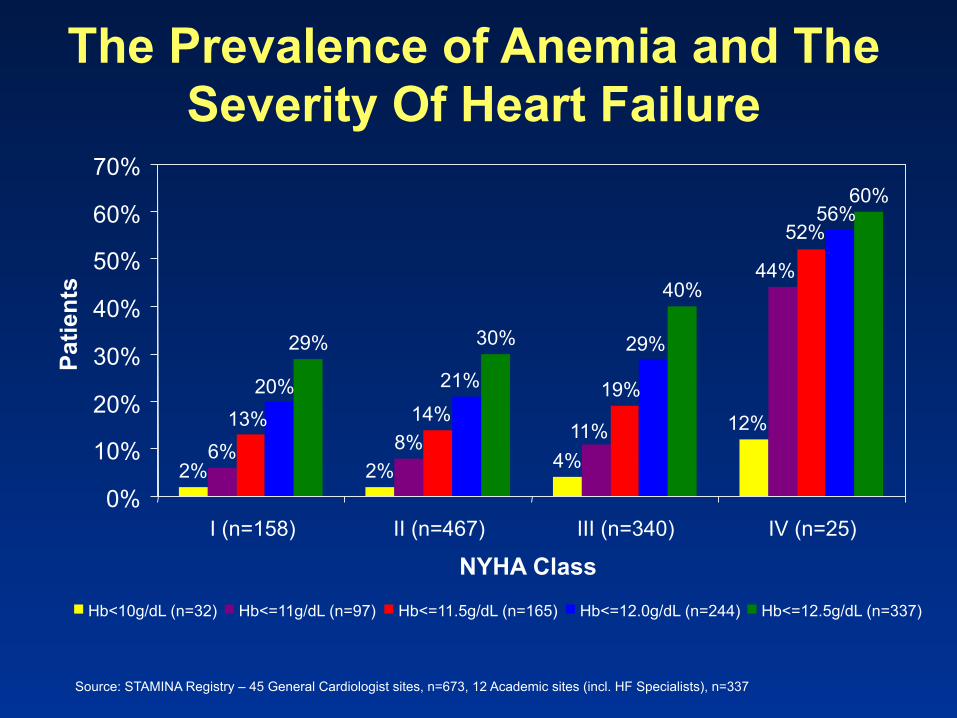
The Prevalence of Anemia and The Severity Of Heart Failure
Source: STAMINA Registry – 45 General Cardiologist sites, n=673, 12 Academic sites (incl. HF Specialists), n=337
2% 2% 4% 6% 8%
29% 30%
40%
60%
12%
44%
11%
52%
19% 14% 13%
29% 21% 20%
56%
0%
10%
20%
30%
40%
50%
60%
70%
I (n=158) II (n=467) III (n=340) IV (n=25)
Patie
nts
Hb<10g/dL (n=32) Hb<=11g/dL (n=97) Hb<=11.5g/dL (n=165) Hb<=12.0g/dL (n=244) Hb<=12.5g/dL (n=337) NYHA Class

Heart Failure: Higher Hematocrit is Associated with Lower Risk of Death
McClellan, JASN 2002, 13:1928-36 Retrospective cohort of 655 Medicare patients admitted to community hospitals for heart failure Adjusted for age, sex, race, kidney function and cardiovascular co-morbidities 2.4% decrease in one year risk of death per 1% increase in hematocrit
Hematocrit % 1 Year Mortality OR
> 40% 30.3% 31.3% 1.0
36 - 39% 22.9% 33.8% 1.08
30 – 35% 33.2% 36.7% 1.17
< 30% 13.6% 50.0% 1.60

The Etiology of Anemia in Heart Failure is Likely Multifactorial
Bone marrow dysfunction Abnormal iron homeostasis (uptake, release, utilization)
Intravascular fluid imbalance (hemodilution) EPO deficiency or resistance
Anemia of Chronic Disease
Pharmaco- therapy
Renal Dysfunction Malnutrition
Decreased Cardiac Output
Chronic Inflammation

↓ Cardiac Output • Impaired renal perfusion, leading to impaired renal function,
decreased EPO production and anemia1
• Impaired bone marrow perfusion leading to impaired function and anemia1
Cytokines • TNF and other inflammatory cytokines may cause bone
marrow suppression, interfere with the action of EPO and the cellular release and utilization of iron2
Iron Deficiency • Edematous GI may diminish absorption of iron • Chronic aspirin therapy may lead to blood loss
ACE inhibitors • Down-regulation of EPO by angiotensin-converting enzyme (ACE) inhibitors3
Dilutional • Plasma volume expansion4
1Chatterjee et al. Eur J Heart Fail. 2000;2:393-398. 2Silverberg et al. J Am Coll Cardiol. 2000;35(7)1737-44. 3Volpe et al. Am J Cardiol. 1994;74:468-473. 4Androne et al. Circulation. 2003;107:226-229.
Causes of Anemia in HF

Adapted from Okonko & Anker. J Cardiac Failure. 2004;10(suppl):S5-S9.
Pathophysiology of Anemia in CHF
↑ Diuretics
↑ Inflammation
Exercise
↑ LV Mass
Apoptosis? Anemia
Tissue Hypoxia
CHF
Remodeling LVH … cell death
↑ LV diameter
↑ Plasma volume … Edema
Increased Retention ↑ Renin Angiotensin
Aldosterone ADH
↓ Renal blood flow
↓ Blood pressure
Peripheral vasodilation
Activation of SNS
↑
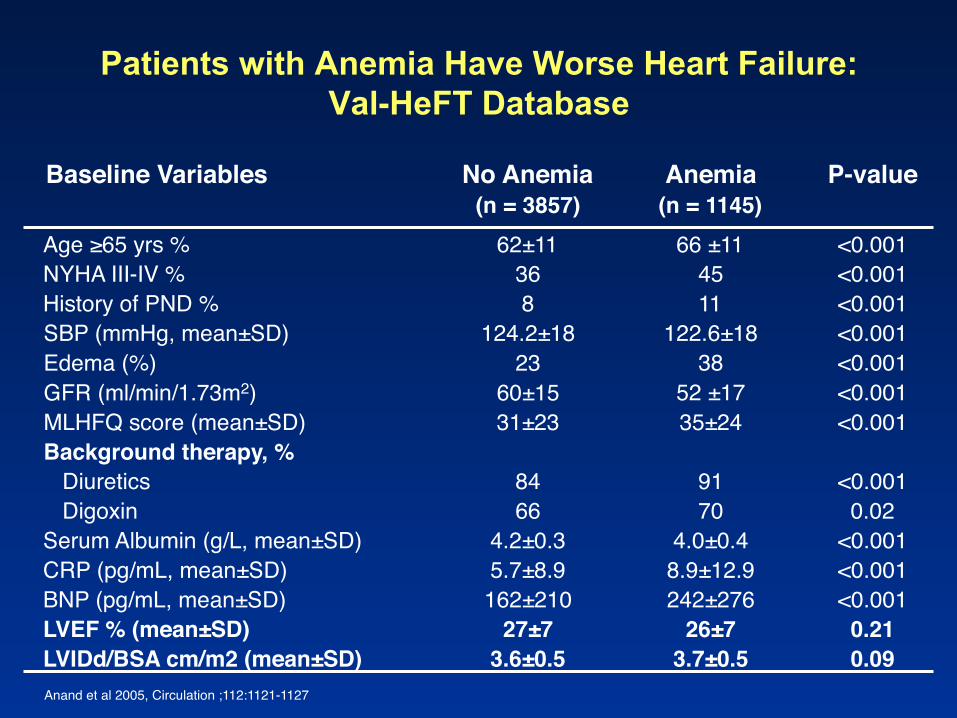
Patients with Anemia Have Worse Heart Failure: Val-HeFT Database
Anand et al 2005, Circulation ;112:1121-1127"
Baseline Variables
Age ≥65 yrs %
SBP (mmHg, mean±SD)
GFR (ml/min/1.73m2) MLHFQ score (mean±SD) Background therapy, % Diuretics Digoxin
CRP (pg/mL, mean±SD)
LVEF % (mean±SD) LVIDd/BSA cm/m2 (mean±SD)
Edema (%)
History of PND %
Serum Albumin (g/L, mean±SD)
BNP (pg/mL, mean±SD)
NYHA III-IV %
No Anemia (n = 3857)
62±11"
124.2±18
60±15"31±23
84 66
5.7±8.9
27±7 3.6±0.5
23
8
4.2±0.3
162±210
36
Anemia (n = 1145)
66 ±11"
122.6±18
52 ±17"35±24
91 70
8.9±12.9
26±7 3.7±0.5
38
11
4.0±0.4
242±276
45
P-value
<0.001
<0.001
<0.001 <0.001
<0.001 0.02
<0.001
0.21 0.09
<0.001
<0.001
<0.001
<0.001
<0.001

Anemia is Associated with Increased Risk for Hospitalization in Heart Failure Patients
Study Design N Anemia Risk Assessment Limitations
Alexander1
Retrospective cohort study of a population based HF database
90,316 Anemia was an independent risk factor of 1-year rehospitalization (RR 1.162; 95% CI: 1.134 to 1.191)
no confirmation of the HF diagnosis; undercounts of minorities and biased results.
Polanczyk2 Prospective, single center, observational study
205 Anemia was an independent predictor of 3-month rehospitalization (p=0.002)
Too small of a population to resolve a small difference in readmission rates; role of confounding variables due to lack of control
OPTIME-CHF3 Retrospective chart review 906
Anemia was an independent predictor of 60-day death or rehospitalization (odds ratio of 0.89 per 1 g/dL increase in hemoglobin; 95% CI: 0.82 to 0.97)
Anemia may have been caused by hemodilution in hospitalized patients
Kosiborod4 Retrospective chart review 2,281
Patients had 2% higher risk of 1-year rehospitalization for every 1% lower hematocrit (95% CI: 1.01 to 1.03; p=0.0002)
Lack of data on transfusions or other treatments for anemia; study generalizability to non-study population
COPERNICUS5
Randomized, double blind, placebo controlled trial
2,286
Anemia was an independent risk factor for 1-year morbidity (HF hospitalization) and mortality outcomes
-
1Alexander M, et al. Am Heart J. 1999;137:919-927 2Polanczyk CA, et al. J Card Failure. 2001;7:289-298 3Felker GM, et al. Am J Cardiol. 2003;92:625-628 4Kosiborod M, et al. Am J Med. 2003;114:112-119 5Anker SD, et al. J Am Coll Cardiol. 2004;43(suppl A):Abstract 842-2
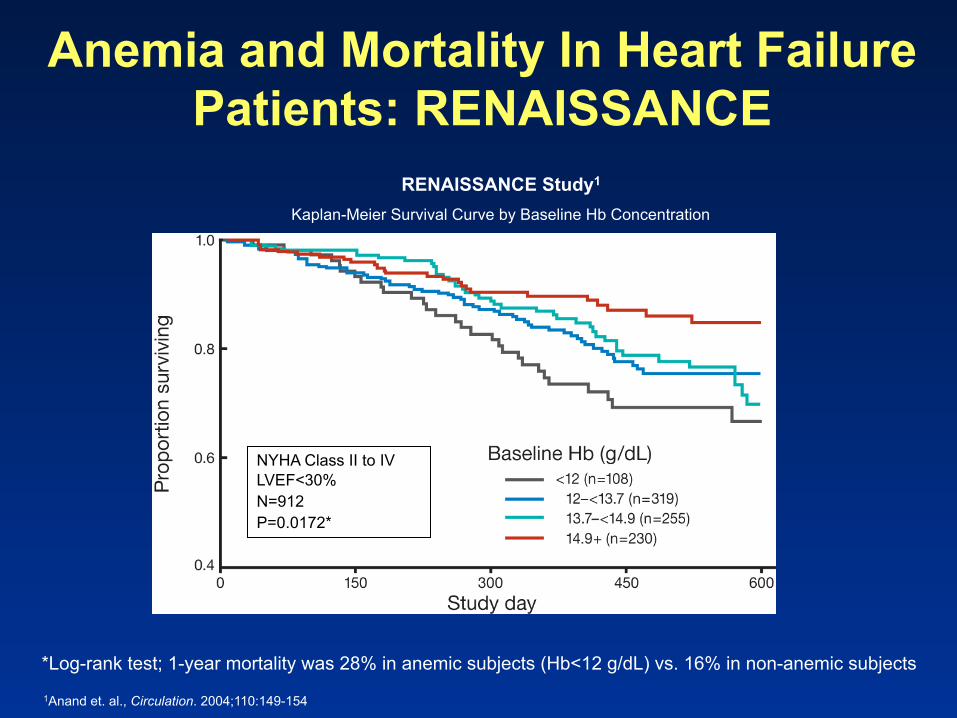
Anemia and Mortality In Heart Failure Patients: RENAISSANCE
*Log-rank test; 1-year mortality was 28% in anemic subjects (Hb<12 g/dL) vs. 16% in non-anemic subjects
1Anand et. al., Circulation. 2004;110:149-154
RENAISSANCE Study1
Kaplan-Meier Survival Curve by Baseline Hb Concentration
NYHA Class II to IV LVEF<30% N=912 P=0.0172*
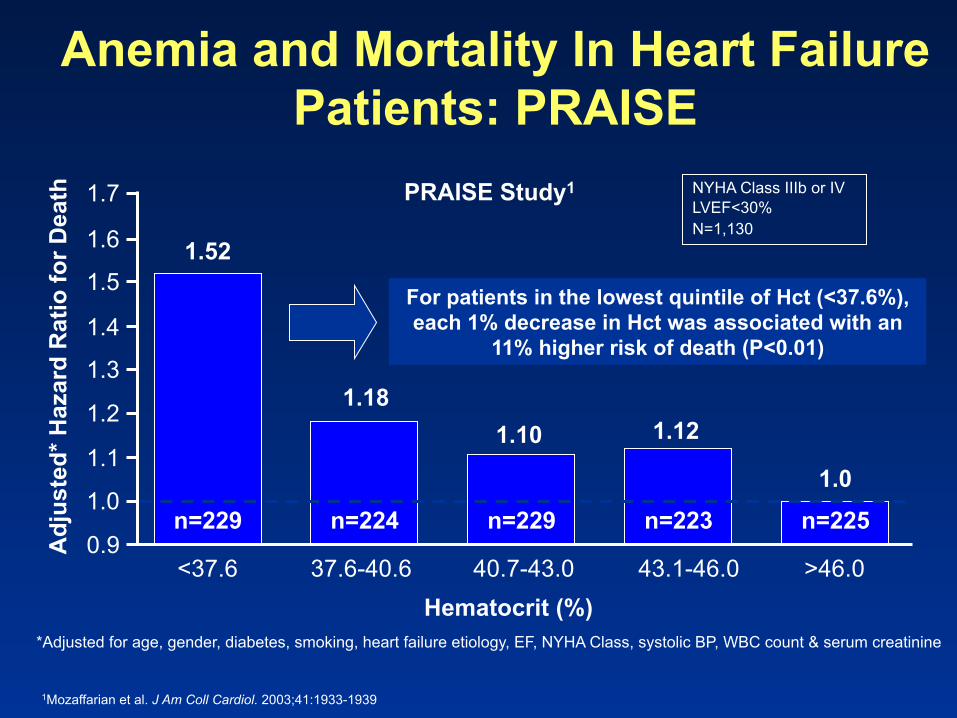
1Mozaffarian et al. J Am Coll Cardiol. 2003;41:1933-1939
Anemia and Mortality In Heart Failure Patients: PRAISE
0.9
1.7
Hematocrit (%)
Adj
uste
d* H
azar
d R
atio
for D
eath
1.5
1.4
1.2
1.1
1.6
1.3
1.0
<37.6 37.6-40.6 40.7-43.0 43.1-46.0 >46.0
n=229
1.52
n=224
1.18
n=229
1.10
n=223
1.12
n=225
1.0
*Adjusted for age, gender, diabetes, smoking, heart failure etiology, EF, NYHA Class, systolic BP, WBC count & serum creatinine
For patients in the lowest quintile of Hct (<37.6%), each 1% decrease in Hct was associated with an
11% higher risk of death (P<0.01)
PRAISE Study1 NYHA Class IIIb or IV LVEF<30% N=1,130

Severity Of Anemia and the Risk For Death Or Heart Failure Hospitalization
1Anker SD, et al. J Am Coll Cardiol. 2004;43(suppl A):Abstract 842-2
Hemoglobin (g/dL)
1-Year Death or HF Hospitalization Kaplan-Meier
Event Rates (%) N
<11 46.6 115
11 to <12.5 36.1 315
12.5 to <13.5 30.5 432
13.5 to <15 31.9 834
15 to 16.5 26.5 463
>16.5 25.5 127
COPERNICUS Study1
N=2,286; LVEF<25%; severe HF with dyspnea or fatigue at rest or on minimal exertion

Perc
ent M
orta
lity
13.2 9.9
8.5 9.8
P = 0.024 P = 0.31 P = 0.32
Q1 Q2 Q3 Q4 0
5
10
15
20
25
950 991 937 1028
14.24 13.92 13.71 13.30 - 1.66 - 0.47 + 0.15 + 1.11 < - 0.8 > - 0.8 to < -0.1 > - 0.1 to < + 0.5 ≥ + 0.5
Mean BL Hgb, g/dL Mean change in Hgb, g/dL Quartile change in Hgb, g/dL
Mean 12 month Hgb, g/dL 12.58 13.44 13.86 14.40
Worsening of Hb from Baseline to 12 Months was Associated with Increased
Mortality in Val-HeFT
Number of patients
Anand et al 2005, Circulation ;112:1121-1127"

CHARM Added
CHARM Preserved
CHARM Programme 3 component trials comparing candesartan
to placebo in patients with symptomatic heart failure
CHARM Alternative
n=2028 LVEF ≤40%
ACE inhibitor intolerant
n=2548 LVEF ≤40%
ACE inhibitor treated
n=3025 LVEF >40%
ACE inhibitor treated/not treated
Primary outcome for Overall Programme: All-cause death Primary outcome for each trial: CV death or CHF hospitalisation

Relevant exclusions
• Serum creatinine ≥ 265 µmol/l (3 mg/dl) • Known bilateral RAS • Haemoglobin/anaemia NOT specifically
mentioned

Mean age (years) 67 64 67 66 Women (%) 32 21 40 32 NYHA class (%) II 48 24 60 45 III 49 73 38 52 IV 3 3 2 3
Mean LVEF 30 28 54 39 Medical history (%) myocardial infarction 61 56 44 53 diabetes 27 30 28 28 hypertension 50 48 64 55 atrial fibrillation 25 26 29 27
Baseline characteristics Alternative Added Preserved Overall n=2028 n=2548 n=3023 n=7599

Median eGFR and Haemoglobin quintiles
30
40
50
60
70
80
90
I II III IV VHaemoglobin quintiles
Low EF Preserved
Med
ian
eGFR
(m
l/min
/1.7
3m2 )
Hgb 11.3 Hgb 12.8
Hgb 13.6 Hgb 14.4 Hgb 15.7
O’Meara et al. CHARM Investigators. Circulation 2006
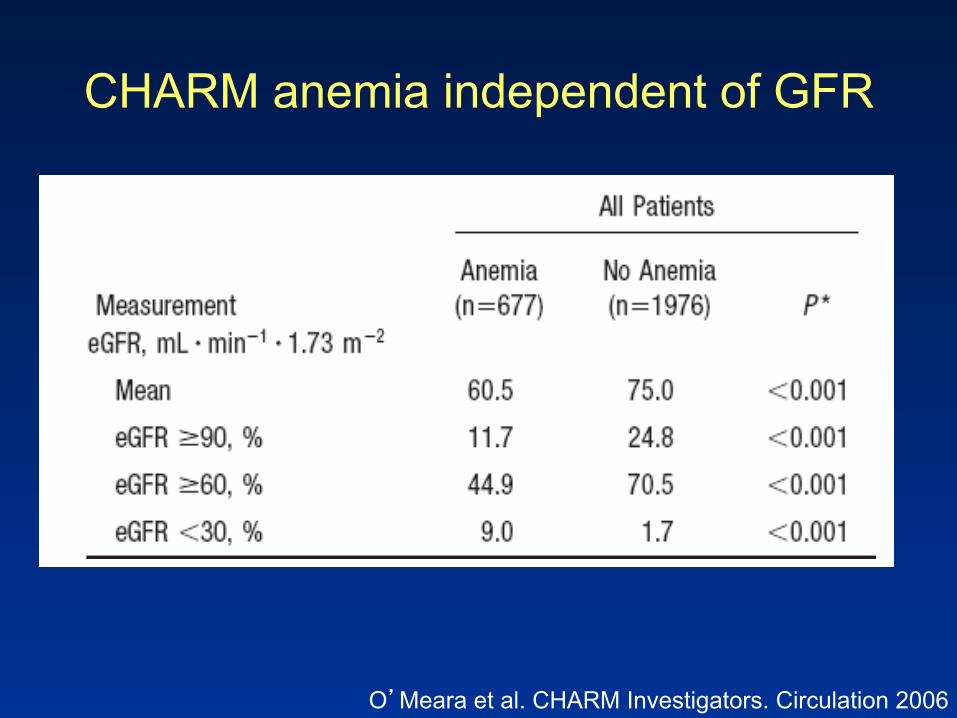
CHARM anemia independent of GFR
O’Meara et al. CHARM Investigators. Circulation 2006
CHARM WORKSHOP-NEW ORLEANS 2004
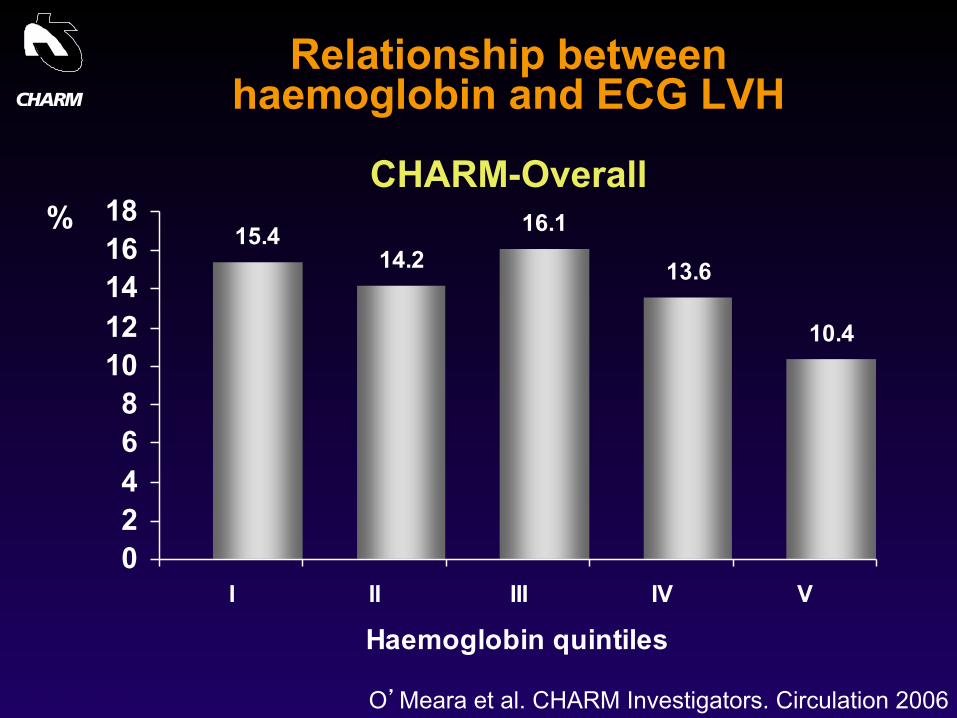
Relationship between haemoglobin and ECG LVH
CHARM-Overall
15.414.2
16.1
13.6
10.4
02468
1012141618
I II III IV V
Haemoglobin quintiles
%
O’Meara et al. CHARM Investigators. Circulation 2006

CHARM WORKSHOP-NEW ORLEANS 2004
Relationship between haemoglobin and radiological cardiomegaly
CHARM-Overall
13.914.6
13.1
11.3
9.8
0
2
4
6
8
10
12
14
16
18
I II III IV VHaemoglobin quintiles
%
O’Meara et al. CHARM Investigators. Circulation 2006

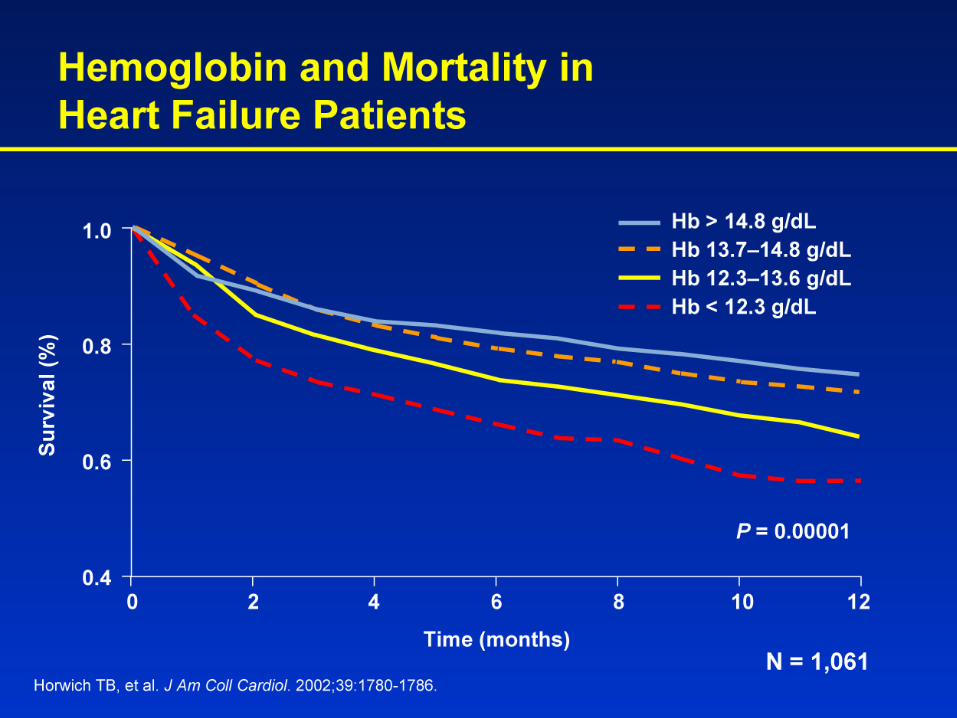
Hemoglobin and Mortality
0
5
10
15
20
25
30
35
I II III IV V
Haemoglobin quintiles
%
All cause mortality
Hgb 11.3 Hgb 12.8
Hgb 13.6 Hgb 14.4
Hgb 15.7
O’Meara et al. CHARM Investigators. Circulation 2006

Rationale for Anemia Correction

Potential Benefits of Treating Anemia in CVD
• Improved oxygen delivery • Improved exercise tolerance • Attenuate adverse
remodeling • Improved QoL • Antiapoptotic? • Decrease in hosp./death?
Adapted from Felker and O’Connor J Am Coll Cardiol. 2004;44:959-966.

Wright et al. 2004. FASEB.
EPOR protein in adult rat heart sections using immuno- histochemistry
50 µm
EPOR protein in isolated adult rat cardiac myocytes visualized by fluorescence microscopy
50 µm
Erythropoietin Receptors are Present on Adult Cardiac Myocytes

Tramontano et al. Biochem Biophys Res Commun. 2003;308:990-994.
EPO Administered at time of LAD Ligation Reduces Myocyte Apoptosis
TUN
EL P
ositi
ve N
ucle
i as
% T
otal
0
35
30
20
10
Sham MI
25
15
5
MI + EPO
*
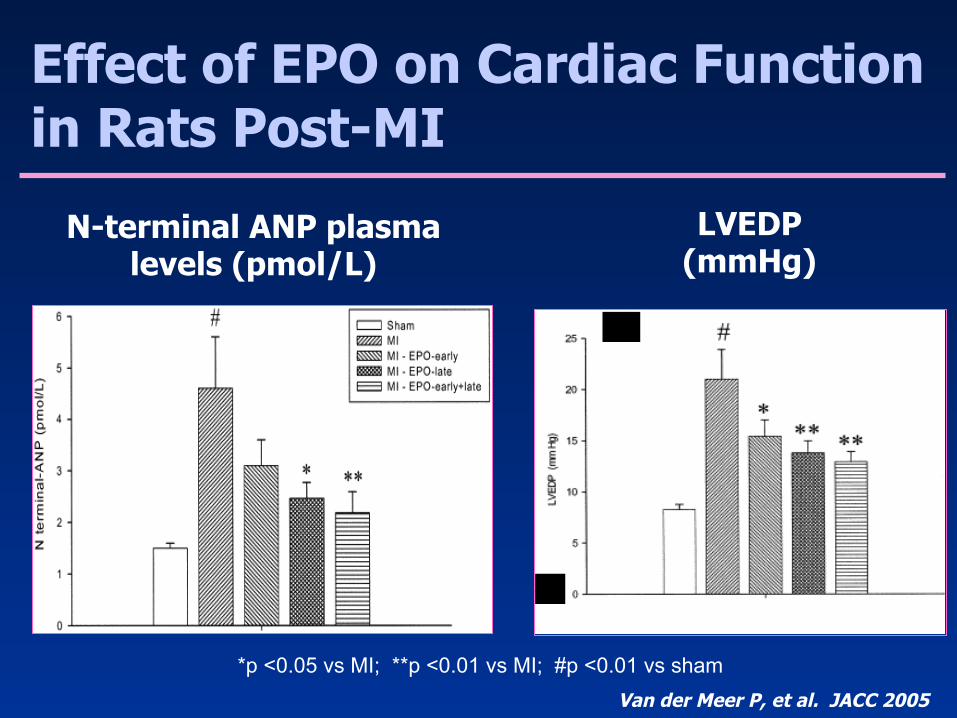
*p <0.05 vs MI; **p <0.01 vs MI; #p <0.01 vs sham
N-terminal ANP plasma levels (pmol/L)
LVEDP (mmHg)
Effect of EPO on Cardiac Function in Rats Post-MI
Van der Meer P, et al. JACC 2005
Clinical Trials of Anemia Correction with Erythropoeitin

Studies Evaluating The Effect Of Treatment Of Anemia With Recombinant Human Erythropoietin (rHuEPO) In Heart Failure Patients
Study N Mean changes in selected endpoints P Value Silverberg et al. 20001
• No control group • Not blinded
26 NYHA class (3.66 → 2.66) LVEF (27.7% → 35.4%) Number of hospitalizations/patient (2.72 → 0.22)
<0.05 <0.001 <0.05
Silverberg et al. 20012
• Randomized control group
• Not blinded, no placebo
32 NYHA class (3.8 → 2.2; 3.5 → 3.9 for control) LVEF (30.8% → 36.3%; 28.4% → 23.0% for control) Hospital days (13.8 → 2.9; 9.9 → 15.6 for control)
<0.0001 <0.013 <0.03
Silverberg et al. 20033
• No control group • Not blinded
179
NYHA class (3.90 → 2.54) LVEF (34.9% → 38.7%) Number of hospitalizations/patient (2.90 → 0.12) Fatigue, shortness of breath VAS (8.76 → 2.75)
<0.05 <0.05 <0.05 <0.05
Mancini et al. 20034 • Randomized, placebo
controlled • Single blinded
23
Hb (11.0 + 0.6 →14.3 + 1.2 g/dL; 10.9 + 1.1→11.5+1.3 g/dL for control Peak VO2 (11+ 0.8 → 12.7 + 2.8 ml/kg/min; 10.0+1.9 → 9.5 + 1.6 ml/kg/min for control) Exercise Duration (590 + 107→ 657+119 sec; 542 + 115→ 459 +172 sec for control) 6-min walk (1187 + 279→1328 + 254 ft; 929 + 356 → 1052 + 403 ft for control) MLHFQ (9 point decrease for EPO; 10 point increase for control)
<0.0001 <0.05 <0.004 <0.05 <0.04
Silverberg et al. 20055
• No control group • Not blinded
78 NYHA class (3.7 → 2.5) LVEF (33.3% → 36.9%) Number of hospitalizations/patient (2.7 → 0.7)
<0.01 <0.01 <0.01
1J Am Coll Cardiol. 2000;35(7):1737-1744 2J Am Coll Cardiol. 2001;37(7):1775-1780 3Nephrol Dial Transplant. 2003;18:141-146 4Circulation. 2003;107:294-299 5Kidney Blood Press Res. 2005;28:41-47
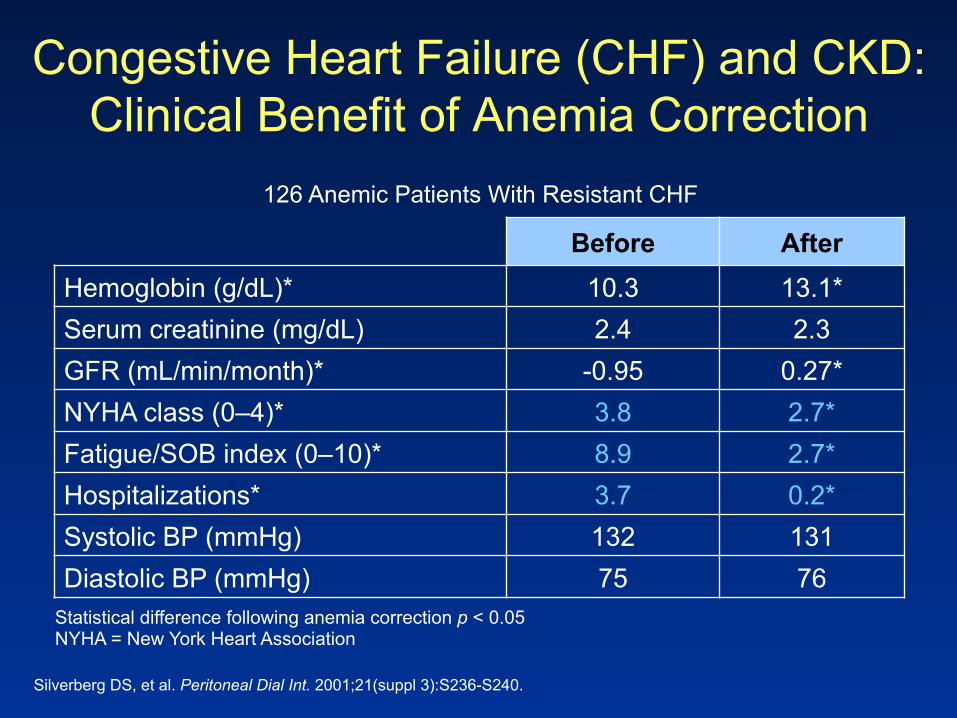
Congestive Heart Failure (CHF) and CKD: Clinical Benefit of Anemia Correction
Statistical difference following anemia correction p < 0.05 NYHA = New York Heart Association
Silverberg DS, et al. Peritoneal Dial Int. 2001;21(suppl 3):S236-S240.
126 Anemic Patients With Resistant CHF
Before After Hemoglobin (g/dL)* 10.3 13.1* Serum creatinine (mg/dL) 2.4 2.3 GFR (mL/min/month)* -0.95 0.27* NYHA class (0–4)* 3.8 2.7* Fatigue/SOB index (0–10)* 8.9 2.7* Hospitalizations* 3.7 0.2* Systolic BP (mmHg) 132 131 Diastolic BP (mmHg) 75 76
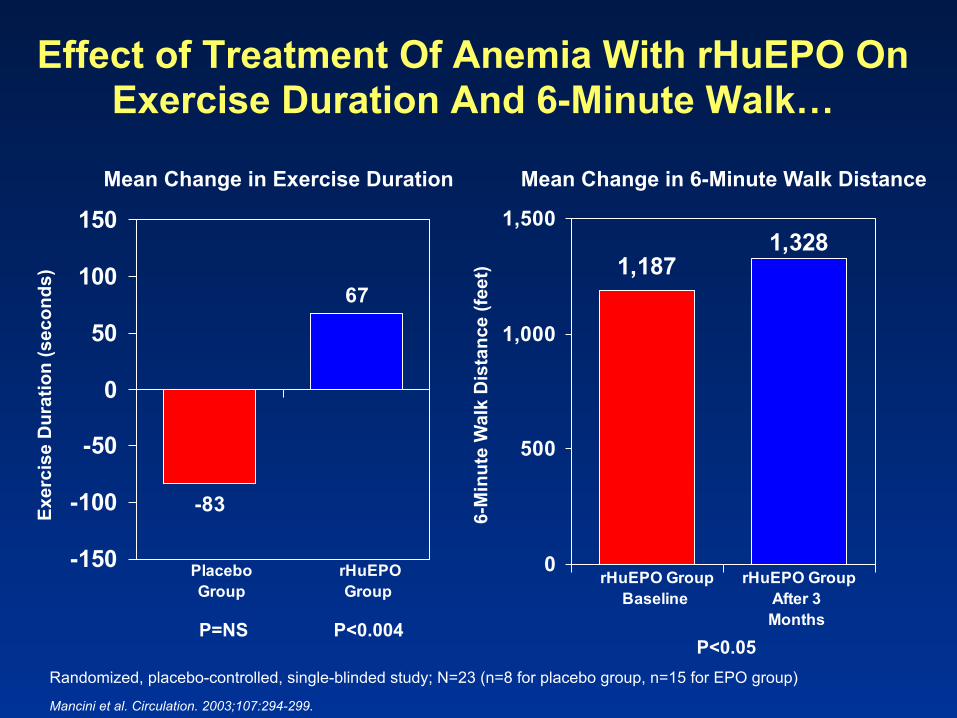
Effect of Treatment Of Anemia With rHuEPO On Exercise Duration And 6-Minute Walk…
Mancini et al. Circulation. 2003;107:294-299.
Mean Change in Exercise Duration
-83
67
-150
-100
-50
0
50
100
150
Placebo Group
rHuEPOGroup
P<0.004
Mean Change in 6-Minute Walk Distance
1,3281,187
0
500
1,000
1,500
rHuEPO GroupBaseline
rHuEPO GroupAfter 3 Months
P<0.05
6-M
inut
e W
alk
Dis
tanc
e (fe
et)
Exer
cise
Dur
atio
n (s
econ
ds)
Randomized, placebo-controlled, single-blinded study; N=23 (n=8 for placebo group, n=15 for EPO group)
P=NS

…As Well As Peak VO2 And Quality Of Life In Heart Failure Patients
Mean Change in Peak VO2
-0.5
1.7
-2
-1
0
1
2
3
Peak
VO
2 (m
L/kg
/min
)
Placebo Group
rHuEPO Group P<0.05
10
-9
-16-12-8-40481216
MLH
FQ (p
oint
s)
P<0.04
Mean Change in MLHFQ Score
Mancini et al. Circulation. 2003;107:294-299.
P=NS
Placebo Group
rHuEPO Group
(P not available)
Randomized, placebo-controlled, single-blinded study; N=23 (n=8 for placebo group, n=15 for EPO group)

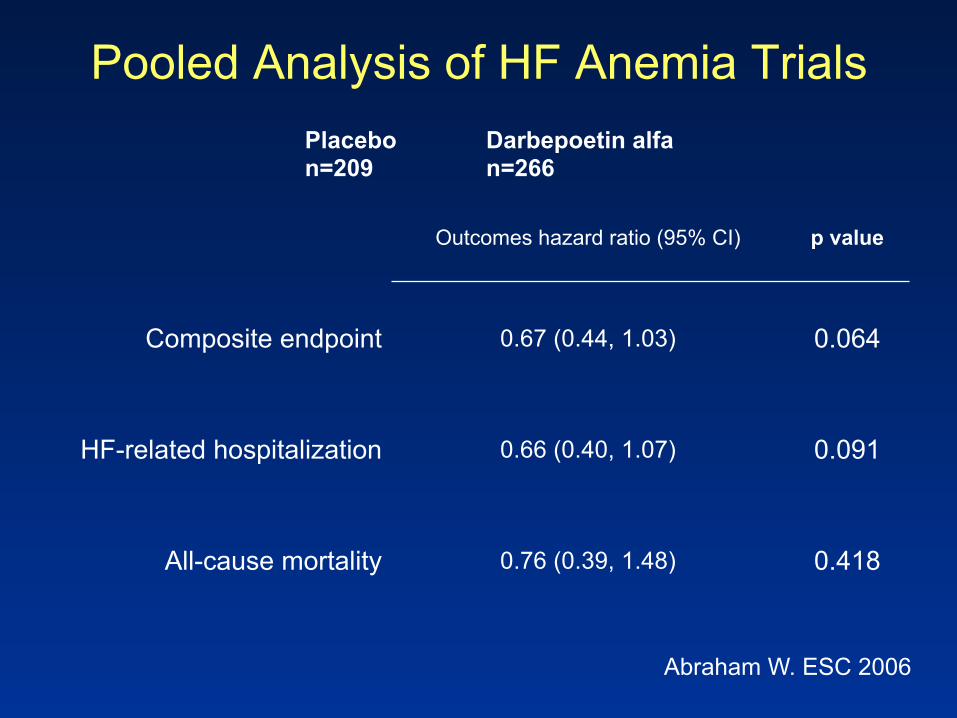
Pooled Analysis of HF Anemia Trials
Outcomes hazard ratio (95% CI) p value
Composite endpoint 0.67 (0.44, 1.03) 0.064
HF-related hospitalization 0.66 (0.40, 1.07) 0.091
All-cause mortality 0.76 (0.39, 1.48) 0.418
Placebo n=209
Darbepoetin alfa n=266
Abraham W. ESC 2006
Pooled Analysis of HF Anemia Trials
Outcomes hazard ratio (95% CI) p value
Composite endpoint 0.67 (0.44, 1.03) 0.064
HF-related hospitalization 0.66 (0.40, 1.07) 0.091
All-cause mortality 0.76 (0.39, 1.48) 0.418
Placebo n=209
Darbepoetin alfa n=266
Abraham W. ESC 2006

Potential Benefits and Risks of Treating Anemia in HF
Potential Benefits • Improved oxygen
delivery • Improved exercise
tolerance • Attenuate adverse
remodeling • Improved QoL • Antiapoptotic? • Decrease in hosp./
death?
Potential Risks • Increased thrombosis • Platelet activation • Hypertension • Endothelial activation
Adapted from Felker and O’Connor J Am Coll Cardiol. 2004;44:959-966.

Recent Oncology Publications Raised Concern Regarding VTE Risk in EPO-
Treated Patients
The Lancet Oncology 2003;4:459-460.

Treatment of Anemia with Erythropoietin Stimulating Agents
(ESAs): What We Know Dialysis CKD
Improvements
Hb
Reduces Transfusion +/-
Quality of Life +/-
CV Outcomes no 3 RCTs

Normal Hematocrit Dialysis Trial
Besarab et al,New Engl J Med 1998
N=618
N=615
~Hb 10
~Hb 13

RR 1.3 (95 CI 0.9 to 1.9)
Besarab et al,New Engl J Med 1998
Normal Hematocrit Dialysis Trial D
eath
or M
I
N=618
N=615
• No benefit higher Hct (Hb) • More vascular access problems
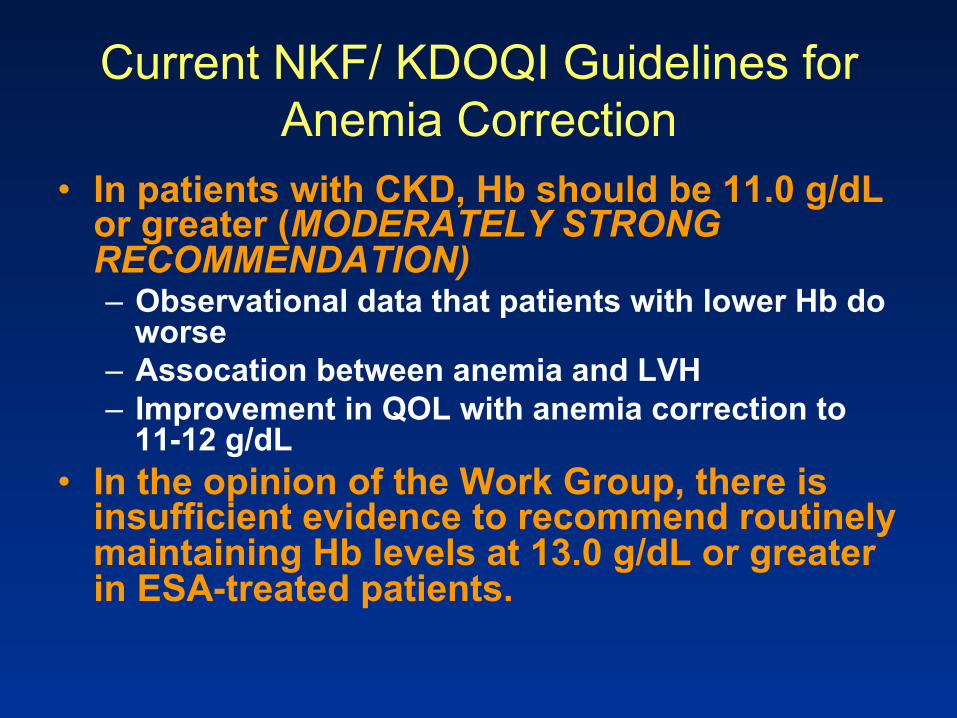
Current NKF/ KDOQI Guidelines for Anemia Correction
• In patients with CKD, Hb should be 11.0 g/dL or greater (MODERATELY STRONG RECOMMENDATION) – Observational data that patients with lower Hb do
worse – Assocation between anemia and LVH – Improvement in QOL with anemia correction to
11-12 g/dL • In the opinion of the Work Group, there is
insufficient evidence to recommend routinely maintaining Hb levels at 13.0 g/dL or greater in ESA-treated patients.

• CREATE (Cardiovascular risk Reduction by Early Anemia Treatment with Epoetin beta) - Completed – Determine the impact of early vs late anemia correction on
mortality and cardiovascular morbidity in patients with CKD
• CHOIR (Correction of Hemoglobin and Outcomes In Renal insufficiency) – Terminated Early – Determine the impact of degree of anemia correction on
mortality and cardiovascular morbidity in patients with CKD
• TREAT (Trial to Reduce Cardiovascular Events with Aranesp® Therapy) - Enrolling – Determine the impact of anemia therapy (yes/no) on
mortality and cardiovascular morbidity in patients with CKD and type 2 diabetes
3 RCTs Designed to Address Whether Anemia Correction in CKD May Improve CV Morbidity and Mortality

N=209N=263
N=201N=254
N=199N=256
N=198N=257
N=201N=255
N=195N=252
N=194N=253
N=187N=238
N=184N=240
N=179N=237
N=179N=245
N=178N=236
N=176N=231
N=175N=229
N=127N=140
Hem
og
lob
in (
g/d
L)
8
9
10
11
12
13
14
Visit WeekBL 1 3 5 7 9 11 13 15 17 19 21 23 25 27
Hemoglobin Concentrations (Mean ± SE) Over Time*
*For subjects in study 170 who stayed on study longer than 27 weeks, the Hb concentration remained stable throughout the study
Darbepoetin alfa Placebo
Pooled Efficacy Results: Hemoglobin Response in Studies 170 and 171

General Design Differences CREATE CHOIR TREAT
Design Randomized, open-label Randomized, open-label Randomized, double-blind, controlled
Sponsor / Agent Roche / Neorecormon® (epoetin beta)
J&J / Procrit® (epoetin alfa)
Amgen / Aranesp® (darbepoetin alfa)
Dosing 2,000 QW Initiate 10,000 QW When stable go to Q2W
0.75mcg/kg/Q2W Double dose when stable
and go to QM
Dosing Frequency De novo to QW De novo to QW to Q2W De novo to Q2W to QM
Hb Target(s),
g/L
Arm 1 130-150 135 130
Arm 2 105-115* 113 Rescue for Hb <90
Regions/Countries EU, Mexico, China, Taiwan, Thailand US US, EU, CAN, AU, LA,
RUS
# Centers Unknown 130 ~700
Censor at RRT Unknown Unknown No
* Treatment starts when Hb <10.5 g/dL

Key Inclusion Criteria and Baseline Characteristics
CREATE (N = 472)a, c, d
CHOIR (N = 963 - 1141)a, b
TREAT (N = 348 - 441)a
Inclusion
Hb (g/L) 110 – 125 <110 ≤110
eGFR/CrCl* 15-35 15-50 20-60
Diabetes No (~20%) No (48.5%) Yes (100%)
Baseline Characteristics
Hb (g/L) 116 101 -
eGFR/CrCl* 24.5 27.0 -
a Study population sample w/ available data
b Abstracts, 2004 ASN, St. Louis, MO c MacDougall et al. NDT 2003;18[suppl 2]:ii13-ii16 d www.theKidney.org
* TREAT, CHOIR: mL/min/1.73m2 * CREATE: mL/min
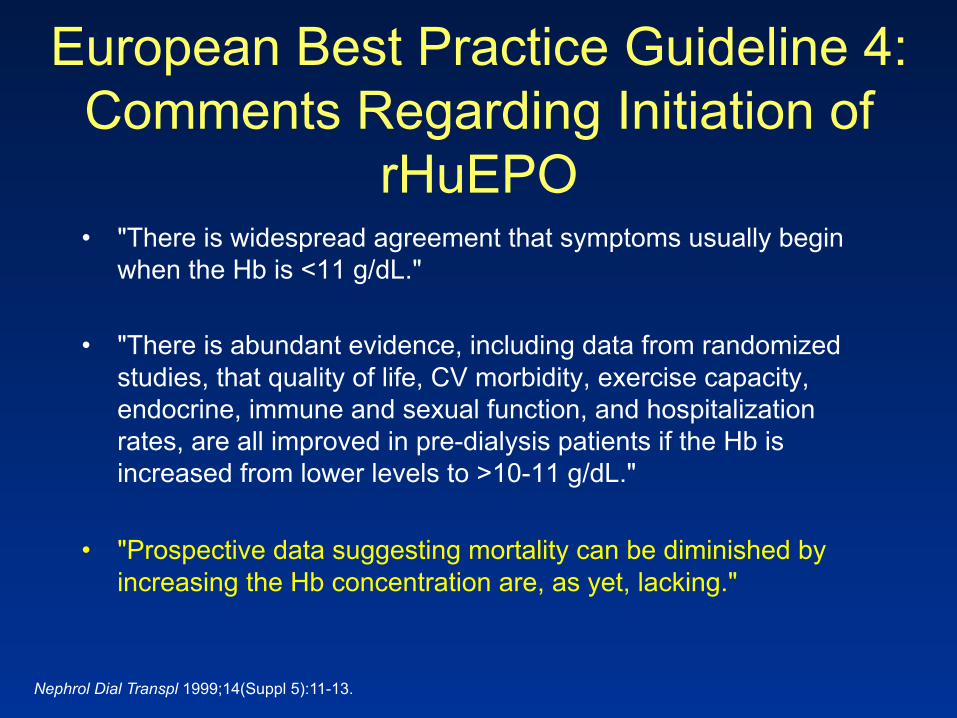
European Best Practice Guideline 4: Comments Regarding Initiation of
rHuEPO • "There is widespread agreement that symptoms usually begin
when the Hb is <11 g/dL."
• "There is abundant evidence, including data from randomized studies, that quality of life, CV morbidity, exercise capacity, endocrine, immune and sexual function, and hospitalization rates, are all improved in pre-dialysis patients if the Hb is increased from lower levels to >10-11 g/dL."
• "Prospective data suggesting mortality can be diminished by increasing the Hb concentration are, as yet, lacking."
Nephrol Dial Transpl 1999;14(Suppl 5):11-13.

Study Endpoints CREATE CHOIR TREAT
Primary Endpoint
1. Change in LVMI: baseline to 1 year 2. Time to: - Sudden death - MI (fatal, non-fatal) - Stroke (fatal, non-fatal) - Heart failure (acute) - Angina (hosp >24 hrs) - Arrhythmias (hosp >24 hrs) - PVD (necrosis, amputation)
Time to all-cause mortality or CV morbidity: - MI - Stroke - Heart failure Hospitalization
- Unplanned hospitalization for heart failure [No coincident initiation of RRT] with administration of IV inotrope, diuretic, vasodilator
Time to all-cause mortality or CV morbidity: - MI - Stroke - Heart failure - Hosp for acute myocardial ischemia
Secondary Endpoints
- All-cause mortality - CV mortality - CHF (change in NYHA class) - CV interventions - Hospitalization - LV growth and systolic fxn - Progression of CKD - Nutritional status - QOL
-All Cause Mortality -CHF Hospitalization -MI -CVA -RRT -CV Hospitalization -Incident CHF -All cause Hospitalization -Change from baseline for Hct/Hb, eGFR, Fe stores -HRQOL
Time to each of: - ESRD or all-cause mortality - ESRD - CV mortality - Components of 1o endpoint Change in pt-reported fatigue: baseline to wk 25 Change in eGFR
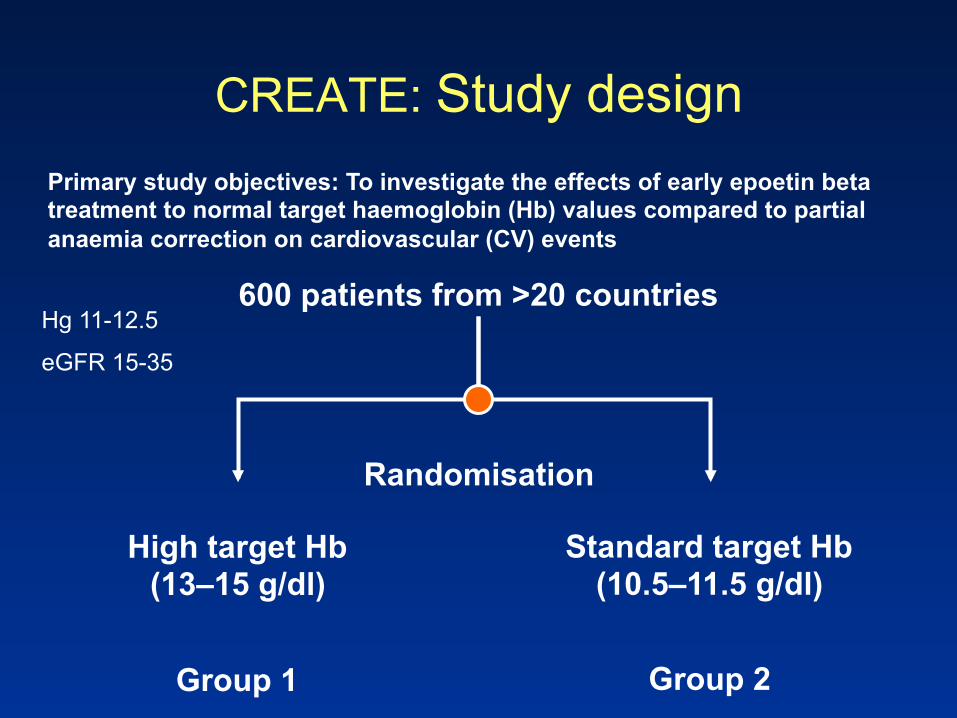
CREATE: Study design
600 patients from >20 countries
Randomisation
High target Hb (13–15 g/dl)
Standard target Hb (10.5–11.5 g/dl)
Group 1 Group 2
Primary study objectives: To investigate the effects of early epoetin beta treatment to normal target haemoglobin (Hb) values compared to partial anaemia correction on cardiovascular (CV) events
Hg 11-12.5
eGFR 15-35

Primary endpoint Time to first CV events (105 events)
Events: 58 vs 47 HR=1.22 (0.83–1.79) Log rank test p=0.20

Cardiovascular Risk Reduction by Early Anemia Treatment with Epoetin beta (CREATE)
CREATEa
Reason for Stopping Last subject followed 2 years
Duration Enrollment (months) Unknown
Total Study Duration (months) 48
Median Follow-up (years) 2.5
Hb Achieved (g/L) Arm 1 135
Arm 2 Unknown ('stable')
Composite Primary Event Rate (% per year) 5.8
# Composite Primary Events Observed Arm 1 58 Arm 2 47
HR (95% CI) Composite Primary Endpoint 1.22 (0.83, 1.79) - estimated
# ESRD Events Observed Arm 1 127 Arm 2 111
HR (p value) Time to ESRD 1.32 (p = 0.034)
Secondary Endpoints Improved QOL (p = 0.003) in higher Hb arm, but clinical significance uncertain;
no difference in other 2ndarys a www.theKidney.org

Correction of Hemoglobin and Outcomes in Renal Insufficiency (CHOIR)
1432 Patients Randomized
715 Group A (Hb 135 g/L) 717 Group B (Hb 113 g/L)
279 Early Withdrawal without experiencing primary endpoint
271 Early Withdrawal without experiencing primary endpoint
DSMB Stopped Study May 2005 for Futility (not a stopping rule) Results Released April 2006 at NKF meeting
Singh A et al. NEJM 2006

Kaplan-Meier Plot of the Time to the Primary Composite Event between Randomization and
Termination: ITT Population
Primary Composite Endpoint: Death, MI, CHF hosp (no RRT) and/or stroke
Randomized Treatment Hemoglobin Target 13.5 g/dL Hemoglobin Target 11.3 g/dL
Kap
lan-
Mei
er F
ailu
re E
stim
ate
(%)
0%
5%
10%
15%
20%
25%
30%
Months from Randomization 0 6 12 18 24 30 36
Hazard ratio 1.337 (1.025, 1.743) P= 0.0312
715 717
587 594
457 499
270 293
55 44
101 107
0 3 At risk
Hazard ratio 1.337 (1.025, 1.743) P= 0.0312
Singh A et al. NEJM 2006
Randomized Treatment Hemoglobin Target 13.5 g/dL Hemoglobin Target 11.3 g/dL
Kaplan-Meier Failure Estimate (%)
0%
5%
10%
15%
20%
0 6 12 18 24 30 36 0%
5%
10%
15%
20%
0 6 12 18 24 30 36
Kaplan-Meier Failure Estimate (%)
0%
5%
10%
15%
20%
Months from Randomization
0 6 12 18 24 30 36 0%
5%
10%
15%
20%
Months from Randomization
0 6 12 18 24 30 36
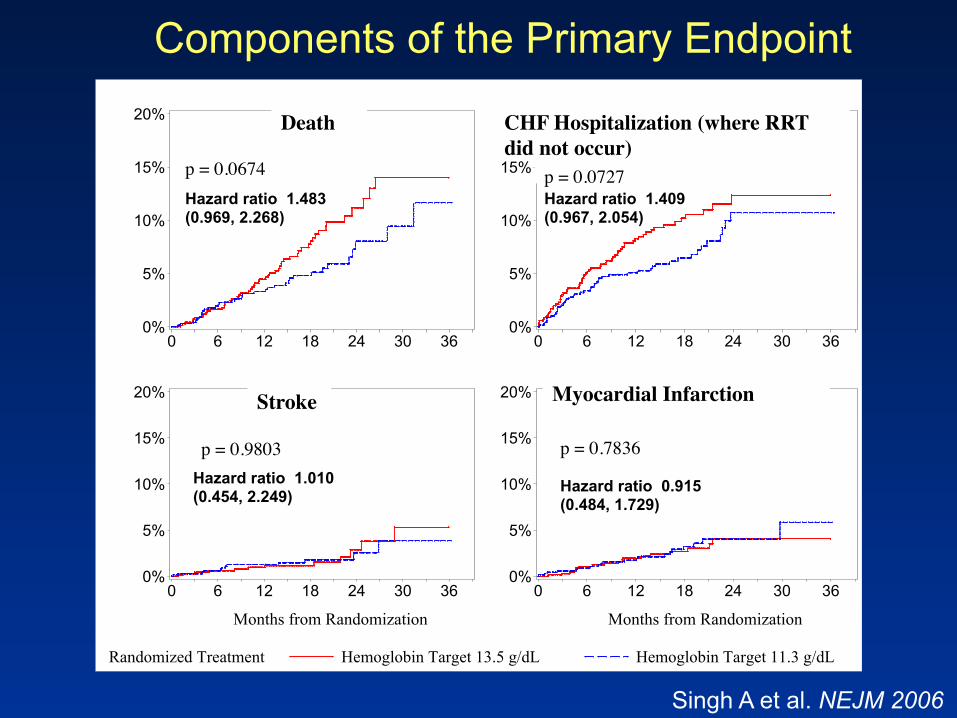
CHF Hospitalization (where RRT did not occur)
Myocardial Infarction
Stroke
Death
p = 0.0727
p = 0.0674
p = 0.9803
p = 0.7836
Components of the Primary Endpoint
Hazard ratio 1.483 (0.969, 2.268)
Hazard ratio 1.409 (0.967, 2.054)
Hazard ratio 1.010 (0.454, 2.249)
Hazard ratio 0.915 (0.484, 1.729)
Singh A et al. NEJM 2006

CHOIR Outcomes: Mortality and CV Morbidity
Endpoint # Events
HR (95% CI) p-value Hb 135 Hb 113
Composite Primary 125 97 1.337 (1.025, 1.743)* 0.0312
Secondary
All-cause death 52 36 1.483 (0.969, 2.268) 0.0674
CV death 26 22 ?
MI 18 20 0.915 (0.484, 1.720) 0.78
Stroke 12 12 1.010 (0.454, 2.249) 0.9803
Heart Failure 64 47 1.409 (0.967, 2.054) 0.0727
Time to ESRD ? ? 1.186 (0.941, 1.495) ?
Cardiovascular hospitalization ? ? 1.225 (1.0131, 1.448)
Composite primary event rate 17.5% 13.5%
KM – 3yr event rate 29.5% 24.9%
* Time for KM curves to separate: ~ 6-8 months Singh A et al. NEJM 2006

CHOIR Results
0 1 2 135 g/L target
better 113 g/L target
better
Primary Composite Endpoint
Death
CHF Hospitalization
Myocardial Infarction
Stroke
Singh A et al. NEJM 2006

Cause of Death in CHOIR
Hb 135 g/L Hb 113 g/L
Deaths 52 36
Causes
Cardiovascular 26 22
Thrombotic 0 2
ESRD 2 0
Sepsis 5 0
Other 19 12

Metaanalysis: Mortality
Lancet 2007

Metaanalysis: MI
Lancet 2007

TREAT: Trial to Reduce Cardiovascular Events with Aranesp® (Darbepoetin alfa) Therapy
Hypothesis:
Treatment of anemia with darbopoetin alfa reduces the risk of mortality and nonfatal cardiovascular events in patients with CKD and type 2
diabetes
Darbopoetin alfa Group (Target Hemoglobin 13 g/dL)
Control Group
Study Population • Hemoglobin ≤11 g/dL • GFR 20-60 mL/min • Type 2 DM
N = 2000
N = 2000
Design – randomized (1:1), double blind, controlled
Event-driven Event-driven: 1200 patients
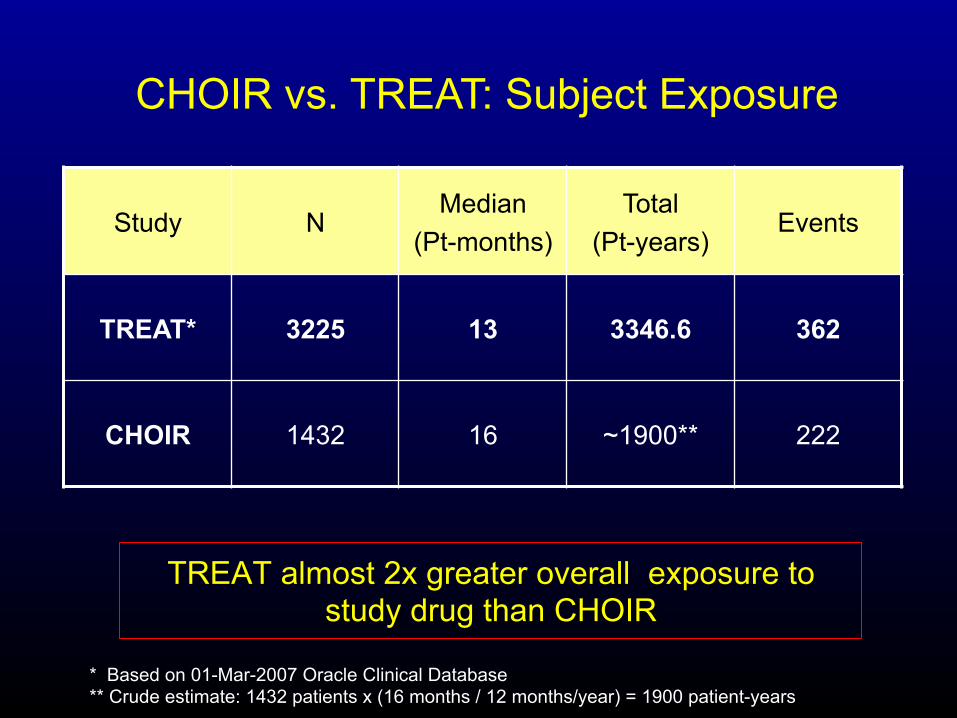
Study N Median
(Pt-months) Total
(Pt-years) Events
TREAT* 3225 13 3346.6 362
CHOIR 1432 16 ~1900** 222
* Based on 01-Mar-2007 Oracle Clinical Database ** Crude estimate: 1432 patients x (16 months / 12 months/year) = 1900 patient-years
CHOIR vs. TREAT: Subject Exposure
TREAT almost 2x greater overall exposure to study drug than CHOIR

NEJM 2007 Lancet February 2007

Unanswered Question in Anemia Rx
• What Targets? • Which Patients?


Anemia is a readily identifiable surrogate associated with …high rates of adverse clinical outcomes. Because ESP can raise hematocrit, it is imperative to definitively determine the risk: benefit ratios of these available therapies…. To accept a benefit based on the existing data may be exposing patients to an expensive therapy that is either ineffective or may even contribute to adverse outcome. On the other hand, to accept harm based on existing data may deny patients the ability to improve their prognosis as well as quality of life.
Rev Cardiovasc Med 2005

Darbepoetin alfa group (target Hb 13.0, not to exceed 14.5 g/dL)
Placebo group
Study Population Hb 9 to 12 g/dL LVEF < 35% NYHA Class II to IV
N = 1700
N = 1700
Hypothesis: Treatment of anemia with darbepoetin alfa in subjects with symptomatic left ventricular systolic
dysfunction and anemia decreases the risk of all-cause mortality or hospital admission for worsening HF
1:1 randomization
RED-HF Trial: Hypothesis and Study Design
Young JB, et al J Cardiac Failure 2006;(Suppl 1):6:S77.

Randomized Controlled Trials Play A Critical Role in Advancing Patient Care Through Guidelines
Drug Discovery
Patient Outcomes
Clinical Trials
Guidelines
Quality Indicators
Caregiver Performance
Califf, R et al JACC 2002;40(11):1895-1901
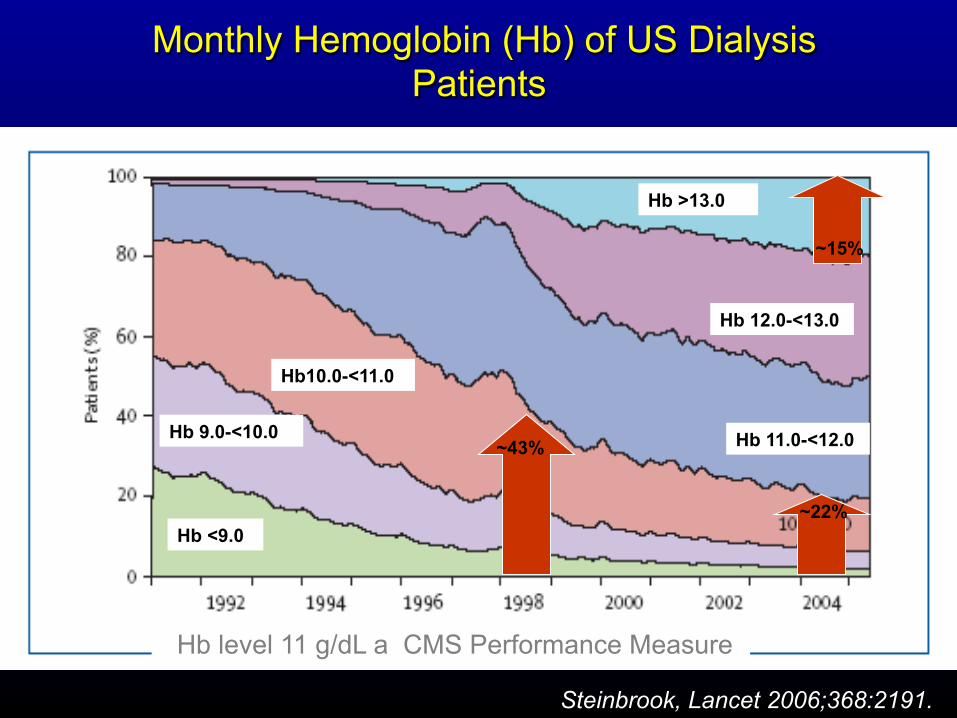
Monthly Hemoglobin (Hb) of US Dialysis Patients
Steinbrook, Lancet 2006;368:2191.
Hb10.0-<11.0
Hb 12.0-<13.0
Hb >13.0
~43%
~22%
Hb level 11 g/dL a CMS Performance Measure
~15%
Hb 11.0-<12.0 Hb 9.0-<10.0
Hb <9.0

Randomized Controlled Trials Have Driven the Evolution of Guidelines in Cardiology
ACC/AHA Guidelines for Management of Acute MI: Beta Blockade
• 1990 – Beta blockers are first recommend for targeted patients (reflex tachycardia, systolic hypertension, persistent angina, no signs of heart failure)1
• 1996 – Guidelines include 'non ST MI' patients in the highest level recommendation2
• 1999 – Patients with 'moderate LV failure' are moved from the class III (potentially harmful) to the class IIb (potentially useful) level recommendation3
• 2001 – Beta blockers are a highest-level recommendation for all post-MI patients4
1 Gunnar RM, et al. Circulation 1990;82(2):664-707 2 Ryan TJ, et al. Circulation 1996;94(9):2341-2350 3 Ryan TJ, et al. Circulation 1999;100(9):1016-30 4 Smith CC, et al. Circulation 2001;104(13):1577-9
ACC = American College of Cardiology AHA = American Heart Association MI = myocardial infarction LV = left ventricular

Negative Results From Randomized Controlled Trials Evolve The Practice of Medicine
• Secondary prevention of cardiovascular disease with estrogens1
• Prophylaxis against ventricular dysrhythmia in the peri-myocardial infarction setting with lidocaine2
• Prophylaxis against pre-eclampsia with calcium supplementation3
1 Hulley S, et al. JAMA 1998;280(7):605-613. 2 Sadowski ZP, et al. American Heart Journal 1999;137(5):792-798. 3 Levine RJ, et al. NEJM 1997;337(2):69-76.

Patients who are deficient in X do not necessarily benefit from repleting X
• Hormone Replacement Therapy – Reduced Estrogen associated with increased risk
of • Heart Disease • Bone Loss
– Observational Suggested Benefits of HRT – Randomized Trials suggested harm with HRT
• Thyroid Replacement – Just enough – good – Too much - bad
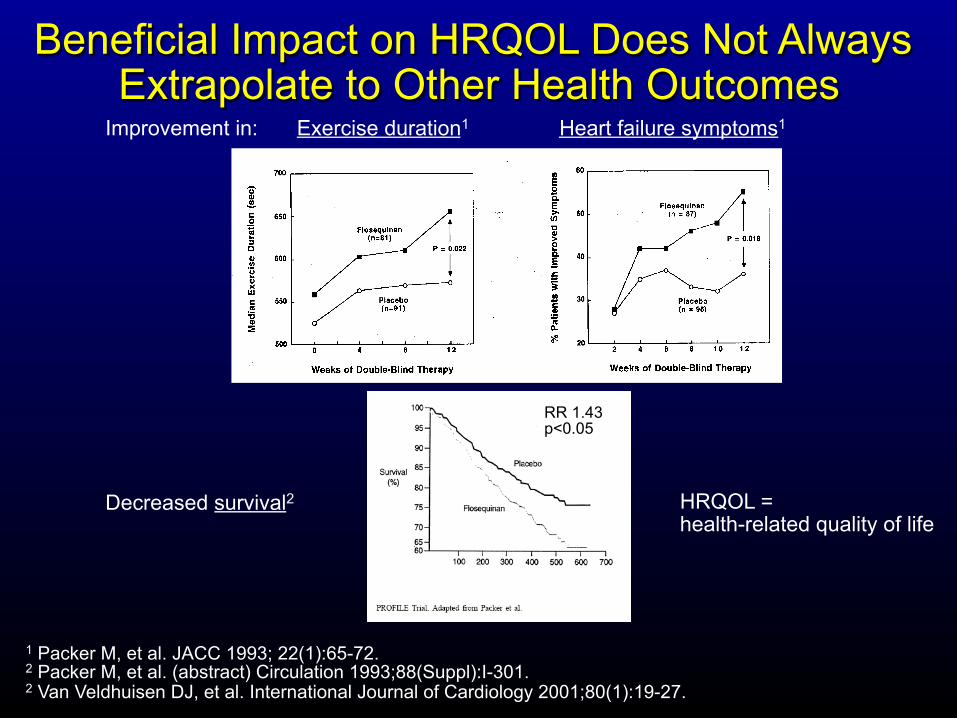
1 Packer M, et al. JACC 1993; 22(1):65-72. 2 Packer M, et al. (abstract) Circulation 1993;88(Suppl):I-301. 2 Van Veldhuisen DJ, et al. International Journal of Cardiology 2001;80(1):19-27.
Beneficial Impact on HRQOL Does Not Always Extrapolate to Other Health Outcomes
Improvement in: Exercise duration1 Heart failure symptoms1
RR 1.43 p<0.05
Decreased survival2 HRQOL = health-related quality of life
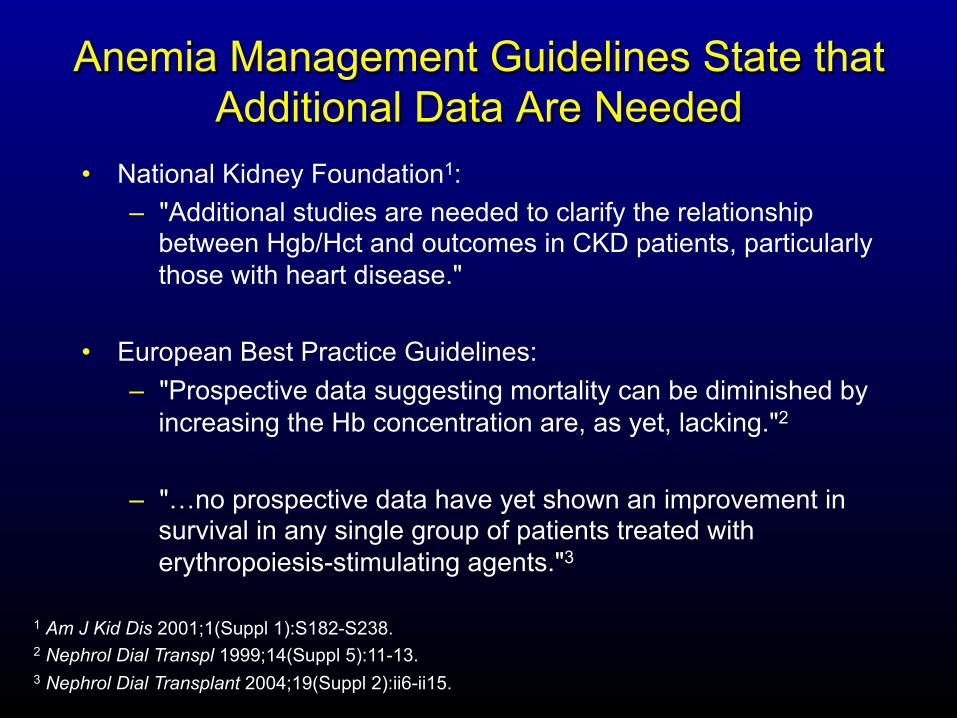
Anemia Management Guidelines State that Additional Data Are Needed
• National Kidney Foundation1: – "Additional studies are needed to clarify the relationship
between Hgb/Hct and outcomes in CKD patients, particularly those with heart disease."
• European Best Practice Guidelines: – "Prospective data suggesting mortality can be diminished by
increasing the Hb concentration are, as yet, lacking."2
– "…no prospective data have yet shown an improvement in survival in any single group of patients treated with erythropoiesis-stimulating agents."3
1 Am J Kid Dis 2001;1(Suppl 1):S182-S238. 2 Nephrol Dial Transpl 1999;14(Suppl 5):11-13. 3 Nephrol Dial Transplant 2004;19(Suppl 2):ii6-ii15.

Conclusions • Anemia is a risk factor for adverse outcome in
patients with CKD and CVD • Correction of anemia with ESPs may offer
benefits to some patients in some clinical circumstances, although degree of correction is hotly debated
• Nevertheless, the potential for harm has been demonstrated with anemia correction in the CKD population
• We should be cautious until we have results from ongoing major clinical trials in anemia correction to reduce CV risk
I was hoping I’d be in the active therapy
group?
Well, I was hoping I’d be in the placebo
group?
The definition of equipoise

Trials of Anemia Targets in CKD
• CHOIR study – 1432 subjects recruited, diabetic and nondiabetic CKD patients – Epoetin-alfa – 130 centers, US only – Hb 13.5 g/dL vs 11.3 g/dL – Study stopped by Data and Safety and Monitoring Board
• CREATE study – Approximately 603 subjects – Epoetin-beta – 100 centers. 22 countries – Study reported data at European Renal Association/European Dialysis and Transplant
Association conference
• TREAT study – 4000 subjects with CKD and type 2 diabetes – Darbepoietin – 700 centers, 26 countries – Placebo-controlled with rescue arm: Hb 9.0 g/dL vs 13.0 g/dL – Enrollment under way
CHOIR = American Correction of Hemoglobin and Outcomes in Renal Insufficiency; CREATE = Cardiovascular Risk Reduction by Early Anemia Treatment With Epoetin-beta; TREAT = Trial to Reduce Cardiovascular Events with Aranesp® Therapy.

CHOIR Study Design • Open label, Randomized Controlled Trial • 130 sites randomized 1432 subjects in US • 3 years duration
• Median f/u 16 months • Study population
• Hb < 11 g/dl • Age ≥ 18
• Steady-state GFR ≥ 15 ml/min and ≤ 50 ml/min
• Primary Endpoint: Composite event • Death • Myocardial infarction • Stroke • CHF hospitalization (excluding RRT)
Singh et al In press
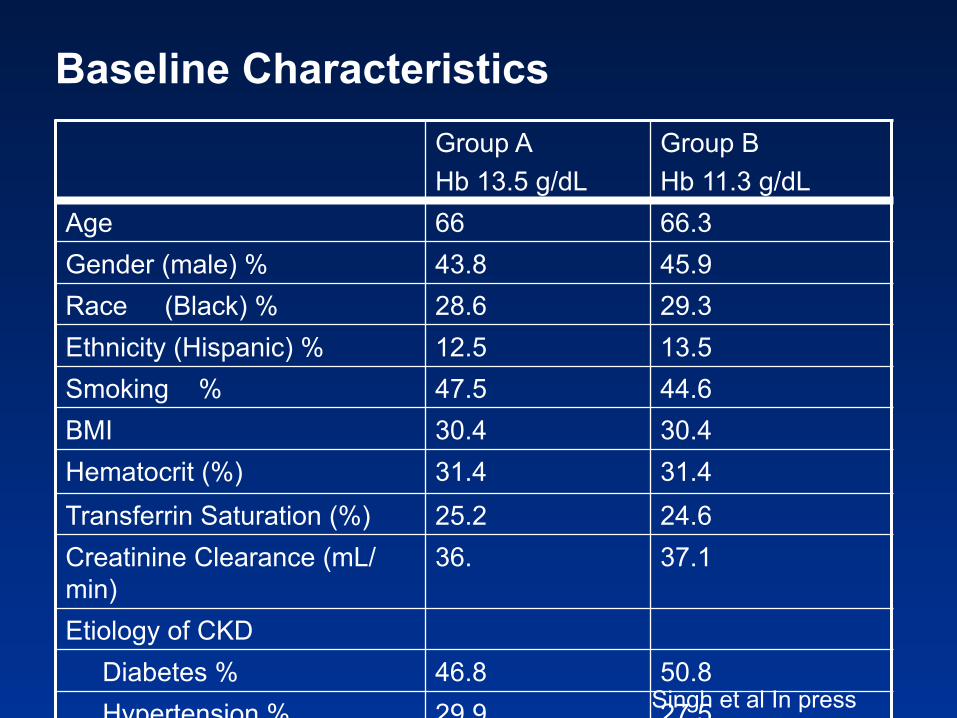
Group A Hb 13.5 g/dL
Group B Hb 11.3 g/dL
Age 66 66.3 Gender (male) % 43.8 45.9 Race (Black) % 28.6 29.3 Ethnicity (Hispanic) % 12.5 13.5 Smoking % 47.5 44.6 BMI 30.4 30.4 Hematocrit (%) 31.4 31.4 Transferrin Saturation (%) 25.2 24.6 Creatinine Clearance (mL/min)
36. 37.1
Etiology of CKD Diabetes % 46.8 50.8 Hypertension % 29.9 27.5 Other % 23.3 21.6
Baseline Characteristics
Singh et al In press

Hemoglobin and Epoetin alfa over Time
N
Hb 13.5 710 667 632 600 558 507 485 433 367 306 252 194 139 95 81 67 49 31 13Hb 11.3 707 672 625 603 549 528 510 471 384 334 250 182 141 101 75 60 45 30 13
N
Hb 13.5 710 667 632 600 558 507 485 433 367 306 252 194 139 95 81 67 49 31 13Hb 11.3 707 672 625 603 549 528 510 471 384 334 250 182 141 101 75 60 45 30 13
N
Hb 13.5 710 667 632 600 558 507 485 433 367 306 252 194 139 95 81 67 49 31 13Hb 11.3 707 672 625 603 549 528 510 471 384 334 250 182 141 101 75 60 45 30 13
N
Hb 13.5 710 667 632 600 558 507 485 433 367 306 252 194 139 95 81 67 49 31 13Hb 11.3 707 672 625 603 549 528 510 471 384 334 250 182 141 101 75 60 45 30 13
Randomized Treatment
Hemoglobin Target 13.5 g/dL
Hemoglobin Target 11.3 g/dL
Mea
n H
emog
lobi
n (g
/dL
) an
d 95
% C
.I.
9.5
1010
.511
11.5
1212
.513
13.5
1414
.515
15.5
Study Month
0 2 4 6 8 10 12 14 16 18 20 22 24 26 28 30 32 34 36
Randomized Treatment
Hemoglobin Target 13.5 g/dL
Hemoglobin Target 11.3 g/dL
Mea
n H
emog
lobi
n (g
/dL
) an
d 95
% C
.I.
9.5
1010
.511
11.5
1212
.513
13.5
1414
.515
15.5
Study Month
0 2 4 6 8 10 12 14 16 18 20 22 24 26 28 30 32 34 36
Randomized Treatment
Hemoglobin Target 13.5 g/dL
Hemoglobin Target 11.3 g/dL
Mea
n H
emog
lobi
n (g
/dL
) an
d 95
% C
.I.
9.5
1010
.511
11.5
1212
.513
13.5
1414
.515
15.5
Study Month
0 2 4 6 8 10 12 14 16 18 20 22 24 26 28 30 32 34 36
Randomized Treatment
Hemoglobin Target 13.5 g/dL
Hemoglobin Target 11.3 g/dL
Mea
n H
emog
lobi
n (g
/dL
) an
d 95
% C
.I.
9.5
1010
.511
11.5
1212
.513
13.5
1414
.515
15.5
Study Month
0 2 4 6 8 10 12 14 16 18 20 22 24 26 28 30 32 34 36
N
Hb 13.5 709 693 659 623 578 530 500 452 370 310 258 189 132 97 79 65 52 27 11Hb 11.3 707 691 655 621 577 549 526 479 393 333 262 189 141 95 73 54 43 27 12
N
Hb 13.5 709 693 659 623 578 530 500 452 370 310 258 189 132 97 79 65 52 27 11Hb 11.3 707 691 655 621 577 549 526 479 393 333 262 189 141 95 73 54 43 27 12
N
Hb 13.5 709 693 659 623 578 530 500 452 370 310 258 189 132 97 79 65 52 27 11Hb 11.3 707 691 655 621 577 549 526 479 393 333 262 189 141 95 73 54 43 27 12
N
Hb 13.5 709 693 659 623 578 530 500 452 370 310 258 189 132 97 79 65 52 27 11Hb 11.3 707 691 655 621 577 549 526 479 393 333 262 189 141 95 73 54 43 27 12
Randomized Treatment
Hemoglobin Target 13.5 g/dL
Hemoglobin Target 11.3 g/dL
Mea
n E
poie
tin-a
lfa
Dos
e (U
) and
95%
C.I.
2000
4000
6000
8000
1000
012
000
1400
016
000
1800
020
000
Study Month
0 2 4 6 8 10 12 14 16 18 20 22 24 26 28 30 32 34 36
Randomized Treatment
Hemoglobin Target 13.5 g/dL
Hemoglobin Target 11.3 g/dL
Mea
n E
poie
tin-a
lfa
Dos
e (U
) and
95%
C.I.
2000
4000
6000
8000
1000
012
000
1400
016
000
1800
020
000
Study Month
0 2 4 6 8 10 12 14 16 18 20 22 24 26 28 30 32 34 36
Randomized Treatment
Hemoglobin Target 13.5 g/dL
Hemoglobin Target 11.3 g/dL
Mea
n E
poie
tin-a
lfa
Dos
e (U
) and
95%
C.I.
2000
4000
6000
8000
1000
012
000
1400
016
000
1800
020
000
Study Month
0 2 4 6 8 10 12 14 16 18 20 22 24 26 28 30 32 34 36
Randomized Treatment
Hemoglobin Target 13.5 g/dL
Hemoglobin Target 11.3 g/dL
Mea
n E
poie
tin-a
lfa
Dos
e (U
) and
95%
C.I.
2000
4000
6000
8000
1000
012
000
1400
016
000
1800
020
000
Study Month
0 2 4 6 8 10 12 14 16 18 20 22 24 26 28 30 32 34 36
Singh et al In press

CHOIR: QOL
• 3 instruments – LASA – KDQ – SF-36
• Limitations – Open label – Subjective

CHOIR QOL: LASA
Longitudinal Analysis
High vs. Low
Difference P value
Energy Level 0.0798 0.350
Ability in DL 0.1356 0.233
Overall QOL -0.001 0.991
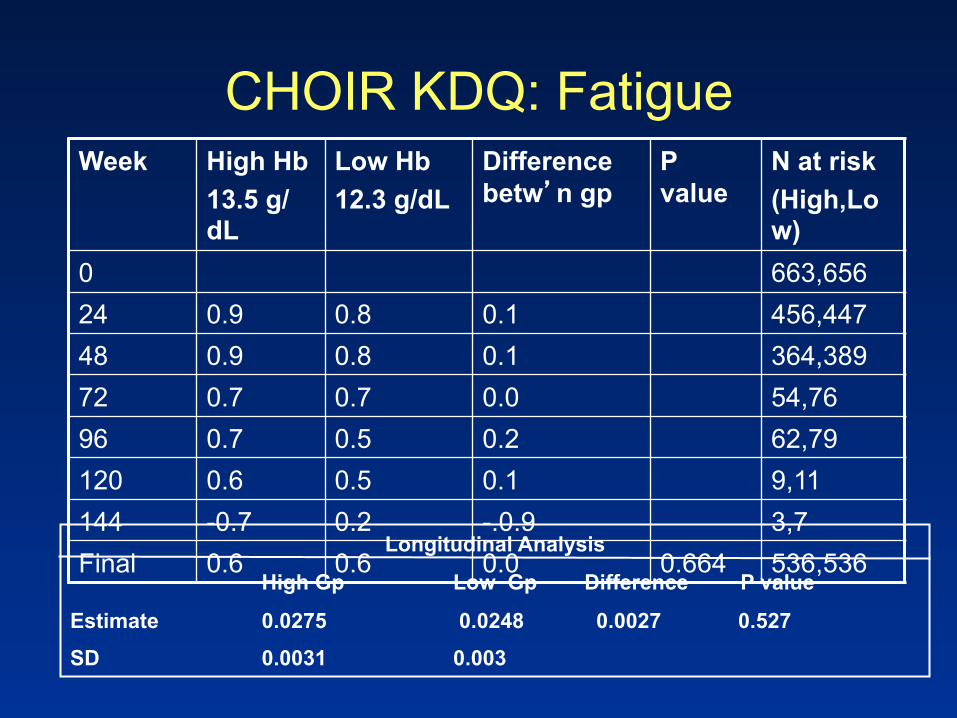
CHOIR KDQ: Fatigue Week High Hb
13.5 g/dL
Low Hb 12.3 g/dL
Difference betw’n gp
P value
N at risk (High,Low)
0 663,656 24 0.9 0.8 0.1 456,447 48 0.9 0.8 0.1 364,389 72 0.7 0.7 0.0 54,76 96 0.7 0.5 0.2 62,79 120 0.6 0.5 0.1 9,11 144 -0.7 0.2 -.0.9 3,7 Final 0.6 0.6 0.0 0.664 536,536
Longitudinal Analysis
High Gp Low Gp Difference P value
Estimate 0.0275 0.0248 0.0027 0.527
SD 0.0031 0.003
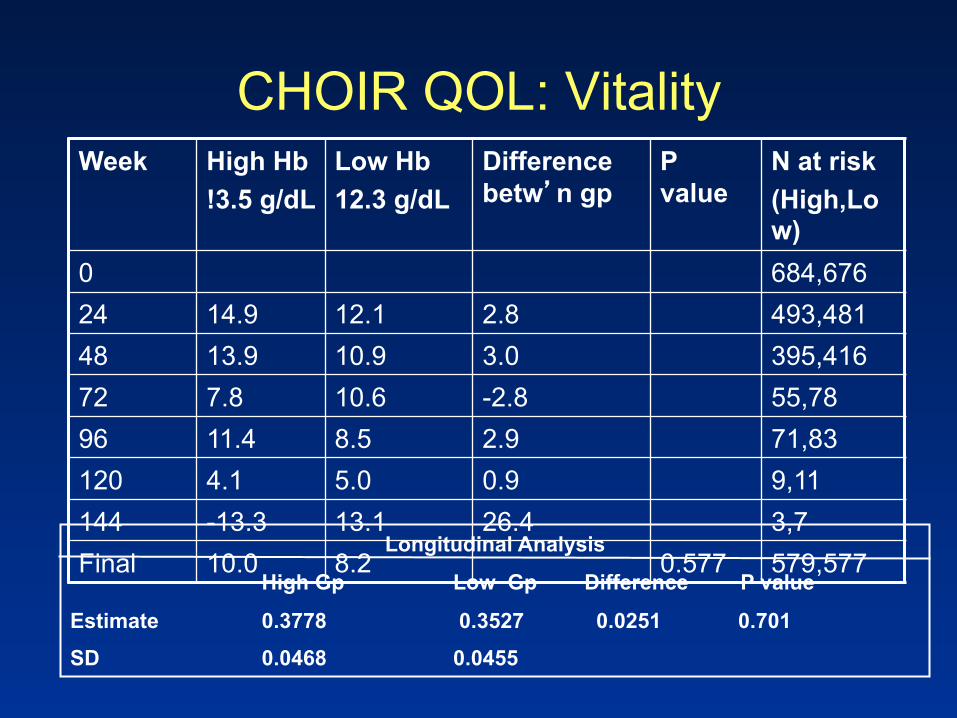
CHOIR QOL: Vitality Week High Hb
!3.5 g/dL Low Hb 12.3 g/dL
Difference betw’n gp
P value
N at risk (High,Low)
0 684,676 24 14.9 12.1 2.8 493,481 48 13.9 10.9 3.0 395,416 72 7.8 10.6 -2.8 55,78 96 11.4 8.5 2.9 71,83 120 4.1 5.0 0.9 9,11 144 -13.3 13.1 26.4 3,7 Final 10.0 8.2 0.577 579,577
Longitudinal Analysis
High Gp Low Gp Difference P value
Estimate 0.3778 0.3527 0.0251 0.701
SD 0.0468 0.0455

TREAT: Trial to Reduce Cardiovascular Events with Aranesp® (Darbepoetin alfa) Therapy
Hypothesis:
Treatment of anemia with Aranesp® reduces the risk of mortality and nonfatal cardiovascular events in patients with CKD and type 2 diabetes
Aranesp® Group (Target Hemoglobin 13 g/dL)
Control Group
Study Population • Hemoglobin ≤11 g/dL • GFR 20-60 mL/min • Type 2 DM
N = 2000
N = 2000
Design – randomized (1:1), double blind, controlled
Event-driven Event-driven: 1200 patients

Darbepoetin alfa group (target Hb 13.0, not to exceed 14.5 g/dL)
Placebo group
Study Population Hb 9 to 12 g/dL LVEF < 35% NYHA Class II to IV
N = 1700
N = 1700
Hypothesis: Treatment of anemia with darbepoetin alfa in subjects with symptomatic left ventricular systolic
dysfunction and anemia decreases the risk of all-cause mortality or hospital admission for worsening HF
1:1 randomization
RED-HF Trial: Hypothesis and Study Design
Young JB, et al J Cardiac Failure 2006;(Suppl 1):6:S77.

FDA Black Box Warning March 9 2007
WARNINGS: Erythropoiesis-Stimulating Agents Use the lowest dose of ESA that will gradually increase the hemoglobin
concentration to the lowest level sufficient to avoid the need for red blood cell transfusion (see DOSAGE AND ADMINISTRATION).
ESAs increased the risk for death and for serious cardiovascular events when administered to target a hemoglobin of greater than 12 g/dL (see WARNINGS: Increased Mortality, Serious Cardiovascular and Thromboembolic Events).
Cancer Patients: Use of ESAs • Shortened overall survival and increased deaths attributed to disease
progression at 4 months in patients with metastatic breast cancer receiving chemotherapy when administered to target a hemoglobin of greater than 12 g/dL,
• Increased the risk of death when administered to target a hemoglobin of 12 g/dL in patients with active malignant disease receiving neither chemotherapy nor radiation therapy. ESAs are not indicated in this population.
![Cardiovascular disease [autosaved]](https://static.fdocuments.net/doc/165x107/554b2ab7b4c905d3088b4ab0/cardiovascular-disease-autosaved.jpg)


![Anemia of Chronic Disease-1.ppt [Read-Only] - ocw.usu.ac.idocw.usu.ac.id/.../his127_slide_anemia_of_chronic_disease.pdf · Anemia of Chronic Disease (ACD) = Anemia of Chronic Inflammation](https://static.fdocuments.net/doc/165x107/5c00539409d3f24d2c8b7d4b/anemia-of-chronic-disease-1ppt-read-only-ocwusuacidocwusuacidhis127slideanemiaofchronic.jpg)