Andrew G Haldane: Curbing the credit cycle · Andrew G Haldane: Curbing the credit cycle Speech...
35
Andrew G Haldane: Curbing the credit cycle Speech presented by Andrew G Haldane, Executive Director, Financial Stability, Bank of England, at the Columbia University Center on Capitalism and Society Annual Conference, New York, 20 November 2010. * * * The speech was prepared by Messrs David Aikman, Andrew G Haldane and Benjamin Nelson. The views are not necessarily those of the Bank of England. We are grateful to Piergiorgio Alessandri, Richard Barwell, Salina Ladha, Roland Meeks, Victoria Saporta and Alan Taylor for comments. Thanks to Vijay Balle and Clare Rogowski for excellent research assistance and to Moritz Schularick and Alan Taylor for making their data available to us. 1. Introduction Credit lies at the heart of crises. Credit booms sow the seeds of subsequent credit crunches. This is a key lesson of past financial crashes, manias and panics (Minsky (1986), Kindleberger (1978), Rogoff and Reinhart (2009)). It was a lesson painfully re-taught to policymakers during the most recent financial crisis. This time’s credit cycle has been particularly severe and synchronous. In 2006, private sector credit across the UK, US and euro area rose by around 10%. During 2009, private credit in these countries fell by around 2%. 1 The knock-on consequences for real growth were equally severe and synchronous. Peak to trough, G7 real output fell by 3.6% during the Great Recession. In response, there have been widespread calls for remedial policy action. These proposals come in various stripes. Some have proposed a more active role for monetary policy in addressing financial imbalances (Taylor (2010), White (2009)). Others have suggested using new macro-prudential tools to rein in credit excesses (Borio and Lowe (2002), Bank of England (2009), Kashyap et al (2010)). Others still have proposed a radical root-and-branch reform of the structure of banking (Kay (2009), Kotlikoff (2010)). Evaluating the merits of these proposals requires a conceptual understanding of the causes of the credit cycle and an empirical quantification of its dynamic behaviour. What is the underlying friction generating credit booms and busts? Are credit cycles distinct from cycles in the real economy? And how have they evolved, both over time and across countries? Answers to these questions should help frame public policy choices for curbing the credit cycle. To fix ideas, Section 2 sketches a model of the credit cycle. In this model, a lack of information provides incentives for banks to expand their balance sheets to boost profits and signal their ability to investors. This gives rise to a coordination failure, as banks collectively risk-up. That, in turn, generates a systematic credit boom and subsequent bust when risk is realised. Sections 3 and 4 present some empirical evidence on the credit cycle. Across countries and across a sweep of history, credit cycles are both clearly identifiable and regular. Typically, they presage banking crises. In their frequency and amplitude, credit cycles are distinct from the business cycle. There is also evidence of them arising from coordination failures, which generate spillover effects across banks and countries. 1 See IMF (2010). BIS Review 168/2010 1
-
Upload
truongnguyet -
Category
Documents
-
view
218 -
download
0
Transcript of Andrew G Haldane: Curbing the credit cycle · Andrew G Haldane: Curbing the credit cycle Speech...

Andrew G Haldane: Curbing the credit cycle
Speech presented by Andrew G Haldane, Executive Director, Financial Stability, Bank of England, at the Columbia University Center on Capitalism and Society Annual Conference, New York, 20 November 2010.
* * *
The speech was prepared by Messrs David Aikman, Andrew G Haldane and Benjamin Nelson. The views are not necessarily those of the Bank of England. We are grateful to Piergiorgio Alessandri, Richard Barwell, Salina Ladha, Roland Meeks, Victoria Saporta and Alan Taylor for comments. Thanks to Vijay Balle and Clare Rogowski for excellent research assistance and to Moritz Schularick and Alan Taylor for making their data available to us.
1. Introduction
Credit lies at the heart of crises. Credit booms sow the seeds of subsequent credit crunches. This is a key lesson of past financial crashes, manias and panics (Minsky (1986), Kindleberger (1978), Rogoff and Reinhart (2009)). It was a lesson painfully re-taught to policymakers during the most recent financial crisis.
This time’s credit cycle has been particularly severe and synchronous. In 2006, private sector credit across the UK, US and euro area rose by around 10%. During 2009, private credit in these countries fell by around 2%.1 The knock-on consequences for real growth were equally severe and synchronous. Peak to trough, G7 real output fell by 3.6% during the Great Recession.
In response, there have been widespread calls for remedial policy action. These proposals come in various stripes. Some have proposed a more active role for monetary policy in addressing financial imbalances (Taylor (2010), White (2009)). Others have suggested using new macro-prudential tools to rein in credit excesses (Borio and Lowe (2002), Bank of England (2009), Kashyap et al (2010)). Others still have proposed a radical root-and-branch reform of the structure of banking (Kay (2009), Kotlikoff (2010)).
Evaluating the merits of these proposals requires a conceptual understanding of the causes of the credit cycle and an empirical quantification of its dynamic behaviour. What is the underlying friction generating credit booms and busts? Are credit cycles distinct from cycles in the real economy? And how have they evolved, both over time and across countries? Answers to these questions should help frame public policy choices for curbing the credit cycle.
To fix ideas, Section 2 sketches a model of the credit cycle. In this model, a lack of information provides incentives for banks to expand their balance sheets to boost profits and signal their ability to investors. This gives rise to a coordination failure, as banks collectively risk-up. That, in turn, generates a systematic credit boom and subsequent bust when risk is realised.
Sections 3 and 4 present some empirical evidence on the credit cycle. Across countries and across a sweep of history, credit cycles are both clearly identifiable and regular. Typically, they presage banking crises. In their frequency and amplitude, credit cycles are distinct from the business cycle.
There is also evidence of them arising from coordination failures, which generate spillover effects across banks and countries.
1 See IMF (2010).
BIS Review 168/2010 1

Drawing on this evidence, Section 5 identifies some implications for the design of public policy. It suggests that neither monetary nor micro-prudential policy may be well-equipped to tackle the credit cycle. Instead, some new policy apparatus may be needed which (unlike monetary policy) targets bank balance sheets directly but which (unlike micro-prudential policy) does so systematically. This is one key dimension of so-called macro-prudential policy.2
Various international macro-prudential policy committees are, or are about to be, put in place – in the US the Financial Stability Oversight Committee, in the euro-area the European Systemic Risk Board and in the UK the Financial Policy Committee. These provide one element of a macroprudential policy framework. Other elements remain to be put in place. Knowledge of the sources and dynamics of the credit cycle will be important in assembling those missing pieces. This paper is intended to be a contribution towards that goal.
2. A model of the credit cycle
We begin by sketching a model which captures some key features of past and in particular the present, credit cycle. There are a number of existing models of the credit, or leverage, cycle. In all of these models, cyclicality in financial variables is aggravated by various micro-economic frictions. These frictions typically then amplify fluctuations in the real economy. Broadly, these models can be classified according to the underlying micro-economic friction.
For example, a well-established body of literature has looked at the effects of asymmetric information between borrowers and lenders in placing limits on credit (Bernanke, Gertler and Gilchrist (1996), Holstrom and Tirole (1997)). These constraints can be loosened by the borrower pledging collateral to the lender, in effect as a substitute for information (Kiyotaki and Moore (1997)). This solves one problem, but at the potential expense of another: movements in the prices of collateral then have the potential to aggravate cycles in leverage and credit (Geanakoplos (2010)). These cycles can in turn act as a “financial accelerator” for the business cycle. These are typically models of a representative bank and credit-constrained investor.
A second potential source of credit market friction arises from coordination failures among lenders (Gorton and He (2008)). In these models, banks are heterogeneous and their behaviour strategic. The individually rational actions of heterogeneous lenders can generate collectively sub-optimal credit provision in both the upswing (a credit boom) and the downswing (a credit crunch), perhaps through herding (Acharya (2009), Acharya and Yorulmazer (2008)). This is the result of a collective action, or co-ordination, problem among banks.
In credit markets, these co-ordination failures are far from new. Keynes memorably noted:
“A sound banker, alas, is not one who foresees danger and avoids it, but one who, when he is ruined, is ruined in a conventional and orthodox way with his fellows, so that no one can really blame him” (Keynes (1931)).
Eighty years later, Chuck Prince, then-CEO of Citibank, captured the collective action problem thus:
“As long as the music is playing, you’ve got to get up and dance. We’re still dancing” (Prince (2006)).
As Prince’s quote attests, these incentives were a key driver of risk-taking behaviour in the run-up to the crisis. In the face of stiffening competition, banks were increasingly required to
2 There are other potential non-cyclical instruments of macro-prudential policy, including instruments to tackle
systemically important financial institutions (SIFIs).
2 BIS Review 168/2010

keep pace with the returns on equity offered by their rivals – a case not so much of “keeping up with the Joneses” as “keeping up with the Goldmans”. To achieve these higher returns, it was individually rational for banks to increase their risk profiles. They did so in various ways including through higher leverage, marked to market gains on trading books and writing contracts with deep out-of-the-money option payoffs (Alessandri and Haldane (2009)).
These strategies had the desired effect. They generated high and synchronous reported returns (Chart 1). But they did so at the expense of higher risk in aggregate – a case of a competitive coordination failure. Reported returns were, in this sense, risk illusory. As those risk illusions were shattered, all of the pre-crisis gains in banks’ reported returns were lost. Our model captures the spirit of these dynamics, with short-run risk-taking to preserve reputation and boost returns (a credit boom) in time giving way to longer-term collective costs when the music ceases (a credit crunch).
Chart 1
Price to book ratios for UK, US and European institutions(a)
Sources: Bloomberg, Thomson Datastream and Bank calculations
(a) Chart shows the ratio of share price to book value per share. Simple averages of the ratio in each peer group are used. The chart plots the three month rolling average.
(b) Excludes Nationwide and Britannia from Major UK Banks peer group.
2.1 The set up
We develop a simple framework, in the spirit of Rajan (1994), to capture these collective action failures. Rajan’s (op.cit.) model generates multiple equilibria. We use a version of the Morris and Shin (2003) “global games” framework to pin down a unique equilibrium for the coordination game among banks, which then allows an evaluation of policy options.3
3 For other applications of the “global games” framework to banking, see inter alia, Rochet and Vives (2004)
and Goldstein and Pauzner (2005). Broadly speaking, these models use the framework to pin down uniqueness in the coordination game played by the depositors of fragile banks, a la Diamond and
BIS Review 168/2010 3

The set up is as follows. Each period there is a continuum of agents, indexed by , all of whom work as financial intermediaries for a single period. In other words, bankers have, by assumption, short horizons. They aim to maximise their reputation in the market at the end of this period.4 At the beginning of each period, each bank originates a risky asset, the return on which depends on (i) the banker’s ability, which can be high or low, and (ii) the macro state, which can be good or bad. Both are unobservable to the market.
The macro state is good with probability . High bank ability and a good macro state increase the probability of positive asset returns. That is, when the macro state is bad, assets turn out to be bad, irrespective of bankers’ ability. But when the macro state is good, both high and low ability bankers achieve high returns with some probability, with high ability types always achieving high returns and low ability types achieving high returns with probability
.
Asset returns are realised in the middle of each period and are observed only by banks. If the asset is good, banks make a profit (normalised to be a negligible amount). If the asset is bad, banks face a loss of –1. Because of their short horizons, bankers care about both the present value of their asset returns and their reputation in the market, where is the probability assigned by the market to a banker being high ability.
The market is unable to observe banks’ actions directly, so instead infers bankers’ ability from observed bank earnings. Banks’ earnings are affected by their choices when returns are low. If an asset turns out to be bad, banks can hide negative earnings in the short run by engaging in risky policies to boost returns – in effect, engaging in risk illusion. When a bank engages in a risky policy, an immediate loss is avoided with probability . But risky policies always involve longer term expected losses of .
If instead of setting risky policies banks choose immediately to liquidate assets, they set a tight policy, realising a loss of –1 for sure. So banks’ choices when faced with low asset returns determine their risk profiles. If returns are low, under a risky policy banks can increase short term earnings with some positive probability, but must incur a long term loss; while under a tight policy, banks can accept low short term earnings for sure now, avoiding losses in the future.
Suppose banks attach weight to their reputation in the market and to the net present value of future profits. When the asset is good, banks earn a return normalised to zero. When the asset is bad, two strategies are possible. If a bank chooses a risky (superscript ) policy, it obtains
where a proportion l of all banks also set a risky policy. The bank makes a loss of 1 with
probability , incurring long term cost while enjoying reputation 5, 6
Dybvig (1983). For a survey of coordination games in macroeconomics, see Cooper (1999) and Morris and Shin (2000).
4 Individuals might receive intrinsic utility from being thought of as high ability, or it might matter materially if future job prospects (including wages) depend on current reputation (see Scharfstein and Stein (1990)). The threat of corporate takeovers might also generate shortened managerial horizons, or agents might engage in hyperbolic discounting, which generates a short-term bias.
5 We assume no discounting, as in Rajan (1994). The qualitative results would not change were we to consider it.
6 is the probability assigned by the market of the bank being high ability, conditional on the bank setting a risky policy (unobserved by the market), the asset being bad, the macro state being and proportion other banks also setting risky policies.
4 BIS Review 168/2010

When the loan is bad, setting a tight (superscript ) policy yields
as the probability of a loss is unity under a tight policy and the bank obtains reputation
.7
The evolution of reputation is key for determining behavioural dynamics in the model. The marginal effect on reputation of banks adopting risky rather than tight policies is given by
We posit improvements in the macro state increase the incentive banks face to liberalise their risk management policies. When the macro state is good, any negative earnings are more likely to be attributed to low ability. This is the “Prince constraint”. A concern for reputation incentivises banks to seek risky ventures (to keep dancing), the more so the better is the market’s prior on the macro state (the louder the music).
We also posit as a larger proportion of banks set risky credit policies, the larger the incentive to pursue similarly risky policies. When others are posting positive earnings, the reputational loss from foreclosing and taking losses is that much greater. This is the “Keynes constraint”. It is better for your reputation to fail conventionally than to succeed unconventionally.
These conditions generate the potential for credit booms and busts. The better is the macro state, the greater banks’ incentive to pursue risky projects to preserve reputation, as the market attributes low earnings to low ability. But one bank’s announcement of positive earnings encourages others to announce positive earnings by setting risky policies too. In Rajan’s model this strategic complementarity between banks generates multiple equilibria: in sufficiently good states, banks coordinate on risky policies (“credit booms”), while in bad states they coordinate on tight policies (“credit crunches”). In between, either equilibrium is possible.
Define the payoff function . Substituting gives:
This captures the marginal return to adopting a risky policy. It allows us to define the regions of fundamentals over which risky policies and tight policies dominate respectively. A risky policy dominates a tight policy, even when no other banks set risky policies ( ), when
where
A tight policy dominates a risky policy, even when other banks set risky policies ( ),
when where
In the intermediate range , there are multiple equilibria, with risky (tight) credit policies optimal when others adopt risky (tight) policies too.
7 is defined analogously to , but is conditioned on tight rather than risky policies.
BIS Review 168/2010 5

2.2 The model in a “global game”
Next, we apply the technology of Morris and Shin (2003) to define a unique equilibrium from this game. Assume that banks observe fundamentals with some small amount of noise, with bank receiving signal
where the noise terms are distributed in the population with continuous density with support on the real line. Our model satisfies the conditions set out in Morris and Shin (2003)
for there to exist a unique equilibrium in this game. In particular, each bank’s strategy
conditional on its signal satisfies when in receipt of a low signal falling short
of some critical level , and adopting strategy when in receipt of a high signal exceeding some critical level . The condition determining this threshold is (see Appendix)
(1)
Condition (1) allows us to perform comparative statics on the unique coordination equilibrium. Using (1) it follows that the threshold level of fundamentals above which banks set risky policies is (a) increasing in the long-term cost of extending bad credit , and (b) decreasing in relative reputational concerns , or
Both results accord with intuition. First, increasing the cost to banks of pursuing risky strategies causes banks to coordinate on risky policies only at very high levels of fundamentals. Or, put differently, safety prevails over a larger range of fundamentals when risky policies are costly. Prudential policies (discussed further in Section 5) are one means of raising the cost to banks of pursuing such risky strategies.
These prudential policies would have both direct effects and strategic effects in the model. A rise in long term costs raises the direct cost to bank of adopting a risky strategy. But it also leads bank to expect fewer other banks to adopt risky policies. So a rise in has both a direct effect on banks’ actions and an effect through banks’ expectations of others’ actions.8 This expectational channel is crucial from a policy perspective.
Second, reputational concerns act in the opposite direction. As greater weight is placed on shortterm reputation, incentives are sharpened to signal high ability by pursuing risky policies, even when their signalling effect is relatively small ( is low). As in Rajan (1994), a tight credit policy becomes optimal for all levels of fundamentals as , or as reputational concerns vanish. Conversely, if increased competition and deregulation increase reputational concerns, this increases the propensity of the system to periodic credit booms and subsequent busts.
2.3 Dynamics
This model can generate credit cycles which amplify cycles in the real economy relative to a world without credit cycle frictions.9 Without frictions, bad loans are liquidated immediately, allowing new assets to be originated next period to unencumbered borrowers. By contrast,
8 These expectation effects are necessarily intra-temporal in our model. The actual operation of macro-
prudential policy may well have effects through inter-temporal expectations as well. See Section 5 below. 9 The property that global games generate endogenous cycles in dynamic settings has been analysed in, inter
alia, Steiner (2006) and Giannitsarou and Toxvaerd (2007).
6 BIS Review 168/2010

extending credit to bad risks eventually results in balance sheet impairment for both borrowers and lenders.
We perform a simple simulation to illustrate these dynamics. Suppose the macro state moves stochastically around its trend as a result of a sequence of iid productivity shocks. The macro state is mean-reverting as long as banks set tight policies when they realise low
asset returns. This occurs when reputational effects are switched off .
Next suppose reputational concerns are introduced, leading banks to risk up to signal high ability. Because of strategic complementarities, banks do this whenever . This leads to subsequent impairment of the borrowing sector. These dynamics are captured in the simple specification
where indexes time, are iid normal shocks and is the indicator
function taking value 1 when and value otherwise. As reputational concerns disappear, the term goes to zero, leaving simple autoregressive dynamics. But with reputational externalities, productivity shocks become amplified by the credit cycle: a high realisation of in period could push the macro state above the risky policy threshold, at which point the dynamics of begin also to shape the real economy.
The distribution of is assumed to have a higher mean and variance than to simulate the effects of the credit boom. In particular, we constrain the distribution of relative to such that expected risk-adjusted fundamentals are constant over time.10 So we have, in effect, a regime-switching model. When banks play safe strategies, fundamentals are relatively stable. When banks risk up, they create a temporary improvement in expected fundamentals at the cost of greater volatility.
This dynamic specification has some interesting properties. First, even small shocks can have disproportionately large effects on fundamentals depending on the initial conditions. In particular, if fundamentals happen to be close to the switching threshold, a further positive shock will lead all firms to coordinate on the high risk-taking strategy. That drives up both the expected value of fundamentals and its volatility. This generates a form of path dependence. Second, credit cycles are endogenous in this framework. As firms coordinate on high risk strategies, this drives up the expected value of fundamentals. But it also drives up volatility due to risk illusion. Because riskadjusted returns are constant, this must entail an increase in the probability of there being a severe negative shock, so the probability of a crash rises.
Chart 2 shows a simulation of the model when for 100 periods with normally distributed shocks. The frictionless benchmark model generates the path shown by the maroon line. As specified, the path is mean reverting, with movements in the macro state around trend. Allowing for reputational effects generates the blue path, giving a threshold level of fundamentals shown by the green dashed line. As the macro state hits the threshold, banks adopt risky policies to signal high ability. In this simulation this happens four times, in periods 3, 50, 68 and 72.
Consider the threshold breach in period 72. As during the Great Moderation, the good macro state at first persists. The credit boom fuels high fundamentals. But while headline fundamentals have improved, risk-adjusted fundamentals have not. Eventually, this results in a crunch in credit and a sharp deterioration in the macro state, as risk is realised.
10 In particular, the Sharpe ratio (the expected value of fundamentals relative to their standard deviation) is
constant across both regimes.
BIS Review 168/2010 7

Now suppose that financial liberalisation generates heightened competition between banks, increasing the market premium on reputation. This raises the value of in the model. Chart 3 shows the effects of the reputational weight being raised . The threshold for risky policies falls. Relative to the baseline, there is an additional large and persistent boom in the middle of the simulation, followed by a period of below counterfactual fundamentals. The path of the economy is more volatile, with deviations from trend larger and more persistent. In other words, the credit cycle has real and adverse consequences.
Chart 2
Model simulation with low reputational weight
Source: Bank calculations.
Chart 3
Model simulation with high reputational weight
Source: Bank calculations.
8 BIS Review 168/2010

2.4 Empirical implications
Several empirical implications follow from the model. First, strategic complementarities incentivise banks to adopt risky strategies in a coordinated fashion during the boom. So the dynamics of the model predict that we should observe cycles in financial activity at a macroeconomic level. Initial productivity improvements are amplified into lending booms, which are followed by credit busts and, potentially, crises. Second, at a micro-economic level, the coordination of risky strategies during the boom should compress the dispersion of bank earnings, as low ability banks masquerade as high ability banks during good times. But during the bust, when the macro state turns bad, the dispersion of banks’ earnings should increase as low ability types crystallise losses while high ability types do not. We turn next to the macro and micro evidence.
3. Credit cycle dynamics
To what extent are the macroeconomic credit cycle dynamics predicted by the model present in the real world? To assess that, we draw on a dataset recently developed by Schularick and Taylor (2009). This covers a lengthy time-series (often more than a century of data) across 12 developed countries.11 It enables us to identify lower (than business cycle) frequency movements in credit, just as Comin and Gertler (2006) do for post World War II US GDP.12 We concentrate on results for the UK and US, though broadly similar patterns are evident for the other ten countries.
Table 1 presents some summary statistics (mean and standard deviation) of real GDP growth, real loan growth and real bank asset growth in the UK and the US since 1880.13 The sample is split into four periods: 1880–1913; 1914–1945; 1945–79; and 1980–2008. Charts 4 and 5, meanwhile, plot loan or asset to GDP ratios for the UK and US over the sample. Several features are clear:
Average real GDP growth is little changed either side of the wars (Table 1). But real credit has grown around twice as quickly since 1945. In consequence, loan/GDP ratios trend upwards from around 1945, consistent with financial liberalisation and deepening (Charts 4 and 5).
The same general pattern is evident in the volatilities of output and credit. The variability of real GDP growth has, if anything, fallen in the period since 1945. The standard deviation of real credit growth rose in the years immediately following 1945 and has remained above those levels, especially since 1980.
Since 1945, the standard deviation of real credit growth has been around five times that of real activity.
On the face of it, these summary statistics are consistent with credit dynamics being distinct from GDP dynamics. It is possible to formalise this intuition by using filtering techniques to
11 The countries covered are: Australia, Canada, Germany, Denmark, Spain, France, United Kingdom, Italy,
Netherlands, Norway, Sweden and the United States. 12 They argue that medium term cycles in GDP reflect persistent responses of real activity to the high-frequency
fluctuations normally associated with the “business cycle” (Comin and Gertler, op. cit.). In this sense, there is a direct analogy with our model, in which strategic complementarities in risk taking can generate persistent credit cycles in response to high-frequency fluctuations in fundamentals.
13 The bank loans series consists of total domestic currency loans of banks and banking institutions to companies and households, while the assets series consists of total domestic currency assets of banks and banking institutions. For a full description of the data and its sources, see Schularick and Taylor (2009), Appendix B.
BIS Review 168/2010 9

extract the cycle in credit. To do so, we apply a band-pass filter to the data.14 This isolates the cyclical component of a series operating in a frequency range specified by the user.15
Charts 6–7 show cyclical fluctuations in real loan growth in the UK and US. The specified frequency domain is 8–20 years. Shorter-term, business cycle fluctuations, say between 2–8 years, were typically not found to account for much of the overall cyclical variation in credit. In other words, credit growth exhibits a clear cyclical pattern with a medium-term orientation. The credit cycle appears to be a well-defined empirical regularity. It also appears to have been operating for well over a century. And its frequency suggests factors other than the business cycle may be responsible for driving it – including, for example, financial liberalisation and competition.
Table 1
Summary statistics of real GDP growth, real loan growth and real bank asset growth in the UK and the US
Sources: Shularick and Taylor (2009) and Bank calculations.
14 We also experimented with the Hodrick-Prescott filter. Although the choice of an appropriate smoothing
parameter is not straightforward a priori, this approach produced broadly similar results to the band-pass filter. See e.g. Harvey and Jaeger (1993) and Canova (1998) for discussions.
15 In what follows, we use Christiano and Fitzgerald’s (2003) optimal finite sample approximation to the band pass filter. An alternative to Christiano and Fitzgerald’s procedure is provided by Baxter and King (1999). Christiano and Fitzgerald provide evidence to suggest that their optimal finite sample approximation is preferable to Baxter and King’s when extracting cycles at lower frequencies.) Suppose the time series in question is a stationary stochastic process with expectation . Its auto-covariance is
. The properties of the time series can be captured in the frequency domain by taking a Fourier transform of the auto-covariances yielding the power spectrum
where is the frequency (in radians) in the range . Since the power spectrum is a function of the auto-covariances (including the variance , it can be viewed as a decomposition of the variance of the time-series in terms of frequency. When the power spectrum is normalised by the variance
, the resulting standardised function is known as the spectral density. The filter then isolates ‘bands’ in the frequency domain of the spectral density and returns the resulting series.
10 BIS Review 168/2010

Chart 4
Ratio of loans to GDP and assets to GDP (UK)
Sources: Shularick and Taylor (2009) and Bank calculations.
Chart 5
Ratio of loans to GDP and assets to GDP (US)
Sources: Shularick and Taylor (2009) and Bank calculations.
The credit cycle is distinct from the business cycle in amplitude as well as frequency. To show this, Charts 6–7 plot the medium-term cycles in real GDP for the UK and US alongside the credit cycle. The amplitude of the credit cycle is twice that of fluctuations in GDP over the medium term. It is roughly five times that of fluctuations in GDP at conventional business cycle frequencies. The peak-to-trough variation in the typical credit cycle has been around 20 percentage points in the UK. For real GDP, it is around 10 percentage points. As a result,
BIS Review 168/2010 11
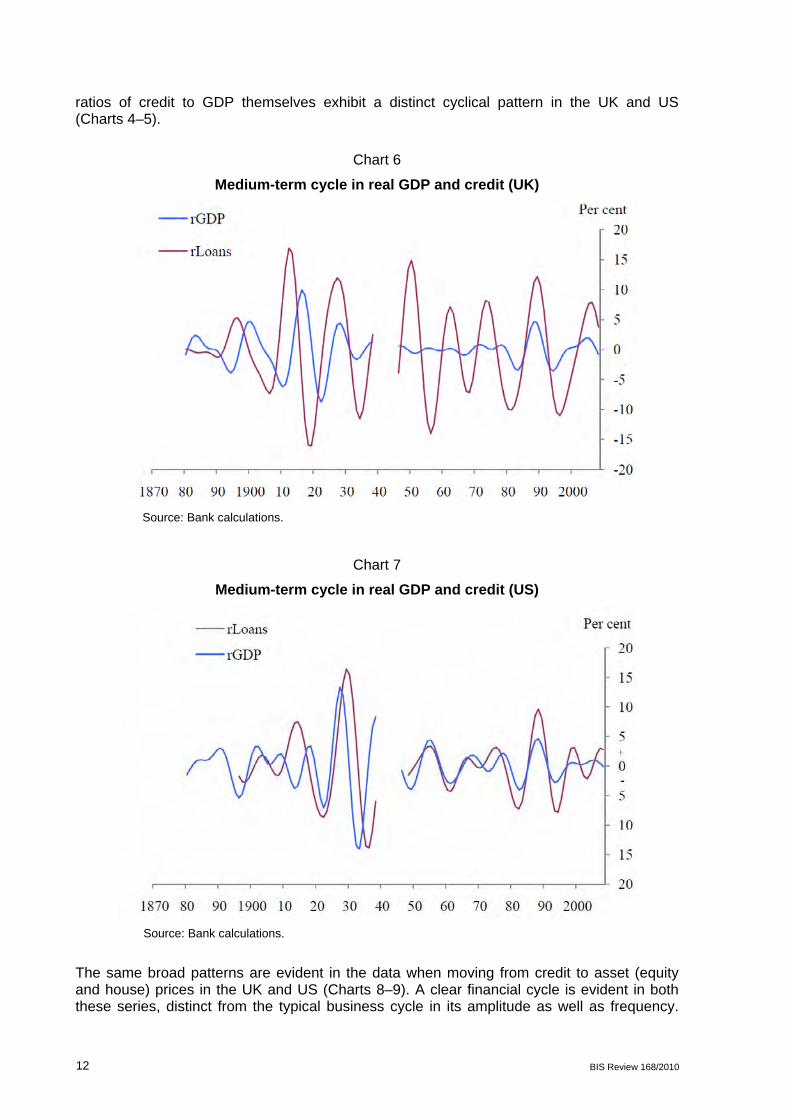
ratios of credit to GDP themselves exhibit a distinct cyclical pattern in the UK and US (Charts 4–5).
Chart 6
Medium-term cycle in real GDP and credit (UK)
Source: Bank calculations.
Chart 7
Medium-term cycle in real GDP and credit (US)
Source: Bank calculations.
The same broad patterns are evident in the data when moving from credit to asset (equity and house) prices in the UK and US (Charts 8–9). A clear financial cycle is evident in both these series, distinct from the typical business cycle in its amplitude as well as frequency.
12 BIS Review 168/2010

The peak to trough variation in asset prices is, if anything, greater than for credit: around 40 percentage points for equities and around 15 percentage points for house prices over medium-term horizons in the UK.
Charts 10 and 11 demonstrate those differences, plotting medium-term frequency cycles in GDP and asset prices in the UK and US since 1945.
Chart 8
Medium-term cyclical fluctuation in UK real equity and house prices
Source: Bank calculations.
Chart 9
Medium-term cyclical fluctuation in US real equity and house prices
Source: Bank calculations.
BIS Review 168/2010 13
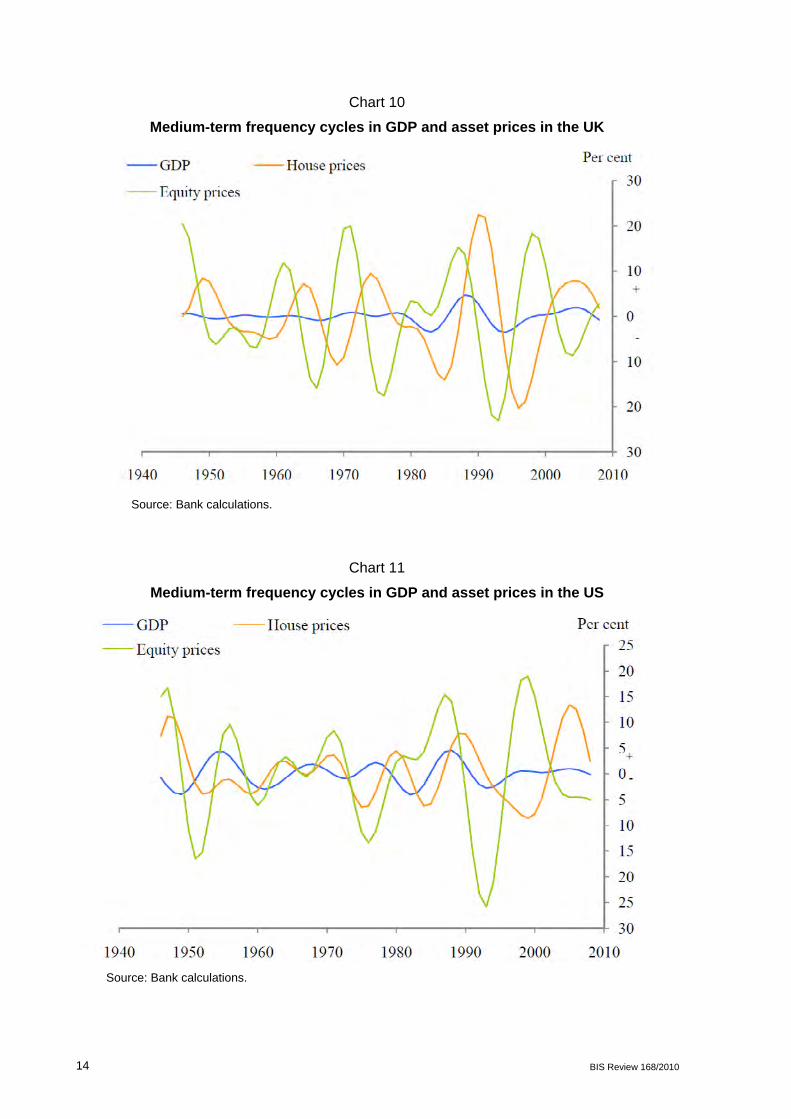
Chart 10
Medium-term frequency cycles in GDP and asset prices in the UK
Source: Bank calculations.
Chart 11
Medium-term frequency cycles in GDP and asset prices in the US
Source: Bank calculations.
14 BIS Review 168/2010
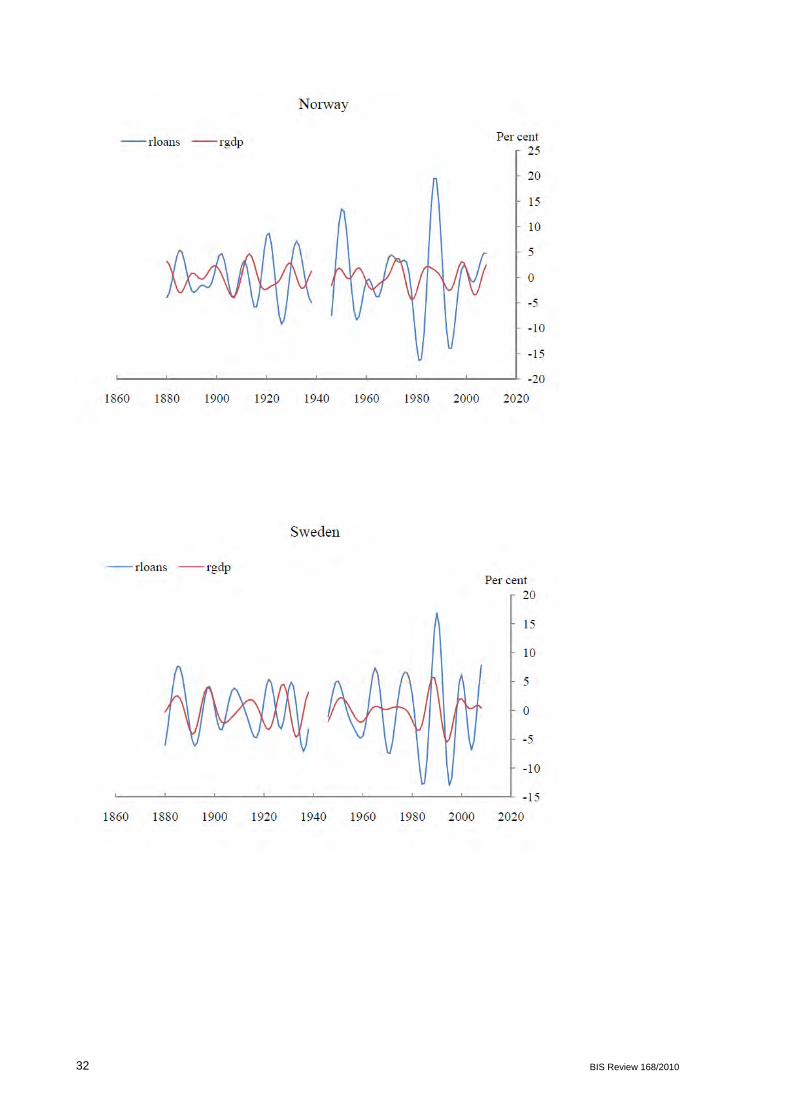
In Annex 2 we show results for the other 10 countries, applying the same techniques to real GDP and real credit. Although the cycles are sometimes not as regular, the same general cyclical patterns in output and credit are present using the wider panel of countries. As Irving Fisher noted almost eighty years ago:
“The old and apparently still persistent notion of “the” business cycle, as a single, simple, self-generating cycle,…is a myth. Instead of one cycle, there are many co-existing cycles, constantly aggravating or neutralising each other, as well as co-existing with many non-cyclical forces” (Fisher (1933)).
Historically, the credit cycle appears to have been just such a phenomenon.
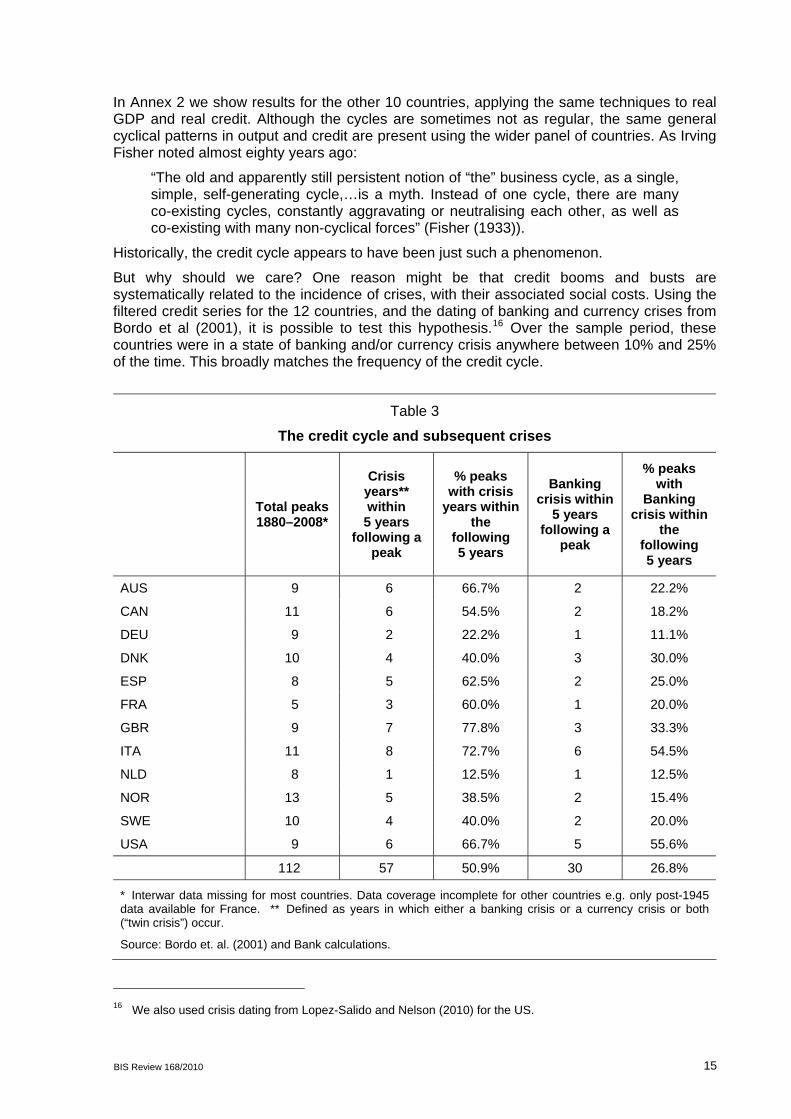
But why should we care? One reason might be that credit booms and busts are systematically related to the incidence of crises, with their associated social costs. Using the filtered credit series for the 12 countries, and the dating of banking and currency crises from Bordo et al (2001), it is possible to test this hypothesis.16 Over the sample period, these countries were in a state of banking and/or currency crisis anywhere between 10% and 25% of the time. This broadly matches the frequency of the credit cycle.
Table 3
The credit cycle and subsequent crises
Total peaks 1880–2008*
Crisis years** within 5 years
following a peak
% peaks with crisis
years within the
following 5 years
Banking crisis within
5 years following a
peak
% peaks with
Banking crisis within
the following 5 years
AUS 9 6 66.7% 2 22.2%
CAN 11 6 54.5% 2 18.2%
DEU 9 2 22.2% 1 11.1%
DNK 10 4 40.0% 3 30.0%
ESP 8 5 62.5% 2 25.0%
FRA 5 3 60.0% 1 20.0%
GBR 9 7 77.8% 3 33.3%
ITA 11 8 72.7% 6 54.5%
NLD 8 1 12.5% 1 12.5%
NOR 13 5 38.5% 2 15.4%
SWE 10 4 40.0% 2 20.0%
USA 9 6 66.7% 5 55.6%
112 57 50.9% 30 26.8%
* Interwar data missing for most countries. Data coverage incomplete for other countries e.g. only post-1945 data available for France. ** Defined as years in which either a banking crisis or a currency crisis or both (“twin crisis”) occur.
Source: Bordo et. al. (2001) and Bank calculations.
16 We also used crisis dating from Lopez-Salido and Nelson (2010) for the US.
BIS Review 168/2010 15
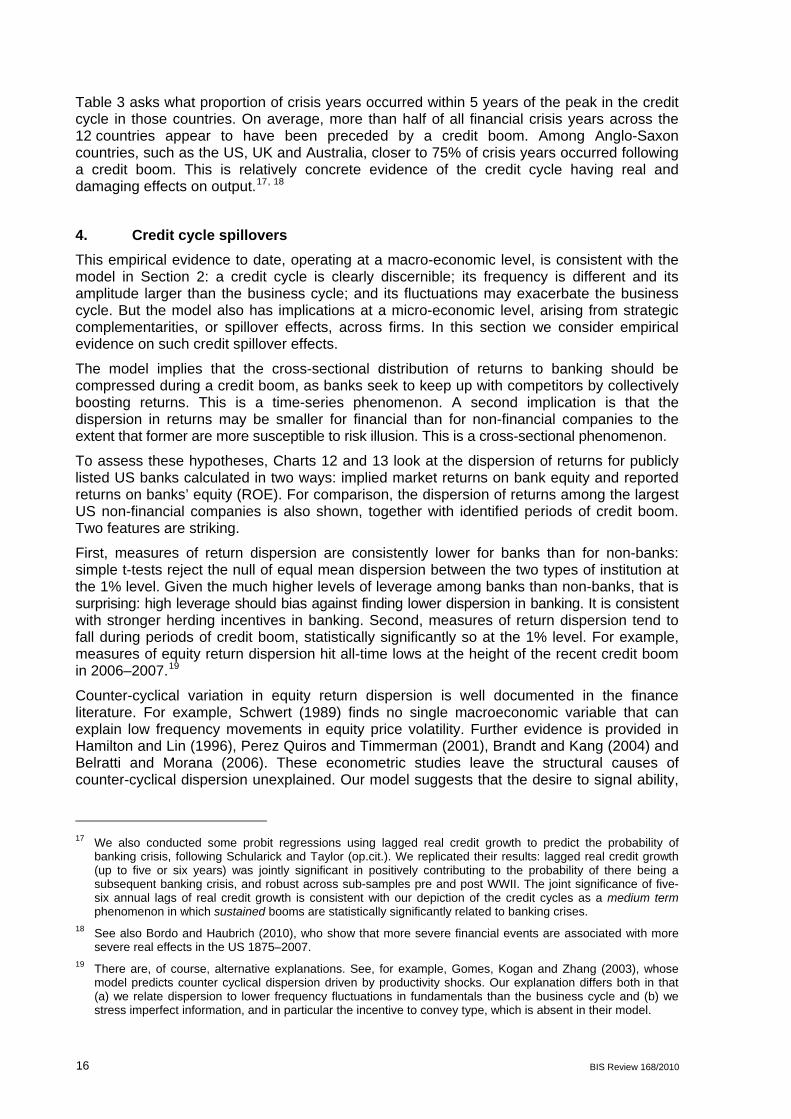
Table 3 asks what proportion of crisis years occurred within 5 years of the peak in the credit cycle in those countries. On average, more than half of all financial crisis years across the 12 countries appear to have been preceded by a credit boom. Among Anglo-Saxon countries, such as the US, UK and Australia, closer to 75% of crisis years occurred following a credit boom. This is relatively concrete evidence of the credit cycle having real and damaging effects on output.17, 18
4. Credit cycle spillovers
This empirical evidence to date, operating at a macro-economic level, is consistent with the model in Section 2: a credit cycle is clearly discernible; its frequency is different and its amplitude larger than the business cycle; and its fluctuations may exacerbate the business cycle. But the model also has implications at a micro-economic level, arising from strategic complementarities, or spillover effects, across firms. In this section we consider empirical evidence on such credit spillover effects.
The model implies that the cross-sectional distribution of returns to banking should be compressed during a credit boom, as banks seek to keep up with competitors by collectively boosting returns. This is a time-series phenomenon. A second implication is that the dispersion in returns may be smaller for financial than for non-financial companies to the extent that former are more susceptible to risk illusion. This is a cross-sectional phenomenon.
To assess these hypotheses, Charts 12 and 13 look at the dispersion of returns for publicly listed US banks calculated in two ways: implied market returns on bank equity and reported returns on banks’ equity (ROE). For comparison, the dispersion of returns among the largest US non-financial companies is also shown, together with identified periods of credit boom. Two features are striking.
First, measures of return dispersion are consistently lower for banks than for non-banks: simple t-tests reject the null of equal mean dispersion between the two types of institution at the 1% level. Given the much higher levels of leverage among banks than non-banks, that is surprising: high leverage should bias against finding lower dispersion in banking. It is consistent with stronger herding incentives in banking. Second, measures of return dispersion tend to fall during periods of credit boom, statistically significantly so at the 1% level. For example, measures of equity return dispersion hit all-time lows at the height of the recent credit boom in 2006–2007.19
Counter-cyclical variation in equity return dispersion is well documented in the finance literature. For example, Schwert (1989) finds no single macroeconomic variable that can explain low frequency movements in equity price volatility. Further evidence is provided in Hamilton and Lin (1996), Perez Quiros and Timmerman (2001), Brandt and Kang (2004) and Belratti and Morana (2006). These econometric studies leave the structural causes of counter-cyclical dispersion unexplained. Our model suggests that the desire to signal ability,
17 We also conducted some probit regressions using lagged real credit growth to predict the probability of
banking crisis, following Schularick and Taylor (op.cit.). We replicated their results: lagged real credit growth (up to five or six years) was jointly significant in positively contributing to the probability of there being a subsequent banking crisis, and robust across sub-samples pre and post WWII. The joint significance of five-six annual lags of real credit growth is consistent with our depiction of the credit cycles as a medium term phenomenon in which sustained booms are statistically significantly related to banking crises.
18 See also Bordo and Haubrich (2010), who show that more severe financial events are associated with more severe real effects in the US 1875–2007.
19 There are, of course, alternative explanations. See, for example, Gomes, Kogan and Zhang (2003), whose model predicts counter cyclical dispersion driven by productivity shocks. Our explanation differs both in that (a) we relate dispersion to lower frequency fluctuations in fundamentals than the business cycle and (b) we stress imperfect information, and in particular the incentive to convey type, which is absent in their model.
16 BIS Review 168/2010

rooted in imperfect information and short horizons, may be a cause of counter-cyclical dispersion in banking returns.20
Charts 14 and 15 look at the same metrics for UK banks. We have also examined return patterns among the largest global banking and non-financial firms.21 The results are much the same. On average, the dispersion in banking returns is statistically significantly lower than for non-banks, at the 1% level, both for UK and global institutions. And, in general, we observe a compression of returns during credit booms and a dispersion in busts. There is evidence of an increase in the degree of coordination of global banks’ activities after the financial liberalisation of the 1980s. This suggests credit cycles may have become increasingly synchronous globally.
To test this formally, we construct pair-wise correlations between countries’ credit cycles for two post-war sub-samples, 1945–79 and 1980–2008. We plot the cumulative distributions of these cross-country correlations in Chart 16. The same technique can be applied to correlations between countries’ medium term fluctuations in GDP (Chart 17). In each chart, a shift to the right of the cumulative distribution indicates an increase in the degree of cross-country correlation.
Chart 12
Dispersion of equity returns of US banks and top 100 US PNFCs (by market cap)
(1), (2) and (3) represent medium term credit booms. Outside of these areas represent medium term credit busts.
Source: Thomson Reuters Datastream and Bank calculations.
20 Theoretical explanations have been put forward by, among others, Campbell and Cochrane (1999) and
Mele (2007), who show that habits and cyclically asymmetric risk premia respectively may generate counter cyclical volatility in asset pricing models.
21 This global group of banking institutions included UK and US banks as a subset.
BIS Review 168/2010 17

Chart 13
Dispersion of ROE of US banks and US top 20 PNFCs (by market cap)
Source: Thomson Reuters Datastream and Bank calculations.
Consistent with Bordo and Helbling (2003, 2010), there is evidence of increasing synchronicity in medium term GDP fluctuations across countries since 1980: a Wilcoxon rank-sum test rejects the null that the two samples are drawn from the same distribution at the 1% level and Jenrich’s test rejects the null that the correlation matrices are equal.22, 23 This increased synchronisation can be explained by increasing trade and financial liberalisation (see Bordo and Helbling (op. cit.)).
We observe an analogous pattern for credit cycles, with the correlation between countries’ credit cycles higher on average after 1980. The Wilcoxon test rejects the null of equality at the 5% level and Jenrich’s rejects its null at the 1% level. This is consistent with the notion that global banks’ activities have become increasingly alike, possibly as a result of increased competition and crossborder lending. The increase in the cross-country correlation of the credit cycle suggests policy needs an international dimension if it is to curb effectively the credit cycle, to which we turn next.
22 Wilcoxon’s test pools the correlation matrices from the two sub samples and ranks individual country-pair
observations by magnitude. If one set of observations features systematically higher cross-correlations, the rank of each of the observations will be higher on average in the pooled sample. Using the rankings of each correlation in the pooled sample, a normally distributed test statistic is constructed, under the null that the two samples are drawn from the same distribution.
23 Jennrich’s test for the equality of two correlation matrices derives a chi-squared distributed test statistic from transformations of the correlation matrices, including a term correcting for the bounded support ([-1,1]) of the difference between two correlations. The null is equality of the matrices.
18 BIS Review 168/2010

Chart 14
Dispersion of equity returns of major UK banks and top UK 100 PNFCs (by market cap)
Source: CapitalIQ and Bank calculations.
Chart 15
Dispersion of ROE of top 10 UK banks and top 10 UK PNFCs (by market cap)
Source: CapitalIQ and Bank calculations.
BIS Review 168/2010 19

Chart 16
Cumulative distribution function of cross-country correlations of credit cycles
Source: Bank calculations
Chart 17
Cumulative distribution function of cross-country correlations between medium term GDP cycles
Source: Bank calculations.
20 BIS Review 168/2010
5. Curbing the credit cycle
Taking together the evidence from Sections 2–4, what are the implications for public policy?
First, according to the model a credit cycle arises from a collective action failure among banks. The lending decisions banks take, while individually rational, are collectively sub-optimal. Specifically, individual banks may fail to internalise the reputational externalities their lending actions impose on others. The result is a periodic tidal wave of credit during the boom followed by protracted credit drought during the crunch. Chuck Prince’s disco inferno causes murder on the dance floor.
These credit cycle externalities provide a justification for state intervention to help co-ordinate lending expectations and actions by banks. At least in principle, these externalities suggest a role for the state in enforcing collective lending action, to curb the peaks and troughs in the credit cycle. The case for policy action may have grown over recent decades as competition in banking, and associated externalities, have intensified.
Second, it has been suggested that one means of curbing credit cycle frictions is through monetary policy – either by ensuring it moderates appropriately the business cycle (Taylor (2010)) or, more ambitiously, by having it play a wider role in curtailing financial imbalances (Borio and White (2004)). The evidence presented here is not especially encouraging on that front. The frequency and amplitude of the business and credit cycles is quite different. Monetary policy may be an inefficient tool for calming the credit cycle, if at the same time it is to moderate the business cycle.
Recent history offers a good case study. Between 2000 and 2007, UK nominal GDP growth exhibited no signs of exuberance, with GDP growth at trend and inflation at target. Over the same period, UK banks’ balance sheets trebled. Using monetary policy to tame credit growth over this period would have come at the expense of a destabilisation of non-financial activity. Activist monetary policy would have resulted in instability migrating from the financial to the non-financial sector. In tackling the credit cycle, monetary policy may have, in Irving Fisher’s language, “aggravated rather than neutralised” the business cycle.
Econometric evidence tends to support this view. Model-based simulations by the IMF suggest the need for two instruments to tackle efficiently real as well as financial imbalances (IMF (2009)). And the empirical evidence in Bean et al (2010) suggests that monetary policy may be a rather ineffective instrument quantitatively in constraining credit growth. This suggests that assigning monetary policy the task of tackling financial imbalances may be inefficient, perhaps ineffective.
Charts 18 and 19 plot credit cycles in the UK and US from 1880, together with the different monetary policy regimes which have operated over this period. Strikingly, credit cycles dynamics appear to be largely invariant to the monetary policy regime – fixed or floating, rules or discretion, lax or tight. This, too, is indicative evidence that monetary policy may not be the most effective tool for moderating credit fluctuations.
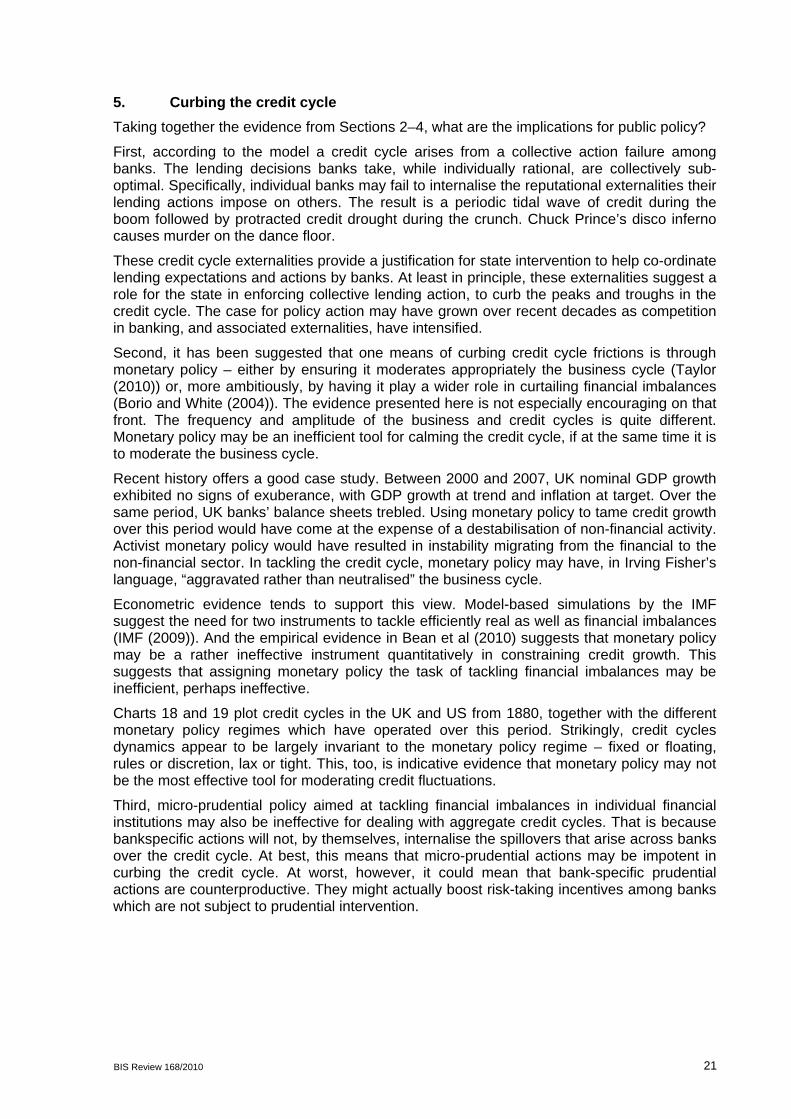
Third, micro-prudential policy aimed at tackling financial imbalances in individual financial institutions may also be ineffective for dealing with aggregate credit cycles. That is because bankspecific actions will not, by themselves, internalise the spillovers that arise across banks over the credit cycle. At best, this means that micro-prudential actions may be impotent in curbing the credit cycle. At worst, however, it could mean that bank-specific prudential actions are counterproductive. They might actually boost risk-taking incentives among banks which are not subject to prudential intervention.
BIS Review 168/2010 21

Chart 18
UK credit cycle across monetary regimes
(1) Gold Standard. (2) Inter-war suspension. (3) Resumption of Gold Standard. (4) Sterling Area. (5) Bank of England nationalised; Bretton Woods. (6) Bretton Woods; Sterling full external convertibility. (7) Monetary Targeting. (8) Exchange Rate Mechanism. (9) Inflation Targeting. (10) Bank of England independence.
Source: Bank calculations.
Chart 19
US credit cycle across monetary regimes
(1) Gold Standard. (2) Inter-war suspension. (3) Resumption of Gold Standard. (4) FDIC established; Federal Reserve reorganisation. (5) Bretton Woods. (6) Treasury-Federal Reserve Accord (1951). (7) End convertibility into gold (“Nixon Shock”) (1971). (8) Volker era. (9) Greenspan era. (10) Bernanke era.
Source: Bank calculations.
22 BIS Review 168/2010

To see that, consider a two-bank variant of the model described by the payoffs in Table 4, in which now references the market’s prior over the macro state, which it updates having
observed a bank’s earnings. When is neither too big nor too small, there are two symmetric Nash equilibrium strategies in this game: {Risky, Risky} and {Tight, Tight}. When Bank 1 sets {Risky}, Bank 2 does not want to set {Tight} and declare negative earnings as this is more likely to signal low ability, provided the long term costs are not too big. On the other hand, if Bank 1 sets {Tight}, Bank 2 sets tight too if long term costs are not too small. This results in a classic coordination game with multiple equilibria.
Table 4
Payoffs in a two-bank game
Bank 2
Risky Tight
Risky
Ban
k 1
Tight
Now suppose the regulator forces Bank 2 to set tight policies whenever it realises low returns. So if Bank 2 announces positive earnings, it must be because the macro state is good. But given this, Bank 1 does not want to signal low ability by playing {Tight} when it makes a bad loan since doing so would be taken by the market to imply low ability. If the spillover from Bank 2’s actions to the market’s assessment of the macro state is strong enough, {Tight, Tight} may no longer be an equilibrium. Instead, Bank 1 may play Risky. The resulting equilibrium is {Risky, Tight}. In this way, bank-specific intervention may have perverse consequences for risk-taking.
Fourth, this co-ordination problem suggests systematic, across-the-system actions are needed to curtail effectively credit booms and busts. This is one dimension of macro-prudential policy. To be effective, these policies need to increase the long-term cost of credit extension to banks during booms and, as importantly, to lower these costs during busts. These actions would help smooth out credit supply over the cycle. There are a variety of macro-prudential tools which could have this effect, including pro-cyclical capital and liquidity requirements, or remuneration packages that tie individual earnings more closely to long term performance (Bank of England (2009), Kashyap et al (2010), G30 (2010)).
Chart 20 illustrates the impact of increasing the long term cost of short term risky strategies, , across the entire system in our simple model. The “low ” and frictionless paths are
identical to Chart 2. But if the regulator raises the cost of risky policies, the signalling threshold rises to the green dashed line. In this example, the increase in this threshold is sufficient to prevent risky policies arising at any point over the horizon. In other words, the “high “ (macro-prudential) path replicates the frictionless equilibrium. The large output swings caused by risky lending cycles are reduced significantly. The financial accelerator is defused.
BIS Review 168/2010 23

Chart 20
Model simulation high long term cost of short term risky strategies
Source: Bank calculations.
Fifth, because credit cycles emerge from a failure to co-ordinate lending decisions, expectations are crucial for the effectiveness of macro-prudential policies. Perhaps even more than in a monetary policy context, macro-prudential policy works by acting on agents’ expectations. For example, raising has a direct effect on lenders’ behaviour, increased incentives to reduce risk. But as importantly, it also has an indirect expectational effect, as all lenders anticipate they will become subject to the same simultaneous squeeze. Anticipating that, lenders will co-ordinate their lending choices today provided policy is credible.
These collective action dynamics underscore the importance of the expectations channel for macroprudential policy. This has important implications for the design of a macro-prudential framework. Without absolute clarity about the objectives of any macro-prudential policy framework and the policy rule necessary to deliver these objectives, expectations will not adjust and policy will be impotent. Any lack of transparency or failure of communications is likely to inhibit seriously the effectiveness of macro-prudential policy.
Sixth, because macro-prudential policy is new in most developed countries, there are understandable concerns that policymakers’ knowledge of the transmission mechanism of policy is incomplete and imperfect. The model of the credit cycle developed here offers some grounds for optimism. Signalling is the key transmission channel. Quantitative estimates of the effects of, for example, higher capital ratios on banks’ cost of credit provision have wide confidence intervals (BIS (2010)). But this may not be fatal if macro-prudential policy by-passes these channels and works by acting, first and foremost, through expectations.
Seventh, the credit cycle is increasingly an international phenomenon, as well as a national one. Credit spillovers occur across borders as well as across banks. This suggests macro-prudential policies need also to have an international dimension if they are to tackle credit externalities. This is recognised in the macro-prudential policy framework currently being discussed by the international regulatory community (BIS (2010)). This framework includes an explicit reciprocity provision. For example, judgements on local credit conditions determine the amounts of capital to be held by international banks on their exposures in
24 BIS Review 168/2010

those countries. This reciprocity feature should help to reduce the arbitrage risks posed by the internationalisation of the credit cycle.
Eighth, a second potential source of regulatory arbitrage is the shadow banking system. Even ahead of the present crisis, this had grown to a scale potentially in excess of the conventional banking system (Adrian et al (2010)). Operating macro-prudential policy on a sub-set of credit providers, ignoring the shadow banks, suffers the same problems as micro-prudential policy operating on a sub-set of banks. It risks not only being ineffective, but also providing incentives for risk to migrate to the unregulated sector. This underlines the importance of policing the regulatory boundary and moving this boundary if credit provision risks crossing the border in the course of setting macroprudential policy.
Ninth, especially at the outset, uncertainties about the role and efficacy of macro-prudential policy will be considerable. Simplicity and humility will be needed. Simplicity to prevent confusion about the objectives and transmission channels for macro-prudential policy, given the importance of signalling. Humility to reduce the chances of banks over-relying on public policy signals about credit provision at a time when these are sure to be noisy (see Morris and Shin (2002)). As with the business cycle and monetary policy, macro-prudential policy cannot be expected to eliminate the credit cycle. This is neither feasible nor desirable. And simple rules, augmented by judgement, offer the best chance of ensuring robust decision-making at the start of a new macro-prudential policy regime (Taylor and Williams (2010)).
Tenth, the state of macro-prudential policy today has many similarities with the state of monetary policy just after the second world war. Data is incomplete, theory patchy, policy experience negligible. Monetary policy then was conducted by trial and error. The same will be true of macroprudential policy now. Mistakes will be made. But as experience with the other arms of macroeconomic policy has taught us, the biggest mistake would be not to try.
BIS Review 168/2010 25

Annex 1: Model proofs
Reputational probabilities: Here we motivate the conditions that . Suppose the market has prior that a banker’s ability is high. If a banker is of low ability, she achieves positive returns on loans with probability when the macro state is good, while high ability bankers achieve positive returns on loans with probability 1 when the macro state is good. When the macro state is bad, all bankers achieve zero returns. Let be the probability that the macro state is good. Let the market conjecture that under a risky policy and a bad state of the world, earnings are positive with probability , while under a risky policy and a good state of the world, earnings are positive with probability . Conditional on risky policies and observing positive earnings, the probability of being of high ability is
which is increasing in .
Similarly, under tight policies,
which is decreasing in . The conditions in the text that capture these effects.
Equilibrium: Our model satisfies following conditions, set out in Morris and Shin (2003), viz.:
Condition 1: Action Monotonicity: is non-decreasing in .
Condition 2: State Monotonicity: is non-decreasing in .
Condition 3: Uniform Limit Dominance: There exist and such
that (1) for all and and (2) there exists such that for all .
Condition 4: Strict Laplacian State Monotonicity: There exists a unique
solving .
Condition 5: Finite Expectations of Signals: is well defined.
Condition 6: Continuity: is continuous with respect to signal and density .
Morris and Shin use these to show
Lemma 1: (Morris and Shin 2003) Let be defined by Condition 4. Then for any there exists such that for all , if strategy s survives iterated
deletion of strictly dominated strategies, then = {Tight} for all and
= {Risky} for all .
Proof: See Morris and Shin (2003), Proposition 2.2.
26 BIS Review 168/2010

i.e. that agents play cut-off strategies, adopting strategy = {Tight} when in receipt of a
“low” signal , and adopting strategy = {Risky} when in receipt of a “high’ signal . Condition 4 gives the threshold.
BIS Review 168/2010 27

Annex 2 International medium-term frequency cycles
in real GDP and credit
28 BIS Review 168/2010

BIS Review 168/2010 29

30 BIS Review 168/2010

BIS Review 168/2010 31
32 BIS Review 168/2010
References
Acharya, V.V. (2009), “A Theory of Systemic Risk and Design of Prudential Bank Regulation”,Journal of Financial Stability, Vol 5, 3, 224–255.
Acharya, V.V., and Yorulmazer, T (2008), “Information Contagion and Bank Herding”, Journal of Money, Credit and Banking, Vol 40, 1, 215–231.
Adrian, T, Ashcraft, A, Boesky, H and Pozsar, Z (2010), “Shadow Banking”, Federal Reserve Bank of New York Staff Reports 458.
Alessandri, P and Haldane, A G (2009), “Banking on the State”, Bank of England.
Angeletos, G, Hellwig, C and Pavan, A (2006), “Signalling in a Global Game: Coordination and Policy Traps”, Journal of Political Economy 114(3).
Bank of England (2009), “The Role of Macroprudential Policy – A Discussion Paper”, available at http://www.bankofengland.co.uk/publications/other/financialstability/roleofmacroprudentialpolicy091121.pdf
Bean, C, Paustian, M, Penalver, A and Taylor, T (2010), “Monetary Policy After the Fall”, available at http://www.bankofengland.co.uk/publications/speeches/2010/speech444.pdf
Belratti and Morana (2006), “Breaks and persistency: macroeconomic causes of stock market volatility”, Journal of Econometrics, 131 pp 151–177.
Bernanke, B, Gertler, M and Gilchrist, S (1996), “The Financial Accelerator and the Flight to Quality”, The Review of Economics and Statistics 78(1), pp 1–15, MIT Press.
BIS (2010), “Countercyclical Capital Buffer Proposal – Consultative Document”, Basel Committee on Banking Supervision, Bank for International Settlements.
Bordo, M, Eichengreen, B, Klingebiel, D and Martinez-Peria, M S (2001), “Is the crisis problem growing more severe?”, Economic Policy 16(1), pp 51–82.
Bordo, M and Haubrich, J (2010), “Credit crises, money and contractions: An historical view”, Journal of Monetary Economics, 1–18.
Bordo, M D and Helbling, T (2003), “Have National Business Cycles Become More Synchronized?”, NBER Working Paper 10130.
Bordo, M D and Helbling, T (2010), “International Business Cycle Synchronization in Historical Perspective”, NBER Working Paper 16103.
Borio and Lowe (2002), “Asset Prices, Financial and Monetary Stability: Exploring the Nexus”, Bank for International Settlements Working Papers 114.
Borio, C and White, W R (2004), “Whither Monetary and Financial Stability? The Implications of Evolving Policy Regimes”, Bank for International Settlements Working Papers 147.
Brandt, M and Kang, Q (2004), “On the relationship between the conditional mean and volatility of stock returns: A latent VAR approach”, Journal of Financial Economics, 217–257.
Campbell, J and Cochrane, J (1999), “By Force of Habit: A Consumption-Based Explanation of Aggregate Stock Market Behaviour”, Journal of Political Economy, 205–251.
Canova, F. (1998), “Detrending and Business Cycle Facts”, Journal of Monetary Economics, 41 475–512.
Comin, D and Gertler, M (2006), “Medium Term Business Cycles”, American Economic Review, Vol. 96 No. 3.
BIS Review 168/2010 33

Cooper, R. W. (1999), Coordination Games: Complementarities and Macroeconomics, Cambridge University Press.
Diamond, D and Dybvig, P (1983), “Bank Runs, Deposit Insurance, and Liquidity”, Journal of Political Economy, 91, 401–419.
Fisher, I (1933), “The Debt-Deflation Theory of Great Depressions”, Econometrica 1, pp 337–357.
Geanakoplos, J (2010), “The Leverage Cycle”, NBER Macroeconomics Annual 2009 Vol. 24, pp 1–65, University of Chicago Press.
Giannitsarou, C and Toxvaerd, F (2007), “Recursive Global Games”, CEPR Discussion Paper 6470.
Goldstein, I and Pauzner, A (2005), “Demand-Deposit Contracts and the Probability of Bank Runs”, Journal of Finance, 60, 1293–1327.
Gomes, J, Kogan, L and Zhang, L (2003), “Equilibrium Cross Section of Returns”, The Journal of Political Economy, Vol. 111, pp. 693–732, University of Chicago Press.
Gorton, G and He, P (2008), “Bank Credit Cycles”, Review of Economic Studies 75(4), pp 1181–1214, Blackwell Publishing.
Group of Thirty (2010), Enhancing Financial Stability and Resilience: Macroprudential Policy,Tools, and Systems for the Future.
Hamilton, J and Lin, G (1996), “Stock Market Volatility and the Business Cycle”, Journal of Applied Econometrics, 573–593.
Harvey, A.C., and Jaeger, A. (1993), “Detrending, Stylized Facts and The Business Cycle”, Journal of Applied Econometrics, Vol. 8, 231–247.
Holmstrom, B and Tirole, J (1997), “Financial Intermediation, Loanable Funds, and the Real Sector”, Quarterly Journal of Economics 112(3), pp 663–91, MIT Press.
IMF (2009), “Lessons for monetary policy from asset price fluctuations”, World Economic Outlook, Chapter 3, October.
IMF (2010), “Meeting New Challenges to Stability and Building a Safer System”, Global Financial Stability Report, International Monetary Fund, April.
Kay, J (2010), Narrow Banking: The Reform of Banking Regulation, Centre for the Study of Financial Innovation.
Kashyap, A K, Stein, J C and Hanson, S (2010), “A Macroprudential Approach to Financial Regulation”, Forthcoming in Journal of Economic Perspectives.
Keynes, J M (1931), “The Consequences to the Banks of the Collapse of Money Values”, Essays in Persuasion, Macmillan Publishers.
Keynes, J M (1936), The General Theory of Employment, Interest and Money, Macmillan Cambridge University Press.
Kindleberger, C.P. (1978), Manias, Panics and Crashes: A History of Financial Crises, Palgrave Macmillan.
King, M (2010), “Banking: From Bagehot to Basel, and back again”, Speech given at the Second Bagehot Lecture Buttonwood Gathering, New York City. Available at: http://www.bankofengland.co.uk/publications/speeches/2010/speech455.pdf
Kiyotaki, N and Moore, J (1997), “Credit Cycles”, Journal of Political Economy 105(2).
Kotlikoff, L J (2010), Jimmy Stewart is Dead: Ending the World’s Ongoing Financial Plague with Limited Purpose Banking, John Wiley and Sons.
34 BIS Review 168/2010

BIS Review 168/2010 35
Lopez-Salido, D. and Nelson, E. (2010), “Postwar Financial Crises and Economic Recoveries in the United States”, mimeo.
Mele, A (2007), “Asymmetric stock market volatility and the cyclical behaviour of expected returns”, Journal of Financial Economics, 446–478.
Minsky, H P (1986), Stabilizing an Unstable Economy, Yale University Press.
Morris, S and Shin, H S (2000), “Rethinking Multiple Equilibria in Macroeconomic Modelling”, NBER Macroeconomics Annual, Vol. 15, 139–161.
Morris, S and Shin, H S (2002), “Social Value of Public Information”, American Economic Review 92(5), pp 1521–1534.
Morris, S, and Shin, H S (2003), “Global Games: Theory and Applications”, Advances in Economics and Econometrics (Proceedings of the Eighth World Congress of the Econometric Society), Cambridge University Press.
Perez-Quiros, G and Timmerman, A (2001), “Business cycle asymmetries in stock returns: Evidence from higher order moments and conditional densities”, Journal of Econometrics, 259–306.
Rajan, R G (1994), “Why Bank Credit Policies Fluctuate: A Theory and Some Evidence”, Quarterly Journal of Economics 109(2), pp 399–441.
Reinhart, C M and Rogoff, K S (2009), This Time is Different: Eight Centuries of Financial Folly, Princeton University Press.
Rochet, J C, and Vives, X (2004), “Coordination Failures and The Lender of Last Resort: Was Bagehot Right After All?”, Journal of the European Economic Association, Vol 2. No. 6.
Scharfstein, D S and Stein, J C (1990), “Herd Behavior and Investment”, American Economic Review, vol. 80(3), pages 465–79, June.
Schularick, M and Taylor, A M (2009), “Credit Booms Gone Bust: Monetary Policy, Levrage Cycles and Financial Crises, 1970–2008”, NBER Working Paper Series 15512.
Schwert, G W (1989), “Why Does Stock Market Volatility Change Over Time?”, The Journal of Finance, 1115–1153.
Steiner, J (2008), “Coordination Cycles”, Games and Economic Behaviour 60, pp 308–327.
Taylor, J (2010), “Commentary: Monetary Policy After the Fall”, Presentation at the Symposium “Macroeconomic Challenges: The Decade Ahead”, Jackson Hole.
White, W R (2009). “Should Monetary Policy ‘Lean or Clean’?”, Federal Reserve Bank of Dallas Globalisation and Monetary Policy Institute Working Paper 34.