The Race to Zero : Speech by Andrew Haldane
26
The views are not necessarily those of the Bank of England or the interim Financial Policy Committee. I would like to thank Nicola Anderson, Evangelos Benos, Oliver Burrows, Priya Kothari, David Lawton, Lavan Mahadeva, David Norcross, Joseph Noss, Rachel Shaw, Belinda Tracey, Anne Wetherilt and Peter Zimmerman for comments and contributions. All speeches are available online at www.bankofengland.co.uk/publications/sp eeches The race to zero Speech given by Andrew G Haldane, Executive Director, Financial Stability and member of the interim Financial Policy Committee International Economic Association Sixteenth World Congress, Beijing, China 8 July 2011
-
Upload
creditplumber -
Category
Documents
-
view
221 -
download
0
Transcript of The Race to Zero : Speech by Andrew Haldane
8/6/2019 The Race to Zero : Speech by Andrew Haldane
http://slidepdf.com/reader/full/the-race-to-zero-speech-by-andrew-haldane 1/25
The views are not necessarily those of the Bank of England or the interim Financial Policy Committee.I would like to thank Nicola Anderson, Evangelos Benos, Oliver Burrows, Priya Kothari, David Lawton,Lavan Mahadeva, David Norcross, Joseph Noss, Rachel Shaw, Belinda Tracey, Anne Wetherilt and
Peter Zimmerman for comments and contributions.
All speeches are available online at www.bankofengland.co.uk/publications/speeches
The race to zero
Speech given by
Andrew G Haldane, Executive Director, Financial Stability and member of the interim
Financial Policy Committee
International Economic Association Sixteenth World Congress, Beijing, China
8 July 2011
8/6/2019 The Race to Zero : Speech by Andrew Haldane
http://slidepdf.com/reader/full/the-race-to-zero-speech-by-andrew-haldane 2/25
All speeches are available online at www.bankofengland.co.uk/publications/speeches
2
2
1. Introduction
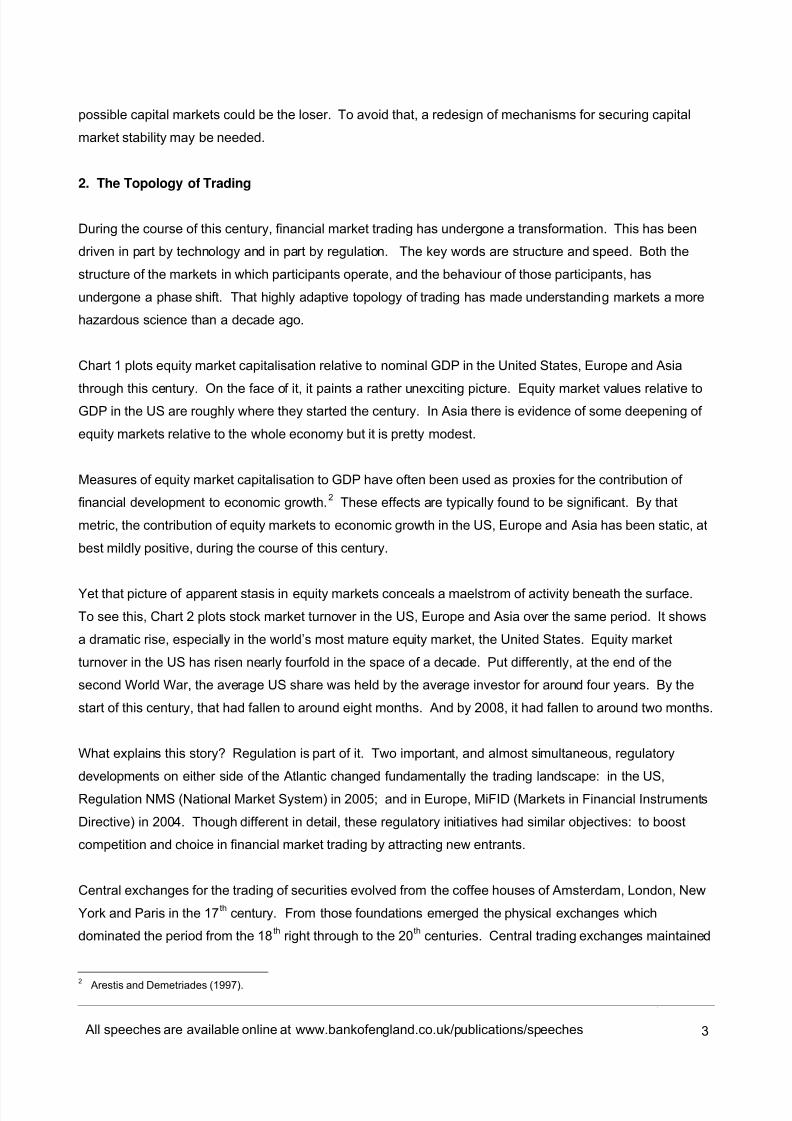
Stock prices can go down as well as up. Never in financial history has this adage been more apt than on
6 May 2010. Then, the so-called “Flash Crash” sent shocks waves through global equity markets. The
Dow Jones experienced its largest ever intraday point fall, losing $1 trillion of market value in the space of
half an hour. History is full of such fat-tailed falls in stocks. Was this just another to add to the list, perhaps
compressed into a smaller time window?
No. This one was different. For a time, equity prices of some of the world’s biggest companies were in
freefall. They appeared to be in a race to zero. Peak to trough, Accenture shares fell by over 99%, from $40
to $0.01. At precisely the same time, shares in Sotheby’s rose three thousand-fold, from $34 to $99,999.99.
These tails were not just fatter and faster. They wagged up as well as down.
The Flash Crash left market participants, regulators and academics agog. More than one year on, they
remain agog. There has been no shortage of potential explanations. These are as varied as they are many:
from fat fingers to fat tails; from block trades to blocked lines; from high-speed traders to low-level abuse.
From this mixed bag, only one clear explanation emerges: that there is no clear explanation. To a first
approximation, we remain unsure quite what caused the Flash Crash or whether it could recur. 1
That conclusion sits uneasily on the shoulders. Asset markets rely on accurate pricing of risk. And financial
regulation relies on an accurate reading of markets. Whether trading assets or regulating exchanges,
ignorance is rarely bliss. It is this uncertainty, rather than the Flash Crash itself, which makes this an issue of potential systemic importance.
In many respects, this uncertainty should come as no surprise. Driven by a potent cocktail of technology and
regulation, trading in financial markets has evolved dramatically during the course of this century. Platforms
for trading equities have proliferated and fragmented. And the speed limit for trading has gone through the
roof. Technologists now believe the sky is the limit.
This rapidly-changing topology of trading raises some big questions for risk management. There are good
reasons, theoretically and empirically, to believe that while this evolution in trading may have brought
benefits such as a reduction in transaction costs, it may also have increased abnormalities in the distribution
of risk and return in the financial system. Such abnormalities hallmarked the Flash Crash. This paper
considers some of the evidence on these abnormalities and their impact on systemic risk.
Regulation has thin-sliced trading. And technology has thin-sliced time. Among traders, as among stocks on
6 May, there is a race to zero. Yet it is unclear that this race will have a winner. If it raises systemic risk, it is
1 For a regulatory perspective see CFTC-SEC (2010), for a market perspective see Automated Trader (2010) and for an academicperspective see Easley et al (2011b).
8/6/2019 The Race to Zero : Speech by Andrew Haldane
http://slidepdf.com/reader/full/the-race-to-zero-speech-by-andrew-haldane 3/25
All speeches are available online at www.bankofengland.co.uk/publications/speeches
3
3
possible capital markets could be the loser. To avoid that, a redesign of mechanisms for securing capital
market stability may be needed.
2. The Topology of Trading
During the course of this century, financial market trading has undergone a transformation. This has been
driven in part by technology and in part by regulation. The key words are structure and speed. Both the
structure of the markets in which participants operate, and the behaviour of those participants, has
undergone a phase shift. That highly adaptive topology of trading has made understanding markets a more
hazardous science than a decade ago.
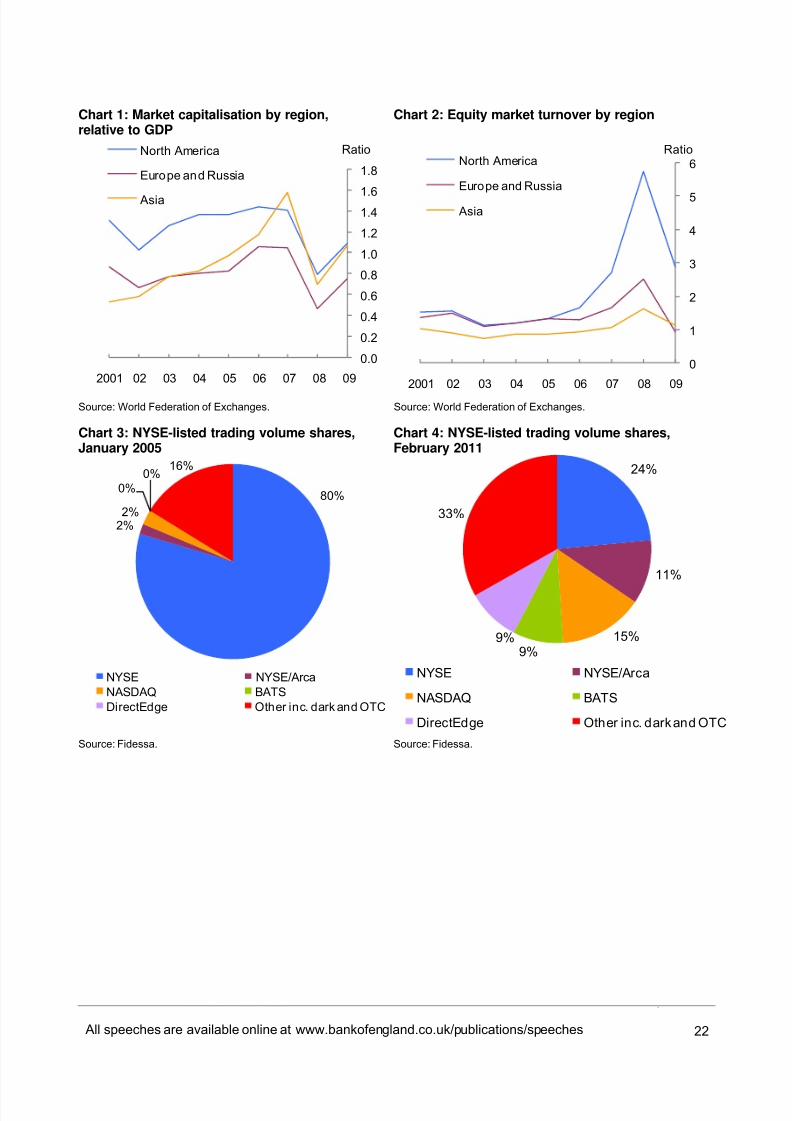
Chart 1 plots equity market capitalisation relative to nominal GDP in the United States, Europe and Asia
through this century. On the face of it, it paints a rather unexciting picture. Equity market values relative toGDP in the US are roughly where they started the century. In Asia there is evidence of some deepening of
equity markets relative to the whole economy but it is pretty modest.
Measures of equity market capitalisation to GDP have often been used as proxies for the contribution of
financial development to economic growth. 2 These effects are typically found to be significant. By that
metric, the contribution of equity markets to economic growth in the US, Europe and Asia has been static, at
best mildly positive, during the course of this century.
Yet that picture of apparent stasis in equity markets conceals a maelstrom of activity beneath the surface.To see this, Chart 2 plots stock market turnover in the US, Europe and Asia over the same period. It shows
a dramatic rise, especially in the world’s most mature equity market, the United States. Equity market
turnover in the US has risen nearly fourfold in the space of a decade. Put differently, at the end of the
second World War, the average US share was held by the average investor for around four years. By the
start of this century, that had fallen to around eight months. And by 2008, it had fallen to around two months.
What explains this story? Regulation is part of it. Two important, and almost simultaneous, regulatory
developments on either side of the Atlantic changed fundamentally the trading landscape: in the US,
Regulation NMS (National Market System) in 2005; and in Europe, MiFID (Markets in Financial Instruments
Directive) in 2004. Though different in detail, these regulatory initiatives had similar objectives: to boost
competition and choice in financial market trading by attracting new entrants.
Central exchanges for the trading of securities evolved from the coffee houses of Amsterdam, London, New
York and Paris in the 17 th century. From those foundations emerged the physical exchanges which
dominated the period from the 18 th right through to the 20 th centuries. Central trading exchanges maintained
2 Arestis and Demetriades (1997).
8/6/2019 The Race to Zero : Speech by Andrew Haldane
http://slidepdf.com/reader/full/the-race-to-zero-speech-by-andrew-haldane 4/25
All speeches are available online at www.bankofengland.co.uk/publications/speeches
4
4
their near-monopoly status for 300 years. In the space of a few years, that monopoly has been decisively
broken.
A diverse and distributed patchwork of exchanges and multilateral trading platforms has emerged in its
place. These offer investors a range of execution characteristics, such as speed, cost and transparency,
typically electronically. Equity market trading structures have fragmented. This has gone furthest in the US,
where trading is now split across more than half a dozen exchanges, multilateral trading platforms and “dark
pools” of anonymous trading (Charts 3 and 4). Having accounted for around 80% of trading volume in
NYSE-listed securities in 2005, the trading share of the NYSE had fallen to around 24% by February 2011.
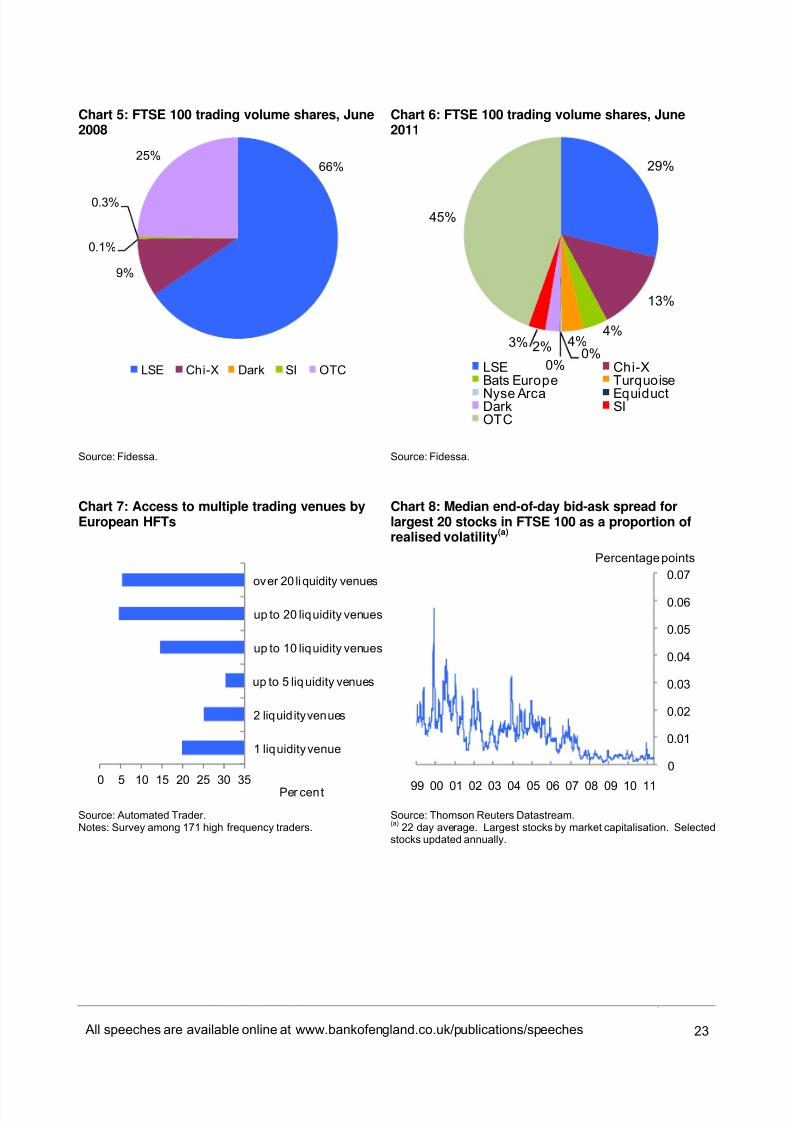
A similar pattern is evident across Europe. In the UK, the market share of the London Stock Exchange has
fallen from two-thirds in June 2008 to less than one third today (Charts 5 and 6). The same pattern is found
in Germany and France. In Asia, there is as yet less fragmentation.
Accompanying this structural evolution in trading has been a technological revolution. Electronic trading is
not new. The first electronic exchange (NASDAQ) is already over forty years old. But advances in
computing power have shifted decisively the frontier of electronic, and in particular algorithmic, trading over
the past few years. That frontier is defined by speed.
The average speed of order execution on the US NYSE has fallen from around 20 seconds a decade ago to
around one second today. These days, the lexicon of financial markets is dominated by talk of
High-Frequency Trading (HFT). It is not just talk. As recently as 2005, HFT accounted for less than a fifth of US equity market turnover by volume. Today, it accounts for between two-thirds and three-quarters.
The picture is similar, if less dramatic, in Europe. Since 2005, HFT has risen from a tiny share to represent
over 35% of the equity market. In Asia and in emerging markets, it is growing fast from a lower base. What
is true across countries is also true across markets. HFT is assuming an ever-increasing role in debt and
foreign exchange markets. In some futures markets, it already accounts for almost half of turnover. In the
space of a few years, HFT has risen from relative obscurity to absolute hegemony, at least in some markets.
HFT itself is far from monolithic, comprising a range of strategies. 3 Some involve high-speed liquidity
provision, which is akin to market-making. Others involve statistical arbitrage, using trading algorithms to
detect and exploit pricing anomalies between stocks or markets. Because these anomalies tend to be
eliminated quickly, HFT algorithms have to be highly adaptive, not least to keep pace with the evolution of
new algorithms. The half-life of an HFT algorithm can often be measured in weeks.
3 Mackenzie (2011) provides a brilliant recent account of the role of HFT, in particular in the context of the Flash Crash. HFT is asub-set of a broader class of algorithmic trading strategies. See also Aldridge (2010).
8/6/2019 The Race to Zero : Speech by Andrew Haldane
http://slidepdf.com/reader/full/the-race-to-zero-speech-by-andrew-haldane 5/25
All speeches are available online at www.bankofengland.co.uk/publications/speeches
5
5
One variant of these arbitrage strategies exploits pricing differences between common securities quoted on
competing trading platforms. For that reason, HFT firms tend to have their tentacles spread across multiple
trading venues, arbitraging tiny differences in price (Chart 7). These strategies have grown up as a direct
response to the fragmentation of trading infrastructures. In other words, HFT is at least in part the (possibly
unplanned) progeny of regulators pursuing competitive ends.
The ascent of HFT goes a long way towards explaining the rise in equity market turnover in the major equity
markets and in particular the rise in number, and fall in the average size, of trades executed. Put differently,
the trading behaviour of HFT has contributed to the downward fall in the average duration of stock holdings.
HFT holding periods lie in a narrow time range. The upper bound is perhaps around one day. The lower
bound is a perpetual downward motion machine, as computing capacity compresses the timeline for trading.
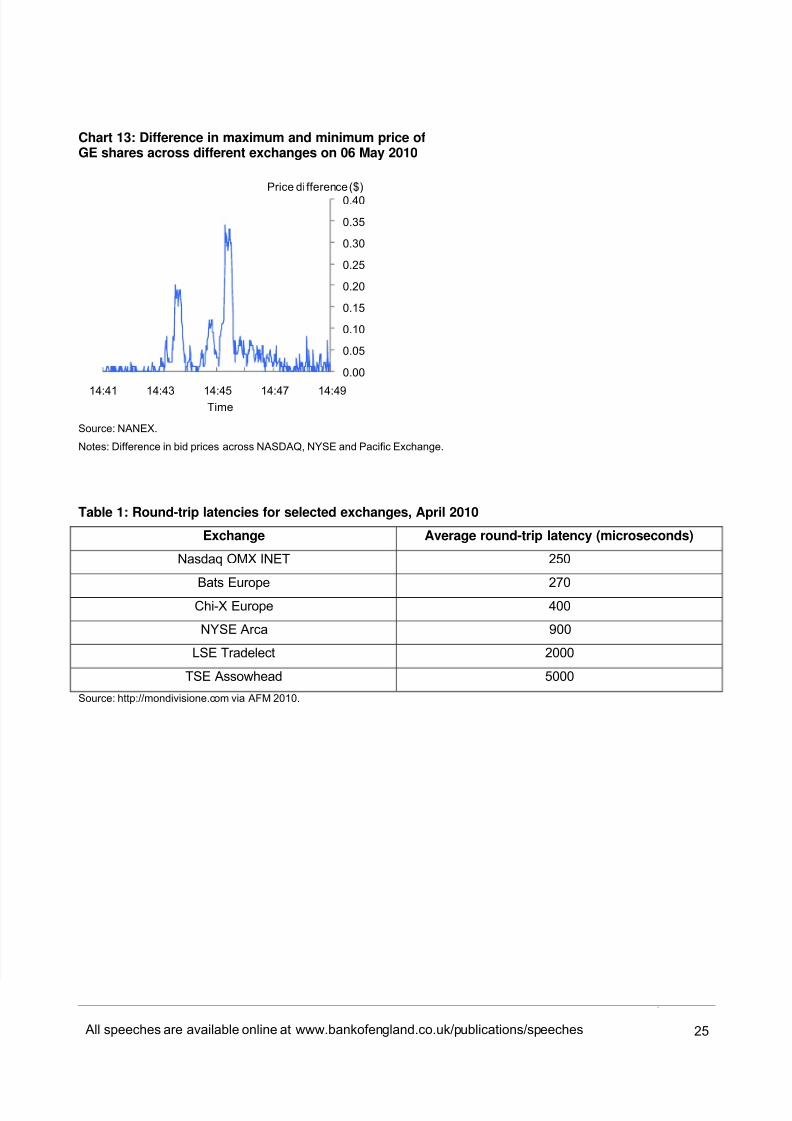
A decade ago, execution times on some electronic trading platforms dipped decisively below the one secondbarrier. As recently as a few years ago, trade execution times reached “blink speed” – as fast as the blink of
an eye. At the time that seemed eye-watering, at around 300-400 milli-seconds or less than a third of a
second. But more recently the speed limit has shifted from milli-seconds to micro-seconds – millionths of a
second. Several trading platforms now offer trade execution measured in micro-seconds (Table 1).
As of today, the lower limit for trade execution appears to be around 10 micro-seconds. This means it would
in principle be possible to execute around 40,000 back-to-back trades in the blink of an eye. If supermarkets
ran HFT programmes, the average household could complete its shopping for a lifetime in under a second.
Imagine.
It is clear from these trends that trading technologists are involved in an arms race. And it is far from over.
The new trading frontier is nano-seconds – billionths of a second. And the twinkle in technologists’
(unblinking) eye is pico-seconds – trillionths of a second. HFT firms talk of a “race to zero”. This is the
promised land of zero “latency” where trading converges on its natural (Planck’s) limit, the speed of light. 4
The race to zero seems like a million miles from the European coffee shop conversations of the 17 th century
and the noisy trading floors of the 18 th, 19 th and 20 th centuries. The dawn of electronic trading coincided with
the dusk for floor trading. Physical proximity lost its allure. As soon as computers processed faster than
traders talked, the time was up for human interactions on physical exchanges. Trading became virtual,
distance a dinosaur.
Or so it seemed. Latterly, however, HFT is turning that logic on its head. The race to zero has encouraged
traders to eke out the last pico-second. And one way to do that is by limiting physical distance. The shorter
4 “Latency” refers to the time it takes from sending an order to it being executed.
8/6/2019 The Race to Zero : Speech by Andrew Haldane
http://slidepdf.com/reader/full/the-race-to-zero-speech-by-andrew-haldane 6/25
All speeches are available online at www.bankofengland.co.uk/publications/speeches
6
6
the cable to the matching engine of the trading exchange, the faster the trade. Every 100 miles might add a
milli-second to estimated execution times. For HFT, that is the difference between the tortoise and the hare.
The recognition of that has led to a phenomenon known as “co-location”. HFT firms have begun to relocate
their servers as close as physically possible to the trade-matching engine. That allows them to eke a pico
over their (non co-located) competitors. For a price, a number of exchanges now offer co-located services,
with a perimeter strictly enforced, including the NYSE, Euronext and the London Stock Exchange.
This has added a new dimension to the “adverse selection” problem in economics – of uninformed traders
suffering at the hands of the informed. Being informed used to mean being smarter than the average bear
about the path of future fundamentals – profits, interest rates, order flow and the like. Adverse selection risk
meant someone having a better informed view on these fundamentals.
Adverse selection risk today has taken on a different shape. In a high-speed, co-located world, being
informed means seeing and acting on market prices sooner than competitors. Today, it pays to be faster
than the average bear, not smarter. To be uninformed is to be slow. These uninformed traders face a
fundamental uncertainty: they may not be able to observe the market price at which their trades will be
executed. This is driving through the rear-view mirror, stock-picking based on yesterday’s prices.
Co-location speeds up the clock. But it has also had the effect of turning it back. Location matters once
more. The race to zero has become a physical, as well as a virtual, one. Distance matters more than ever.
The dinosaur has been resurrected, this time in high definition. In some ways, it is the ultimate contradiction.
In sum, through this century changes in the structure of trading, and in the behaviour of traders, have gone
hand in hand. Liberalisation and innovation have delivered fragmentation of structure and transformation of
speed. Both structure and speed have experienced a high-velocity revolution. So what impact has this race
to zero had on market dynamics?
3. From Microstructure to Macrostructure
This is difficult detective work. But there are theoretical clues and empirical fingerprints. The theoretical
clues come from a literature that flourished after the stock market crash of 1987 – the so-called market
microstructure literature. 5 This departs from the notion of frictionless trading and information-efficient prices.
In its place it introduces frictions in the price-setting process, which arise from characteristics of market
participants (such as their trading speed) and of the trading infrastructure (such as its degree of
fragmentation).
5 For example, O’Hara (2004).
8/6/2019 The Race to Zero : Speech by Andrew Haldane
http://slidepdf.com/reader/full/the-race-to-zero-speech-by-andrew-haldane 7/25
All speeches are available online at www.bankofengland.co.uk/publications/speeches
7
7
Frictions in pricing arise from the process of matching buyers and sellers. Here, the role of market-makers is
key. The market-maker faces two types of problem. One is an inventory-management problem – how much
stock to hold and at what price to buy and sell. The market-maker earns a bid-ask spread in return for
solving this problem since they bear the risk that their inventory loses value. 6
Market-makers face a second, information-management problem. This arises from the possibility of trading
with someone better informed about true prices than themselves – an adverse selection risk. Again, the
market-maker earns a bid-ask spread to protect against this informational risk. 7
The bid-ask spread, then, is the market-makers’ insurance premium. It provides protection against risks from
a depreciating or mis-priced inventory. As such, it also proxies the “liquidity” of the market – that is, its
ability to absorb buy and sell orders and execute them without an impact on price. A wider bid-ask spread
implies greater risk in the sense of the market’s ability to absorb volume without affecting prices.
This basic framework can be used to assess the impact of the changing trading topology on systemic risk,
moving from analysing market microstructure to market macro structure. Take the effects of fragmentation.
That heightens competition among trading platforms, offering differing execution options and wider access to
participants. This would tend to attract liquidity providers, including cross-market arbitraging HFT. As new
liquidity-providers enter the market, execution certainty and price efficiency might be expected to improve.
Inventory and information risk would thereby fall and, with it, bid-ask spreads.
Some of the early empirical fingerprints suggest just such a pattern. For example, Brogaard (2010) analysesthe effects of HFT on 26 NASDAQ-listed stocks. HFT is estimated to have reduced the price impact of a
100-share trade by $0.022. For a 1000-share trade, the price impact is reduced by $0.083. In other words,
HFT boosts the market’s absorptive capacity. Consistent with that, Hendershott et al (2010) and Hasbrouck
and Saar (2011) find evidence of algorithmic trading and HFT having narrowed bid-ask spreads.
Chart 8 plots a measure of bid-ask spreads on UK equities over the past decade, normalising them by a
measure of market volatility to strip out volatility spikes. It confirms the pattern from earlier studies. Bid-ask
spreads have fallen by an order of magnitude since 2004, from around 0.023 to 0.002 percentage points.
On this metric, market liquidity and efficiency appear to have improved. HFT has greased the wheels of
modern finance.
But bid-ask spreads can sometimes conceal as much as they reveal. For example, by normalising on
volatility, Chart 8 air-brushes out what might be most interesting: normalising volatility might normalise
6 Stoll (1978).7 Glosten and Milgrom (1985).
8/6/2019 The Race to Zero : Speech by Andrew Haldane
http://slidepdf.com/reader/full/the-race-to-zero-speech-by-andrew-haldane 8/25
All speeches are available online at www.bankofengland.co.uk/publications/speeches
8
8
abnormality. It risks falling foul of what sociologists call “normalisation of deviance” – that is, ignoring small
changes which might later culminate in an extreme event. 8
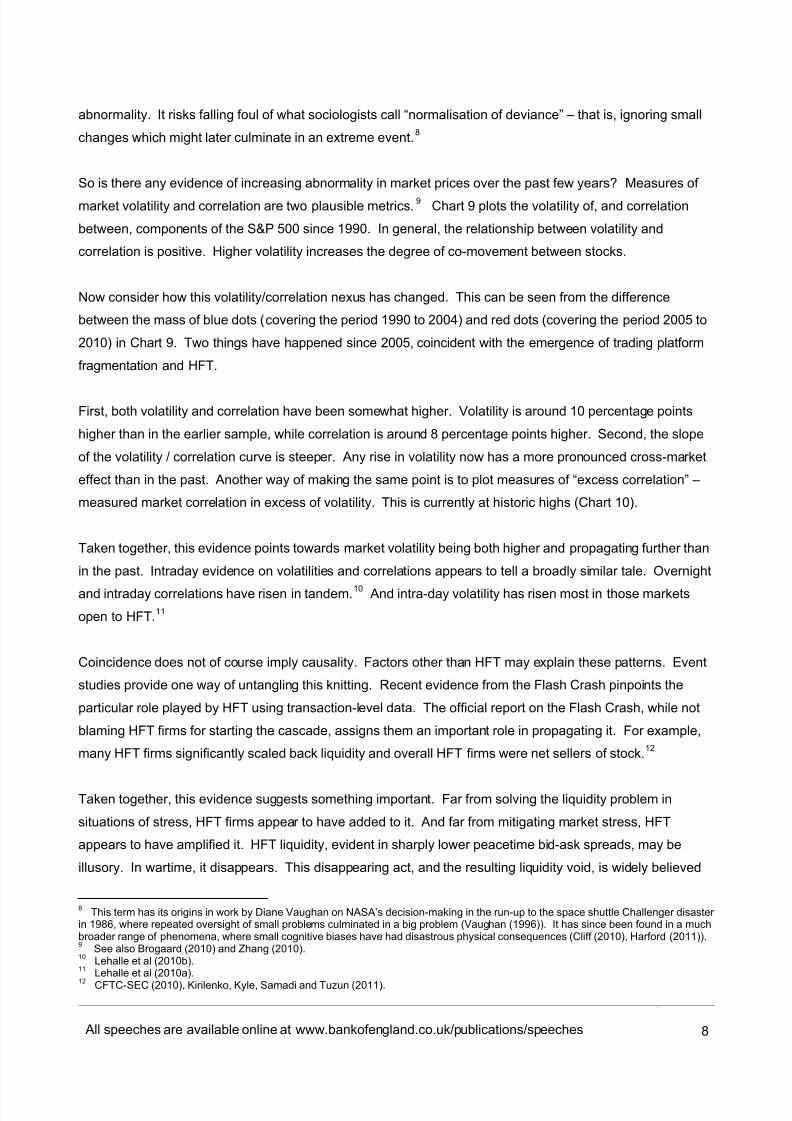
So is there any evidence of increasing abnormality in market prices over the past few years? Measures of
market volatility and correlation are two plausible metrics. 9 Chart 9 plots the volatility of, and correlation
between, components of the S&P 500 since 1990. In general, the relationship between volatility and
correlation is positive. Higher volatility increases the degree of co-movement between stocks.
Now consider how this volatility/correlation nexus has changed. This can be seen from the difference
between the mass of blue dots (covering the period 1990 to 2004) and red dots (covering the period 2005 to
2010) in Chart 9. Two things have happened since 2005, coincident with the emergence of trading platform
fragmentation and HFT.
First, both volatility and correlation have been somewhat higher. Volatility is around 10 percentage points
higher than in the earlier sample, while correlation is around 8 percentage points higher. Second, the slope
of the volatility / correlation curve is steeper. Any rise in volatility now has a more pronounced cross-market
effect than in the past. Another way of making the same point is to plot measures of “excess correlation” –
measured market correlation in excess of volatility. This is currently at historic highs (Chart 10).
Taken together, this evidence points towards market volatility being both higher and propagating further than
in the past. Intraday evidence on volatilities and correlations appears to tell a broadly similar tale. Overnight
and intraday correlations have risen in tandem. 10 And intra-day volatility has risen most in those marketsopen to HFT. 11
Coincidence does not of course imply causality. Factors other than HFT may explain these patterns. Event
studies provide one way of untangling this knitting. Recent evidence from the Flash Crash pinpoints the
particular role played by HFT using transaction-level data. The official report on the Flash Crash, while not
blaming HFT firms for starting the cascade, assigns them an important role in propagating it. For example,
many HFT firms significantly scaled back liquidity and overall HFT firms were net sellers of stock. 12
Taken together, this evidence suggests something important. Far from solving the liquidity problem in
situations of stress, HFT firms appear to have added to it. And far from mitigating market stress, HFT
appears to have amplified it. HFT liquidity, evident in sharply lower peacetime bid-ask spreads, may be
illusory. In wartime, it disappears. This disappearing act, and the resulting liquidity void, is widely believed
8 This term has its origins in work by Diane Vaughan on NASA’s decision-making in the run-up to the space shuttle Challenger disaster in 1986, where repeated oversight of small problems culminated in a big problem (Vaughan (1996)). It has since been found in a muchbroader range of phenomena, where small cognitive biases have had disastrous physical consequences (Cliff (2010), Harford (2011)).9 See also Brogaard (2010) and Zhang (2010).10 Lehalle et al (2010b).11 Lehalle et al (2010a).12 CFTC-SEC (2010), Kirilenko, Kyle, Samadi and Tuzun (2011).
8/6/2019 The Race to Zero : Speech by Andrew Haldane
http://slidepdf.com/reader/full/the-race-to-zero-speech-by-andrew-haldane 9/25
All speeches are available online at www.bankofengland.co.uk/publications/speeches
9
9
to have amplified the price discontinuities evident during the Flash Crash. 13 HFT liquidity proved fickle under
stress, as flood turned to drought.
In some respects, this may sound like old news. For example, an evaporation of liquidity, amplified by
algorithmic trading, lay at the heart of the 1987 stock market crash. And it is also well-known that stock
prices exhibit non-normalities, with the distribution of asset price changes fatter-tailed and more persistent
than implied by the efficient markets hypothesis at frequencies of years and months, perhaps weeks and
days. 14 But these abnormalities were thought to disappear at higher frequencies, such as hours and
minutes. Over shorter intervals, efficient market pricing restored itself.
Recent studies point, however, to a changing pattern. Non-normal patterns in prices have begun to appear
at much higher frequencies. A recent study by Smith (2010) suggests that, since around 2005, stock price
returns have begun to exhibit fat-tailed persistence at 15 minute intervals. Given the timing, thesenon-normalities are attributed to the role of HFT in financial markets.
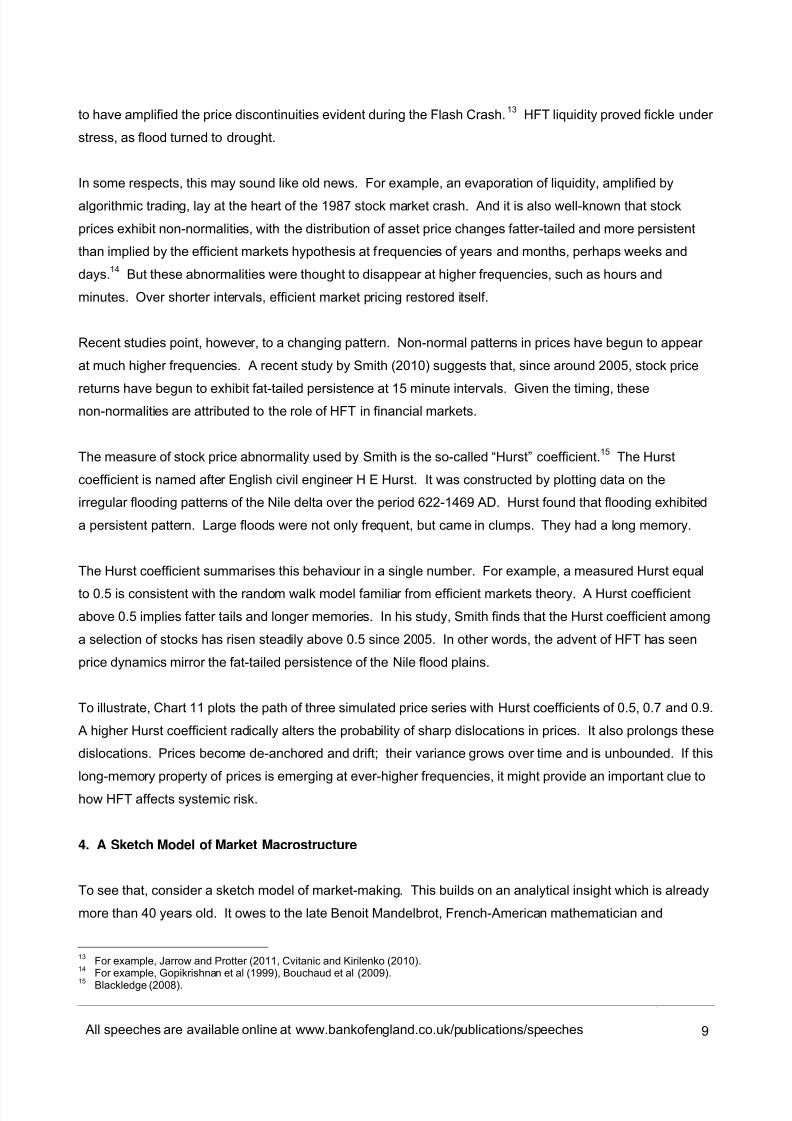
The measure of stock price abnormality used by Smith is the so-called “Hurst” coefficient. 15 The Hurst
coefficient is named after English civil engineer H E Hurst. It was constructed by plotting data on the
irregular flooding patterns of the Nile delta over the period 622-1469 AD. Hurst found that flooding exhibited
a persistent pattern. Large floods were not only frequent, but came in clumps. They had a long memory.
The Hurst coefficient summarises this behaviour in a single number. For example, a measured Hurst equal
to 0.5 is consistent with the random walk model familiar from efficient markets theory. A Hurst coefficientabove 0.5 implies fatter tails and longer memories. In his study, Smith finds that the Hurst coefficient among
a selection of stocks has risen steadily above 0.5 since 2005. In other words, the advent of HFT has seen
price dynamics mirror the fat-tailed persistence of the Nile flood plains.
To illustrate, Chart 11 plots the path of three simulated price series with Hurst coefficients of 0.5, 0.7 and 0.9.
A higher Hurst coefficient radically alters the probability of sharp dislocations in prices. It also prolongs these
dislocations. Prices become de-anchored and drift; their variance grows over time and is unbounded. If this
long-memory property of prices is emerging at ever-higher frequencies, it might provide an important clue to
how HFT affects systemic risk.
4. A Sketch Model of Market Macrostructure
To see that, consider a sketch model of market-making. This builds on an analytical insight which is already
more than 40 years old. It owes to the late Benoit Mandelbrot, French-American mathematician and
13 For example, Jarrow and Protter (2011, Cvitanic and Kirilenko (2010).14 For example, Gopikrishnan et al (1999), Bouchaud et al (2009).15 Blackledge (2008).
8/6/2019 The Race to Zero : Speech by Andrew Haldane
http://slidepdf.com/reader/full/the-race-to-zero-speech-by-andrew-haldane 10/25
All speeches are available online at www.bankofengland.co.uk/publications/speeches
10
10
architect of fractal geometry. Mandelbrot found that a great many real-world topologies exhibited a fractal
pattern. By this he meant that the basic pattern repeated itself, whatever the scale at which it was observed.
They were “self-similar”. Self-similarity appears to be present throughout the physical world, from coastlines
to cauliflowers, from snowflakes to lightning bolts, from mountain ranges to river deltas. 16
One of Mandelbrot’s earliest applications of fractal geometry was to stock prices. In a 1967 paper, he
argued that stock prices could best be understood by distinguishing between two measuring rods: clock time
and volume time. 17 While empirical studies typically used the first measuring rod (days, hours, seconds,
milli-seconds), stock prices were better understood by using the second.
Mandelbrot’s explanation was relatively simple. If trading cannot occur within a given time window, price
movements can only reflect random pieces of news – economic, financial, political. So, consistent with
efficient market theory, price changes would be drawn from a normal distribution with a fat middle and thintails when measured in clock time. They were a random walk.
But as soon as trading is possible within a period, this game changes. Strategic, interactive behaviour
among participants enters the equation. Volumes come and go. Traders enter and exit. Algorithms die or
adapt. Behaviour within that time interval may then no longer be random noise. Rather trading volumes will
exhibit persistence and fat tails. This will then be mirrored in prices. 18 So when measured in clock time,
prices changes will have thinner middles and fatter tails, just like a cauliflower, a coastline, or a cosmos. 19
Subsequent studies have shown that this clock time / volume time distinction helps explain equity pricedynamics, especially at times of market stress. For example, Easley et al (2011) show that the distribution of
price changes during the Flash Crash was highly non-normal in clock time, with fat tails and persistence. But
in volume time, normal service – indeed, near-normality – resumed. This fractal lens can be used to explain
why market liquidity can evaporate in situations of market stress, amplifying small events across time, assets
and markets. Fractal geometry tells us that what might start off as a snowflake has the potential to snowball.
(a) Behaviour of High Frequency Traders
HFT has had three key effects on markets. First, it has meant ever-larger volumes of trading have been
compressed into ever-smaller chunks of time. Second, it has meant strategic behaviour among traders is
occurring at ever-higher frequencies. Third, it is not just that the speed of strategic interaction has changed
but also its nature. Yesterday, interaction was human-to-human. Today, it is machine-to-machine,
16 Peters (1994).17 Mandelbrot and Taylor (1967). See also Clark (1973).18 This finding can be given a variety of behavioural interpretations, including persistence in gaps in the limit order book (Bouchard et al(2009)). Empirical support for this hypothesis is found in Easley et al (2011a).19 Andrew Lo’s “adaptive market hypothesis” is a more recent manifestation of essentially the same story.
8/6/2019 The Race to Zero : Speech by Andrew Haldane
http://slidepdf.com/reader/full/the-race-to-zero-speech-by-andrew-haldane 11/25
All speeches are available online at www.bankofengland.co.uk/publications/speeches
11
11
algorithm-to-algorithm. For algorithms with the lifespan of a ladybird, this makes for rapid evolutionary
adaptation.
Cramming ever-larger volumes of strategic, adaptive trading into ever-smaller time intervals would, following
Mandelbrot, tend to increase abnormalities in prices when measured in clock time. It will make for fatter,
more persistent tails at ever-higher frequencies. That is what we appear, increasingly, to find in financial
market prices in practice, whether in volatility and correlation or in fat tails and persistence.
This change in price dynamics will in turn influence market-making behaviour. Consider the problem facing
an HFT market-maker. They face inventory risk from market fluctuations and information risk from adverse
selection. Pricing these risks means forming a guess about the future path of prices. The greater the
potential range of future prices, the larger the insurance premium they will demand.
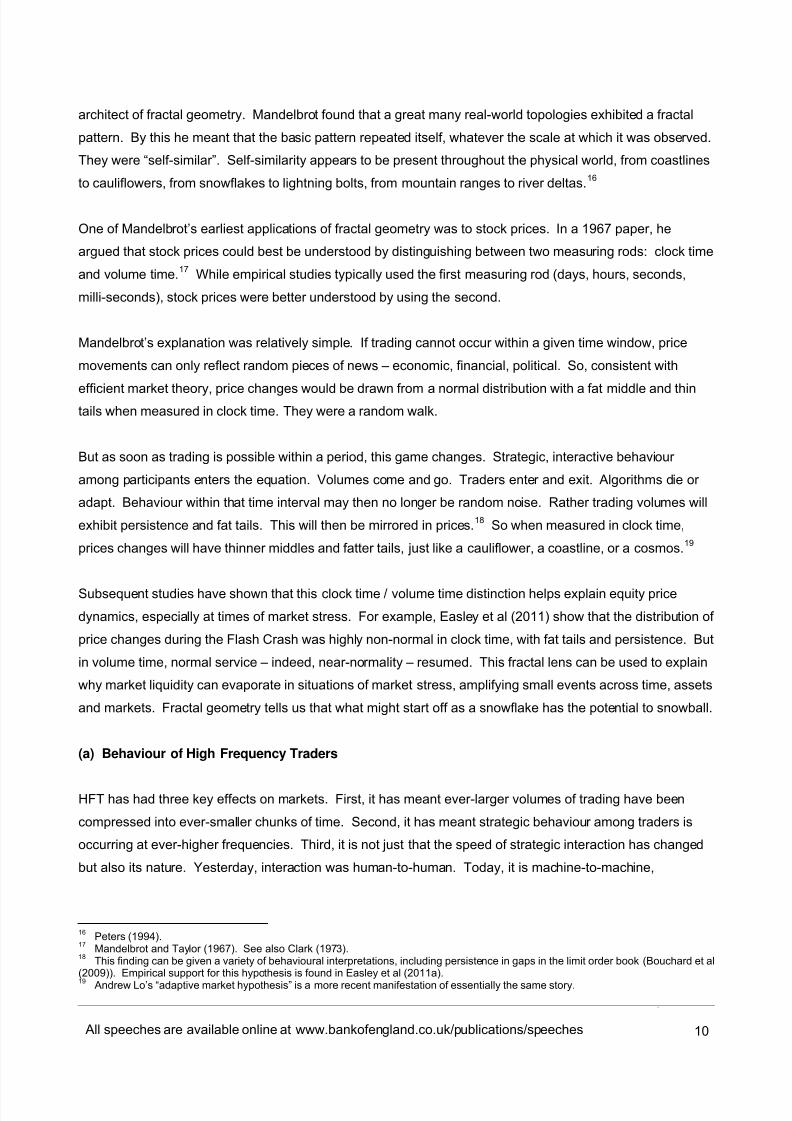
The future price range (maximum – minimum) for a price series at some future date T, R(T), can be written
generically as: 20
(1)
where κ is a constant and σ T is the standard deviation of the process up to time T . H is our old friend the
Hurst coefficient, dredged up from the Nile; it can be thought to summarise the degree of fat-tailedness and
persistence in prices.
When the holding period is short (say T=1), as with HFT, the future price range is the volatility of the series
magnified by the Hurst coefficient. In other words, the fatter and more persistent the tails (H), the greater the
market risk and the wider the bid-ask spread of the HFT.
This has implications for the dynamics of bid-ask spreads, and hence liquidity, among HFT firms. During a
market crash, the volatility of prices ( σ ) is likely to spike. From equation (1), fractality heightens the risk-
sensitivity of HFT bid-ask spreads to such a volatility event. In other words, liquidity under stress is likely to
prove less resilient. This is because one extreme event, one flood or drought on the Nile, is more likely to be
followed by a second, a third and a fourth. Reorganising that greater risk, market makers’ insurance
premium will rise accordingly.
This is the HFT inventory problem. But the information problem for HFT market-makers in situations of
stress is in many ways even more acute. Price dynamics are the fruits of trader interaction or, more
accurately, algorithmic interaction. These interactions will be close to impossible for an individual trader to
observe or understand. This algorithmic risk is not new. In 2003, a US trading firm became insolvent in 16
20 Equation (1) holds asymptotically in expectation for large T and for a broad range of statistical processes (see Peters (1994) andQian and Rasheed (2004)).
8/6/2019 The Race to Zero : Speech by Andrew Haldane
http://slidepdf.com/reader/full/the-race-to-zero-speech-by-andrew-haldane 12/25
All speeches are available online at www.bankofengland.co.uk/publications/speeches
12
12
seconds when an employee inadvertently turned an algorithm on. It took the company 47 minutes to realise
it had gone bust. 21
Since then, things have stepped up several gears. For a 14-second period during the Flash Crash,
algorithmic interactions caused 27,000 contracts of the S&P 500 E-mini futures contracts to change hands.
Yet, in net terms, only 200 contracts were purchased. HFT algorithms were automatically offloading
contracts in a frenetic, and in net terms fruitless, game of pass-the-parcel. The result was a magnification of
the fat tail in stock prices due to fire-sale forced machine selling. 22
These algorithmic interactions, and the uncertainty they create, will magnify the effect on spreads of a market
event. Pricing becomes near-impossible and with it the making of markets. During the Flash Crash,
Accenture shares traded at 1 cent, and Sotheby’s at $99,999.99, because these were the lowest and highest
quotes admissible by HFT market-makers consistent with fulfilling their obligations. Bid-ask spreads did not just widen, they ballooned. Liquidity entered a void. That trades were executed at these “stub quotes”
demonstrated algorithms were running on autopilot with liquidity spent. Prices were not just information
inefficient; they were dislocated to the point where they had no information content whatsoever.
(b) Behaviour of Low Frequency Traders
If the story stopped here the ending would be an unhappy, but perhaps not critical, one. After all, the Flash
Crash was done and dusted within an hour. But the framework developed suggests these effects need not,
in general will not, be transient. To the contrary, these effects might actually magnify. To see why, consider now the behaviour of low frequency traders (LFT).
They face the same set of risks as the HFT market-maker – inventory and information risk. But persistence
and fat tails in short-term price movement amplify these risks. From equation (1), the greater the holding
period, T, the greater the potential dispersion in future prices. Intuitively, with fat-tailed persistence, a large
shock is both more likely and its effects will linger longer. Slower trading increases the distance prices can
travel once de-anchored.
Chart 12 illustrates this. The distribution of returns observed at a low frequency has far greater variance and
kurtosis than that at a higher frequency. For example, the variance of prices faced by a LFT firm (trading at
T=50) is around nine times greater than for a HFT firm (trading at T=1), for H=0.9. 23
Given these price dynamics, HFT aggravates the market-making problem for LFT firms by magnifying the
market risk they face. 24 And it is not just that LFT firms are slower to execute. In situations of stress, they
21 Clark (2010).22 CFTC-SEC (2010).23 Even once an adjustment has been made for the degree of time scaling associated with a standard Brownian motion.
8/6/2019 The Race to Zero : Speech by Andrew Haldane
http://slidepdf.com/reader/full/the-race-to-zero-speech-by-andrew-haldane 13/25
All speeches are available online at www.bankofengland.co.uk/publications/speeches
13
13
may not even be able to see the prices at which they can trade. Co-located traders may have executed
many thousands of trades before LFT firms have executed their own. LFT firms face intrinsic uncertainty
about prices. When volumes and price movements are large, LFT market-making is driving in the dark,
stock-picking with a safety-pin.
During the Flash Crash, many traders suffered just this problem. Message traffic resulted in delays in
disseminating quotes for over 1000 stocks. These delays lasted for up to 35 seconds. As a result,
discrepancies emerged between the prices of common stocks trading on different exchanges (Chart 13).
Faced with such uncertainty, a number of market participants paused or halted trading. The equilibrating
force of long-term investors went missing. Bargain-hunting shoppers simply had no price list.
The combined effects of these inventory and information problems is to widen the bid-ask spreads LFT
market-makers charge. Greater execution risk and uncertainty calls for a larger insurance premium. This,too, may have an adverse feedback effect on financial market pricing. That is because it is likely to render
uncompetitive LFT firms relative to HFT firms able to charge tighter spreads. Market-making will increasingly
congregate around HFT firms proffering these lower spreads.
If the way to make money is to make markets, and the way to market markets is to make haste, the result is
likely to be a race – an arms race to zero latency. Competitive forces will generate incentives to break the
speed barrier, as this is the passport to lower spreads which is in turn the passport to making markets. This
arms race to zero is precisely what has played out in financial markets over the past few years.
Arms races rarely have a winner. This one may be no exception. In the trading sphere, there is a risk the
individually optimising actions of participants generate an outcome for the system which benefits no-one – a
latter-day “tragedy of the commons”. 25 How so? Because speed increases the risk of feasts and famines in
market liquidity. HFT contribute to the feast through lower bid-ask spreads. But they also contribute to the
famine if their liquidity provision is fickle in situations of stress.
In these situations, backstops sources of longer-term liquidity ought to ride to the rescue. But HFT has also
affected this outside option. LFT market-making has been squeezed-out by competitive pressures from
HFT. And those LFT market makers that remain are at an acute informational disadvantage in situations of
stress. The result is a potentially double liquidity void.
24 Indeed, with fractal price dynamics the variability of prices will potentially grow without bound over time.25 Hardin (1968).
8/6/2019 The Race to Zero : Speech by Andrew Haldane
http://slidepdf.com/reader/full/the-race-to-zero-speech-by-andrew-haldane 14/25
All speeches are available online at www.bankofengland.co.uk/publications/speeches
14
14
(c) Behaviour across Assets and Markets
So far the story has been confined to behaviour of one stock trading on a single exchange. But the changing
structure of markets and trading mean it is unlikely that any stock-specific price dislocation will be localised.
The new topology of trading makes contagion more of a potential bogeyman now than in the past.
One source of contagion is between stock prices and derivatives written on these stocks. HFT activity
means that arbitrage opportunities between these markets are likely to be quickly removed. Or, put
differently, price dislocations in the cash market are likely to be transmitted instantly to futures markets and
vice-versa. That was the story of the Flash Crash, with order imbalances propagated through the futures
market due to pass-the-parcel dynamics before ricocheting back to affect prices in the cash market. 26
A second channel of contagion is between different exchanges and trading platforms. Here, too, HFT haschanged the landscape. Because HFT strategies have emerged to arbitrage differences, price transmission
across exchanges and platforms is near-instantaneous. It also has the potential to be more disruptive.
Liquidity on these exchanges is no longer pooled and centralised. Instead it is distributed and localised,
increasing the potential for illiquidity premia to emerge in periods of stress.
A third potential contagion channel is across stocks. HFT algorithms tend to amplify cross-stock correlation
in the face of a rise in volatility due to their greater use of algorithmic trend-following and arbitrage strategies.
That is consistent with the evidence in Chart 9, with heightened correlation per unit of volatility relative to the
past.
Taken together, these contagion channels suggest that fat-tailed persistence in individual stocks could
quickly be magnified to wider classes of asset, exchange and market. The micro would transmute to the
macro. This is very much in the spirit of Mandelbrot’s fractal story. Structures exhibiting self-similarity
magnify micro behaviour to the macro level. Micro-level abnormalities manifest as system-wide instabilities.
In many respects, this is an unsurprising conclusion. The emergence of HFT in fragmented trading platforms
makes for a financial market place exhibiting complexity and contagion. As the race for zero has gathered
pace, those two features are likely to have grown in importance. The trading system has become
increasingly complex and tightly knit. From the work of Charles Perrow, these are the two essential
ingredients in the recipe for systemic failure. 27
26 CFTC-SEC (2010).27 Perrow (1999), Harford (2011).
8/6/2019 The Race to Zero : Speech by Andrew Haldane
http://slidepdf.com/reader/full/the-race-to-zero-speech-by-andrew-haldane 15/25
All speeches are available online at www.bankofengland.co.uk/publications/speeches
15
15
5. Market Macrostructure and Public Policy
The rapidly-adapting topology of trading poses a challenging set of questions for policymakers, particularly
those safeguarding the resilience of financial markets. How is this changing market macrostructure best
understood and monitored? And how, if at all, can it be modified to bolster systemic resilience?
This is unlikely to be an easy regulatory task. For the first time in financial history, machines can execute
trades far faster than humans can intervene. That gap is set to widen. In some respects the 2010 Flash
Crash and the 1987 stock market crash have common genes – algorithmic amplification of stress. But they
differ in one critical respect. Regulatory intervention could feasibly have forestalled the 1987 crash. By the
time of the Flash Crash, regulators might have blinked – literally, blinked – and missed their chance.
Nonetheless, the experience of managing large-scale, non-financial systems suggests risk-reducingregulatory intervention is possible. Drawing on that experience, two sets of policy tool are worth developing
further.
(a) Mapping Market Macrostructure
Many securities regulators collect transactional data for the markets they oversee, typically to help them
detect instances of market abuse. But the transactional data collected internationally is about to be
transformed. In future, a much larger array of over-the-counter transactions will be cleared through central
counterparties (CCP). And transactions in a number of non-centrally cleared markets will be recorded andwarehoused in so-called trade repositories. 28
This presents a real opportunity. Prospectively over the next decade, securities regulators internationally will
have at their disposal a database which is far richer in its frequency and scope than anything previously. For
the first time ever, many of the raw ingredients will exist to map price and quantity dynamics within, and
across, markets in close to real time.
To date, relatively little thought has been given to how best to put these data to work. They will certainly be
useful as an archaeological site, allowing a detailed forensic sifting of the genealogy of historical market
events. As with the Flash Crash, this may enable regulatory detectives to solve the whodunit: who did what
when and, perhaps, why. It will allow DNA sampling of the victim.
28 In the United States, the Office of Financial Research, created under the Dodd Frank Act, is charged with collecting and analysingdata submitted by US firms.
8/6/2019 The Race to Zero : Speech by Andrew Haldane
http://slidepdf.com/reader/full/the-race-to-zero-speech-by-andrew-haldane 16/25
All speeches are available online at www.bankofengland.co.uk/publications/speeches
16
16
An altogether bigger prize would be to put these data to work before the fact, identifying the next victim
pre-autopsy. That could mean using transactions data to help detect early warnings of systemic fault-lines
and stresses. This is a potentially massive analytical and technical challenge.
The technical challenge is certainly surmountable. Advances in computer power over the past decade mean
that storing and processing huge volumes of data poses no technological barrier. The answer lies in the
clouds – conveniently enough, since they too exhibit fractal properties. If we can search and track the world
wide web in close to real time, we can certainly do the same for its financial sub-component.
The analytical challenge is altogether greater. In essence, it is to find summary measures of billions of
transactions data which are informative about impending market stress. There is serious needle-in-haystack
risk with such an endeavour. And experience in economics and finance of finding robust early warning
indicators is mixed. But here again, the market microstructure literature offers some tantalising clues.
For example, Easley et al (2011b) have suggested that measures of “order imbalance” may provide early
warning signs of liquidity voids and price dislocations. Their measure of imbalance follows closely in
Mandelbrot’s footprints. It uses a volume-based metric of the proportion or orders from informed traders.
Any imbalance towards informed traders causes potential liquidity problems down the line as a result of
adverse selection risk. Easley et al show that their imbalance measure rose sharply ahead of the Flash
Crash, contributing to an eventual evaporation of liquidity.
A more ambitious approach still would be to develop a system-wide model of financial market interaction.Cliff (2010) describes the trading infrastructure as an example of a “socio-technical system of systems”.
These involve a complex fusion between technology and human behaviour. This interaction increases the
system’s vulnerability to catastrophic failure. He proposes a “test rig” for such systems, using simulation
techniques to unearth potential systemic fault-lines.
These techniques have already been applied to other large socio-technical systems, such as defence, space
and weather systems. In each case, there have been some successes. The lessons from these exercises
seem to be twofold. First, that although technology may pose a problem, it may also provide the solution.
Second, that even if it ain’t broke, there is a compelling strong case for fixing it. Not to do so today runs too
great a risk of catastrophic failure tomorrow. We do not need to await a second Flash Crash to establish it
was no fluke. To wait is to normalise deviance.
8/6/2019 The Race to Zero : Speech by Andrew Haldane
http://slidepdf.com/reader/full/the-race-to-zero-speech-by-andrew-haldane 17/25
All speeches are available online at www.bankofengland.co.uk/publications/speeches
17
17
(b) Modifying Market Macrostructure
Regulators in the US and Europe are in the process of reviewing regulatory rules for trading. In the US,
some changes to market rules have already been implemented, while others are the subject of ongoing
research. 29 In Europe, a review is underway of MiFID with an early set of proposals tabled. 30 It is interesting
to assess those proposals using the framework developed here.
(i) Market-making guidelines: In principle, a commitment by market-makers to provide liquidity, whatever
the state of the market, would go to the heart of potential price discontinuity problems. Market-making
commitments would not forestall the arms race. But they would lessen the chances of liquidity droughts and
associated fat tails and persistence in prices. They would, in effect, lower the impact of H. Perhaps for that
reason, there have been proposals in both the US and Europe for such a set of market-making
commitments.31
The difficulty appears, first, in specifying these commitments in a precise enough fashion; and, relatedly and
just as importantly, enforcing them. In a sense, even the market-makers offering their stub quotes on 6 May
were fulfilling a market-making commitment, albeit a paper-thin one. If hard law commitments are too difficult
to define or enforce, an alternative may be a set of soft law guidelines. A number of electronic broking
platforms, notably in foreign exchange markets, have codes or rules of conduct - for example, around
price-making and price-taking which control the extent to which any one firm can steal a technological march
on others. If these codes were extended across trading platforms and assets, perhaps in time
market-making behaviour might adapt.
(ii) Circuit-breakers: Circuit-breakers already exist on US and Europe exchanges. Indeed, circuit-breakers
played an important role in stalling the Flash Crash. In the face of pass-the-parcel algorithmic dynamics, the
Chicago Mercantile Exchange imposed an automatic 5-second pause on trading in its S&P 500 E-mini
futures contracts. 32 It worked, providing time for human traders to take stock – and, as importantly, buy
stock.
The rationale for such rules is well-understood. They temporarily impose a minimum execution time on
trading, T. By calling a halt to trading, circuit-breakers provide a means of establishing a level informational
playing field for all traders, long and short, fast and slow. In other words, they help solve the asymmetric
information (risk and uncertainty) problem across traders of different types. The changing topology of
trading, both speed and structure, has made these informational frictions more acute. So the case for
circuit-breakers is perhaps stronger now than in the past.
29 European Commission (2010), CFTC-SEC (2011).30 CFTC-SEC (2011).31 European Commission (2010)32 MacKenzie and Demos (2011).
8/6/2019 The Race to Zero : Speech by Andrew Haldane
http://slidepdf.com/reader/full/the-race-to-zero-speech-by-andrew-haldane 18/25
All speeches are available online at www.bankofengland.co.uk/publications/speeches
18
18
Circuit-breakers are also a means of heading-off suicidal spiralling, when algorithms join hands and chase
each other over a cliff edge, as during the Flash Crash. Because they are automatic, circuit-breakers allow
time for human intervention to catch-up with, and forestall, machine (summary) execution. They close the
gap between man and machine, if only temporarily. Because HFT has widened this gap, the case for
deploying circuit-breakers is stronger now than in the past.
Historically, circuit-breaking rules have been security or exchange-specific. But in a world of multiple
exchanges, and increasingly correlated securities, rules of this type may not be restrictive enough.
Contagion across securities and exchanges has become the rule. Recognising that, the US authorities have
recently revised their circuit-breaking rules with all trading in a specified set of securities and futures now
halted, irrespective of where trading is taking place. 33
Although the pattern of trading fragmentation in Europe is similar to the US, current MiFID proposals do notenvisage an automatic cross-market trading halt. But in a world of location-free, tightly arbitraged trading,
cross-market circuit-breakers might become increasingly important. Indeed, these rules may potentially
need to cross continents, as well as countries and platforms, if price dislocations are not to be redirected.
(iii) Resting rules: Circuit-breakers are an ex-post, state-contingent intervention rule, specifying a minimum T
for a temporary period. A more ambitious proposal still would be to impose a minimum T, or resting period
for trades, at all times. Minimum resting periods are an ex-ante, non-state contingent intervention rule. They
tackle the arms race at source by imposing a speed limit on trading. Though mooted in both the US and
Europe, they have not been implemented in either trading jurisdiction.
In some respects, it is easy to see why. From equation (1), imposing a minimum T will tend to result in a
higher average bid-ask spread in all states. By increasing the per period transaction cost, the imposition of a
minimum resting period would tend to widen bid-ask spreads and damage market liquidity in peacetime.
HFT would be constrained in its offering to the liquidity feast.
That is of course only one side of the coin. Setting a minimum T would also tend to reduce the risk of
liquidity drought. While raising the average bid-ask spread, it might also lower its variability at times of
stress. Liquidity would on average be more expensive but also more resilient. So in determining whether
there is a role for minimum resting periods, this trade-off between market efficiency and stability is key.
In calibrating this trade-off, a judgement would need to be made on the social value of split-second trading
and liquidity provision and whether this more than counterbalances the greater market uncertainty it
potentially engenders. At times, the efficiency of financial markets and their systemic resilience need to be
33 CFTC-SEC (2010).

8/6/2019 The Race to Zero : Speech by Andrew Haldane
http://slidepdf.com/reader/full/the-race-to-zero-speech-by-andrew-haldane 19/25
All speeches are available online at www.bankofengland.co.uk/publications/speeches
19
19
traded off. This may be one such moment. Historically, the regulatory skew has been heavily towards the
efficiency objective. Given today’s trading topology, it may be time for that to change.
5. Conclusion
The Flash Crash was a near miss. It taught us something important, if uncomfortable, about our state of
knowledge of modern financial markets. Not just that it was imperfect, but that these imperfections may
magnify, sending systemic shockwaves. Technology allows us to thin-slice time. But thinner technological
slices may make for fatter market tails. Flash Crashes, like car crashes, may be more severe the greater the
velocity.
Physical catastrophes alert us to the costs of ignoring these events, of normalising deviance. There is
nothing normal about recent deviations in financial markets. The race to zero may have contributed to thoseabnormalities, adding liquidity during a monsoon and absorbing it during a drought. This fattens tail risk.
Understanding and correcting those tail events is a systemic issue. It may call for new rules of the road for
trading. Grit in the wheels, like grit on the roads, could help forestall the next crash.
8/6/2019 The Race to Zero : Speech by Andrew Haldane
http://slidepdf.com/reader/full/the-race-to-zero-speech-by-andrew-haldane 20/25
All speeches are available online at www.bankofengland.co.uk/publications/speeches
20
20
References
Aldridge, I (2010), “High-Frequency Trading: A Practical Guide to Algorithmic Strategies and TradingSystems”, Wiley Publications.
Arestis, P and Demetriades, P (1997), “Financial Development and Economic Growth: Assessing theEvidence,” The Economic Journal , Vol. 107, No. 442 (May, 1997), pp. 783-799 , Blackwell Publishing for theRoyal Economic Society.
Automated Trader Magazine (2010) , “What just happened?”, Issue 18(3), available at:http://www.automatedtrader.net/articles/risk/50335/what-just-happened .
Bouchaud, J, Farmery, J D and Lill, F (2009) , “How markets slowly digest changes in supply and demand,”Santa Fe Institute working paper.
Blackledge, J (2008) , “Application of the fractal market hypothesis for macroeconomic time series analysis,”ISAST Transactions on Electronics and Signal Processing, Vol. 1(2), pp. 89–110 .
Brogaard, J (2010), “High frequency trading and its impact on market quality”, mimeo.
CFTC-SEC (2010), “Findings regarding the market events of May 6, 2010”, Report of the staffs of the CFTCand SEC to the joint advisory committee on emerging regulatory issues, September 30.
CFTC-SEC Advisory Committee on Emerging Regulatory Issues (2011) , “Recommendations regardingregulation to the market events of May 6, 2010”, available at:http://www.cftc.gov/ucm/groups/public/@aboutcftc/documents/file/jacreport_021811.pdf .
Clark, C (2010) , “Controlling risk in a lightning-speed trading environment”, Federal Reserve Bank of Chicago Financial Markets Group , Policy Discussion Paper Series PDP 2010-1.
Clark, P K (1973) , “A subordinated stochastic process model with finite variance for speculative prices”,Econometrica , Vol. 41, pp. 135–155.
Cliff, D (2010) , “The flash crash of May 6th 2010: Why Technology Failures?”, speech given at the RoyalSociety of London, available at: http://www.cs.bris.ac.uk/home/dc/cliff_wtf_transcript_final.pdf .
Cvitanic, J and Kirilenko, A (2010) , “High frequency traders and asset prices,” Commodity Futures TradingCommission working paper.
Easley D, Lopez de Prado M and O’Hara, M (2011a), “Flow toxicity and volatility in a high frequency world”,working paper.
Easley D, Lopez de Prado M and O’Hara, M (2011b) , “The Microstructure of the “Flash Crash”: FlowToxicity, Liquidity Crashes, and the Probability of Informed Trading”, Journal of Portfolio Management, Vol.37(2), pp. 118–128.
European Commission (2010) , “Review of the Markets in Financial Instruments Directive (MiFID)”,available at: http://ec.europa.eu/internal_market/consultations/docs/2010/mifid/consultation_paper_en.pdf .
Glosten, L and Milgrom, J (1985) , “Bid and ask transaction prices in a specialist market withheterogeneously informed traders”, Journal of Financial Economics, Vol. 9, pp. 47–73.
Gopikrishnan, P, Plerou, V, Amaral, L, Meyer, M and Stanley, H E (1999) , “Scaling of the distribution of fluctuations of financial market indices,” Physical Review E, Vol. 60, pp. 5305–316.
Hardin, G (1968), “The Tragedy of the Commons”, Science 13 December 1968: Vol. 162 no. 3859 pp.1243-1248.
8/6/2019 The Race to Zero : Speech by Andrew Haldane
http://slidepdf.com/reader/full/the-race-to-zero-speech-by-andrew-haldane 21/25
All speeches are available online at www.bankofengland.co.uk/publications/speeches
21
21
Harford, T (2011) , “Adapt: why success always starts with failure,” Little, Brown .
Hasbrouck J and Saar, G (2011), “Low-latency trading”, Johnson school research paper series No 35-2010.
Hendershott, T, Jones, C and Menkveld, A (2010) , “Does Algorithmic Trading improve Liquidity?”, Journal
of Finance, Vol. 66, pp. 1–33.Jarrow, R A and Protter, P (2011) , “A dysfunctional role of high frequency trading in electronic markets”,Johnson School Research Paper Series No. 08-2011.
Kirilenko, A, Kyle, A S, Samadi, M and Tuzun, T (2011) , “The Flash Crash: The impact of high frequencytrading on electronic markets,” Commodity Futures Trading Commission working paper.
Lehalle, C, and Burgot, R (2010a) , “Navigating liquidity 4”, Cheuvreux Credit Agricole Group, April,available at: https://www.cheuvreux.com/pdf/Navigating_Liquidity_september2009.pdf.
Lehalle, C, Burgot, R, Lasnier, M, and Pelin, S (2010b) , “Navigating liquidity 5”, Cheuvreux Credit AgricoleGroup, December, available at: https://www.cheuvreux.com/pdf/NavigatingLiquidity5_December2010.pdf
Mackenzie, D (2011) , “How to Make Money in Microseconds”, London Review of Books , available here:http://www.lrb.co.uk/v33/n10/donald-mackenzie/how-to-make-money-in-microseconds .
Mandelbrot, B B and Taylor, H W (1967) , “On the Distribution of Stock Price Differences”, OperationsResearch , Vol . 15(6), pp. 1057–1062.
O’Hara, M (2004), “Market Microstructure Theory”, Blackwell Publishing .
Perrow, C (1999) , Normal Accidents: Living with High Risk Technologies , Princeton, NJ: PrincetonUniversity Press.
Peters, E (1994) , Fractal Market Analysis: Applying Chaos Theory to Investment and Economics , Wiley
Finance.
Qian, B and Rasheed, K (2004) , "Hurst exponent and financial market predictability", IASTED conferenceon "Financial Engineering and Applications" (FEA 2004), pp. 203 – 209.
SEC (2010) , “SEC Approves Rules Expanding Stock-by-Stock Circuit Breakers and Clarifying Process for Breaking Erroneous Trades”, available at: http://www.sec.gov/news/press/2010/2010-167.htm .
Smith, R (2010) , “Is HFT inducing changes in market microstructure and dynamics," working paper.
Stoll, H (1978) , “The supply of dealer services in securities markets”, Journal of Finance, Vol. 33, pp. 1133–51.
Vaughan, D (1996) , “The challenger launch decision: risky technology, culture, and deviance at NASA,” TheUniversity of Chicago press .
Zhang, F (2010) , “High-frequency trading, stock volatility, and price discovery”, mimeo .
8/6/2019 The Race to Zero : Speech by Andrew Haldane
http://slidepdf.com/reader/full/the-race-to-zero-speech-by-andrew-haldane 22/25
All speeches are available online at www.bankofengland.co.uk/publications/speeches
22
22
Chart 1: Market capitalisation by region,relative to GDP
Chart 2: Equity market turnover by region
Source: World Federation of Exchanges. Source: World Federation of Exchanges.
Chart 3: NYSE-listed trading volume shares,January 2005
Chart 4: NYSE-listed trading volume shares,February 2011
Source: Fidessa. Source: Fidessa.
0.0
0.2
0.4
0.6
0.8
1.0
1.2
1.41.6
1.8
2001 02 03 04 05 06 07 08 09
North America
Europe and Russia
Asia
Ratio
0
1
2
3
4
5
6
2001 02 03 04 05 06 07 08 09
North America
Europe and Russia
Asia
Ratio
80%
2%2%
0%0%
16%
NYSE NYSE/ArcaNASDAQ BATSDirectEdge Other inc. dark and OTC
24%
11%
15%9%
9%
33%
NYSE NYSE/Arca
NASDAQ BATS
DirectEdge Other inc. dark and OTC
8/6/2019 The Race to Zero : Speech by Andrew Haldane
http://slidepdf.com/reader/full/the-race-to-zero-speech-by-andrew-haldane 23/25
All speeches are available online at www.bankofengland.co.uk/publications/speeches
23
23
Chart 5: FTSE 100 trading volume shares, June2008
Chart 6: FTSE 100 trading volume shares, June2011
Source: Fidessa. Source: Fidessa.
Chart 7: Access to multiple trading venues byEuropean HFTs
Chart 8: Median end-of-day bid-ask spread forlargest 20 stocks in FTSE 100 as a proportion ofrealised volatility (a)
Source: Automated Trader.Notes: Survey among 171 high frequency traders.
Source: Thomson Reuters Datastream.(a) 22 day average. Largest stocks by market capitalisation. Selectedstocks updated annually.
66%
9%
0.1%
0.3%
25%
LSE Chi-X Dark SI OTC
29%
13%
4%4%
0%0%
2%3%
45%
LSE Chi-XBats Europe TurquoiseNyse Arca EquiductDark SIOTC
0 5 10 15 20 25 30 35
1 liquidity venue
2 liquidity venues
up to 5 liq uidity venues
up to 10 liquidity venues
up to 20 liquidity venues
over 20 liquidity venues
Per cent
0
0.01
0.02
0.03
0.04
0.05
0.06
0.07
99 00 01 02 03 04 05 06 07 08 09 10 11
Percentage points

8/6/2019 The Race to Zero : Speech by Andrew Haldane
http://slidepdf.com/reader/full/the-race-to-zero-speech-by-andrew-haldane 24/25
All speeches are available online at www.bankofengland.co.uk/publications/speeches
24
24
Chart 9: Volatility and correlation of S&P 500 Chart 10: Excess volatility
Source: JP Morgan and Bank calculations. Source: JP Morgan and Bank calculations.
Chart 11: Simulated price series under differentHurst coefficients
Chart 12: Distribution of simulated returns atdifferent time horizons with H=0.9 (a)
Source: Bank of England. Source: Bank of England(a) Returns at different time horizons have been scaled by theinverse of the square root of time, 1/sqrt(T).
0%
10%
20%
30%
40%
50%60%
70%
0% 10% 20% 30% 40% 50%S&P 500 1Y volatili ty
S&P 500 1Y Correlation
1990 - 2004
2005 - 2010
0
10
20
30
40
50
60
20
15
10
5
0
5
10
15
20
90 92 94 96 98 00 02 04 06 08
Excess co rrelation (LHS)
1yr Correltaion (LHS)
1yr Volatility (RHS)
Per centPer cent
-
+
100
80
60
40
20
0
20
40H=0.5H=0.7H=0.9
-
+
Time
T=1
T=20
T=50
- +
8/6/2019 The Race to Zero : Speech by Andrew Haldane
http://slidepdf.com/reader/full/the-race-to-zero-speech-by-andrew-haldane 25/25
All speeches are available online at www bankofengland co uk/publications/speeches
25
25
Chart 13: Difference in maximum and minimum price ofGE shares across different exchanges on 06 May 2010
Source: NANEX.
Notes: Difference in bid prices across NASDAQ, NYSE and Pacific Exchange.
Table 1: Round-trip latencies for selected exchanges, April 2010
Exchange Average round-trip latency (microseconds)
Nasdaq OMX INET 250
Bats Europe 270Chi-X Europe 400
NYSE Arca 900
LSE Tradelect 2000
TSE Assowhead 5000Source: http://mondivisione.com via AFM 2010.
0.00
0.05
0.10
0.15
0.20
0.25
0.30
0.35
0.40
14:41 14:43 14:45 14:47 14:49
Price di fference ($)
Time