anamika mam (1).ppt
15
Presented by: Jyoti Sharma Kshipra Joshi 1
-
Upload
krishna-yadav -
Category
Documents
-
view
213 -
download
0
Transcript of anamika mam (1).ppt

7/27/2019 anamika mam (1).ppt
http://slidepdf.com/reader/full/anamika-mam-1ppt 1/15
Presented by:Jyoti SharmaKshipra Joshi
1

7/27/2019 anamika mam (1).ppt
http://slidepdf.com/reader/full/anamika-mam-1ppt 2/15
Meaning
Methods
Quantitative tech. meaning
Approaches of quant. Tech. Trend analysis
Example
Work study tech.
Example
Advantages
Disadvantages
2

7/27/2019 anamika mam (1).ppt
http://slidepdf.com/reader/full/anamika-mam-1ppt 3/15
Human resource forecasting is the process
of estimating the future quantity and
quality required.
It depends on the scale of operations of
the organization over that period of time.
3

7/27/2019 anamika mam (1).ppt
http://slidepdf.com/reader/full/anamika-mam-1ppt 4/15
4
HR Forecasting Methods
Quantitative Methods
Qualitative Methods
Forecasting Methods

7/27/2019 anamika mam (1).ppt
http://slidepdf.com/reader/full/anamika-mam-1ppt 5/15
These are statistical and operation research or
programming techniques which helps in
decision making process specially concerning
business and industry. Quantitative approaches utilize mathematical
procedures to predict requirements.
5

7/27/2019 anamika mam (1).ppt
http://slidepdf.com/reader/full/anamika-mam-1ppt 6/15
[a]. Forecasts based on historical data
Naive methods
Moving average
Work study techniques
Trend analysis
[b]. Associative (causal) forecasts
Regression Analysis
Venture technique
6

7/27/2019 anamika mam (1).ppt
http://slidepdf.com/reader/full/anamika-mam-1ppt 7/15
Forecasts employment requirements on the basis of some organizational index and is one
of the most commonly used approaches for
projecting HR demand.
It involves the following steps:
1. Select an appropriate business factor. This
should be the best available predictor of
human resources needs.
7

7/27/2019 anamika mam (1).ppt
http://slidepdf.com/reader/full/anamika-mam-1ppt 8/15
2. Plot a historical trend of the business factor
in relation to number of employees
3. Compare the productivity ratio for at least
the past five years
4. Calculate human resources demand bydividing the business factor by the
productivity ratio.
5. Finally, project human resources demand outto the target year.
8

7/27/2019 anamika mam (1).ppt
http://slidepdf.com/reader/full/anamika-mam-1ppt 9/159
Example of Trend Analysis of HR
Demand
2001 $2,351 14.33 164
2002 $2,613 11.12 235
2003 $2,935 8.34 352
2004 $3,306 10.02 330
2005 $3,613 11.12 325
2006 $3,748 11.12 337
2007 $3,880 12.52 310
2008* $4,095 12.52 327
2009* $4,283 12.52 342
2010* $4,446 12.52 355
BUSINESS LABOR = HUMAN RESOURCES
FACTOR PRODUCTIVITY DEMANDYEAR (SALES IN THOUSANDS) (SALES/EMPLOYEE) (NUMBER OF EMPLOYEES)

7/27/2019 anamika mam (1).ppt
http://slidepdf.com/reader/full/anamika-mam-1ppt 10/1510
Work-Study Technique
Work-study techniques can be used when it is possible to apply work measurement to calculatethe length of operations and the amount of labor required.
The budgets of productive hours per unit of output are then multiplied by the planned volumeof units to be produced to give the total number of planned hours for the period.
This is then divided by the number of actualworking hours for an individual operator to showthe number of operators required.
7/27/2019 anamika mam (1).ppt
http://slidepdf.com/reader/full/anamika-mam-1ppt 11/15
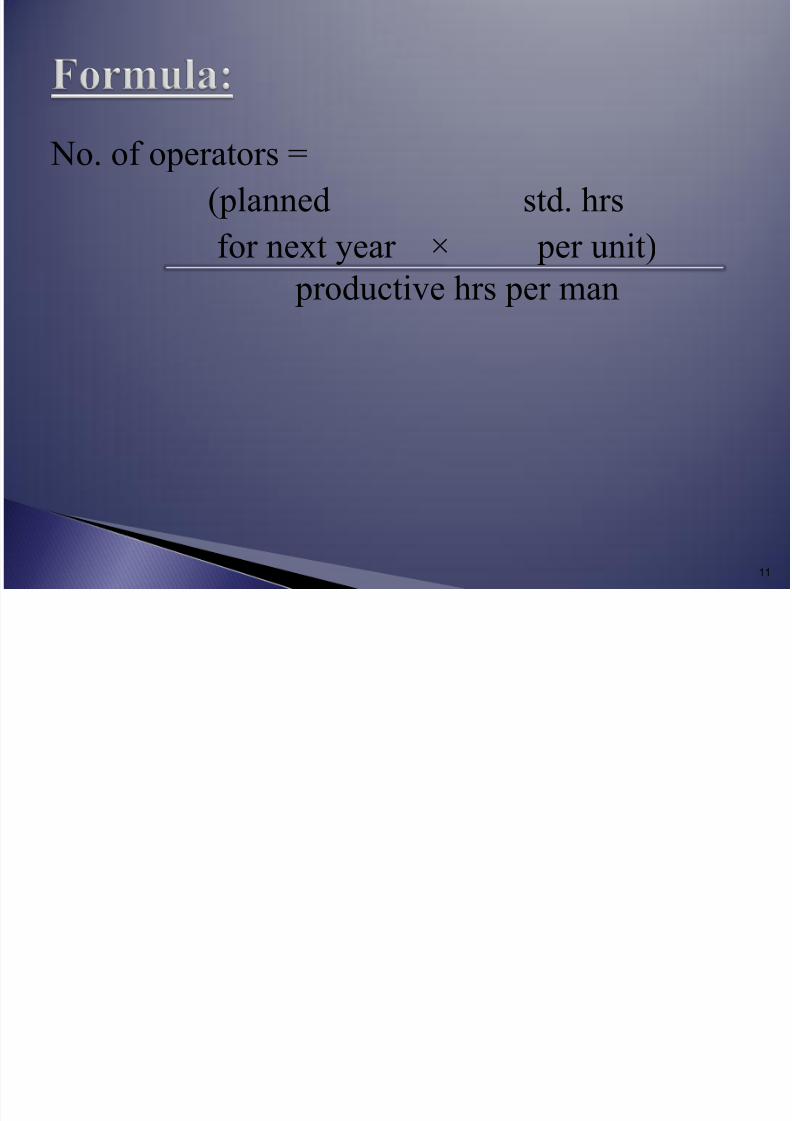
No. of operators =
(planned std. hrs
for next year × per unit)
productive hrs per man
11

7/27/2019 anamika mam (1).ppt
http://slidepdf.com/reader/full/anamika-mam-1ppt 12/15
Planned output for next year= 20000 units
Std. hrs. per unit = 5
Productive hrs per man = 2000
Then
no. of operators requires = 50
12

7/27/2019 anamika mam (1).ppt
http://slidepdf.com/reader/full/anamika-mam-1ppt 13/15
•Simplicity.
•Data easily available.
•Easily explained to managers.
•Easily prepared by HR planners.
13
7/27/2019 anamika mam (1).ppt
http://slidepdf.com/reader/full/anamika-mam-1ppt 14/15
•Mathematical complexity.
•Requires large sample sizes.
•Relies on past data.
•May not be accurate in individual cases.
14

7/27/2019 anamika mam (1).ppt
http://slidepdf.com/reader/full/anamika-mam-1ppt 15/15
15