Analyzing the Texas Projection Measure for Use with ...
18
Analyzing the Texas Projection Measure for Use with Spanish and Cross-Language TAKS Examinees Fall 2009 Updated Spring 2011 Background The Texas Projection Measure (TPM) as implemented in 2009 required students to have (at a minimum) valid reading and mathematics scores within the same language version 1 of the TAKS. Students testing in English were projected to English outcomes and students testing in Spanish were projected to Spanish outcomes. One frequently asked question fielded from districts after TPM results were reported was why students in grades 3-5 who took TAKS reading and mathematics in different languages (referred to as cross-language examinees in this document) did not receive TPM projections. This document describes several analyses used to evaluate the feasibility of developing separate cross-language TPM equations. First, the n-counts for each cohort of cross-language examinees in grades 3 – 5 is examined, because it is not possible to develop stable TPM equations when n-counts are small. Second, analyses are provided that compare the accuracy of cross-language TPM projections to the accuracy of English and Spanish-language TPM projections. Finally, factors that impact policy decisions about how the TPM is used with students testing in Spanish in at least one subject area are described. The purpose of this document is to present the empirical results to inform policy considerations for using TPM with Spanish and cross-language examinees starting in spring 2010. Discussion Questions 1. Given the data presented concerning n-counts and accuracy comparisons, should TPM be reported for certain cross-language combinations, subjects, and grades? 2. If so, for which grades and subjects, where TPM models are feasible, should TPM projections be implemented starting in 2010? 3. For Spanish and cross-language testers in grades 3 and 4, what factors should be considered in determining whether to project to grade 5 English or Spanish language assessments for CSR reporting and for use in state and federal accountability calculations? 4. What strategies should the state implement in communicating these changes and new measures to districts and parents? 1 Through spring 2009 Spanish versions of TAKS were administered in grades 3-6. By Texas law, Spanish versions will be available only through grade 5 beginning in spring 2010. 1
Transcript of Analyzing the Texas Projection Measure for Use with ...

Analyzing the Texas Projection Measure for Use with Spanish and Cross-Language TAKS Examinees
Fall 2009 Updated Spring 2011
Background The Texas Projection Measure (TPM) as implemented in 2009 required students to have (at a minimum) valid reading and mathematics scores within the same language version1 of the TAKS. Students testing in English were projected to English outcomes and students testing in Spanish were projected to Spanish outcomes. One frequently asked question fielded from districts after TPM results were reported was why students in grades 3-5 who took TAKS reading and mathematics in different languages (referred to as cross-language examinees in this document) did not receive TPM projections.
This document describes several analyses used to evaluate the feasibility of developing separate cross-language TPM equations. First, the n-counts for each cohort of cross-language examinees in grades 3 – 5 is examined, because it is not possible to develop stable TPM equations when n-counts are small. Second, analyses are provided that compare the accuracy of cross-language TPM projections to the accuracy of English and Spanish-language TPM projections. Finally, factors that impact policy decisions about how the TPM is used with students testing in Spanish in at least one subject area are described. The purpose of this document is to present the empirical results to inform policy considerations for using TPM with Spanish and cross-language examinees starting in spring 2010.
Discussion Questions 1. Given the data presented concerning n-counts and accuracy
comparisons, should TPM be reported for certain cross-language combinations, subjects, and grades?
2. If so, for which grades and subjects, where TPM models are feasible, should TPM projections be implemented starting in 2010?
3. For Spanish and cross-language testers in grades 3 and 4, what factors should be considered in determining whether to project to grade 5 English or Spanish language assessments for CSR reporting and for use in state and federal accountability calculations?
4. What strategies should the state implement in communicating these changes and new measures to districts and parents?
1 Through spring 2009 Spanish versions of TAKS were administered in grades 3-6. By Texas law, Spanish versions will be available only through grade 5 beginning in spring 2010.
1

Table 1. Possible TAKS Cross-Language Combinations Taken by Students in Grade 3
Language and Subject Projected To Grade 5
Reading Language Predictor in Grade 3
Mathematics Language Predictor in Grade 3
English Reading English Spanish
Spanish English
English Mathematics English Spanish
Spanish English
Spanish Reading English Spanish
Spanish English
Spanish Math English Spanish
Spanish English
N-Count Analyses The first set of analyses examines the numbers of cross-language testers in grades 3 through 5. The first step in the analysis was determining whether there were sufficient numbers of cross-language examinees for each of the combinations presented in Tables 1–3 to generate stable regression coefficients going forward. For the purpose of this analysis, a minimum size requirement of 1,000 students who had a 2009 TAKS outcome score and cross-language predictors was set. The minimum size was chosen based on suggested guidelines of 50 level 2 units (i.e., schools) with 20 level 1 units (i.e., students) per level 2 unit for multilevel models (Hox, 1998). Further research by Bell, Ferron, and Kromrey (2008) suggests that smaller numbers of level 1 units per level 2 unit are not a problem if the number of level 2 units is large. Therefore, 1,000 students seems to be a sufficient sample size whether there are 50 schools with 20 students each or, more likely, a larger number of schools with fewer than 20 students each.
2

Table 3. Possible TAKS Cross-Language Combinations Taken by Students in Grade 5
Language and Subject Projected To Grade 8
Reading Language Predictor in Grade 5
Mathematics Language Predictor in Grade 5
Science Predictor in Grade 5
English Reading English Spanish
Spanish English
English Mathematics English Spanish
Spanish English
English Science
English Spanish English
English Spanish Spanish
English English Spanish
Spanish English English
Spanish English Spanish
Spanish Spanish English
Table 2. Possible TAKS Cross-Language Combinations Taken by Students in Grade 4
Grade, Language and Subject
Projected To Reading Language
Predictor in Grade 4
Mathematics Language
Predictor in Grade 4
Writing Language
Predictor in Grade 4
Grade 5 English Reading English Spanish
Spanish English
Grade 5 English Mathematics English Spanish
Spanish English
Grade 5 Spanish Reading English Spanish
Spanish English
Grade 5 Spanish Math English Spanish
Spanish English
Grade 7 English Writing
English Spanish English
English Spanish Spanish
English English Spanish
Spanish English English
Spanish English Spanish
Spanish Spanish English
An example of a cross-language cohort with a sufficient number of students to generate stable TPM coefficients is the cohort that took Spanish reading and English mathematics in grade 4 in 2008, and Spanish reading in grade 5 in 2009, which had 1,043 students (see Table 5). That cohort of students was included in the analyses. By contrast, there were only 37 students who took
3

English reading and Spanish mathematics in grade 4 in 2008, and Spanish reading in grade 5 in 2009. That cohort of students was eliminated from the analysis.
Projection Accuracy Analyses Once the cohorts with sufficient sample sizes were identified, the second set of analyses examined the accuracy of TPM projections for eligible grade 4 cross-language cohorts. Classification analyses focused on the cohort of students testing in the primary administration in grade 4 in 2008, who would be projected to grade 5 in 2009, because this cohort represents the most current cohort for whom classification accuracy results could be verified. This cohort also enabled a direct comparison of TPM projection accuracy among the cross-language, Spanish language, and English language cohorts. Given that the types of students in each grade differ in terms of performance and student characteristics, the extent to which the results of the analysis for grade 4 are likely to generalize to grades 3 and 5 is not known. Therefore, classification analyses will be conducted on grades 3 and 5 as data for these analyses become available.
In order to complete the classification accuracy analysis, regression coefficients were generated using the TPM with a cohort of students who were in grade 4 in 2007 and grade 5 in 2008. The resulting coefficients were used to project future scores for the cohort of students who were in grade 4 in 2008. The last step of the analysis examined the accuracy of the projections, which focused on projections in 2008 compared with observed scores in 2009.
Projection Projected Projection Equations Scores Accuracy Developed Generated Evaluated
from for 2008 for 2009 2007-2008 Grade 4 Grade 5
Cohort Cohort Cohort Figure 1. TPM Equation Development, Application, and Evaluation Process
Projection accuracy was evaluated in two ways. First, the accuracy of the Met Standard and Did Not Meet Standard performance level classifications was analyzed by comparing 2008 projections for grade 4 students with the grade 5 observed scores for those same students in 2009. Second, the mean projected scores from 2008 were compared with the mean observed scores from 2009. Note that projections were made using the horizontal scale, or score system in which Met Standard is represented by a 2100 scale score. Students projected to score 2100 or greater were defined as Meeting TPM in these analyses, since the Met Standard cut point in 2009 was 2100. Starting in 2010, performance standards in some grades and subjects will be slightly increased based on the
4

implementation of the vertical scale and the standards review meetings from 2008. See http://www.tea.state.tx.us/index3.aspx?id=3818&menu_id3=793 for more information about the vertical scale and revised performance standards. Results of all analyses are presented below.
N-Count Results Results of the analyses that evaluated sample sizes for cross-language testers are found in Tables 4–6. The results illustrate that the sample sizes for the cross-language testers in Spanish reading and English mathematics were larger than the sample sizes for testers in English reading and Spanish mathematics across all combinations listed in Tables 1–3. In other words, the more typical cross-language testing combination was for students to take reading in Spanish and mathematics in English. Furthermore, sample sizes of cross-language testers taking English reading and Spanish mathematics were not sufficiently large to generate stable TPM coefficients for any of the combinations listed.
The cross-language combination of Spanish reading and English mathematics had sufficient sample sizes to generate projections to English reading and English mathematics for grades 3, 4, and 5 (see Tables 4–6). In addition, the grade 4 cross-language combination of Spanish reading and English mathematics had sufficient sample sizes to generate projections to grade 5 Spanish reading and grade 7 writing (see Table 5). There were insufficient numbers of grade 4 cross-language testers to generate projections to grade 5 Spanish mathematics or grade 5 cross language testers to generate projections to grade 8 science (see Tables 5 and 6).
Table 4. Sample Sizes for 2007 Grade 3 Cross-Language Combinations
Language and Subject
Projected To Grade 5
Reading Language Predictor in Grade
3
Mathematics Language
Predictor in Grade 3
N-Count
English Reading English Spanish 133
Spanish English 1998
English Mathematics English Spanish 126
Spanish English 2418
Spanish Reading English Spanish 7
Spanish English 435
Spanish Math English Spanish 18
Spanish English 42
Note: Bolded values represent sufficient sample size to generate reliable TPM coefficients.
5

Table 5. Sample Sizes for 2008 Grade 4 Cross-Language Combinations
Grade, Language and Subject
Projected To
Reading Language
Predictor in Grade 4
Mathematics Language Predictor in Grade 4
Writing Language
Predictor in Grade 4 N-Count
Grade 5 English Reading English Spanish 202
Spanish English 2186
Grade 5 English
Mathematics
English Spanish 184
Spanish English 3132
Grade 5 Spanish Reading English Spanish 37
Spanish English 1043
Grade 5 Spanish Math English Spanish 56
Spanish English 108
Grade 7 English Writing
English Spanish English 32
English Spanish Spanish 90
English English Spanish 816
Spanish English English 71
Spanish English Spanish 1400
Spanish Spanish English 79
Note: Bolded values represent sufficient sample size to generate reliable TPM coefficients.
Table 6. Sample Sizes for 2006 Grade 5 Cross-Language Combinations
Language and Subject Projected To Grade 8
Reading Language Predictor in Grade 5
Mathematics Language Predictor in Grade 5
Science Predictor in Grade
5 N-Count
English Reading English Spanish 121
Spanish English 1141
English Mathematics English Spanish 121
Spanish English 1136
English Science
English Spanish English 83
English Spanish Spanish 30
English English Spanish 71
Spanish English English 761
Spanish English Spanish 300
Spanish Spanish English 542
Note: Bolded values represent sufficient sample size to generate reliable TPM coefficients.
6

Projection Accuracy Results Figures 2–4 on the following pages graphically present some of the projection accuracy results. Note that English predictors mean that the reading and mathematics scores used to make the projection were both from English TAKS, Spanish predictors mean that the reading and mathematics scores are in Spanish, and the cross-language predictors indicate grade 4 reading scores from Spanish TAKS and grade 4 mathematics scores from English TAKS. These results are presented in summary form in Table 7 below and in more detail in Appendices A and B.
Table 7. Summary of TPM Projection Accuracy Analyses with Cross-Language Testers
Grade From Grade To
Projection Subject
Group N Projected Mean
Observed Mean
Difference Accuracy (%)
Grade 4 to Grade 5 English
Reading All Students 2186 2132.02 2119.17 12.85 76
Grade 4 to Grade 5 English
Mathematics All Students 3132 2255.84 2256.34 -0.50 85
Grade 4 to Grade 5 Spanish
Reading All Students 1043 2183.53 2164.14 19.39 80
Results of the projection accuracy analyses indicated that the percentages of accurate classifications based on projections ranged from 76% to 85%, with the highest classification accuracy percentage in English mathematics (see Appendix A). The lowest classification accuracy percentage was in English reading (see Appendix A). The magnitude of the mean difference between projected and observed scores was smaller than 20 scale score points for all comparisons. For mathematics, the mean difference was -0.50, meaning that the observed scores were half of a scale score point higher than the projected scores. The mean projected and observed scores for this subject were remarkably similar. For English reading, the mean projected score was approximately 13 scale score points higher than the mean observed score for these students. For Spanish reading, the mean projected score was approximately 19 scale score points higher than the mean observed score for these students. The mean differences in projections compared with observed scores were quite small, given that a student’s score in a given year (as defined by the conditional standard error) can vary by 60-70 scale score points by chance alone.
When projections were inaccurate, over projections were more common than under projections. In general, students were more likely to be projected to meet the standard without actually meeting it (see Appendix A). Furthermore, the mean projected scores were slightly higher than the mean observed scores when projecting reading results (see Appendix B).
7

Figure 2. TPM Projection Accuracy 2008 to 2009 for English-Language and Cross-Language Predictors.
TPM Projection Accuracy 2008 to 2009 for Cross-
Language and English Language Predictors
76.03%
85.09% 88.89% 89.39%
0.00%
10.00%
20.00%
30.00%
40.00%
50.00%
60.00%
70.00%
80.00%
90.00%
100.00%
Grade 4-5 Reading Grade 4-5 Math
Cross-Language Predictors English Predictors
Note. The yellow bar represents projection accuracy for students who took TAKS grade 4 reading in Spanish and mathematics in English. The blue bar represents projection accuracy for students who took TAKS grade 4 reading and mathematics in English.
8

Predictors
Figure 3. TPM Projection Accuracy 2008 to 2009 for Cross-Language and Spanish-Language Predictors.
TPM Projection Accuracy 2008 to 2009 for Cross– Language and Spanish-Language
80.06% 78.86%
0.00%
10.00%
20.00%
30.00%
40.00%
50.00%
60.00%
70.00%
80.00%
90.00%
100.00%
Grade 4 to 5 Reading
Cross-Language Predictors Spanish Predictors
Note. The yellow bar represents projection accuracy for students who took TAKS grade 4 reading in Spanish and mathematics in English. The blue bar represents projection accuracy for students who took TAKS grade 4 reading and mathematics in Spanish.
9
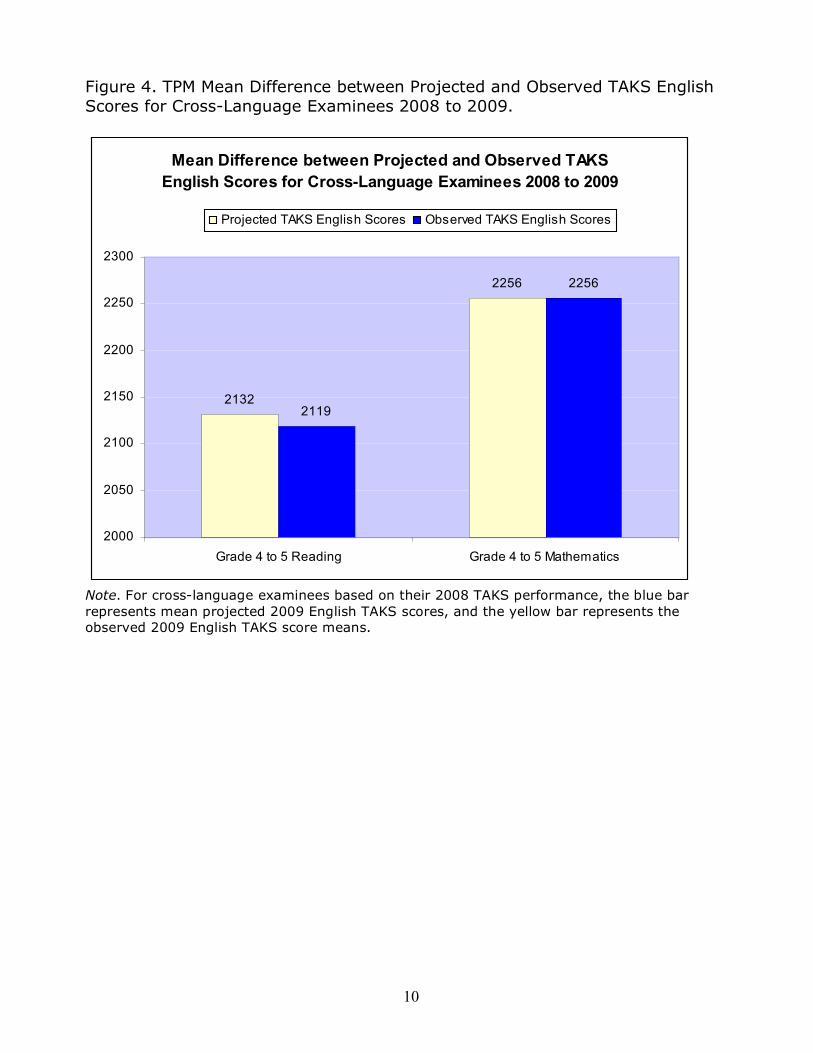
Figure 4. TPM Mean Difference between Projected and Observed TAKS English Scores for Cross-Language Examinees 2008 to 2009.
Mean Difference between Projected and Observed TAKS
English Scores for Cross-Language Examinees 2008 to 2009
2132
2256
2119
2256
2000
2050
2100
2150
2200
2250
2300
Grade 4 to 5 Reading Grade 4 to 5 Mathematics
Projected TAKS English Scores Observed TAKS English Scores
Note. For cross-language examinees based on their 2008 TAKS performance, the blue bar represents mean projected 2009 English TAKS scores, and the yellow bar represents the observed 2009 English TAKS score means.
10

Mean Difference between Projected and Observed TAKS
Spanish Scores for Cross-Language Examinees 2008 to 2009
2184
2164
2000
2050
2100
2150
2200
2250
2300
Grade 4 to 5 Reading
Projected TAKS Spanish Scores Observed TAKS Spanish Scores
Figure 5. TPM Mean Difference between Projected and Observed TAKS Spanish Scores for Cross-Language Examinees 2008 to 2009.
Note. For students under the cross-language model based on their 2008 TAKS performance, the blue bar represents mean projected 2009 Spanish TAKS scores, and the yellow bar represents the observed 2009 Spanish TAKS score means.
Summary of Analyses Results of the analyses on cross-language testers suggest that there are sufficient numbers of students who take Spanish reading and English mathematics to generate stable TPM projections from grades 3 and 4 to grade-5 English reading and mathematics, and from grade 5 to grade 8 English reading and mathematics. There are also sufficient numbers to project from grade 4 to grade 5 Spanish reading and grade-7 writing. The sample sizes do not appear to support projections from grade 3 to grade 5 Spanish reading or mathematics, nor from grade 5 to grade 8 science.
Results also indicate that there are insufficient numbers of cross-language examinees who take the combination of English TAKS reading and Spanish TAKS mathematics to generate stable TPM equations. In sum, it would be feasible to generate TPM equations in 2010 for the following students. Table 8 illustrates all combinations of testers who take at least one TAKS in Spanish and the ability to generate TPM for each combination.
11

• Grade 3 students testing in Spanish reading and English mathematics to:
o Grade 5 English reading o Grade 5 English mathematics
• Grade 4 students testing in Spanish reading and English mathematics to:
o Grade 5 English reading o Grade 5 English mathematics o Grade 5 Spanish reading o Grade 7 writing (with grade 4 Spanish writing)
• Grade 5 students testing in Spanish reading and English mathematics to:
o Grade 8 reading o Grade 8 mathematics
Projection accuracy results indicate that cross-language projections to English reading and mathematics will not be as accurate as projections generated from two TAKS English scores; however, cross-language projections to Spanish reading appear to be comparable in accuracy to projections generated from two TAKS Spanish scores.
Discussion Questions
1. Given the data presented concerning n-counts and accuracy comparisons, should TPM be reported for certain cross-language combinations, subjects, and grades?
2. If so, for which grades and subjects, where TPM models are feasible, should TPM projections be implemented starting in 2010?
The analyses conducted evaluating TPM for cross-language testers indicates that TPM equations are feasible for:
• Grade-3 students testing in Spanish reading and English mathematics to:
o Grade-5 English reading o Grade-5 English mathematics
• Grade-4 students testing in Spanish reading and English mathematics to:
o Grade-5 English reading o Grade-5 English mathematics o Grade-5 Spanish reading o Grade-7 writing
• Grade-5 students testing in Spanish reading and English mathematics to:
o Grade-8 reading o Grade-8 mathematics
12

Should the state add the TPM equations for these grades and subjects?
3. For Spanish and cross-language testers in grades 3 and 4, what factors should be considered in determining whether to project to grade 5 English or Spanish language assessments for CSR reporting and for use in state and federal accountability calculations?
It is not possible to make decisions about a student’s grade 5 language of testing in grade 3 or 4. State Board of Education rules require language proficiency assessment committees (LPACs) to make decisions about the language of testing on an individual student basis in accordance with the language that provides the most appropriate measure of the student’s academic progress. The vast majority of students who take TAKS in Spanish are in bilingual education programs, which are designed to gradually transition students from receiving the majority of academic instruction in Spanish to the majority of academic instruction in English as they learn English.
Given that it is not possible to know the grade 5 language of testing of a student in grade 3 or 4, the following factors might be used to inform policy decisions about whether to use Spanish-language or English-language projections in grade 5:
1. The grade 5 language version typically taken by these students 2. The differences in projection results for these students to the grade
5 English and Spanish versions, or the extent to which projections are greater for one language version or the other.
3. TPM equation availability for students taking any TAKS assessment in Spanish
Note that in spring 2009 a policy decision was made to project the results of students who took all tests in Spanish in grades 3 and 4 to grade 5 Spanish for student reporting and accountability purposes. Though TPM equations were made available on an electronic data file to districts so that they could make local projections from grades 3 and 4 Spanish testers to English language versions in grade 5, the projections to Spanish were used by the state.
Analyses indicate that more grade 3 and 4 Spanish and cross-language testers take English TAKS in grade 5. However, some students continue to test in Spanish in grade 5. See Table 8 for results of analyses evaluating the grade 5 language version taken by grade 3 and 4 students.
An evaluation of the TPM equations for Spanish testers in grades 3 and 4 indicate that in reading, more students are projected to meet the standard when the projections are to grade 5 Spanish rather than to grade 5 English. In contrast, for mathematics, more Spanish testers in grades 3 and 4 are projected to meet the standard when the projections are to grade 5 English.
13
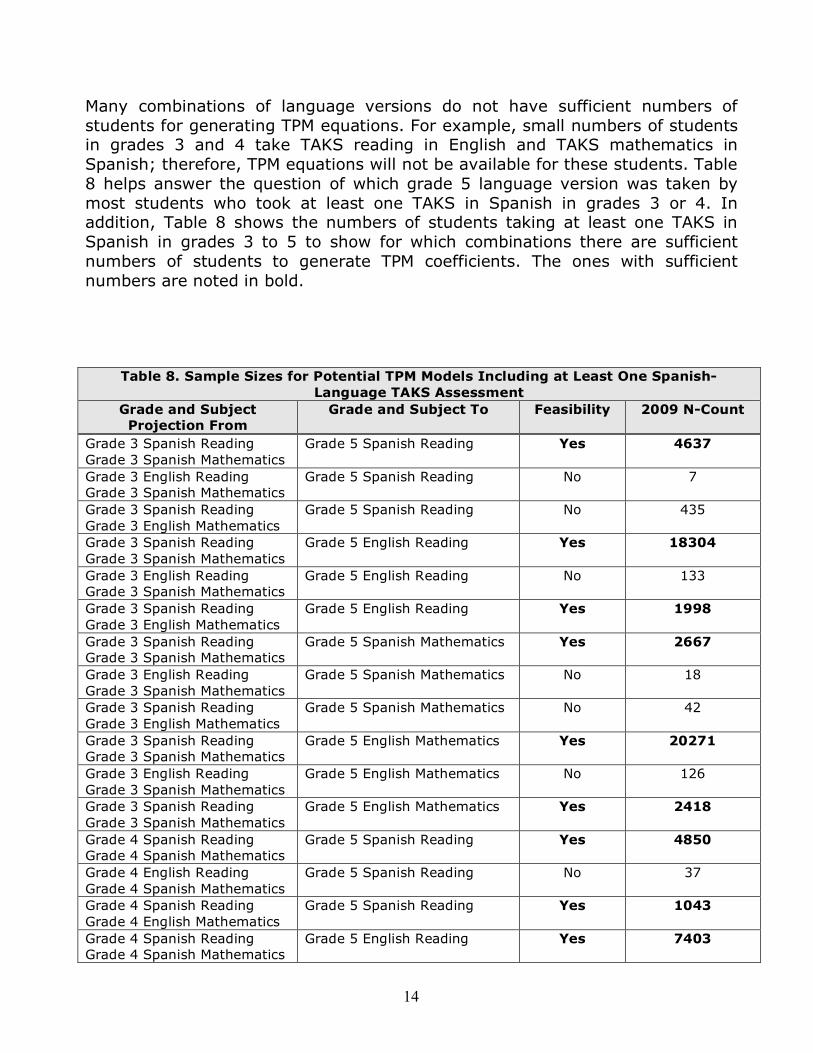
Many combinations of language versions do not have sufficient numbers of students for generating TPM equations. For example, small numbers of students in grades 3 and 4 take TAKS reading in English and TAKS mathematics in Spanish; therefore, TPM equations will not be available for these students. Table 8 helps answer the question of which grade 5 language version was taken by most students who took at least one TAKS in Spanish in grades 3 or 4. In addition, Table 8 shows the numbers of students taking at least one TAKS in Spanish in grades 3 to 5 to show for which combinations there are sufficient numbers of students to generate TPM coefficients. The ones with sufficient numbers are noted in bold.
Table 8. Sample Sizes for Potential TPM Models Including at Least One Spanish-Language TAKS Assessment
Grade and Subject Projection From
Grade and Subject To Feasibility 2009 N-Count
Grade 3 Spanish Reading Grade 3 Spanish Mathematics
Grade 5 Spanish Reading Yes 4637
Grade 3 English Reading Grade 3 Spanish Mathematics
Grade 5 Spanish Reading No 7
Grade 3 Spanish Reading Grade 3 English Mathematics
Grade 5 Spanish Reading No 435
Grade 3 Spanish Reading Grade 3 Spanish Mathematics
Grade 5 English Reading Yes 18304
Grade 3 English Reading Grade 3 Spanish Mathematics
Grade 5 English Reading No 133
Grade 3 Spanish Reading Grade 3 English Mathematics
Grade 5 English Reading Yes 1998
Grade 3 Spanish Reading Grade 3 Spanish Mathematics
Grade 5 Spanish Mathematics Yes 2667
Grade 3 English Reading Grade 3 Spanish Mathematics
Grade 5 Spanish Mathematics No 18
Grade 3 Spanish Reading Grade 3 English Mathematics
Grade 5 Spanish Mathematics No 42
Grade 3 Spanish Reading Grade 3 Spanish Mathematics
Grade 5 English Mathematics Yes 20271
Grade 3 English Reading Grade 3 Spanish Mathematics
Grade 5 English Mathematics No 126
Grade 3 Spanish Reading Grade 3 Spanish Mathematics
Grade 5 English Mathematics Yes 2418
Grade 4 Spanish Reading Grade 4 Spanish Mathematics
Grade 5 Spanish Reading Yes 4850
Grade 4 English Reading Grade 4 Spanish Mathematics
Grade 5 Spanish Reading No 37
Grade 4 Spanish Reading Grade 4 English Mathematics
Grade 5 Spanish Reading Yes 1043
Grade 4 Spanish Reading Grade 4 Spanish Mathematics
Grade 5 English Reading Yes 7403
14

Grade and Subject Projection From
Grade and Subject To Feasibility 2009 N-Count
Grade 4 English Reading Grade 4 Spanish Mathematics
Grade 5 English Reading No 202
Grade 4 Spanish Reading Grade 4 English Mathematics
Grade 5 English Reading Yes 2186
Grade 4 Spanish Reading Grade 4 Spanish Mathematics
Grade 5 Spanish Mathematics Yes 3180
Grade 4 English Reading Grade 4 Spanish Mathematics
Grade 5 Spanish Mathematics No 56
Grade 4 Spanish Reading Grade 4 English Mathematics
Grade 5 Spanish Mathematics No 108
Grade 4 Spanish Reading Grade 4 Spanish Mathematics
Grade 5 English Mathematics Yes 9049
Grade 4 English Reading Grade 4 Spanish Mathematics
Grade 5 English Mathematics No 184
Grade 4 Spanish Reading Grade 4 English Mathematics
Grade 5 English Mathematics Yes 1332
Grade 4 Spanish Reading Grade 4 Spanish Mathematics Grade 4 Spanish Writing
Grade 7 English Writing Yes 13042
Grade 4 English Reading Grade 4 Spanish Mathematics Grade 4 Spanish Writing
Grade 7 English Writing No 90
Grade 4 English Reading Grade 4 Spanish Mathematics Grade 4 English Writing
Grade 7 English Writing No 32
Grade 4 English Reading Grade 4 English Mathematics Grade 4 Spanish Writing
Grade 7 English Writing No 816
Grade 4 Spanish Reading Grade 4 Spanish Mathematics Grade 4 English Writing
Grade 7 English Writing No 79
Grade 4 Spanish Reading Grade 4 English Mathematics Grade 4 Spanish Writing
Grade 7 English Writing Yes 1400
Grade 4 Spanish Reading Grade 4 English Mathematics Grade 4 English Writing
Grade 7 English Writing No 71
Grade 5 Spanish Reading Grade 5 Spanish Mathematics
Grade 8 English Reading Yes 4522
Grade 5 English Reading Grade 5 Spanish Mathematics
Grade 8 English Reading No 121
Grade 5 Spanish Reading Grade 5 English Mathematics
Grade 8 English Reading Yes 1141
Grade 5 Spanish Reading Grade 5 Spanish Mathematics
Grade 8 English Mathematics Yes 4445
Grade 5 English Reading Grade 5 Spanish Mathematics
Grade 8 English Mathematics No 121
Grade 5 Spanish Reading Grade 5 English Mathematics
Grade 8 English Mathematics Yes 1136
Grade 5 Spanish Reading Grade 5 Spanish Mathematics Grade 5 Spanish Science
Grade 8 English Science Yes 3666
15

Grade and Subject Projection From
Grade and Subject To Feasibility 2009 N-Count
Grade 5 English Reading Grade 5 Spanish Mathematics Grade 5 Spanish Science
Grade 8 English Science No 30
Grade 5 English Reading Grade 5 Spanish Mathematics Grade 5 English Science
Grade 8 English Science No 83
Grade 5 English Reading Grade 5 English Mathematics Grade 5 Spanish Science
Grade 8 English Science No 71
Grade 5 Spanish Reading Grade 5 Spanish Mathematics Grade 5 English Science
Grade 8 English Science No 542
Grade 5 Spanish Reading Grade 5 English Mathematics Grade 5 Spanish Science
Grade 8 English Science No 300
Grade 5 Spanish Reading Grade 5 English Mathematics Grade 5 English Science
Grade 8 English Science No 761
Note: Bolded values represent sufficient sample size to generate reliable TPM coefficients.
4. What strategies should the state implement in communicating changes and new measures to districts and parents?
Strategies used to communicate and train on implementation of the TPM are noted below. What other strategies should the state employ?
• Training o Texas Assessment Conference Session o Texas Statewide Network of Assessment Professionals (TSNAP)
Meetings o Texas Association of School Administrators (TASA) conference
sessions o Updates presented at advisory committee meetings, such as
meetings for the District Advisory Committee, the Student Assessment Advisory Committee, the Texas Technical Advisory Committee, the Accountability Focus Group, etc.
• Documentation on the TEA website (http://www.tea.state.tx.us/index3.aspx?id=3688&menu_id3=793)
o TPM frequently asked questions (FAQ) document o TPM and vertical scale training slide shows posted on TEA website o Step-by-step instructions for calculating the TPM o TPM calculator o Sample CSRs with TPM o TPM Blackline Master o Communications about TPM with the United States Department of
Education
16

Appendices
Appendix A. TPM TAKS Classification Accuracy of Cross-Language Examinees 2008 to 2009
Grade From Grade To
Group N Total Projection Accuracy
Accurate Classifications Misclassifications
Projection Subject
Accurate Projections
Inaccurate Projections
Met Standard
Did Not Meet Standard
Met Standard
Did Not Meet
(Under Standard Projection) (Over
Projection)
All Students 2186
(100.00) 1662
(76.03) 524
(23.97) 1041
(47.62) 621
(28.41) 241
(11.02) 283
(12.95) African 3 1 2 1 0 2 0
American (100.00) (33.33) (66.67) (33.33) (0.00) (66.67) (0.00) Grade 4 to Grade 5 Hispanic
2177 (100.00)
1657 (76.11)
520 (23.89)
1037 (47.63)
620 (28.48)
237 (10.89)
283 (13.00)
English Reading White
6 (100.00)
4 (66.67)
2 (33.33)
3 (50.00)
1 (16.67)
2 (33.33)
0 (0.00)
Economically 2049 1556 493 962 594 223 270 Disadvantaged (100.00) (75.94) (24.06) (46.95) (28.99) (10.88) (13.18)
Special 41 34 7 15 19 2 5 Education (100.00) (82.93) (17.07) (36.59) (46.34) (4.88) (12.20)
All Students 3132
(100.00) 2665
(85.09) 467
(14.91) 2308
(73.69) 357
(11.40) 113
(3.61) 354
(11.30) African 3 2 1 1 1 0 1
American (100.00) (66.67) (33.33) (33.33) (33.33) (0.00) (33.33) Grade 4 to Grade 5
Hispanic 3124
(100.00) 2661
(85.18) 463
(14.82) 2305
(73.78) 356
(11.40) 111
(3.55) 352
(11.27) English
Mathematics White 5
(100.00) 2
(40.00) 3
(60.00) 2
(40.00) 0
(0.00) 2
(40.00) 1
(20.00) Economically 2965 2516 449 2169 347 107 342
Disadvantaged (100.00) (84.86) (15.14) (73.15) (11.70) (3.61) (11.53) Special 64 51 13 39 12 2 11
Education (100.00) (79.69) (20.31) (60.94) (18.75) (3.13) (17.19)
17

Appendix A. TPM TAKS Classification Accuracy of Cross-Language Examinees 2008 to 2009 Grade Group N Total Accurate Misclassifications From Projection Accuracy Classifications
Grade To Accurate Inaccurate Met Did Not Met Did Not Meet Projection Projections Projections Standard Meet Standard Standard
Subject Standard (Under (Over projection) projection)
All Students 1043
(100.00) 835
(80.06) 208
(19.94) 636
(60.98) 199
(19.08) 66
(6.33) 142
(13.61) African 2 1 1 1 0 0 1
American (100.00) (50.00) (50.00) (50.00) (0.00) (0.00) (50.00) Grade 4 to Grade 5 Hispanic 1040
(100.00) 833
(80.10) 207
(19.90) 634
(60.96) 199
(19.13) 66
(6.35) 141
(13.56) Spanish Reading White 1
(100.00) 1
(100.00) 0
(0.00) 1
(100.00) 0
(0.00) 0
(0.00) 0
(0.00) Economically 1003 802 201 605 197 62 139
Disadvantaged (100.00) (79.96) (20.04) (60.32) (19.64) (6.18) (13.86) Special 23 17 6 9 8 2 4
Education (100.00) (73.91) (26.09) (39.13) (34.78) (8.70) (17.39)
Appendix B. TPM TAKS Projection Mean Differences and Classification Accuracy for Cross-Language Examinees 2008 to 2009
Grade From Grade To
Projection Subject
Group N Projection Observed
Difference Accuracy
(%) Mean SD Mean SD
Grade 4 to Grade 5 English Reading
All Students 2186
(100.00) 2132.02 105.21 2119.17 166.93 12.85 76
Grade 4 to Grade 5 English
Mathematics All Students 3132
(100.00) 2255.84 157.99 2256.34 223.80 -0.50
85
Grade 4 to Grade 5 Spanish Reading
All Students 1043 (100.00)
2183.53 128.23 2164.14 194.47 19.39 80
18