
Analyzing Information and Writing Reportsmyresource.phoenix.edu/secure/resource/XCOM285R2/… ·...
52
Locker−Kienzler: Business and Administrative Communication, Eighth Edition V. Reports 16. Analyzing Information and Writing Report © The McGraw−Hill Companies, 2008 CHAPTER 16 Analyzing Information and Writing Reports Learning Objectives After studying this chapter, you will know: 1 Ways to analyze data, information, and logic. 2 How to choose information for reports. 3 Different ways to organize reports. 4 How to present information effectively in reports. 5 How to prepare the different components of formal reports.
-
Upload
phungkhanh -
Category
Documents
-
view
216 -
download
2
Transcript of Analyzing Information and Writing Reportsmyresource.phoenix.edu/secure/resource/XCOM285R2/… ·...

Locker−Kienzler: Business and Administrative Communication, Eighth Edition
V. Reports 16. Analyzing Information and Writing Report
© The McGraw−Hill Companies, 2008
C H A P T E R16Analyzing Informationand Writing Reports
Learning ObjectivesAfter studying this chapter, you will know:
1 Ways to analyze data, information, and logic.
2 How to choose information for reports.
3 Different ways to organize reports.
4 How to present information effectively in reports.
5 How to prepare the different components of formal reports.

Locker−Kienzler: Business and Administrative Communication, Eighth Edition
V. Reports 16. Analyzing Information and Writing Report
© The McGraw−Hill Companies, 2008
IN THE NEWS
“Seasonal Fluctuations”: Facts, Spin, and Annual Reports
In 2005, the US Securities and Exchange Com-
mission (SEC) started legal action against the
former CEO and CFO of Kmart Corporation, be-
cause the Management’s Discussion and Analysis
(MD&A) portion of Kmart’s 2001 annual report was
misleading to stockholders. The report explained an
increase in inventory by “seasonal fluctuations” (a
natural part of doing business that stockholders
wouldn’t question) when the
increase was really caused by
one executive’s poor decisions
(which would reflect badly on
the company). Did Kmart’s
CEO and CFO actually write
that report themselves? Proba-
bly not, but they signed off on
the information and certified it as factual, so the
SEC found them liable for the lies.
Kmart isn’t the only corporation whose annual
report has come under heavy scrutiny: in the post-
Enron business world, the SEC now watches corpo-
rate annual reports more closely than ever. The
result? As ReportWatch notes in their 2006 Annual
Report on Annual Reports, many US companies have
replaced descriptive, easy-to-read MD&A sections
with simple “10-K” statements: tables of financial
data taken directly from the Form 10-K that all pub-
licly held US companies must file with the SEC.
These new MD&A’s are factual and detailed, with
no spin and no misleading information, but they
don’t provide much actual information about the
companies’ economic realities.
A good annual report should
do both: it should combine
hard data with the explana-
tions and details that are nec-
essary for your readers to
understand the numbers and
make good decisions about
you and your organization. To
write a good report, you’ll need to know your audi-
ence(s)’ needs, goals, and interests. You’ll also need
to gather data from a variety of sources, interpret
and format that data—using graphics to increase
usability—and collaborate with others to make sure
the final product is factual and reflects your organi-
zation’s goals.
535
“A good report . . . [combines] hard
data with the explanations and details
that are necessary for your readers to
understand the numbers.”
Sources: Amy Borrus, “The SEC: Cracking Down on Spin,” BusinessWeek, September 26, 2005, 94–97; and ReportWatch.net, “Annual Report on AnnualReports 2006,” http://www.reportwatch.net/download/AnnualReport_on_AnnualReports2006.pdf (accessed May 18, 2007).

Locker−Kienzler: Business and Administrative Communication, Eighth Edition
V. Reports 16. Analyzing Information and Writing Report
© The McGraw−Hill Companies, 2008
536 Part 5 Reports
Chapter OutlineUsing Your Time Efficiently
Analyzing Data and Information for Reports
• Identifying the Source of the Data• Analyzing Numbers• Analyzing Words• Analyzing Patterns• Checking Your Logic
Choosing Information for Reports
Organizing Information in Reports
• Basic Patterns for Organizing Information• How to Organize Specific Varieties of Reports
Presenting Information Effectively in Reports
1. Use Clear, Engaging Writing.2. Keep Repetition to a Minimum.3. Introduce Sources and Visuals.4. Use Forecasting, Transitions, Topic Sentences, and Headings.
Writing Formal Reports
• Title Page• Letter or Memo of Transmittal• Table of Contents• List of Illustrations• Executive Summary• Introduction• Background or History• Body• Conclusions and Recommendations
Summary of Key Points
Careful analysis, smooth writing, and effective document design work togetherto make effective reports, whether you’re writing a 21⁄2-page memo report or a250-page formal report complete with all the report components.
Chapter 15 covered the first two steps in writing a report:
1. Define the problem.
2. Gather the necessary data and information.
This chapter covers the last three steps:
1. Analyze the data and information.
2. Organize the information.
3. Write the report.
Using Your Time EfficientlyTo use your time efficiently, think about the parts of the report before you begin writing. Much of the introduction comes from your proposal, with onlyminor revisions. You can write six sections even before you’ve finished yourresearch: Purpose, Scope, Assumptions, Methods, Criteria, and Definitions.

Locker−Kienzler: Business and Administrative Communication, Eighth Edition
V. Reports 16. Analyzing Information and Writing Report
© The McGraw−Hill Companies, 2008
Chapter 16 Analyzing Information and Writing Reports 537
Measure WhatMatters
It sounds obvious:Find out whether your
customers are satisfied, becausesatisfied customers will buy fromyou again and again, helpingyour profits grow. It sounds soobvious that big companies paygenerous fees to researcherswho create sophisticated meas-ures of customer satisfaction.
It sounds obvious, but it’swrong. Frederick Reichheld com-pared consumers’ answers toquestions about customer satis-faction and loyalty with measuresof their actual purchases andtheir memory of referring othersto the company. He found little relationship between stated satis-faction and repeat purchases. Instead, the best predictor of re-peat purchases was a favorableresponse to “How likely is it thatyou would recommend [com-pany X] to a friend or colleague?”People who would recommendthe company were also likely tobuy from it again.
Responses fall into three clus-ters: promoters, defined as thecustomers who were extremelylikely to recommend (choosing 9 or10 on a 10-point scale), those whowere less likely (“passively satis-fied,” at 7 or 8), and the remainderof the customers. The greater theshare of customers who are pro-moters, the faster a company’s rev-enues grow. Over the three yearsstudied, companies with manypromoters included SouthwestAirlines, Earthlink, and Enter-prise Rent-A-Car, and all of themgrew much faster than their com-petitors. Reichheld’s advice tocompanies looking for growth:Skip the fancy questionnaires,and just ask customers if theywill recommend your company.
Adapted from Frederick F. Reichheld,“The One Number You Need toGrow,” Harvard Business Review 81,no. 12 (December 2003): 46–54.
Mock up tables and figures early. Since they provide information on whichyou will base your arguments or explanations, it is important to arrange datalogically and plan how you will use it in the report. As you tally and analyzethe data, prepare your figures and tables, and a complete list of references.The background reading for your proposal can form the first draft of your listof references. Save a copy of your questionnaire or interview questions to useas an appendix. You can print appendixes before the final report is ready ifyou number their pages separately. Appendix A pages would be A-1, A-2,and so forth; Appendix B pages would be B-1, B-2, and so forth.
You can write the title page and the transmittal as soon as you know whatyour recommendation will be.
After you’ve analyzed your data, write the body, the conclusions and rec-ommendations, and the executive summary. Prepare a draft of the table ofcontents and the list of illustrations.
When you write a long report, list all the sections (headings) that your re-port will have. Mark those that are most important to your reader and yourlogic, and spend most of your time on them. Write the important sectionsearly. That way, you won’t spend all your time on Background or History ofthe Problem. Instead, you’ll get to the meat of your report.
Analyzing Data and Information for ReportsGood reports begin with good data. Analyzing the data you have gathered isessential to produce the tight logic needed for a good report. Analyze yourdata with healthy skepticism. Check to see that they correspond with expecta-tions or other existing data. If they don’t, check for well-supported explana-tions of the difference.
Spreadsheets can be particularly troublesome. Cell results derived by for-mulas can be subtly, or grossly, wrong by incorrectly defining ranges, for example. It is easy to generate results that are impossible, such as sums thatexceed known totals. Always have an estimate of the result of a calculation.Using spreadsheets, you can easily be wrong by a factor of 10, 100, or 1,000.Results produced by this kind of error are wrong at best, and can be ludicrousand embarrassing. One study found that 30% of spreadsheets had errors, suchas misplaced decimal points, transposed digits, and wrong signs, built intotheir rules.1 Try to keep ball-park figures, estimates of what the numbersshould be, in mind as you look at numerical data. Question surprises beforeaccepting them.
Analyzing data can be hard even for experts. New techniques continuallyappear, allowing experts to challenge earlier conclusions. One example is theNumber Needed to Treat (NNT), a new measure of drug effectiveness devel-oped within the past 20 years. Most clinical trials answer the question, “Willpatients on this drug do better than those taking a placebo?” For statins, drugsto reduce high cholesterol, the answer is yes: you may see 30% fewer heart at-tacks, depending on the particular trial. Sounds great, yes? But how many ofthose people would have had heart attacks in the first place? If the number isvery small, 30% fewer isn’t much decrease, particularly considering the cost ofstatins and possible side effects including liver damage. The NNT asks, “Howmany people have to take this drug to avoid one heart attack?” For statins, theanswer is about 50, much different odds and more food for thought for Amer-ica’s aging population as it decides whether or not to take more prescriptions.2
Numerous studies exist in scholarly journals challenging the data-basedconclusions of earlier articles. One example is the fate of unmarried, college-educated women over 30. A famous Newsweek cover story, “Too Late for Prince

Locker−Kienzler: Business and Administrative Communication, Eighth Edition
V. Reports 16. Analyzing Information and Writing Report
© The McGraw−Hill Companies, 2008
538 Part 5 Reports
Getting the RightData
Surveys are often usedto measure consumer
satisfaction, asking people torate products and services. How-ever, does high customer satis-faction also mean that the qualityof the product or service is alsohigh? In a recent study, medicalresearchers found no correlationbetween patient-satisfaction andthe quality of the care received.Those patients that rated thequality of their care as 10 (on ascale of 1 to 10) were no morelikely to have received better carethan those who gave it a 5.
This example shows some ofthe thorny issues associated withsurveys. First, because surveysare easy to get and report, theyare popular. But, people who re-spond to surveys tend to be thosewho are satisfied with the productor service. In addition, relying onsurvey data can exclude other im-portant findings. As in the case inmedical research, customer satis-faction can mean something verydifferent than the quality of med-ical care received.
Given these complexities, howcan surveys be used effectively?
Adapted from David Wessel, “InHealth Care, Consumer Theory FallsFlat,” Wall Street Journal, September 7,2006, A2.
Charming?” reported the Yale and Harvard study that suggested suchwomen had only a 20% chance of finding husbands, and only a 2.6% chanceby the time they reached 40. Twenty years later an economist at the Universityof Washington examined 30 years of census data. Her figures for the decadeof the original study showed that women aged 40–44 with advanced degreeswere only 25% less likely to be married than comparably aged women withjust high school diplomas. By 2000, those women with postcollege educationwere slightly more likely to be married than those who had finished onlyhigh school.3
Identifying the Source of the DataCheck to be sure that your data come from a reliable source. Use the strategiesoutlined in Chapter 15 to evaluate Web sources ( p. 509). When the sourcehas a vested interest ( p. 372) in the results, scrutinize them with specialcare. To analyze a company’s financial prospects, use independent informa-tion as well as the company’s annual report and press releases.
If your report is based upon secondary data from library and online re-search, look at the sample, the sample size, and the exact wording of questionsto see what the data actually measure. (See Chapter 15 for more informationon sampling and surveying.) Does the sample have a built-in bias? A surveyof city library users may uncover information about users, but it may not findwhat keeps other people away from the library.
For many kinds of research, a large sample is important for giving signifi-cant results. For example, polls found that citizens were closely divided aboutthe 2004 presidential elections. The difference of a few percentage points waswithin the margin of error, meaning that the pollsters really did not knowwhether President George W. Bush or Senator John Kerry was in the lead; thedifference in the numbers could have been mere chance. In that situation, alarge sample was essential for the results to be meaningful. Nielsen Media Re-search collects about 2 million television viewing diaries annually to gatherviewing data. The large numbers also allow it to provide viewing informationfor local stations and their advertisers.4
A survey that has been the target of much questioning in the press is theone behind the annual college rankings of US News & World Report. Criticscharge that the rankings are based far too heavily on opinion (peer evalua-tions from other schools), uncorroborated data supplied by the schools them-selves, and irrelevant data (such as rates of alumni giving). Critics also chargeschools with gaming the system through practices such as heavy solicitationof students who have almost no chance of being accepted (low acceptancerates help schools’ rankings).5
Identify exactly what the data measure. When advertisers began to placemessages on the Internet, they soon realized that they had a measurementproblem. The tools they used to measure viewer response counted the num-ber of people who clicked on an ad that delivered them to the advertiser’sWeb site. In most cases, of course, advertisers want more than Web site visi-tors; they want people to buy from the company. Now more sophisticatedtools can keep track of the percentage of people who click on the ad and thenmake a purchase at the company’s Web site. Advertisers can use this infor-mation to test different versions of their advertising, so they use only themost profitable versions. At the same time, the companies that sell online ad-vertising complain that these measures are unfair because they hold Internetadvertising to a higher standard. Other media, such as magazines and televi-sion, merely estimate the number of people who see an ad, not the percentagewho make a purchase.6
�
�

Locker−Kienzler: Business and Administrative Communication, Eighth Edition
V. Reports 16. Analyzing Information and Writing Report
© The McGraw−Hill Companies, 2008
Chapter 16 Analyzing Information and Writing Reports 539
Identify the assumptions used in analyzing the data. When Nielsen Media Re-search estimates the number of people who view television stations, it must makea number of assumptions. The company has to determine how well its PeopleMeter actually tracks whether people are watching, and it has to make decisionsabout how to count groups that are hard to measure. Nielsen has reported that 18-to 34-year-old males are watching less television, in part because they spend moretime with videogames and DVDs. However, television networks complained thatthe company was underreporting this group’s hours for a variety of reasons. Forexample, Nielsen was not counting young people who leave for college, and itssample did not include homes with TiVo or other personal video recorders (de-vices that make measurement more difficult). Because of such differences, the net-works, Nielsen, and advertisers disagree about whether young men are losinginterest in television programming.7 Nielsen continually refines the ways it col-lects data. Since its original report on young men, for instance, it has started meas-ures to track college students’ viewing. Those efforts have increased ratings forsome shows by more then 35%.8
Analyzing NumbersMany reports analyze numbers—either numbers from databases and sourcesor numbers from a survey you have conducted. The numerical information,properly analyzed, can make a clear case in support of a recommendation.Suppose, for example, you are trying to make your company’s Web site easierto use. In your report, you might want to include numbers from Jakob Nielsenthat using Web sites is 206% harder for people with disabilities and 122%harder for elderly people.9 These numbers are striking because they are largeand because they are quite different. They make the case that some groups arehaving great difficulty with Web sites; if your company cares about servingthese groups, it would be worthwhile to find out how to make your com-pany’s Web site easier for them to use. Also, depending on your group’s ob-jectives, you might decide to focus more on people with disabilities (becausethey have much more difficulty) or to focus more on elderly computer users(because they are a larger part of the population). The next steps would in-clude finding out why these groups have trouble and how to make your com-pany’s Web site more user friendly. (The Web Accessibility Initiative providesexcellent material on how to make Web sites accessible to the disabled:http://www.w3.org/WAI/intro/accessibility.php.)
Recognize that even authorities can differ on the numbers they offer, or onthe interpretations of the same data sets. Researchers from the United Nationsand Johns Hopkins University differed on their estimates of Iraqi deaths in thewar by 500% (see sidebar on page 542).10
In their books, The Tipping Point and Freakonomics, Malcolm Gladwell andSteven D. Levitt and Stephen J. Dubner reach different conclusions about thedata on dropping crime rates for New York City. Gladwell attributes the dropto the crackdown by the new police chief on even minor crimes such as graffitiand public drunkenness. Levitt and Dubner first explain why the cause wasnot a crackdown on crime (the years don’t match well; other cities also experi-enced the drop) and attribute it to the legalization of abortion (at the time ofthe crime drop the first wave of children born after Roe v. Wade was hittinglate teen years and thus prime crime time; that group was short on the cate-gory most likely to become criminal: unwanted children). They also providecorroborating evidence from other countries.11
If you’ve conducted a survey, your first step in analyzing your numbers isto transfer the responses on the survey form into numbers. For some cate-gories, you’ll assign numbers arbitrarily. For example, you might record men
Analyzing Numbers, I
True story. One of theBig Three Detroit Au-
tomakers put together a cus-tomer relationship management(CRM) system that helped it de-cide which cars to manufacturebased on what was going on indealers’ lots. It worked great.
Well, except for one catch. Ac-cording to Eric Almquist, VP atMercer Management Consult-ing, the company’s marketingteam had just created sales in-centives to get rid of a lot oflime-green cars, which no onewanted. As consumers snappedup the special deals on the cars,the CRM software noticed thesurge of sales in lime-green carsand instructed the factory toproduce more. The automakerlost millions of dollars before itcaught the error.
Quoted from Brian Caulfield, “FacingUp to CRM,” Business 2.0, August/September 2001, 149.

Locker−Kienzler: Business and Administrative Communication, Eighth Edition
V. Reports 16. Analyzing Information and Writing Report
© The McGraw−Hill Companies, 2008
540 Part 5 Reports
as 1 and women as 2—or vice versa. Such assignments don’t matter, as long asyou’re consistent throughout your project. In these cases, you can report thenumber and percentage of men and women who responded to your survey,but you can’t do anything else with the numbers.
When you have numbers for salaries or other figures, start by figuring theaverage (or mean), the median, and the range. The average or mean is calcu-lated by adding up all the figures and dividing by the number of samples. Themode is the number that occurs most often. The median is the number that isexactly in the middle. When you have an odd number of observations, the me-dian will be the middle number. When you have an even number, the medianwill be the average of the two numbers in the center. The range is the differ-ence between the high and low figures for that variable.
Figure 16.1 shows the raw data that a student recorded in a report evaluat-ing a hospital’s emergency room procedures. To analyze the data, we couldrearrange them, listing them from low to high (see Figure 16.2). The averagewaiting time is 26.6 minutes, but the median (the middle number) is only 22.
Finding the average takes a few more steps when you have different kindsof data. For example, it’s common to ask respondents whether they find a fea-ture “very important,” “somewhat important,” or “not important.” You mightcode “very important” as “3,” “somewhat important” as “2,” and “not impor-tant” as “1.” To find the average in this kind of data,
1. For each response, multiply the code by the number of people who gavethat response.
2. Add up the figures.
3. Divide by the total number of people responding to the question.
For example, suppose you have the following data after selecting a randomsample and surveying 50 people about the features they want in a proposedapartment complex:
Patient Wait Patient
1
2
3
4
5
1217152235
6
7
8
9
10
Wait Patient Wait
1735125450
11
12
13
14
15
1931412317
Amount of time (rounded off to the nearest minute) that patients wait in the emergency room before being examined in triage.
Figure 16.1 Raw Data from Observations for a Report
Very important Somewhat important Not important (coded as “3”) (coded as “2”) (coded as “1”)
Party house 26 12 13Extra parking for guests 26 23 1
Following step 1, to get the average for “party house,” multiply 3 � 26 � 78;2 � 12 � 24; and 1 � 13 � 13. Then add 78 � 24 � 13 � 115. Divide by the
Analyzing Numbers, II
Beth Baldwin, Direc-tor of Marketing Infor-
mation at Terra Lycos, the giantdotcom portal, knew the num-bers didn’t add up. Last No-vember, New York–based Webaudience measurement serv-ice Media Matrix reported thatLycos Zone—the portal’s site forkids—had seen a 5 percent de-cline from the previous month.Baldwin’s own numbers, how-ever, showed that in fact theamount of traffic to the site hadincreased during that period.
Baldwin believed that hernumbers, generated by TerraLycos’s site-metrics software,were probably right, but shehad to prove it because WallStreet was more inclined to treatMedia Matrix as the final word. Ittook two months, but she finallyfound the answer in a study,conducted by market researchfirm Roper Starch Worldwide,that reported on Web usage inschools and listed popular K–12sites. Baldwin realized thatmany of the visitors to LycosZone were kids logging on fromschool, and that Media Matrixdoesn’t count those users. Hernumbers were indeed correct.
Quoted from Brian Caulfield, “Why YourSite Traffic Numbers Are out of Whack,”Business 2.0, March 2001, 122.

Locker−Kienzler: Business and Administrative Communication, Eighth Edition
V. Reports 16. Analyzing Information and Writing Report
© The McGraw−Hill Companies, 2008
Chapter 16 Analyzing Information and Writing Reports 541
12, 121517, 17, 171922233135, 35415054
Average: 26.6 minutesMedian: 22 minutesMode: 17 minutesRange: 12 54 minutes
Figure 16.2 Rearranging Data to Find the Average (Mean), Mode,and Median
number of people answering the question and you get the average for thatfactor: 115 divided by 50 � 2.3. Repeat the process for the next factor, “extraparking”: 3 � 26 � 78; 2 � 23 � 46; 1 � 1 � 1. Adding 78 � 46 � 1 � 125; dividing by 50 � 2.5.
The average then gives an easy way to compare various features. If theparty house averages 2.3 while extra parking for guests is 2.5, you know thatyour respondents would find extra parking more important than a partyhouse. (Whether the difference is significant or not is a statistics question.)You can now arrange the factors in order of importance:
Table 4. “How Important Is Each Factor to You in Choosing an Apartment?”
n � 50; 3 � “Very Important”
Extra parking for guests 2.5Party house 2.3Pool 2.2Convenient to bus line 2.0
Often it’s useful to simplify numerical data: rounding it off, combiningsimilar elements. Then you can see that one number is about 21⁄2 times an-other. Charting it can also help you see patterns in your data. (See Chapter6 for a full discussion of charts as a way of analyzing and presenting nu-merical data.) Look at the raw data as well as at percentages. For example, a50% increase in shoplifting incidents sounds alarming. An increase fromtwo to three shoplifting incidents sounds less so but is the same data stateddifferently.
Many people believe numbers are more “objective” than words. In reality, thisbelief is inaccurate; both numbers and words require interpretation and context tohave meaning. Consider the data collected by the Department of Transportation’sNational Highway Traffic Safety Administration (NHTSA). For each year, theNHTSA gathers and reports statistics on the number of motor vehicle accidentfatalities, breaking down the data by type of accident, type of vehicle, and state.In 2003 the agency determined that 42,643 people died in traffic accidents in theUnited States. When the data were ready, the NHTSA news release proclaimed,“DOT Announces Historic Low Highway Fatality Rate in 2003.” The releasequoted Transportation Secretary Norman Mineta as saying, “America’s roadsare safer than ever.” The “historic low” was a rate of 1.48 per 100 million
When EstimatesCollide
Why do married cou-ples argue about
money? One reason might be dif-ferences in what they think theyhave. In the National LongitudinalStudies, the Bureau of Labor Sta-tistics looks at household meas-ures over many years. EconomistJay Zagorsky found a problemwith the financial data: husbandsand wives differ in their estimatesof income and assets.
On average, husbands report5 percent more income and 10percent more total wealth thanwives do. In one way, though,spouses are consistent. Both re-port lower earnings for theirspouses than the spouses reportas their income. Their estimatesdiffer by more than $3,000. Whenit comes to total wealth, hus-bands report more wealth thanwives estimate.
Who is wrong? Zagorsky isn’tsure. Couples do agree onwhich spouse pays most of thebills. For about 60 percent of thecouples, that person is the wife.
Zagorsky’s research tells oth-ers to be cautious in reviewingestimates of family earnings. Forexample, the federal govern-ment uses the Current Popula-tion Survey to calculate statisticsabout poverty. About two-thirdsof respondents are women. Arepoverty estimates too high? Sofar, we can only wonder.
Adapted from Jeff Grabmeier, “Hus-bands, Wives Don’t Agree on TheirFinancial Status,” OnCampus, June 12,2003, 5–6.

Locker−Kienzler: Business and Administrative Communication, Eighth Edition
V. Reports 16. Analyzing Information and Writing Report
© The McGraw−Hill Companies, 2008
542 Part 5 Reports
vehicle miles traveled, the first time that rate had been less than 1.5 since theNHTSA began gathering the data. A columnist for the Wall Street Journal ac-knowledged the good news but observed that the rate of decline was just0.8%. The NHTSA news release emphasized reasons for the decline in fatali-ties (more seat belt use and stiffer drunk-driving laws), whereas the WallStreet Journal highlighted reasons for the small size of the decline (the popu-larity of SUVs and pickups, whose fatality rates are declining but are higherthan for passenger cars).12
The same numbers can be presented in different ways to create very differ-ent impressions. In the case of the NHTSA data, the Kansas City Star and Timemagazine prepared articles emphasizing not the overall decline in fatalities,but the difference between the fatality rates observed for passenger cars andSUVs. Both articles mentioned that passengers are “11% more likely to die” ina crash if they are driving an SUV rather than an automobile. A story in Forbesmagazine, however, called SUVs “slightly more dangerous” but focused onadditional data comparing various types of crashes. The Forbes article empha-sized that in crashes between a light truck and a passenger car, if someonedied, that person usually was an occupant of the car. The article listed thenumber of deaths recorded in each type of crash but not the percentage of fatalities (13%) in crashes between cars and light trucks.13 In each of these ex-amples, the publication used the same data to reach a conclusion that is moredramatic than a decline in fatalities of less than 1%.
A common myth associated with numbers is that numbers are more objectivethan words: “numbers don’t lie.”
Analyzing WordsIf your data include words, try to find out what the words mean to the peoplewho said them. An effort to measure the effectiveness of four TV commercialsin Australia asked whether each commercial “encourages me to try/buy thebrand product.” The question is ambiguous. Some consumers might think theresearcher wants to know whether the ad is obviously a sales pitch. (Is the ad“encouraging me to buy” or just trying to make me feel good?) Others mightthink the question is asking about how effective the ad is in persuading theconsumer. (Did the ad succeed at encouraging me, or did it fail?) This ques-tion therefore might measure either the commercials’ content or their ability topersuade, depending on how people interpret the words.14
Also try to measure words against numbers. When he researched possibleinvestments, Peter Lynch found that people in mature industries were pes-simistic, seeing clouds. People in immature industries saw pie in the sky, evenwhen the numbers weren’t great.15
Analyzing PatternsPatterns can help you draw meaning from your data. If you have librarysources, on which points do experts agree? Which disagreements can be explained by early theories or numbers that have now changed? Which dis-agreements are the result of different interpretations of the same data? Whichare the result of having different values and criteria? In your interviews andsurveys, what patterns do you see?
• Have things changed over time?
• Does geography account for differences?
• Do demographics such as gender, age, or income account for differences?
• What similarities do you see?
• What differences do you see?
Getting the DataRight
A 2006 report by JohnsHopkins University
claimed that 655,000 Iraqis haddied in the war in Iraq, a figurethat diverged wildly from otherestimates—sometimes more than1,000%. The Hopkins figure is500% more than that of theUnited Nations. Such a differencefrom other reports calls into ques-tion the accuracy of the Hopkinsreport.
To understand why the figure isso much higher than other re-search reports, it is important toconsider how the data were gath-ered. The Hopkins researchersused cluster sampling for inter-views, a methodology that makessense given the country’s war-zone status. Researchers ran-domly selected neighborhoodsand then conducted door-to-doorinterviews with “clusters” of indi-viduals from within those neigh-borhoods. Such a techniquesaves time and money and iscommon in research within devel-oping countries.
But, the key to this kind of tech-nique is to use enough clusterpoints. A lack of cluster pointscan mean that the populationsampled isn’t representative of thepopulation in Iraq. The Hopkinsresearchers did not use enoughcluster points. In addition, theHopkins researchers didn’tgather demographic data fromtheir participants for comparisonto census data. Doing so wouldhave added to the believabilityof their results.
Getting the data right is impor-tant because numbers canhave a significant impact on de-cisions and policies. In terms ofcasualties, the decisions madebased on the numbers reportedhave an impact on millions ofIraqis and Americans.
Adapted from Stephen E. Moore,“655,000 War Dead?” Wall StreetJournal, October 18, 2006, A20.

Locker−Kienzler: Business and Administrative Communication, Eighth Edition
V. Reports 16. Analyzing Information and Writing Report
© The McGraw−Hill Companies, 2008
Chapter 16 Analyzing Information and Writing Reports 543
• What confirms your hunches?
• What surprises you?
Checking Your LogicState accurately what your data show. For example, suppose that you’veasked people who use computers if they could be as productive without themand the overwhelming majority say no. This finding shows that people believethat computers make them more productive, but it does not prove that they infact are more productive.
Don’t confuse causation with correlation. Causation means that one thingcauses or produces another. Correlation means that two things happening atthe same time are positively or negatively related. One might cause the other,but both might be caused by a third. Correlation and causation are easy toconfuse, but the difference is important. Consider studies showing that intelli-gence declines as birth order increases. Thus, the average first-born child ismore intelligent than the average second-born, and IQs continue to fall for thethird-, fourth-, and fifth-born. Does that mean having older siblings makes aperson less intelligent? A more plausible explanation would be that a thirdfactor makes large families different from small ones in a way that relates tointelligence measures. Similarly, the Census Bureau publishes figures show-ing that greater education levels are associated with greater incomes. Awidely held assumption is that more education causes greater earnings. Butmight people from richer backgrounds seek more education? Or might somethird factor, such as intelligence, lead to both greater education and higher income? The Census Bureau does not measure intelligence.16
Consciously search for at least three possible causes for each phenomenonyou’ve observed and at least three possible solutions for each problem. Themore possibilities you brainstorm, the more likely you are to find good op-tions. In your report, mention all of the possibilities; discuss in detail onlythose that will occur to readers and that you think are the real reasons and thebest solutions.
When you have identified causes of the problem or the best solutions, checkthese ideas against reality. Can you find support in quotes or in numbers? Canyou answer claims of people who interpret the data in other ways?
Make the nature of your evidence clear to your reader. Do you have obser-vations that you yourself have made? Or do you have inferences based on observations or data collected by others? Old data may not be good guides tofuture action.
If you can’t prove the claim you originally hoped to make, modify yourconclusions to fit your data. Even when your market test is a failure or yourexperiment disproves your hypothesis, you can still write a useful report.
• Identify changes that might yield a different result. For example, selling theproduct at a lower price might enable the company to sell enough units.
• Divide the discussion to show what part of the test succeeded.
• Discuss circumstances that may have affected the results.
• Summarize your negative findings in progress reports to let readers downgradually and to give them a chance to modify the research design.
• Remember that negative results aren’t always disappointing to the audience.For example, the people who commissioned a feasibility report may be re-lieved to have an impartial outsider confirm their suspicions that a project is-n’t feasible. Marketing consultant Arthur Shapiro once worked with anexecutive who was disappointed when the results were positive. Shapirotested a proposed advertising campaign and found that it performed as
To see examples ofthe ways in which
reports are written anddisseminated, visit the PewInternet & American Life Projectat the above Web site.
The project producesreports on the impact of theInternet on American lives,collecting and analyzing data orreal-world developments asthey intersect with the virtualworld. Following data collection,the results are written into thereports and posted as PDFs tothe Web site.
Visit the Project’s Webpages to see examples of theways in which reports are firstpresented and then rewritten bythe press for their audienceand purpose.
http://www.pewinternet.org/

Locker−Kienzler: Business and Administrative Communication, Eighth Edition
V. Reports 16. Analyzing Information and Writing Report
© The McGraw−Hill Companies, 2008
544 Part 5 Reports
intended. But after receiving the results, the executive responded that hecould not be convinced because, he explained, “I hate the campaign.”17
Choosing Information for ReportsDon’t put information in reports just because you have it or just because ittook you a long time to find it. Instead, choose the information that yourreader needs to make a decision.
If you know your readers well, you may know what their priorities are. For ex-ample, the supervisor of a call center knows that management will be looking forcertain kinds of performance data, including costs, workload handled and fore-cast, and customer satisfaction. To write regular reports, the supervisor would setup a format in which it is easy to see how well the center is doing in each of theseareas. Using the same format month after month simplifies the reader’s task. Pre-senting the actual performance alongside objectives helps managers focus on ma-jor successes and failures. The supervisor also would highlight and explain anyunusual data, such as an unexpected surge in volume or a one-time expense.18
If you don’t know your readers, you may be able to get a sense for what is important by showing them a tentative table of contents (a list of your headings)and asking, “Have I included everything?” When you cannot contact an exter-nal audience, show your draft to colleagues and superiors in your organization.
How much information you need to include depends on whether your audience is likely to be supportive, neutral, or skeptical. If your audience islikely to be pleased with your research, you can present your findings di-rectly. If your audience will not be pleased, you will need to explain yourthinking in a persuasive way and provide substantial evidence.
You must also decide whether to put information in the body of the reportor in appendixes. Put material in the body of the report if it is crucial to yourproof, if your most significant readers will want to see it there, or if it is short.(Something less than half a page won’t interrupt the reader.) Frequently deci-sion makers want your analysis of the data in the report body rather than theactual data itself. Supporting data that will be examined later by specialistssuch as accountants, lawyers, and engineers are generally put in an appendix.
Anything that a careful reader will want but that is not crucial to your proofcan go in an appendix. Appendixes can include
• A copy of a survey questionnaire or interview questions.
• A tally of responses to each question in a survey.
• A copy of responses to open-ended questions in a survey.
• A transcript of an interview.
• Computer printouts.
• Complex tables and visuals.
• Technical data.
• Previous reports on the same subject.
Organizing Information in ReportsMost sets of data can be organized in several logical ways. Choose the waythat makes your information easiest for the reader to understand and use. Ifyou were compiling a directory of all the employees at your plant, for ex-ample, alphabetizing by last name would be far more useful than listingpeople by height, social security number, or length of service with the com-pany, although those organizing principles might make sense in other listsfor other purposes.

Locker−Kienzler: Business and Administrative Communication, Eighth Edition
V. Reports 16. Analyzing Information and Writing Report
© The McGraw−Hill Companies, 2008
Chapter 16 Analyzing Information and Writing Reports 545
In one company, a young employee comparing the economics of twoproposed manufacturing processes gave his logic and his calculations infull before getting to his conclusion. But his superiors didn’t want to wadethrough eight single-spaced pages; they wanted his recommendation upfront.19
The following three guidelines will help you choose the arrangement thatwill be the most useful for your reader:
1. Process your information before you present it to your reader. The orderin which you became aware of information usually is not the best order topresent it to your reader.
2. When you have lots of information, group it into three to seven cate-gories. The average person’s short-term memory can hold only sevenchunks, though the chunks can be of any size.20 By grouping your infor-mation into seven categories (or fewer), you make your report easier toread.
3. Work with the reader’s expectations, not against them. Introduce ideasin the overview in the order in which you will discuss them.
Basic Patterns for Organizing InformationSeven basic patterns for organizing information are useful in reports:
1. Comparison/contrast.
2. Problem-solution.
3. Elimination of alternatives.
4. General to particular or particular to general.
5. Geographic or spatial.
6. Functional.
7. Chronological.
Any of these patterns can be used for a whole report or for only part of it.
1. Comparison/contrast
Many reports use comparison/contrast sections within a larger report pattern.Comparison/contrast can also be the purpose of the whole report. Feasibilitystudies usually use this pattern. You can focus either on the alternatives youare evaluating or on the criteria you use. See Figure 16.3 for examples of thesetwo patterns in a report.
Focus on the alternatives when
• One alternative is clearly superior.
• The criteria are hard to separate.
• The reader will intuitively grasp the alternative as a whole rather than asthe sum of its parts.
Focus on the criteria when
• The superiority of one alternative to another depends on the relativeweight assigned to various criteria. Perhaps Alternative A is best if we aremost concerned about Criterion 1, cost, but worst if we are most concernedabout Criterion 2, proximity to target market.
• The criteria are easy to separate.
• The reader wants to compare and contrast the options independently ofyour recommendation.
Tell Them a Story
To persuade people,tell them a story or anecdotethat proves your point.
Experiments with both highschool teachers and quantita-tively trained MBA studentsshow that people are more likelyto believe a point and morelikely to be committed to it whenpoints were made by examples,stories, and case studies. Sto-ries alone were more effectivethan a combination of storiesand statistics; the combinationwas more effective than statis-tics alone. In another experi-ment, attitude changes lastedlonger when the audience hadread stories than when they hadonly read numbers. Recent re-search suggests that stories aremore persuasive because peopleremember them.
In many cases, you’ll need toprovide statistics or numbers toconvince the careful reader thatyour anecdote is a representa-tive example. But give the storyfirst. It’s more persuasive.
Adapted from Dean C. Kazoleas, “AComparison of the Persuasive Effec-tiveness of Qualitative versus Quan-titative Evidence,” CommunicationQuarterly 41, no. 1 (Winter 1993):40–50; and Joanne Martin andMelanie E. Powers, “Truth of Corpo-rate Propaganda,” in OrganizationalSymbolism, ed. Louis R. Pondy, et al.(Greenwich, CT: JAI Press, 1983),97–107.

Locker−Kienzler: Business and Administrative Communication, Eighth Edition
V. Reports 16. Analyzing Information and Writing Report
© The McGraw−Hill Companies, 2008
546 Part 5 Reports
A variation of the divided pattern is the pro-and-con pattern. In this pat-tern, under each specific heading, give the arguments for and against that alternative. A report recommending new plantings for a university quadrangleuses the pro-and-con pattern:
Figure 16.3 Two Ways to Organize a Comparison/Contrast Report
Focus on alternatives
Alternative A Opening a New Store on CampusCriterion 1 Cost of Renting SpaceCriterion 2 Proximity to Target MarketCriterion 3 Competition from Similar Stores
Alternative B Opening a New Store in the Suburban MallCriterion 1 Cost of Renting SpaceCriterion 2 Proximity to Target MarketCriterion 3 Competition from Similar Stores
Focus on criteria
Criterion 1 Cost of Renting Space for the New StoreAlternative A Cost of Campus LocationsAlternative B Cost of Locations in the Suburban Mall
Criterion 2 Proximity to Target MarketAlternative A Proximity on CampusAlternative B Proximity in the Suburban Mall
Criterion 3 Competition from Similar StoresAlternative A Competing Stores on CampusAlternative B Competing Stores in the Suburban Mall
Advantages of MonocroppingHigh ProductivityVisual Symmetry
Disadvantages of MonocroppingDanger of Pest ExploitationVisual Monotony
This pattern is least effective when you want to deemphasize the disadvantagesof a proposed solution, for it does not permit you to bury the disadvantagesbetween neutral or positive material.
2. Problem-solution
Identify the problem; explain its background or history; discuss its extentand seriousness; identify its causes. Discuss the factors (criteria) that affectthe decision. Analyze the advantages and disadvantages of possible solu-tions. Conclusions and recommendation can go either first or last, depend-ing on the preferences of your reader. This pattern works well when thereader is neutral.
A report recommending ways to eliminate solidification of a granularbleach during production uses the problem-solution pattern:

Locker−Kienzler: Business and Administrative Communication, Eighth Edition
V. Reports 16. Analyzing Information and Writing Report
© The McGraw−Hill Companies, 2008
Chapter 16 Analyzing Information and Writing Reports 547
4. General to particular or particular to general
General to particular starts with the problem as it affects the organization or asit manifests itself in general and then moves to a discussion of the parts of theproblem and solutions to each of these parts. Particular to general starts withthe problem as the audience defines it and moves to larger issues of which theproblem is a part. Both are good patterns when you need to redefine thereader’s perception of the problem to solve it effectively.
The directors of a student volunteer organization, VIP, have defined theirproblem as “not enough volunteers.” After studying the subject, the writer isconvinced that problems in training, supervision, and campus awareness are re-sponsible for both a high dropout rate and a low recruitment rate. The general-to-particular pattern helps the audience see the problem in a new way:
Glass Ceilings?
Researchers not onlywrite reports about
their data, they also use reportsto gather data. In a recent study,researchers from Dartmouth’sTuck School of Business andLoyola University–Chicago in-vestigated proxy statementsand Securities and ExchangeCommission reports to gatherdata about the status of femaleCEOs.
Researchers categorized andranked biographical data bygender, age, and tenure of ex-ecutives from the largest 942U.S. companies to predict therate at which female executiveswill advance to become CEOs.In 2000, 0.6 % of board chairsand CEOs were women. By2016, the proportion of femalesin those top positions is pro-jected to be 6.2 percent. Theyconcluded that “despite ad-vances in the corporate sphere,it’s still lonely at the top for fe-male CEOs—and will be for atleast another decade.”
Adapted from Elizabeth Woyke,“Glass Ceilings: Corner OfficeCrawl,” BusinessWeek, December 4,2006, 14.
Recommended Reformulation for Vibe BleachProblems in Maintaining Vibe’s Granular Structure
Solidifying during Storage and TransportationCustomer Complaints about “Blocks” of Vibe in Boxes
Why Vibe Bleach “Cakes”Vibe’s FormulaThe Manufacturing ProcessThe Chemical Process of Solidification
Modifications Needed to Keep Vibe Flowing Freely
3. Elimination of alternatives
After discussing the problem and its causes, discuss the impractical solutionsfirst, showing why they will not work. End with the most practical solution.This pattern works well when the solutions the reader is likely to favor willnot work, while the solution you recommend is likely to be perceived as expensive, intrusive, or radical.
A report on toy commercials, “The Effect of TV Ads on Children,” eliminatesalternatives:
Alternative Solutions to Problems in TV Toy AdsLeave Ads UnchangedMandate School Units on AdvertisingAsk the Industry to Regulate ItselfGive FCC Authority to Regulate TV Ads Directed at Children
Why VIP Needs More VolunteersWhy Some VIP Volunteers Drop Out
Inadequate TrainingInadequate SupervisionFeeling That VIP Requires Too Much TimeFeeling That the Work Is Too Emotionally Demanding
Why Some Students Do Not VolunteerFeeling That VIP Requires Too Much TimeFeeling That the Work Is Too Emotionally DemandingPreference for Volunteering with Another OrganizationLack of Knowledge about VIP Opportunities
How VIP Volunteers Are Currently Trained and SupervisedTime Demands on VIP Volunteers

Locker−Kienzler: Business and Administrative Communication, Eighth Edition
V. Reports 16. Analyzing Information and Writing Report
© The McGraw−Hill Companies, 2008
548 Part 5 Reports
5. Geographic or spatial
In a geographic or spatial pattern, you discuss problems and solutions byunits by their physical arrangement. Move from office to office, building tobuilding, factory to factory, state to state, region to region, etc.
A sales report uses a geographic pattern of organization:
Tapping into theResearch Experts
Where else can yougo besides Google to
find the information you needfor your next report? You mighttry your local library. While youcan find a wealth of informationon Google, libraries subscribeto commercial databases thatcan give you access to power-ful tools for writing your com-pany’s business or marketingplan. An added plus is that li-brarians are experts at navigat-ing those databases.
Small business owners, in par-ticular, can benefit. Many librarieseven hold classes for entrepre-neurs and provide networkingopportunities with other local agen-cies and organizations geared tohelp the small business person. Sothe next time you are working outa business problem, visit your local library.
Adapted from Tara Siegel Bernhard,“Enterprise: Big Help for Small Busi-nesses at the Library; CommercialDatabases, Assistance on Researchand Classes Are Offered,” WallStreet Journal, August 29, 2006, B4.
Emotional Demands on VIP VolunteersWays to Increase Volunteer Commitment and Motivation
Improving Training and SupervisionImproving the Flexibility of Volunteers’ HoursProviding Emotional Support to VolunteersProviding More Information about Community Needs and VIP Services
Sales Have Risen in the European CommunitySales Are Flat in Eastern EuropeSales Have Fallen Sharply in the Middle EastSales Are Off to a Strong Start in AfricaSales Have Risen Slightly in AsiaSales Have Fallen Slightly in South AmericaSales Are Steady in North America
6. Functional
In functional patterns, discuss the problems and solutions of each functionalunit. For example, a small business might organize a report to its venture capital-ists by the categories of research, production, and marketing. A government report might divide data into the different functions an agency performed, taking each in turn:
Major Accomplishments FY 09RegulationEducationResearchInternational coordination
7. Chronological
A chronological report records events in the order in which they happened orare planned to happen. Many progress reports are organized chronologically:
Work Completed in OctoberWork Planned for November
If you choose this pattern, be sure you do not let the chronology obscure significant points or trends.
How to Organize Specific Varieties of ReportsInformative, feasibility, and justification reports will be more successful whenyou work with the readers’ expectations for that kind of report.

Locker−Kienzler: Business and Administrative Communication, Eighth Edition
V. Reports 16. Analyzing Information and Writing Report
© The McGraw−Hill Companies, 2008
Chapter 16 Analyzing Information and Writing Reports 549
Informative and closure reports
Informative and closure reports summarize completed work or research thatdoes not result in action or recommendation.
Informative reports often include the following elements:
• Introductory paragraph summarizing the problems or successes of theproject.
• Purpose and scope section(s) giving the purpose of the report and indicatingwhat aspects of the topic it covers.
• Chronological account of how the problem was discovered, what wasdone, and what the results were.
• Concluding paragraph with suggestions for later action. In a recommen-dation report, the recommendations would be based on proof. In contrast,the suggestions in a closure or recommendation report are not proved indetail.
Figure 16.4 presents this kind of informative closure report.Closure reports also allow a firm to document the alternatives it has consid-
ered before choosing a final design and to prove its right to copyrights andpatents.
Feasibility reportsFeasibility reports evaluate two or more alternatives and recommend one ofthem. (Doing nothing or delaying action can be one of the alternatives.)
Feasibility reports normally open by explaining the decision to be made, list-ing the alternatives, and explaining the criteria. In the body of the report, eachalternative will be evaluated according to the criteria using one of the two comparison/contrast patterns. Discussing each alternative separately is betterwhen one alternative is clearly superior, when the criteria interact, or wheneach alternative is indivisible. If the choice depends on the weight given to eachcriterion, you may want to discuss each alternative under each criterion.
Whether your recommendation should come at the beginning or the end ofthe report depends on your reader and the culture of your organization. Mostreaders want the “bottom line” up front. However, if the reader will find yourrecommendation hard to accept, you may want to delay your recommenda-tion until the end of the report when you have given all your evidence.
Justification reportsJustification reports recommend or justify a purchase, investment, hiring, orchange in policy. If your organization has a standard format for justificationreports, follow that format. If you can choose your headings and organization,use this pattern when your recommendation will be easy for your reader toaccept.
1. Indicate what you’re asking for and why it’s needed. Since the readerhas not asked for the report, you must link your request to the organiza-tion’s goals.
2. Briefly give the background of the problem or need.
3. Explain each of the possible solutions. For each, give the cost and theadvantages and disadvantages.
4. Summarize the action needed to implement your recommendation. Ifseveral people will be involved, indicate who will do what and how longeach step will take.
5. Ask for the action you want.
Failure Isn’t Final
Researchers write clo-sure reports when the companydecides that the project they’reworking on isn’t feasible. How-ever, a few years later, new tech-nologies, new conditions, or newideas may make a “failed” ideafeasible.
Post-It® notes use a “failed”adhesive because one 3M em-ployee saw the weak adhesiveas a solution to a problem:
I was singing in the choir in mychurch. . . . I would mark the pageswith little pieces of paper normally.And sometimes they would fall out. . . .I thought what I really need is . . . abookmark that’s going to stick to thosepages . . . and still not damage thebook when I pull them off. . . . I knewthat Spence Silver back in our labora-tory had just developed an adhesivethat would do that. And I made . . .rough samples of the bookmarks. . . . I had also made up some larger sizesand found, hey, these are really handyfor notes.
An adhesive that failed in itsoriginal application was a spec-tacular success in a new andhighly profitable product.
Adapted from John Nathan, InSearch of Excellence (Waltham, MA:Nathan/Tyler Productions, 1985), 9.

Locker−Kienzler: Business and Administrative Communication, Eighth Edition
V. Reports 16. Analyzing Information and Writing Report
© The McGraw−Hill Companies, 2008
550 Part 5 Reports
March 14, 2008
To: Kitty O. Locker
From: Sara A. Ratterman
Subject: Recycling at Bike Nashbar
Two months ago, Bike Nashbar began recycling its corrugated cardboard boxes. The program was easy to implement and actually saves the company a little money compared to our previous garbage pickup.
In this report, I will explain how whyand Bike Nashbar‘s program was initiated, how the program works and what it costs, and why other businesses should consider similar programs.
The Problem of Too Many Boxes and Not Enough Space in Bike Nashbar
Every week, Bike Nashbar receives about 40 large cardboard boxes containing bicycles and other merchandise. As many boxes as possible would be stuffed into the trash bin behind the building, which also had to accommodate all the other solid waste the shop produces. Boxes that didn't fit in the trash bin ended up lying around the shop, blocking doorways, and taking up space needed for customers' bikes. The trash bin was only emptied once a week, and by that time, even more boxes would have arrived.
The Importance of Recycling Cardboard Rather than Throwing It Away
Arranging for more trash bins or more frequent pickups would have solved the immediate problem at Bike Nashbar but would have done nothing to solve the problem created by throwing away so much trash in the first place.
According to David Crogen, sales representative for Waste Management, Inc., 75% of all solid waste in Columbus goes to landfills. The amount of trash the city collects has increased 150% in the last five years. Columbus‘s landfill is almost full. In an effort to encourage people and businesses to recycle, the cost of dumping trash in the landfill is doubling from $4.90 a cubic yard to $9.90 a cubic yard next week. Next January, the price will increase again, to $12.95 a cubic yard. Crogen believes that the amount of trash can be reduced by cooperation between the landfill and the power plant and by recycling.
How Bike Nashbar Started Recycling Cardboard
Waste Management, Inc., is the country‘s largest waste processor. After reading an article about how committed Waste Management, Inc., is to waste reduction and recycling, I decided to see whether Waste Management could recycle our boxes. Corrugated cardboard (which is what Bike Nashbar‘s boxes are made of) is almost 100% recyclable, so we seemed to be a good candidate for recycling.
Purposeand scope of report.
Firstparagraph
summarizesmain
points.
Bold or underline headings.
Informal short reports use
letter or memo format.
Furtherseriousnessof problem.
Cause of problem.
Triple space before
Double space after heading.
heading.
Double space between paragraphs within heading.
Capitalize first letter of
major words in heading.
Solution.
Figure 16.4 An Informative Memo Report Describing How a Company Solved a Problem
(continued)

Locker−Kienzler: Business and Administrative Communication, Eighth Edition
V. Reports 16. Analyzing Information and Writing Report
© The McGraw−Hill Companies, 2008
Chapter 16 Analyzing Information and Writing Reports 551
Kitty O. LockerMarch 14, 2008Page 2
How the Service Works and What It Costs
Waste Management took away our existing 8-cubic-yard garbage bin and replaced it with two 4-yard bins. One of these bins is white and has “cardboard only” printed on the outside; the other is brown and is for all other solid waste. The bins are emptied once a week, with the cardboard being taken to the recycling plant and the solid waste going to the landfill or power plant.
Since Bike Nashbar was already paying more than $60 a week for garbage pickup, our basic cost stayed the same. (Waste Management can absorb the extra overhead only if the current charge is at least $60 a week.) The cost is divided 80/20 between the two bins: 80% of the cost pays for the bin that goes to the landfill and power plant; 20% covers the cardboard pickup. Bike Nashbar actually receives $5.00 for each ton of cardboard it recycles.
Each employee at Bike Nashbar is responsible for putting all the boxes he or she opens in the recycling bin. Employees must follow these rules:
Reader’s name,date,page number.
To get the service started, I met with a friendly sales rep, David Crogen, that same afternoonto discuss the service.
Waste Management, Inc., took care of all the details. Two days later, Bike Nashbar was recycling its cardboard.
•
•
•
•
Talking heads tell reader what to
expect in each section.
Details of solution.
Doublespace
betweenparagraphs.
Indentedlists
providevisualvariety.
The cardboard must have the word “corrugated” printed on it, along with the universal recycling symbol.
The boxes must be broken down to their flattest form. If they aren’t, they won’t all fit in the bin and Waste Management would be picking up air when it could pick up solid cardboard. The more boxes that are picked up, the more money and space that will be made.
No other waste except corrugated cardboard can be put in the recycling bin. Other materialscould break the recycling machinery or contaminate the new cardboard.
The recycling bin is to be kept locked with a padlock provided by Waste Management so that vagrants don't steal the cardboard and lose money for Waste Management and Bike Nashbar.
Figure 16.4 An Informative Memo Report Describing How a Company Solved a Problem(Continued)
(continued)

Locker−Kienzler: Business and Administrative Communication, Eighth Edition
V. Reports 16. Analyzing Information and Writing Report
© The McGraw−Hill Companies, 2008
552 Part 5 Reports
Kitty O. LockerMarch 14, 2008Page 3
Minor Problems with Running the Recycling Program
The only problems we’ve encountered have been minor ones of violating the rules. Sometimes employees at the shop forget to flatten boxes, and air instead of cardboard gets picked up. Sometimes people forget to lock the recycling bin. When the bin is left unlocked, people do steal the cardboard, and plastic cups and other solid waste get dumped in the cardboard bin. I’ve posted signs where the key to the bin hangs, reminding employees to empty and fold boxes and relock the bin after putting cardboard in it. I hope this will turn things around and these problems will be solved.
Advantages of the Recycling Program
The program is a great success. Now when boxes arrive, they are unloaded, broken down, and disposed of quickly. It is a great relief to get the boxes out of our way, and knowing that we are making a contribution to saving our environment builds pride in ourselves and Bike Nashbar.
Our company depends on a clean, safe environment for people to ride their bikes in. Now we have become part of the solution. By choosing to recycle and reduce the amount of solid waste our company generates, we can save money while gaining a reputation as a socially responsible business.
Why Other Companies Should Adopt Similar Programs
Businesses and institutions in Franklin County currently recycle less than 4% of the solid waste they produce. David Crogen tells me he has over 8,000 clients in Columbus alone, and he acquires new ones every day. Many of these businesses can recycle a large portion of their solid waste at no additional cost. Depending on what they recycle, they may even get a little money back.
The environmental and economic benefits of recycling as part of a comprehensive waste reduction program are numerous. Recycling helps preserve our environment. We can use the same materials over and over again, saving natural resources such as trees, fuel, and metals and decreasing the amount of solid waste in landfills. By conserving natural resources, recycling helps the U.S. become less dependent on imported raw materials. Crogen predicts that Columbus will be on a 100% recycling system by the year 2020. I strongly hope that his prediction will come true and the future may start to look a little brighter.
Dis-advantagesofsolution.
Advantagesofsolution.
Arguesthat her
company'sexperienceis relevantto other
companies.
Figure 16.4 An Informative Memo Report Describing How a Company Solved a Problem(Concluded)
If the reader will be reluctant to grant your request, use this variation of theproblem-solving pattern described in Chapter 12 ( p. 378):
1. Describe the organizational problem (which your request will solve).Use specific examples to prove the seriousness of the problem.
2. Show why easier or less expensive solutions will not solve the problem.
�

Locker−Kienzler: Business and Administrative Communication, Eighth Edition
V. Reports 16. Analyzing Information and Writing Report
© The McGraw−Hill Companies, 2008
Chapter 16 Analyzing Information and Writing Reports 553
3. Present your solution impersonally.
4. Show that the disadvantages of your solution are outweighed by the advantages.
5. Summarize the action needed to implement your recommendation. Ifseveral people will be involved, indicate who will do what and how longeach step will take.
6. Ask for the action you want.
How much detail you need to give in a justification report depends on the cor-porate culture and on your reader’s knowledge of and attitude toward yourrecommendation. Many organizations expect justification reports to beshort—only one or two pages. Other organizations may expect longer reportswith much more detailed budgets and a full discussion of the problem andeach possible solution.
Presenting Information Effectively in ReportsThe advice about style in Chapter 4 also applies to reports, with three exceptions:
1. Use a fairly formal style, without contractions or slang.
2. Avoid the word you. In a document with multiple audiences, it will notbe clear who you is. Instead, use the company name.
3. Include in the report all the definitions and documents needed to un-derstand the recommendations. The multiple audiences for reports in-clude readers who may consult the document months or years from now;they will not share your special knowledge. Explain acronyms and abbre-viations the first time they appear. Explain as much of the history or back-ground of the problem as necessary. Add as appendixes previousdocuments on which you are building.
The following points apply to any kind of writing, but they are particularlyimportant in reports:
1. Use clear, engaging writing.
2. Keep repetition to a minimum.
3. Introduce sources and visuals.
4. Use forecasting, transitions, topic sentences, and headings to make yourorganization clear to your reader.
Let’s look at each of these principles as they apply to reports.
1. Use Clear, Engaging Writing.Most people want to be able to read a report quickly while still absorbing itsimportant points. You can help them do this by using accurate diction. Not-quite-right word choices are particularly damaging in reports, which may beskimmed by readers who know very little about the subject. Occasionally youcan simply substitute a word:
Incorrect: With these recommendations, we can overcome the solutions to ourproblem.
Correct: With these recommendations, we can overcome our problem.
Also correct: With these recommendations, we can solve our problem.
Sometimes you’ll need to completely recast the sentence.
The Importance ofAnnual Reports
A 2006 survey, con-ducted by WithumSmith
& Brown and MGT Design Inc.,found that the annual report isthe most important publicationthat a company produces. Tounderstand the value of annualreports, the survey asked indi-vidual investors, portfolio man-agers, and securities analysts(the primary audiences for an-nual reports) about the ways thatthey read and use the reports tomake decisions.
Here are some of their findings:
• 77% said the annual reportis the most importantpublication that a companyproduces.
• 33% read most of the report.
• Nearly 64% read the report’sFinancial Highlights first.
• 47% said that poorly doneannual reports are a signthat the organization is notperforming well.
• 90% said that importantconcerns facing the industry,such as environment issuesand corporate governance,should be addressed in thereport.
• 81% prefer a print versionover electronic versions.Respondents said the printdocuments were easier toread, highlight, annotate,and file.
Taken together, these findingssuggest that the annual report isan important communication fororganizations and well worth thetime spent creating it.
Adapted from WithumSmith & Brownand MGT Design Inc., “AR Survey �Findings,” in News & Financial Tools:WS�B Press Releases: WS�B InThe News: Survey Reveals Impor-tance of Corporate Annual Reports,http://www.withum.com/pressReleaseFiles/Annual%20Report%20Survey%20Results.pdf (accessed June 17,2007).

Locker−Kienzler: Business and Administrative Communication, Eighth Edition
V. Reports 16. Analyzing Information and Writing Report
© The McGraw−Hill Companies, 2008
554 Part 5 Reports
Incorrect: The first problem with the incentive program is that middle managers donot use good interpersonal skills in implementing it. For example, the hotel chef openly ridicules the program. As a result, the kitchen staff fearbeing mocked if they participate in the program.
Better: The first problem with the incentive program is that some middle man-agers undercut it. For example, the hotel chef openly ridicules the pro-gram. As a result, the kitchen staff fear being mocked if they participatein the program.
A strong writing style is especially important when you are preparing a re-port that relies on a wealth of statistics. Most people have difficulty absorbingnumber after number. To help your readers, use text to highlight the messageyou want the statistics to convey. Examples and action-oriented details keepthe reader engaged. An example that has this level of clarity is the 2004 reportof the US government’s commission investigating the terrorist attacks of September 11, 2001. The report was praised for its “solid, clear narrative thatprovides a sense of drama” and was described as being “richly detailed andcolorful” and using language that is “precise, economical and highly authori-tative.” The commission’s executive director, Philip D. Zelikow, said the re-port was intentionally made readable because the commission’s leadershipwanted people to read and act on it.21
2. Keep Repetition to a Minimum.Some repetition in reports is legitimate. The conclusion restates points madein the body of the report; the recommendations appear in the transmittal, theabstract or executive summary, and in the recommendations sections of thereport. However, repetitive references to earlier material (“As we have already seen”) may indicate that the document needs to be reorganized. Readthe document through at a single sitting to make sure that any repetitionserves a useful purpose.
3. Introduce Sources and Visuals.The first time you cite an author’s work, use his or her full name: “RosabethMoss Kanter points out. . . . ” In subsequent citations, use only the last name:“Kanter shows. . . . ” Use active rather than passive verbs.
The verb you use indicates your attitude toward the source. Says and writesare neutral. Points out, shows, suggests, discovers, and notes suggest that youagree with the source. Words such as claims, argues, contends that, believes, andalleges distance you from the source. At a minimum, they suggest that youknow that not everyone agrees with the source; they are also appropriate toreport the views of someone with whom you disagree.
The report text should refer to all visuals:
As Table 1 shows, . . .
See Figure 4.
4. Use Forecasting, Transitions, Topic Sentences, and Headings.Forecasts are overviews that tell the reader what you will discuss in a sectionor in the entire report. Make your forecast easy to read by telling the readerhow many points there are and using bullets or numbers (either words or fig-ures). In the following example, the first sentence in the revised paragraphtells the reader to look for four points; the numbers separate the four points
Who Did What?
The passive verbsand impersonal con-
structions in US reports of coalmine disasters (“coal dust waspermitted to accumulate” and“an accident occurred”) sug-gest that accidents are in-evitable. Who permitted the coaldust to accumulate? What couldhave been done to prevent theaccumulation? Mine disaster re-ports contain sentences like thefollowing: “The . . . fatality oc-curred when the victim pro-ceeded into an area . . . beforethe roof was supported.” Whydid the man who was killed gointo the area? Had a supervisorchecked to see that the roof wassupported? Who ordered what?
British reports of mine disas-ters, in contrast, focus on peopleand what they did to limit thedamage from the disaster. Per-haps as a result, British mineshave a much lower incidence ofdisasters than do US coal mines.
Adapted from Beverly A. Sauer,“Sense and Sensibility in TechnicalDocumentation: How Feminist Inter-pretation Strategies Can Save Livesin the Nation’s Mines,” Journal ofBusiness and Technical Communi-cation 7 (January 1993): 63–83.
Locker−Kienzler: Business and Administrative Communication, Eighth Edition
V. Reports 16. Analyzing Information and Writing Report
© The McGraw−Hill Companies, 2008
Chapter 16 Analyzing Information and Writing Reports 555
clearly. This overview paragraph also makes a contract with readers, whonow expect to read about tax benefits first and employee benefits last.
Paragraph without numbers: Employee stock ownership programs (ESOPs)have several advantages. They provide tax bene-fits for the company. ESOPs also create tax bene-fits for employees and for lenders. They provide adefense against takeovers. In some organizations,productivity increases because workers now havea financial stake in the company’s profits. ESOPsare an attractive employee benefit and help thecompany hire and retain good employees.
Revised paragraph with numbers: Employee stock ownership programs (ESOPs)provide four benefits. First, ESOPs provide taxbenefits for the company, its employees, andlenders to the plan. Second, ESOPs help create adefense against takeovers. Third, ESOPs may in-crease productivity by giving workers a financialstake in the company’s profits. Fourth, as an at-tractive employee benefit, ESOPs help the com-pany hire and retain good employees.
Transitions are words, phrases, or sentences that tell readers whether thediscussion is continuing on the same point or shifting points.
There are economic advantages, too.
(Tells the reader that we are still discussing advantages but that we havenow moved to economic advantages.)
An alternative to this plan is . . .
(Tells reader that a second option follows.)
The second factor . . .
(Tells reader that the discussion of the first factor is finished.)
These advantages, however, are found only in A, not in B or C.
(Prepares reader for a shift from A to B and C.)
A topic sentence introduces or summarizes the main idea of a paragraph.Readers who skim reports can follow your ideas more easily if each paragraphbegins with a topic sentence.
Hard to read (no topic sentence): Another main use of ice is to keep the fish fresh.Each of the seven kinds of fish served at therestaurant requires one gallon twice a day, for atotal of 14 gallons. An additional 6 gallons a dayare required for the salad bar.
Better (begins with topic sentence): Twenty gallons of ice a day are needed to keepfood fresh. Of this, the biggest portion (14 gallons)is used to keep the fish fresh. Each of the sevenkinds of fish served at the restaurant requires onegallon twice a day (7 � 2 � 14). An additional 6 gallons a day are required for the salad bar.
Headings (see Chapter 6 p. 156) are single words, short phrases, orcomplete sentences that indicate the topic in each section. A heading mustcover all of the material under it until the next heading. For example, Cost ofTuition cannot include the cost of books or of room and board. You can have
�
Legal Liability andReport Drafts
During civil litigation(such as a tort case
charging that a product has in-jured a user), rough drafts maybe important to establish thestate of mind and intent of adocument’s drafters.
To protect the company, onelawyer recommends labeling allbut the final draft “PreliminaryDraft: Subject to Change.” Thatway, if there’s ever a lawsuit, thecompany will be able to argue thatonly the final report, not the drafts,should be used as evidence.
Adapted from Elizabeth McCord,“‘But What You Really Meant Was . . .Multiple Drafts and Legal Liability,”paper presented at the Associationfor Business Communication Mid-west Regional Conference, Akron,OH, April 3–5, 1991.

Locker−Kienzler: Business and Administrative Communication, Eighth Edition
V. Reports 16. Analyzing Information and Writing Report
© The McGraw−Hill Companies, 2008
556 Part 5 Reports
just one paragraph under a heading or several pages. If you do have severalpages between headings you may want to consider using subheadings. Usesubheadings only when you have two or more divisions within a mainheading.
Topic headings focus on the structure of the report. As you can see from thefollowing example, topic headings give very little information.
Topic headings are vague.
RecommendationProblem
Situation 1Situation 2
Causes of the ProblemBackgroundCause 1Cause 2
Recommended Solution
Talking heads are specific.
Recommended Reformulation for Vibe BleachProblems in Maintaining Vibe’s Granular Structure
Solidifying during Storage and TransportationCustomer Complaints about “Blocks” of Vibe in Boxes
Why Vibe Bleach “Cakes”Vibe’s FormulaThe Manufacturing ProcessThe Chemical Process of Solidification
Modifications Needed to Keep Vibe Flowing Freely
Talking heads, in contrast, tell the reader what to expect. Talking heads,like those in the examples in this chapter, provide an overview of each sectionand of the entire report.
Headings must be parallel ( p. 124); that is, they must use the same gram-matical structure. Subheads must be parallel to each other but do not necessarilyhave to be parallel to subheads under other headings.
Not parallel: Are Students Aware of VIP?
Current Awareness among Undergraduate Students
Graduate Students
Ways to Increase Volunteer Commitment and Motivation
We Must Improve Training and Supervision
Can We Make Volunteers’ Hours More Flexible?
Providing Emotional Support to Volunteers
Provide More Information about Community Needs and VIP Services
�

Locker−Kienzler: Business and Administrative Communication, Eighth Edition
V. Reports 16. Analyzing Information and Writing Report
© The McGraw−Hill Companies, 2008
Chapter 16 Analyzing Information and Writing Reports 557
Parallel: Campus Awareness of VIP
Current Awareness among Undergraduate Students
Current Awareness among Graduate Students
Ways to Increase Volunteer Commitment and Motivation
Improving Training and Supervision
Improving the Flexibility of Volunteers’ Hours
Providing Emotional Support to Volunteers
Providing More Information about Community Needs and VIP Services
In a very complicated report, you may need up to three levels of headings.Figure 16.5 illustrates one way to set up headings. Follow these standardconventions for headings:
Typing Titles and Headings for Reports
For the title of a report, use a bold font two point sizes bigger than the largest size in the body of the report.You may want to use an even bigger size or a different font to create an attractive title page. Capitalize thefirst word and all major words of the title.
Typing Headings for Reports
Center main headings, capitalize the first and all major words, and use bold. In single-spaced text, leavetwo empty spaces before main headings and one after. Also leave an extra space between paragraphs. Youmay also want to use main headings that are one point size bigger than the body text.
This example provides just one example of each level of heading. However, in a real document, use headingsonly when you have at least two of them in the document. In a report, you'll have several.
Typing Subheadings
Most reports use subheadings under some main headings. Use subheadings only if you have at least twoof them under a given heading. It is OK to use subheadings in some sections and not in others. Normallyyou'll have several paragraphs under a subheading, but it's OK to have just one paragraph under somesubheadings.
Subheadings in a report use the same format as headings in letters and memos. Bold subheadings and setthem at the left margin. Capitalize the first word and major words. Leave two empty spaces before thesubheading and one empty space after it, before the first paragraph under the subheading. Use the samesize font as the body paragraphs.
Typing Further Subdivisions. For a very long report, you may need further subdivisions under asubheading. Bold the further subdivision, capitalizing the first word and major words, and end the phrasewith a period. Begin the text on the same line. Use normal spacing between paragraphs. Further subdivide asubheading only if you have at least two such subdivisions under a given subheading. It is OK to usedivisions under some subheadings and not under others.
12-pointtype
for bodytext
12-pointtype
Periodafterheading
14-point type.
12-point type.
Two empty spaces (triple space)Heading for maindivisions
Center the title;use bold anda bigger font.
Two empty spaces (triple space)Bold; left margin
One empty space
One empty space (normal paragraph spacing)
One empty space (double space)
Figure 16.5 Setting Up Headings in a Single-Spaced Document
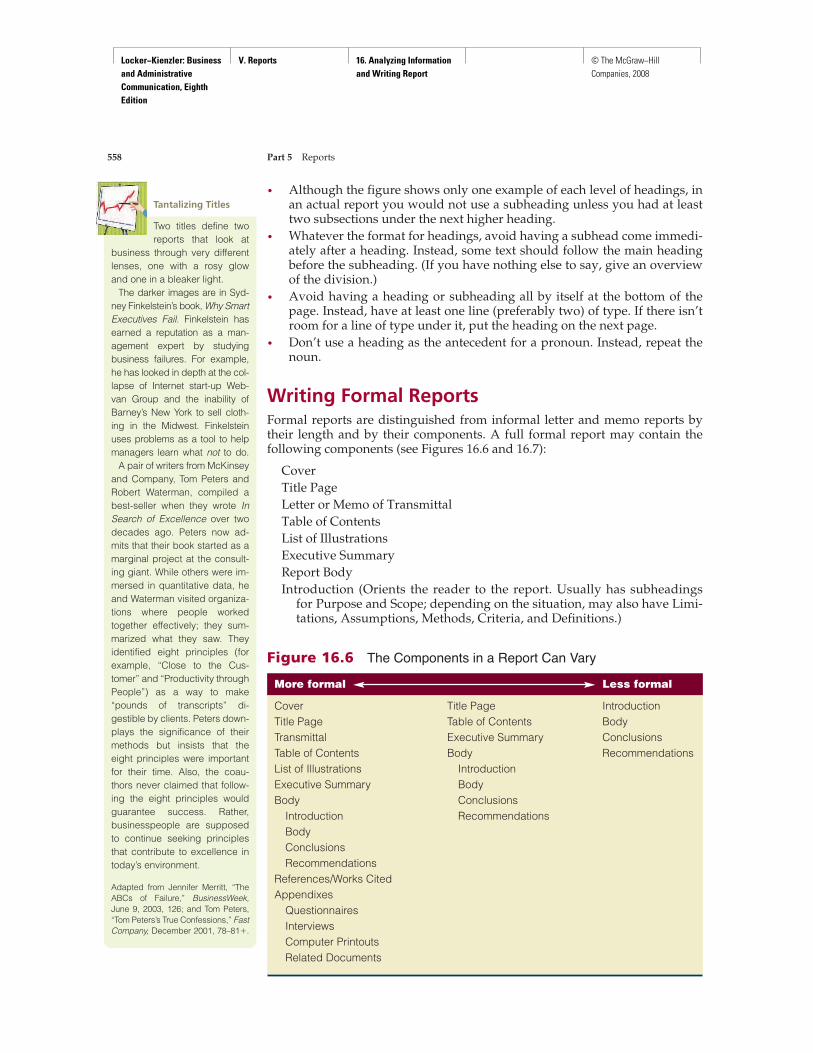
Locker−Kienzler: Business and Administrative Communication, Eighth Edition
V. Reports 16. Analyzing Information and Writing Report
© The McGraw−Hill Companies, 2008
558 Part 5 Reports
• Although the figure shows only one example of each level of headings, inan actual report you would not use a subheading unless you had at leasttwo subsections under the next higher heading.
• Whatever the format for headings, avoid having a subhead come immedi-ately after a heading. Instead, some text should follow the main headingbefore the subheading. (If you have nothing else to say, give an overviewof the division.)
• Avoid having a heading or subheading all by itself at the bottom of thepage. Instead, have at least one line (preferably two) of type. If there isn’troom for a line of type under it, put the heading on the next page.
• Don’t use a heading as the antecedent for a pronoun. Instead, repeat thenoun.
Writing Formal ReportsFormal reports are distinguished from informal letter and memo reports bytheir length and by their components. A full formal report may contain the following components (see Figures 16.6 and 16.7):
Cover
Title Page
Letter or Memo of Transmittal
Table of Contents
List of Illustrations
Executive Summary
Report Body
Introduction (Orients the reader to the report. Usually has subheadingsfor Purpose and Scope; depending on the situation, may also have Limi-tations, Assumptions, Methods, Criteria, and Definitions.)
Figure 16.6 The Components in a Report Can Vary
More formal Less formal
Cover Title Page IntroductionTitle Page Table of Contents BodyTransmittal Executive Summary ConclusionsTable of Contents Body RecommendationsList of Illustrations IntroductionExecutive Summary BodyBody Conclusions
Introduction RecommendationsBodyConclusionsRecommendations
References/Works CitedAppendixes
QuestionnairesInterviewsComputer PrintoutsRelated Documents
Tantalizing Titles
Two titles define tworeports that look at
business through very differentlenses, one with a rosy glowand one in a bleaker light.
The darker images are in Syd-ney Finkelstein’s book, Why SmartExecutives Fail. Finkelstein hasearned a reputation as a man-agement expert by studyingbusiness failures. For example,he has looked in depth at the col-lapse of Internet start-up Web-van Group and the inability ofBarney’s New York to sell cloth-ing in the Midwest. Finkelsteinuses problems as a tool to helpmanagers learn what not to do.
A pair of writers from McKinseyand Company, Tom Peters andRobert Waterman, compiled abest-seller when they wrote InSearch of Excellence over twodecades ago. Peters now ad-mits that their book started as amarginal project at the consult-ing giant. While others were im-mersed in quantitative data, heand Waterman visited organiza-tions where people worked together effectively; they sum-marized what they saw. Theyidentified eight principles (forexample, “Close to the Cus-tomer” and “Productivity throughPeople”) as a way to make“pounds of transcripts” di-gestible by clients. Peters down-plays the significance of theirmethods but insists that theeight principles were importantfor their time. Also, the coau-thors never claimed that follow-ing the eight principles wouldguarantee success. Rather,businesspeople are supposedto continue seeking principlesthat contribute to excellence intoday’s environment.
Adapted from Jennifer Merritt, “TheABCs of Failure,” BusinessWeek,June 9, 2003, 126; and Tom Peters,“Tom Peters’s True Confessions,” FastCompany, December 2001, 78–81�.

Locker−Kienzler: Business and Administrative Communication, Eighth Edition
V. Reports 16. Analyzing Information and Writing Report
© The McGraw−Hill Companies, 2008
Chapter 16 Analyzing Information and Writing Reports 559
Use a large font size
for the main title.Center all texton the title
page.
Use a slightly smaller
font size for thesub-heading.
No punctuation
The rest of the
document should use
12-point font size.
Name of reader,job title, organization,
city, state, andzip code.
Name of writer(s),organization, city,
state, and zip code.
Viva Panera!
Expanding Panera into Chile
Prepared for
Mr. Ronald M. Shaich, CEOPanera Bread Company
Richmond Heights, MO 63117
Prepared by
April 16, 2007
JOABA ConsultingApril Hoffmeyer
Betsy HertzAndrea KeeneyJessica OneyOmar Romero
Iowa State UniversityAmes, IA 50011
No punctuation
Date report isreleased
Figure 16.7 A Formal Report
(continued)

Locker−Kienzler: Business and Administrative Communication, Eighth Edition
V. Reports 16. Analyzing Information and Writing Report
© The McGraw−Hill Companies, 2008
560 Part 5 Reports
JOABA Consulting131 Ross HallAmes, IA 50011
April 17, 2006
Mr. Ronald M. Shaich, CEOPanera Bread Company6710 Clayton RoadRichmond Heights, MO 63117
Dear Mr. Shaich:
Here you will find the report you requested in March including information on the feasibility of expanding a Panera Bread facility into Chile and our recommendations for a plan of action.
During the market analysis, our team considered and researched various macro environment factors including location, customs and behaviors, economics and laws, and market possibilities and competition. Our findings show that Chile is an attractive market to invest in, and we recommend it as a location into which Panera Bread should expand. The research conducted about your business and Chile’s consumer market leads us to recommend opening a corporate-owned facility in the capital city of Santiago.
The capital city of Santiago is already home to many successful American franchises, and to stay competitive with these franchises, we suggest you expand into this market. With the use of appropriate marketing campaigns and employment of locals with management experience, your business has the potential to penetrate the market in Santiago.
The analysis in this report came from several helpful resources. The U.S. Commercial Services, the Central Intelligence Agency’s World Factbook, and the Santiago Chamber of Commerce were all very helpful and cooperative in answering our questions.
Thank you for allowing us to conduct this research. We have learned about Panera, the country of Chile, and the international business environment. If you have any questions, feel free to contact our firm at any time. We look forward to working with you in the future.
Sincerely,
April HoffmeyerJOABA Team Leader
This student group designed their
own letterhead, assuming they
were doing this report
as consultants.
This letter usesBlock format.
In paragraph 1, release the report.
note when and by whom the report
was authorized. Note report’s purpose.
Thank reader for the opportunity to do the research.
Offer to answer questions
about the report.
Center page number at the
bottom of the page. Use
a lowercase Roman
numeral for initial
pages of report.
Give recommendations
or thesis of
report.
Note sources
that were
helpful.
i
Figure 16.7 A Formal Report (Continued)
(continued)

Locker−Kienzler: Business and Administrative Communication, Eighth Edition
V. Reports 16. Analyzing Information and Writing Report
© The McGraw−Hill Companies, 2008
Chapter 16 Analyzing Information and Writing Reports 561
Letter of Transmittal
Executive Summary
Introduction Purpose & Scope Assumptions Methods Limitations Criteria
Location
Chilean Customs and Behaviors Food Preferences Eating Times Family Life Greetings and Address Body Language Religion
Chilean Politics Presidential Power Trade Agreements
Chilean Economics and Legal Concerns Economic Growth Currency and GDP Imports Franchising
Market Possibilities and Competitors
Conclusions and Recommendations
References
Figure 1 Economic Growth in Chile: 2000-2005
Figure 2 Franchising Ownership
Headings or subheadings mustbe parallel with a section.
Use lower-
case Roman
numerals for
initial pages.
Introduction
begins on
page I.
Line upright margin
(justify)
Table of
contents does
not list itself.
Capitalize first
letter of each
major word in
headings.
Indentions show
level of heading
at a glance.
Figures and tables are numbered independently,so you could have both a Figure 1 and a Table 1.Add a “List of Illustrations” at the
bottom of the page or on a separate
page if the report has graphs
and other visuals.
Table of Contents
List of Illustrations
11
111
2
2233344
444
55667
7
8
9
5
7
i
iii
1
ii
Figure 16.7 A Formal Report (Continued)
(continued)

Locker−Kienzler: Business and Administrative Communication, Eighth Edition
V. Reports 16. Analyzing Information and Writing Report
© The McGraw−Hill Companies, 2008
562 Part 5 Reports
Executive Summary
To remain competitive with an ever-expanding market, Panera should expand into Santiago, Chile’s capital. Santiago is home to approximately 5.6 million people and is one of the most modern cities in South America because of its buildings, subway system, and green areas. Santiago is already home to many American franchises, several direct competitors of Panera, and remaining competitive with these chains would be beneficial to Panera.
As far as our research shows, expanding into Chile is likely to be a profitable decision for a few reasons. For example, the country’s foods are similar to those of Panera’s and would not require extensive menu changes. In addition, the current economic situation is among the most stable in South America, and with an unemployment rate of 8%, there will likely be workers to fill positions at the restaurant. Moreover, the political standing and lack of legal barriers in Chile is beneficial to foreign-run businesses.
To ensure a successful expansion, JOABA recommends the following:
1. Expand into one location in Santiago, Chile. Opening one store in this large city will introduce the restaurant into the Chilean culture with minimal risk. The locals will have the opportunity to show their acceptance or rejection of Panera through their patronage. • Start a company-owned store (as opposed to a franchise).
• Open the store with both an American and Chilean manager so the American can train the Chilean in the business to ensure Panera’s identity is maintained.
• Hire local people in Santiago as employees.
2. Evaluate the success and expansion feasibility at the end of a 12 month period. • Survey locals for their feedback on the restaurant. • Explore additional places in Santiago to expand to (if expansion is the result of the evaluation).
3. After three years, investigate selling the company-owned stores to managers to transition the stores into franchises. • Evaluate the success of the stores based on sales and community response. • Research the economic feasibility of this change of ownership.
Many audiences only read theExecutive Summary, not the report.
Include enough information togive readers the key points
you make.
Reporttitle.
Start with recommendation
or thesis.
Provide brief
support for
recommen
-dation.
Language in Executive Summary
can come from report. Make
sure any repeated language
is well-written!The abstract or Executive Summary
contains the logical skeleton of
the report: the recommendation(s)
and evidence supporting it.
Viva Panera!Expanding Panera into Chile
iii
Figure 16.7 A Formal Report (Continued)
(continued)

Locker−Kienzler: Business and Administrative Communication, Eighth Edition
V. Reports 16. Analyzing Information and Writing Report
© The McGraw−Hill Companies, 2008
Chapter 16 Analyzing Information and Writing Reports 563
Viva Panera!: Expanding Panera into Chile 1
Introduction
To stay competitive in the global market, Panera Bread has asked us to explore expanding into Chile. In order to make a wise and well-researched proposal, JOABA Consulting has researched Chilean data to see if Panera would be potentially prosperous and successful there.
Purpose and ScopePanera has experienced recent success and is growing rapidly within the United States. To stay competitive in the global market, they must look to expand into other countries. The purpose of this research is to propose a plan stating if and to what extent Panera should expand into Chile.
This report will cover several topics about Chile including: location, customs and behaviors, politics, economics and laws, and market possibilities and competition. Throughout this report, we do not discuss topics dealing with the internal intricacies of Panera Bread Company. We also do not include any on-site research from local Chilean people.
AssumptionsOur recommendation is based on the assumption that Panera’s expansion process will be similar to that of other American competitors who have successfully opened stores in Chile. We are also assuming that Chile’s political outlook will remain stable and its economic situation will remain healthy.
MethodsThe information from this report came from newspapers, library books, and online sources. We have found the U.S. Commercial Services, the Central Intelligence Agency’s World Factbook, and Kwintessential Language and Cultural Specialists websites to be extremely useful resources to explore this expansion possibility.
LimitationsThis research was limited to materials available via the Internet and from our university’s library. In addition, only one of the five JOABA group members is a business major, and the other group members are somewhat unfamiliar with this type of business analysis. Time constraints have limited the possibility of an exhaustive search for information regarding the expansion of Panera Bread into Chile. Moreover, our group would have greatly benefited by actually traveling to Chile for on-location research.
CriteriaJOABA Consulting established criteria, which we used during our investigation of Chile. These criteria included the location, customs, politics, economic climate and legal issues, market
A running header is optional
“Purpose” and
“Scope” can
be separate
sections if
either islong
Topics in “Scope”
section should
match those
in the report.
Center main headings
Tell what you discuss and how thoroughlyyou discuss each topic Give topics
in the orderin which
you’ll discussthem
List any relevant topics you do not discuss.
Assumptions cannot be proved. But if they are wrong, the report’s recommendation may no
longerbe valid.If you collected
original data(surveys,interviews, or observations).
If your report has limitations, state them.
This section
outlines the
criteria used
to make
the overall
recommendation.
, tell how you chose whom to study, what
it just provides a brief discussion of significant sources.
the information. This report does not use original data;
kind of sample you used, and when you collected
Figure 16.7 A Formal Report (Continued)
(continued)

Locker−Kienzler: Business and Administrative Communication, Eighth Edition
V. Reports 16. Analyzing Information and Writing Report
© The McGraw−Hill Companies, 2008
564 Part 5 Reports
Viva Panera!: Expanding Panera into Chile 2
possibilities and competition. At least four of these five criteria needed to be favorable for us to give a positive recommendation.
Location
While Chile offers many possible cities for Panera to expand, we believe that Santiago would be the most prosperous. Santiago, the capital of Chile and home to approximately 5.6 million people, is one of the most modern cities of South America because of its buildings, subway system, and green areas (“Chile”). Expanding Panera Bread into Santiago would be ideal because of the large market.
Moreover, Santiago ranked first on AméricaEconomía’s list of the Best Cities for Doing Business in Latin America in 2005. The study looked at the costs and benefits of different locations and was based on the recommendations of international consulting firms. Santiago was found to add the most value to a business and to offer the best combination of quality of life, business potential, and professional development. The ranking also points out the city’s attention to transportation infrastructure, showing that it benefits both commuters and business visitors (“Business Environment”). In 2006, Santiago was ranked second behind Sao Paulo, Brazil.
The continued high ranking of Santiago reinforces it as one of the best cities for doing business in Latin America, and supports our belief that Santiago would make a great city in which Panera could expand.
Chilean Customs and Behaviors
Panera must have a deep understanding of the approximately 16 million Chilean people if it is to effectively adapt products to its new audience. Panera representatives, who would implement the plan, must appreciate and respect Chilean customs and behavioral norms so they do not send negative signals to the native Chilean people.
In order to ensure a smooth expansion effort for Panera, we have researched food preferences, eating times, family life, greetings and address, body language, and religion. The following information presents the results of this research and can serve as a guide to understanding some of the customs and behaviors of Chilean people.
Food PreferencesChilean cuisine boasts a wide range of tastes, which vary from region to region. Seafood dishes are popular, including the use of eel, bass, scallops, clams and other shellfish. Although many assume Chilean food to be hot, spiciness is a rarity in this country. Chano en piedra and pebre are two common spices used in Chilean cooking. Chano en piedra is made by grinding tomato, garlic and onions with a stone. Pebre is made from tomatoes, onions, chili, coriander, and chives. Main dishes are commonly made from beef, chicken or pork and lots of vegetables (“Typical Chilean”).
Triple space before headings
It's ok tohave subheadings
under someheadings andnot others.
Begin most paragraphs with topic sentences.
Not every idea needsa source. Here, generalpopulation figures arereadily available.
Italicize
titles.
List subtopics
in the order
in which
they are
discussed.
Use subheadings only when
you have two or more
sections
Figure 16.7 A Formal Report (Continued)
(continued)

Locker−Kienzler: Business and Administrative Communication, Eighth Edition
V. Reports 16. Analyzing Information and Writing Report
© The McGraw−Hill Companies, 2008
Chapter 16 Analyzing Information and Writing Reports 565
Viva Panera!: Expanding Panera into Chile 3
Sandwiches and breads are also popular in Chile. Both cold and grilled sandwiches are served for the smaller meals during the day. The type of sandwiches eaten ranges from ham and chicken deli meat to hamburgers and hotdogs, usually topped with vegetables, especially tomatoes and avocados. Breads are also served at smaller meals. Pan amasado is a homemade bread and sopaipilla is a deep fried flat bread made using pumpkin and flour (“Typical Chilean”).
Many Chilean dishes correspond with Panera’s menu. The popularity of vegetables suggests salads would work well. Sandwiches are well-liked in Chile both grilled and cold, often with deli meats. Panera could easily adapt their menu for the Chilean people by blending traditional Panera flavors with common Chilean flavors. Soups and stews are common in Chile and could also be adapted for a menu in Chile. A Panera in Chile could also offer more seafood dishes because of its popularity and availability. Panera’s traditional coffees and teas would fit in to the culture and could be served, especially during the once meal.
Eating TimesIn Chile, most people customarily eat four meals a day. Breakfast is a small meal consisting of fresh bread with jelly or manjar (a caramel-like spread). Lunch is the largest meal of the day, having several courses, usually a cazuela soup or stew, a main dish, and a vegetable side dish, often beans. Once (pronounced own-say) is served in the afternoon between 4:00 and 7:00 PM. It includes bread or a sandwich served with coffee or tea. Dinner is a smaller meal than lunch and is typically served late evening (Rawlinson).
Family LifeChilean life is family-centered, and people spend a lot of time with their extended family and distant relatives. Large family gatherings are common, and Panera restaurants in Chile would have to cater to the needs of large groups for such events. Family is also important in the business world, as many businesses in Chile are run by a single family (Nicol). A Panera franchise could potentially be owned and operated by a single family.
Greetings and AddressPeople in Chile are traditional as well as friendly. When greeting someone new, a firm handshake and good eye contact are usually expected. If a man is greeting a friend or family member, he would give them a hug, while a woman would kiss them on the cheek (“Chile: Society”). When engaged in conversation, Chileans speak close to one another and usually maintain eye contact. Common conversational topics are family and children (Nicol).
Addressing people by the proper name is important to build goodwill with people in business.In Chile, it is common for people to have two surnames, one from both the mother and thefather. Most of the time the father’s name is first and that is what most people will go by(“Chilean Culture”).
Period goes outside of the parenthesis.
Use author’s name in parentheses when it isn't
in the sentence introducing quote.
Figure 16.7 A Formal Report (Continued)
(continued)

Locker−Kienzler: Business and Administrative Communication, Eighth Edition
V. Reports 16. Analyzing Information and Writing Report
© The McGraw−Hill Companies, 2008
566 Part 5 Reports
Viva Panera!: Expanding Panera into Chile 4
Body LanguageBody language is also important to keep in mind when interacting with someone from Chile. Hitting your fist into the other hand is usually considered obscene. Holding one’s fist to the same height as their head is a sign of communism. In addition, a hand palm-up with fingers spread out signals you think something is stupid. Moreover, yawns should always be covered or stifled (Nicol). At meals, hands should always be above the table, with wrists resting on the edge of the table. Serving wine with the left hand is sometimes seen as disrespectful. (“Chile: Society”).
ReligionRoman Catholicism is the predominant religion in Chile, making up 89% of the population (“Chile”). The religion is integrated into the society, as it is taught in most public schools and is the reason for most public holidays. Even many of the country’s laws are influenced by Catholic beliefs. For example, because of the Church’s inherent disbelief in divorce, it was illegal until 2004 (“Chile: Society”). The religion of Chile would affect Panera’s business, particularly during the Lenten season, because Catholics change their diet by refraining from eating meat on Fridays. The Catholic religion also affects holidays for the customers, as well as the employees.
Chilean Politics
To comprehend the importance of the current political stability, Panera must understand some recent Chilean political history. Specifically, it should know about presidential power and trade agreements.
Presidential PowerIn 1973, Augusto Pinochet led a military coup and declared himself president. His regime hurt the country and its economy, closing down the Chilean Parliament and banning all political and trade union activity. Pinochet was overthrown in 1990 and democracy was finally restored to Chile. (Franklin).
Chile is currently a republic with seven primary political parties, which are grouped into two main groups (“Why Chile?”). The Concertación coalition has been in power since the end of Pinochet’s rule. In January 2006, the first female president in Chile's history, Michelle Bachelet, was elected. Bachelet is the fourth consecutive head of state from the center-left Concertación coalition (“Business Environment”).
Trade AgreementsIn addition to the positive political environment, the country is also taking positive steps to improve its stability through relations with other countries. The U.S. Chile Free Trade Agreement (FTA) has expanded U.S-Chilean trade ties and relations between the U.S. and Chile, and they are the best they have ever been (Santiago–Chile). The two governments regularly discuss issues
Use first words of the titlein quotation marks for sources with no author.
Headings must covereverything under thatheading until next one.
Capitalize all main words ofheadings and subheadings.
Figure 16.7 A Formal Report (Continued)
(continued)

Locker−Kienzler: Business and Administrative Communication, Eighth Edition
V. Reports 16. Analyzing Information and Writing Report
© The McGraw−Hill Companies, 2008
Chapter 16 Analyzing Information and Writing Reports 567
Viva Panera!: Expanding Panera into Chile 5
of mutual concern including multilateral diplomacy, security, culture, and science. The strong relationship between the governments shows the political stability of Chile. The U.S. Embassy in Santiago will also be available to assist Panera through its involvement in strengthening the relationship between the two countries (Santiago–Chile).
Chilean Economics and Legal Concerns
We believe that Panera should know characteristics of the Chilean economy and other legal concerns before expanding. Ideally, Panera wants a stable economy before expanding there because economic instability might affect Panera’s success. The local currency and its stability should be taken into account when considering how to price our products. The GDP per capita is also important because it is an indicator of the average income of an average citizen. Our analysis of Chile’s economy shows us that it is well suited for the expansion of Panera Bread into its market because of its stable and growing economy and its willingness to allow foreign investment and free trade.
Economic GrowthBy the end of 1999, exports and economic activity had begun to recover from the low growth levels seen for much of the 90s. By 2000, economic growth increased to 4.5%. However, growth once again dropped in 2001 to 3.4% and to 2.2% in 2002 as seen in Figure 1. The drop occurred largely because of low global growth, and the devaluation of the Argentine peso (“Business Environment”).
Economic Growth in Chile 2000–2005
However, in 2003, Chile’s economy began a recovery resulting in growth of 3.7% and increases to 6.2% and 6.3% in 2004 and 2005, respectively, while Chile maintained a low rate of inflation
Refer to Figure in textbefore you show it. Tellwhat point it makes.
Provide a heading forfigures and tables.
Figure 1. Recent economic growth rates in Chile (“Business Environment’’).
Label bothaxes. SeeChapter 6 formore infor-mation oncreatinggraphsand visuals.
Number Figures
and Tables
independently
7.0%
6.0%
5.0%
4.0%
3.0%
2.0%
1.0%
0.0%2000 2001 2002
Year
GROW
TH (%
)
2003 2004 2005
4.5%
3.4%
2.2%
3.7%
6.2% 6.3%
Figure 16.7 A Formal Report (Continued)
(continued)

Locker−Kienzler: Business and Administrative Communication, Eighth Edition
V. Reports 16. Analyzing Information and Writing Report
© The McGraw−Hill Companies, 2008
568 Part 5 Reports
Viva Panera!: Expanding Panera into Chile 6
(“Business Environment”). Over the last few years, GDP growth can be attributed to record high copper prices, solid export earnings, and increased foreign investment. The growth in GDP has reduced inflation but unemployment remains high at 8.0% (“Chile”), which indicates a large labor pool.
Currency and GDPThe currency of Chile is the Chilean Peso (CPL), and the current exchange rate between the U.S. dollar and the Chilean Peso is $1 to 514.90 CPL. In recent years, the Chilean Peso has strengthened significantly against the U.S. dollar and has remained stable. This can be attributed to the growing GDP of the country and increased trade with other countries (“Chile”). The stable currency will make Panera’s expansion more favorable.
In 2005, the GDP was $180.6 billion, with a GDP per capita of approximately $11,300. In 2005, Chile had a current account balance of $309 million and external debt of $44.8 billion. As of 2002, Chile has not received economic aid from the IMF, the World Bank, or another country (“Chile”). Chile serves as an economic model for the rest of Latin America with its continued economic growth and is expected to continue growing into 2009 (“Business Environment”).
ImportsThe country’s largest import partners are Argentina, United States, Brazil, and China. Chile is relatively open to trade and investment and has a Free Trade Agreement with the United States. When the U.S.-Chile Free Trade Agreement came into effect in January 1, 2004, 90% of tariffs on U.S. exports were eliminated. By 2015, all trade between the two countries will be duty free.
Typically, Chile has few barriers to imports. However, in the case of agriculture, some exceptions apply. If Panera is going to import processed food products, it will have to obtain permission from the Health Service Officer at the port of entry, who will take samples and perform necessary tests. Upon importation of products, there is some necessary documentation that will have to accompany the products. This documentation includes commercial invoices, certificates of origin, bills of lading, freight insurance and packing lists. Franchises are subject to regular trade laws. The withholding tax on royalties is 35% and all imports are subject to 19% value-added tax (“Made”).
In addition, Chile has certain labeling requirements for imported products. The product must display the country of origin before being sold. Packaged goods must be marked with the quality, purity, ingredients, and the net weight or measure. The labeling must also be in Spanish and measurements should use the metric system. Foreign firms in Chile are allowed the same protection and operate under the same conditions as local firms. Trademarks, patents, industrial designs, models, and copyrights are protected in Chile under the Paris Convention because Chile belongs to the World Intellectual Property Organization. Trademark stockpiling is rather common in Chile, so U.S. companies are encouraged to register their trademark as soon as possible (“Made”).
Figure 16.7 A Formal Report (Continued)
(continued)

Locker−Kienzler: Business and Administrative Communication, Eighth Edition
V. Reports 16. Analyzing Information and Writing Report
© The McGraw−Hill Companies, 2008
Chapter 16 Analyzing Information and Writing Reports 569
Viva Panera!: Expanding Panera into Chile 7
This legal analysis provides Panera with a synopsis of the opportunities and restrictions available to the company when considering doing business in Chile. These legal restrictions will need to be followed if opening a facility in Chile so that any legal risk between the business and consumers or the government can be avoided.
FranchisingChile has no franchising laws that might restrict the advancement of Panera. (“Chile”). The current franchise fee of a Panera store is $35,000 plus royalties of 4–5% of annual sales (“Panera Bread”). Because of this high startup cost, the Panera facility that would open in Chile would be company owned. After an evaluation of the success of the initial restaurant, the facility could change from being company owned to becoming a franchise with opportunities to expand in numbers of franchises.
Market Possibilities and Competitors
Panera also needs to be aware of the Chilean market possibilities and current competitors, now there are about 50 franchise businesses operating in Chile with over 914 locations. As seen below in Figure 2, U.S.-run franchise operations account for 55% of the total Chilean markets mostly because of technology, convenience, and marketing strategies borrowed from the U.S.
American restaurant franchises currently present are Domino’s Pizza, Kentucky Friend Chicken,Pizza Hut, Burger King, Dunkin Donuts, Bennigans, Chuck E. Cheese, TGI Fridays, Taco Bell,McDonalds, Au Bon Pain, and Ruby Tuesday. The local franchise competitors are Schop Dog,
Figure 2. The current franchising ownershipin Santiago, Chile (“Franchising”).
Refer to Figure beforeit appears in report.
Be sure toproofread for
errors such
as incorrect
words andcommasplices.
Note that spelling
checkers would not
catch this mistake.
Number Figures
consecutively throughout
the report.
U.S.Chil
eSpa
in
German
y
Canad
aIta
lyOthe
r
55%
36%
4% 1% 1% 1% 2%0%
20%
40%
60%
80%
100%
Franchising Ownership
Figure 16.7 A Formal Report (Continued)
(continued)

Locker−Kienzler: Business and Administrative Communication, Eighth Edition
V. Reports 16. Analyzing Information and Writing Report
© The McGraw−Hill Companies, 2008
570 Part 5 Reports
Viva Panera!: Expanding Panera into Chile 8
Lomito’n, and Doggis, all fast food restaurants, and Tavelli. These local competitors are in direct competition with American based franchises, especially in Santiago (“Can One Get a Decent”). This competition most likely will be positive for Panera because of the market awareness created by the competitors.
However, it should be noted that full service restaurants are listed among the best commercial opportunities because in general, they can compete with the inadequate amount of restaurants present (“Franchising”). Some café and bakery style restaurants such as Au Bon Pain, a North American chain marketed as a bakery/cafeteria serving a variety of sandwiches, salads, and breads, have done extremely well in Santiago. The marketability of Au Bon Pain restaurants and the chain’s success in Chile is a key indicator that Panera could do the same (“Can One Get a Decent”).
Moreover, other foreign restaurants have done equally well. For example, Doggendorf is a family-run German bakery in Santiago. The franchise began as a doughnut shop, and has now expanded into a larger commercial operation of four family-owned and run bakeries. The fact that Chileans have accepted this foreign bakery is a good indicator that Panera would also be well-accepted (“Your Complete Guide”).
Conclusions and Recommendations
Chile’s unique culture and customs, progressive politics, and efficient business management along with its growing economy leads JOABA Consulting to suggest their market is ready for a new franchise. Therefore, we conclude that Panera should expand into Chile. We recommend the following process to ensure a successful expansion:
1. Expand into one location in Santiago, Chile. Opening one store in this large city will introduce the restaurant into the Chilean culture with minimal risk. The locals will have the opportunity to show their acceptance or rejection of Panera through their patronage. • Start a company-owned store (as opposed to a franchise).
• Open the store with both an American and Chilean manager so the American can train the Chilean in the business to ensure Panera’s identity is maintained.
• Hire local people in Santiago as employees.
2. Evaluate the success and expansion feasibility at the end of a 12-month period. • Survey locals in the area for their feedback on the restaurant. • Explore additional places in Santiago to expand to (if expansion is the result of the evaluation).
3. After three years, investigate selling the company-owned stores to managers to transition the stores into franchises. • Evaluate the success of the stores based on sales and community response. • Research the economic feasibility of this change of ownership.
Conclusions repeat points made in the report.
Recommendationsare actionsthe readersshould take.
Numbering points
makes it easy
for readers to
follow and
discuss them.
Make sure all
items in a list
are parallel
Because many readers turn to the “Recommendations”
first, provide enough information so that the reason is
clear all by itself. The ideas in this section must be logical
extensions of the points made and supported in the body of the report.
Some companies ask for Conclusions andRecommendations at the beginning of the report.
Figure 16.7 A Formal Report (Continued)
(continued)

Locker−Kienzler: Business and Administrative Communication, Eighth Edition
V. Reports 16. Analyzing Information and Writing Report
© The McGraw−Hill Companies, 2008
Chapter 16 Analyzing Information and Writing Reports 571
Viva Panera!: Expanding Panera into Chile 9
References
“Business Environment.” Chile Foreign Investment Committee. 2006. 30 March 2007. <http://www.cinver.cl/index/plantilla3.asp?id_seccion=7&id_subsectiones=32>.
“Can One Get Decent Coffee in Santiago?” Tourism Promotion Corporation of Chile. 2006. 2 April 2006. <http://www.visit-chile.org/50faq/50faq-section-eng.phtml?id_secc=5>.
“Chile.” Central Intelligence Agency: The World Factbook. 10 Jan. 2006. 29 March 2007 <http://www.cia.gov/library/publications/the-world-factbook/geos/ci.html>.
“Chile: Culture and Customs.” San Marcos Church. 30 July 2002. 30 March 2007. <http://www.sanmarcoschurch.cl/fr_culture.html>.
“Chile: Society, Language and Culture Guide.” Kwintessential Language and Cultural Specialists. 2006. 30 Mar. 2007. <http://www.kwintessential.co.uk/resources/global-etiquette/chile.html>.
“Franchising.” U.S. Commercial Service. 2006. U.S.A. Department of Commerce. 2 April 2007. <www.buyusa.gov/chile>.
Franklin, Jonathan. “Chile Identified 35,000 Victims of Pinochet.” Guardian Unlimited. 15 November 2004. 16 June 2007.<http://www.guardian.co.uk/ chile/story/0,13755,1351421,00.html>.
“Made in USA, Sold in Chile.” Buyusa.Gov. 2006. U.S. Commercial Service. 29 March 2007. <www.buyusa.gov/chile/en>.
Nicol, Joni. “Chile.” International Business Center. 2003. International-Business- Center.Com. 30 March 2007. <http://www.cyborlink.com/besite/chile.htm>.
Panera Bread. 2007. 29 Mar. 2007 <http://www.panerabread.com/>.
Rawlinson, Joe. “Chilean Food.” Pepe’s Chile. 1995-2006. Joe’s Kitchen. 30 March 2007. <http://www.joeskitchen.com/chile/culture/food.htm>.
Santiago–Chile. “Embassy of the USA.” 2007. U.S. Department of State. 29 March 2007. <www.usembassy.cl>.
“Typical Chilean Food and Drink.” Woodward Chile. 28 November 2005. Woodward: A Different Kind of Thinking. 30 March 2007. <http://www.woodward.cl.chilefood.htm>.
“Your Complete Guide to Santiago.” Area Guides.Net. 2006. 2 April 2007 <http://santiagoch.ags.myareaguide.com/index.html?detailID=57577&SSC=413>.
This report uses MLA
citation style
Remove
hyperlinks from
URLs; enclose
URLs in brackets.
Compare this list of
sources with those
in the proposal.
Notice how the
authors had to
adjust the list
as they
completed the
research.
Start with title of article or Web site when no author is given.
List all the printed and online sources cited in your report. Do notlist sources you used for background but did not cite.
Figure 16.7 A Formal Report (Concluded)

Locker−Kienzler: Business and Administrative Communication, Eighth Edition
V. Reports 16. Analyzing Information and Writing Report
© The McGraw−Hill Companies, 2008
572 Part 5 Reports
Background or History of the Problem (Orients the reader to the topic ofthe report. Serves as a record for later readers of the report.)
Body (Presents and interprets data in words and visuals. Analyzes causesof the problem and evaluates possible solutions. Specific headings willdepend on the topic of the report.)
Conclusions (Summarizes main points of report.)
Recommendations (Recommends actions to solve the problem. May becombined with Conclusions; may be put at beginning of body ratherthan at the end.)
Notes, References, or Works Cited (Documents sources cited in the report.)
Appendixes (Provides additional materials that the careful reader may want:transcripts of interviews, copies of questionnaires, tallies of all the questions,complex tables, computer printouts, previous reports.)
As Figure 16.6 shows, not every formal report necessarily has all these components. In addition, some organizations call for additional componentsor arrange these components in a different order. As you read each section below, you may want to turn to the corresponding pages of the long report inFigure 16.7 to see how the component is set up and how it relates to the totalreport.
Title PageThe title page of a report usually contains four items: the title of the report, theperson or organization for whom the report is prepared, the person or groupwho prepared the report, and the release date. Some title pages also contain abrief summary or abstract of the contents of the report; some title pages containdecorative artwork.
The title of the report should be as informative as possible. Like subjectlines, report titles are straightforward.
Poor title: New Plant Site
Better title: Eugene, Oregon, Site for the New Kemco Plant
Large organizations that issue many reports may use two-part titles tomake it easier to search for reports electronically. For example, US govern-ment report titles first give the agency sponsoring the report, then the title ofthat particular report.
Small Business Administration: Management Practices Have Improved for theWomen’s Business Center Program
In many cases, the title will state the recommendation in the report: “Whythe United Nations Should Establish a Seed Bank.” However, the title shouldomit recommendations when
• The reader will find the recommendations hard to accept.
• Putting all the recommendations in the title would make it too long.
• The report does not offer recommendations.
If the title does not contain the recommendation, it normally indicates whatproblem the report tries to solve.
Eliminate any unnecessary words:
Wordy: Report of a Study on Ways to Market Life Insurance to Urban Professional People Who Are in Their Mid-40s
Better: Marketing Life Insurance to the Mid-40s Urban Professional

Locker−Kienzler: Business and Administrative Communication, Eighth Edition
V. Reports 16. Analyzing Information and Writing Report
© The McGraw−Hill Companies, 2008
Chapter 16 Analyzing Information and Writing Reports 573
The identification of the receiver of the report normally includes the nameof the person who will make a decision based on the report, his or her job title,the organization’s name, and its location (city, state, and zip code). Govern-ment reports often omit the person’s name and simply give the organizationthat authorized the report.
If the report is prepared primarily by one person, the Prepared by sectionwill have that person’s name, his or her title, the organization, and its location(city, state, and zip code). In internal reports, the organization and location areusually omitted if the report writer works at the headquarters office.
If several people write the report, government reports normally list all theirnames, using a separate sheet of paper if the group working on the report islarge. Practices in business differ. In some organizations, all the names arelisted; in others, the division to which they belong is listed; in still others, thename of the chair of the group appears.
The release date, the date the report will be released to the public, is usuallythe date the report is scheduled for discussion by the decision makers. The re-port is frequently due four to six weeks before the release date so that the deci-sion makers can review the report before the meeting.
If you have the facilities and the time, try using type variations, color, andartwork to create a visually attractive and impressive title page. However, aplain typed page is acceptable. The format in Figure 16.7 will enable you tocreate an acceptable typed title page.
Letter or Memo of TransmittalUse a letter of transmittal if you are not a regular employee of the organizationfor which you prepare the report; use a memo if you are a regular employee.See Appendix A for letter and memo formats.
The transmittal has several purposes: to transmit the report, to orient thereader to the report, and to build a good image of the report and of the writer. Aninformal writing style is appropriate for a transmittal even when the style in thereport is more formal. A professional transmittal helps you create a good imageof yourself and enhances your credibility. Personal statements are appropriate inthe transmittal, even though they would not be acceptable in the report itself.
Organize the transmittal in this way:
1. Transmit the report. Tell when and by whom it was authorized and thepurpose it was to fulfill.
2. Summarize your conclusions and recommendations. If the recommen-dations will be easy for the reader to accept, put them early in the trans-mittal. If they will be difficult, summarize the findings and conclusionsbefore the recommendations.
3. Mention any points of special interest in the report. Show how you sur-mounted minor problems you encountered in your investigation. Thankpeople who helped you. These optional items can build goodwill andenhance your credibility.
4. Point out additional research that is necessary, if any. Sometimes yourrecommendation cannot be implemented until further work is done. Ifyou’d be interested in doing that research, or if you’d like to implementthe recommendations, say so.
5. Thank the reader for the opportunity to do the work and offer to answerquestions. Even if the report has not been fun to do, expressing satisfactionin doing the project is expected. Saying that you’ll answer questions aboutthe report is a way of saying that you won’t charge the reader your normalhourly fee to answer questions (one more reason to make the report clear!).
The letter of transmittal on page i of Figure 16.7 uses this pattern of organization.
Report Your Way to a Better Job
Joan was hired by acomputer company to find ref-erences to the computer indus-try in current publications. Toexpand her job description,Joan wrote reports summarizingthe data instead of just sendingfiles of clippings. The receiverswere delighted because shewas saving them time.
Her second step was to meetwith the people who got her re-ports to ask them what sorts ofinformation they needed. Nowshe was able to target her re-ports to her readers’ needs. Peo-ple in each unit began to inviteher to meetings discussing theprojects she was researching.
As a member of the variousgroups within the company,Joan now had the informationshe needed to take a third step:drafting the report for decisionmakers. For example, if thesales department wanted infor-mation for a proposal to a client,she presented her informationin a sales proposal. If the presi-dent wanted material for aspeech, she arranged her infor-mation in a speech outline.
When the director of businesscommunications resigned, Joanwas the obvious choice for thejob.
Adapted from Janice LaRouche,“I’m Stuck in a Dead-End Job,”Family Circle, March 24, 1987, 121.

Locker−Kienzler: Business and Administrative Communication, Eighth Edition
V. Reports 16. Analyzing Information and Writing Report
© The McGraw−Hill Companies, 2008
574 Part 5 Reports
Table of ContentsIn the table of contents, list the headings exactly as they appear in the body ofthe report. If the report is less than 25 pages, you’ll probably list all the levelsof headings. In a very long report, pick a level and put all the headings at thatlevel and above in the table of contents.
Page ii of Figure 16.7 shows the table of contents.
List of IllustrationsA list of illustrations enables readers to refer to your visuals.
Report visuals comprise both tables and figures. Tables are words or num-bers arranged in rows and columns. Figures are everything else: bar graphs,pie charts, flow charts, maps, drawings, photographs, computer printouts,and so on. Tables and figures may be numbered independently, so you mayhave both a Table 1 and a Figure 1. In a report with maps and graphs but noother visuals, the visuals are sometimes called Map 1 and Graph 1. Whateveryou call the illustrations, list them in the order in which they appear in the report; give the name of each visual as well as its number.
See Chapter 6 for information about how to design and label visuals.
Executive SummaryAn executive summary or abstract tells the reader what the document isabout. It summarizes the recommendation of the report and the reasons forthe recommendation or describes the topics the report discusses and indicatesthe depth of the discussion. It should be clear even to people who will readonly the abstract.
A good abstract is easy to read, concise, and clear. Edit your abstract carefullyto tighten your writing and eliminate any unnecessary words.
Wordy: The report describes two types of business jargon, businessese and reversegobbledygook. He gives many examples of each of these and points out howtheir use can be harmful.
Tight: The report describes and illustrates two harmful types of business jargon,businessese and reverse gobbledygook.
It’s OK to use exactly the same words in the abstract and the report.Abstracts generally use a more formal style than other forms of business
writing. Avoid contractions and colloquialisms. Try to avoid using the second-person you. Because reports may have many different readers, you may becomeinaccurate.
Summary abstracts present the logical skeleton of the article: the thesis orrecommendation and its proof. Use a summary abstract to give the most usefulinformation in the shortest space.
�
To market life insurance to mid-40s urban professionals, Interstate Fidelity Insuranceshould advertise in upscale publications and use direct mail.
Network TV and radio are not cost-efficient for reaching this market. This group com-prises a small percentage of the prime-time network TV audience and a minority of mostradio station listeners. They tend to discard newspapers and general-interest magazinesquickly, but many of them keep upscale periodicals for months or years. Magazines with high percentages of readers in this group include Architectural Digest, Bon Appetit, BusinessWeek, Forbes, Golf Digest, Metropolitan Home, Southern Living, and

Locker−Kienzler: Business and Administrative Communication, Eighth Edition
V. Reports 16. Analyzing Information and Writing Report
© The McGraw−Hill Companies, 2008
Chapter 16 Analyzing Information and Writing Reports 575
IntroductionThe Introduction of the report always contains a statement of purpose andscope and may include all the parts in the following list.
• Purpose. The purpose statement ( p. 493) identifies the organizationalproblem the report addresses, the technical investigations it summarizes,and the rhetorical purpose (to explain, to recommend).
• Scope. The scope statement identifies how broad an area the reportsurveys. For example, Company XYZ is losing money on its line of com-puters. Does the report investigate the quality of the computers? The ad-vertising campaign? The cost of manufacturing? The demand forcomputers? A scope statement allows the reader to evaluate the report onappropriate grounds. If the person who approved the proposal accepted afocus on advertising, then one cannot fault a report that considers onlythat factor.
• Assumptions. Assumptions in a report are like assumptions in geometry:statements whose truth you assume, and which you use to prove your finalpoint. If they are wrong, the conclusion will be wrong too.
For example, to plan cars that will be built five years from now, an auto-mobile manufacturer commissions a report on young adults’ attitudes toward cars. The recommendations would be based on assumptions bothabout gas prices and about the economy. If gas prices radically rose or fell,the kinds of cars young adults wanted would change. If there were a majorrecession, people wouldn’t be able to buy new cars.
Almost all reports require assumptions. A good report spells out its as-sumptions so that readers can make decisions more confidently.
�
Smithsonian. Most urban professionals in their mid-40s are already used to shopping bymail and respond positively to well-conceived and well-executed direct mail appeals.
Any advertising campaign needs to overcome this group’s feeling that they al-ready have the insurance they need. One way to do this would be to encourage themto check the coverage their employers provide and to calculate the cost of their chil-dren’s expenses through college graduation. Insurance plans that provide savingsand tax benefits as well as death benefits might also be appealing.
One way to start composing an abstract is to write a sentence outline. Asentence outline not only uses complete sentences rather than words orphrases but also contains the thesis sentence or recommendation and theevidence that proves that point. Combine the sentences into paragraphs,adding transitions if necessary, and you’ll have your abstract.
Descriptive abstracts indicate what topics the report covers and howdeeply it goes into each topic, but they do not summarize what the report saysabout each topic. Phrases that describe the report (“this report covers,” “it in-cludes,” “it summarizes,” “it concludes”) are marks of a descriptive abstract.An additional mark of a descriptive abstract is that the reader can’t tell whatthe report says about the topics it covers.
This report recommends ways Interstate Fidelity Insurance could market insurance tomid-40s urban professionals. It examines demographic and psychographic profiles ofthe target market. Survey results are used to show attitudes toward insurance. The report suggests some appeals that might be successful with this market.

Locker−Kienzler: Business and Administrative Communication, Eighth Edition
V. Reports 16. Analyzing Information and Writing Report
© The McGraw−Hill Companies, 2008
576 Part 5 Reports
• Methods. If you conducted surveys, focus groups, or interviews, youneed to tell how you chose your subjects, and how, when, and wherethey were interviewed. If the discussion of your methodology is morethan a paragraph or two, you should probably make it a separate sec-tion in the body of the report rather than including it in the introduc-tion. Reports based on scientific experiments usually put the methodssection in the body of the report, not in the Introduction.
If your report is based solely on library or online research, provide abrief description of significant sources. See Chapter 15 on how to citeand document sources.
• Limitations. Limitations make your recommendations less valid orvalid only under certain conditions. Limitations usually arise becausetime or money constraints haven’t permitted full research. For example, acampus pizza restaurant considering expanding its menu may ask for areport but not have enough money to take a random sample of studentsand townspeople. Without a random sample, the writer cannot generalizefrom the sample to the larger population.
Many recommendations are valid only for a limited time. For in-stance, a campus store wants to know what kinds of clothing will ap-peal to college men. The recommendations will remain in force only fora short time: Three years from now, styles and tastes may havechanged, and the clothes that would sell best now may no longer be indemand.
• Criteria. The criteria section outlines the factors or standards that youare considering and the relative importance of each. If a company ischoosing a city for a new office, is the cost of office space more or less im-portant than the availability of skilled workers? Check with your audi-ence before you write the draft to make sure that your criteria matchthose of your readers.
• Definitions. Many reports define key terms in the introduction. For instance, a report on unauthorized Internet use by employees might de-fine what is meant by “unauthorized uses.” A report on the corporatedress code might define such codes broadly to include general appear-ance, so it could include items such as tattoos, facial piercings, and generalcleanliness. Also, if you know that some members of your primary, sec-ondary, or intermediate audience will not understand technical terms, define them. If you have only a few definitions, you can put them in the In-troduction. If you have many terms to define, put a glossary in an appen-dix. Refer to it in the Introduction so that readers know that you’veprovided it.
Background or HistoryFormal reports usually have a section that gives the background of the situa-tion or the history of the problem. Even though the current audience for thereport probably knows the situation, reports are filed and consulted yearslater. These later audiences will probably not know the background, althoughit may be crucial for understanding the options that are possible.
In some cases, the history section may cover many years. For example, areport recommending that a US hotel chain open hotels in Romania maygive the history of that country for at least several decades. In other cases,the history section is much briefer, covering only a few years or even just theimmediate situation.
�
Analyzing Numbers,
West Concord, MA, has. . . one of the highest
[per capita incomes] in the nation. . . . It also has one of the highestnumber of single men in Massa-chusetts. Why? On the outskirts ofWest Concord is a medium-to-maximum security prison!
So, when one naively juxta-poses these data points, onecan be led to assume that thereare plenty of single, wealthymen there—when that isn’t thecase. . . . Think before arriving toconclusions indicated by datacrunching.
Quoted from Thomas M. Bodenberg,Letter to the Editor, American Demo-graphics, August 2001, 8.

Locker−Kienzler: Business and Administrative Communication, Eighth Edition
V. Reports 16. Analyzing Information and Writing Report
© The McGraw−Hill Companies, 2008
Chapter 16 Analyzing Information and Writing Reports 577
The purpose of most reports is rarely to provide a history of the problem.Do not let the background section achieve undue length.
BodyThe body of the report is usually its longest section. Here you analyze causesof the problem and offer possible solutions. Here you present your argumentwith all its evidence and data. Data that are necessary to follow the argumentare included with appropriate visuals and explanatory text. Extended datasets, such as large tables and long questionnaires, are generally placed in ap-pendices. It is particularly important in the body that you use headings, fore-casting statements, and topic sentences to help lead your readers through thebody. Readers will also appreciate clear, concise, and engaging prose. Re-member to cite your sources (see Chapter 15) and to refer in the text to all vi-suals and appendices.
Conclusions and RecommendationsConclusions summarize points you have made in the body of the report;Recommendations are action items that would solve or ameliorate theproblem. These sections are often combined if they are short: Conclu-sions and Recommendations. No new information should be included in this section.
Many readers turn to the recommendations section first; some organiza-tions ask that recommendations be presented early in the report. Number therecommendations to make it easy for people to discuss them. If the recom-mendations will seem difficult or controversial, give a brief paragraph of rationale after each recommendation. If they’ll be easy for the audience to accept, you can simply list them without comments or reasons. The recom-mendations will also be in the executive summary and perhaps in the title andthe transmittal.
Summary of Key Points• Good reports begin with good data. Make sure your data come from reli-
able sources.
• Analyze report numbers and text for accuracy and logic.
• Choose an appropriate organizational pattern for your information andpurposes.The most common patterns are comparison/contrast, problem-solving, elimination, general to particular, particular to general, geo-graphic or spatial, and functional.
• Reports use the same style as other business documents, with three exceptions:
1. Reports use a more formal style than do many letters and memos.
2. Reports rarely use the word you.
3. Reports should include all the definitions and documents needed tounderstand the recommendations.
• To create good report style,
1. Use clear, engaging writing.
2. Keep repetition to a minimum.
3. Introduce all sources and visuals.
4. Use forecasting, transitions, topic sentences, and headings.

Locker−Kienzler: Business and Administrative Communication, Eighth Edition
V. Reports 16. Analyzing Information and Writing Report
© The McGraw−Hill Companies, 2008
578 Part 5 Reports
• Headings are single words, short phrases, or complete sentences thatcover all of the material under it until the next heading. Talking heads tellthe reader what to expect in each section.
• Headings must use the same grammatical structure. Subheads under aheading must be parallel to each other but do not necessarily have to beparallel to subheads under other headings.
• The title page of a report usually contains four items: the title of the re-port, whom the report is prepared for, whom it is prepared by, and thedate.
• If the report is 25 pages or less, list all the headings in the table of contents.In a long report, pick a level and put all the headings at that level andabove in the contents.
• Organize the transmittal in this way:
1. Release the report.
2. Summarize your conclusions and recommendations.
3. Mention any points of special interest in the report. Show how you sur-mounted minor problems you encountered in your investigation.Thank people who helped you.
4. Point out additional research that is necessary, if any.
5. Thank the reader for the opportunity to do the work and offer to an-swer questions.
• Summary abstracts present the logical skeleton of the article: the thesis or rec-ommendation and its proof. Descriptive abstracts indicate what topics thearticle covers and how deeply it goes into each topic, but do not summarizewhat the article says about each topic.
• A good abstract or executive summary is easy to read, concise, andclear. A good abstract can be understood by itself, without the report orreferences.
• The Introduction of the report always contains a statement of purposeand scope. The Purpose statement identifies the organizational prob-lem the report addresses, the technical investigations it summarizes,and the rhetorical purpose (to explain, to recommend). The Scopestatement identifies how broad an area the report surveys. The intro-duction may also include Limitations, problems or factors that limitthe validity of your recommendations; Assumptions, statementswhose truth you assume, and which you use to prove your final point;Methods, an explanation of how you gathered your data; Criteria usedto weigh the factors in the decision; and Definitions of terms readersmay not know.
• A Background or History section is usually included because reports arefiled and may be consulted years later by people who no longer rememberthe original circumstances.
• The body of the report, usually the longest section, analyzes causes of theproblem and offers possible solutions. It presents your argument with allevidence and data.
• Conclusions summarize points made in the body of the report; Recom-mendations are action items that would solve or ameliorate the problem.These sections are often combined if they are short.

Locker−Kienzler: Business and Administrative Communication, Eighth Edition
V. Reports 16. Analyzing Information and Writing Report
© The McGraw−Hill Companies, 2008
Chapter 16 Analyzing Information and Writing Reports 579
C H A P T E R 16 Exercises and Problems
16.1 Reviewing the Chapter
1. What are some criteria to check to ensure you havequality data? (LO 1)
2. What kinds of patterns should you look for in yourdata and text? (LO 1)
3. What are some guidelines for choosing informationfor reports? (LO 2)
4. Name seven basic patterns for organizing reports.For four of them, explain when they would beparticularly effective or ineffective. (LO 3)
5. What are three ways that style in reports differs fromconventional business communication style? (LO 4)
6. Name four good writing principles that areparticularly important in reports. (LO 4)
7. How do you introduce sources in the text of thereport? (LO 4)
8. Why should reports try to have a topic sentence atthe beginning of each paragraph? (LO 4)
9. What are the characteristics of an effective reporttitle? (LO 5)
10. What goes in the letter of transmittal? (LO 5)
11. What is the difference between summary anddescriptive abstracts? (LO 5)
12. What goes in the introduction of a report? (LO5)
13. What is the difference between conclusions andrecommendations? (LO 5)
16.2 Identifying Assumptions and Limitations
Indicate whether each of the following would be an assumption or a limitation in a formal report.
a. Report on Ways to Encourage More Students to JoinXYZ Organization
1. I surveyed a judgment sample rather than arandom sample.
2. These recommendations are based on theattitudes of current students. Presumably,students in the next several years will have thesame attitudes and interests.
b. Report on the Feasibility of Building Hilton Hotelsin Vietnam
1. This report is based on the expectation that thecountry will be politically stable.
2. All of my information is based on libraryresearch. The most recent articles were published
two months ago; much of the information waspublished a year ago or more. Therefore some ofmy information may be out of date.
c. Report on Car-Buying Preferences of Young Adults
1. These recommendations may change if the costof gasoline increases dramatically or if there isanother deep recession.
2. This report is based on a survey of adults ages20 to 24 in California, Texas, Illinois, Ontario,and Massachusetts.
3. These preferences are based on the cars nowavailable. If a major technical or stylinginnovation occurs, preferences may change.
16.3 Revising an Executive Summary
The following Executive Summary is poorly organizedand too long. Rearrange information to make it more
effective. Cut information that does not belong in thesummary. You may use different words as you revise.
In this report I will discuss the communication problems which exist at Rolling MeadowsGolf Club. The problems discussed will deal with channels of communication. The areaswhich are causing problems are internal. Radios would solve these internal problems.
Taking a 15-minute drive on a golf cart in order to find the superintendent is a com-mon occurrence. Starters and rangers need to keep in touch with the clubhouse tomaintain a smooth flow of players around the course. The rangers have expressed aninterest in being able to call the clubhouse for advice and support.

Locker−Kienzler: Business and Administrative Communication, Eighth Edition
V. Reports 16. Analyzing Information and Writing Report
© The McGraw−Hill Companies, 2008
580 Part 5 Reports
16.4 Analyzing Data and Information
Every year, Business Ethics magazine releases its annualsurvey of the “100 Best Corporate Citizens.” The surveymeasures a company’s social responsibility to the envi-ronment and to their community and employees.
Go to the Web site http://www.business-ethics.com/what_new/100best.html and analyze the data and infor-mation used to create their list. Consider the followingquestions:
• Do the data come from a reliable source? Does thesource have a vested interest in the results?
• What do the data actually measure?
• Are there any assumptions or limitations that needto be considered when analyzing these numbers?
As your instructor directs,
• Write a memo to your instructor summarizing youranalysis.
• Share your analysis orally with a small group ofstudents.
• Present your analysis to the class.
16.5 Recommending Action
Write a report recommending an action that your unit ororganization should take. Possibilities include
• Buying more equipment for your department.
• Hiring an additional worker for your department.
• Making your organization more family-friendly.
• Making a change that will make the organizationmore efficient.
• Making changes to improve accessibility forcustomers or employees with disabilities.
Address your report to the person who would havethe power to approve your recommendation.
As your instructor directs,
a. Create a document or presentation to achieve thegoal.
b. Write a memo to your instructor describing the situ-ation at your workplace and explaining your rhetor-ical choices (medium, strategy, tone, wording,graphics or document design, and so forth).
Purchasing two-channel FM radios with private channels would provide three advan-tages. First, radios would make the golf course safer by providing a means of notify-ing someone in the event of an emergency. Second, radios would make the staffmore efficient by providing a faster channel of communication. Third, radios wouldenable clubhouse personnel to keep in touch with the superintendent, the rangers,and the starters.
During the week, radios can be carried by the superintendent, the golf pro, and an-other course worker. On weekends and during tournaments, one radio will be used bythe golf professional. The other two will be used by one starter and one ranger. Threeradios is the minimum needed to meet basic communication needs. A fourth radiowould provide more flexibility for busy weekends and during tournaments.
Tekk T-20 radios can be purchased from Page-Com for $129 each. These radioshave the range and options needed for use on the golf course. Radios are durableand easy to service. It is possible that another brand might be even less expensive.
Rolling Meadows Golf Club should purchase four radios. They will cost under $600and can be paid for from the current equipment budget.

Locker−Kienzler: Business and Administrative Communication, Eighth Edition
V. Reports 16. Analyzing Information and Writing Report
© The McGraw−Hill Companies, 2008
Chapter 16 Analyzing Information and Writing Reports 581
16.6 Evaluating a Report from Your Workplace
Consider the following aspects of a report from yourworkplace:
• Content. How much information is included? Howis it presented?
• Emphasis. What points are emphasized? Whatpoints are deemphasized? What verbal and visualtechniques are used to highlight or minimizeinformation?
• Visuals and layout. Are visuals used effectively? Arethey accurate and free from chartjunk? What image do
the pictures and visuals create? Are color and whitespace used effectively? (See Chapter 6 on visuals.)
As your instructor directs,
a. Write a memo to your instructor analyzing the report.
b. Join with a small group of students to compare andcontrast several reports. Present your evaluation inan informal group report.
c. Present your evaluation orally to the class.
16.7 Analyzing and Writing Reports
Reread the sidebar about the Pew Internet and AmericanLife Project at http://www.pewinternet.org/. Go to theWeb site and browse through the reports. Select a reportand answer the following questions:
• Who is the report’s audience?
• What is its purpose?
• How were the data collected?
• What did the data collection measure?
• Why was the data collection important?
Given your analysis of the report’s audience, purpose,and data collection, consider the strategies used in the re-port to convey the information. Answer these questions:
• What tone did the writer adopt?
• How was the report organized and designed to meetthe needs of the audience?
• What language choices did the writer make?
Finally, examine the press releases that are writtenabout the report (the press releases for each report areincluded as links) for the ways the information in the re-port is adapted for a different audience and purpose.How do the content, organization, tone, and languagechoices differ from those of the original report? Do yousee any ethical issues involved in condensing the reportinto a press release?
As your instructor directs,
• Write a report of your findings to your instructor.
• Present your findings to the class using presentationsoftware.
16.8 Writing a Feasibility Study
Write a report evaluating the feasibility of two or morealternatives. Possible topics include the following:
1. Is it feasible to start a monthly newsletter forstudents in your major?
2. Is it feasible for your student organization to writean annual report? Would doing so help the nextyear’s officers?
3. Is it feasible for your student organization to createa wiki, blog, or newsletter to facilitatecommunication with a constituency?
4. Is it feasible for your workplace to create anewsletter to communicate internally?
5. Is it feasible for a local restaurant to open anotherbranch? Where should it be?
6. Is it feasible to open another student parking lot onor near campus? Where should it be?
In designing your study, identify the alternatives, defineyour criteria for selecting one option over others, care-fully evaluate each alternative, and recommend the bestcourse of action.
16.9 Writing an Informative or Closure Report
Write an informative report on one of the following topics.
1. What should a US or Canadian manager knowabout dealing with workers from _____ [you fill inthe country or culture]? What factors do and do notmotivate people in this group? How do they show
respect and deference? Are they used to a stronghierarchy or to an egalitarian setting? Do theynormally do one thing at once or many things?How important is clock time and being on time?What factors lead them to respect someone? Age?

Locker−Kienzler: Business and Administrative Communication, Eighth Edition
V. Reports 16. Analyzing Information and Writing Report
© The McGraw−Hill Companies, 2008
582 Part 5 Reports
Experience? Education? Technical knowledge?Wealth? Or what? What conflicts ormiscommunications may arise between workersfrom this culture and other workers due tocultural differences? Are people from this culturesimilar in these beliefs and behaviors, or is therelots of variation?
2. What benefits do companies offer? To getinformation, check the Web pages of three companiesin the same industry. Information about benefits isusually on the page about working for the company.
3. Describe an ethical dilemma encountered byworkers in a specific organization. What is thebackground of the situation? What competingloyalties exist? In the past, how have workersresponded? How has the organization responded?Have “whistle-blowers” been rewarded or
16.10 Writing a Consultant’s Report—Restaurant Tipping
Your consulting company has been asked to conduct areport for Diamond Enterprises, which runs three national chains: FishStix, The Bar-B-Q Pit, and Morrie’s.All are medium-priced, family-friendly restaurants. TheCEO is thinking of replacing optional tips with a 15%service fee automatically added to bills.
You read articles in trade journals, surveyed a ran-dom sample of 200 workers in each of the chains, andconducted an e-mail survey of the 136 restaurant managers. Here are your findings:
1. Trade journals point out that the Internal RevenueService (IRS) audits restaurants if it thinks thatservers underreport tips. Dealing with an audit istime-consuming and often results in the restaurant’shaving to pay penalties and interest.
2. Only one Morrie’s restaurant has actually beenaudited by the IRS. Management was able toconvince the IRS that servers were reporting tipsaccurately. No penalty was assessed. Managementspent $1,000 on CPA and legal fees and spent over80 hours of management time gathering data andparticipating in the audit.
3. Restaurants in Europe already add a service fee(usually 15%) to the bill. Patrons can add more if theychoose. Local custom determines whether tips areexpected and how much they should be. In Germany,for example, it is more usual to round up the bill (from27 € to 30 €, for example) than to figure a percentage.
4. If the restaurant collected a service fee, it could usethe income to raise wages for cooks and hosts andpay for other benefits, such as health insurance, ratherthan giving all the money to servers and bussers.
5. Morrie’s servers tend to be under 25 years of age.FishStix employs more servers over 25, who aredoing this for a living. The Bar-B-Q Pit servers arestudents in college towns.
6. In all three chains, servers oppose the idea.Employees other than servers generally support it.
Change to service
Retain fee added Don’ttips to bill care
FishStix servers (n � 115) 90% 7% 3%
Bar-B-Q servers (n � 73) 95% 0% 5%
Morrie’s servers (n � 93) 85% 15% 0%
Morrie’s nonservers (n � 65) 25% 70% 5%
FishStix nonservers (n � 46) 32% 32% 37%
Bar-B-Q nonservers (n � 43) 56% 20% 25%
(Numbers do not add up to 100% due to rounding.)
7. Servers said that it was important to go home withmoney in their pockets (92%), that their expertiseincreased food sales and should be rewarded (67%),and that if a service fee replaced tips they would belikely to look for another job (45%). Some (17%)thought that if the manager distributed service-feeincome, favoritism rather than the quality of workwould govern how much tip income they got. Most(72%) thought that customers would not addanything beyond the 15% service fee, and many(66%) thought that total tip income would decreaseand their own portion of that income woulddecrease (90%).
8. Managers generally support the change.
Change to service
Retain fee added Don’ttips to bill care
FishStix managers (n � 44) 20% 80% 0%
Bar-B-Q managers (n � 13) 33% 67% 0%
Morrie’s managers (n � 58) 55% 45% 0%
punished? What could the organization do to fosterethical behavior?
4. Describe a problem or challenge encountered by anorganization where you’ve worked. Describe theproblem, show why it needed to be solved, tell whodid what to try to solve it, and tell how successfulthe efforts were. Possibilities include
• How the organization is implementing work teams,downsizing, or changing organizational culture.
• How the organization uses e-mail or voice mail.
• How the organization uses telecommuting.
• How managers deal with stress, make ethicalchoices, or evaluate subordinates.
• How the organization is responding to changingUS demographics, the Americans with DisabilitiesAct, or international competition and opportunities.

Locker−Kienzler: Business and Administrative Communication, Eighth Edition
V. Reports 16. Analyzing Information and Writing Report
© The McGraw−Hill Companies, 2008
Chapter 16 Analyzing Information and Writing Reports 583
9. Comments from managers include: “It isn’t fair fora cook with eight years of experience to make only$12 an hour while a server can make $25 an hour injust a couple of months,” and “I could have my pickof employees if I offered health insurance.”
10. Morale at Bar-B-Q seems low. This is seen in part inthe low response rate to the survey.
11. In a tight employment market, some restaurants mightlose good servers if they made the change. However,hiring cooks and other nonservers would be easier.
12. The current computer systems in place can handlefiguring and recording the service fee. Since bills areprinted by computer, an additional line could beadded. Allocating the service-fee income could takeextra managerial time, especially at first.
16.11 Writing a Library Research Report
Write a library research report.
As your instructor directs,
Turn in the following documents:
a. The approved proposal.
b. Two copies of the report, including
Cover.
Title Page.
Letter or Memo of Transmittal.
Table of Contents.
List of Illustrations.
Executive Summary or Abstract.
Body (Introduction, all information, recommenda-tions). Your instructor may specify a minimumlength, a minimum number or kind of sources, and aminimum number of visuals.
References or Works Cited.
c. Your notes and rough drafts.
Choose one of the following topics.
1. Selling to College Students. Your car dealershipis located in a university town, but the managerdoubts that selling cars to college students will beprofitable. You agree that college incomes are low tononexistent, but you see some students driving late-model cars. Recommend to the dealership’smanager whether to begin marketing to collegestudents, suggesting some tactics that would beeffective.
2. Advertising on the Internet. You work on a teamdeveloping a marketing plan to sell high-endsunglasses. Your boss is reluctant to spend moneyfor online advertising because she has heard thatthe money is mostly wasted. Also, she associates theads with spam, which she detests. Recommendwhether the company should devote some of itsadvertising budget to online ads. Include samples ofonline advertising that supports yourrecommendation.
3. Improving Job Interview Questions. Turnoveramong the sales force has been high, and your boss
believes the problem is that your company has beenhiring the wrong people. You are part of a teaminvestigating the problem, and your assignment isto evaluate the questions used in job interviews.Human resource personnel use tried-and-truequestions like “What is your greatest strength?” and“What is your greatest weakness?” The salesmanager has some creative alternatives, such asasking candidates to solve logic puzzles and seeinghow they perform under stress by taking frequentphone calls during the interview. You are toevaluate the current interviewing approaches andpropose changes where they would improve hiringdecisions.
4. Selling to Wal-Mart. Your company has areputation for making high-quality lamps andceiling fans sold in specialty stores. Although thecompany has been profitable, it could grow muchfaster if it sold through Wal-Mart. Your boss isexcited about her recent discussions with thatretailer, but she has heard from associates that Wal-Mart can be a demanding customer. She asked youto find out if there is a downside to selling throughWal-Mart and, if so, whether manufacturers canafford to say no to a business deal with the retailgiant.
5. Making College Affordable. The senator youwork for is concerned about fast-rising costs of acollege education. Students say they cannot affordtheir tuition bills. Colleges say they are making allthe cuts they can without compromising the qualityof education. In order to propose a bill that wouldhelp make college affordable for those who arequalified to attend, the senator has asked you toresearch alternatives for easing the problem.Recommend one or two measures the senator couldinclude in a bill for the Senate to vote on.
6. With your instructor’s permission, investigate atopic of your choice.

Locker−Kienzler: Business and Administrative Communication, Eighth Edition
V. Reports 16. Analyzing Information and Writing Report
© The McGraw−Hill Companies, 2008
584 Part 5 Reports
Write an individual or a group report.
As your instructor directs,
Turn in the following documents:
1. The approved proposal.
2. Two copies of the report, including
Cover.
Title Page.
Letter or Memo of Transmittal.
Table of Contents.
List of Illustrations.
Executive Summary or Abstract.
Body (Introduction, all information,recommendations). Your instructor may specifya minimum length, a minimum number or kindof sources, and a minimum number of visuals.
Appendixes if useful or relevant.
3. Your notes and rough drafts.
Pick one of the following topics.
1. Improving Customer Service. Many customersfind that service is getting poorer and workers aregetting ruder. Evaluate the service in a local store,restaurant, or other organization. Are customersmade to feel comfortable? Is workers’communication helpful, friendly, and respectful?Are workers knowledgeable about products andservices? Do they sell them effectively? Write areport analyzing the quality of service andrecommending what the organization should do toimprove.
2. Recommending Courses for the Local CommunityCollege. Businesses want to be able to sendworkers to local community colleges to upgradetheir skills; community colleges want to prepare
students to enter the local workforce. What skills arein demand in your community? What courses atwhat levels should the local community collegeoffer?
3. Improving Sales and Profits. Recommend ways asmall business in your community can increasesales and profits. Focus on one or more of thefollowing: the products or services it offers, itsadvertising, its decor, its location, its accountingmethods, its cash management, or any other aspectthat may be keeping the company from achievingits potential. Address your report to the owner ofthe business.
4. Increasing Student Involvement. How could anorganization on campus persuade more of thestudents who are eligible to join or to become activein its programs? Do students know that it exists? Isit offering programs that interest students? Is itretaining current members? What changes shouldthe organization make? Address your report to theofficers of the organization.
5. Evaluating a Potential Employer. What training isavailable to new employees? How soon is theaverage entry-level person promoted? How muchtravel and weekend work are expected? Is there a“busy season,” or is the workload consistent year-round? What fringe benefits are offered? Whatis the corporate culture? Is the climate nonracist andnonsexist? How strong is the companyeconomically? How is it likely to be affected bycurrent economic, demographic, and politicaltrends? Address your report to the Placement Officeon campus; recommend whether it shouldencourage students to work at this company.
6. With your instructor’s permission, choose your owntopic.
16.13 Mosaic Case
The Communications Department at Mosaic is gettingready to produce the organization’s annual report thatwill be distributed to all investors and shareholders.Yvonne, who normally oversees the production andprinting of this high-end report, is doing some recon-naissance work abroad. As a result, she passed the torchto complete this project to Sarah and Demetri, since theyare responsible for Mosaic’s physical stores and onlinecommunications.
For the past week, Sarah and Demetri have been fran-tic and on everyone’s case. They know not only how im-portant the annual report is to the image of theorganization, but also the detrimental effect it couldhave on their jobs if they do a poor job.
16.12 Writing a Recommendation Report
Today while taking a coffee break, Sarah said toDemetri, “I’m not sure about the content of an annual re-port. I’ve seen them before, but Yvonne usually handlesorganizing it all. I’m not exactly sure what even needs tobe included.”
“I have a general idea about content,” said Demetribut I’m not positive about how to arrange the visualsand layout the report in a way that will really meansomething to shareholders.”
Trey, who was also in the break room and overheadtheir conversation, suggested to them, “Why don’t youjust research Mosaic’s past annual reports, as well as re-ports from similar competitors to become more comfort-able with the look and conventions of the document?”

Locker−Kienzler: Business and Administrative Communication, Eighth Edition
V. Reports 16. Analyzing Information and Writing Report
© The McGraw−Hill Companies, 2008
Chapter 16 Analyzing Information and Writing Reports 585
“That’s a great idea, Trey,” said Sarah and Demetri almost simultaneously. “I’ll have Martina get right onthat!” said Sarah.
Martina the intern, who coincidentally walked intothe break room just then eating a banana and mindingher own business, suddenly found herself as a keyplayer in the production of Mosaic’s annual report.
Take on the communication task of Martina. Researchthe annual reports of five major corporations (competitors)as Sarah and Demetri have asked her to do. When you arefinished, write a memo to Sarah and Demetri that explains
what sections are typically included in these organiza-tions’ annual reports and possible reasons for includingthem. If variation occurs in the typical content of corre-sponding sections, give Sarah and Demetri some idea ofthe range of variations and why you think the differencesoccur. In addition, figure out how the annual reports haveincorporated visual displays and other pictures and howthe visuals help convey information to the audience of thereport (www.annualreports.com is a great place to start ifyou cannot locate hard copies of reports.)