Analyzing Order Throughput Times in a Milkrun Picking System
13
Georgia Southern University Georgia Southern University Digital Commons@Georgia Southern Digital Commons@Georgia Southern 14th IMHRC Proceedings (Karlsruhe, Germany – 2016) Progress in Material Handling Research 2016 Analyzing Order Throughput Times in a Milkrun Picking System Analyzing Order Throughput Times in a Milkrun Picking System J. P. van der Gaast Erasmus Universiteit Rotterdam, [email protected] M.B. M. de Koster Erasmus Universiteit Rotterdam Ivo J.B.F. Adan Technische Universiteit Eindhoven, [email protected] Follow this and additional works at: https://digitalcommons.georgiasouthern.edu/pmhr_2016 Part of the Industrial Engineering Commons, Operational Research Commons, and the Operations and Supply Chain Management Commons Recommended Citation Recommended Citation van der Gaast, J. P.; de Koster, M.B. M.; and Adan, Ivo J.B.F., "Analyzing Order Throughput Times in a Milkrun Picking System" (2016). 14th IMHRC Proceedings (Karlsruhe, Germany – 2016). 34. https://digitalcommons.georgiasouthern.edu/pmhr_2016/34 This research paper is brought to you for free and open access by the Progress in Material Handling Research at Digital Commons@Georgia Southern. It has been accepted for inclusion in 14th IMHRC Proceedings (Karlsruhe, Germany – 2016) by an authorized administrator of Digital Commons@Georgia Southern. For more information, please contact [email protected].
Transcript of Analyzing Order Throughput Times in a Milkrun Picking System

Georgia Southern University Georgia Southern University
Digital Commons@Georgia Southern Digital Commons@Georgia Southern
14th IMHRC Proceedings (Karlsruhe, Germany – 2016) Progress in Material Handling Research
2016
Analyzing Order Throughput Times in a Milkrun Picking System Analyzing Order Throughput Times in a Milkrun Picking System
J. P. van der Gaast Erasmus Universiteit Rotterdam, [email protected]
M.B. M. de Koster Erasmus Universiteit Rotterdam
Ivo J.B.F. Adan Technische Universiteit Eindhoven, [email protected]
Follow this and additional works at: https://digitalcommons.georgiasouthern.edu/pmhr_2016
Part of the Industrial Engineering Commons, Operational Research Commons, and the Operations and
Supply Chain Management Commons
Recommended Citation Recommended Citation van der Gaast, J. P.; de Koster, M.B. M.; and Adan, Ivo J.B.F., "Analyzing Order Throughput Times in a Milkrun Picking System" (2016). 14th IMHRC Proceedings (Karlsruhe, Germany – 2016). 34. https://digitalcommons.georgiasouthern.edu/pmhr_2016/34
This research paper is brought to you for free and open access by the Progress in Material Handling Research at Digital Commons@Georgia Southern. It has been accepted for inclusion in 14th IMHRC Proceedings (Karlsruhe, Germany – 2016) by an authorized administrator of Digital Commons@Georgia Southern. For more information, please contact [email protected].

ANALYZING ORDER THROUGHPUT TIMES IN A MILKRUN
PICKING SYSTEM
J.P. van der GaastErasmus Universiteit Rotterdam
M.B.M. de KosterErasmus Universiteit Rotterdam
I.J.B.F. AdanTechnische Universiteit Eindhoven
Abstract
E-commerce fulfillment competition evolves around cheap, speedy, and time-definitedelivery. Milkrun order picking systems have proven to be very successful in provid-ing handling speed for a large, but highly variable, number of orders. In this system,an order picker picks orders that arrive in real time during the picking process; bydynamically changing the stops on the picker’s current picking route. The advantageof milkrun picking is that it reduces order picking set-up time and worker travel timecompared to conventional batch picking systems. This paper is the first in studyingorder throughput times of multi-line orders in a milkrun picking system. We modelthis system as a cyclic polling system with simultaneous batch arrivals and determinethe mean order throughput time. These results allow us to study the effect of differentproduct allocations. For a real world application we show that milkrun order pick-ing reduces the order throughput time significantly compared to conventional batchpicking.
1 IntroductionRecent technological advances and trends in distribution and manufacturing have led to agrowth in complexity of warehousing systems. Today’s warehouse operations face chal-
1

lenges like the need for shorter lead times, for real-time response, to handle a larger numberof orders with greater variety, and to deal with flexible processes [4].Batch picking is a common way to organize the picking process, where daily a large
number of customer orders needs to be picked (Figure 1a). Batch picking is a picker-to-parts order picking method in which the demand from multiple orders is used to form so-called pick batches [1]. Pick routes are constructed for each pick batch to minimize thetotal travel time of the order picker (see e.g. Gademann & Van de Velde [2]). A drawbackof this approach is that batch formation takes time, and, as customers demand shorter leadtimes, more efficient ways to organize the order picking process exist. In this paper westudy an alternative method of order picking, which we denote by milkrun picking, thatallows shorter order throughput times compared to conventional batch picking systems, inparticular for high order arrival rates.
In a milkrun picking system (Figure 1b), an order picker picks orders in batches that ar-rive in real-time and integrates them in the current picking cycle. This subsequently changesdynamically the stops on the order picker’s picking route [3]. The picker is constantly trav-eling a fixed route along the aisles of a part or the entire order picking area. Using modernorder-picking aids like pick-by-voice techniques or by a handheld terminal, new pick in-structions are received continuously and are included in the current picking cycle. In casethe lines of an incoming customer order are located either at the current stop or furtherdownstream in the picking route, the picker can pick this order in the current picking cycle.In a traditional batch picking system, an incoming customer order would only be picked inone of the following picking cycles. After the picking cycle has been completed and theorder picker reaches the depot, the picked products are disposed and sorted per customerorder (i.e. using a pick-and-sort system), and a new picking cycle starts immediately. Thisway of order picking saves set-up time, worker travel time, and allows fast customer re-sponse, particularly for high order arrival rates which are often experienced in warehousesof e-commerce companies [4]. In addition, short order throughput times are important ase-commerce companies are inclined to set their order cut-off times as late as possible whilestill guaranteeing that orders can be delivered next day or in some cases even the same day.
In this paper, we study the mean order throughput time in a milkrun picking system, i.e.the time between a customer order entering the system until the whole order is delivered atthe depot. The order throughput time strongly depends on the product (or storage) allocationin the order picking area. Typically, an incoming customer order consists of one or moreorder lines, each for a product stored at a different location within the order picking area.Therefore, in order to achieve short order throughput times products should be allocated inan optimal way in order to increase the probability that an incoming customer order can beincluded and fully picked in the current picking cycle. We study for a real world applicationthe mean order throughput time, as well as the effect of different product allocations. Ourresults will help both designers and managers to create optimal design and control methodsto improve the performance of a milkrun picking system.
The organization of this paper is as follows. In section §2 a detailed description of the
2

Depot
Rack
Order picker
Different pick routes
(a) Batch picking
Depot
Rack
Order picker
Fixed pick route
(b) Milkrun picking
Figure 1: Comparison of batch and milkrun picking.
model and the corresponding notation used in this paper are given. Next, section §3 providesthe analysis of the mean order throughput times. We extensively analyze the results of ourmodel in section §4 for a real world application. Finally, in section §5 we conclude andsuggest some extensions of the model and further research topics.
2 Model description
Consider a milkrun picking system as shown in Figure 2. We assume the order picking areato have a parallel aisle layout, with A aisles and L storage positions on each side of an aisle(a rack). Within an aisle, a single order picker applies two-sided picking, i.e. simultane-ous picking from the right and left sides within an aisle. We denote the storage locationsby Q1, . . . , QN , where the number of storage locations N equals 2AL. Each storage lo-cation can be considered as a queue for order lines requesting the product stored on thatlocation. Without loss of generality, we assume that the number of storage locations equalsthe number of different products stored in the warehouse. For the ease of presentation, allreferences to queue indices greater thanN or less than 1 are implicitly assumed to be mod-ulo N , e.g., QN+1 is understood as Q1. The order picker visits all queues according to astrict S-shape routing policy in a cyclic sequence and picks all required products for theoutstanding customer orders to a pick cart or tow-train. This means that every aisle is com-pletely traversed during a picking cycle, because new customer orders can enter the systemin real-time. Therefore, the order picker cannot skip entering an aisle like in conventionalbatch picking. We assume the number of products the order picker can pick per pickingcycle is unconstrained, as for online retailers the route often finishes before the cart or train
3

is full [3]. This implies that every customer order is either fully picked by the end of thecurrent cycle or at the end of the next cycle. Finite capacity of the pick cart and storing thesame product at multiple locations are considered to be further extensions of the model.
A milkrun picking system with multi-line customer orders arriving in real-time can beaccurately modeled using a polling system with simultaneous batch arrivals [6]. Pollingsystems are multi-queue systems served by a single server who cyclically visits the queuesin order to serve the customers waiting at these queues. Typically, when moving from onequeue to another the server incurs a switch-over time. In a milkrun picking system, theorder picker is represented by the server and a storage location by a queue, and a multi-lineorder represents multiple simultaneously arriving customers (a batch).
L
A
Q1 Q2
Q4Q3
Q6Q5
Q8Q7
Q15 Q16
Q14Q13
Q12Q11
Q10Q9
Q17 Q18
Q20Q19
Q22Q21
Q24Q23
Q31 Q32
Q30Q29
Q28Q27
Q26Q25
s2
s1s3s0
A := number of aislesL := number of storage positions
in a racks0 := return travel time
and depot times1 := travel time side to sides2 := travel time within aisles
between adjacent storagelocation
s3 := travel time betweenadjacent aisles
Figure 2: Overview of the milkrun picking system.
New customer orders arrive at the system according to a Poisson process with rate λ.Each customer order is of size D = (D1, . . . , DN), where Dj , j = 1, . . . , N representsthe number of units of product j is requested. Let K = Φ(D), where Φ : NN → NN .Mapping Φ defines the product allocation of the products to their storage locations and isgiven by, Φ (D) = Dx, where xij ∈ NN×N with xij = 1 if product j is allocated tostorage location i and 0 otherwise. Then, for each order, K = (K1, . . . , KN), where Ki
represents the number of units that need to be picked at Qi, i = 1, . . . , N for that order.The random vectorK is assumed to be independent of past and future arriving epochs andfor every realization at least one product needs to be picked. The support with all possiblerealizations ofK is denoted by K, and we denote by k = (k1, . . . , kN) a realization ofK.The joint probability distribution ofK is denoted by π (k) = P (K1 = k1, . . . , KN = kN).The arrival rate of product units that need to be picked at Qi is denoted by λi = λE (Ki).The total arrival rate of products to be picked for the customer orders arriving in the system
4

is given by Λ =∑N
i=1 λi. The order throughput time of an arbitrary customer order isdenoted by T and is defined as the time between its arrival epoch until the order has beenfully picked and delivered at the depot.
At each queue, the picker picks the product units on a First-Come First-Served (FCFS)basis. We assume the order picker picks all product units at the current queue until noproduct units need to be picked anymore. This also includes demand for the product thatarrives while the picker is busy picking at this queue (exhaustive strategy). The pickingtimes of a product unit in Qi dentored by generally distributed random variable Bi are as-sumed to be independent and identically distributed random variables with first and secondmoment E (Bi) and E(B2
i ), respectively. The workload at Qi, i = 1, . . . , N is definedby ρi = λiE (Bi); the overall system load by ρ =
∑Ni=1 ρi. For the system to be stable a
necessary and sufficient condition is that ρ < 1 [5], which is assumed to be the case in theremainder of this paper.
When the order picker moves from Qi to Qi+1, he or she takes a generally distributedtravel time Si with first and second moment E (Si) and E(S2
i ). Without loss of general-ity, we assume that the travel times from side to side within an aisle are independent andidentically distributed with mean s1 and second moment s21, the travel times within aislesbetween two adjacent storage locations have mean s2 and second moment s22, whereas thetime required to travel from one aisle to the next one has mean s3 and second moment s23.Finally, after visiting the last queue the order picker returns to the first queue to start a newcycle. On the way, the order picker visits the depot where he or she will drop off the pickedproducts so that other operators can sort and transport them. We assume that this time is in-dependent of the number of products picked, and it is included in s0 and its second moments20. See also Figure 2.
We define a picking cycle from the service beginning at the first queue until the orderpicker has delivered all the picked products at the depot and arrives at the first queue again.Therefore, a picking cycle C consists of N visit periods, Vi, each followed by a travel timeSi. A visit period Vi starts with a pick of a product unit and ends after the last product hasbeen picked given that product units need to be picked atQi. Then, the order picker travelsto the next picking location of which the duration is Si. In case no product units need to bepicked at Qi the order picker immediately travels to next picking location. The total meanduration of a picking cycle is independent of the queues involved and is given by (see, e.g.,Takagi [5]) E (C) = E (S) / (1− ρ). Finally, we assume replenishment is not required ina picking cycle, and each queue has infinite capacity (i.e. no limit on the maximum numberof order lines waiting to be picked).
Whether a customer order is fully picked in the picking cycle during which it arrives, orotherwise in the next cycle depends on the location of the server and the picking strategy.Therefore, let K0
j and K1j , j = 1, . . . , N be subsets of support K, defined as
K0j = {k1 = 0, . . . , kj−1 = 0, kj ≥ 0, kj+1 ≥ 0, . . . , kN ≥ 0} ∈ K,
and K1j =
(K0
j
)c as its complement such that for j = 1, . . . , N we have K0j ∪ K1
j = K
5
andlettheassociatedprobabilitiesbeπ(K0
j
)andπ
(K1
j
).Theinterpretationofk∈K0
jisthatforanincomingcustomerorderalltheproductsneedtobepickedatQj,...,QN.Forexample,thismeansiftheorderpickerisatQjorhasnotreachedQjyetacustomerorderk∈K0
jcanbeincludedinthecurrentpickingcycle,whereasifk∈K1jtheorderwillbe
completedinthenextcycle.Finally,letE(Ki|K0j
)andE
(Ki|K1j
)betheconditionalmean
numberofproductunitsthatneedtopickedinQi,i=1,...,NgivensubsetK0jorK1
j.
3 Meanorderthroughputtime
Inordertoderivethemeanorderthroughputtime,weapplytheMeanValueAnalysis(MVA)ofVanderGaastetal.[6]fortheexhaustivestrategy.Inthis MVAasetofN2linear
equationsisderivedforcalculatingE(L̄
(Sj 1,Vj)i
),theconditionalmeanqueue-lengthat
Qi(excludingthepotentialproductunitthatisbeingpicked)atanarbitraryepochwithintravelperiodSj−1andvisitperiodVj.These MVAequationsfortheexhaustivestrategyaregiveninVanderGaastetal.[6]. Withuseoftheconditionalmeanqueue-lengths,theperformancestatisticssuchasthewaitingtimeofacustomercanbedetermined,butalsothemeanorderthroughputtimeaswewillshowinthissection.
Fornotationpurposesweintroduceθjinthissectionasshorthandforintervisitperiod(Sj−1,Vj);themeandurationofthisperiodE(θj)isgivenby,E(θj)=E(Sj−1)+E(Vj),
j=1,...,N,whereE(Vj)=ρjE(C)and∑N
j=1E(θj)=E(C)
θj δj,1 δj,2 δj,3 δj,n...
...
dj,n
.
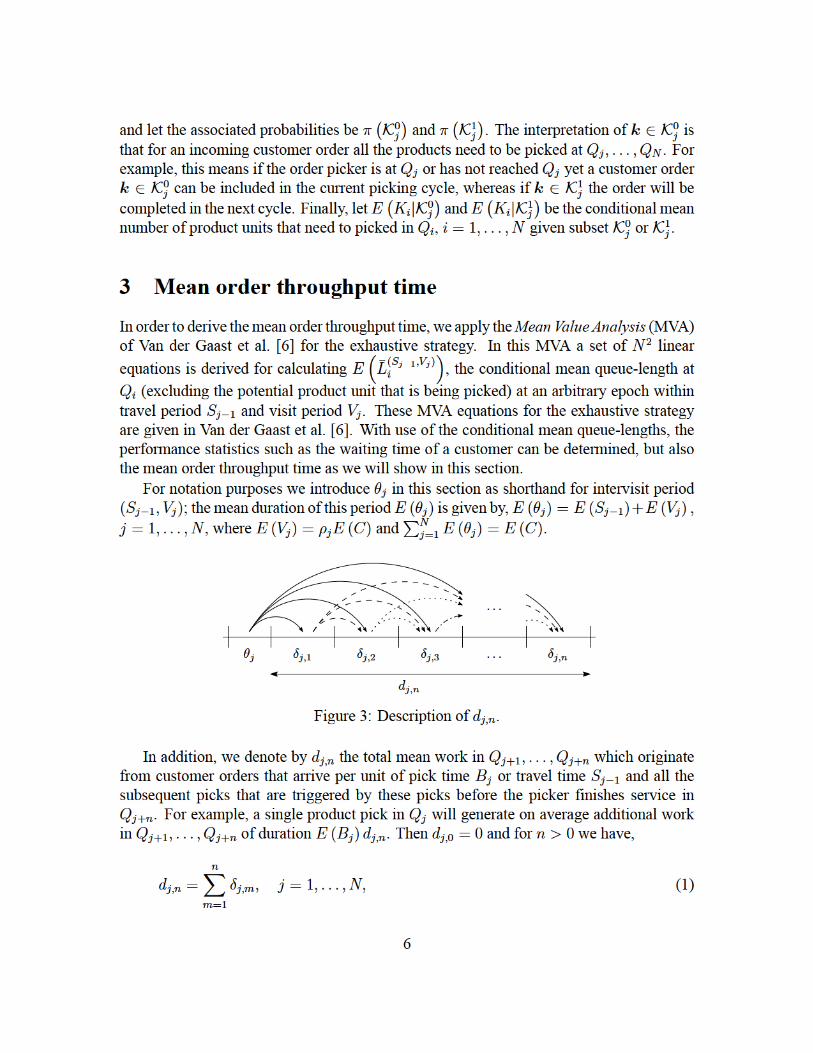
Figure3:Descriptionofdj,n.
Inaddition,wedenotebydj,nthetotalmeanworkinQj+1,...,Qj+nwhichoriginatefromcustomerordersthatarriveperunitofpicktimeBjortraveltimeSj−1andallthesubsequentpicksthataretriggeredbythesepicksbeforethepickerfinishesserviceinQj+n.Forexample,asingleproductpickinQjwillgenerateonaverageadditionalworkinQj+1,...,Qj+nofdurationE(Bj)dj,n.Thendj,0=0andforn>0wehave,
dj,n=
n∑
m=1
δj,m, j=1,...,N, (1)
6

where δj,m is the contribution of Qj+m. First, δj,1 = ρj+1/ (1− ρj+1) includes the meanpicking times and the consecutive busy periods inQj+1 of product units that arrived duringa product pick Bj or travel time Sj−1. Then, δj,2 = (1 + δj,1) ρj+2/ (1− ρj+2) containsthe mean picking times of the product units that arrived in Qj+2 during Bj or Sj−1 and theprevious busy periods in Qj+1 plus all the busy periods that these picks generate in Qj+2.In general we can write δj,n for n > 0 as (see Figure 3),
δj,n =
min(N−1,n)∑m=1
δj,n−mρj+n
1− ρj+n
, j = 1, . . . , N,
where δj,0 = 1. Note that δj,n only depends on at most N − 1 previous δj,n−m’s because ifnew demand arrives at the queue that is currently being visited it will be picked before theend of the current visit.
The mean order throughput time E (T ) can be determined by explicitly conditioningon the location of the order picker and by studying the system until the incoming customerorder has been fully delivered at the depot,
E (T ) =1
E (C)
N∑j=1
E (θj)(π(K0
j
)E(T (θj ,0)
)+ π
(K1
j
)E(T (θj ,1)
)). (2)
Whenever the order picker is at intervisit period θj and still can pick all the products ofan incoming customer order (i.e. k ∈ K0
j ), then the order throughput time is equal toE(T (θj ,0)
). This is the mean time until the order picker reaches the depot during the current
cycle including the conditional mean number of picks for customer orders in k ∈ K0j .
Otherwise, one or more products are located upstream and the order throughput time isequal toE
(T (θj ,1)
). This is the expected time until the order picker reaches the depot in the
next cycle including the conditional mean number of picks for customer orders in k ∈ K1j .
First, we focus on the derivation of E(T (θj ,0)
). When the customer order enters the
system in intervisit period θj with probabilities E (Vj) /E (θj) and E (Sj−1) /E (θj) it hasto wait for a residual picking time E
(BR
j
)= E
(B2
j
)/ (2E (Bj)) or residual travel time
E(SRj−1
)= E
(S2j−1
)/ (2E (Sj−1)). Also, it has to wait for E
(L̄(θj)j
)product units that
still need to be picked at Qj , as well as the expected E(Kj|K0
j
)product units that need be
picked at this queue for a customer order in k ∈ K0j . Each of these picks triggers a busy pe-
riod of length E (Bj) / (1− ρj) and generates additional picks that will be made before theend of the current cycle of duration dj,N−jE (Bj) / (1− ρj). This also applies for the resid-ual picking time and residual travel time. Then, for each subsequent intervisit period θl, l =j+1, . . . , N , the travel time fromQl−1 toQl will trigger a busy period and additional picksin Ql, . . . , QN of duration E (Sl−1) (1 + dl,N−l) / (1− ρl). Similarly, the average numberof product units that still needed to be picked at the customer order arrival and the meanE(Kl|K0
j
)product units needed to be picked for the arriving customer order will increase
7

the order throughput time by[E(L̄(θj)l
)+ E
(Kl|K0
j
)]E (Bl) (1 + dl,N−l) / (1− ρl). Fi-
nally, the picked orders have to be delivered to the depot of which the duration is E (SN).Combining this gives the following expression for the mean time until the order picker
reaches the depot during the current cycle given the average number of picks for a customerorder in k ∈ K1
j ,
E(T (θj ,0)
)=
[E (Vj)
E (θj)E(BR
j
)+
E (Sj−1)
E (θj)E(SRj−1
)+[E(L̄(θj)j
)+ E
(Kj|K0
j
)]E (Bj)
]× 1 + dj,N−j
1− ρj+
N−j∑l=1
(E (Sj+l−1) +
[E(L̄(θj)j+l
)+ E
(Kj+l|K0
j
)]E (Bj+l)
)× 1 + dj+l,N−j−l
1− ρj+l
+ E (SN) . (3)
Next we focus on E(T (θj ,1)
). The derivation is similar to the one of Equation (3), except
that we should also consider the additional demand that is generated during a pick or aswitch from queue to queue until the end of the next picking cycle. This gives the followingexpression,
E(T (θj ,1)
)=
[E (Vj)
E (θj)E(BR
j
)+
E (Sj−1)
E (θj)E(SRj−1
)+[E(L̄(θj)j
)+ E
(Kj|K1
j
)]E (Bj)
]× 1 + dj,2N−j
1− ρj+
N−1∑l=1
(E (Sj+l−1) +
[E(L̄(θj)j+l
)+ E
(Kj+l|K1
j
)]E (Bj+l)
)× 1 + dj+l,2N−j−l
1− ρj+l
+
2N−j∑l=N
E (Sj+l−1)1 + dj+l,2N−j−l
1− ρj+l
+ E (SN) . (4)
Then, E (T ) in (2) can be easily calculated with use of (3) and (4).
4 Numerical resultsIn this section we investigate the mean order throughput time for a real world milkrun pick-ing system. In addition, we also study the effects of different product allocations. For thiswe study the warehouse of an online Chinese retailer in consumer electronics, the samewarehouse considered in case 2 in Gong & De Koster [3]. However, the authors only com-pared the product unit waiting times. The retailer sells over 20, 000 products in 226 citiesand provides deliveries within 2 hours upon order receipt in large cities. In order to meet thisservice level agreement, management requires that orders should start processing within 5minutes on average after being received and the order throughput times should be as shortas possible.
8

Table 1: Parameters of the China online shopping warehouse.
(a) Warehouse
Parameter Value
Warehouse area 985m2
Aisles 8
Number of storage locations per aisle side 30
(b) Order pickers
Parameter Value
Number of order pickers 30
Number of storage locations per picker,N 16
Number of aisles per picker, A 4
Number of storage locations per rack per
picker, L
2
(c) Operations
Parameter Value
Travel speed of a picker 0.48 meter/sec.
Mean picking time, E (Bi) 1.51 sec.
Second moment picking time, E(B2
i
)3.82
Mean traveling time (depot), s0 63.0 sec.
Mean traveling time (side to side), s1 2.00 sec.
Mean traveling time (adjacent storage
locations), s2
2.50 sec.
Mean traveling time (adjacent aisles), s3 9.60 sec.
The company uses a milkrun picking system aided by an information system based onmobile technology and a call center (order processing center). In Table 1 an overview of theparameters of the warehouse is provided. The total area dedicated for the milkrun pickingsystem is 985m2. The total number of aisles is 8 and each aisle has a width of 1 meter. Oneach side of the aisle there are 30 storage positions, where each storage position has a widthand depth of 1.2 meter. Altogether there are 480 (= 2 · 8 · 30) storage locations.
In total there are now 30 order pickers working per shift in the warehouse. Differentfrom Gong & De Koster [3] who assume all order pickers visit sequentially every storagelocation and thus follow the same picking route, we assume that the order picking areais zoned and each picker is responsible for picking products from his or her zone. Thismeans that there is no overlap in picking routes between order pickers. Picked products arebrought to a central depot location where they are sorted per customer order. Additionally,we assume 64% of the incoming orders request only one product unit and 36% two productunits. Also, we assume that every customer order can be fully picked in one zone since theycontain distinct enough product ranges. This allows us to study each zone in isolation.
Then, a single order picker is responsible for N = 16 = 2 · 4 · 2 storage locations.The subsequent picking routes can be realized by adding additional cross-aisles to the orderpicking area. Each order picker has a traveling speed of 0.48 meter/seconds. The meantravel time side to side is s1 = 2 seconds, the mean travel time within aisles betweenadjacent storage location is s2 = 2.50 seconds, and the mean travel time between adjacentaisles is s3 = 9.60 seconds. The average mean traveling times from the last storage locationincluding the depot time is s0 = 63.0 seconds for all the pickers. As a result, the total
9
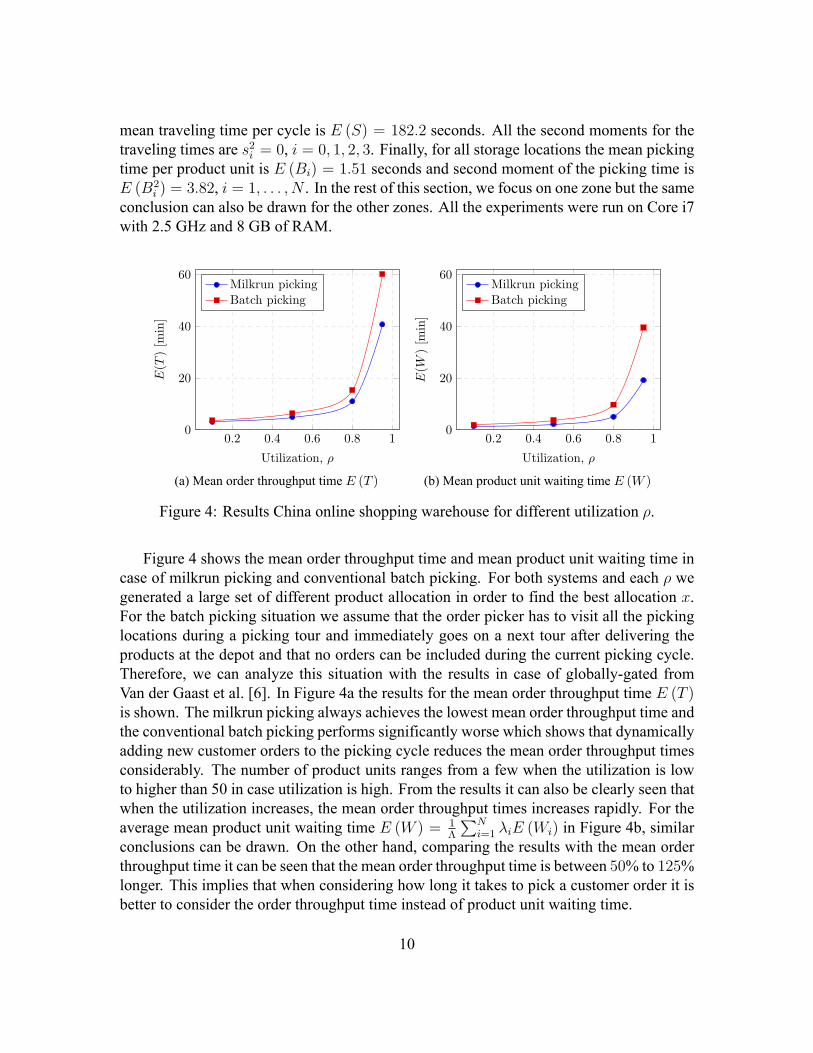
mean traveling time per cycle is E (S) = 182.2 seconds. All the second moments for thetraveling times are s2i = 0, i = 0, 1, 2, 3. Finally, for all storage locations the mean pickingtime per product unit is E (Bi) = 1.51 seconds and second moment of the picking time isE (B2
i ) = 3.82, i = 1, . . . , N . In the rest of this section, we focus on one zone but the sameconclusion can also be drawn for the other zones. All the experiments were run on Core i7with 2.5 GHz and 8 GB of RAM.
0.2 0.4 0.6 0.8 10
20
40
60
Utilization, ρ
E(T
)[m
in]
Milkrun pickingBatch picking
(a) Mean order throughput time E (T )
0.2 0.4 0.6 0.8 10
20
40
60
Utilization, ρ
E(W
)[m
in]
Milkrun pickingBatch picking
(b) Mean product unit waiting time E (W )
Figure 4: Results China online shopping warehouse for different utilization ρ.
Figure 4 shows the mean order throughput time and mean product unit waiting time incase of milkrun picking and conventional batch picking. For both systems and each ρ wegenerated a large set of different product allocation in order to find the best allocation x.For the batch picking situation we assume that the order picker has to visit all the pickinglocations during a picking tour and immediately goes on a next tour after delivering theproducts at the depot and that no orders can be included during the current picking cycle.Therefore, we can analyze this situation with the results in case of globally-gated fromVan der Gaast et al. [6]. In Figure 4a the results for the mean order throughput time E (T )is shown. The milkrun picking always achieves the lowest mean order throughput time andthe conventional batch picking performs significantly worse which shows that dynamicallyadding new customer orders to the picking cycle reduces the mean order throughput timesconsiderably. The number of product units ranges from a few when the utilization is lowto higher than 50 in case utilization is high. From the results it can also be clearly seen thatwhen the utilization increases, the mean order throughput times increases rapidly. For theaverage mean product unit waiting time E (W ) = 1
Λ
∑Ni=1 λiE (Wi) in Figure 4b, similar
conclusions can be drawn. On the other hand, comparing the results with the mean orderthroughput time it can be seen that the mean order throughput time is between 50% to 125%longer. This implies that when considering how long it takes to pick a customer order it isbetter to consider the order throughput time instead of product unit waiting time.
10
3.04 3.06 3.08 3.1 3.12 3.14 3.16 3.18 3.2 3.22
0.10
E(T ) [min]
4.95 5 5.05 5.1 5.15 5.2
0.50
11 11.1 11.2 11.3 11.4 11.5 11.6 11.7
0.80
ρ
40.5 41 41.5 42 42.5 43 43.5 44
0.95
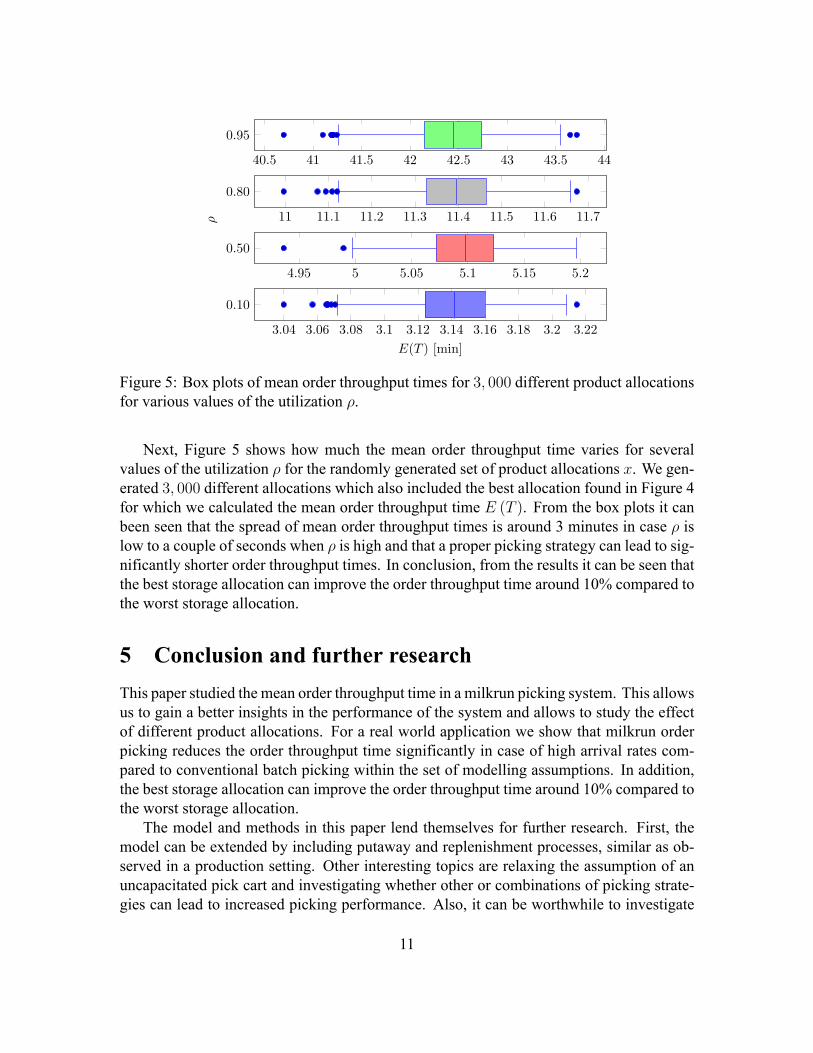
Figure 5: Box plots of mean order throughput times for 3, 000 different product allocationsfor various values of the utilization ρ.
Next, Figure 5 shows how much the mean order throughput time varies for severalvalues of the utilization ρ for the randomly generated set of product allocations x. We gen-erated 3, 000 different allocations which also included the best allocation found in Figure 4for which we calculated the mean order throughput time E (T ). From the box plots it canbeen seen that the spread of mean order throughput times is around 3 minutes in case ρ islow to a couple of seconds when ρ is high and that a proper picking strategy can lead to sig-nificantly shorter order throughput times. In conclusion, from the results it can be seen thatthe best storage allocation can improve the order throughput time around 10% compared tothe worst storage allocation.
5 Conclusion and further researchThis paper studied the mean order throughput time in a milkrun picking system. This allowsus to gain a better insights in the performance of the system and allows to study the effectof different product allocations. For a real world application we show that milkrun orderpicking reduces the order throughput time significantly in case of high arrival rates com-pared to conventional batch picking within the set of modelling assumptions. In addition,the best storage allocation can improve the order throughput time around 10% compared tothe worst storage allocation.
The model and methods in this paper lend themselves for further research. First, themodel can be extended by including putaway and replenishment processes, similar as ob-served in a production setting. Other interesting topics are relaxing the assumption of anuncapacitated pick cart and investigating whether other or combinations of picking strate-gies can lead to increased picking performance. Also, it can be worthwhile to investigate
11

whether a local backward routing policy, i.e. picking a product that arrived in the queuethat just has been visited, might increase system performance. Another research topic is toanalyze a multi-zoned warehouse where each zone operates under a separate milkrun.
References[1] De Koster, R., Le-Duc, T., & Roodbergen, K. J. (2007). Design and control of ware-
house order picking: A literature review. European Journal of Operational Research,182(2), 481–501.
[2] Gademann, N. & Van de Velde, S. (2005). Order batching to minimize total travel timein a parallel-aisle warehouse. IIE transactions, 37(1), 63–75.
[3] Gong, Y. & De Koster, R. (2008). A polling-based dynamic order picking system foronline retailers. IIE Transactions, 40(11), 1070–1082.
[4] Gong, Y. & De Koster, R. B. M. (2011). A review on stochastic models and analysis ofwarehouse operations. Logistics Research, 3(4), 191–205.
[5] Takagi, H. (1986). Analysis of polling systems. MIT press.
[6] Van der Gaast, J. P., Adan, I. J. B. F., & de Koster, R. B. M. (2015). The analysis ofbatch sojourn-times in polling systems. Working paper.
12