Order Picking
24
The Effects of Pick Density on Order Picking Areas With Narrow Aisles Kevin R. Gue Department of Industrial & Systems Engineering Auburn University Auburn, AL 36849 Russell D. Meller Department of Industrial Engineering University of Arkansas Fayetteville, AR 72701 Joseph D. Skufca Department of Mathematics Clarkson University Potsdam, NY 13699 January 23, 2006 Abstract The cost and service performa nce of an order fulfi llme nt cente r are determined par tly by ho w wo rkers are org ani zed into an ord er pic kin g sys tem. One common approach is batch picking, in which workers circumnavigate a picking area with other wo rkers, gather ing items on a pic k list. In some systems with high spac e util ization, narrow aisles prohibit workers from passing one another when in the same aisle, and this leads to cong estion. We buil d anal ytic al and simula tion models of these systems to investi gate their b ehavio r under different level s of activit y . Among other things, our results suggest that when the system is busier and pick density is high — that is, when workers stop often to make picks — congestion is less of a problem and workers are more productive. 1
-
Upload
bala-ganesh -
Category
Documents
-
view
240 -
download
0
Transcript of Order Picking
8/3/2019 Order Picking
http://slidepdf.com/reader/full/order-picking 1/24
The Effects of Pick Density on Order Picking Areas
With Narrow Aisles
Kevin R. Gue
Department of Industrial & Systems Engineering
Auburn University
Auburn, AL 36849
Russell D. Meller
Department of Industrial Engineering
University of ArkansasFayetteville, AR 72701
Joseph D. Skufca
Department of Mathematics
Clarkson University Potsdam, NY 13699
January 23, 2006
Abstract
The cost and service performance of an order fulfillment center are determined
partly by how workers are organized into an order picking system. One common
approach is batch picking, in which workers circumnavigate a picking area with other
workers, gathering items on a pick list. In some systems with high space utilization,narrow aisles prohibit workers from passing one another when in the same aisle, and
this leads to congestion. We build analytical and simulation models of these systems
to investigate their behavior under different levels of activity. Among other things, our
results suggest that when the system is busier and pick density is high — that is, when
workers stop often to make picks — congestion is less of a problem and workers are
more productive.
1
8/3/2019 Order Picking
http://slidepdf.com/reader/full/order-picking 2/24
1 Order picking
A distribution center typically consists of a reserve area (or warehouse) and an order fulfill-
ment center (an order picking forward area and possibly downstream sortation). Among the
decisions related to the order fulfillment center, one of the most significant from a cost and
service perspective is the design of the order picking system. Frazelle (2002) reports that
order picking typically comprises about 50% of the total operating costs of a distribution
center; and, to some extent, order picking determines customer service because it is one of
several time-consuming tasks that occur after a customer places an order. It also affects
service quality because certain designs are more susceptible to mispicks and clerical errors
than others.
Designers of order picking systems face a complex set of decisions, which interact mainly
to satisfy three design goals:
• Throughput — How many picks per hour will be required?
• Space utilization — How many items must be stored in how much space? and
• Cost — What will be the fixed and variable costs?
For a greenfield design, the objective is usually to minimize cost, subject to constraints on
throughput and space utilization. But this may change over the life of the distribution center:
as the business grows, throughput requirements often increase, and managers attempt to
maximize throughput; or storage space could become a problem, and managers would focus
on space utilization. Regardless of the objective, these design goals involve tradeoffs: a higher
throughput system typically requires more workers or automation and therefore has a higher
cost. Higher space utilization may require one-way aisles, leading to worker congestion and
lower throughput, or to automation and its increased cost.
To achieve these goals, designers must specify two primary characteristics of the system:
the physical configuration (racks, aisles, picking vehicles, etc.) and the order picking policy ;
that is, how workers are organized to pick and consolidate items for orders. The physical
2
8/3/2019 Order Picking
http://slidepdf.com/reader/full/order-picking 3/24
configuration determines space utilization by specifying the type of storage racks (single-
deep, double-deep, flow-rack, etc.) and the width of aisles. Narrow aisles result in higher
space utilization, but can lead to increased travel and congestion associated with one-way
travel.
The order picking policy specifies how workers are organized to retrieve orders. Tompkins
et al. (2003) identify three major order picking policies: (1) discrete order picking , in which
a worker picks all the items for a single order on each tour, (2) batch picking , in which a
worker collects items for several orders on each tour, and (3) zone picking , in which each
worker is assigned to a specific area of the warehouse and portions of orders are assigned to
appropriate zones. (Here, we consider discrete order picking to be a form of batch picking,
and therefore use the term batch picking to refer to either method.) Naturally, each methodhas advantages and disadvantages: discrete order picking is simple to implement and not
prone to mispicks, but is labor-intensive; batch picking has higher productivity due to less
worker travel per item picked, but can result in congestion and mispicks; zone picking has
high productivity (if there is sufficient picking activity to keep workers busy), but requires
downstream sortation, which can be costly. In an attempt to garner the advantages from
multiple methods, some warehouses use hybrid policies. We also note that multiple workers
are allowed in a zone in some zone picking systems, but this is rare in our experience.Notice that the physical configuration and the order picking policy might interact. If,
in an attempt to increase space utilization, the designer specifies aisles too narrow to allow
passing (which is not uncommon in practice), then having multiple workers in the same aisle
— as in batch picking — could lead to congestion. This is the situation we consider in our
work. Specifically, we are interested in narrow aisle picking systems (hereafter we mean this
to imply no passing within the aisles) when batch picking is the order picking policy; that
is, when there can be congestion among workers. We have visited narrow aisle systems withbatch picking that were designed this way and one, which we describe below, that was forced
into batch picking by a need for more throughput.
But we believe our work is relevant for another reason. Our experience suggests that batch
3
8/3/2019 Order Picking
http://slidepdf.com/reader/full/order-picking 4/24
picking is not very common in narrow-aisle systems because managers believe that if required
to produce high throughput, congestion would be a major problem. Therefore, managers
often choose zone picking when narrow aisles prevent workers from passing, without (in our
opinion) carefully weighing the disadvantages of zone picking, such as the cost of downstream
sortation, the difficulty of balancing zones, which leads to the possibility of idle workers due
to zone imbalances, and so on.
The models we present suggest that the effect of congestion in narrow aisle systems —
particularly busy ones — is misunderstood. The idea for our work came after discussions with
a distribution center manager who told us he used zone picking rather than batch picking
in a narrow aisle picking area because the pick density (the probability that a worker will
pick from any given location during his tour) was so low (corresponding to low throughput).Several months later, when we visited again, he had converted the area to batch picking,
citing a sharp increase in requests from this area and a need to increase the throughput; that
is, pick density was high . This was not in keeping with our observation of industry practice,
which seems to use zone picking to avoid congestion in busy picking areas with narrow aisles.
His statement led us to pose the following questions:
•Does lower pick density lead to more congestion in narrow-aisle systems? Why? What
is the relationship between pick density and congestion, and how should this influence
the design of an order picking system?
• Could we develop insights that would help designers know if congestion would be a
problem in narrow-aisle, batch picking areas?
Here, we present analytical and simulation models of narrow-aisle batch picking systems
and show that our DC manager was mostly correct: as throughput increases to high levels
in a narrow-aisle system, congestion among workers does (according to our models) tend to
decrease.
4
8/3/2019 Order Picking
http://slidepdf.com/reader/full/order-picking 5/24
2 Related literature
The literature on order picking is extensive, with several papers written on the operational
problem of how to execute a batch ordering system (van den Berg and Gademann, 1999).
Hwang and Lee (1988) use cluster analysis in an attempt to improve upon existing approaches
to order batching. Gibson and Sharp (1992) use spacefilling curves to form batches of orders
based on the expected retrieval tours. Pan and Liu (1995) investigate twelve algorithms for
order batching and find that the capacity of the picking vehicle (a man-on-board automated
storage and retrieval system) has an impact on which algorithm performs best. de Koster
et al. (1998) investigate heuristics for forming batches in a warehouse, noting that since
these problems are solved frequently, robustness and solution time are important criteria
when selecting an algorithm. de Koster and van der Poort (1998) provide a computational
comparison of heuristic order picking tours with optimal tours, noting that a heuristic tour
is frequently more than 10% longer than the optimal tour.
Among distribution center design papers, Gray et al. (1992) propose a hierarchical design
methodology that uses a sequence of mathematical programming models to address problems
such as warehouse layout, equipment selection, item location, picker assignment, and order
batching. Simpson and Erenguc (2001) model the order picking function at the middle of
a supply chain to illustrate how cost structures influence how much inventory is held and
the impact of policies on overall supply chain inventory costs. Ashayeri and Gelders (1985)
propose that the most practical approach to distribution center design lies in using simulation
and analytical tools together.
Our model of worker congestion in a batch picking system addresses the interaction of
workers in a set of picking aisles when there is no passing, which we will model as a circle.
Some related work has been published for production systems on a line. Muth (1984) models
a production line of k stations, where the service time at each station is given by a random
variable. Weber and Weiss (1994) describe an interesting problem called the “cafeteria
problem.” Customers move through a series of stations at which they receive service lasting
one time unit from a single, randomly chosen server. As in our model, there is no passing,
5
8/3/2019 Order Picking
http://slidepdf.com/reader/full/order-picking 6/24
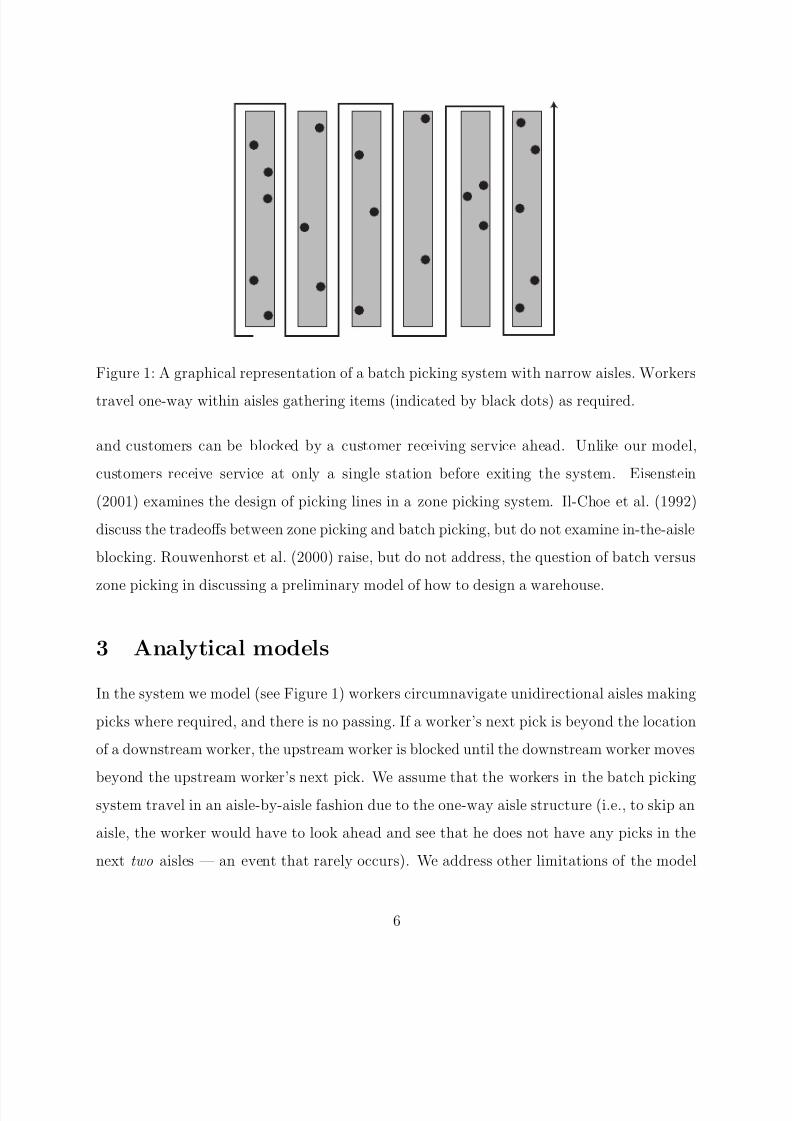
Figure 1: A graphical representation of a batch picking system with narrow aisles. Workers
travel one-way within aisles gathering items (indicated by black dots) as required.
and customers can be blocked by a customer receiving service ahead. Unlike our model,
customers receive service at only a single station before exiting the system. Eisenstein
(2001) examines the design of picking lines in a zone picking system. Il-Choe et al. (1992)
discuss the tradeoffs between zone picking and batch picking, but do not examine in-the-aisle
blocking. Rouwenhorst et al. (2000) raise, but do not address, the question of batch versus
zone picking in discussing a preliminary model of how to design a warehouse.
3 Analytical models
In the system we model (see Figure 1) workers circumnavigate unidirectional aisles making
picks where required, and there is no passing. If a worker’s next pick is beyond the location
of a downstream worker, the upstream worker is blocked until the downstream worker moves
beyond the upstream worker’s next pick. We assume that the workers in the batch pickingsystem travel in an aisle-by-aisle fashion due to the one-way aisle structure (i.e., to skip an
aisle, the worker would have to look ahead and see that he does not have any picks in the
next two aisles — an event that rarely occurs). We address other limitations of the model
6

8/3/2019 Order Picking
http://slidepdf.com/reader/full/order-picking 7/24
in the next section.
In this section we develop a simple throughput model for this batch picking system. The
model depends on the fraction of time a worker is blocked, and so we develop analytical
models for that fraction.
3.1 Throughput model
One measure of the effectiveness of an order picking strategy is its throughput capacity,
where throughput is the number of picks made per time. We assume that a worker is either
picking, walking, or idle due to blocking.
Our model is built on the following assumptions:
• The picking area has n picking points. In a typical application, a picking point might
represent a column of pallet rack, a bay of flow rack, or a section of bin shelving.
Each picking point, in reality, might contain several picking locations (e.g., a column
of pallet rack might be 3 or 4 pallets high), but for our purposes the place at which a
worker stops to make picks is the picking point. Our definition of picking point could
include both sides of an aisle because the worker would stop at the same point to make
a pick from either side.
• Workers stop at each picking point independently with probability p. This is a surro-
gate for pick density, or alternatively, for the average number of picks per tour (np).
(The probability of not having to make a pick at a picking point is q = 1 − p.)
• The time to pick is a constant t p, meaning we ignore the variation in the actual time
to pick at a picking point and instead use just an average time.
• The time to walk past a location is tw. We ignore the effects of acceleration and
deceleration in our model, although this time could be added to the picking time t p.
For a batch picking system with k workers, we say that each worker is blocked a fraction
7
8/3/2019 Order Picking
http://slidepdf.com/reader/full/order-picking 8/24
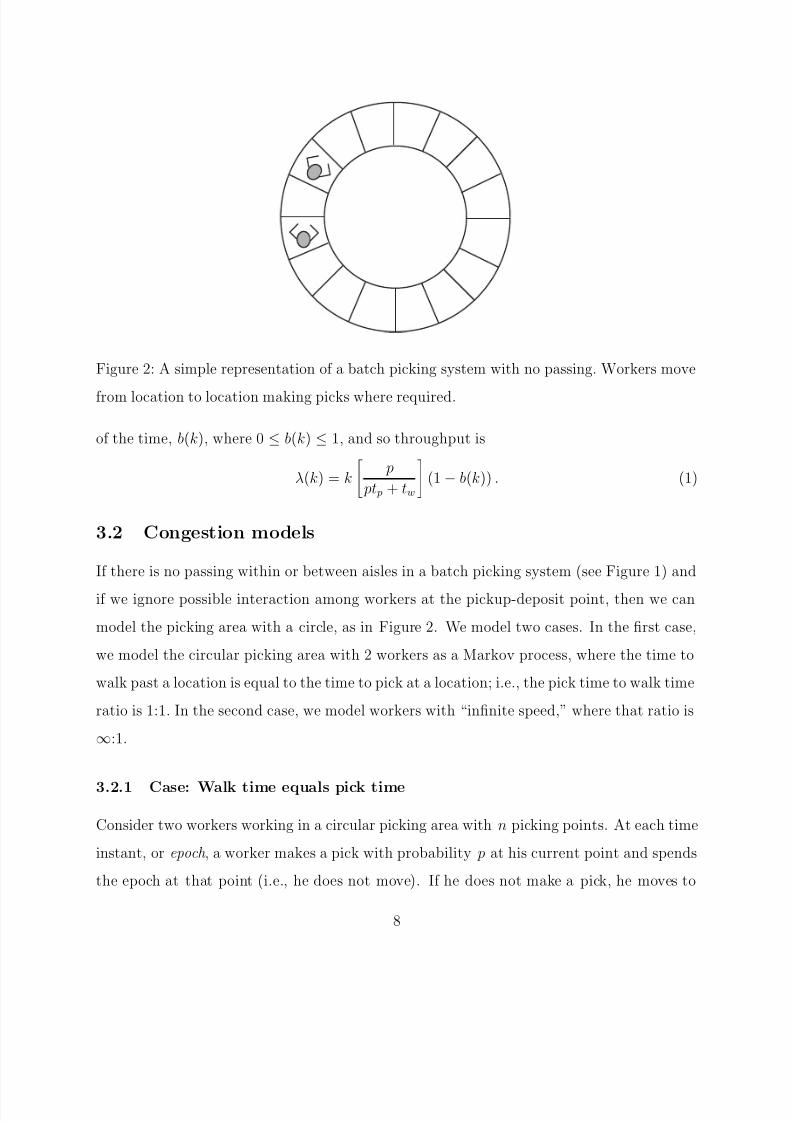
Figure 2: A simple representation of a batch picking system with no passing. Workers move
from location to location making picks where required.
of the time, b(k), where 0 ≤ b(k) ≤ 1, and so throughput is
λ(k) = k
p
pt p + tw
(1 − b(k)) . (1)
3.2 Congestion models
If there is no passing within or between aisles in a batch picking system (see Figure 1) and
if we ignore possible interaction among workers at the pickup-deposit point, then we can
model the picking area with a circle, as in Figure 2. We model two cases. In the first case,
we model the circular picking area with 2 workers as a Markov process, where the time to
walk past a location is equal to the time to pick at a location; i.e., the pick time to walk time
ratio is 1:1. In the second case, we model workers with “infinite speed,” where that ratio is
∞:1.
3.2.1 Case: Walk time equals pick time
Consider two workers working in a circular picking area with n picking points. At each time
instant, or epoch , a worker makes a pick with probability p at his current point and spends
the epoch at that point (i.e., he does not move). If he does not make a pick, he moves to
8
8/3/2019 Order Picking
http://slidepdf.com/reader/full/order-picking 9/24
the next picking point in this epoch, unless that point is occupied by another worker making
a pick. In that case he is blocked for that epoch. Since the picking area is circular, either
worker can block the other. We assume that once a pick is made at a point, the worker will
move past the current point in the next epoch with probability 1. Assume that workers have
the same picking time, walking speed, and probability of stopping at any picking point.
Consider the distance Dt between Worker 1 and Worker 2 at epoch t, where worker
numbers are assigned arbitrarily, a priori , and never change. The distance is always equal to
(n + (Worker 1 position) − (Worker 2 position)) mod n. Since the workers are not allowed
to be at the same picking point, 1 ≤ Dt ≤ n − 1. For example, in a picking area with n = 6
picking points, the workers could be as close as points 2 and 1 ( Dt = 1) or as far away as
points 6 and 1 (Dt = 5).The sequence {Dt} is not a Markov chain because if a worker picked during the last
epoch he must move during this epoch; therefore, Dt+1 depends on Dt and on the action
of the workers in the previous step. To establish the Markov property we must include the
history of the previous step in the state. We label states as rxy, where x and y represent the
previous action of Workers 1 and 2, respectively. For example, state 3 pw says that workers
are 3 picking points apart, Worker 1 just picked, and Worker 2 just walked. The state 1wp
is not achievable because it indicates that workers are adjacent immediately after Worker1 walked and Worker 2 picked, which could only happen if the workers occupied the same
picking point in the previous epoch. We called this the blocked state instead. All other states
are achievable except state (n − 1) pw, which we also label as blocked.
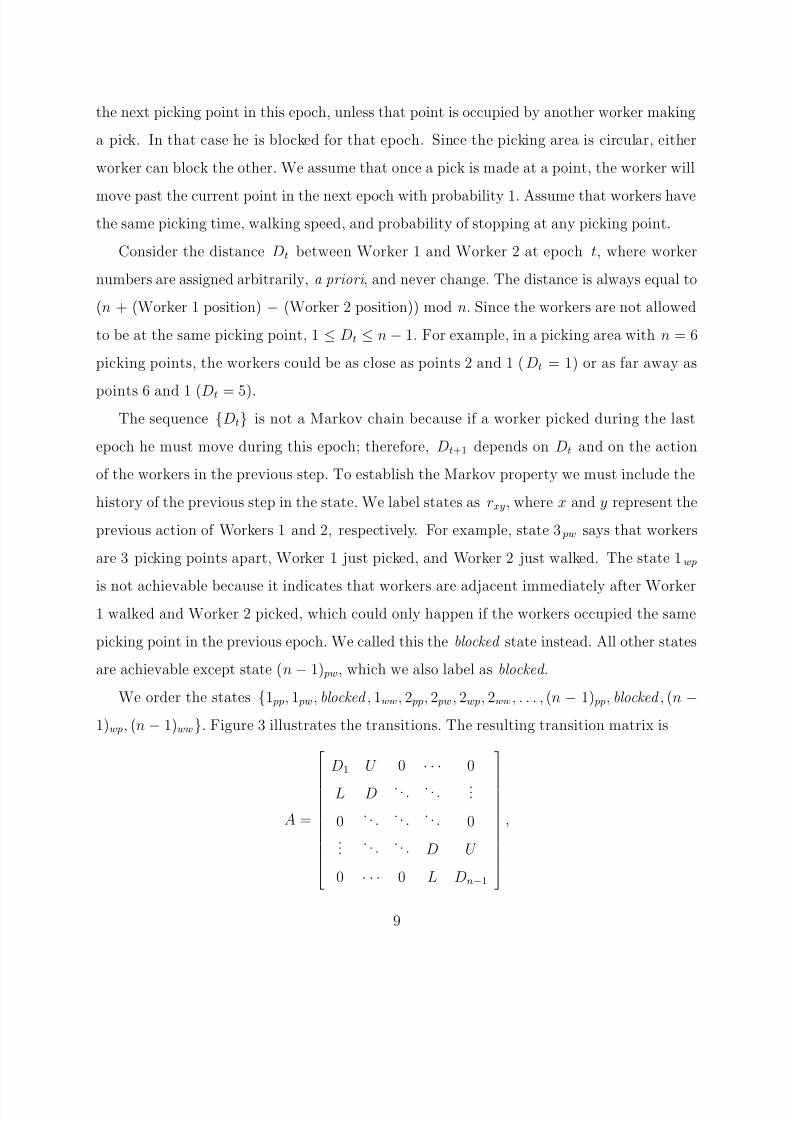
We order the states {1 pp, 1 pw, blocked , 1ww, 2 pp, 2 pw, 2wp, 2ww, . . . , (n − 1) pp, blocked , (n −1)wp, (n − 1)ww}. Figure 3 illustrates the transitions. The resulting transition matrix is
A =
D1 U 0 · · · 0
L D . . . . . . ...
0. . .
. . .. . . 0
.... . . . . . D U
0 · · · 0 L Dn−1
,
9
8/3/2019 Order Picking
http://slidepdf.com/reader/full/order-picking 10/24
1 pp1 pw 1ww
2 pp 2 pw 2wp 2ww
3 pp 3 pw 3wp 3ww
block
1
p2
q
1
pq
q2
pq
pq
p
p
p2
p
q
pq
q2
q
p
pq
1
Figure 3: State space and transitions for the Markov chain model when picking time equals
travel time.
where
L =
0 0 0 0
0 0 0 0
0 p 0 0
0 pq 0 0
, U =
0 0 0 0
0 0 p 0
0 0 0 0
0 0 pq 0
,
D =
0 0 0 1
0 0 0 q
0 0 0 q
p2 0 0 q2
, D1 =
0 0 0 1
0 0 0 q
0 0 0 1
p2 0 pq q2
, and Dn−1 =
0 0 0 1
0 0 0 1
0 0 0 q
p2 pq 0 q2
.
We can verify that
v = [
r=1 p2,p,pq, 1,
r=2 p2,p,p, 1, . . . ,
r=n−2 p2,p,p, 1,
r=n−1 p2,pq,p, 1]
satisfies vA = v. The stationary density for the Markov process is determined by scaling by
v1
. Since the blocked state for Worker 2 is represented by the third row or column in the
transition matrix A, we have
b1(2) =v3
v1
=pq
(n − 3)( p2 + 2 p + 1) + 2( p2 + pq + p + 1)=
pq
(n − 1)( p + 1)2 − 2 p2, (2)
10
8/3/2019 Order Picking
http://slidepdf.com/reader/full/order-picking 11/24
0.2 0.4 0.6 0.8 1Prob
0.1
0.2
0.3
0.4
0.5
0.6
% time blocked
n20
50
100
200
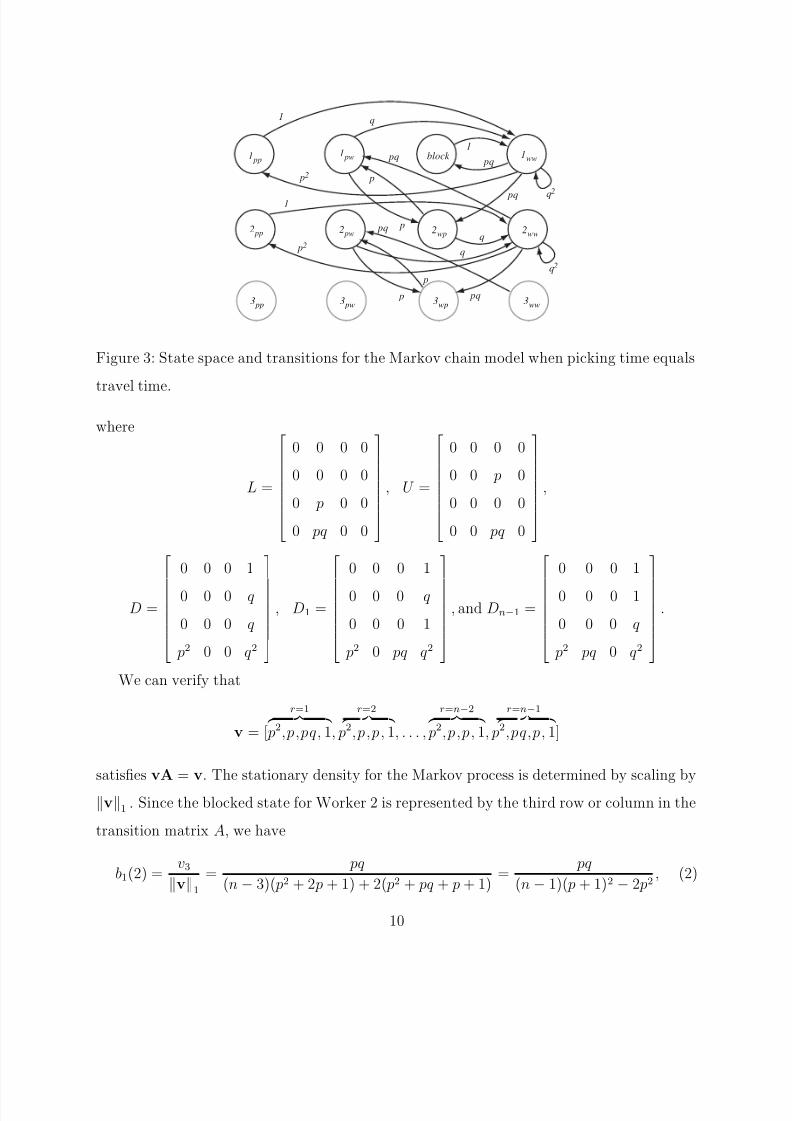
Figure 4: Percentage of time workers are blocked in a 2-worker system in which the time to
pick from a picking point equals the time to walk past it, as the number of picking points nvaries.
where b1(2) is the average amount of time that Worker 2 is blocked. And since the blocked
state for Worker 1 (the n −3 row or column in A) is occupied with the same frequency, b1(2)
also represents the average amount of time that Worker 1 is blocked. Therefore, b1(2) is the
average amount of time that each of the two workers is blocked. Figure 4 shows the result
for several values of n.
From the derivative of (2), the value of p that maximizes blocking in a 1:1 system with
n picking points is
pmax1 (n) =
1 − n +√
6 − 10n + 4n2
−5 + 3n, (3)
which leads to
Theorem 1 Congestion is worst in a 1:1 batch picking system when 1/3 ≤ p ≤√3−12
, or
approximately 0.33 ≤ p ≤ 0.37.
Proof Taking the derivative of (3) with respect to n, we see that pmax1 (n) decreases as n
increases. Evaluating (3) with n = 3 establishes the upper bound at√3−12
. To establish the
lower bound, we note that limn→∞ pmax
1 (n) = 1/3. 2
11
8/3/2019 Order Picking
http://slidepdf.com/reader/full/order-picking 12/24
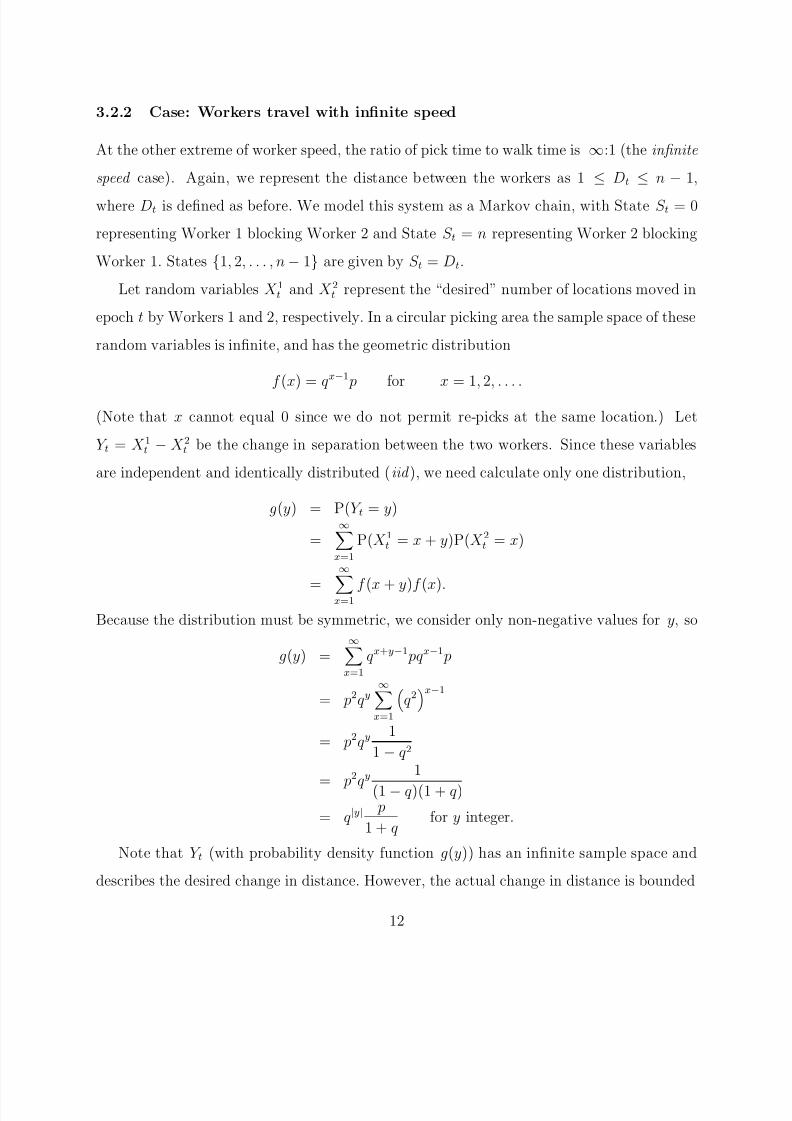
3.2.2 Case: Workers travel with infinite speed
At the other extreme of worker speed, the ratio of pick time to walk time is ∞:1 (the infinite
speed case). Again, we represent the distance between the workers as 1
≤Dt
≤n
−1,
where Dt is defined as before. We model this system as a Markov chain, with State S t = 0
representing Worker 1 blocking Worker 2 and State S t = n representing Worker 2 blocking
Worker 1. States {1, 2, . . . , n − 1} are given by S t = Dt.
Let random variables X 1t and X 2t represent the “desired” number of locations moved in
epoch t by Workers 1 and 2, respectively. In a circular picking area the sample space of these
random variables is infinite, and has the geometric distribution
f (x) = qx−1 p for x = 1, 2, . . . .
(Note that x cannot equal 0 since we do not permit re-picks at the same location.) Let
Y t = X 1t − X 2t be the change in separation between the two workers. Since these variables
are independent and identically distributed (iid ), we need calculate only one distribution,
g(y) = P(Y t = y)
=∞x=1
P(X 1t = x + y)P(X 2t = x)
=
∞x=1 f (x + y)f (x).
Because the distribution must be symmetric, we consider only non-negative values for y, so
g(y) =∞x=1
qx+y−1 pqx−1 p
= p2qy∞x=1
q2x−1
= p2qy1
1 − q2
= p2
qy 1
(1 − q)(1 + q)
= q|y|p
1 + qfor y integer.
Note that Y t (with probability density function g(y)) has an infinite sample space and
describes the desired change in distance. However, the actual change in distance is bounded
12
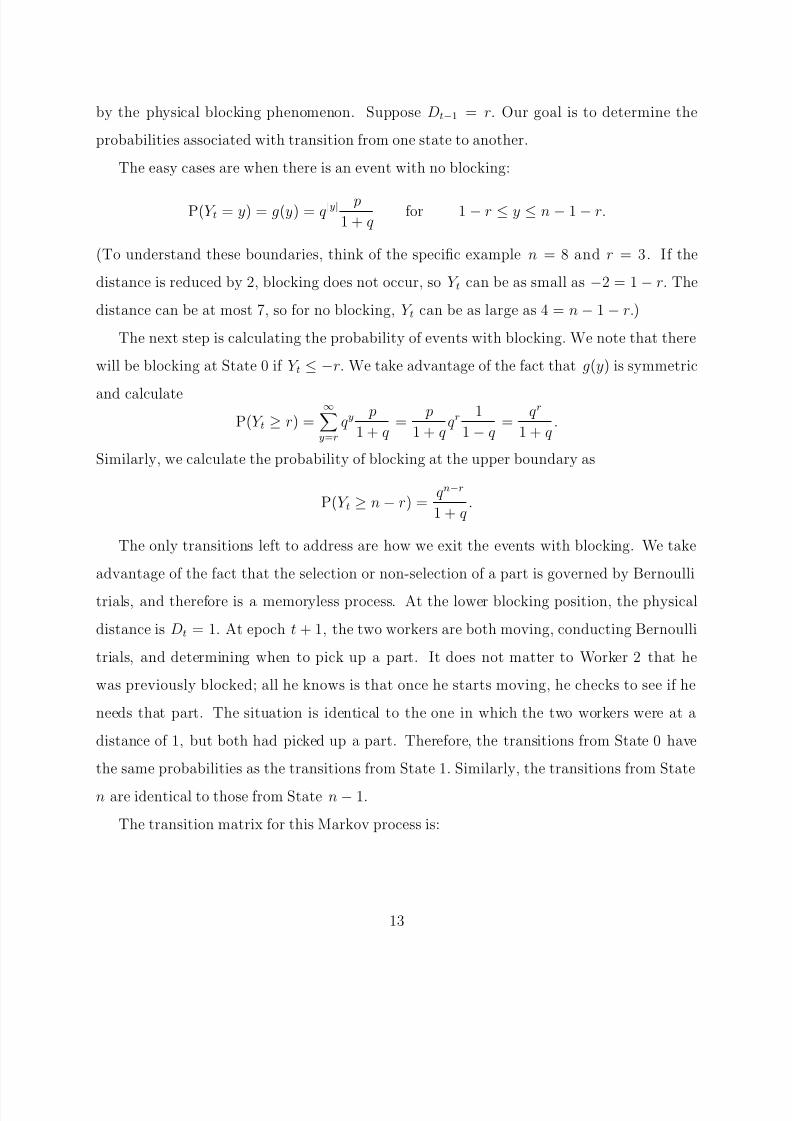
8/3/2019 Order Picking
http://slidepdf.com/reader/full/order-picking 13/24
by the physical blocking phenomenon. Suppose Dt−1 = r. Our goal is to determine the
probabilities associated with transition from one state to another.
The easy cases are when there is an event with no blocking:
P(Y t = y) = g(y) = q|y| p1 + q
for 1 − r ≤ y ≤ n − 1 − r.
(To understand these boundaries, think of the specific example n = 8 and r = 3. If the
distance is reduced by 2, blocking does not occur, so Y t can be as small as −2 = 1 − r. The
distance can be at most 7, so for no blocking, Y t can be as large as 4 = n − 1 − r.)
The next step is calculating the probability of events with blocking. We note that there
will be blocking at State 0 if Y t ≤ −r. We take advantage of the fact that g(y) is symmetric
and calculate
P(Y t ≥ r) =∞y=r
qyp
1 + q=
p
1 + qqr
1
1 − q=
qr
1 + q.
Similarly, we calculate the probability of blocking at the upper boundary as
P(Y t ≥ n − r) =qn−r
1 + q.
The only transitions left to address are how we exit the events with blocking. We take
advantage of the fact that the selection or non-selection of a part is governed by Bernoulli
trials, and therefore is a memoryless process. At the lower blocking position, the physical
distance is Dt = 1. At epoch t + 1, the two workers are both moving, conducting Bernoulli
trials, and determining when to pick up a part. It does not matter to Worker 2 that he
was previously blocked; all he knows is that once he starts moving, he checks to see if he
needs that part. The situation is identical to the one in which the two workers were at a
distance of 1, but both had picked up a part. Therefore, the transitions from State 0 have
the same probabilities as the transitions from State 1. Similarly, the transitions from State
n are identical to those from State n − 1.
The transition matrix for this Markov process is:
13
8/3/2019 Order Picking
http://slidepdf.com/reader/full/order-picking 14/24
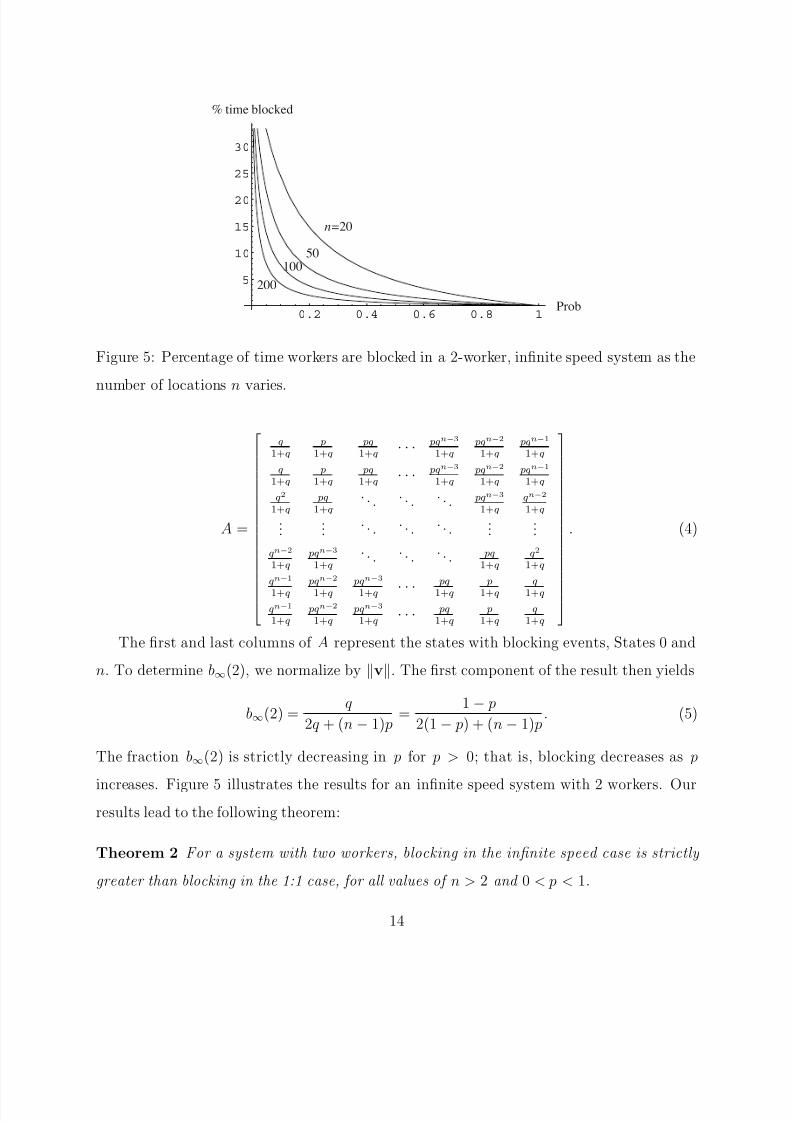
0.2 0.4 0.6 0.8 1Prob
5
10
15
20
25
30
% time blocked
n20
50
100
200
Figure 5: Percentage of time workers are blocked in a 2-worker, infinite speed system as the
number of locations n varies.
A =
q
1+q
p
1+q
pq
1+q· · · pqn−3
1+q
pqn−2
1+q
pqn−1
1+q
q
1+q
p
1+q
pq
1+q· · · pqn−3
1+q
pqn−2
1+q
pqn−1
1+q
q2
1+q
pq
1+q
. . . . . . . . . pqn−3
1+q
qn−2
1+q
......
. . . . . . . . ....
...
qn−2
1+q
pqn−3
1+q
. . . . . . . . . pq
1+q
q2
1+q
qn−1
1+q
pqn−2
1+q
pqn−3
1+q · · ·pq
1+q
p
1+q
q
1+q
qn−1
1+q
pqn−2
1+q
pqn−3
1+q· · · pq
1+q
p
1+q
q
1+q
. (4)
The first and last columns of A represent the states with blocking events, States 0 and
n. To determine b∞(2), we normalize by v. The first component of the result then yields
b∞(2) =q
2q + (n − 1) p=
1 − p
2(1 − p) + (n − 1) p. (5)
The fraction b∞(2) is strictly decreasing in p for p > 0; that is, blocking decreases as p
increases. Figure 5 illustrates the results for an infinite speed system with 2 workers. Our
results lead to the following theorem:
Theorem 2 For a system with two workers, blocking in the infinite speed case is strictly
greater than blocking in the 1:1 case, for all values of n > 2 and 0 < p < 1.
14
8/3/2019 Order Picking
http://slidepdf.com/reader/full/order-picking 15/24
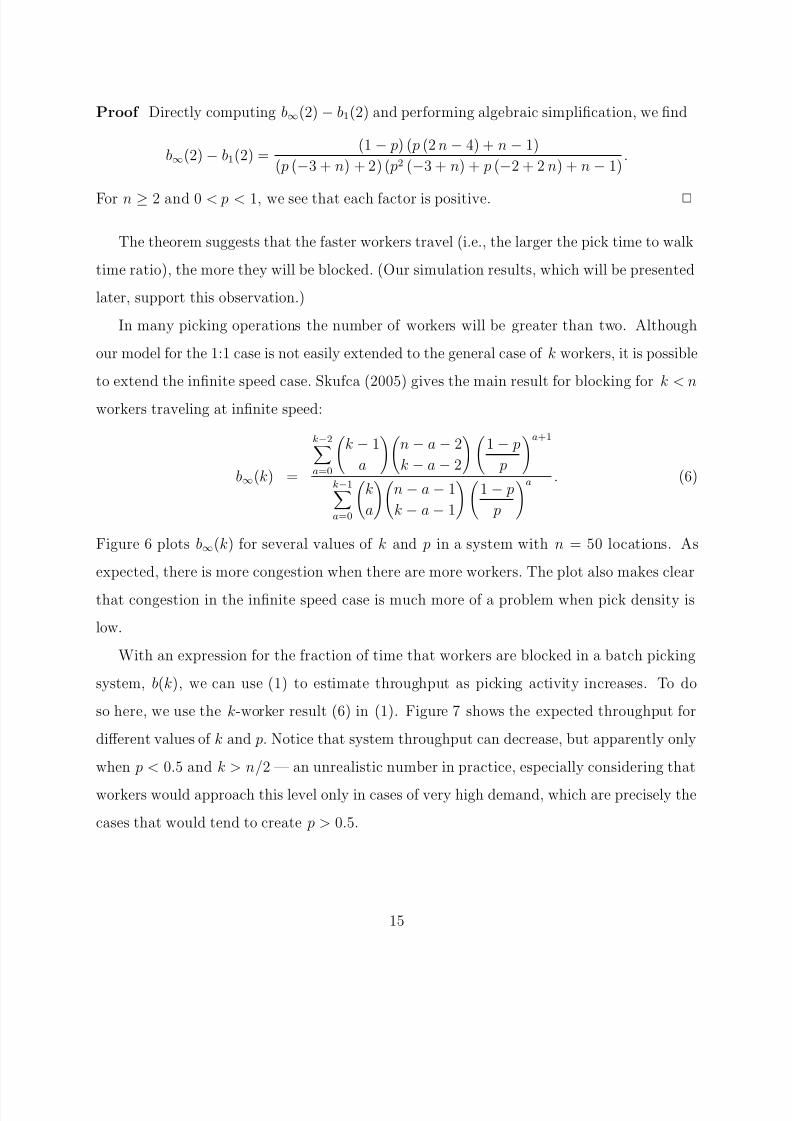
Proof Directly computing b∞(2) − b1(2) and performing algebraic simplification, we find
b∞(2) − b1(2) =(1 − p) ( p (2 n − 4) + n − 1)
( p (−3 + n) + 2) ( p2 (−3 + n) + p (−2 + 2 n) + n − 1).
For n ≥ 2 and 0 < p < 1, we see that each factor is positive. 2
The theorem suggests that the faster workers travel (i.e., the larger the pick time to walk
time ratio), the more they will be blocked. (Our simulation results, which will be presented
later, support this observation.)
In many picking operations the number of workers will be greater than two. Although
our model for the 1:1 case is not easily extended to the general case of k workers, it is possible
to extend the infinite speed case. Skufca (2005) gives the main result for blocking for k < n
workers traveling at infinite speed:
b∞(k) =
k−2a=0
k − 1
a
n − a − 2
k − a − 2
1 − p
p
a+1
k−1a=0
k
a
n − a − 1
k − a − 1
1 − p
p
a . (6)
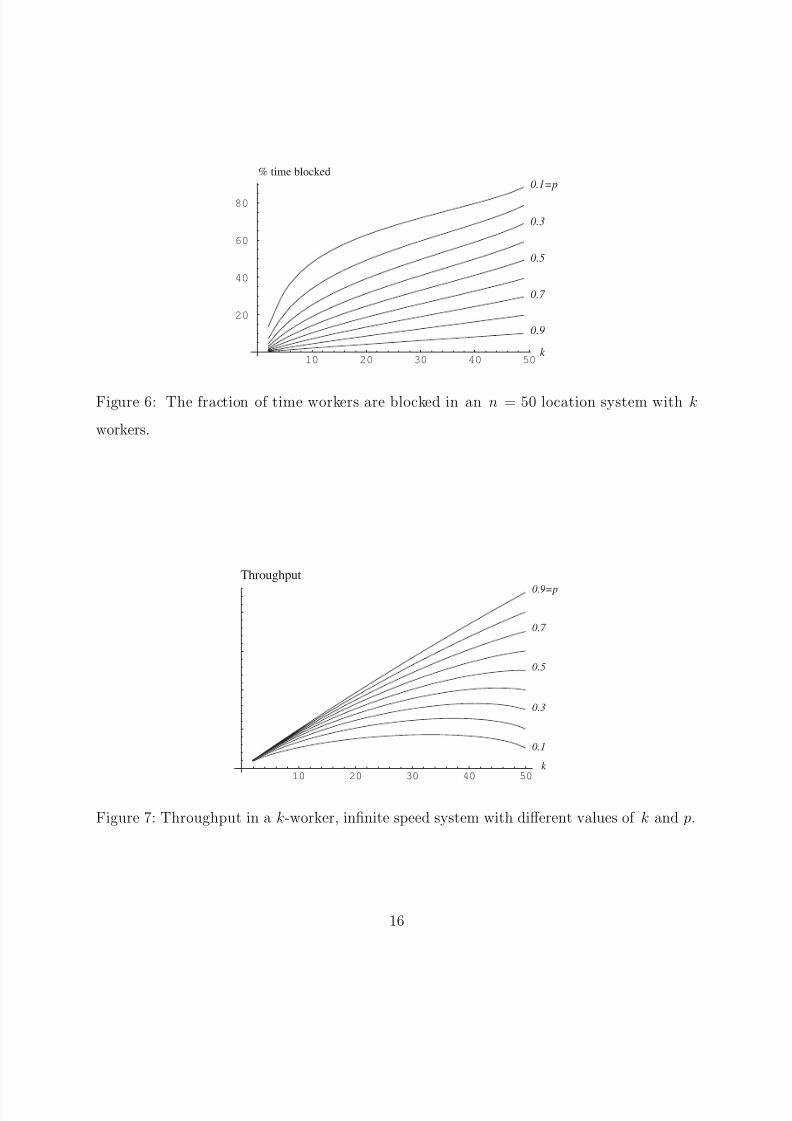
Figure 6 plots b∞(k) for several values of k and p in a system with n = 50 locations. As
expected, there is more congestion when there are more workers. The plot also makes clear
that congestion in the infinite speed case is much more of a problem when pick density is
low.
With an expression for the fraction of time that workers are blocked in a batch picking
system, b(k), we can use (1) to estimate throughput as picking activity increases. To do
so here, we use the k-worker result (6) in (1). Figure 7 shows the expected throughput for
different values of k and p. Notice that system throughput can decrease, but apparently only
when p < 0.5 and k > n/2 — an unrealistic number in practice, especially considering that
workers would approach this level only in cases of very high demand, which are precisely the
cases that would tend to create p > 0.5.
15
8/3/2019 Order Picking
http://slidepdf.com/reader/full/order-picking 16/24
10 20 30 40 50k
20
40
60
80
0.1=p
0.3
0.5
0.7
0.9
% time blocked
Figure 6: The fraction of time workers are blocked in an n = 50 location system with k
workers.
k
0.9=p
0.7
0.5
0.3
0.1
10 20 30 40 50
Throughput
Figure 7: Throughput in a k-worker, infinite speed system with different values of k and p.
16
8/3/2019 Order Picking
http://slidepdf.com/reader/full/order-picking 17/24
0.2 0.4 0.6 0.8 1Prob
5
10
15
20
25
% time blocked
:1
20:1
10:1
5:1
1:1
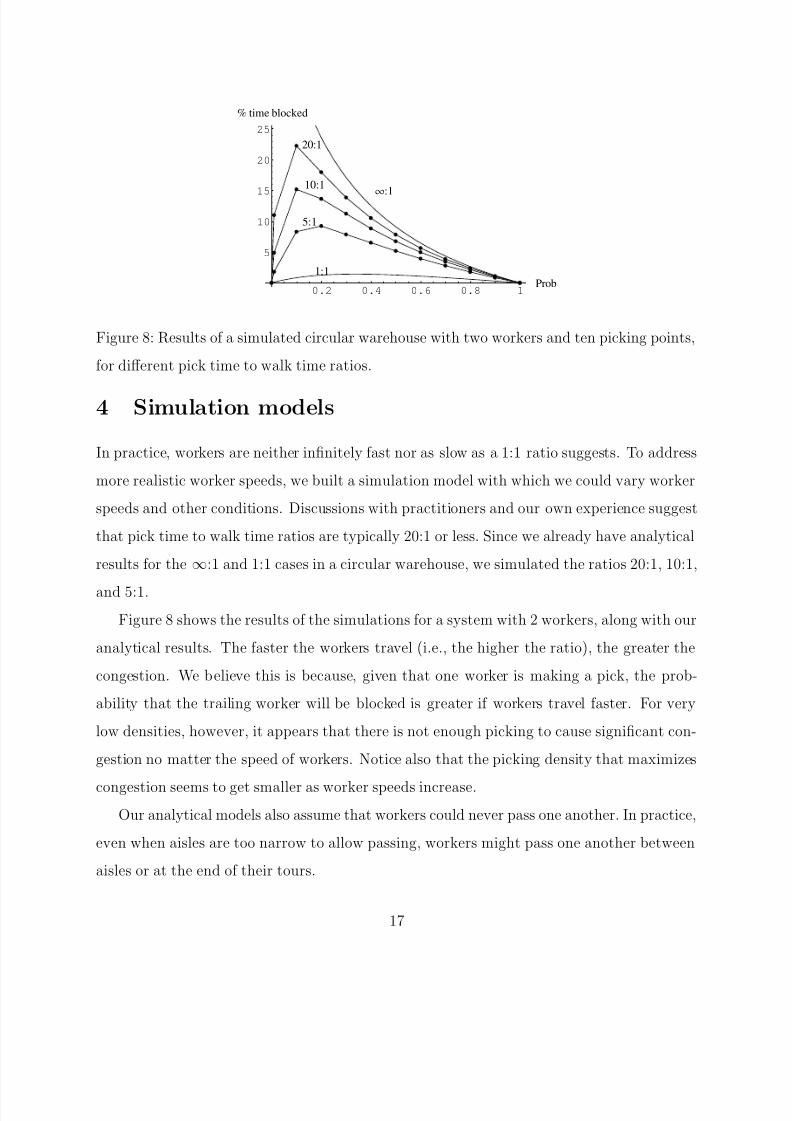
Figure 8: Results of a simulated circular warehouse with two workers and ten picking points,
for different pick time to walk time ratios.
4 Simulation models
In practice, workers are neither infinitely fast nor as slow as a 1:1 ratio suggests. To address
more realistic worker speeds, we built a simulation model with which we could vary worker
speeds and other conditions. Discussions with practitioners and our own experience suggest
that pick time to walk time ratios are typically 20:1 or less. Since we already have analytical
results for the ∞:1 and 1:1 cases in a circular warehouse, we simulated the ratios 20:1, 10:1,
and 5:1.
Figure 8 shows the results of the simulations for a system with 2 workers, along with our
analytical results. The faster the workers travel (i.e., the higher the ratio), the greater the
congestion. We believe this is because, given that one worker is making a pick, the prob-
ability that the trailing worker will be blocked is greater if workers travel faster. For very
low densities, however, it appears that there is not enough picking to cause significant con-
gestion no matter the speed of workers. Notice also that the picking density that maximizes
congestion seems to get smaller as worker speeds increase.
Our analytical models also assume that workers could never pass one another. In practice,
even when aisles are too narrow to allow passing, workers might pass one another between
aisles or at the end of their tours.
17
8/3/2019 Order Picking
http://slidepdf.com/reader/full/order-picking 18/24
0.2 0.4 0.6 0.8 1
1
2
3
4
5
6
% time blocked
Without passing
With passing
Prob
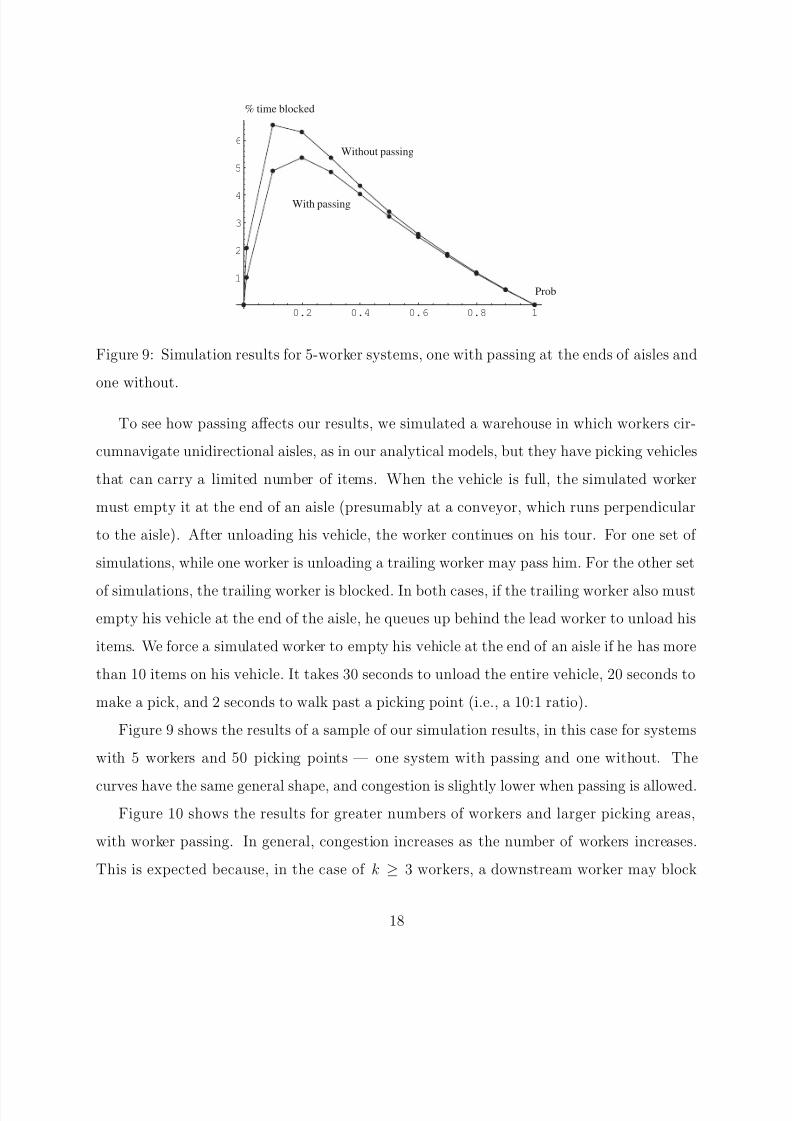
Figure 9: Simulation results for 5-worker systems, one with passing at the ends of aisles and
one without.
To see how passing affects our results, we simulated a warehouse in which workers cir-
cumnavigate unidirectional aisles, as in our analytical models, but they have picking vehicles
that can carry a limited number of items. When the vehicle is full, the simulated worker
must empty it at the end of an aisle (presumably at a conveyor, which runs perpendicular
to the aisle). After unloading his vehicle, the worker continues on his tour. For one set of
simulations, while one worker is unloading a trailing worker may pass him. For the other set
of simulations, the trailing worker is blocked. In both cases, if the trailing worker also must
empty his vehicle at the end of the aisle, he queues up behind the lead worker to unload his
items. We force a simulated worker to empty his vehicle at the end of an aisle if he has more
than 10 items on his vehicle. It takes 30 seconds to unload the entire vehicle, 20 seconds to
make a pick, and 2 seconds to walk past a picking point (i.e., a 10:1 ratio).
Figure 9 shows the results of a sample of our simulation results, in this case for systems
with 5 workers and 50 picking points — one system with passing and one without. The
curves have the same general shape, and congestion is slightly lower when passing is allowed.
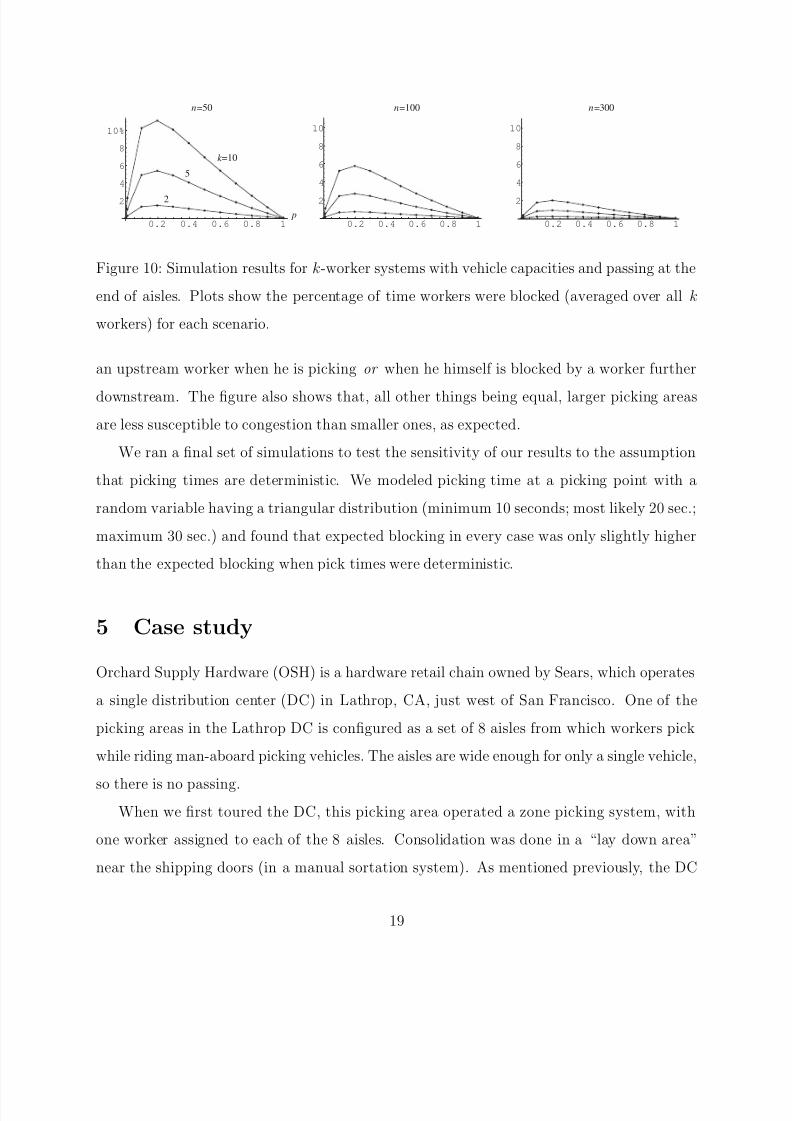
Figure 10 shows the results for greater numbers of workers and larger picking areas,
with worker passing. In general, congestion increases as the number of workers increases.
This is expected because, in the case of k ≥ 3 workers, a downstream worker may block
18
8/3/2019 Order Picking
http://slidepdf.com/reader/full/order-picking 19/24
0.2 0.4 0.6 0.8 1
2
4
6
8
10%
0.2 0.4 0.6 0.8 1
2
4
6
8
10
0.2 0.4 0.6 0.8 1
2
4
6
8
10
k =10
5
2
n=50 n=100 n=300
p
Figure 10: Simulation results for k-worker systems with vehicle capacities and passing at the
end of aisles. Plots show the percentage of time workers were blocked (averaged over all k
workers) for each scenario.
an upstream worker when he is picking or when he himself is blocked by a worker further
downstream. The figure also shows that, all other things being equal, larger picking areas
are less susceptible to congestion than smaller ones, as expected.
We ran a final set of simulations to test the sensitivity of our results to the assumption
that picking times are deterministic. We modeled picking time at a picking point with a
random variable having a triangular distribution (minimum 10 seconds; most likely 20 sec.;
maximum 30 sec.) and found that expected blocking in every case was only slightly higher
than the expected blocking when pick times were deterministic.
5 Case study
Orchard Supply Hardware (OSH) is a hardware retail chain owned by Sears, which operates
a single distribution center (DC) in Lathrop, CA, just west of San Francisco. One of the
picking areas in the Lathrop DC is configured as a set of 8 aisles from which workers pick
while riding man-aboard picking vehicles. The aisles are wide enough for only a single vehicle,
so there is no passing.When we first toured the DC, this picking area operated a zone picking system, with
one worker assigned to each of the 8 aisles. Consolidation was done in a “lay down area”
near the shipping doors (in a manual sortation system). As mentioned previously, the DC
19
8/3/2019 Order Picking
http://slidepdf.com/reader/full/order-picking 20/24
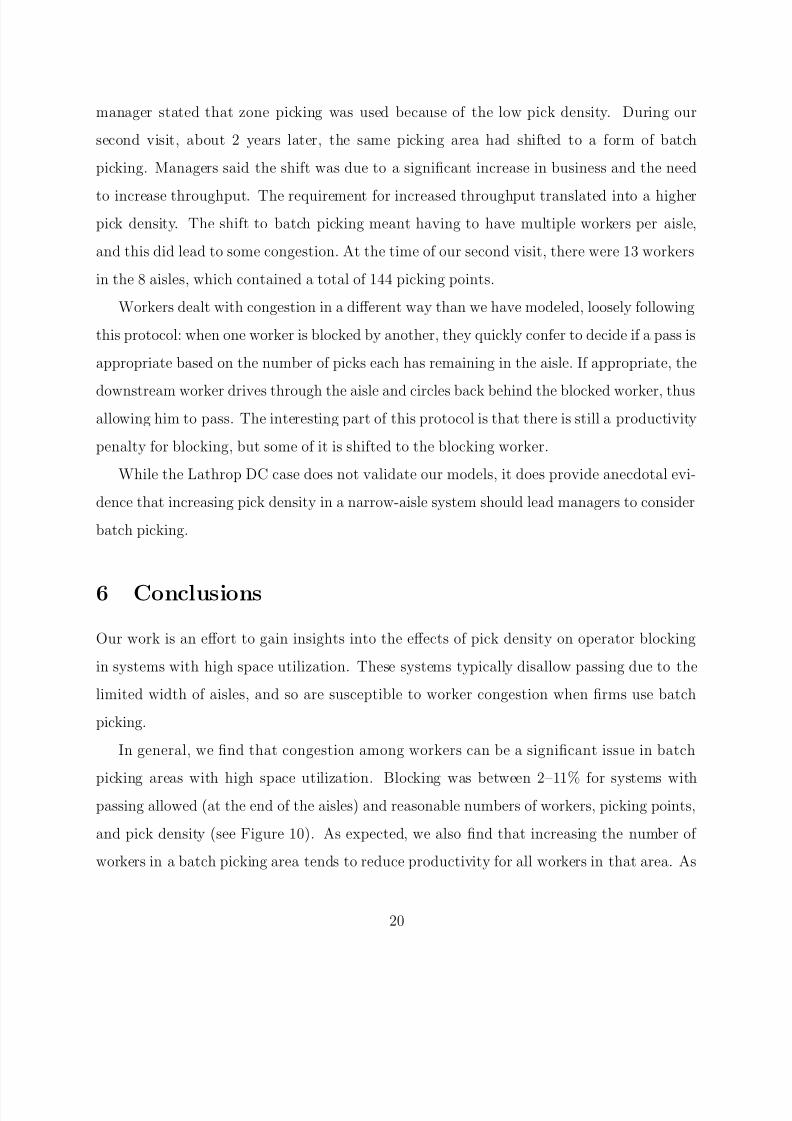
manager stated that zone picking was used because of the low pick density. During our
second visit, about 2 years later, the same picking area had shifted to a form of batch
picking. Managers said the shift was due to a significant increase in business and the need
to increase throughput. The requirement for increased throughput translated into a higher
pick density. The shift to batch picking meant having to have multiple workers per aisle,
and this did lead to some congestion. At the time of our second visit, there were 13 workers
in the 8 aisles, which contained a total of 144 picking points.
Workers dealt with congestion in a different way than we have modeled, loosely following
this protocol: when one worker is blocked by another, they quickly confer to decide if a pass is
appropriate based on the number of picks each has remaining in the aisle. If appropriate, the
downstream worker drives through the aisle and circles back behind the blocked worker, thusallowing him to pass. The interesting part of this protocol is that there is still a productivity
penalty for blocking, but some of it is shifted to the blocking worker.
While the Lathrop DC case does not validate our models, it does provide anecdotal evi-
dence that increasing pick density in a narrow-aisle system should lead managers to consider
batch picking.
6 Conclusions
Our work is an effort to gain insights into the effects of pick density on operator blocking
in systems with high space utilization. These systems typically disallow passing due to the
limited width of aisles, and so are susceptible to worker congestion when firms use batch
picking.
In general, we find that congestion among workers can be a significant issue in batch
picking areas with high space utilization. Blocking was between 2–11% for systems withpassing allowed (at the end of the aisles) and reasonable numbers of workers, picking points,
and pick density (see Figure 10). As expected, we also find that increasing the number of
workers in a batch picking area tends to reduce productivity for all workers in that area. As
20
8/3/2019 Order Picking
http://slidepdf.com/reader/full/order-picking 21/24
the number of workers in a batch picking area increases, throughput indeed increases, but
at the cost of additional congestion for all (see Figure 7). If it is easy to hand-off orders and
workers are arranged on a picking line, bucket brigades may be appropriate because there
is no congestion under that protocol. Also as expected, we find that congestion is less of a
problem for larger batch picking areas. Our results for picking areas with more than 100
picking points had blocking percentages less than 3% for systems with 5 or fewer workers
(see Figure 10), which seems quite tolerable. Because the number of picking points is so large
compared to the number of workers, workers are more likely to “spread out,” thus avoiding
congestion.
Our major finding is that
As a narrow-aisle batch picking area gets busier, congestion among the workers
becomes less of a concern.
Irrespective of the number of workers, size of the picking area, and the ability of workers to
pass at the end of the aisles, blocking as a function of picking density tends to follow the
same pattern (see Figures 8–9). For extremely low values of pick density, there is very little
blocking because workers make almost no picks. For higher levels of pick density, congestion
increases as workers make sufficient stops to cause interaction. But as pick density continues
to increase, workers tend not to block one another because they spend more time picking
and less time traveling. It is only while traveling that a worker can be blocked, so blocking
is less of a concern for these high levels of worker activity.
Our results suggest a possible progression of order picking approaches for existing systems
with high space utilization: when pick density is very low, batch picking is preferred because
there is likely not enough activity to keep workers sufficiently busy in zones (or the zones
would be unreasonably large). For higher levels of pick density, zone picking may be preferred
due to increased congestion of equivalent batch picking systems, depending on the number
of workers, actual pick density, number of picking points, and so on. But as pick density
increases yet again, say, due to an increase in business of the firm, batch picking might be
preferred again for two reasons. First, there is little loss due to congestion, as our results
21
8/3/2019 Order Picking
http://slidepdf.com/reader/full/order-picking 22/24
suggest, and second, the zone picking system may be unable to deliver sufficient throughput
because zones typically contain only a single worker. For example, at OSH Hardware, the
picking area employed more workers than it contained aisles, and some worker interaction
was unavoidable.
22
8/3/2019 Order Picking
http://slidepdf.com/reader/full/order-picking 23/24
References
Ashayeri, J. and Gelders, L. (1985). Warehouse design optimization. European Journal of
Operational Research , 21:285–294.
de Koster, M. B. M., van der Poort, E., and Wolters, M. (1998). Order batching in ware-
houses. International Journal of Production Research , 37(7):1479–1504.
de Koster, R. and van der Poort, E. (1998). Routing orderpickers in a warehouse: A compar-
ison between optimal and heuristic solutions. IIE Transactions on Scheduling & Logistics,
30(5):469–480.
Eisenstein, D. D. (2001). Analysis and optimal design of discrete order picking technologiesalong a line. Working paper, Graduate School of Business, University of Chicago.
Frazelle, E. H. (2002). World-Class Warehousing and Material Handling . McGraw Hill, New
York, New York.
Gibson, D. R. and Sharp, G. P. (1992). Order batching procedures. European Journal of
Operational Research , 58(1):57–67.
Gray, A. E., Karmarkar, U. S., and Seidmann, A. (1992). Design and operation of an
order-consolidation warehouse: Models and application. European Journal of Operational
Research , 58:14–36.
Hwang, H. and Lee, M. K. (1988). Order batching algorithms for a man-on-board automated
storage and retrieval system. Engineering Costs and Production Economics, 13:285–294.
Il-Choe, K., Sharp, G. P., and Serfozo, R. F. (1992). Aisle-based order pick systems with
batching, zoning, and sorting. In Proceedings from the Material Handling Research Collo-
quium , pages 245–276, Milwaukee, Wisconsin.
Muth, E. J. (1984). Stochastic processes and their network representations associated with
a production line queuing model. European Journal of Operational Research , 15:63–83.
23
8/3/2019 Order Picking
http://slidepdf.com/reader/full/order-picking 24/24
Pan, C. H. and Liu, S. Y. (1995). A comparative study of order batching algorithms. Omega ,
23(6):48–56.
Rouwenhorst, B., Reuter, B., Stockrahm, V., van Houtum, G., Mantel, R., and Zijm, W.
(2000). Warehouse design and control: Framework and literature review. European Journal
of Operational Research , 122:515–533.
Simpson, N. C. and Erenguc, S. S. (2001). Modeling the order picking function in supply
chain systems: Formulation, experimentation, and insights. IIE Transactions on Schedul-
ing & Logistics, 33(2):119–130.
Skufca, J. D. (2005). k-workers in a circular warehouse — a random walk on a circle, without
passing. SIAM Review . Forthcoming.
Tompkins, J. A., White, J. A., Bozer, Y. A., and Tanchoco, J. M. A. (2003). Facilities
Planning . Wiley, New York, New York, 3rd edition.
van den Berg, J. P. and Gademann, A. J. R. M. N. (1999). A literature survey on planning and
control of warehousing systems. IIE Transactions on Scheduling & Logistics, 31(8):751–
762.
Weber, R. C. and Weiss, G. (1994). The cafeteria process—tandem queues with 0-1 depen-
dent service times and the bowl shape phenomenon. Operations Research , 42(5):895–912.
24