analyzing EGYPT
13
Analyzing the Egyptian stock market with the top down approach philosophy Analyzing : The Egyptian Economy EGX100 EGX 30 Sectoral analysis Stock picks Prepared by : Ahmed Khaled, CMT Head of Technical analysis section Senior account manager May Torky , MBA Senior account manager In Arabeya online brokerage (member of audi sal)
-
Upload
ahmed-khaled-cmt -
Category
Documents
-
view
64 -
download
2
Transcript of analyzing EGYPT

Analyzing the Egyptian stock market with the top
down approach philosophy
Analyzing :
The Egyptian Economy
EGX100
EGX 30
Sectoral analysis
Stock picks
Prepared by :
Ahmed Khaled, CMT
Head of Technical analysis section
Senior account manager
May Torky , MBA
Senior account manager
In Arabeya online brokerage (member of audi sal)
Egyptian GDP
The Egyptian economy
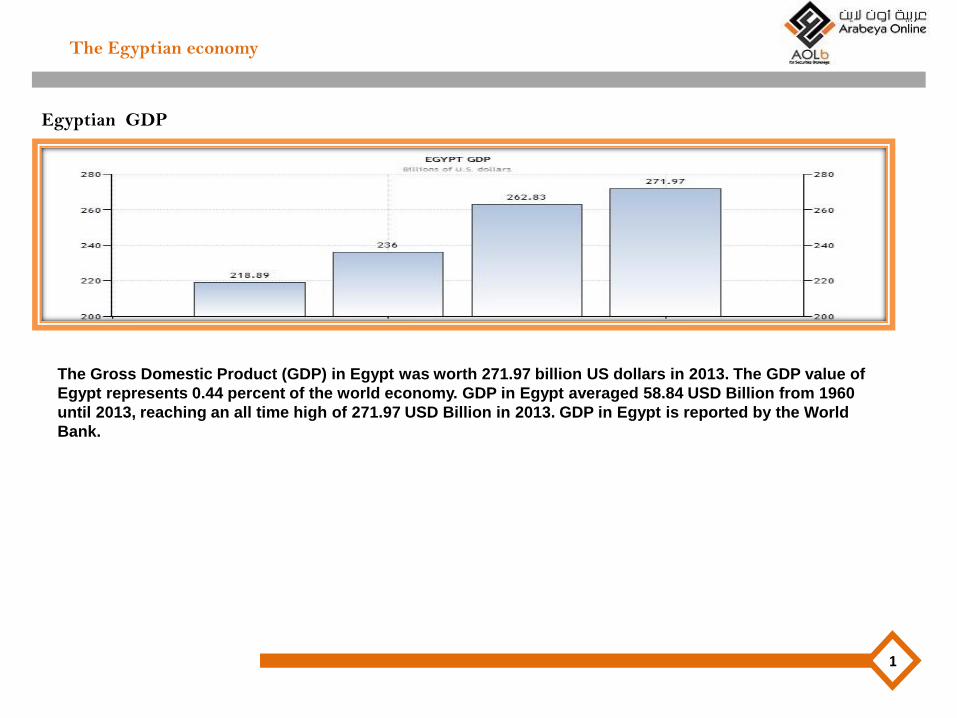
The Gross Domestic Product (GDP) in Egypt was worth 271.97 billion US dollars in 2013. The GDP value of
Egypt represents 0.44 percent of the world economy. GDP in Egypt averaged 58.84 USD Billion from 1960
until 2013, reaching an all time high of 271.97 USD Billion in 2013. GDP in Egypt is reported by the World
Bank.
1

Egypt GDP Annual Growth Rate
The Egyptian economy
The Gross Domestic Product (GDP) in Egypt expanded 4.30 percent in the fourth quarter of 2014 over the
same quarter of the previous year. GDP Annual Growth Rate in Egypt averaged 3.81 percent from 1992 until
2014, reaching an all time high of 7.30 percent in the first quarter of 2008.GDP Annual Growth Rate in Egypt
is reported by the Central Bank of Egypt
2

Egypt Inflation Rate
The Egyptian economy
The inflation rate in Egypt was recorded at 10.60 percent in February of 2015. Inflation Rate in Egypt
averaged 8.94 percent from 1958 until 2015, reaching an all time high of 35.10 percent in June of 1986 and a
record low of -4.20 percent in August of 1962. Inflation Rate in Egypt is reported by the Central Bank of
Egypt
3

Egypt | Credit Rating
The Egyptian economy
Standard & Poor's credit rating for Egypt stands at B-. Moody's rating for Egypt sovereign debt is B2. Fitch's
credit rating for Egypt is B+ and stable outlook for the country. In general, a credit rating is used to show
credit worthiness of Egypt thus having a big impact on the country's borrowing costs.
International Credit Ratings Fitch announced on December 2014 the upgrading Egypt’s credit rating by one
notch concerning the long – term borrowing for both foreign and local currencies to B and so while keeping
the Egyptian economy’s outlook “stable”. Fitch attributed this decision to the government implemented
financial and structural reforms that would achieve economic stability and financial sustainability, as well as
large growth prospects of the Egyptian economy on short and medium term, due to recovery of security and
political stability.
4

Why Egx100 ?
Egx100
Egx30 and Egx70 always gets the attention of all market players in the Egyptian market . Where most of the researchers ,traders, individuals and institutions tackle those two indices while they ignore the most valuable index we have here which is Egx100 . And I will elaborate through the coming points why is it valuable . Egx100 is a price weighted index established in January 2006. Where it sum up the components of Egx30 and Egx70. •Egx30: includes the most active and highest 30 market cap. weighted stocks . •Egx70: includes the most tradable active 70 stocks in the market . Other than egx30 stocks stated above. •Egx100 sum up all the sectors of the economy without favoring one on the other .
•The index is revised every 6 months to make sure the components of the index are following the criteria it was established upon in 2006.
5
Long term vision for the index using the classical tools .
Egx100
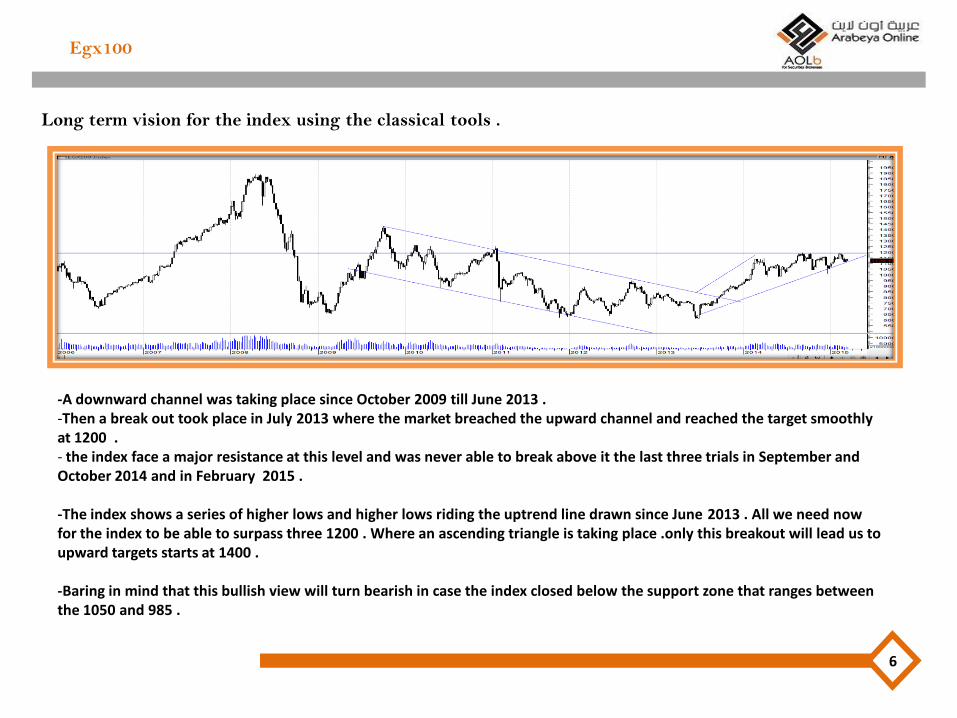
-A downward channel was taking place since October 2009 till June 2013 . -Then a break out took place in July 2013 where the market breached the upward channel and reached the target smoothly at 1200 . - the index face a major resistance at this level and was never able to break above it the last three trials in September and October 2014 and in February 2015 . -The index shows a series of higher lows and higher lows riding the uptrend line drawn since June 2013 . All we need now for the index to be able to surpass three 1200 . Where an ascending triangle is taking place .only this breakout will lead us to upward targets starts at 1400 . -Baring in mind that this bullish view will turn bearish in case the index closed below the support zone that ranges between the 1050 and 985 .
6
Medium term vision for the index applying various indicators.
Egx100
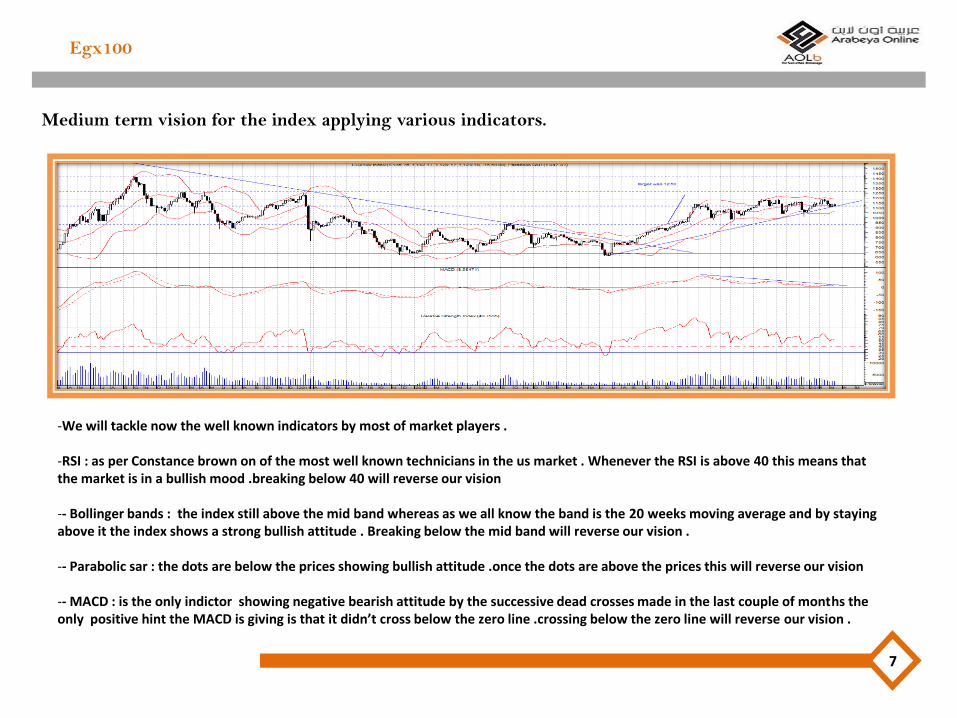
-We will tackle now the well known indicators by most of market players .
-RSI : as per Constance brown on of the most well known technicians in the us market . Whenever the RSI is above 40 this means that the market is in a bullish mood .breaking below 40 will reverse our vision
-- Bollinger bands : the index still above the mid band whereas as we all know the band is the 20 weeks moving average and by staying above it the index shows a strong bullish attitude . Breaking below the mid band will reverse our vision .
-- Parabolic sar : the dots are below the prices showing bullish attitude .once the dots are above the prices this will reverse our vision
-- MACD : is the only indictor showing negative bearish attitude by the successive dead crosses made in the last couple of months the only positive hint the MACD is giving is that it didn’t cross below the zero line .crossing below the zero line will reverse our vision .
7

Change in fading breakout /false breakouts phsycology
EGX30
-As we can see from the above chart the EGX 30 adjusted itself where the fake breakouts whereas the fading breakout used to take only one candle above the resistance level as we saw in the fore mentioned levels on the chart .
Where the bull trap used to take one day out and back in again in the following incidents : -The break above 9800 that acted as a major resistance level in September 2014 -The break above 9600 that acted as a major resistance level in December 2014 Then the behavior of investors changed in crisis like the oil and libya crisis and even their rebounds where the fading breakout used to take more than one candle the thing that confused investors and technicians applying The time filter rule (where any resistance /support is confirmed to be broken if it was surpassed for more than one candle -where we need to come to the conclusion that the market is changing and we need to adapt to those changes in order to sustain our performance .
8

Applying some classical tools
EGX30
The weekly chart of EGX 30 shows a lot -The financial crisis in 2008 the market slinked towards 3500 and rebounded and made a major resistance level in 2009 at 7600 -The market made another dive in 2011 after the revolution and tested the major support at 3500 then the upward rebound lead the market once more to reach the major resistance level at 7500 where a break above it was confirmed by a pullback to retest the for mentioned level as a major support . Applying the reversal rule .
-A double bottom was established and activated by the 7500 breakout where its minimum target is 11500 .
-What hindered us from reaching this target is some of the external factors (taxes law, oil crisis, Libya incident) that reacted in harmony with the new discovered Fibonacci level 78.2 % that was discovered lately in the money markets and was proven to be a very powerful fibbo retracement level .
9

EGX30
-An upward channel is taking place with current turbulences taking place the last rebound didn’t enable the index to reach the upper bound which is weakness sign but what reduced the negative effect is the index rebounded directly once it touched the lower band of the upward channel in the last downward move in Feb. 2015 .
-Till now higher lows are taking place and all we need now is breach the 10000 in order to formulate noticeable higher highs .to get out of this indifference era . We are trading in now
-Still MACD is above zero line and RSI above 50 and the index is sustained above the mid band .same as EGX 100 .
10
Sectoral analysis
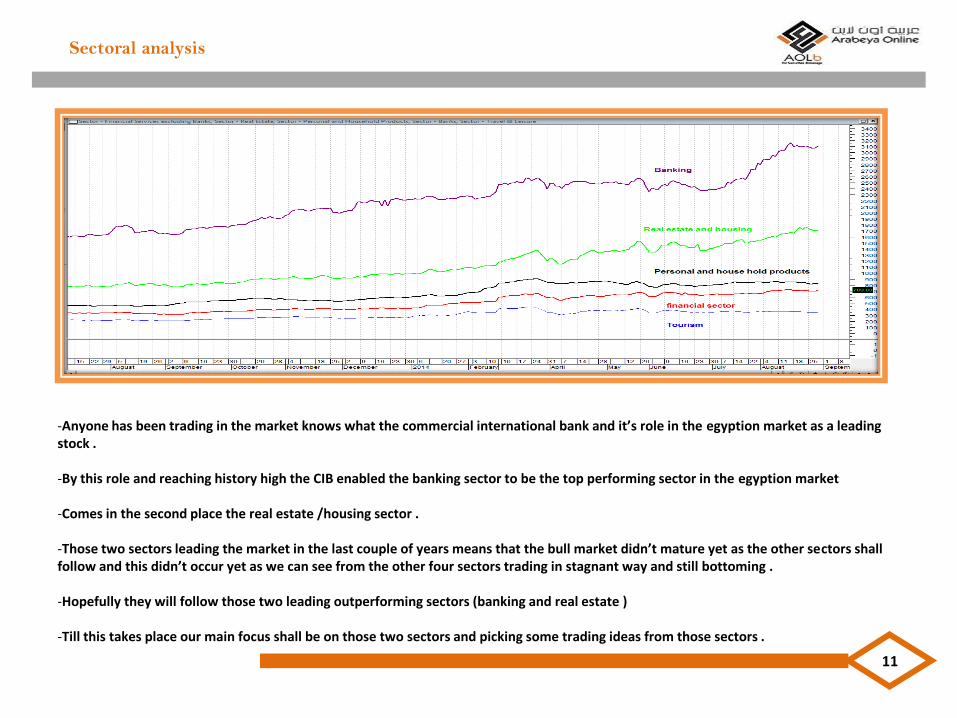
-Anyone has been trading in the market knows what the commercial international bank and it’s role in the egyption market as a leading stock .
-By this role and reaching history high the CIB enabled the banking sector to be the top performing sector in the egyption market
-Comes in the second place the real estate /housing sector .
-Those two sectors leading the market in the last couple of years means that the bull market didn’t mature yet as the other sectors shall follow and this didn’t occur yet as we can see from the other four sectors trading in stagnant way and still bottoming .
-Hopefully they will follow those two leading outperforming sectors (banking and real estate )
-Till this takes place our main focus shall be on those two sectors and picking some trading ideas from those sectors .
11
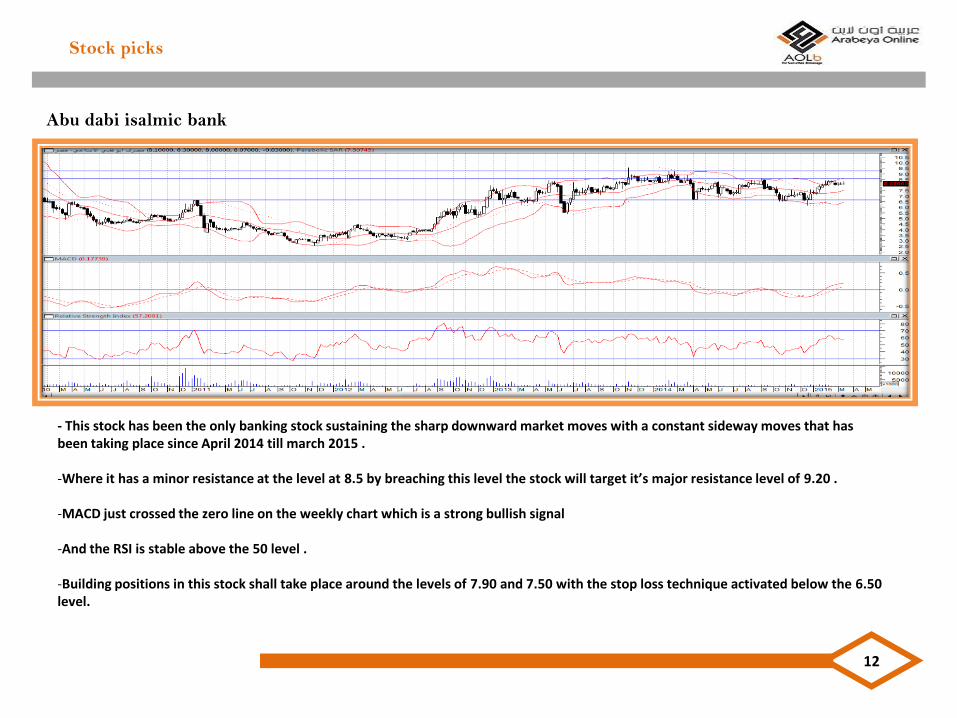
Abu dabi isalmic bank
Stock picks
- This stock has been the only banking stock sustaining the sharp downward market moves with a constant sideway moves that has been taking place since April 2014 till march 2015 . -Where it has a minor resistance at the level at 8.5 by breaching this level the stock will target it’s major resistance level of 9.20 .
-MACD just crossed the zero line on the weekly chart which is a strong bullish signal
-And the RSI is stable above the 50 level .
-Building positions in this stock shall take place around the levels of 7.90 and 7.50 with the stop loss technique activated below the 6.50 level.
12