Income consumption curve,price consumption curve, engles law
Analyze of Energy consumption
Akzo Nobel Functional Chemicals AB
Mattias Svensson
Master of Science Thesis in Energy Engineering. Umeå Institute of Technology(löpnr. som tilldelas)
2
Abstract
The main purpose of this project was to make a survey of the steam and electricity
consumption at Akzo Nobel Functional Chemistry AB and give suggestions of how to
minimize them. These three different areas were focused on. First to make a survey of all the
most important consumers, second to find the electricity consumption of the air compressors
and the amount of waste heat produced from them. The third area was to calculate a model of
how much fresh water that is used during a cooling sequence in the water based
heating/cooling system of the reactors and give a suggestion of a suitable reuse for this water.
The main result is a total survey of the energy consumption in steam and electricity. The
survey shows that the second largest group after drying is heating of ventilation which gives
big potentials of reducing the total steam consumption if there is a way of being self
supporting in ventilation heat. Because of the large amount of waste heat from the process
equipment to the surrounding it could be possible to make the ventilation unit self supporting
in heat by using an air to air heat exchanger.
The second area that was decided to focus on was the two air compressors that is consuming a
lot of electricity and produce a lot of hot water that could be reused in other applications. The
waste heat from the air compressors may be used to preheat the water based heating system of
the ventilation units.
The third area that’s been looked closer into is the inefficient heating/cooling circuit of the
reactors that also produces a lot of hot waste water. The simplest solution to this problem is to
accumulate the amount water that’s holds a certain minimum temperature and recycle it in the
next heating sequence. The calculated model gives the amount produced hot water which
depends on the chosen temperature interval.
3
1 Introduction .......................................................................................... 4
1.1 Background ....................................................................................................... 4
1.2 Purpose ............................................................................................................. 5
1.3 Scope of the Project .......................................................................................... 5
1.4 Method ............................................................................................................... 5
2 Akzo Nobel Functional Chemicals AB – Energy situation ..................... 7
2.1 Process description ........................................................................................... 7
2.2 Service media .................................................................................................... 7
2.3 Example of the energy situation ........................................................................ 7
3 Theory and method .............................................................................. 9
3.1 Electricity consumption of fans .......................................................................... 9
3.2 Electricity consumption of pumps .................................................................... 11
3.3 Heat flows ........................................................................................................ 13
3.3.1 Air compressors ......................................................................................... 13
3.3.2 Heating/cooling system of the reaction chambers ..................................... 16
4 Results and discussions ..................................................................... 19
4.1 Steam .............................................................................................................. 19
4.2 Electricity ......................................................................................................... 21
4.3 Air compressors ............................................................................................... 24
4.4 Heating/cooling system .................................................................................... 25
4.5 General comments .......................................................................................... 26
5 Conclusions ....................................................................................... 27
6 Reference List .................................................................................... 28
Attachment ............................................................................................ 29

4
1 Introduction Akzo Nobel Functional Chemistry AB is aware of the fact that the plant is quite energy
consuming because most of the equipment have been installed during a time when energy
were in expensive and for that reason not an issue. Now situation is different, the energy price
is relatively high and even expects to increase, so Akzo Nobel are interested in becoming
more aware of their plants energy condition. To know what they are going to decrease their
energy consumption they started an energy project in 2008 to get an answer to this main
question.
1.1 Background
Throughout the years the focus has always been directed to process optimizing, availability
and product quality. The thought of the indirect energy cost haven’t been taken into account
since the energy price been relatively low and now the factory is built in a way that waste
energy. Today the energy price is higher and is expected to rise even more in the nearest
future so the interest in getting the factory more energy efficient is rising every day.
In 2008 an energy project started to lower the energy consumption. One part of that project
was to make a map of all energy consumers and sort out the ones that got the biggest savings
potentials. After a lot of calculations, three different areas were pointed out to be looked
closer into. The main goal became to get self-supporting in heating of the ventilation system
by integrating it with other heat sources as cooling water from air compressors. Another
obvious heat source concerning ventilation is an air to air heat exchanger. The last area that
was decided to look closer into was the water based heating/cooling system around the
reactors.
The purpose of this heating/cooling system is to control the reaction rate inside the reactor. By
heating the reactor up the reaction rate increases; it is done by pumping hot water through of
the shell of the reactor. To decrease the reaction rate the system is used the other way around,
by cooling it down with cold water. It is a way of adjusting the reaction rate and controlling
which one of the substances that is going to react, see figure 1.
Figure 1: The direction of the water flow through the jacket of the reactors. The purpose of
the water is to control the temperature inside the reactor.
Hot water
Cold water Waste water
Reactor
5
Today this hot water with high energy content is used in a very inefficient way because of the
absence of hot water recycling. For example when it is time for cooling the hot water is just
flushed into the sewer and exchanged with cold water and when it is time for next heating
sequence all that cold water needs to be heated up with expensive steam. This procedure is
done up to 90 times a day, including all five reactors.
1.2 Purpose
The purpose of this graduation project was to investigate the possibilities of lowering the
energy consumption of the plant, locate the ones with biggest savings potentials and to
present a solution that will decrease the energy cost. The purpose of the investigation was also
to create a survey consisting of information around the high energy consumer, like big pumps,
fans and driers. Information that will make the employees aware of how much money that is
spent on energy at different consumers, money that could be saved just by changing attitude
by the operators.
To locate the biggest saving points and to find practical applications for them is a way of
showing all the employees that much can be done about energy saving. Hopefully that will be
a base of a further work around this issue. Another reason is of course to save money which is
the main purpose of this project.
A summary of the three areas that have been focused on is pointed out in the list below.
1. Make a survey of all the most important energy consumers.
2. Find the electricity consumption of the air compressors and the amount of energy as hot
water that is produced from them.
3. Calculate a model of how much water that is used during a cooling sequence in the
water based heating/cooling system of the reactors and give suggestion of a suitable use
for this water.
1.3 Scope of the Project
The project did not include complete solutions on how to minimize the energy consumption.
There are often many different possible solutions to one problem which makes it very time-
consuming to give an answer or recommendation on which that would be the most suitable
one. So the project was delimited to just give suggestions based on the results from the three
focused areas.
Another limitation of the project was that it would not include any economical aspects
concerning reconstructions or new installations only answering questions from energy point
of view. That means that the suggestions given in the report will not have taken financial part
into account only the fact that the suggestions would be suited to reach a more energy
efficient plant.
1.4 Method
The first approach that was used was the rough estimation of the plants equipment to find the
biggest energy consumers which of course are the ones that should be most focus on. That
was even an important part to weed out the ones that were too small to spend time on so that
was in other words a method to set the project boundaries.

6
The method used to find the energy consumption for the equipment have partly been by
finding operating information in the control system, such as temperatures, pressure, operating
speed and media flow etc. By calculating a yearly average for each of the equipment the
results could be determined and compared.
To determine the consumptions many different methods have been used. For pumps and fans,
pump curves and fans curves have mainly been the course of action in one or another way. In
other situations where there have not been any measured data to start with, a more theoretical
approach has been used. For instance when estimating the steam consumption for the
heating/cooling circuit.
7
2 Akzo Nobel Functional Chemicals AB – Energy situation The factory Akzo Nobel in Örnsköldsvik is a manufacturer of a powder that gives paint and
joint compounds their viscous character. The product is mostly made of cellulose and by
mixing it with a couple of chemical substances into a reactor it turns out to this extraordinary
product. The flow sheet for this process involves a lot of milling, drying and pumping of hot
fluids, all very high energy areas. Even the external equipment, as compressed air and
ventilation are high energy consumers which makes this plant very interesting in the subject
energy efficiency.
2.1 Process description
The process starts with grinding of cellulose which is the raw material for the product.
Together with chemicals it adds to a reactor where the main reaction takes place. The reaction
rate is controlled by the water based heating/cooling system which uses steam as the heat
source and the pressure is controlled by steam fed ejectors. The rotation of the reactor axle is
made by an electric drive.
After the reactor the cellulose like product gets washed by hot water from the Hot water tank
that is preheated with direct steam. The product slurry becomes dewater by Decanters that
separates water from the product and the rotation is made by electric drive. The cellulose
product still have a high water content and the final drying is done by steam fed dryers that
that is held rotating by electric drives.
The separated water is collected in the Pulp water/Backwater tank where its temperature is
held constant by direct steam.
The dried product is grinded to achieve the powder like quality, these also have electric
drives. All dried material as raw cellulose and dried product are transported inside the plant
with transportation fans.
The nonreacted chemicals from the reactor is taken to the recovery system where the
chemicals is purified by the Stripper and the Ether column, they both uses the steam as
stripping media and the consumption are not controlled by any measured parameter it just has
a fixed flow.
2.2 Service media
The plant uses service media to assist the main process like Compressed air to valves and
instruments, Cooling machines to feed the chemical recovery system and Ventilation to
maintain a acceptable climate inside the buildings, to cool electronic equipment and to make
sure that an accident of chemical leakage are sufficiently ventilated.
2.3 Example of the energy situation
An example of waste heat is all the fresh water that is needed for cooling of equipment; it
becomes heated up and without seizing the heat the water just gets pumped back into the
river. This warm water could be used as heat source in the ventilation system or as preheated

8
water for other purposes. How this heat will be recycled is not that obvious but the potential is
still there.
Another example of an unused heat source is the hot air from the big driers that is just
blowing right up in the atmosphere without any heat recirculation. These are a few examples
of the inefficiency at the factory that could be used in other heating applications and result in
important savings.

9
3 Theory and method In the beginning of this degree project the focus was to determine valuable information about
pumps, fans, compressors and the energy content in their fluid flows. This type of work is the
mapping of the plant that has been mentioned earlier. It will form a base that makes it possible
for future decisions of what areas to analyze deeper. A more detailed view of the energy
consumptions is determined in the different situations and different machines are going to be
described in this following part of the report.
This section will include both theory and method because it will give a better understanding
of the course of action and it will be easier latch on to calculations when it is possible to
follow a common thread of the method at the same time. Another reason is that the project has
not included any specific test or experiments that are built on a certain method so there is no
reason to give the section Method its on title. Theory is here the main part and to include
method under the same topic will give it a god support for a better understanding.
3.1 Electricity consumption of fans
Akzo Nobel is a factory that makes a powder out of cellulose and the transportation of this
material around the plant is done through pipes with big transportation fans. The powers of
these are often very high, although it does not exists any measurements of the electricity
consumption. The same issue about the measurements was discovered about the ventilation
units. The information that in most cases could be found in the documentations was the
projected volume flow and the differential pressure. To be able to estimate the consumption it
was necessary to determined it from these parameters, the flow and the pressure. In other
words it is to calculate the work done by the fan with consideration to its efficiency. This
method of finding information is the approach that has been used for most of the fans. A
practical example is given below.

10
Figure 2. A page from the process flow sheet. The red circle surrounds the plants biggest ventilation
unit and arrow A points to its fan. Arrow B points to a pressure transmitter in ventilation channel.
The figure 2 above is a copy of a page from the plant process schedule. The red circle shows
the biggest ventilation unit and the units fan is pointed out with arrow A. That’s the example
to be calculated on. Arrow B points to the pressure transmitter that’s continuously measures
the pressure after the fan. A plot from that transmitter is showed in figure 2.
The power of the fan can be calculated with the following relation,
mf
pQP
1000
. (1)
P is the denoted for needed power input to the electric motor that drives the fan and Q is the
volume flow of air through the fan. p is the total differential pressure over the fan and is
the efficiency where f stands for fan and m for motor. Both efficiencies are needed to be taken
into count.
The average total differential pressure p is determined from the atmospheric pressure before
the fan, pressure losses over the filter and the pressure after the fan. The estimation about the
filter losses can be decided from the manufacturer specifications as well as the efficiency of
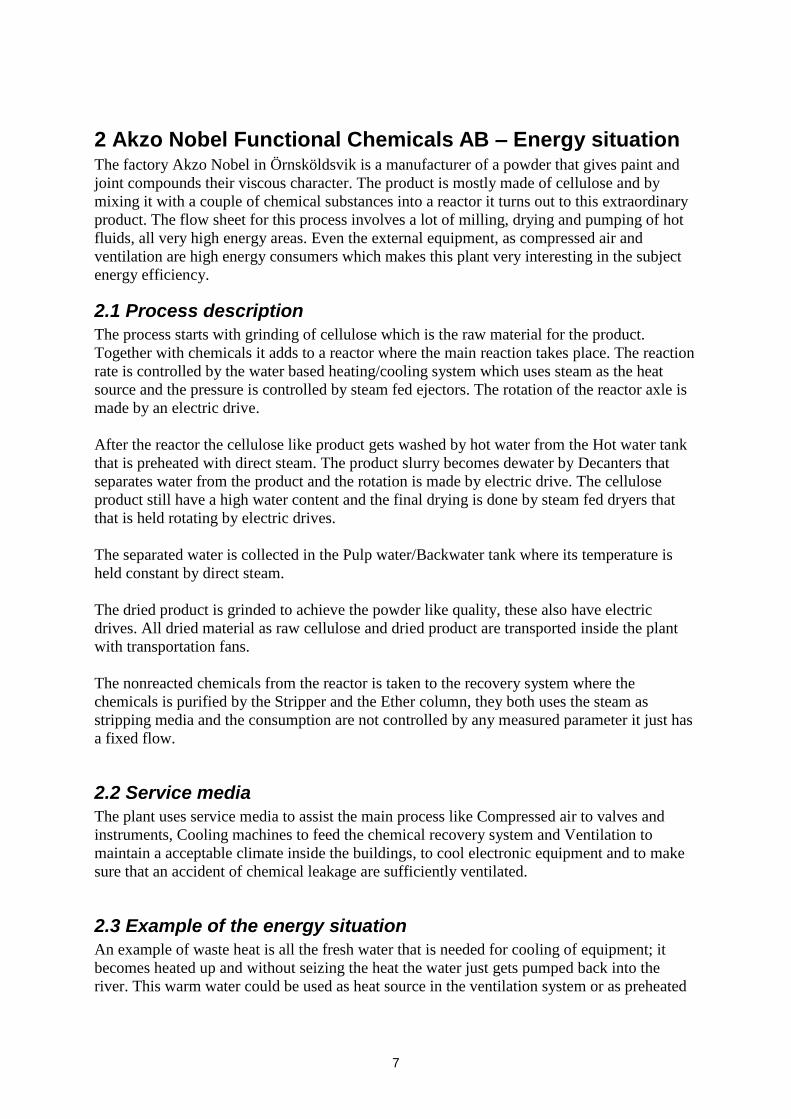
the fan. As mentioned earlier the pressure after the fan is continuously measured, fig 3 and
before the fan it’s assumed to be normal atmospheric pressure. With all this information
known the total differential pressure can be determined.
To fulfill all parameters in the equation 1 only the unknown efficiency m of the electric
motor remains. Information around electric motors usually is quite easy to find because of it is
A
B
11
well known and is an established machine that is been used for decades. In this motor
specification the efficiency is found and the equation 1 is completed.
Figure 3. Measured air pressure after the ventilation unit during 2007. On the Y-axis the pressure is
measured in Pa.
By using the average of the parameters in a whole year, 2007, this equation 1 gives a mean
value of the power that multiplied with the operating time gives the yearly amount of energy,
se following equation 2.
tPE (2)
The energy amount E has the unit, kWh, since the average power, P, has the unit kW and the
operating time, t, is the number of hours that the unit have been worked under the reference
year, 2007.
3.2 Electricity consumption of pumps
There are a lot of pumps at the plant and to get an idea of the consumption a method is needed
for this. The easiest way is to find a curve for every pump and then search for the mass flow
and pressure which will lead to the needed power. It’s not always that easy since the pumps
serve different purposes, like circulating a fluid or maintain a certain pressure and that affects
the way of handling problem. For example the circulation pump have an relatively easy
operating mode because it works under the same conditions all the time, same mass flow,
same rotation speed and nearly the same pressure. The opposite of this circulation pump is
speed-controlled pump that changes its rotation speed to attain a certain pressure that depends
on the water/fluid requirement. This result in different flows and different power needed
which makes the estimation of the electric consumption much harder.
The purpose of a circulation pumps is to maintain a certain flow, this flow together with the
pump curve is often well specified in the documents from the installation project. With this
information the electricity consumption becomes quite easy to find. An example of a pump
curve is given in figure 4.
12
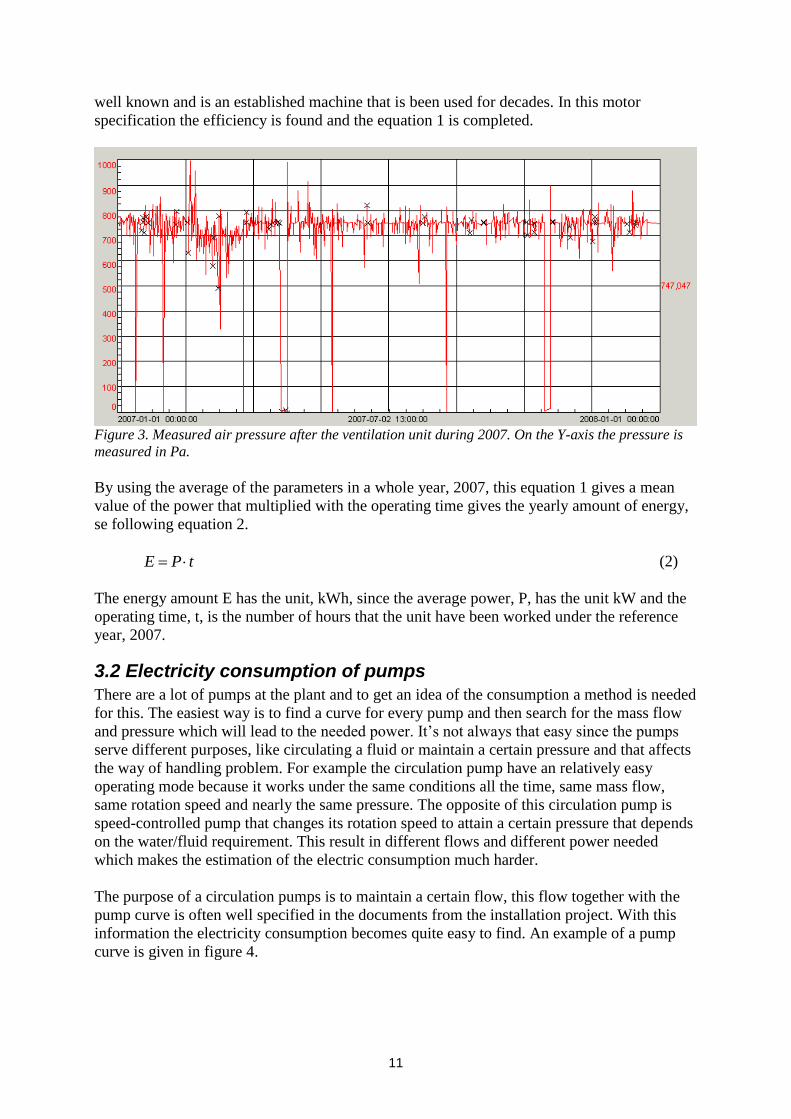
Figure 4. The picture illustrates a pump curve that shows the characteristic of certain circulation
pump. The x-axes show the water volume flow and the upper y-axis shows the discharge of the head.
In the middle of the y-axis the needed shaft power can be red and at the bottom of that axis the
maximum suction head for a curtain flow is denoted. This curve is done for five different impellers,
marked with this symbol Ф.
As mentioned before the flow is relatively well known for a circulation pump and in figure 4
the method of finding the needed power is shown. By following the red line from the flow
down to the right impeller, in this case the biggest, the needed shaft power can be red on the
y-axis. Excluding the losses from the motor inefficiency this example shows an operating
power of 13.5 kW.
When instead looking into rotation speed-controlled pump there has to be more focus on
average values. Because the power varies in time it’s important to find measurements that can
be representative over a long time period, preferably a year. These types of pumps regulate its
work done by changing the rotation speed which is directly related to the electric net
frequency. The relation is presented in equation 3.
p
fn
120 (3)

13
The rotation speed is denoted with n, the frequency with f and p is the number of poles in the
electric motor. If the attached motor is one with induction instead of a synchronous motor the
equation 3 have to be multiplied with factor of 0,95 because of the slip from the rotor.
On most of the pumps the frequency is measured continuously and that makes it possible to
calculate an average value of the rotation speed. But then another problem occurs, there is no
pump curve made with that specific rotation speed. The pumps usually have a curve with one
reference speed like 1450 rpm in fig.3. But there is one way to go around this problem and
that’s by using the affinity laws, equations (4-6). A new curve can now be plotted for the new
rotation speed and with a known water flow all information is available as efficiency, suction
head and power.
2
1
2
1
n
n
Q
Q (4)
2
2
1
2
1
n
n
H
H (5)
3
2
1
2
1
n
n
P
P (6)
The volume flow is denoted with Q, the rotation speed with n, the head with H and the power
with P. The indexing 1 is the reference value that’s given in the pump curve and indexing 2 is
the value related to the new rotations speed.
3.3 Heat flows
A third big area that’s important to look into are all the fluid heat flows like warm waste water
and warm air flows that just blows out into the atmosphere. When considering these heat
flows, two main questions were in focus. How much energy do they contain and what quality
do they have. The starting points became the forced cooling water through the air compressor,
the waste water from the water based heating/cooling system of the reactors and last the
exhaust air from the dryers. These three energy flows are not recycled in any way so if there is
a way to regain the energy in them it might be a large amount of money to save.
3.3.1 Air compressors
The first heat flow to determine is the cooling water from the two air compressors. These
compressors are speed controlled and the needed power input and the needed cooling effect is
proportional to the motor speed which makes it necessary to find its average. This is done by
reading off the operating mode on the displayed menu at the compressors. Among many other
information the operating time for different motor speeds can be found and out of that an
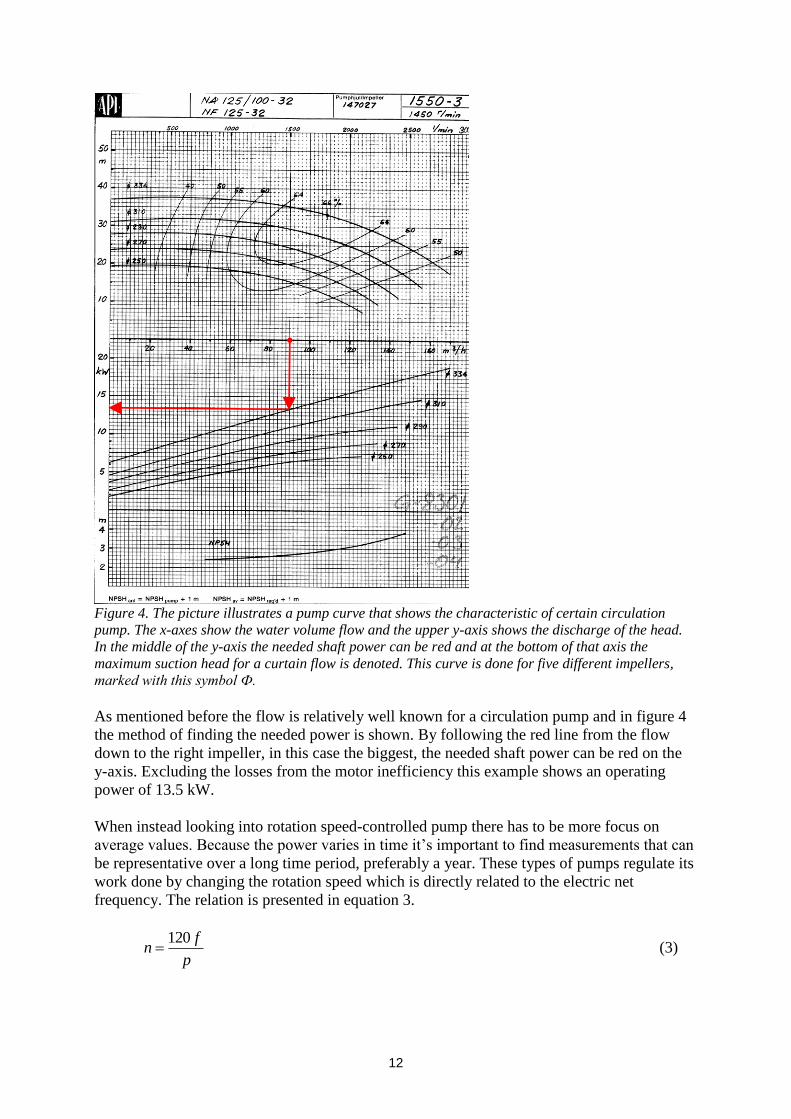
weighted average can be calculated. The operating times that are displayed on the
compressors is presented in figure 5. The values on the Y-axis are the percent of total
operating time and the values on X-axis are the percent of max motor speed. The motor speed
on the X-axis are divided into five groups 0-20%, 20-40%, 40-60%, 60-80% and 80-100% so
for instance if the motor speed for a compressor mostly have been running near 50% the
column 40-60% will be the highest. These values are measured for the reference year and they
will be used to calculate the average motor speed for each compressor.
14
Figure 5. These tables show the operating time for different motor speeds on compressor 2 and 3. The
weighted average motor speeds have been calculated from these tables.
As can be seen in Figure 5 the typical value for both compressors 2 and 3 is between 40 and
60 % of the maximum motor speed which means that this is the most common operating load.
The figure even shows that both compressors have been running around this load for 40-60%
of the time during this reference year but even thou it does not say anything about their exact
average motor speed during this year so the next step is to calculate that out of the presented
information in Figure 5.
The calculation of the average motor speed by using the information from Figure 5 is shown
in equation 7. The average speed is denoted with nave, and the operating time with t%-%. Each
column has been given an average percentage value of 10, 30, 50, 70 or 90% which in
decimal form became 0,1 up to 0,9. These are the factors multiplied with operating time in the
equation 7.
10080806060404020200 9,07,05,03,01,0 tttttnave (7)
Even if the average speed is found it does not say anything about the amount of waste heat
that is transferred to the cooling water which is aim of this determination. The next step is to
find the needed electrical power input to the compressor at this calculated average motor
speed. As mentioned earlier in this interval the needed cooing effect is proportional to power
input and the motor speed. In the compressor specification the cooling effect at the reference
speed is specified. That makes it possible to calculate the effect at the average motor speed. It
does not help very much just knowing that is it proportional, it is necessary to know in what
way it is proportional as well. That is solved by comparing the needed electric power input
with the motor speed which even says how that the cooling effect relates to the motor speed,
see figure 6.
Compressor 3
0
20
40
60
80
100
0-20 20-40 40-60 60-80 80-100
Percent of max motor speed
Pe
rce
nt
of
op
era
tin
g t
ime
Op
0
20
40
60
80
100
0-20 20-40 40-60 60-80 80-100Pe
rce
nt o
f o
pe
rati
ng
ti
me
Percent of max motor speed
Compressor 2
15
Compressor characteristic
0
50
100
150
200
250
300
1000 1500 2000 2430 2700
Motor speed / rpm
Po
wer
inp
ut
/ kW
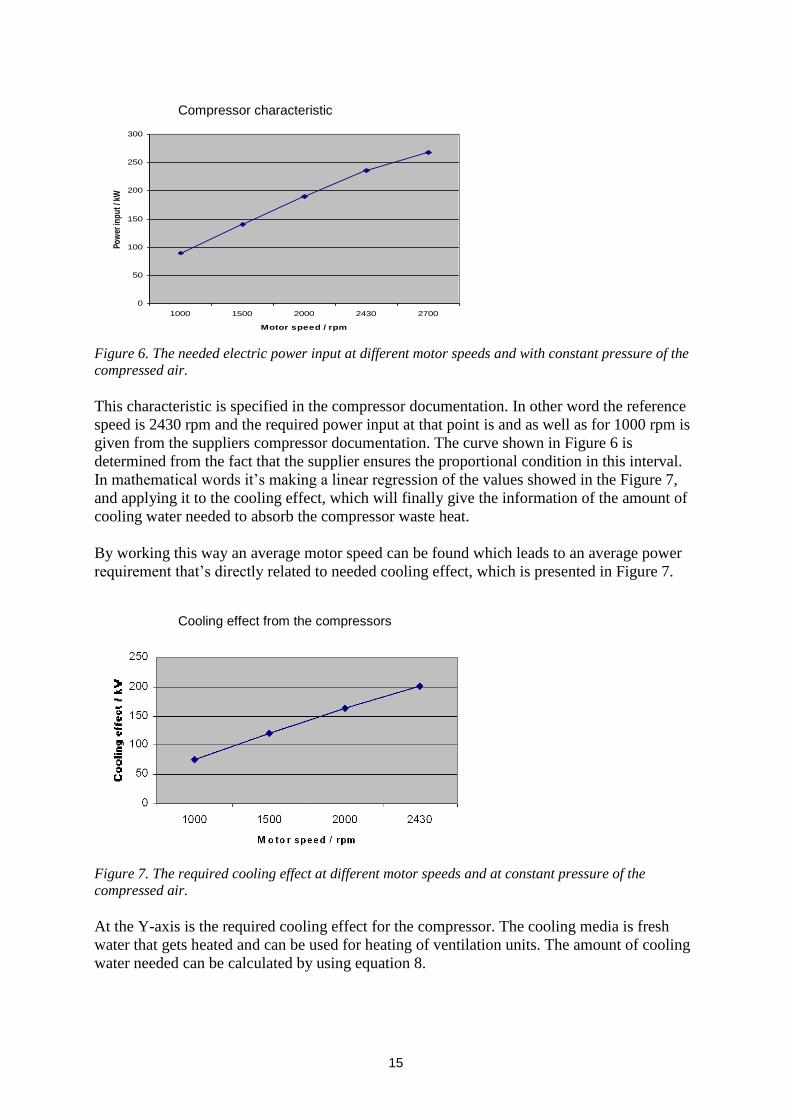
Figure 6. The needed electric power input at different motor speeds and with constant pressure of the
compressed air.
This characteristic is specified in the compressor documentation. In other word the reference
speed is 2430 rpm and the required power input at that point is and as well as for 1000 rpm is
given from the suppliers compressor documentation. The curve shown in Figure 6 is
determined from the fact that the supplier ensures the proportional condition in this interval.
In mathematical words it’s making a linear regression of the values showed in the Figure 7,
and applying it to the cooling effect, which will finally give the information of the amount of
cooling water needed to absorb the compressor waste heat.
By working this way an average motor speed can be found which leads to an average power
requirement that’s directly related to needed cooling effect, which is presented in Figure 7.
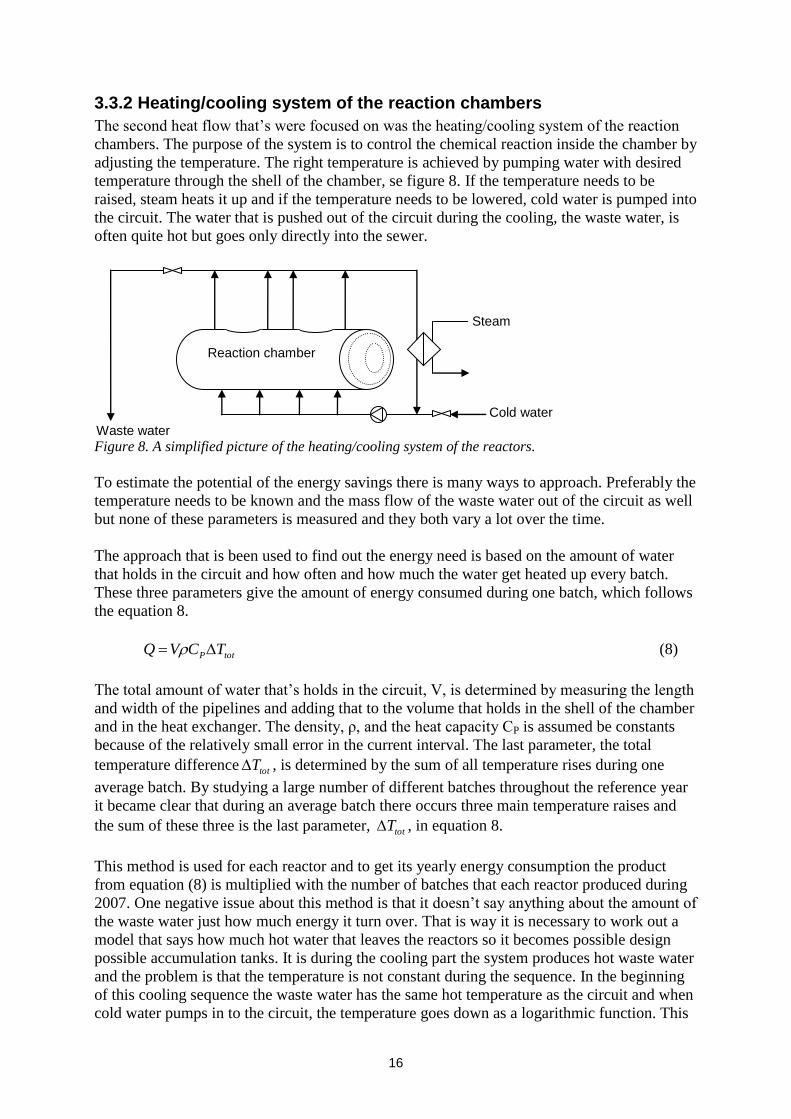
Figure 7. The required cooling effect at different motor speeds and at constant pressure of the
compressed air.
At the Y-axis is the required cooling effect for the compressor. The cooling media is fresh
water that gets heated and can be used for heating of ventilation units. The amount of cooling
water needed can be calculated by using equation 8.
Cooling effect from the compressors
Compressor characteristic
16
3.3.2 Heating/cooling system of the reaction chambers
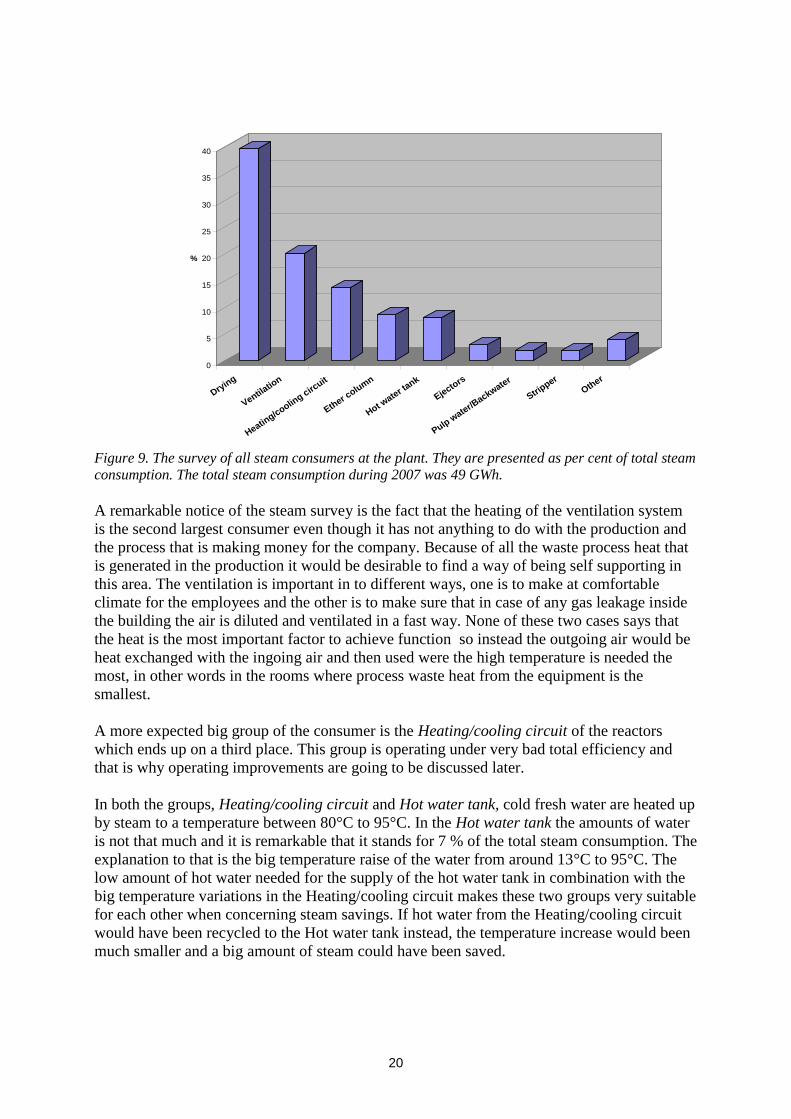
The second heat flow that’s were focused on was the heating/cooling system of the reaction
chambers. The purpose of the system is to control the chemical reaction inside the chamber by
adjusting the temperature. The right temperature is achieved by pumping water with desired
temperature through the shell of the chamber, se figure 8. If the temperature needs to be
raised, steam heats it up and if the temperature needs to be lowered, cold water is pumped into
the circuit. The water that is pushed out of the circuit during the cooling, the waste water, is
often quite hot but goes only directly into the sewer.
Figure 8. A simplified picture of the heating/cooling system of the reactors.
To estimate the potential of the energy savings there is many ways to approach. Preferably the
temperature needs to be known and the mass flow of the waste water out of the circuit as well
but none of these parameters is measured and they both vary a lot over the time.
The approach that is been used to find out the energy need is based on the amount of water
that holds in the circuit and how often and how much the water get heated up every batch.
These three parameters give the amount of energy consumed during one batch, which follows
the equation 8.
totP TCVQ (8)
The total amount of water that’s holds in the circuit, V, is determined by measuring the length
and width of the pipelines and adding that to the volume that holds in the shell of the chamber
and in the heat exchanger. The density, ρ, and the heat capacity CP is assumed be constants
because of the relatively small error in the current interval. The last parameter, the total
temperature difference totT , is determined by the sum of all temperature rises during one
average batch. By studying a large number of different batches throughout the reference year
it became clear that during an average batch there occurs three main temperature raises and
the sum of these three is the last parameter, totT , in equation 8.
This method is used for each reactor and to get its yearly energy consumption the product
from equation (8) is multiplied with the number of batches that each reactor produced during
2007. One negative issue about this method is that it doesn’t say anything about the amount of
the waste water just how much energy it turn over. That is way it is necessary to work out a
model that says how much hot water that leaves the reactors so it becomes possible design
possible accumulation tanks. It is during the cooling part the system produces hot waste water
and the problem is that the temperature is not constant during the sequence. In the beginning
of this cooling sequence the waste water has the same hot temperature as the circuit and when
cold water pumps in to the circuit, the temperature goes down as a logarithmic function. This
Steam water
Cold water
Waste water
Reaction chamber

17
makes it necessary to create a model of the system and out from that estimate the amount of
cold water that’s needed during the cooling sequence, which is the same amount of hot water
that goes out of the circuit. This model that is going to describe the temperature of the water
will make it much easier to find suitable range of applications for this hot waste water. In
other words, how much water is pushed out of the circuit, what temperature does it have and
in what applications can it be reused.
The theoretical model of the heating/cooling circuit is built on the assumption that the mass
flow of the cold water that is pumped in to the circuit is much lower than the mass flow
circulating inside the circuit. That will make the water well blended and the temperature
inside the circuit will lower in a nice and balanced way, which thermodynamically is a called
quasi-equilibrium process.
After each infinite small element of cold water, dm, that’s pumped in to the circuit the
temperature in the hot circuit, Tcirc will lowers a infinite small degree dT. That will cause a
small energy decrease dQ in the circuit, that’s determined from equation 9, dQ is the
coldcircP TTCdmdQ (9)
The heat capacity CP is approximated to be a constant in this range and Tcold is the temperature
of the cold raw water that’s pumped into the circuit, and it’s also approximated to be a
constant.
This decrease in energy inside the circuit results in a small decrease in temperature, dT, which
is determined from equation 10.The total mass of the water in the circuit is denoted with mcirc
and CP is the heat capacity of water which is assumed to be a constant as in previous equation.
Pcirc Cm
dQdT
(10)
By using equation (9) in this the equation above (10) dm can be solved after integrating over a
cooling sequence, in other words, integrating between the hot temperature and the cold
temperature. Equation below (11) is the result of equ. (9) and equ. (10).
Pcirc
coldcircP
Cm
TTCdmdT
(11)
Rearranging the equation above with focus on dm gives the equation below 12, which for
clarification is the amount of cold water that’s been pushed in to the circuit during a cooling
sequence.
coldcirc
circ
TT
mdTdm
(12)
The final step is to integrate above equation 12 with respect to Tcirc which is the temperature
in the circuit and that lowers as cold water; dm, is pumped in to the circuit.

18
Start
End
T
T coldcirc
circTT
dTmm (13)
coldEnd
coldStart
circTT
TTmm ln (14)
As mentioned earlier the goal is to determine how much hot water that’s leaving the reactors.
The temperature of this water fluctuates three times between 15°C and 120°C during an
ordinary batch. The information that’s interesting but unknown is how much water that’s
hotter than a certain temperature, that’s what this model can describe. For example if there is
a cooling sequence and the temperature in the circuit lowers from 120°C down to 60°C the
formula 14 can be used to determine the amount of cold water needed for this cooling, which
is the same amount of hot water that pushed out of the circuit.

19
4 Results and discussions The total survey of all energy consumers are divided into two different groups, one for steam
and one for electricity. To find information about steam is a little bit easier because of the
steam flow meters that are measuring the consumptions at the main pipes and sometimes
before a specific consumer, like Ether column, Ejectors and Stripper. The other consumers
that are presented in diagram 1 have mostly been calculated from the heat flow method
described under Theory and method.
All results are one year average values from 2007 which is chosen to be the reference year
during this work. All the raw data are taken from the data base of the control system and have
mostly been treated and calculated in excel. The results have been chosen to be presented in
per cent of total consumption, which is an effective way of obtaining the consumer that have
biggest influence on the total saving potential.
According to the financial department at Akzo Nobel the total steam consumption during
2007 was near 49 GWh/year. For the electricity consumption was 38 GWh/year. During this
year the steam price was 0,35 kr/kWh and for electricity 0,45 kr/kWh.
4.1 Steam
Some of the consumers in Figure 9 below have been determined directly by information from
the control system of the plant, those are Drying, Ether column, Ejectors and Stripper. The
other consumers have been calculated by information of how much each part of the process
increases in energy content like the methods describes in previous chapter, Theory and
Method.
Drying in Figure 9 means the drying processes in specially designed product dryers where the
energy feed is medium and low pressure steam. The steam are in all drying cases basically
heat exchanged in one or another way. The steam consumption is determined by handle data
from the control system.
Ventilation is steam used for heating of all buildings at the plant, for instance everything from
ventilation units in the central heating to the small local steam condensers that are hanging at
the walls. Heating/cooling circuit is the steam used for the water based temperature control
system of the reactors. The Ether column uses direct steam for separation of ether from
liquids. The Hot water tank is used to accumulate hot water that is needed to be preheated
before added to the process, direct steam is here the energy source. The Ejectors are exactly
what the names says and is the normal industrial way of creating vacuum, direct steam is here
the driving force. Pulpwater/backwater is a small group of tanks used for accumulating
process water and these tanks uses steam to maintain the right temperature. The smallest
group of the steam consumers is Other and covers all undeclared consumptions like manually
cleaning of filters and heat exchangers etc.
20
0
5
10
15
20
25
30
35
40
%
Dryin
g
Ventilatio
n
Heating/c
ooling c
ircuit
Ether c
olum
n
Hot wate
r tank
Ejecto
rs
Pulp w
ater/B
ackwater
Stripper
Other
Steam consumer
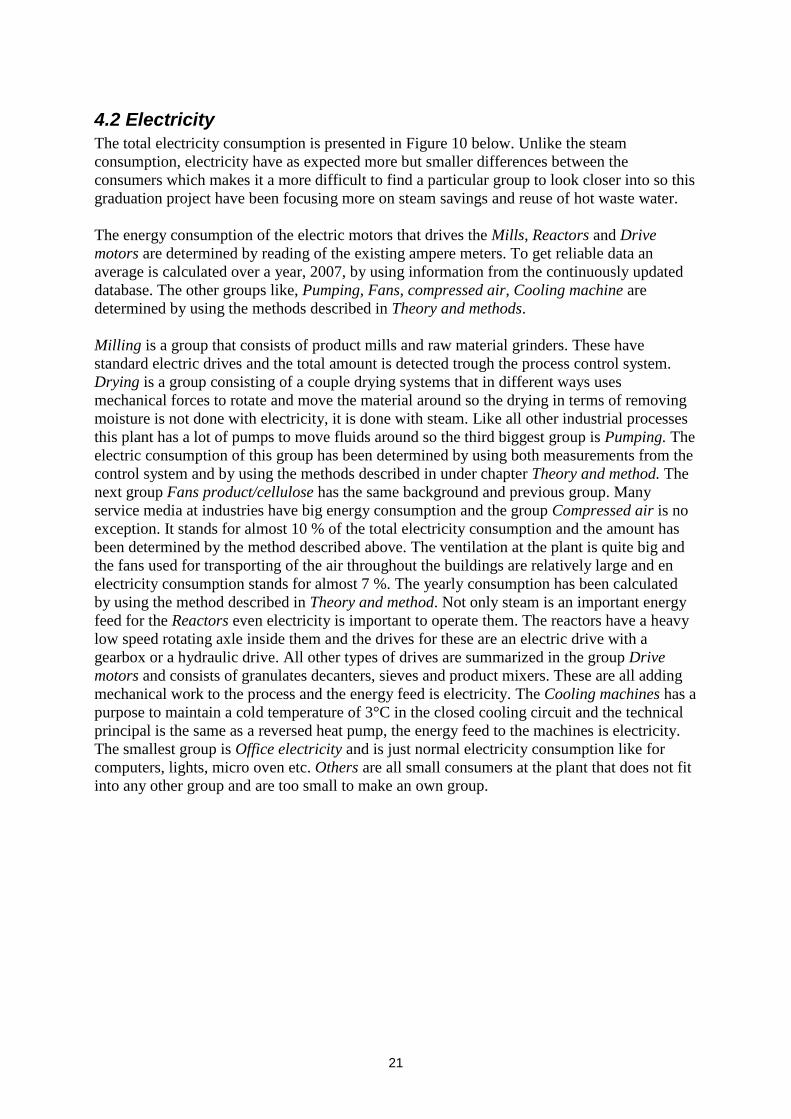
Figure 9. The survey of all steam consumers at the plant. They are presented as per cent of total steam
consumption. The total steam consumption during 2007 was 49 GWh.
A remarkable notice of the steam survey is the fact that the heating of the ventilation system
is the second largest consumer even though it has not anything to do with the production and
the process that is making money for the company. Because of all the waste process heat that
is generated in the production it would be desirable to find a way of being self supporting in
this area. The ventilation is important in to different ways, one is to make at comfortable
climate for the employees and the other is to make sure that in case of any gas leakage inside
the building the air is diluted and ventilated in a fast way. None of these two cases says that
the heat is the most important factor to achieve function so instead the outgoing air would be
heat exchanged with the ingoing air and then used were the high temperature is needed the
most, in other words in the rooms where process waste heat from the equipment is the
smallest.
A more expected big group of the consumer is the Heating/cooling circuit of the reactors
which ends up on a third place. This group is operating under very bad total efficiency and
that is why operating improvements are going to be discussed later.
In both the groups, Heating/cooling circuit and Hot water tank, cold fresh water are heated up
by steam to a temperature between 80°C to 95°C. In the Hot water tank the amounts of water
is not that much and it is remarkable that it stands for 7 % of the total steam consumption. The
explanation to that is the big temperature raise of the water from around 13°C to 95°C. The
low amount of hot water needed for the supply of the hot water tank in combination with the
big temperature variations in the Heating/cooling circuit makes these two groups very suitable
for each other when concerning steam savings. If hot water from the Heating/cooling circuit
would have been recycled to the Hot water tank instead, the temperature increase would been
much smaller and a big amount of steam could have been saved.
21
4.2 Electricity
The total electricity consumption is presented in Figure 10 below. Unlike the steam
consumption, electricity have as expected more but smaller differences between the
consumers which makes it a more difficult to find a particular group to look closer into so this
graduation project have been focusing more on steam savings and reuse of hot waste water.
The energy consumption of the electric motors that drives the Mills, Reactors and Drive
motors are determined by reading of the existing ampere meters. To get reliable data an
average is calculated over a year, 2007, by using information from the continuously updated
database. The other groups like, Pumping, Fans, compressed air, Cooling machine are
determined by using the methods described in Theory and methods.
Milling is a group that consists of product mills and raw material grinders. These have
standard electric drives and the total amount is detected trough the process control system.
Drying is a group consisting of a couple drying systems that in different ways uses
mechanical forces to rotate and move the material around so the drying in terms of removing
moisture is not done with electricity, it is done with steam. Like all other industrial processes
this plant has a lot of pumps to move fluids around so the third biggest group is Pumping. The
electric consumption of this group has been determined by using both measurements from the
control system and by using the methods described in under chapter Theory and method. The
next group Fans product/cellulose has the same background and previous group. Many
service media at industries have big energy consumption and the group Compressed air is no
exception. It stands for almost 10 % of the total electricity consumption and the amount has
been determined by the method described above. The ventilation at the plant is quite big and
the fans used for transporting of the air throughout the buildings are relatively large and en
electricity consumption stands for almost 7 %. The yearly consumption has been calculated
by using the method described in Theory and method. Not only steam is an important energy
feed for the Reactors even electricity is important to operate them. The reactors have a heavy
low speed rotating axle inside them and the drives for these are an electric drive with a
gearbox or a hydraulic drive. All other types of drives are summarized in the group Drive
motors and consists of granulates decanters, sieves and product mixers. These are all adding
mechanical work to the process and the energy feed is electricity. The Cooling machines has a
purpose to maintain a cold temperature of 3°C in the closed cooling circuit and the technical
principal is the same as a reversed heat pump, the energy feed to the machines is electricity.
The smallest group is Office electricity and is just normal electricity consumption like for
computers, lights, micro oven etc. Others are all small consumers at the plant that does not fit
into any other group and are too small to make an own group.
22
0
5
10
15
20
25
%
Mill
ing
Dryin
g
Pumpin
g
Fans pro
duct/cellu
lose
Compre
ssed air
Fans Ventil
ation
Reactors
Drive m
otors
Cooling m
achines
Office e
lectri
cityOth
er
Electricity consumer
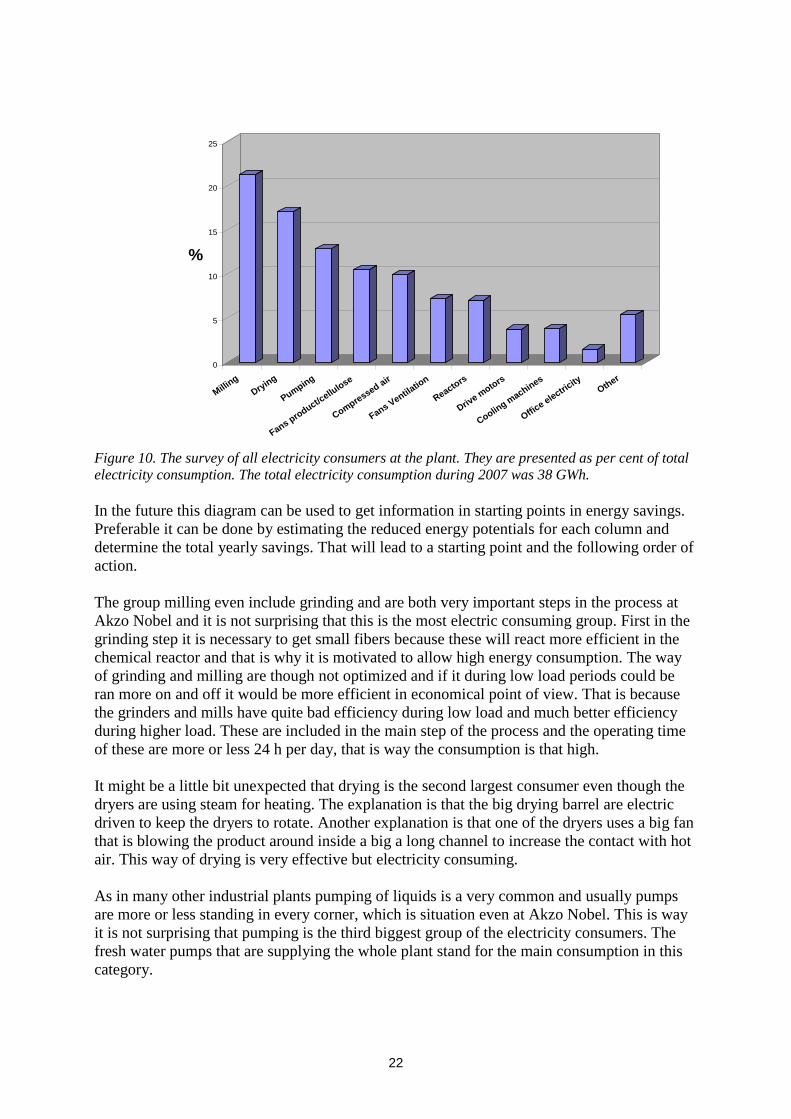
Figure 10. The survey of all electricity consumers at the plant. They are presented as per cent of total
electricity consumption. The total electricity consumption during 2007 was 38 GWh.
In the future this diagram can be used to get information in starting points in energy savings.
Preferable it can be done by estimating the reduced energy potentials for each column and
determine the total yearly savings. That will lead to a starting point and the following order of
action.
The group milling even include grinding and are both very important steps in the process at
Akzo Nobel and it is not surprising that this is the most electric consuming group. First in the
grinding step it is necessary to get small fibers because these will react more efficient in the
chemical reactor and that is why it is motivated to allow high energy consumption. The way
of grinding and milling are though not optimized and if it during low load periods could be
ran more on and off it would be more efficient in economical point of view. That is because
the grinders and mills have quite bad efficiency during low load and much better efficiency
during higher load. These are included in the main step of the process and the operating time
of these are more or less 24 h per day, that is way the consumption is that high.
It might be a little bit unexpected that drying is the second largest consumer even though the
dryers are using steam for heating. The explanation is that the big drying barrel are electric
driven to keep the dryers to rotate. Another explanation is that one of the dryers uses a big fan
that is blowing the product around inside a big a long channel to increase the contact with hot
air. This way of drying is very effective but electricity consuming.
As in many other industrial plants pumping of liquids is a very common and usually pumps
are more or less standing in every corner, which is situation even at Akzo Nobel. This is way
it is not surprising that pumping is the third biggest group of the electricity consumers. The
fresh water pumps that are supplying the whole plant stand for the main consumption in this
category.
23
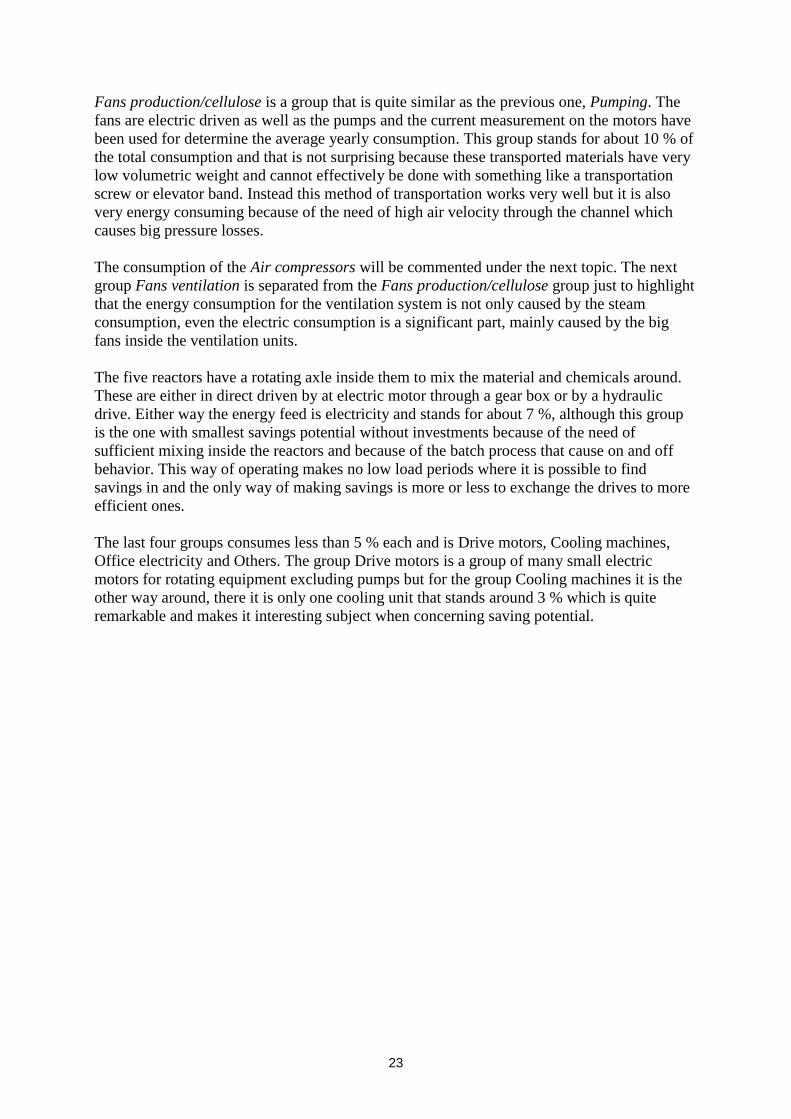
Fans production/cellulose is a group that is quite similar as the previous one, Pumping. The
fans are electric driven as well as the pumps and the current measurement on the motors have
been used for determine the average yearly consumption. This group stands for about 10 % of
the total consumption and that is not surprising because these transported materials have very
low volumetric weight and cannot effectively be done with something like a transportation
screw or elevator band. Instead this method of transportation works very well but it is also
very energy consuming because of the need of high air velocity through the channel which
causes big pressure losses.
The consumption of the Air compressors will be commented under the next topic. The next
group Fans ventilation is separated from the Fans production/cellulose group just to highlight
that the energy consumption for the ventilation system is not only caused by the steam
consumption, even the electric consumption is a significant part, mainly caused by the big
fans inside the ventilation units.
The five reactors have a rotating axle inside them to mix the material and chemicals around.
These are either in direct driven by at electric motor through a gear box or by a hydraulic
drive. Either way the energy feed is electricity and stands for about 7 %, although this group
is the one with smallest savings potential without investments because of the need of
sufficient mixing inside the reactors and because of the batch process that cause on and off
behavior. This way of operating makes no low load periods where it is possible to find
savings in and the only way of making savings is more or less to exchange the drives to more
efficient ones.
The last four groups consumes less than 5 % each and is Drive motors, Cooling machines,
Office electricity and Others. The group Drive motors is a group of many small electric
motors for rotating equipment excluding pumps but for the group Cooling machines it is the
other way around, there it is only one cooling unit that stands around 3 % which is quite
remarkable and makes it interesting subject when concerning saving potential.
24
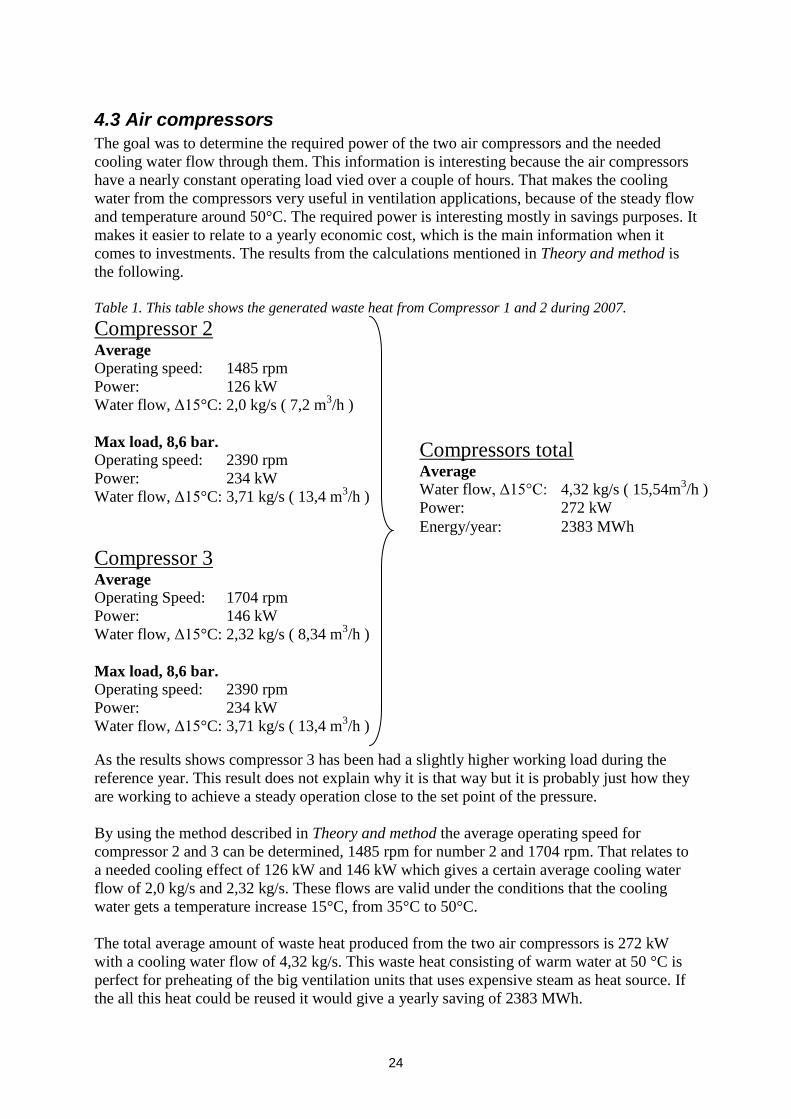
4.3 Air compressors
The goal was to determine the required power of the two air compressors and the needed
cooling water flow through them. This information is interesting because the air compressors
have a nearly constant operating load vied over a couple of hours. That makes the cooling
water from the compressors very useful in ventilation applications, because of the steady flow
and temperature around 50°C. The required power is interesting mostly in savings purposes. It
makes it easier to relate to a yearly economic cost, which is the main information when it
comes to investments. The results from the calculations mentioned in Theory and method is
the following.
Table 1. This table shows the generated waste heat from Compressor 1 and 2 during 2007.
Compressor 2 Average
Operating speed: 1485 rpm
Power: 126 kW
Water flow, Δ15°C: 2,0 kg/s ( 7,2 m3/h )
Max load, 8,6 bar.
Operating speed: 2390 rpm
Power: 234 kW
Water flow, Δ15°C: 3,71 kg/s ( 13,4 m3/h )
Compressor 3 Average
Operating Speed: 1704 rpm
Power: 146 kW
Water flow, Δ15°C: 2,32 kg/s ( 8,34 m3/h )
Max load, 8,6 bar.
Operating speed: 2390 rpm
Power: 234 kW
Water flow, Δ15°C: 3,71 kg/s ( 13,4 m3/h )
As the results shows compressor 3 has been had a slightly higher working load during the
reference year. This result does not explain why it is that way but it is probably just how they
are working to achieve a steady operation close to the set point of the pressure.
By using the method described in Theory and method the average operating speed for
compressor 2 and 3 can be determined, 1485 rpm for number 2 and 1704 rpm. That relates to
a needed cooling effect of 126 kW and 146 kW which gives a certain average cooling water
flow of 2,0 kg/s and 2,32 kg/s. These flows are valid under the conditions that the cooling
water gets a temperature increase 15°C, from 35°C to 50°C.
The total average amount of waste heat produced from the two air compressors is 272 kW
with a cooling water flow of 4,32 kg/s. This waste heat consisting of warm water at 50 °C is
perfect for preheating of the big ventilation units that uses expensive steam as heat source. If
the all this heat could be reused it would give a yearly saving of 2383 MWh.
Compressors total Average
Water flow, Δ15°C: 4,32 kg/s ( 15,54m3/h )
Power: 272 kW
Energy/year: 2383 MWh

25
4.4 Heating/cooling system
Throughout the years it has been well known that the heating/cooling systems of the reactors
are a very big steam consumer during the heating sequences. It have also been known that
there are very much hot water that’s just goes into the sewer during the cooling sequences,
which is indirectly still money that goes into the sewer. So far no one have calculated or tried
to measure how much steam and hot water it really is. One of the tasks in this project was to
calculate a model that makes it possible to determine the amount of water that is used during
one cooling sequence. From the derivation in Theory and method this formula stated, equation
15.
coldEnd
coldStart
circTT
TTmm ln (15)
The amount of steam needed for the heating sequences can be calculated as described in
Theory and method. To get a premonition of a possible consumption, year 2007 can be used
which have chosen to the reference year. The steam consumption for the heating/cooling
circuit can determined by using survey for steam and multiplying the percentage consumption
for each consumer with the total steam expenditure, 49 GWh.
The amount of water from the heating cooling/sequence that goes non recovered down into
sewer can preferably be used as preheating in the next heating sequence which would
decrease the amount of needed steam. To make this work in reality it is necessary to
accumulate the water with the highest temperature until next batch. When the next batch starts
and it is time for heating of the reactor again the accumulated hot water is pumped through
the heat exchanger to the reactor. Then it’s possible to raise the temperature in the steam heat
exchanger if needed. By recycling the water in this way 80 % of the steam consumption can
be saved.

26
4.5 General comments
Some problems needed to be solved before the project could be started. One of them was the
lack of information that indirect concerned the process, like pumps, fans and compressors. To
know how to optimize the energy consumption and get the plant more efficient it was
necessary to know where to begin. To be able to do this estimation a full survey of all
machines and their yearly cost was desirable and had to be the start of the project.
The type of energies that was taken in consideration was electricity, steam and heat flows. For
the most of the machines none of these had been measured and because of the batch like
process it would preferably be measured over a year. The time plan reached over four month
so this consumption had to be estimated in another way.
If you do not know how much energy that goes in to a machine you still can get the
information if you can determine the energy out from it. In the data base from the plant you
often can find measured information after a pump or a fan that can lead you to the work done
by known physical relations. By specification from the manufacturer the efficiency of the
machine is known and by working this way from pump to pump the desired energy
information can be reached.
It was not very easy to find information around energy consumption of the equipment because
of the lack of measured operating data. That was the main problem when working with this
project. To get around this problem methods where needed to be worked out to estimate the
consumption. Most of the time information could be found along the process like heat flows
before and after the equipment which could lead to an estimated work done.
Another problem that seemed to be bigger than expected was the needed knowledge of the
total factory. To be able to make a solid appraisal of the waste energy, where it could be
renewed and where in the factory the biggest savings are, it was necessary to get a big
understanding of the process. So the problem was actually the time that started to look
undersized. But with a lot of help from the employees and with some modifying of the time
plan it seemed work out in a good way.
A more theoretical problem was how to decide reference when calculating the amount of
energies that could be taken care of, because that depends on where it can be recycled and
what type of energy it is. For example, the general reference temperature for steam is zero
degrees Celsius but if you have a hot waste fluid you can in most cases only take care of
temperatures down to thirteen degrees which is the average temperature of raw water. What
reference that is taken in consideration is therefore very important and have to be followed as
a comment next to the amount of energy that is determined for every calculated heat flow.
Because of the limited time plan the work had to be considered from the beginning to the end,
not in detail but in such a way that you do not notice a systematic error in the end which
affects the whole survey, like the wrong reference. That was one of the challenges of the
project, to make yourself a picture of a work which you’re not aware of the outcome.

27
5 Conclusions The purpose was to investigate the possibilities of lowering the energy consumption at the
plant. The main conclusion is that Akzo Nobel has a big potential of decreasing the
expenditure caused by energy consumption and the remaining question is just how big the
investment will be, and the pay off time. The report does not include determinations of the
cost for different investments or the most energy efficient solutions but is instead focused on
highlighting inefficient consumers and their consumption.
On the heating/cooling circuit much money can be saved because of the repeated heating and
cooling sequences and without giving a detailed solution the main conclusion is that the use
of steam is far away from optimized and much energy and money could be saved. The next
step would be to investigate the investment cost for an accumulator and compare it to other
solutions.
To get a feeling of how much money that could be saved regarding this issue an example is
made. If hot water from the Heating/cooling circuit would be recycled to the hot water tank it
is not excessive that half of the direct steam to the hot water could be saved. That is 1,8
GWh/year and with a steam price of 0,35 kr/kWh (during 2007) the saving would be 643 000
kr /year.
Because of the big amount of waste heat from the process equipment, as hot water and warm
air, it would not be unreasonable to state the fact that the ventilation system should be self
supporting. How that is done in the most affordable way the report does not tell but there are
many ways because of the low demands on heat quality. To feed the ventilation unit with heat
it is only necessary to have a water temperature of 50°C or an air temperature of 25°C, in
these ranges there are plenty of heat sources. The next step would be to determine the size of a
hot water accumulation tank that would be big enough to supply the biggest ventilation unit
and then estimate the pay off time for this installation, including piping and heat changers.
To exemplify the situation when the plant is self-sufficient in ventilation and all the steam to
its units is saved, then the total saving would be 3 100 000 kr/year.
In a first step it is recommended connect the easiest equipment to the ventilation system. That
is the warm water from the air compressors which is only pumped to the sewer. If all the
waste heat from Compressor 2 and 3 would be reused in the ventilation system a saving of
1 500 000 kr/year could be made.
The group milling is the largest one when concerning electricity. If the grinding and milling
could be optimized like not running all the mills all the time and instead shut parts of them
down when it is low load then a saving could be down. If that could save 5 % of the electric
input it would mean a saving of 200 000 kr/year.
The topics have one thing in common and that is the financial part. To go on with this project
it is necessary to estimate the investment costs and compare different solutions in force of
technical and economical basis. The main conclusion is that Akzo Nobel AB can lowering the
energy consumption and this report present a couple of topics that have big potentials and
remaining question is what solution to choose for each one of them and what the pay off time
will be.

28
6 Reference List
[1] Cengel, Yunus A. Boles Michael A. (2002); Thermodynamics – An engineering
Approach..4th
Ed. McGraw-Hill ISBN 0-07-121688-X.
[2] Nordling, Carl. Österman, Jonny. (2001) Physics handbook – for Science and
Engineering.ISBN 91-44-008223-6
[3] Munson, Bruce R. Young, Donald F. Okiishi, Theodore H. (2002); Fundamentals of
Fluid Mechanics. 4th
ISBN 0-471-44250-X.
[4] Processchema Akzo Nobel rev. 2008.1
29
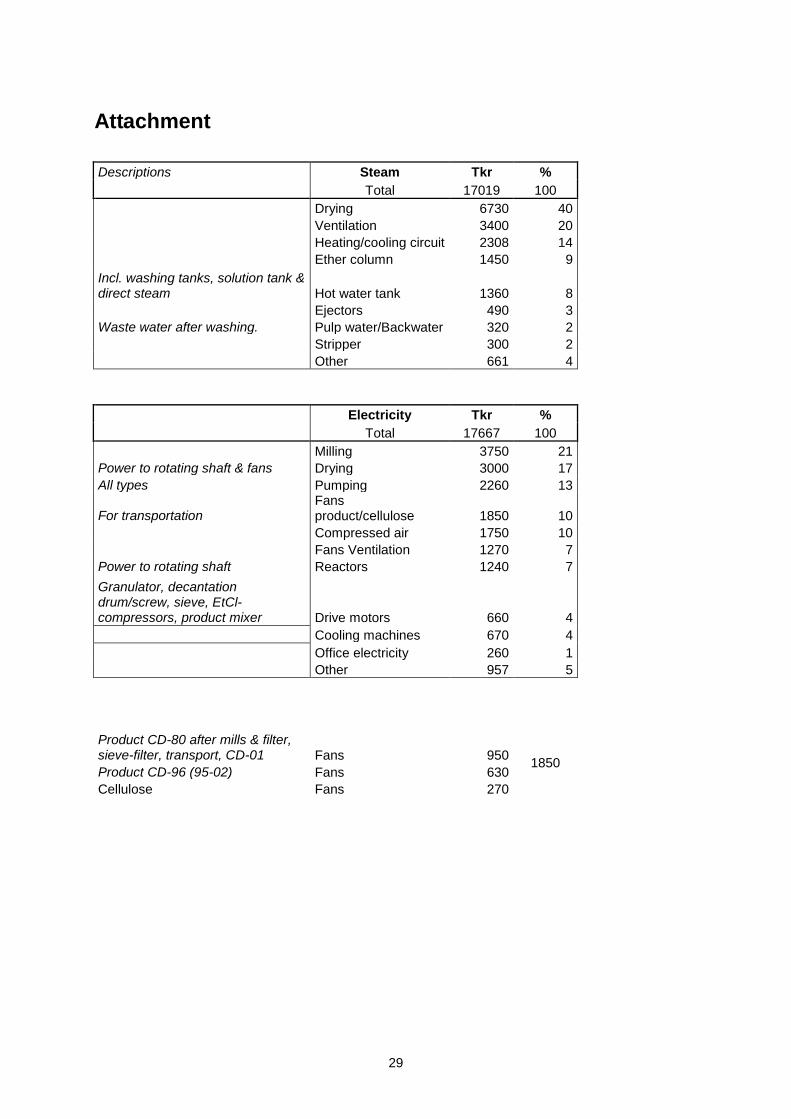
Attachment
Descriptions Steam Tkr %
Total 17019 100
Drying 6730 40
Ventilation 3400 20
Heating/cooling circuit 2308 14
Ether column 1450 9
Incl. washing tanks, solution tank & direct steam Hot water tank 1360 8
Ejectors 490 3
Waste water after washing. Pulp water/Backwater 320 2
Stripper 300 2
Other 661 4
Electricity Tkr %
Total 17667 100
Milling 3750 21
Power to rotating shaft & fans Drying 3000 17
All types Pumping 2260 13
For transportation Fans product/cellulose 1850 10
Compressed air 1750 10
Fans Ventilation 1270 7
Power to rotating shaft Reactors 1240 7
Granulator, decantation drum/screw, sieve, EtCl-compressors, product mixer Drive motors 660 4
Cooling machines 670 4
Office electricity 260 1
Other 957 5
Product CD-80 after mills & filter, sieve-filter, transport, CD-01 Fans 950
1850 Product CD-96 (95-02) Fans 630
Cellulose Fans 270