ANALYTICAL STUDY OF ACOUSTO/OPTICAL … · HOLOGRAPHY - INTERFACING METHODS FOR ACOUSTICAL AND...
97
I NASACONTRACTOR _ REPORT LOAN COPY: F?ETlJKN TO AFWL -I-ECHN:ICAL LiE!%El’P\B KIRTLAND AFf3,N. M2 ’ ANALYTICAL STUDY OF ACOUSTO/OPTICAL HOLOGRAPHY - INTERFACING METHODS FOR ACOUSTICAL AND OPTICAL HOLOGRAPHY ND’? RESEARCH EL M. A. El-Smz Prepared by EL-SUM CONSULTANTS Atherton, Calif. 9402 5 for George C. MarshaN Space Flight Center NATIONAL AERONAUTICS AND SPACE ADMINISTRATION l WASHINGTON, Di C. . DECEMBER 1976 https://ntrs.nasa.gov/search.jsp?R=19770007469 2018-09-09T06:37:04+00:00Z
Transcript of ANALYTICAL STUDY OF ACOUSTO/OPTICAL … · HOLOGRAPHY - INTERFACING METHODS FOR ACOUSTICAL AND...
I
NASACONTRACTOR _
REPORT
LOAN COPY: F?ETlJKN TO AFWL -I-ECHN:ICAL LiE!%El’P\B
KIRTLAND AFf3,N. M2 ’
ANALYTICAL STUDY OF ACOUSTO/OPTICAL HOLOGRAPHY - INTERFACING METHODS FOR ACOUSTICAL AND OPTICAL HOLOGRAPHY ND’? RESEARCH
EL M. A. El-Smz
Prepared by
EL-SUM CONSULTANTS Atherton, Calif. 9402 5
for George C. MarshaN Space Flight Center
NATIONAL AERONAUTICS AND SPACE ADMINISTRATION l WASHINGTON, Di C. . DECEMBER 1976
https://ntrs.nasa.gov/search.jsp?R=19770007469 2018-09-09T06:37:04+00:00Z
_~ ~~ -
TECH LIBRARY KAFB, NM
-- 1. REPORT NO. 12. GOVERNMENT ACCESSION NO. 3. RECIPIENT’S CATALOG NO.
NASA CR-2775 --_~~_~ P TITLE AND SUBTITLE
I I 15. REPORT OATE
Analytical Study of Acousto/Optical Holography - Interfacing December 1976 Methods ?or Acoustical and Optical Holography NDT Research
6. PERFORMING ORGANIZATION CODE
7. AUTHOR(S)
H. M. A. El-Sum 3. PERFORMING ORGANIZATION NAME AND ADDRESS
El-Sum Consultants 74 Middlefield Road Atherton, California 94025 .-
2 SPONSORING AGENCY NAME AND AOORESS
6. PERFORMING ORGANI RATION REPOR r i
M-197 10. WORK UNIT, NO.
11. CONTRACT OR GRANT NO.
NAS8-31783 ,S. TYPE OF REPORi’ 6 PERIOD COVEREI
Contractor National Aeronautics and Space Administration Washington, D. C. 20546 1.1. SPONSORING AGENCY CODE
15. SUPPLEMENTARY NOTES
Prepared under the technical monitorship of the Physics and Instrumentation Division, Space Sciences Laboratory, Marshall Space Flight Center - _; ~~. ..- ----.
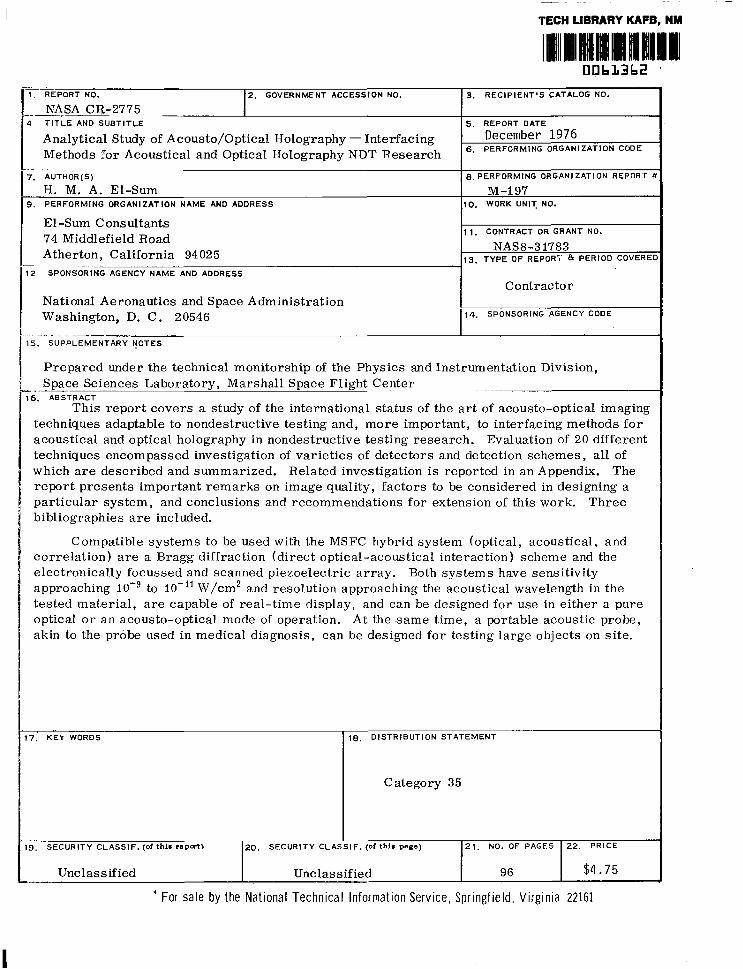
6. ABSTRACT This report covers a study of the international status of the art of acousto-optical imaging
techniques adaptable to nondestructive testing and, more important, to interfacing methods for acoustical and optical holography in nondestructive testing research. Evaluation of 20 different techniques encompassed investigation of varieties of detectors and detection schemes, all of which are described and summarized. Related investigation is reported in an Appendix. The report presents important remarks on image quality, factors to be considered in designing a particular system, and conclusions and recommendations for extension of this work. Three bibliographies are included.
Compatible systems to be used with the MSFC hybrid system (optical, acoustical, and correlation) are a Bragg diffraction (direct optical-acoustical interaction) scheme and the electronically focussed and scanned piezoelectric array. Both systems have sensitivity approaching 10e9 to IO-” W/cm2 and resolution approaching the acoustical wavelength in the tested material, are capable of real-time display, and can be designed for use in either a pure optical or an acousto-optical mode of operation. At the same time, a portable acoustic probe, akin to the probe used in medical diagnosis, can be designed for testing large objects on site.
7: KEY WORDS 1.6. DISTRIBUTION STATEMENT
Category 35
9. SECURITY CLASSIF. (of thh raPti) 20. SECURITY CLAI il F. (of thh P-V) 21. NO. OF PAGES 22. PRICE
Unclassified I Unclassified 96 1 $4.75
* For sale by the National Technical Information Service, Springfield. Virginia 22161

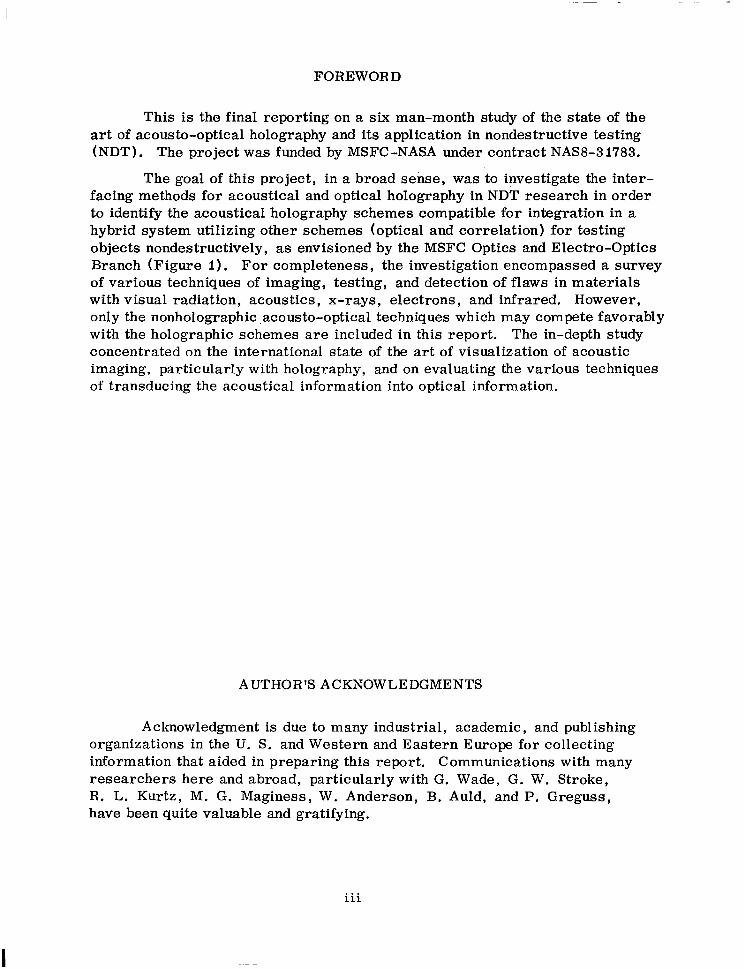
FOREWORD
This is the final reporting on a six man-month study of the state of the art of acousto-optical holography and its application in nondestructive testing (NDT). The project was funded by MSFC-NASA under contract NAS8-31783.
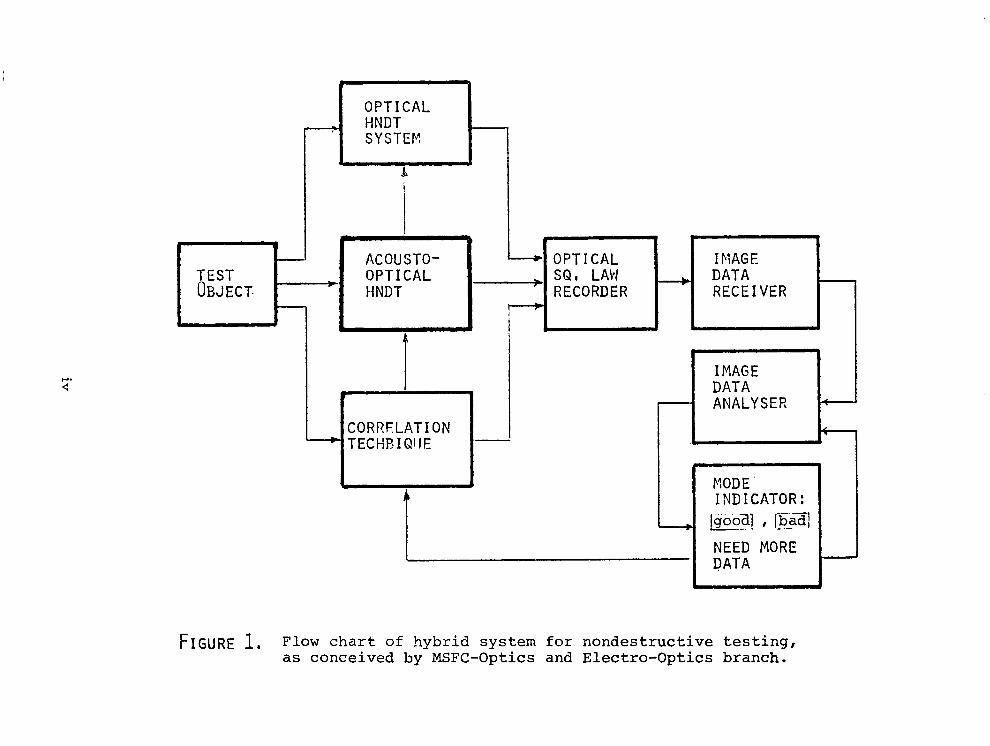
The goal of this project, in a broad sense, was to investigate the inter- facing methods for acoustical and optical holography in NDT research in order to identify the acoustical holography schemes compatible for integration in a hybrid system utilizing other schemes (optical and correlation) for testing objects nondestructively, as envisioned by the MSFC Optics and Electra-Optics Branch (Figure 1). For completeness, the investigation encompassed a survey of various techniques of imaging, testing, and detection of flaws in materials with visual radiation, acoustics, x-rays, electrons, and infrared. However, only the nonholographic ,acousto-optical techniques which may compete favorably with the holographic schemes are included in this report. The in-depth study concentrated on the international state of the art of visualization of acoustic imaging, particularly with holography, and on evaluating the various techniques of transducing the acoustical information into optical information.
AUTHOR’S ACKNOWLEDGMENTS
Acknowledgment is due to many industrial, academic, and publishing organizations in the U. S. and Western and Eastern Europe for collecting information that aided in preparing this report. Communications with many researchers here and abroad, particularly with G. Wade, G. W. Stroke, R. L. Kurtz, M. G. Maginess, W. Anderson, B. Auld, and P. Greguss, have been quite valuable and gratifying.
. . . 111
q 4
OPTICAL - HNDT
SYSTEF
P. c
ACOUSTO- _I I OPTICAL . HNDT
/ . OPTICAL IMAGE
zc SQ, LAW L . DATA RECORDER RECEIVER
4 1
CORRELATION
I, DATA J- _/
MODE INDICATOR:
j+o~] , j-5aaj . .- NEED MORE
FIGURE 1, Flow chart of hybrid system for nondestructive testing, as conceived by MSFC-Optics and Electra-Optics branch.
TABLE OF CONTENTS
Page
CHAPTER I
GENERAL INTRODUCTION 1
2.1 2.2 2.3 2.4 2.5 2.6 2.7 2.8 2.9 2.10
2.11 2.12 2.13 2.14 2.15 2.16 2.17 2.18
CHAPTER II
ACOUSTICAL IMAGING SYSTEMS 5
Introduction ...................... Liquid Surface Deformation (Static Ripples) ...... Bragg Diffraction or Direct Sound-Light Interaction , . Laser Beam Scanning .................. Electron Beam Scanning of Deformed Surface ....... Sokolov Image Tube Converter .............. Metal Fiber Face Tube Image Converter ......... Pyroelectric Image Converter and Image Storage ..... Electrostatic Transducer ................ Piezoelectric Array With Electronic Focussing and Scanning ........................ Frequency Swept Holographic Imaging .......... Zone-Plate Acoustic Imaging Devices .......... Gabor's Sonaradiographic Imaging Scheme ........ Acoustic Tomography .................. Piezoresistive Image Converter ............. Electroluminescent Acoustic-Image Detector ....... Photographic and Chemical Direct Acoustic Recording . . Solid and Liquid Crystal Acoustic Displays ....... .2.18.1 Dynamic Scattering ............... 2.18.2 Voltage Controlled Optical Activity ...... 2.18.3 Guest-host Interaction .............
6 8
10 16 16 18 20 21 22
23 26 27 30 33 33 34 34 40 41 42 . 42
TABLE OF CONTENTS (Cont'd)
Page
2.18.4 Birefringcnt Properties ............ 43 2.18.5 Direct Acousto-Optical Effects ......... 43
2.19 Pohlman Cell ...................... 44 2.20 Oil, Thermoplastic and Photoplastic Films ....... 44 2.21 Scanning and Sampling Technique ............ 46 2.22 Recent Developments .................. 47
CHAPTER III
ANALYSIS, CONCLUSIONS AND RECOMMENDATIONS
3.1 Image Quality ..................... 50 3.2 Comparison of Various Techniques ............ 52 3.3 Recommendations .................... 53
BIBLIOGRAPHY. . . . . . . . . . . . . . . . . . . . . . . . . 60
APPENDIX A - Earlier Study of the Project . . . . . . . . . . A-l
APPENDIX B - Real-Time, Erasable Image Recording . . . . . . B-l
vi
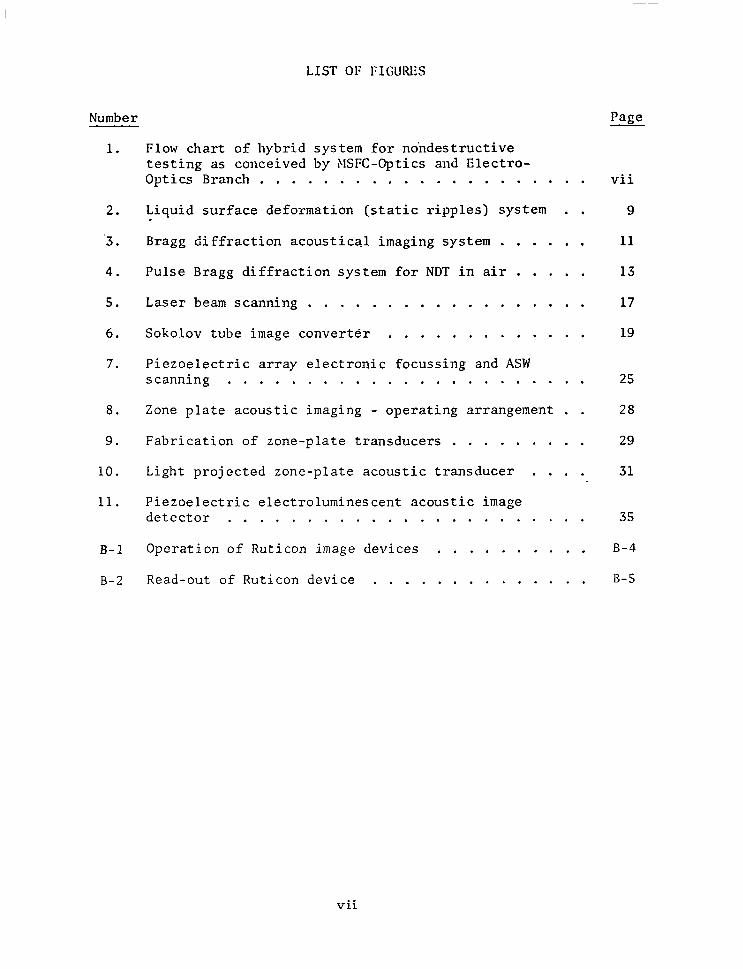
LIST OF FIGURIJS
Number
1. Flow chart of hybrid system for nondestructive testing as conceived by MSFC-Optics and Electro- Optics Branch . . . . . . . . . . . . . . . . . . .
2.
'3.
4.
5.
6.
7.
Liquid surface deformation (static ripples) system
Bragg diffraction acoustical imaging system . . . .
. .
. .
. .
. .
. .
. .
Pulse Bragg diffraction system for NDT in air . . .
Laser beam scanning . . . . . . . . . . . . . . . .
Sokolov tube image converter . . . . . . . . . . .
Piezoelectric array electronic focussing and ASW scanning . . . . . . . . . . . . . . . . . . . . .
8.
9.
10.
11.
Zone plate acoustic imaging - operating arrangement
. . 25
. . 28
. . 29
. . 31
Fabrication of zone-plate transducers . . . . . . .
Light projected zone-plate acoustic transducer . .
Piezoelectric electroluminescent acoustic image detector . . . . . . . . . . . . . . . . . . . . . . .
B-l Operation of Ruticon image devices . . . . . . . .
B-2 Read-out of Ruticon device . . . . . . . . . . . . . .
Page
vii
9
11
13
17
19
35
B-4
B-5
vii
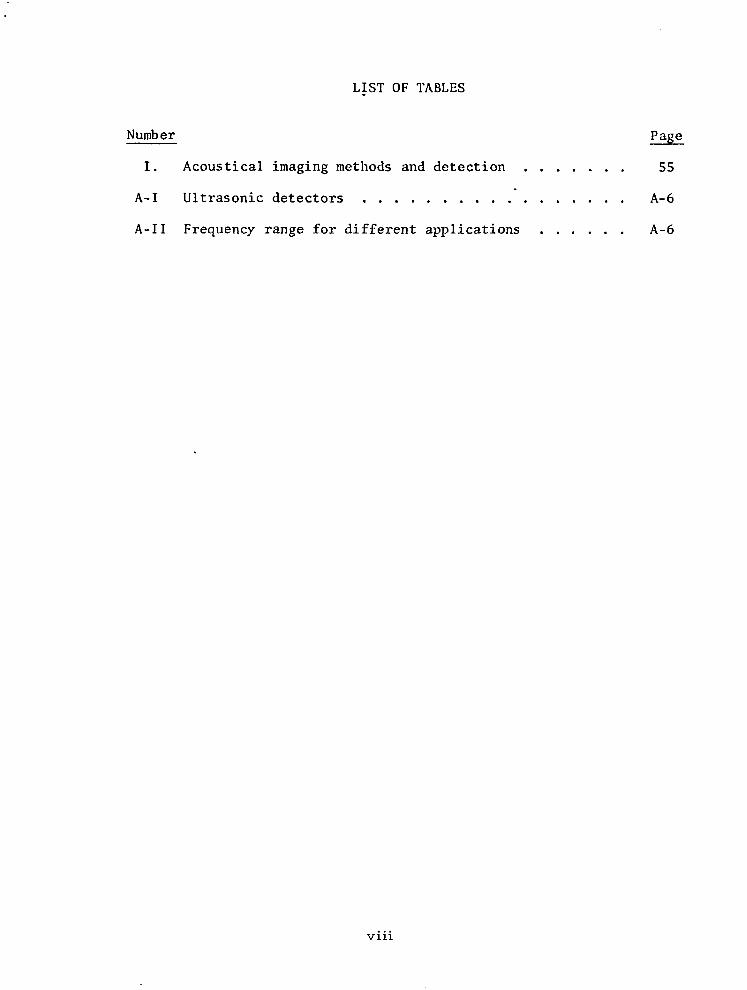
LIST OF TABLES
Number Page
I. Acoustical imaging methods and detection ....... 55
A-I Ultrasonic detectors .................. A-6
A-II Frequency range for different applications ...... A-6
. . . Vlll
CHAPTER I
GENERAL IXTRODUCTION
The potential of acoustical holography as a diagnostic tool in
nondestructive testing was well recognized ever since the first success-
ful demonstration of forming an acoustical hologram and reconstructing,
it with coherent visible light. (1,2) In fact, the vigorous development
of acousto/optical holographic techniques for material nondestructive
testing is second only to the application of these techniques in the
biological and medical field, as evidenced from the yearly symposia on
Acoustical Holography, (3) the IEEE ultrasonics, (4) and other national
and international conferences. Technological advances, inspired origi-
nally by acoustical holography, have led in many cases to further
simplification of the two-stage acoustical holography to a real-time
acoustical imaging, as will be discussed later.
Among the pertinent advantages of acoustical holography in NDT are:
(1) having a permanent 2-D record of a 3-D image (both outer
shape and internal structure of the object),
(2) obtaining a good lateral resolution without the need for
complex ultrasonic imaging optics,
(3) obtaining a good depth resolution without the need for very
short pulses of ultrasonic energy,
(4) detection of very weak ultrasonic scattering regions, too
weak to be detected by other methods,
(5) measuring the degree of material uniformity by considering
the hologram as an interferogram,
(6) measuring the uniformity of the tested object before and
after a change in its environment (such as temperature,
pressure, etc.), and
2
(7) converting the acoustical information into optical information
which may be easier to interpret directly by the eye or by the
use of well established optical techniques.
However, acousto/optical imaging capabilities have certain limitations
and what may be considered disadvantages. As an illustration, the follow-
ing examples are enumerated:
(1) distortion due to the change in wavelength (from a long
acoustical wave Xs which probes the object and forms the
hologram, to a much shorter light wave XL to reconstruct a
visible image). See the discussion in Appendix I, pp. A-4,
(2) the speckle effect produced by the coherent nature of the
reconstructing light, and the limited aperture of the
hologram.
(3) at certain angles of incidence,objects, opaque to sound
waves, become transparent to such waves and hence the intro-
duction of possible misinterpretation of the image.
(4) nonlinearity of sound propagation introduces distortion in
the phase of the reflected waves, particularly with high
amplitude and frequency.
(5) acoustic transducers usually have an excess of 100 dB (a
factor of 100,000) range of pressure amplitudes, while the
intensity modulated oscilloscope can only display about
20 dB (a factor lo), and photographic films have a dynamic
range of only about 10 dB. (109) 'Thus to display both large
and small acoustic information simultaneously, it is neces-
sary to use amplitude compression technique or use digitizing
3
techniques and computer processing.
(6) distortion due to mechanical instability of tested object or
to unsteady environment, in which case special mounting (51
may be neeced.
blast of these limitations can be overcome. They are mentioned
merely to emphasize the need for extreme care to correctly diagnose the
tested object using the acousto/optic holographic technique. Further-
more, it shows the necessity of using the acousto/optical testing as a
complement to other testing means such as optical, and correlation.
.4coustic frequencies ranging from 100 KHz to 10 GHz have been used
in NDT [see Appendix A, pp. A-6, Table 4-111; the choice of the proper
frequency depends upon the material of the object to be used, and the
required depth of penetration of the probing wave, since the attenuation
of such wave is proportional to the square power of the frequency.
Hence usually the normal NDT of thick objects are limited to the acoustic
frequency range of 100 KHz to 10 MHz, while the range 10 MHz to 10 GHz
is used in ultrasonic microscopy where the material is quite thin (of
the order of micrometers) . The latter will not be treated extensively
in this report; however, this does not diminish its importance in areas
like the study of the theory of crack development in materials. New
materials and/or techniques (e.g., photopolymer films, pyroelectric
conversion layers, electrostatic transducers, crystalline solid thin
layer of CoC12*6 H20, ultrasonic tomography, zone plate focussing,
electronic focussing and scanning of phased arrays) still in the develop-
ing state, are described in Chapter II, and evaluated in Chapter III.
4
CHAPTER II
ACOUSTICAL IMAGING SYSTEMS
2.1 Introduction
An acoustical imaging system consists, in general, of:
. an insonifier
. the object
. a lens (not needed in some systems)
. a detector or transducer
. a display or recorder (which may be the detector itself).
All of these components are usually immersed in a water tank to minimize *
the acoustical impedence mismatch. Some of these components may be a
simple one element, a composite structure, or a collection of several
elements, depending on the operational function of the whole system.
There may be, for example, more than one insonifier, as in holography;
the lens may be eliminated in some holographic arrangements, or if the
object is in contact with the detector; the detector itself may be (but
rarely in a practical system) a simple chemical emulsion, a liquid
crystal, a composite of deformed liquid or solid surface and a scanning
laser or electron beam, a sandwich of several materials (e.g., piezo-
electric and electroluminescence) etc.; the visual display of the
acoustical information is converted into optical information via a
vidi con camera, an optical telescope, or a CRT. There is quite an
overlap between the display subsystem and the detection techniques that it
is often difficult to separate the two.
* Acoustical imaging reveals the change in acoustical impedance in the object, and hence depends on the density of the material to be imaged and the acoustic velocity yithin this material. This is different from x-ray imaging which depends on the electron density and atomic number of the material; electron beam images (as in electron microscope) reveals*only the surface or near surface structure, and depends on the atomic. density of the material; optical images reveal only the outer shape of the object.
6
The different components of an acousto/optical system are arranged
in a variety of ways, dcpcnding on whether the object is to be seen in a
transmission or a reflection mode. In the transmission mode the object
hides the detector from the insonifying source. If the object is in
touch with the detector, the lens is not needed and we get an arrangement
akin to a contact print.in optical or x-ray photography. However, if
the object is separated from the detector then a lens is needed between
the two to cast a sharp image on the detector; otherwise, if there is
no lens, the shadow cast on the detector may be a diffused shadow, or an
on-axis (Gabor type) hologram. An off-axis acoustic hologram may be
formed if the shadow of the object cast on the detector is biased by
another coherent acoustic wave (from another insonifier tuned to the
same frequency) which falls obliquely on the same detector. In the
reflection mode arrangement, the object, insonifier and detector, are
not in a straight line. The scattered wave from the object may be
focussed on the detector by a lens; or, in the absence of a lens, an
off-axis hologram is produced. Here again, a second reference acoustic
wave may be used, particularly if an in-focus hologram is to be made.
In an earlier study (summarized in Appendix A) we broadly classi-
fied the various systems, mainly according to the detection-display
scheme. Now, we shall proceed to expound the various techniques, con-
centrating mainly on those most applicable to NDT.
* Such a hologram is produced only if acoustic radiation from the same source falls on the detector (without passing through the object) to provide the reference wave. It is assumed that coherent acoustic waves are used to insonify the object.
7
2.2 Liquid Surface Deformation (Static Ripples) (271
This method of acoustic image conversion and the electron-beam
scanning tube of Sokolov are the earliest to be conceived for real-time
visualization of ultrasonic images. (11,121 When an acoustic image is
focussed onto the liquid surface it causes the surface to elevate at
each point until equilibrium is attained by the restoring forces of
surface tension and gr.avity. The relief pattern formed in this way is
an analog of the pattern of acoustic intensity incident on the surface.
The deformed fluid surface serves.as an optical phase-object, and a
visible representation of the acoustic image is produced by reflecting
1 ight from, or refracting it through, the surface, using one of several
phase-contrast imaging techniques. This technique has recently been
revived in acoustic holography. 11,2,12,13) The modern version (used
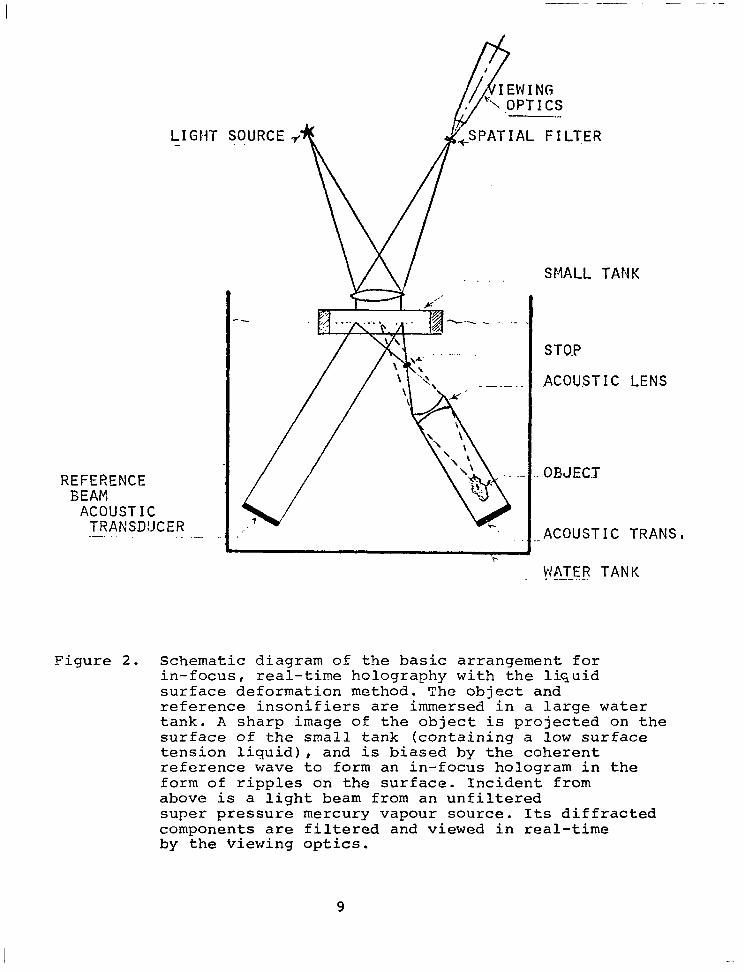
commercially) is illustrated in Figure 2, which is self-explanatory.
Refer to Appendix A, pp. A-7 - A-10 for more discussion.
Instead of the coherent acoustical reference beam, Green (15) used
a wire grating close to the liquid surface on which the acoustic image
of the object is immersed. In this way the undesired high frequency
ripples are reduced considerably. Both arrangements produced images of
comparable quality.
Another improvement was made by N. K. Sheridan, (14) to amplify the
ripples, more at the high frequency end than the low frequency one, and
hence reduce the low frequency noise and improve the real-time image
visualization. He used a thin layer of a dielectric liquid (which may
have conducting or insulating su.rface) placed in a strong electric field.
Experimental verification of the idea revealed pictures no better than
8
LIGHT
REFERENCE EjEAM
ACOUSTIC TRANSDUCER .-. _ -_- . .-
SMALL TANK
ST0.P
.ACOUSTIC LENS
OBJECT
.ACOUSTIC TRANS,
WATER TANK . --.-.._.
Figure 2. Schematic diagram of the basic arrangement for in-focus, real-time holography with the liquid surface deformation method. The object and reference insonifiers are immersed in a large water tank. A sharp image of the object is projected on the surface of the small tank (containing a low surface tension liquid), and is biased by the coherent reference wave to form an in-focus hologram in the form of ripples on the surface. Incident from above is a light beam from an unfiltered super pressure mercury vapour source. Its diffracted components are filtered and viewed in real-time by the viewing optics.
9
Brenden’s and Green’s, but the sensitivity may have been increased.
This work has been discontinued.
The advantages of this technique are its
(a) simplicity
(b) moderate sensitivity (O.OOiS W/cm2 is practical; 10 -9 W/ cm2
highly theoretical (17)
(c) good resolution (0.07” voids in 4” thick steel and 0.03”
voids in 1” Al have been reported) (16)
(4 capacity for real-time display
On the other hand, this scheme is most suited for Gabor-type, near on-
axis holography because of the limited frequency response of the liquid
surface. Depending on the surface tension of the liquid the low and
high spatial frequency cut-offs are at about 1 cycle/cm and 20 cycle/cm
respectively. Furthermore, the highest acoustic frequency that can be
used is about 10 FMz (limited by the surface tension of the liquid) and
the lowest usable acoustic frequency is about 0.5 MHz (limited by the
capillary forces giving way to gravitational forces).
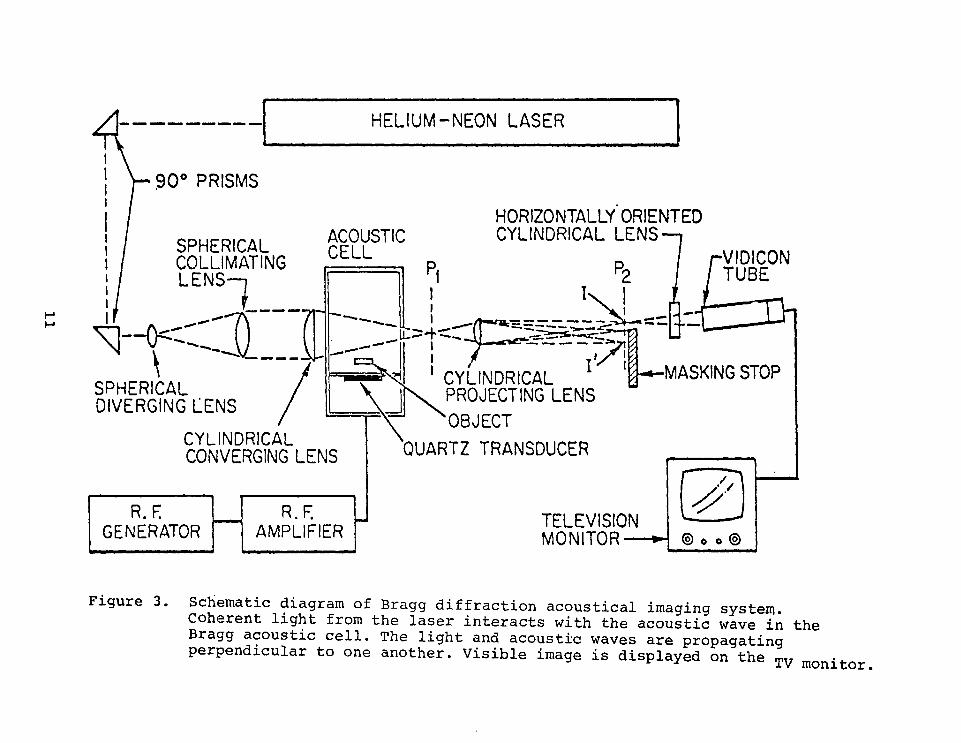
2.3 Bragg- Diffraction or Direct Sound-Light Interaction (18)
The operational principle of Bragg-diffraction imaging is based
upon the diffraction of coherent light by acoustic waves when proper
conditions are met. A basic schematic arrangement of the system is
shown in Figure 3. The object is placed on a membrane in the water
filled Bragg acoustic cell, and insonified in the vertical direction.
The laser beam interacts with the acoustic wave propagating in the
acoustic cell. Two spherical lenses collimate the laser beam, which is
then focussed by a cylindrical lens onto the line Pl. Bragg diffraction
10
w-e------
4
‘
I I 90” PRISMS
HELIUM -NEON LASER
“nn”n”‘TALLY’ORIENTED CYLINDRICAL LENS l
CYLINDRICAL CONVERGING LENS I ‘QUARTZ TRANSDUCER
Figure 3. Schematic diagram of Bragg diffraction acoustical imaging system. Coherent light from the laser interacts with the acoustic wave in the Bragg acoustic cell. The light and acoustic waves are propagating perpendicular to one another. Visible image is displayed on the TV monitor .
of the light takes place in the acoustic cell. Two first -0rdcr frequency
shifted Bragg-diffracted light beams, I and I I, and the zero-order light
at its original frequency, are projected onto plane P 2’ Only one of the
diffracted beams is allowed through a second cylindrical lens for aspect
ratio correction and is projected onto a vidicon tube for real-time
television display.
The angle of diffraction in .this scheme is a function of the ratio
of the light ltyavelength to the acoustic wavelength, according to the
simple equation:
xL Sin 8 = 2x (1) S
where 8 is half the angle of diffraction. It is therefore desirable to
use the highest possible acoustic frequency. Frequencies in the range
of 10 to 100 MHz have been used. At the lower frequencies, the produced
images alriays suffer from the scattering of the direct beam. To over-
come this, an ingenious scheme was used, where the image is recorded
with a biasing light wave from the laser. This recording will then
carry the desired image superimposed on a hologram of the direct beam
(since the diffracted light has a different frequency from the original
laser light). The recording can then be reconstructed in the normal way
and the desired image can be filtered out.
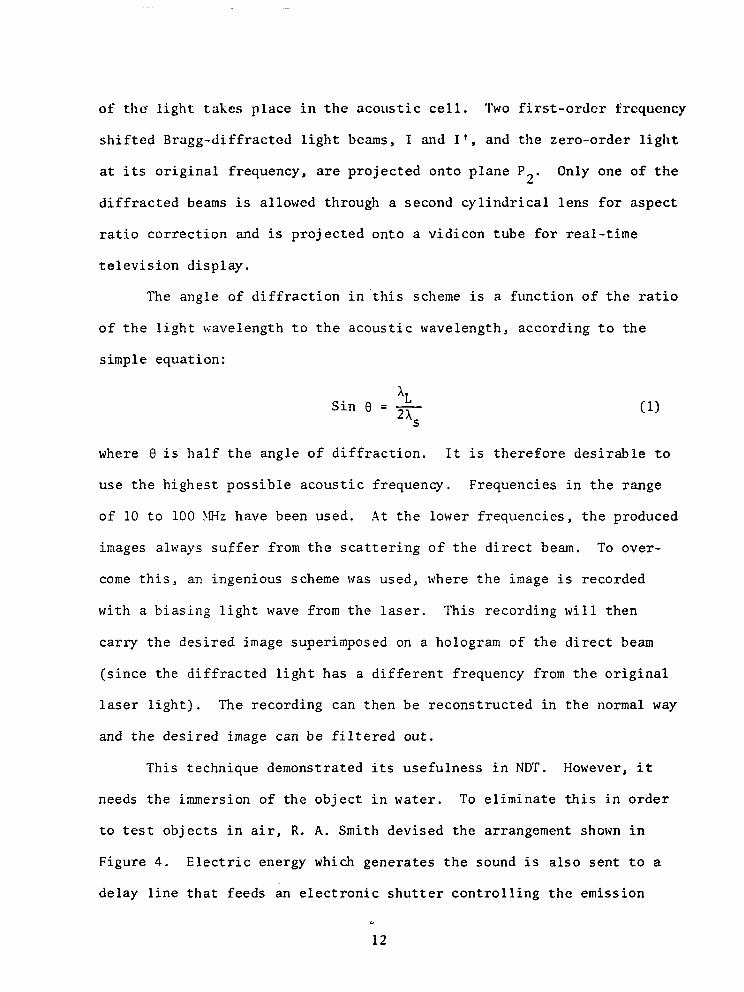
This technique demonstrated its usefulness in NDT. However, it
needs the immersion of the object in water. To eliminate this in order
to test objects in air, R. A. Smith devised the arrangement shown in
Figure 4. Electric energy which generates the sound is also sent to a
delay line that feeds an electronic shutter controlling the emission
0 12
c
VARIABLE DELAY
4
I r II 1
1 TRANSDUCER]
‘MEMBRANE
Figure 4. Block diagram of pulsed Bragg imaging system for NDT of material that must be kept dry (i.e. not t0 be immersed in the water filled Bragg cell). The object is placed in air against the polyethylene membrane of the Bragg cell. The pulsed light from the laser is delayed so that it passes through Bragg cell only when the acoustic pulse is reflected upwards from the object. The delay time determines the plane of the object to be imaged, and the thickness of such a plane is determined by the duration of the laser light pulse.
13
of laser light. Uy pulsing the laser at some given time, subsequent
to the gcncrntion of sound, reflected sound will be returned from a
specific distance within the object viewed. At a later time, the sound
present in the Rragg cell would be reflected from a greater distance in
the obj ect . Consequently, the image wi 11 be a replica of objects located
at ever increasing distances as time proceeds . The duration of the laser
light pulse is made sufficiently short to have a negligible effect on the
size of the range interval viewed. The range interval is one-half the
duration of the sound pulse multiplied by the velocity of sound in the
material inspected. Flaws outside this range interval will be rejected
from view. Flaws may be separated which are as close together as pulse
rise or fall times will allow. A complete inspection of an object would
require repetitive pulsing of a sound transducer with repetitive illumi-
nation from the laser using sound pulses and laser pulses which are
repeated with increasing delay after a given image plane has been
inspected. Pictures have been published (231 using this technique with
an acoustic frequency of 18.7 MHz, of holes in Al block, silicon rubber
strips on Al, etc.
The resolution in this arrangement depends on the acoustic wave-
length Xs the distance of interaction D in the Bragg cell, the angular
extent ZCY of the converging light, the distance R between the object
and light column, the height H of the light column in the vertical
direction, and the width W of the light cone. The horizontal and
vertical resolutions, 6h and 6v respectively, are different:
14
6 h =
!
* xs Rii- for R > 2 SFn cc
AS 2 Sin cc for R < 2 S-n c1 t
(21
As Rii-
for R = H
6v =
A for . t R << H
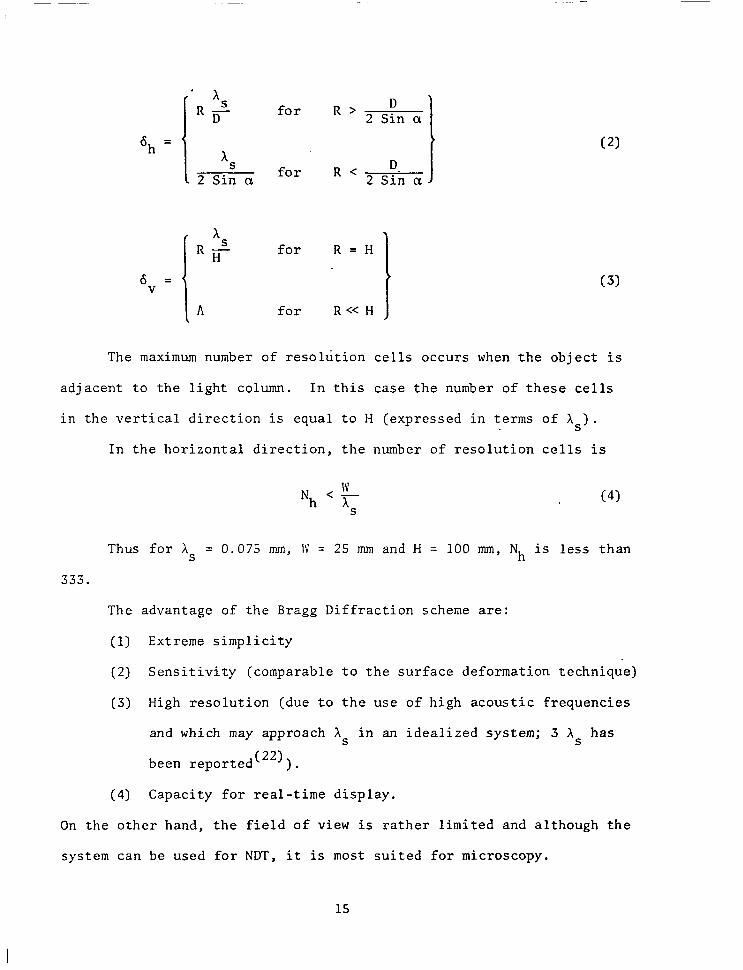
The maximum number of resolution cells occurs when the object is
adjacent to the light column. In this case the number of these cells
in the vertical direction is equal to H (expressed in terms of As).
In the horizontal direction, the number of resolution cells is
Nh < $ S
(4)
Thus for As = 0.075 mm, 1S = 25 mm and H = 100 mm, Nh is less than
333.
The advantage of the Bragg Diffraction scheme are:
(1) Extreme simplicity
(2) Sensitivity (comparable to the surface deformation technique)
(3) High resolution (due to the use of high acoustic frequencies
and which may approach As in an idealized system; 3 As has
been reported (22)) .
(4) Capacity for real-time display.
On the other hand, the field of view is rather limited and although the
system can be used for NDT, it is most suited for microscopy.
15
2.4 Laser Beam Scanning (24,25,26,28,100,101)
In this technique a scanning laser beam is used to effect optical
readout of the acoustic information which is present in the form of
dynamic ripples on solids or liquids. It is mostly limited to acoustic
microscopy because it has an extremely limited aperture, due to the
limitation of the angular deflection of the laser beam. It has not been
used except for imaging.very thin samples, mostly biological, using
acoustic frequencies near 100 MHz. Interested readers are referred to
the literature referenced above, and to Appendix A, pp. 11.
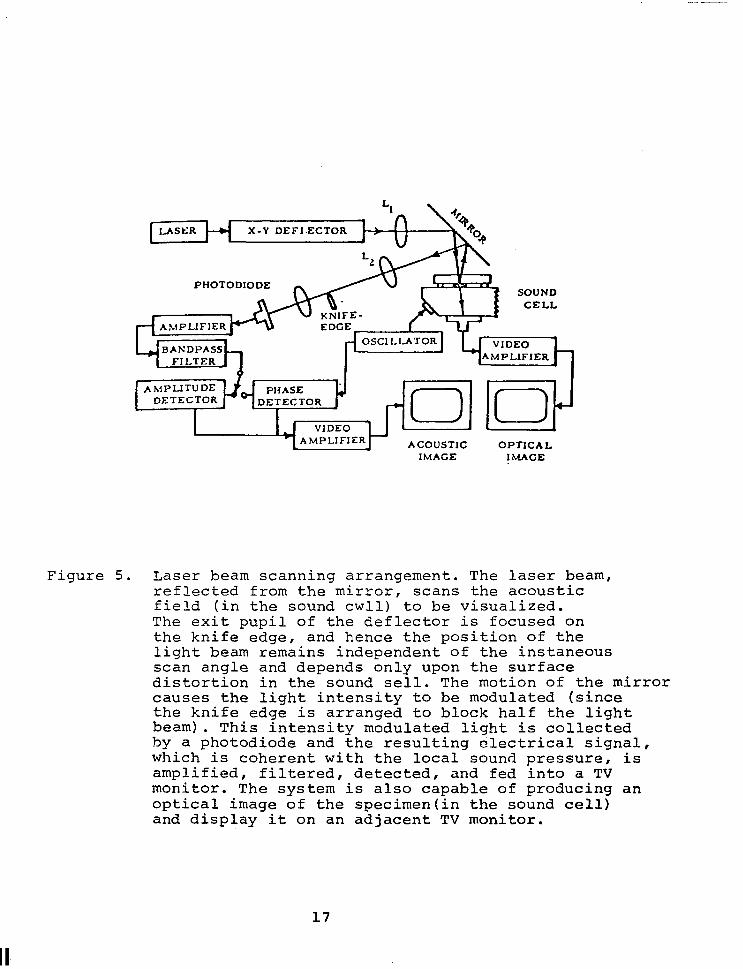
It has demonstrated its real-time operation capability using
100 MHz, displaying simultaneously the acoustic and optic images of the
tested samples (25 urn thick) in an arrangement shown in Figure 5. The
measured sensitivity of this technique is 10 -3 W/cm', while theoretically
it should reach about 10 -' W/cm'.
It has recently been reported, however, that displacements were
measured of the order of
acoustic frequency of 10
using a moving mirror to
to measure the radiation 7,
magnitude of 0.07 A over 15 cm aperture with
>Hz CZ9) . Argon laser was used for scanning,
study biological tissues, 6 urn thick, and also
pattern of acoustic transducers. This system 3
sensitivity was lo-" W/cm'.
2.5 Electron Beam Scanning of Deformed Surface (30)
Instead of the'laser beam scanning, discussed in the previous
section, electron beams can be modulated in phase when they scan a
photocathode on which the acoustic object-wave (focussed, unfocussed,
or biased by a reference wave) is projected. This scheme is thus capable
of displaying either a hologram or its optical reconstruction, depending
16
PHOTODIODE
AMPLIFIER ACOUSTIC IMAGE
OPTICAL IMAGE
Figure 5. Laser beam scanning arrangement. The laser beam, reflected from the mirror, scans the acoustic field (in the sound cwll) to be visualized. The exit pupil of the deflector is focused on the knife edge, and hence the position of the light beam remains independent of the instaneous scan angle and depends only upon the surface distortion in the sound sell. The motion of the mirror causes the light intensity to be modulated (since the knife edge is arranged to block half the light beam). This intensity modulated light is collected by a photodiode and the resulting electrical signal, which is coherent with the local sound pressure, is amplified, filtered, detected, and fed into a TV monitor. The system is also capable of producing an optical image of the specimentin the sound cell) and display it on an adjacent TV monitor.
17
on the relative ,location of the photocathode in the system s
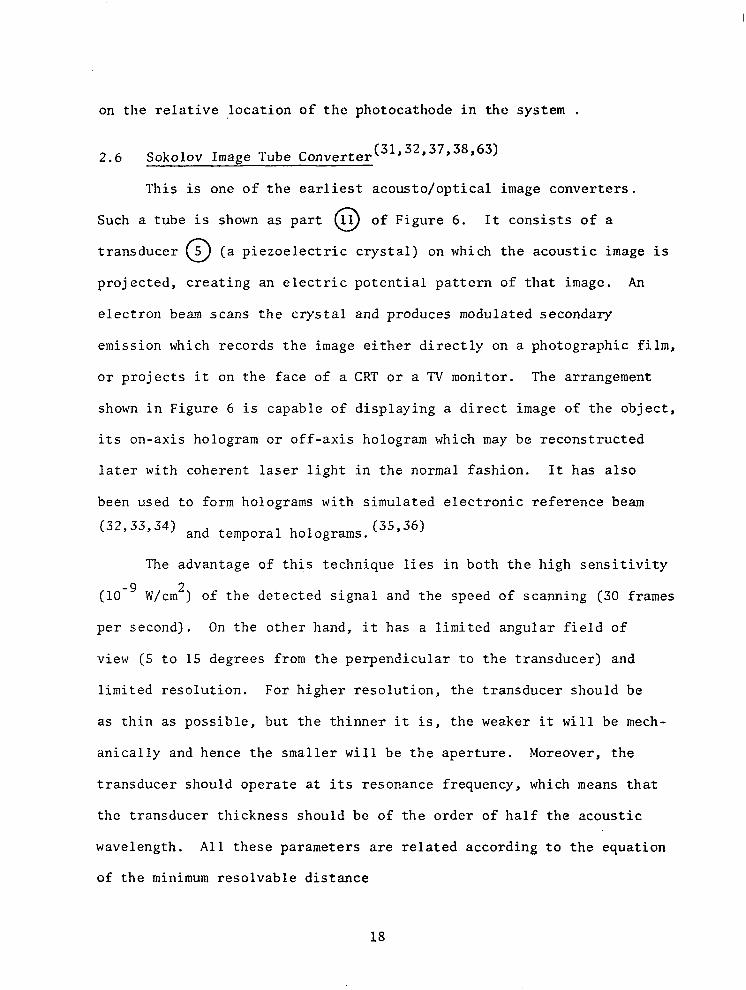
2.6 Sokolov Image Tube Converter (31,32,37,38,63)
This is one of the earliest acousto/optical image converters.
Such a tube is shown as part 11 of Figure 6. 0 It consists of a
t rans ducer 0 5 (a piezoelectric crystal) on which the acoustic image is
proj ected, creating an electric potential pattern of that image. An
electron beam scans the crystal and produces modulated secondary
emission which records the image either directly on a photographic film,
or projects it on the face of a CRT or a TV monitor. The arrangement
shown in Figure 6 is capable of displaying a direct image of the object,
its on-axis hologram or off-axis hologram which may be reconstructed
later with coherent laser light in the normal fashion. It has also
been used to form holograms with simulated electronic reference beam (32,33,34) and temporal holograms. (35,361
The advantage of this technique lies in both the high sensitivity
(lo-g W/cm2) of the detected signal and the speed of scanning (30 frames
per second). On the other hand, it has a limited angular field of
view (5 to 15 degrees from the perpendicular to the transducer) and
limited resolution. For higher resolution, the transducer should be
as thin as possible, but the thinner it is, the weaker it will be mech-
anically and hence the smaller will be the aperture. Moreover, the
transducer should operate at its resonance frequency, which means that
the transducer thickness should be of the order of half the acoustic
wavelength. All these parameters are related according to the equation
of the minimum resolvable distance
18
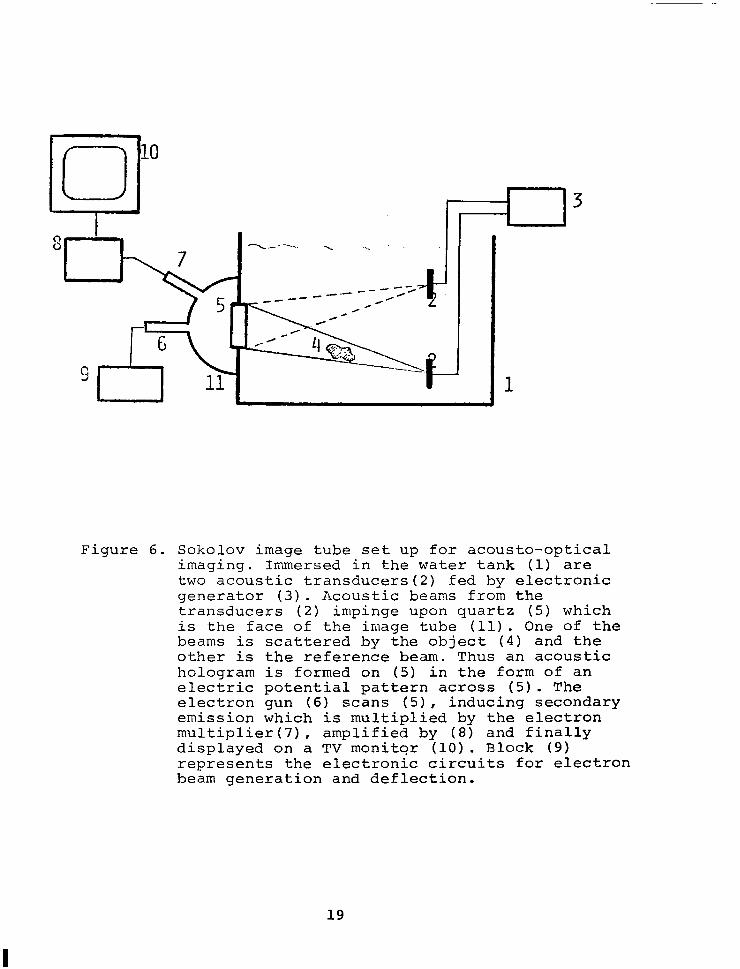
Figure 6. Sokolov image tube set up for acousto-optical imaging. Immersed in the water tank (1) are two acoustic transducers(2) fed by electronic generator (3). Acoustic beams from the transducers (2) impinge upon quartz (5) which is the face of the image tube (11). One of the beams is scattered by the object (4) and the other is the reference beam. Thus an acoustic hologram is formed on (5) in the form of an electric potential pattern across (5). The electron gun (6) scans (S), inducing secondary emission which is multiplied by the electron multiplier(7), amplified by (8) and finally displayed on a TV monitor (10). Rlock (9) represents the electronic circuits for electron beam generation and deflection.
19
6(mm) = 2.86 Acoustic frequency (Mllz)
Resolutions of 3 to 5 times the acoustic wavelength have been reported (39) .
Again, because of the mechanical rigidity, frequencies higher than about
10 MHz are not used. The interest in improving this image converter
(because of its sensitivity and real-time capability) is continuing.
All the efforts are concentrated on developing larger and thinner face
plates. These special designs (37938) extend the common quartz face
plate’s diameter from 5 cm, used with 1 MHz, to 11.5 cm, used with 2 MHz,
and even to 30 cm, used with 20 MHz. These results were attained by
mechanically strengthening the piezoelectric quartz face plate (37) by a
metal grid and/or modifying the electronic scanning scheme of the face
plate.
Other types of face plates are discussed below.
2.7 Metal Fiber Face Tube Image Converter (40)
The conventional Sokolov tube described above utilizes a piezo-
electric plate (PZT-4 or quartz) to convert the incident acoustic signal
into an electric signal, and also to serve as the interface between the
vacuum chamber and the water. The plate should be as thin as possible,
and for maximum resolution, the acoustic velocity in the plate should
be about the same as that of the water so that the maximum angle of
incidence for acoustic plane waves will be as close to 90” as possible.
This puts severe limitation on the diameter of the face plate and the
angular field of view. To overcome these limitations, a metal fiber
face plate is used to serve as the interface between the vacuum chamber
(piezoelectric plate) ‘and the water. This metal fiber face plate is
20
made of glass clad wires (about 0.05 mm in diameter on about 0.15 mm
centers). Theoretically there is no limit on the size of such a plate
and in practice, 150 mm diameter plates were made. The limit is par-
tially imposed by the angular deflection of the electronic scanner.
Published results indicate that such image converters increase
the field of view of the Sokolov tube, does not degrade the resolution,
and makes it possible to have a mechanically strong vacuum boundary while
still being free to select an acoustic to electric transducer that will
provide optimum image quality.
Instead of the metal fiber plate discussed above, one may be able
to improve the characteristic acoustic impedence coupling between the
water and the piezoelectric (quartz) plate by using fine copper powder
in a casting plastic. The thickness of this material deposited on the
quartz plate must be an odd number of quarter wavelength resonant point.
Such a face plate has 101~ absorption of the incident energy; however, it
produces loss of resolution (38) , due to the increase in thickness of the
face plate.
2.8 Pyroelectric Image Converter and Image Storage (41) ---__
The scanning beam interaction with the piezoelectric face of the-
Sokolov tube is such that only the energy in the piezoelectric element
during the time interval the scanning beam is touching that element is
effective in forming the visual signal. This characteristic operation
has precluded for all practical purposes the use of pulsed acoustic
radiation in systems using Sokolov tube.
To overcome this difficulty and further improvement (such as
eliminating the high frequency cut-off limit, increasing the bandwidth,
21
increasing the sensitivity with the applied frequency, etc.) the piezo-
electric face plate was replaced by an acoustic sensitive pyroelectric
target which provides image storage in the form of a spatial temperature
differential related to the absorbed acoustic energy. Only recently
have such highly sensitive pyroelectric materials become available. (42)
Thus pulsed acoustic radiation can be used and the image can be stored
in the form of a thermal distribution in the pyroelectric layer. The
pyroelectric material used is a crystalline substance, triglycine
sulphat e . It is spread as a layer of pyroelectric polymer (PVF2) on
Pyrex glass. Such a detector is thermovoltaic, and has a spontaneous
polarization and dielectric constant which change with temperature.
Its resistivity is high enough to permit charge storage. Pyroelectricity
exists in polymers, and all pyroelectric materials exhibit piezo-
electricity but not vice versa.
The measured sensitivity of such an image converter was reported
as 10 -3 W/ cm2. Its sensitivity increases with the frequency (proportion
to f2), while piezoelectric transducers are less sensitive at higher
frequency. There is no resonance effect and hence it has a wide fre-
quency band (just like all thermal detectors (thermocouples, thermistors,
etc.), but which have never been used because of their extremely low
sensitivity).
2.9 Electrostatic Transducer (43944)
This is a foil-electret transducer array for real-time acoustical
imaging. The foil-electret microphone principle is employed to con-
struct a two-dimensional transducer array. In one design, the back
plate is divided into NxN elements, and one electret foil. The second
design utilizes a back plate and an electret foil each with N strips of
22
mctallization arranged in an overlapping fashion. Parallel sampling
is done with the first design only. A 256 x 256 element array has
been constructed, (43) having an area of (256 x 256)mm2, operating at
frequencies 0.5 to 2.5 blllz. The elements here commuted at a frequency
of 4 KHz so that 16 frames per second was delivered and real-time view-
ing was-obtained. Acoustic holograms were obtained in less than 50 sets.
at a frequency of 3.5 MHz, having a dynamic range of 35 dB.
Such electrostatic transducer arrays are used either in air or in
water. The optimum frequency range in air is 70 to 250 KHz and in
water, 0.3 to 3.5 MHz depending on the medium attenuation of the
angular field of view. The sensitivity of this system was calculated
to reach 10 -8 W/cm2 in air and 2x10 -11 K/cm2 in water,.but measured
sensitivity was reported as 10 -3 W/cm2 only. Eighteen cm demountable
sealed image converters of the Sokolov type were built with such a foil-
electret transducer array as face plates. (44)
2,lO Piezoelectric Array With Electronic Focussing and Scanning (45-50) ~__. ~-
The use of a piezoelectric face plate in an acoustic imaging
converter (Sokolov type) was discussed in the preceding section 1.6.
Such large piezoelectric plate has a very limited angular field of
view. This field of view increases with the decrease of the material
size and reaches a very large angle when it is of the order of a mm or
less. Thus an array or a mosaic of piezoelectric material will possess
a large angular field of view together with high sensitivity (10 -11 W/cm2).*
* Of the many available piezoelectric materials (quartz, lithium sulfate, barium titanate, lead zirconate-titanate, lead metaniobate, etc.) lead metaniobate is highly recommended because it has a very wide band- width without resorting to elaborate backing and matching, and it has minimum electrostatic coupling as compared to other materials.
23
A phased piczoclcctric array in one or two dimensions has been
designed for use in NDT B- or C-scan reflection mode or C-scan trans-
mission mode. When such an array is electronically focussed and scanned
in one direction only, the scanning in the other direction is done
mechanically. Also, the same piezoelectric elements are used to both
transmit (insonify) the.object and receive (detect) the acoustic signal.
Such a scheme has the advantage of having smaller aperture for the same
definition (resolution), or better definition for the same aperture.
Its image does not suffer from the speckle noise (because of the chirp
property of the scanning scheme), nor from interference fringes at the
image boundaries. The focal length of the array can be easily changed
to any depth in the tested material. It has a faster rate of scanning
(about 30 frames per second) in real-time operation. It also has a
range gating with definition comparable to its transverse definition.
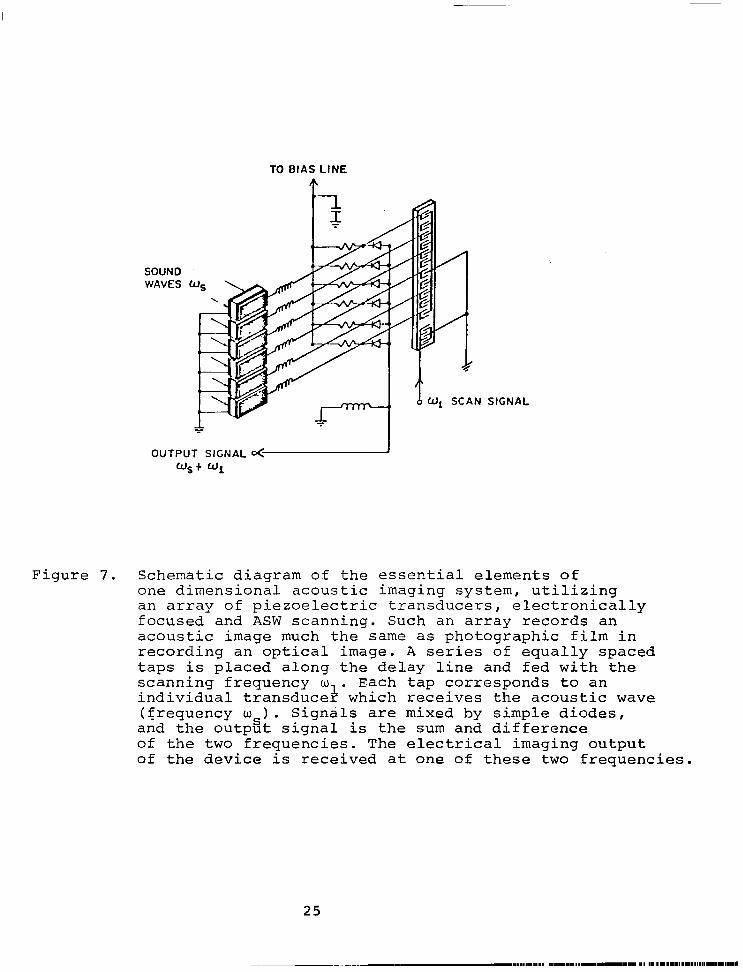
A schematic diagram of acoustic imaging system in one dimension
is shown in Figure 7. It shows the piezoelectric transducers (PZT-5,
1.2 nun wide) receiving the acoustic image, and the BGO (Bismuth Germanium
Oxide substrate) acoustic wave surface delay line, which provide the
delay necessary in sampling the transducers array. For detailed dis-
cussion of the theory references (49), (46) and (45) are recommended.
Arrays of 100 elements, measuring 11.75 cm, were built with acoustic
BGO delay line having a corresponding 100 taps (one tap per transducer)
with 50 MHz chirp frequency. This was used for acoustic imaging; using
1.6 to 2.5 MHz produced images with resolution about 1 mm. Objects
used were 2-25 cm Al block with holes of various sizes; others were
bonded Boron fiber reinforced epoxy laminate laid. dorm on titanium. A
24
TO BIAS LINE
f
SOUND WAVES
OUTPUT SIGNAL o( us+ ml
6 Wl SCAN SIGNAL
Figure 7. Schematic diagram of the essential elements of one dimensional acoustic imaging system, utilizing an array of piezoelectric transducers, electronically focused and ASW scanning. Such an array records an acoustic image much the same as photographic film in recording an optical image. A series of equally spaced taps is placed along the delay line and fed with the scanning frequency w . Each tap corresponds to an individual transduceh which receives the acoustic wave (frequency w 1. Signals are mixed by simple diodes, and the outpzt signal is the sum and difference of the two frequencies. The electrical imaging output of the device is received at one of these two frequencies.
25
third sample was. cracked plastic with part of the crack filled with 1120.
This technique seems to be one of the best and most sensitive
techniques for nondestructive testing in real-time operation. It is
similar to the ultrasonic probe used in the medical field, where 5x5
mosaic elements of lead metaniobate, measuring (4x4) mm* is designed for
heart diagnosis. It operates at 3.5 MHz with 1 MHz bandwidth, and uses
integrated circuits. (1081 Arrays of 32x32 with element spacing of 1 mm
are in the developing stage. There is no reason why such probes cannot
be used in nondestructive probing of materials for the detection of
voids, flaws, cracks, bonding, etc.
2.11 Frequency Sliept Holographic Imaging (511
In the previous section, a two dimensional array is used to
angularly scan a probing narrow beam in object space and the received
backscatter is used to generate a display of the relative positions and
strengths of the various scatterers present. It is an excellent but
expensive technique. Another cheaper method of mapping the scattered
field utilizes only one transmitter and one receiver. The illuminating
acoustic frequency is changed, causing the diffraction pattern (or
hologram) of the object to expand or contract and swing in space with
the object forming the center of gyration for the swinging and changing
pattern. A single stationary receiver can be used to map the variation
in the diffracted pattern as the pattern sweeps over it as a result of
frequency sweeping the object illumination. Theoretical analysis of
this frequency swept scanning technique shows that under certain con-
ditions, the collected data is equivalent to that obtained from a linear
scan of a receiver over the stationary diffraction pattern.
26
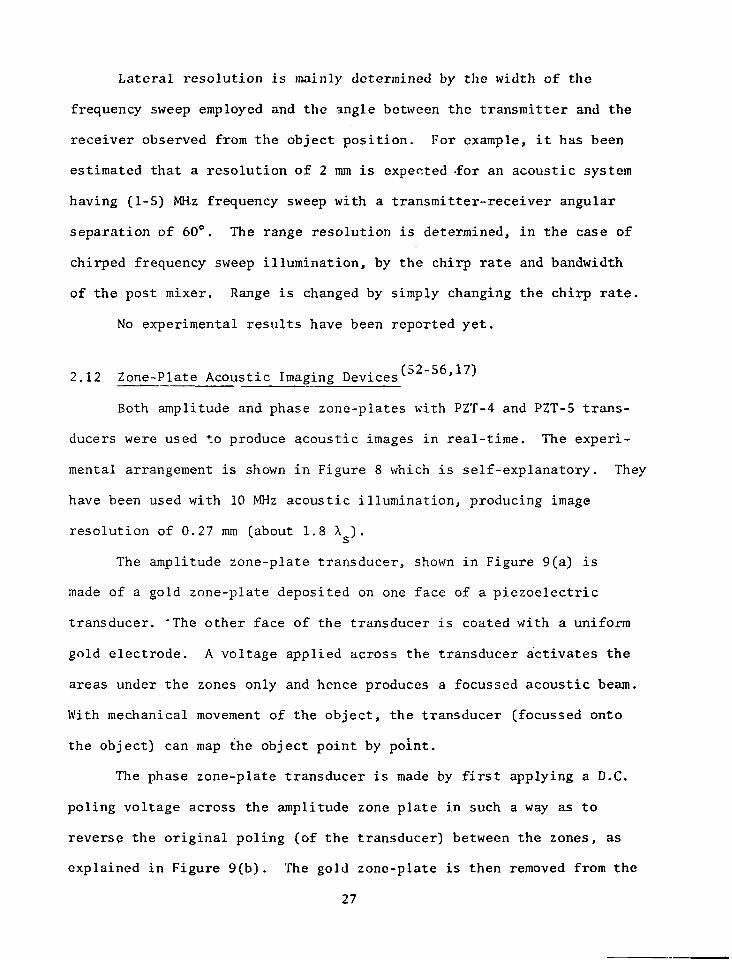
Lateral resolution is mainly determined by the width of the
frequency sweep employed and the angle between the transmitter and the
receiver observed from the object position. For example, it has been
estimated that a resolution of 2 mm is expected -for an acoustic system
having (1-5) MH.z frequency sweep with a transmitter-receiver angular
separation of 60". The range resolution is determined, in the case of
chirped frequency sweep illumination, by the chirp rate and bandwidth
of the post mixer. Range is changed by simply changing the chirp rate.
No experimental results have been reported yet.
2.12 Zone-Plate Acoustic Imaging Devices (52-56,17)
Both amplitude and phase zone-plates with PZT-4 and PZT-5 trans-
ducers were used to produce acoustic images in real-time. The experi-
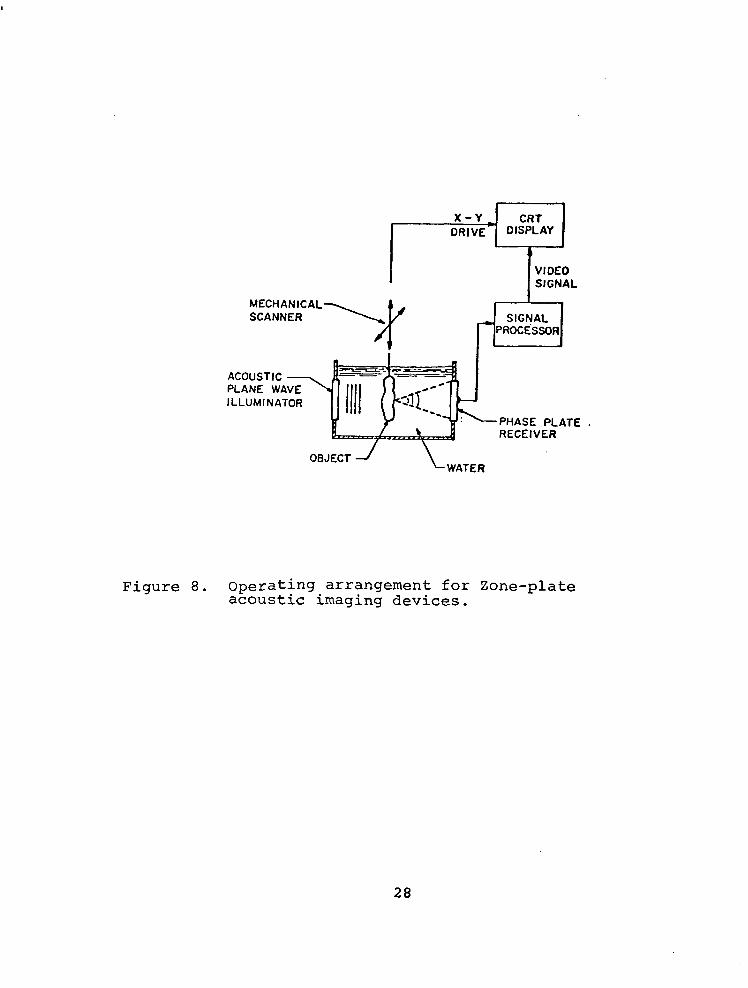
mental arrangement is shown in Figure 8 which is self-explanatory. They
have been used with 10 MHz acoustic illumination, producing image
resolution of 0.27 mm (about 1.8 hs).
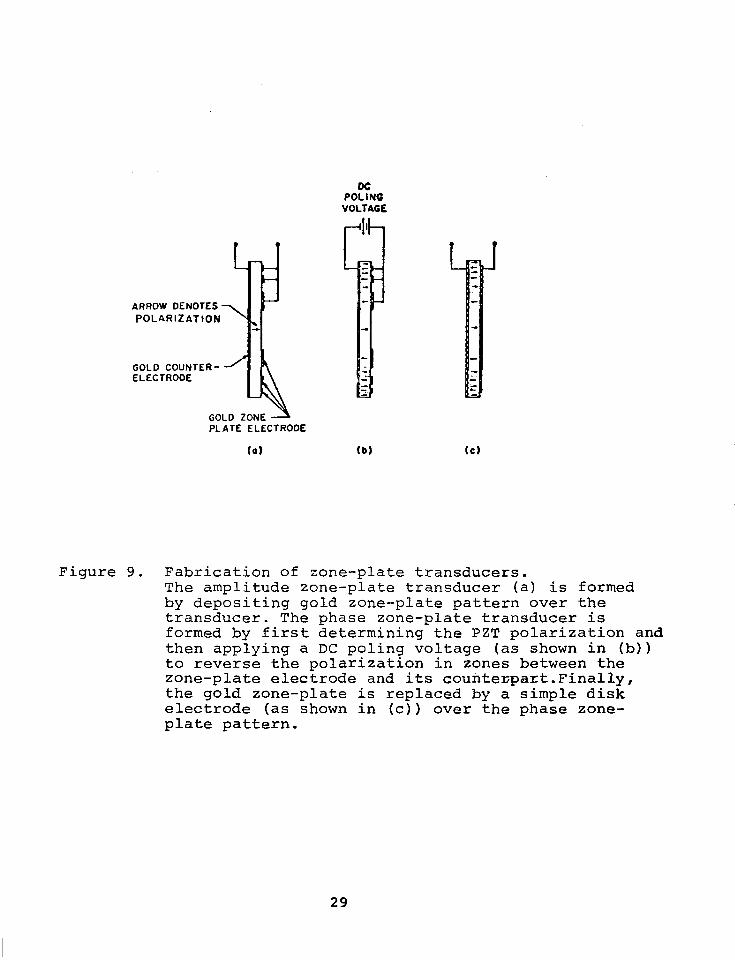
The amplitude zone-plate transducer, shown in Figure 9(a) is
made of a gold zone-plate deposited on one face of a piezoelectric
transducer. -The other face of the transducer is coated with a uniform
gold electrode. A voltage applied across the transducer activates the
areas under the zones only and hence produces a focussed acoustic beam.
With mechanical movement of the object, the transducer (focussed onto
the object) can map the object point by point.
The phase zone-plate transducer is made by first applying a D.C.
poling voltage across the amplitude zone plate in such a way as to
reverse the original poling (of the transducer) between the zones, as
explained in Figure 9(b). The gold zone-plate is then removed from the
27
I 1
PHASE PLATE .
OBJECT J WATER
Figure 8. Operating arrangement for Zone-plate acoustic imaging devices.
28
oc POLING
VOLTAGO
ARROW DENOTES 7 POLARIZATION
t GOLD ZONE
GOLD COUNTER- 1 ELECTRODE
PLATE ELECTRODE
(0) (b) (cl
Figure 9. Fabrication of zone-plate transducers. The amplitude zone-plate transducer (a) is formed by depositing gold zone-plate pattern over the transducer. The phase zone-plate transducer is formed by first determining the PZT polarization and then applying a DC poling voltage (as shown in (b)) to reverse the polarization in zones between the zone-plate electrode and its counterpart.Finally, the gold zone-plate is replaced by a simple disk electrode (as shown in (c)) over the phase zone- plate pattern.
29
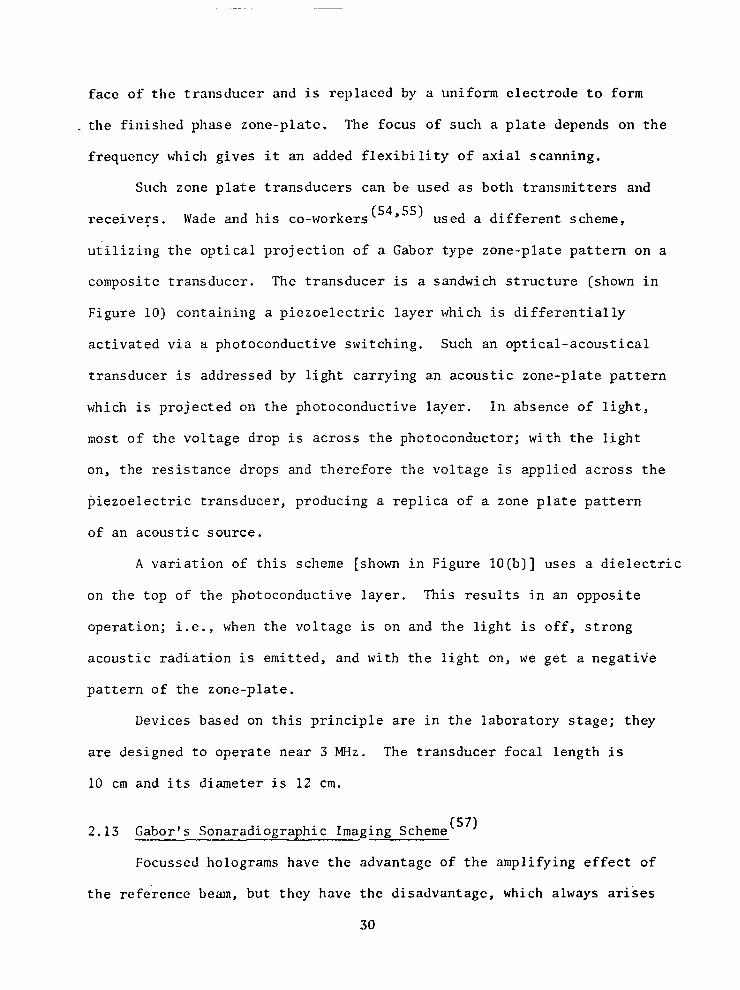
face of the transducer and is replaced by a uniform electrode to form
_ the finished phase zone-plate. The focus of such a plate depends on the
frequency which gives it an added flexibility of axial scanning.
Such zone plate transducers can be used as both transmitters and
receivers. Wade and his co-workers (54955) used a different scheme,
utilizing the optical projection of a Gabor type zone-plate pattern on a
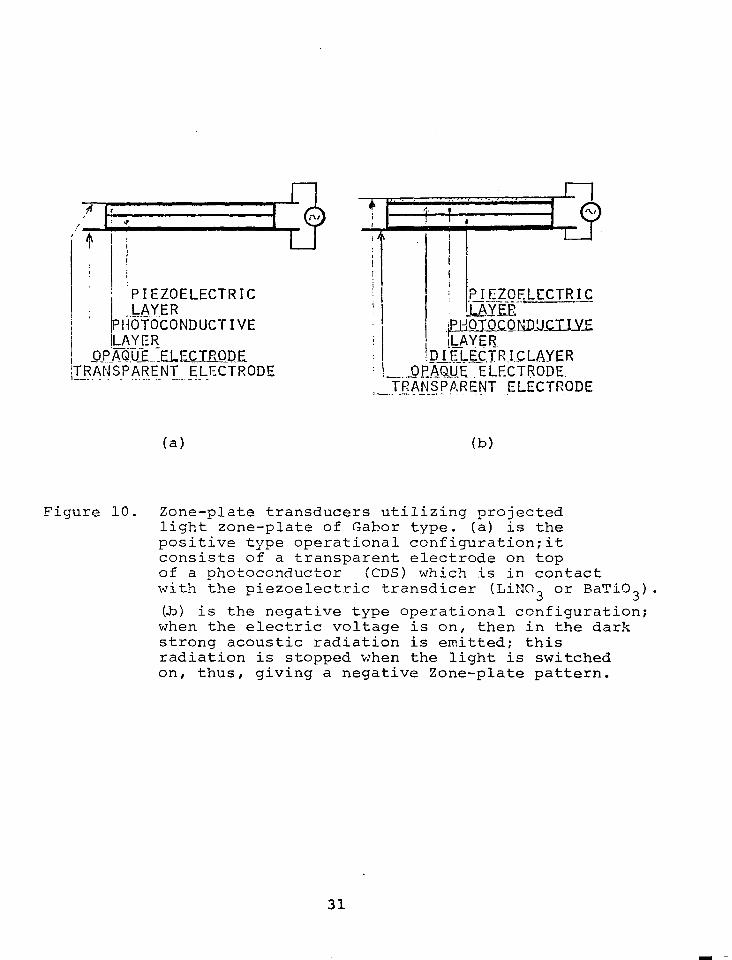
composite transducer. The transducer is a sandwich structure (shown in
Figure 10) containing a piezoelectric layer which is differentially
activated via a photoconductive switching. Such an optical-acoustical
transducer is addressed by light carrying an acoustic zone-plate pattern
which is projected on the photoconductive layer. In absence of light,
most of the voltage drop is across the photoconductor; with the light
on, the resistance drops and therefore the voltage is applied across the
piezoelectric transducer, producing a replica of a zone plate pattern
of an acoustic source.
A variation of this scheme [shown in Figure 10(b)] uses a dielectric
on the top of the photoconductive layer. This results in an opposite
operation; i.e., when the voltage is on and the light is off, strong
acoustic radiation is emitted, and with the light on, we get a negative
pattern of the zone-plate.
Devices based on this principle are in the laboratory stage; they
are designed to operate near 3 MHz. The transducer focal length is
10 cm and its diameter is 12 cm.
2.13 Gabor’s Sonaradiographic Imaging Scheme (57)
Focussed holograms have the advantage of the amplifying effect of
the reference beam, but they have the disadvantage, which always arises
30
i I j i I I i
i :PIEZOELECTRIC ; ’ ..LAY.ER
PIlOTOCONDUCTIVE
/ $&$!&JXTPOD_F -L... 5 jIJ,-$jSPARENT ELECTRODE . . -.-- - ._.. OPAQUE .ELECTRODE. I_-_ .- -_.- .-._.
TPANSPARFNT J&ECTR.ODE I__ -.:--- _,.. ‘-.
(a) (b)
Figure 10. Zone-plate transducers utilizing projected light zone-plate of Gabor type. (a) is the positive type operational configuration;it consists of a transparent electrode on top of a photoconductor (CDS) which is in contact with the piezoelectric transdicer (LiNO 3 or RaTi.03). 03) is the negative type operational configuration;
when the electric voltage is on, then in the dark strong acoustic radiation is emitted; this radiation is stopped when the light is switched on, thus, giving a negative Zone-plate pattern.
31
in the case of coherent sound, of very strong speckle noise.
To eliminate this speckle noise, acoustic imaging should use one
of the following techniques :
(4
(b)
cc>
Incoherent acoustic waves.
Cut out all the sections other than just the one from
which the signal is detected. This can be accomplished by
the electronic focussing and scanning (section 1.10) or
zone-plate devices (section 1.12) .
Sonaradiography (as outlined below) where only one section
in the depth of the object is isolated and imaged.
The scheme proposed by Gabor is based on producing holograms with very
short single acoustic pulses. When such a pulse is scattered by a point
object, the scattered wave will produce on an intervening membrane a
rapidly spreading ring-shaped fine ridge. If then we illuminate the
membrane with a high frequency stroboscopic laser light source for a
short interval, the trace of the spreading ring will appear exactly
like the hologram of a point object (a system of Fresnel zones), which
can then be.photographed and reconstructed. By proper gating we can
then make holograms of any section within the object. Since the acoustic
pulse used for illumination is very sharp, no speckles wi 11 appear in
the hologram.
This scheme was intended for use in medicine, but there is no
reason why it cannot be used for industrial NDT. Unfortunately, the
work on this idea was terminated without satisfactory conclusion.
32
2.14 Acoustic Tomography
Tomography (well known among x-ray radiographers) is the technique
by means of which a sharp image of one section of the object is obtained
by moving the illuminating source and the recording plane in opposite
direction. The section to be imaged depends on the relative positions
of the source, the object and the recorder. This technique is well
known among medical diagnosticians, but we believe that it can be
extended to material NDT. However, careful study of such a possibility
has not been done during the course of this contract.
2.15 Piezoresistive Image Converter (59,601
One difficulty with the piezoelectric face tube (Sokolov type,
section 1.6) is the lack of extended grey scale in the image. It is
difficult, with these tubes, to present more than S-10 distinct shades
of grey. To overcome this difficulty, piezoresistive materials [like
CdS (Cu)] may be used. Such materials have a wide range of acoustic
frequencies as opposed to the resonant frequency and odd harmonic
response of the piezoelectrics. They also have high resistivity and
have the capability of information storage, since the piezoelectric
transducer presents to the scanning 'electron beam a signal proportional
to the acoustic intensity incident at the moment of scan, while the
storage system (using piezoresistive transducer) presents all the
accumulated signals since the last scan. This can then lead, in theory,
to significant improvement in sensitivity, in addition to the freedom
to use pulsed acoustic illumination. Sensitivity of the order of 10 -7
W/cm2 has been reported.
33
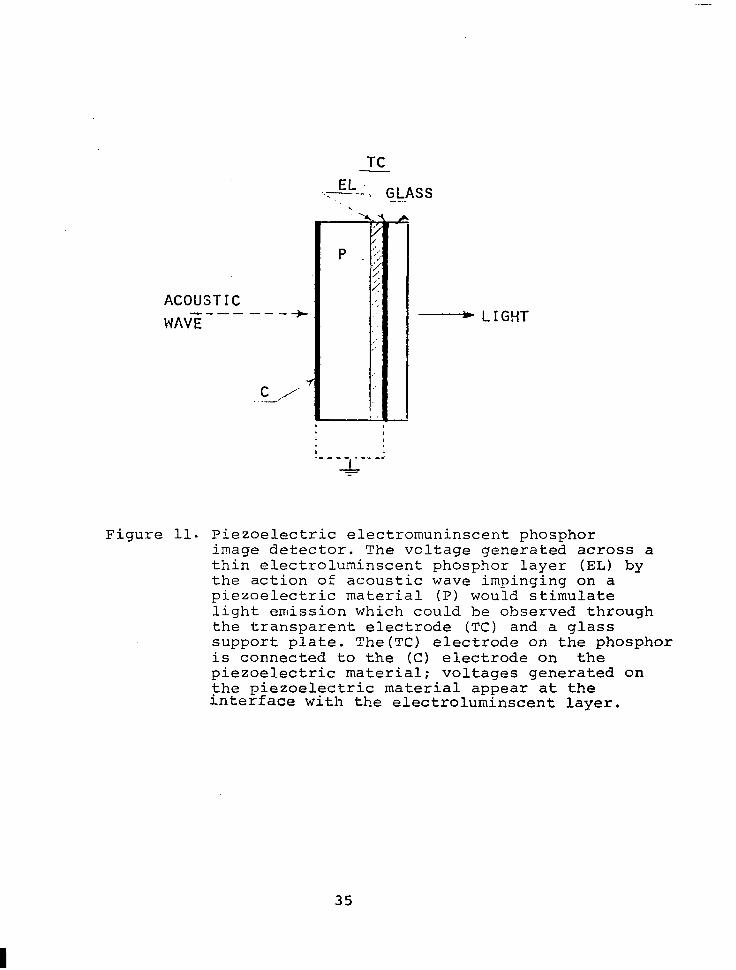
2.16 * Electroluminescent Acoustic-Image Detector (61)
Such a detector combines a .piezoelectric and electroluminescent
layers in contact, as shown in Figure 11. The thickness of the electro-
luminescent layer, together with proper simulation for luminescence
such as bias voltage or UV illumination, are important in yielding a
phosphor which could be stimulated by the piezoelectric voltage generated.
Threshold sensitivity in the order of 10m6 to 10 -7 W/cm2 has been re-
ported. However, activities in this field are practically at a stand-
still.
2.17 Photographic and Chemical Direct Acoustic Recording (61,621
Although none of the direct recordings of acoustic images by
photographic or chemical recording are presently in use (mainly because
of their relative low sensitivity, which is of the order of 1 W/cm”)
they are briefly surveyed in this section since they were part of our
s tudy . Hereunder is a summary of our findings based mainly on ref. (62).
Ultrasound can be detected by means of the direct action of ultra-
sound energy on a photographic emulsion and because ultrasound accelerates
or causes some chemical reactions. The fact that ultrasonic radiation
influences a photographic emulsion was reported in 1933 by Marinesco
and Trui 1 let (64) . Subsequent studies by other investigators still have
not clearly revealed the exact mechanism involved. The analysis by
Bennett (65), in which he showed that luminescence and pressure effects
did not appear to explain all the existing facts, remains a good dis-
cussion of this situation. Although Bennett indicated rather conclu-
sively that the softness of the photographic emulsion was a very
34
TC
EL GLASS ..7-.-- \
ACOUSTIC ---- I- -*
WAVE
c, ‘I A’.
-. 4 P .;:
5 i
I ,.’ ,’
.
- LIGHT
Figure 11. Piezoelectric electromuninscent phosphor image detector. The voltage generated across a thin electroluminscent phosphor layer (EL) by the action of acoustic wave impinging on a piezoelectric material (PI would stimulate light emission which could be observed through the transparent electrode (TC) and a glass support plate. The(TC) electrode on the phosphor is connected to the (C) electrode on the piezoelectric material; voltages generated on the piezoelectric material appear at the l.nterface with the electroluminscent layer.
35

important factor in its response to ultrasound, he stated in his con-
clusion that "there is not sufficient evidence to delineate clearly the
mechanism, whether thermal, mechanical or otherwise". Bennett's work
did indicate that the photographic speed of the film emulsion had little
effect on the result (his tests included film speeds for tungsten from
less than 10 to 160).
The softness of the emulsion has been shown to be a significant
factor for the film detection of ultrasound. Film exposed in the dark
to ultrasound and developed in the normal manner will yield a useful
image with an exposure time of about 4 hrs for an ultrasonic intensity
of 1 W/cm2. If the temperature of the film is raised from 20' to 28'C,
a significant exposure improvement factor can be obtained. If the
emulsion is soaked in water at room temperature prior to exposure, a
factor of about four times less exposure can be used (66) . Both these
improvements were reported to be based on the fact that the emulsion
was softened.
These photographic film methods of course require darkroom tech-
niques. There are other photographic methods which do not. One involves
the ultrasound exposure of film in an iodine solution (661 . The effect
of the ultrasound exposure on the emulsion is to render the emulsion
resistant to fixing to an extent proportional to the exposure. The
image becomes visible during the exposure because the emulsion turns a
darker yellow color.
The image can be made visible more easily after completion of the
exposure by fixing the film for a short time (for example, 1 min in Kodak
liquid X-ray fixer and replenisher) in order to clear the unirradiated
36
emulsion. The remaining emulsion then displays the sound pattern hy a
yellow color against the clear background. Those areas of greatest
exposure remain essentially yellow, while in areas of intermediate
exposure the emulsion is partially cleared. There is therefore some
grey scale in the image. This detection method can be used in the light
since the exposed film is not developed and light appears to have little
influence on the fixing of the emulsion.
A second photographic method which can be performed in the light
involves the ultrasound exposure of photographic film or paper in a
(67,68) developer solution . The uniformly light-exposed emulsion develops
more quickly in areas where the ultrasonic intensity, and therefore
agitation of the developer, is highest.
A thorough study of this technique with photographic paper has
been made and reported by Arkhangel'skii and Afanas'ev (68) . They found
that one could obtain a maximum paper density contrast in the exposed
areas for a developer concentration of 0.2, an exposure time of 90-110
set, and an ultrasonic intensity of 0.15-0.25 W/cm" for photographic
paper No. 6. The threshold sensitivity was reported to be 0.05 W/cmL
for a high developer concentration and an exposure time of 40 sec.
Exposure times could not be too long or the paper would develop completely.
A practical aspect of the developer and photographic paper study
by Arkhangel'skii and Afanas'ev is that they devised a thin detector cell
containing developer solution and paper. The cell had ultrasound trans-
mitting windows of thin (0.15 mm) rubber and allowed a space of 2 mm
inside *he cell for the paper and developer solution. In this manner
the need for a large tank containing developer solution as the exposure
37
tank was eliminated.
The same authors also studied the resolution characteristics of
the photographic paper method. The resolution is determined by the
transverse diffusion of the developing solution in the photolayer and
by the presence of nonuniform streaming. This latter effect leads to
distorted and by the presence of nonuniform streaming. This latter
effect leads to distorted images because fresh developer is directed
along the ultrasonic field by the acoustic wind. The rubber-covered
detector cell tended to eliminate.some of this problem. Assuming that
the streaming problem could be eliminated, the authors indicated that
the resolution of the detector could be in the range of 0.01 mm.
One chemical detection method that has been studied by a number
of investigators involves potassium iodide-starch solutions (69,70,71-73) .
Under ultrasonic irradiation air-filled water undergoes an oxidizing
reaction to form H202, which tends to discolor organic dyes. For example,
the potassium iodide-starch solution tends to turn blue. Rust et al. (71)
used this phenomenon to detect ultrasound images by making an array of
boxes containing this solution. Each liquid-filled box tended to darken
depending upon the ultrasonic intensity. Darkening also depended upon
the iodine concentration and the exposure time.
The individual liquid-filled boxes had to be at least one wave-
length in depth for optimum results. The threshold ultrasonic intensity
was reported to be 0.5-1.0 W/cm2. At that intensity exposure times were
only about 2 min. The threshold intensity could be lowered to a value
as low as 0.07 W/cm2 if small amounts of aliphatic chlorides such as
Ccl4 or chloroform were added to the solution (70) .
38
A similar method suggestpd by Bennett (69) called for the exposure
of films of starch on glass plates in an iodine solution. Ilere too a
blue color was produced in areas of higher ultrasound intensity. Expo-
sure times of about 2 min at 1 W/cm 2 - were common.
A number of other chemical techniques involving more complicated
organic dyes have also been investigated (74,75) . Recently, a new photo-
polymer material for optical hologram recording was announced (76,771 .
It is grainless, exhibits 100% diffraction efficiency, irreversible,
can be overmodulated, no wet processing is needed, and permits the dif-
fraction efficiency to be preadjusted for a variety of desired angular
responses and spatial frequencies. It is, however, not very sensitive
(slower than 649F emulsion) and displays poor low spatial frequency
response. The material is photopolymerizable, sensitized in the blue-
green spectral region with a dye sensitizer; thus it can be exposed
for all the argon-ion laser wavelengths. It can be coated on glass or
film base with thickness from a few micrometers to several hundred
micrometers. A typical hologram was recorded on this material with 3:l
reference to object beam ratio, in 30 seconds using 12.8 mW/cm'.
The material is still under development and is being.tested in
various optical laboratories.
However, nothing is known about the response of this material to
acoustic radiation or electron beams. Thus its use for acoustic record-
ing seems at the present to be limited to systems where the acoustic
image is converted to an optical image (first as, for example, in Gabor's
scheme, or with piezoelectric-electroluminescent devices, etc.). Ilowever,
with its present low speed characteristic, it is doubtful that it has use
39
in acoustic image recording, except in special cases.
2.18 Solid and Liquid Crystal Acoustic Displays (78-82)
Crystalline solid, thin layer of CoC12 .6H20 was used to demonstrate
its capability to visualize acoustic images. The concept is based on
the well known fact that acoustic waves projected on a suitable absorb-
ing material is converted into a corresponding thermal map of the acoustic
image. Since the color of cobalt chloride crystal layer depends on its
crystal structure, and this is a function of its local temperature, dif-
ferent ultrasonic intensities show up in various colors, starting from
pink, then blue, and ending in white. The interest in such solid crys-
tals as acoustic field detectors has been only an academic curiosity.
On the other hand the interest in liquid crystals is more than
academic. It is practical and progressive development of these crystals
and their potential use as real-time acoustic image display devices is
carried out in various laboratories. The optical properties of these
crystals resemble those of crystalline solid.
Liquid crystals are usually divided into smectic, nematic and
cholesteric, depending on the arrangement of the molecules and their
degree of rotational freedom. Only the nematic and cholesteric types
were used as acoustic to optic converters Several cholestric materials
were tried as acoustic area detectors. These attempts were based on
thermal mapping of spatial temperature variation on an ultrasonic
absorber irradiated by the acoustic field (79) . Most of the problems
with cholesteric liquid displays is that they have limited resolution
(which is a function of the thickness of the substrate) and poor sensi-
tivity. Microencapsulation in coating materials of high acoustic
40
propcrtics and using an acoustic impedcncc close to that of the capsula-
ted cholestric liquid crystals has been suggested to improvo the resolu-
tion. Ultrasonic holograms were recorded with cholesteric liquid crystal
area detectors, by properly thermal balancing of the liquid crystals,
and by using a transparent acoustic absorber in specially constructed
black bottom tank(84). In spite of such demonstration of the use of
cholestric liquid crystals in acoustic holography, such method is more
of a scientific than a practical importance, since the acoustic intensity
used was 8.1 W/cm2 at a frequency of 5 MHz. Improvement of the sensi-
tivity (may be by an order of magnitude) would, however, mean the need
for an ambient temperature regulation to lo-' degrees which rules the
scheme out for any practical use.
Better schemes for using liquid crystals exploit the five electro-
optical effects which have been observed in certain types of nematic
liquid crystals, all of which may perhaps be influenced by an ultra-
sonic field. Based on these electro-optical effects, the following
suggestions were made to design liquid crystal displays.
2.18.1 Dynamic Scattering
When an electric field is applied, the liquid crystals become
milky white and opaque. This dynamic scattering is due to the
interaction of charge carriers and the dipole moment of the
nematic liquid crystal molecules. Since ultrasonic fields
influence the electric conduction, the dynamic light scattering
may be affected and the changes taking place could be used for
(78) acoustical imaging displays .
41
2.18.2 VoItagc Controlled Optical Activity
A thin layer of twisted nematic liquid crystals is sandwiched
between two glass plates, each provided with conductive coating.
The molecules of the liquid crystals are turned 90“ in going
from one glass plate to the other with no electric field ap-
plied. When linearly polarized li-ght is incident perpendicular
to one side, its plane of polarization will rotate along the
twist axis of the nematic molecule a total of 90” as the light
is transmitted to the other side. On the other hand, when an
electric field is applied across the cell, the liquid crystal
molecules are rearranged so that their orientation no longer
shows a continuous twist of 90’ and so light will pass through
the cell. Knowing that static electric fields and acoustic
fields may interact, such interaction could be used to develop
an acoustical-to-optical display.
2.18.3 Guest-host Interaction
A dichroic dye molecule is introduced as a “guest” into the
crystalline “host” nematic liquid crystal. The orientation
of the dye molecules and their optical absorption are controlled
by applying an aligning electric field. Since the optical
absorption properties of certain dyes are influenced by acoustic
radiation, a real-time acoustical-to-optical display screen may
be reconstructed.
42
2.18.4 Bircfringent Properties
Phase deformation in vertically aligned liquid crystal
(specially prepared) shows up in their light transmission
properties, .as was observed by Schickel and Fahrensohn of AEG-
Telefunken. Contrast ratio of 1OOO:l have been achieved using
only 7-10 volts. The orientation of the liquid crystals can be
influenced by an acoustic wavefront and hence the latter may be
visualized.
It is to be emphasized that none of the above suggested schemes have
been tested.
Other tested schemes are presented below.
2.18.5 Direct Acousto-Optical Effects (78)
Propagation of acoustic waves in nematic liquid crystals
-causes turbulent motion of these crystals, and this leads to
dynamic optical scattering in the liquid crystal layers (in the
absence of any electric field). This was demonstrated (78) by
bonding an array of 10 MHz PZT-4 acoustic transducer to the
back of a liquid crystal cell. When the transducers were
switched on, the liquid cells in contact with them turned milky.
It was found that the sensitivity of such a cell can be in-
creased by proper biasing with an electric field (85) . Appendix A,
pp. A-13 describes a successful design of such an acousto/optic
liquid crystal display screen (80) .
43
II
Although image quality of liquid crystal devices are quite poor,
the existing interest in such devices is motivating many researchers
to pursue their work with optimism.
New results will be reported at the Acoustical Holography
Symposium #7 at Chicago, Illinois (August 1976) by J. L. Dion, of
Canada, on the use of homeotropic nematic liquid crystal cells having
sensitivity better than 10 -6 W/cm* independent of the frequency in the
range of 1 to 10 MHz.
2.19 Pohlman Cell (86,87)
This cell is described in Appendix A, pp-13. Poh lman announced
the idea in 1939(86) and then demonstrated its use in 1948 (87) . To
improve the contrast of acoustic images detected by these cells,
Van Valkenburg (88) applied a small bias voltage (typically 25-30 V AC)
across the cell. The voltage tends to align the flakes so that no light
is reflected in the absence of ultrasound. Results were shown (881 using
5 MHz. Such cells, however, gave way to other techniques of acoustic
imaging, because of its poor relative resolution and sensitivity (10 -1
to 10 -3 W/cm* with reaction time L 1 sec., and 2.8x10 -7 W/cm* with ex-
pected reaction time of the order of minutes). It also has a limited
dynamic range of 20 dB.
2.20 Oil, Thermoplastic and Photoplastic Films (88,89,90,110)
All these detectors are used after converting the acoustic image
into an electronic one and focussing the electrons on one of these
materials.
44
A thin oil .film is used to coat an optically flat glass plate in
vacuum. The electrons, writing on the oil film, are attracted by a
high voltage on the glass plate, causing the oil surface to deform,
which in turn results in varying the thickness of the oil film. The
deformed film is then read out optically by using a phase modulation
scheme, and an optical image is projected.
Thermoplastic film is very similar to the oil film. A thin layer
of low-melting-poi'nt elastic is coated on a transparent conducting film.
The film is written on by an electron beam and heated to the softening
point of the plastic coating. The electrons are attracted by a high
voltage on the conducting backing and produce thickness variation in, a
manner similar to that of the oil film. After cooling, the plastic
hardens, and thus a permanent record is available.
Photoplastic is very similar to thermoplastic, except that it is
also a photoconductor. The surface of the photoconductor is charged,
and, at points where light strikes the photoconductor, the charge leaks
through to the conducting layer on the base. The remaining charge
causes deformation when the photoplastic is softened by heating in the
same way as with thermoplastic. This material is better than the
thermoplastic because it does not require vacuum; however, it is less
sensitive.
All of these materials require complex and expensive material in
addition to their low sensitivities 0.1 - 1 W/cm* and hence they cannot
compete with other detectors. *
* For recent advances, see Ref. B.
45
2.21 Scanning snd Sampling Technique (91-!)5) -
flistorically the first acoustic holograms were recorded (either
in air or water) by scanning a small microphone (in air) or piezoelectric
detector (in water) over the hologram plane. The signal then modulates
the intensity of a CRT electron gun, or a small neon bulb focussed on a
photographic plate. The CRT electron beam or the neon bulb move in
synchronism with the ac0usti.c detector at a slow speed to produce an
optical hologram properly demagnified. There have been a variety of
arrangements of this technique, one of which gives a sampled hologram
which can be constructed by a computer (96) , another by keeping the de-
tector stationary and scanning with the insonifying sollrce (what is
known as reciprocal hologram (104,104)) > a third by scanning both the
source and the detector simultaneously with the same or different rela-
tive speed to produce a synthetic aperture hologram (105,106) , a fourth
approach produces a phase only hologram (107) , etc.
The literature is full of such techniques. The scanning is done
mechanically and thus it is very slow and for this particular reason it
is rarely used. However, if a mosaic of detectors are made to sample
the field in parallel, then it can produce a hologram almost instanta-
neous ly . However, the reconstruction or computer data reduction limit
the speed of the process to obtain the final visual image. Such s ch emes
are superceded presently with the more sophisticated techniques described
in previous sections (e.g., electronically focussed and scanned piezo-
electric transducers, Bragg cells, rippled surface, etc.).
2.22 Recent Developments (yet to be published)*
Takuso Sato used a rotating random phase disk behind the object
to detect the signal by a fixed receiver placed far from the disk, thus
transforming the spatial distribution of the wave intensity of the
object waves to be reconstructed into a temporal distribution. This
idea eliminates the need for a scanning receiver or phased array
receivers.
Hitachi Ltd. of Japan will announce soon a shear wave focussed
image holography system for sizing vertical and oblique flaws and
defects in metal structures. The system utilizes acoustical holographic
interferometry in the focussed image hologram mode. The image of an
internal flaw consists of interference fringes or contour lines across
the flaw's surface. The fringe separation represents half wavelength
deviation in depth from the scanning plane, and the length of the fringe
corresponds to the width of the flaw. Thus one can estimate the size
of the flaw by measuring the number and length of the fringes which
appear on the focussed image hologram.
In an effort to suppress the effects of object vibrations, changing
temperature, and other external infouences, H. J. Shaw applies the
principle of differential phase contrast imaging where comparison is
made between the phases of adjacent points on the object, which are
separated by a constant distance along the scan line. This is different
from the fixed reference phase contrast imaging in that the reference
and signal beams travel almost identical paths.
* It is expected that some of these accomplishments will be announced
at the Acoustical llolography Symposium #7 (Aug. 1976).
47
II III I
Rcsl-time imaging with shear waves and surface waves, using the
FM chirp focusscd phase array and tilting the ,array past the critical
angle for longitudinal waves in the target block, shows a 5 mm defini-
tion in the normal direction and 4 mm in the horizontal direction at a
distance of 15 cm in an Al block, when the acoustic frequency was 1.8 MHz.
When the array is tilted further than the critical angle, exciting
Rayleigh waves, the resolution achieved did not change. This informa-
tion was obtained from G. S. Kino.
48
CHAPTER III
ANALYSIS, CONCLUSIONS AND RECObiMENDATIONS
49

3.1 Image Quality
Acoustic images produ red by whatever technique are far inferior
to optical images. They are not as sharp, reveal poor resolution,
distortion, noisy, and can lead to erroneous interpretation. However,
they do reveal the internal structure of the object, and not merely its
outside slrface. In comparison with x-rays, they are again, as a whole,
of less quality; but again because of the nature of interaction of
acoustic waves in the materials they give information about the inter-
faces in the tested objects, which are hidden or not evident in x-ray
pictures .
Hereunder are the main causes for limiting the quality of acoustic
images.
(a) Wavelength. -. Acoustical frequencies (normally used for non-
destructive testing (0.1 - 20 MHz) are far below the optical frequencies
(~10~~ Hz) . Naturally, then, the acoustic resolution is less than
optical ones. Indeed, imrdes obtained in acoustic microscopy where
very high frequencies (1 - 10 GHz) were used, compete very well with
optical microscopy pictures.
(b) Specular Reflection. Most of the surfaces are smooth relative
to the acoustic wavelength. This produces specular reflection and.hence
false interpretations. For example, rods may look like wires, spheres
as points, etc. Thus, care must be taken in choosing the right acoustic
frequency to insonify the object, relative to its surface roughness,
geometrical arrangement, etc.
(cl Speckle Noise. This is produced by the coherent nature of the
irradiation. It can be eliminated by using wide frequency band, large
50
aperture, very sharp pulsing for insonification, large aperture,
and/or focussed detection.
(d) Limited Aperture. In reconstructing an acoustic hologram
with visible light, the hologram dimension must be reduced by the ratio
of the acoustical wavelength to optical wavelength (Appendix A, pp. A-4)
which is of the order of magnitude of 1000; otherwise, depth distortion
is generated in the reconstructed image. A highly reduced hologram on
the other hand will be too noisy due to speckles. Other means to avoid
the demagnification of the acoustic hologram under reconstruction, and
produce an undistorted image, are (a) the use of composite holography
(discussed next); (b) ignore the depth information; or (c) resort to
direct focussed imaging (item 1.10, for example).
(e) Depth Distortion. One of the main attractions to holography
is to reconstruct the whole 3-D information about the object from one
hologram. However, \<hen there is a change between the wavelengths of
the radiation used in recording and reconstructing the hologram, the
depth of the object (in the reconstructed image) is magnified or de-
magnified relative to the other dimensions of the object. To avoid this
the hologram dimensions have to be changed (as explained above and
Appendix A, pp. A-4). This, however, may be undesirable.
Another idea to obtain undistorted.depth information, separate
images are made for various sections in the body (e.g., using a B-scan).
Transparencies of these images are then stacked and one optical hologram
of the whole stack is made optically (97 s 981 . This hologram then may be
reconstructed later with the same optical wavelength, to produce an
undistorted visible acoustic image of the object.
51
(f) Miscellaneous Artifac.ts. Interpretation of acoustic images
is sometimes hampered by artifacts peculiar to the technique used.
Scanning, for example, whether linear, circular or helical, may produce
(99 moire patterns , multiplicity of images which are not separated from
one another, etc. Diffraction fringes may appear to hinder the location
of sharp edges. Speckle noise may be confused with the roughness of the
surface.
3.2 Comparison of Various Techniques.
The various systems for visualizing acoustical images in NDT are
described in Chapter 2 and summarized in Table 1. They are also pre-
sented in a condensed form in Appendix 'A, Table A.1, pp. A-6. The
choice of a proper system depends on:
(a) type and size of object to be tested,
0) accessibility to the object (i.e., tested on site or in the
laboratory),
(c) degree of the details of the information,
(4 need for real-time information, or a record for filing,
W need for gross macroscopic information only, or gross and
fine microscopic details,
(fl whether the system is to work alone or as a complement to
other systems,
(gl whether the system has the capability of acoustical imaging
only or both acoustical and optical imaging, and
(h) the cost of the system.
52
The Bragg-diffraction system (Section 2.3) exhibits the capability
for real-time acoustic image visualization, and at the same time with
some modification, can be switched to real-time optical imaging. It is
simple and sensitive enough. However, it may be limited to testing of
medium sized objects which can be moved to the lab and placed in the
water filled Bragg cell.
For macroscopic and microscopic testing of medium sized objects,
an electronically focussed, electronically scanned piezoelectric array
(Section 2.10) offers the best technique at the present.
For large objects, a piezoelectric mosaic array may be built as a
probe to scan the object mechanically (like a stethescope). This is
similar to the technique used in medical diagnosis. Like the above two
techniques it has the capability of real-time display.
Most of the other techniques have not yet proven their practicality,
are still in the research or development stage, or incapable of real-
time display.
With the exception of Sokolov-type image converter system (Section
2.6) and the deformed water surface (static ripple) system (Section 2.2),
no other system is available commercially. Both systems, however, have
limited field of view.
3.3 Recommendations.
1. Follow up the international state of the art and new devclop-
ment in this fast moving acousto/optical imaging technique.
2. Design an acoustical system, or systems, that can be incor-
porated in the MSK hybrid system (Figure l), according to the types of
objects to be tested.
. 53
3. Analyze and design the whole hybrid system for nondestructive
testing incorporating optical, acoustical and correlation techniaues.
This includes information acquisition, storage, reduction and retrieval
in addition to the various subsystems of imaging, rectification,
enhancement, etc.
4. Study and bl1il.d a portable probe for testing large objects
on site, akin to that used in medical diagnosis (utilizing integrated
circuits (lo8)).
5. Initiate a program to study microscopic cracks and monitoring
them acoustically.
6. Initiate a study program on zone-plate acoustic imaging
devices with the possibility of using the zone-plate for both acoustical
and optical focussing.
7. Investigate more thoroughly the capabilities of acoustic
tomography (Section 2.14) and Gabor’s sonoradiography (Section 2.13).
54
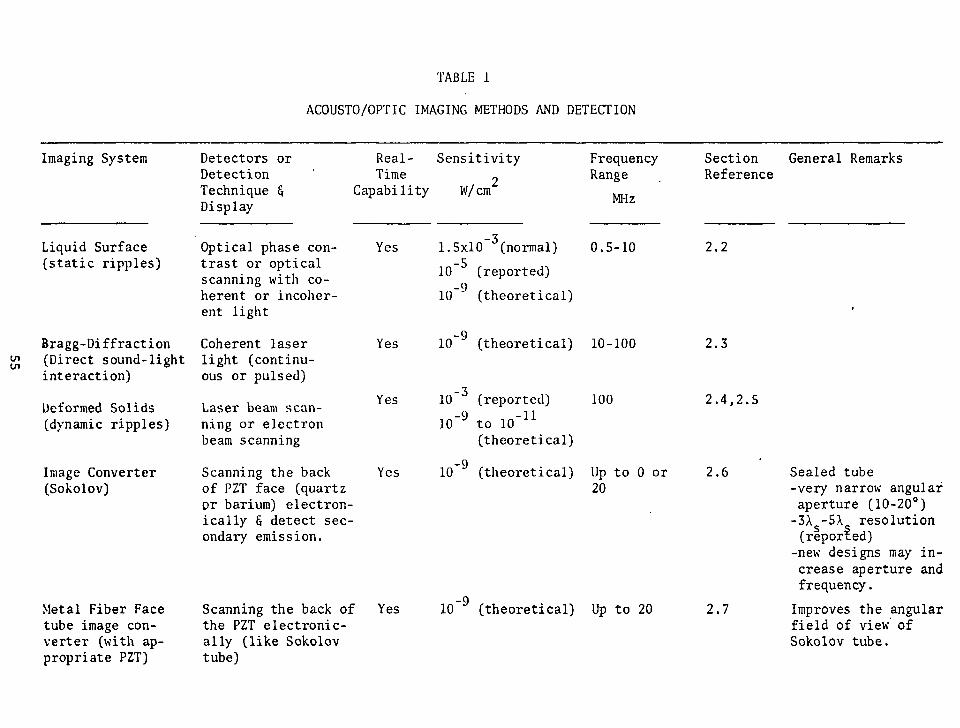
TABLE 1
ACOUSTO/OPTIC IMAGING METHODS AND DETECTION
Imaging System Detectors or Detection Technique G Display
Liquid Surface (static ripples)
Bragg-Diffraction Coherent laser E (Direct sound-light light (continu-
interaction) ous or pulsed)
Deformed Solids (dynamic ripples)
Laser beam scan- ning or electron beam scanning
Image Converter (Sokolov)
Optical phase con- trast or optical scanning with co- herent or incohcr- ent light
Scanning the back of PZT face (quartz or barium) electron- ically & detect sec- ondary emission.
Metal Fiber Face tube image con- verter (with ap- propri at e PZT)
Scanning the back of the PZT electronic- ally (like Sokolov tube)
Real - Sensitivity Frequency Section General Remarks Time 1 Range Reference
Capability W/cm‘ MHZ
Yes 1. 5x10m3 (normal) 0.5-10 2.2
lo-5 (reported) 10 -‘I (theoretical)
Yes 1o-g (theoretical) 10-100
Yes 1O-3 (reported) 100 10 -9 to lo-l1
(theoretical)
2.3
2.4,2.5
Yes 1o-g (theoretical) Up to 0 or 2.6 Sealed tube 20 -very narrow angular
aperture (10-20’) -3X -5X resolution
(r$por?ed) -new designs may in-
crease aperture and frequency.
Yes lo-’ (th eoretical) Up to 20 2.7 Improves the angular field of view’ of Sokolov tube.
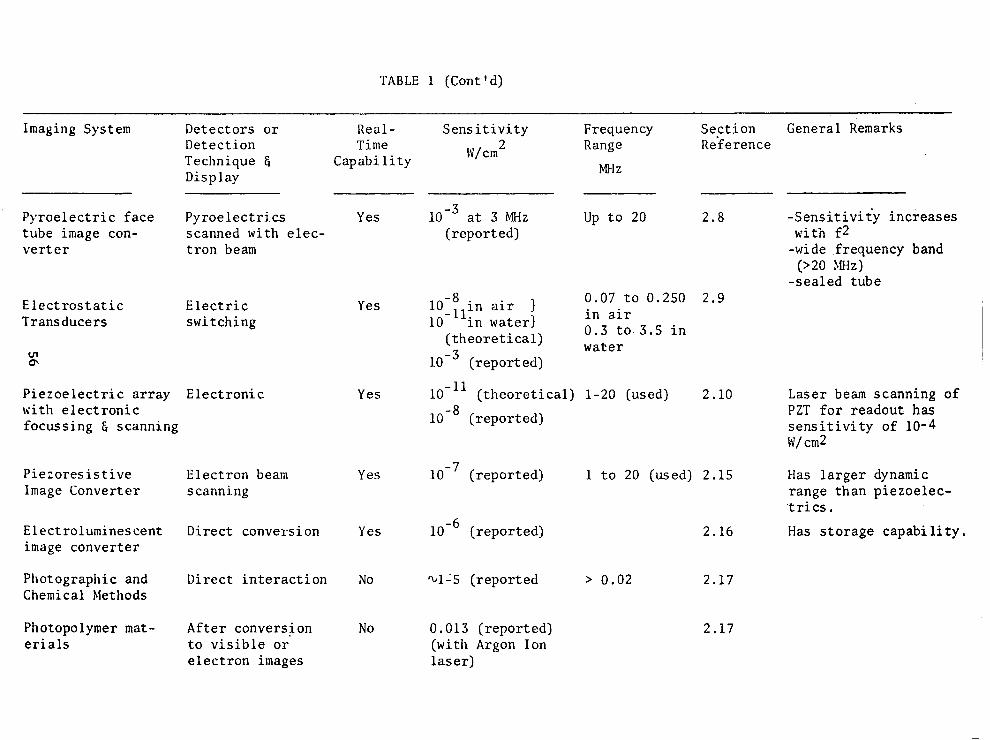
TABLE 1 (Cont ‘d)
Imaging System Detectors or Detection Technique & Display
Real - Time
Capability
Pyroelectric face Pyroelectrics tube image con- scanned with elec- vert er tron beam
Electrostatic Transducers
u-l 0
Electric switching
Piezoelectric array Electronic \<ith electronic focussing & scanning
Piezoresistive Image Converter
Electron beam scanning
Electroluminescent Direct conversion image converter
Yes
Photographic and Chemical Methods
Direct interaction No
Photopolymer mat- After conversion erials to visible or
electron images
No
Yes
Yes
Yes
Yes
Sensitivity W/cm2
Frequency Range
MHZ
Section General Remarks Reference
lo-3 at 3 MHz (reported)
up to 20 2.8 -Sensitivity increases with f2
-wide .frequency band (>20 MHz)
-sealed tube ii-11 -8 in air ) 0.07 to 0.250 2.9
in water) in air (theoretical) 0.3 to 3.5 in
water 1o-5 (reported)
lo-l1 (theoretical) l-20 (used) 1o-8 (reported)
2.10
10 -7 (reported) 1 to 20 (used) 2.15
1o-6 (reported) 2.16
~~1-5 (reported > 0.02 2.17
0.013 (reported) (with Argon Ion laser)
2.17
Laser beam scanning of PZT for readout has sensitivity of 10-4 W/ cm2
Has larger dynamic range than piezoelec- ‘tries. Has storage capabi li ty .
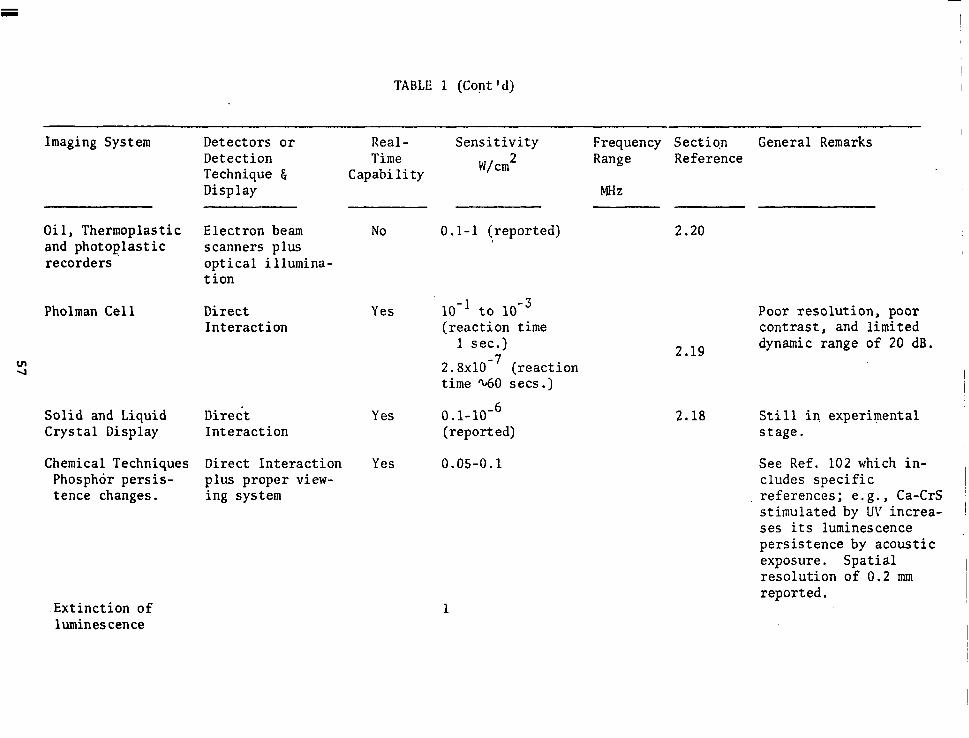
TABLE 1 (Cont ‘d)
Imaging System
Oi 1, Thermoplastic and photoplastic recorders
Pholman Cell
Solid and Liquid Direct Crystal Display Interaction
Chemical Techniques Phosphor persis- tence changes.
Direct Interaction plus proper view- ing system
Extinction of luminescence
Detectors or Detection Technique E Display
Real - Sensitivity Time
Capability W/cm2
Electron beam scanners plus optical illumina- tion
Direct Interaction
No 0. l-l (reported)
Yes 10-l to 10 -3 (reaction time
1 sec.) 2.8~10-~ (reaction time ~60 sets.)
Yes o.1-10-6 (reported)
Yes 0.05-0.1
Frequency Sectiqn General Remarks Range Reference
MHZ
2.20
2.19
Poor resolution, poor contrast, and limited dynamic range of 20 dB .
2.18 Sti 11 in experimental stage.
See Ref. 102 which in- cludes specific references; e.g., Ca-CrS stimulated by UV increa- ses its luminescence persistence by acoustic exposure. Spatial resolution of 0.2 mm reported.
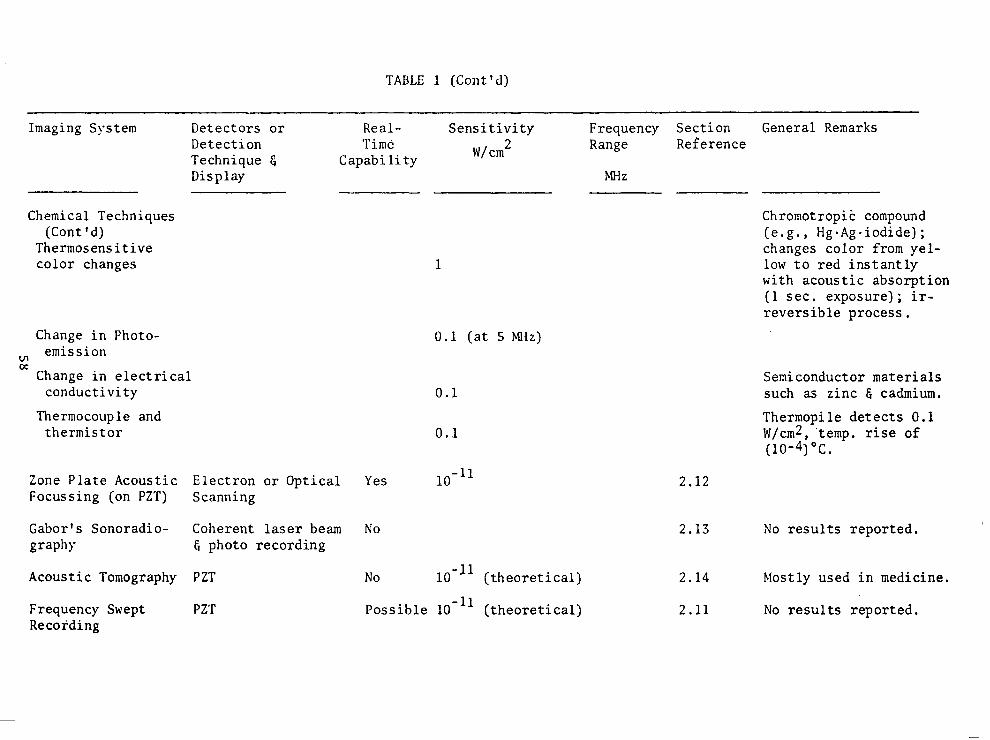
TABLE 1 (Cont’d)
Imaging System Detectors or Detection Technique $ Display
Chemical Techniques (Cont ‘d)
Thermosensitive color changes
Real- Time
Capabi li ty
Sensitivity W/cm*
Frequency Section Range Reference
MHZ
1
Change in Photo- tn emission Oc Change in electrical
conductivity Thermocouple and
thermistor
0.1 (at 5 MHz)
0.1
0.1
Zone Plate Acoustic Electron or Optical Yes 10 -11 Focussing (on PZT) Scanning
Gabor’s Sonoradio- Coherent laser beam No graphs E photo recording
Acoustic Tomography PZT
Frequency Swept PZT Recording
No lo-l1 (theoretical)
Possible 10 -” (theoretical)
2.12
2.13
2.14 Mostly used in medicine.
2.11 No results reported.
General Remarks
Chromotropic compound (e.g., HgsAgeiodide) ; changes color from yel- low to red instantly with acoustic absorption (1 sec. exposure) ; ir- reversible process.
Semiconductor materials such as zinc E cadmium. Thermopile detects 0.1 W/cm*, ‘temp. rise of (10-4) Oc.
No results reported.
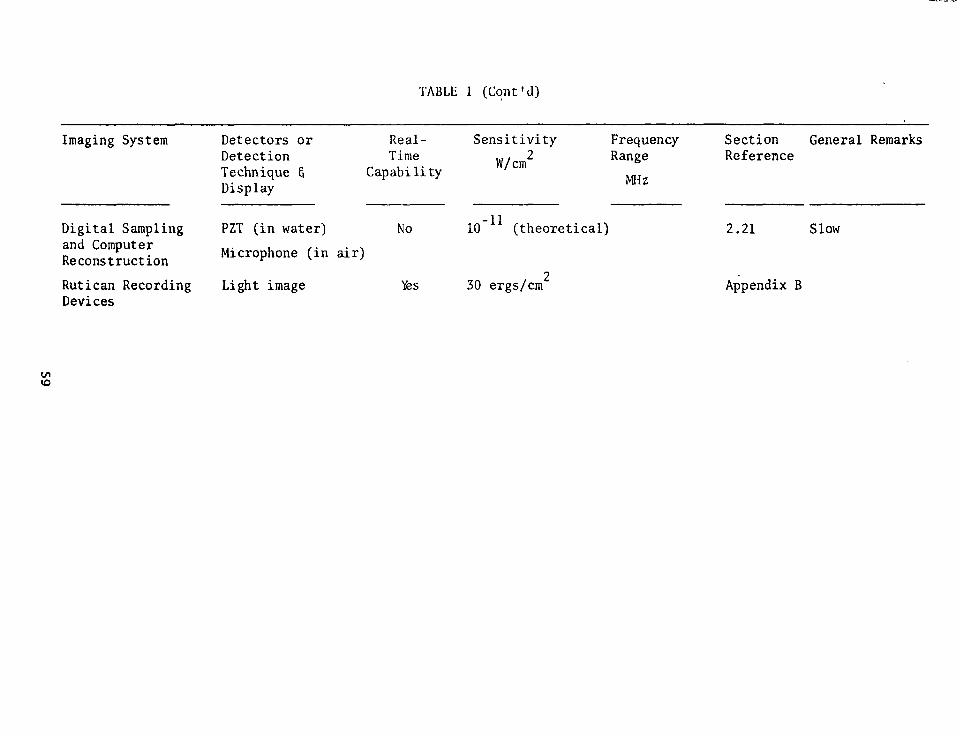
TABLE 1 (Cqnt ‘d)
Imaging System Detectors or Detection Technique & Display
Real- Time
Capabi li ty
Sensitivity W/cm*
Frequency Range
MHZ
Section General Remarks Reference
and Computer Reconstruction
Digital Sampling PZT (in water) Microphone (in air)
No lo-l1 (theoretical) 2.21 Slow
Rutican Recording Light image Yes 30 ergs/cm* Appendix B Devices
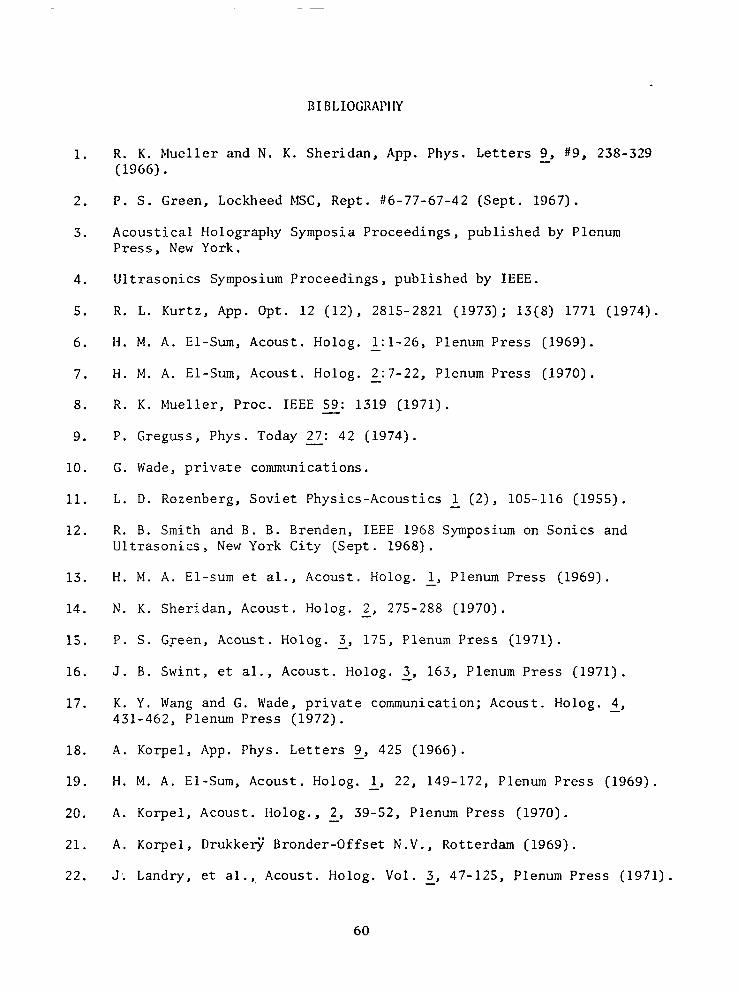
BIBLIOCRAPI1Y
1.
2.
3.
4.
5.
6.
7.
8.
9.
10.
11.
12.
13.
14.
15.
16.
17.
18.
19.
20.
21.
22.
R. K. Mueller and N. K. Sheridan, App. Phys. Letters 9, #9, 238-329 (1966).
P. S. Green, Lockheed MSC, Rept. H6-77-67-42 (Sept. 1967).
Acoustical Holography Symposia Proceedings, published by Plenum Press, New York.
Ultrasonics Symposium Proceedings, published by IEEE.
R. L. Kurtz, App. Opt. 12 (12), 2815-2821 (1973); 13(8) 1771 (1974).
II. M. A. El-Sum, Acoust. Holog. i:l-26, Plenum Press (1969).
H. M. A. El-Sum, Acoust. Holog. 2:7-22, Plenum Press (1970).
R. K. Mueller, Proc. IEEE 59: 1319 (1971). -
P. Greguss, Phys. Today 27: 42 (1974). -
G. Wade, private communications.
L. D. Rozenberg, Soviet Physics-Acoustics 1 (2), 105-,116 (1955).
R. B. Smith and B. B. Brenden, IEEE 1968 Symposium on Sonics and Ultrasonics, New York City (Sept. 1968).
H. M. A. El-sum et al., Acoust. Holog. 1, Plenum Press (1969).
N. K. Sheridan, Acoust. Holog. 2, 275-288 (1970).
P. S. Green, Acoust. Holog. 3, 175, Plenum Press (1971).
J. B. Swint, et al., Acoust. Holog. 3, 163, Plenum Press (1971).
K. Y. Wang and G. Wade, private communication; Acoust. Holog. 4, 431-462, Plenum Press (1972).
A. Korpel, App. Phys. Letters 2, 425 (1966).
H. M. A. El-Sum, Acoust. Holog. 1, 22, 149-172, Plenum Press (1969).
A. Korpel, Acoust. Holog., 2, 39-52, Plenum Press (1970).
A. Korpel, Drukkej; Bronder-Offset N.V., Rotterdam (1969).
J; Landry, et al.,, Acoust. Holog. Vol. 3, 47-125, Plenum Press (1971).
60
23.
24.
25.
26.
27.
28.
29.
30.
31.
32.
33.
34.
35.
36.
37.
38.
39.
40.
41.
42.
43.
R. A. Smith, Acoust. Ilolog., 5, 7-9, Plenum Press (1973).
R. Adler, A. Korpel and P. Desmares, IEEE Trans. on Sonics and Ultrasonics SU-15, 157 (July 1968).
L. W. Kessler, P. R. Palermo and A. Korpel, Acoust. Holog. 4, 51-72, Plenum Press (1972).
R. L. Whitman, M. Ahmed and A. Korpel, Acoust. Holog. 4, 11-32, Plenum Press (1972).
B. B. Brenden, Acoust. Holog. 2, 1-9, Plenum Press (1972).
A. Korpel, et al., Acoust. Holog. 5, 15-23, Plenum Press (1973).
R. Mezrich, D. Vilkomerson and K. Etzold, App. Optics 15 -' 1499 (June 1976).
A. Chutjian and R. J. Collier, J.O.S.A. 57, 1405 (1967). -
S. Sokolov, U.S. patent #2,164,125.
D. Fritzler,. E. Marom and R. K. Mueller, Acoust. Holog. 1, 249-256, Plenum Press (1969).
A. F. Metherell and H. M. A. El-Sum. App. Phys. Letters 11 -' 20-22 (July 1, 1967).
H. M. A. El-Sum, et al., J. Acoust. Sot. Am. 42 (4), 733-742 (Oct. - 1967).
H. M. A. El-Sum, Acoust. Holog. 2, 12-16, Plenum Press (1970).
A. F. Metherell, S. Spinok and-E. J. Pisa, Acoust. Holog. I_, 69-86, Plenum Press (1970).
J. L. DuBois, Acoust. Holog. 2, 59-68, Plenum Press (1970).
J. E. Jacobs and Donald A. Peterson, Acoust. Holog. 5, 633-645, Plenum Press (1973).
J. E. Jacobs, Trans. N. Y. Academy of Sciences, Series II, 30,.3 - (Jan. 1968).
R. C. Addison, Acoust. Holog. 5_, 659-670, Plenum Press (1973).
J. E. Jacobs, Acoust. Holog. 5, 661-669, Plenum Press (1974).
P, Buchman, Ferroelectrics 5, 39-43 (1973).
P. Alais, Acoustic llqlog. 4, 237-249, Plenum Press Ilolog. 2, 671-684, Plenum Press (1973).
61
(1972) ; Acoust.
44.
45.
46.
47.
48.
. 49.
50.
51. N. H. Farahat, IEEE Ultrasonic Proc. 75 CHO 994-4SLJ, 68-72 (1975).
52. S. A. Farnow and B. A. Auld, Appl. Phys. Letters 25, 681 (1975). -
53.
54.
55.
56. B. A. Auld, private communications.
'57. D. Gabor;Ultrasonic Imaging and Holography, 151-158, Plenum Press (1973).
58.
59.
60.
61.
62.
A. K. Nigam, et al., Acoust. Ilolog. 4, 173-194, Plenum Press (1972); Acoust. Iioldg. 2, 655-700, Plenum Press (1973).
G. S. Kino, C. DeSilets, J. Fraser and T. Waugh, IEEE Ultrasonic Symposium Proceedings 75 Cl10 994-4SU, 94-101 (1975).
W. P. Leung, R. A. Mills, H. J. Shaw, D. K. Winslow and L. Zitelli, IEEE Ultrasonic Symposium Proceedings 75 CHO 994-4SU, 84-87 (1975)'.
J. T. Walker and J. D. Meindl, IEEE Ultrasonic Symposium Proceed- ings 75 Cl10 994-4SU, SO-83 (1975).
J. Fraser, J. Howlice, G. Kino, W. Leung, H. Shaw, K. Toda, T. Waugh, D. Winslow and L. Zitelli, Acoustical Holog. 6, 275-304 (1974) .
J. F. Havlice, G. S. Kino, J. S. Kofol and C. F. Quate, Acoust. Holog. S, 317-333 (1973).
N. Takagi, T. Kawashima, T. Ogura and T. Yamada, Acoust. Holog. 4, 215-236 (1972).
S. A. Farnow and B. A. Auld, Acoust. Holog. 4, 259-273 (1972).
K. Wang, H. Shen and G. Wade, IEEE Proc. 62, 650 (1974). -
K. Wang, H. Shen and G. Wade, IEEE Ultrasonic Symp. Proc. 75 CHO-4SU, 52-56 (1975).
Y. Kikuchi, Ultrasonic Imaging and Holography, 245, Plenum Press (1973).
J. E. Jacobs, D. W. Cugell and N. V. Phan, International Conf. on Medical Electronics, Proceedings (P. L. Frommer, ed.) 21, (1961).
N. V Phan, M. S. Thesis, "The Application of T.V. Scanning Tech- niques to the Problem of Visualizing Ultrasound Images", North- western University, Evanston, Illinois (1961).
Harold Berger, ANL Report #6680.
llarold Berger, Acoust. Holog. 1, 30-34 (1969).
62
63. S. J. Sokolov, Tcchn. Physics USSR 3, 176-182 (1936).
64. N. Marinesco and J. J. Truillet, Compt. Rend. 196, 558-860 (1933).
65. G. S. Bennett, J. hcoust. Sot. Am. 25 1149-1151 (1953). -'
66. H. Berger and I. R. Kraska, J. Acoust. Sot. Am. 34, 518-519 (1962). -
67. Y. Torkikai and K. Nigishi, J. Phys. Sot. Japan 10 1110-1113 (1955). -'
68. M. E. Arkhangel'skii and V. Ia. Afanas'ev, Soviet Physics-Acoustics 3, 230-235 (1957).
69. G. S. Bennett, J. Acoust. Sot. Am. 24, 470-474 (1952). -
70. R. Haul, H. J. Studt and H. H. Rust, Angew. Chemie 62 -' 186-188 (1950) .
71. R. Haul, H. J. Studt and H. H. Rust, Naturwissenschaften 36 374- -' 375 (1949).
72. H. H. Rust, Angew. Chemie 64, 308-311 (1952).
73. P. Renaud, J. Chim. Phys. 52, 339 (1955). -
74: L. D. Soviet 105-116 Rozenberg, Phys.-Acoustics 1, (1955).
75. P. J. Ernst and C. W. Hoffman, J. Acoust. Sot. Am. 24,'207-211 (1952). -
76. W. S. Colburn and K. A. Haines, App. Optics 10 -' 1636-1641 (July 1971).
77. B. L. Booth, App. Optics 14, 593-601 (March 1975).
7s. L. W. Kessler and S. T. Sawyer, Appl. Phys. Letters 17, 440-441 - (1970),
79. J. F. Havlice, Electronics Letters L, 477-479 (1969).
so. P. Greguss, Laser and Unconventional Optics Journal #45 (published by European Abstracts Service, Goteborg, Sweden).
81. P. Greguss, Acoustica 29, 52 (1973). -
82. J. L. Ferguson, Acoust. Holog. 2, 53, Plenum Press (1970).
83. G. H. Brown, G. J. Dienes, and M. M. Labels, "Liquid Crystals", Gordon and Breach, New York (1966).
84. M. J. Intlekofer, and D. C. Auth, App. Phys. 20, 151-152 (1972). -
85. 11. Mailer, App. Phys. Letters 18 105-106 (1971). -'
63
86.
87.
88.
89.
90.
91.
92.
93.
94.
95.
96.
97.
9s.
99.
100.
101.
102.
103.
104.
105.
106.
107.
108.
R. Z. Pohlman, Physik 113,, 697 (1939).
R. Pohlman, Z. Agnew. Phys. 1, 181 (1945).
H. E. Van Valkenburg, Abstract #US, 74th OAS Meeting (1967).
J. D. Young and J. E. Wolfe, App. Phys. Letters 11, 294-296 (1967).
W. A. Penn and J. L. Chovan, Acous. Holog. 2, 168-169 (1970).
H. M. A. El-Sum, Acoustic Holography L, 14-22, Plenum Press (1969).
B. B. Brenden, Acoustic Holography 1, 65-71, Plenum Press (1969).
J. L. Kreuzer, Acoustic Holography 1, 73-95, Plenum Press (1969).
K. Preston, Jr. and J. L. Kreuzer, App. Phys. Letters 10 150-152 -' (1967).
G. E. Massey, Proc. IEEE 55, 1115-1117 (1967). -
J. W. Goodman, Acoust. Holog. 1, 173-156, Plenum Press (1969).
P. Gregus and H. J. Caulfield, Science 177, 422-424 (1972).
G. W. Stroke, Wcience 189, 994-995 (1975).
H. M. A. El-Sum, Acoust. Holog. _1, 19-22 (1969).
A. Korpel and P. Desmares, J. Acoust. Sot. Am. (Sept. 1968).
R. Adler, A. Korpel and P. Desmares, paper #3, IEEE Symp. on Sonics and Ultrasonics (Vancouver, Canada, 1967).
H. Berger, Acoust. Holog. 1, 34-36 (1969).
A. F. Metherel and H. M. A. El-Sum, Proc. Symp. Eng. Uses of Holography, Scotland, Sept. 1968 (Cambridge University Press).
H. M. A. El-Sum, Acoustical Holography, 2, 16, Plenum Press (1970).
H. M. A. El-Sum, Acoustical Holography, 2, 16-19,Plenum Press -(1970).
B. P. Hilderbrand and K. A. J-lains, Physics Letters 2, 378 (1968); and J.O.S.A. 59, 1 (1969). -
L. Larmore, H. M. A. El-Sum and A. F. Metherell, App. Opt. g,(S), 1533-1536 (1969).
M. G. Maginess, J. D. Meindl; et al., IEEE Proc. Symposia on Sonics and Ultrasonics (1973 and 1975); Acoust. Ilolog. 5, 619-631, Plenum Press (1973); Stanford Cardiac Imaging Conference (July 1975).
64
109. K. I:. lirikson, I:. J. ITry and J. 0. Jones, IEEE Trans. Sonics and Ultrasonics, SU-21 (3), 144-170, (July 1974). (This reference contains 376 rcferenccs related to Ultrasonics in Medicine.)
110. H. M. A. El-Sum, "Optical Processing of Information", 85-97, Spartan Publishers (1963).
65

I--
APPENDIX A
EARLIER STUDY OF THE PROJECT
A-l
I. INTRODUCTION
1.1 GENERAL REMARKS
The flurry of activity in acoustical imaging of the 1930's and
early 1940's, PJ3 mainly in the USSR and Europe; has been revived with
more vigour in the 1960's after the demonstrated success of optical
holography and the availability of coherent .light sources--lasers. The
dormant peri0d.i.n the work on acoustical imaging resulted mainly from
the difficulties encountered in making satisfactory acoustic lenses on
one hand, and on the other hand,from the inability to produce reliable
and/or low cost acousto-optical transducers capable of transforming the
acoustical image to a visible one.
Holography seems to alleviate these two main difficulties since,
in p.rinciple, no lenses were needed and the acoustical hologram may be
in itself considered as the acousto-optical transducer. 13341 ' Since the
early publication of the original theory of holography 151 by D. Gabor in
Great Britain, and the early work of El-Sum [6,71 in the USA, it was known
that the technique of holography can be extended to all scalar waves,
including acoustic waves. Demonstration of this was made with elec-
trons, [6,81 x-raysi7' and microwaves[" in the 1950's; however, acoustic
holograms were made about two decades later. Cl01 The delay was.mainly
due to the nonavailability of coherent light sources (lasers) and the
lack of proper practical techniques. for interfacing acoustical and optical
fields in order to render an intelligible visible picture of the acous-
tical image.
In light of the brief discussion mentioned above, we shall survey
the various categories of acoustic holography and the interfacing of the
A-2
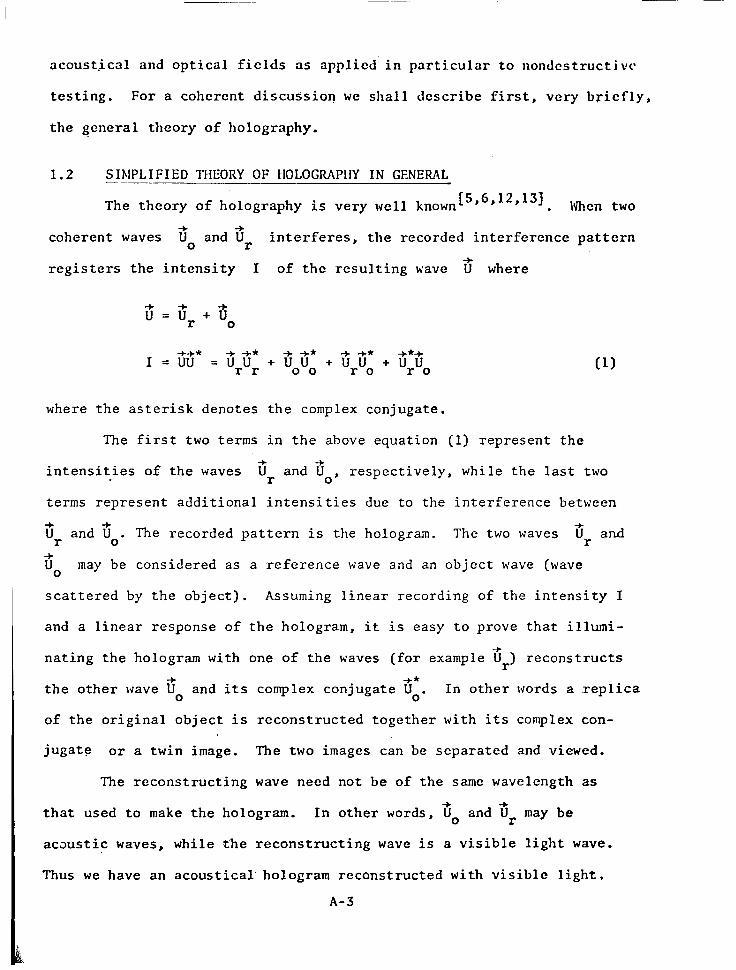
acoustical and optical fields as applied in particular to nondcstructivc
testing. For a cohcrcnt discussion we shall describe first, very briefly,
the general theory of holography.
1.2 SIblPLIFIED TJJEORY OF JJOLOGRAPIlY IN GENERAL
The theory of holography is very well known C5,6,12,131 . When two
coherent waves so and fir interferes, the recorded interference pattern
registers the intensity I of the resulting wave f where
-t +* + +* -t +* +*+ I = z* = UrUr + UoUo + uruo + 'rue (11
where the asterisk denotes the complex conjugate.
The first two terms in the above equation (1) represent the
intensities of the waves 8r and so, respectively, while the last two .
terms represent additional intensities due to the interference between
cr and co. The recorded pattern is the hologram. The two waves cr and
ijO may be considered as a reference wave and an object wave (wave
scattered by the object). Assuming linear recording of the intensity I
and a linear response of the hologram, it is easy to prove that illumi-
nating the hologram with one of the waves (for example cr) reconstructs
the other wave co and its complex conjugate "i. In other words a .replica
of the original object is reconstructed together with its complex con-
jugate or a twin image. The two images can be separated and viewed.
The reconstructing wave need not be of the same wavelength as
that used to make the hologram. In other words, do and cr may be
acoustic waves, while the reconstructing wave is a visible light wave.
Thus we have an acoustical hologram reconstructed with visible light,
A-3
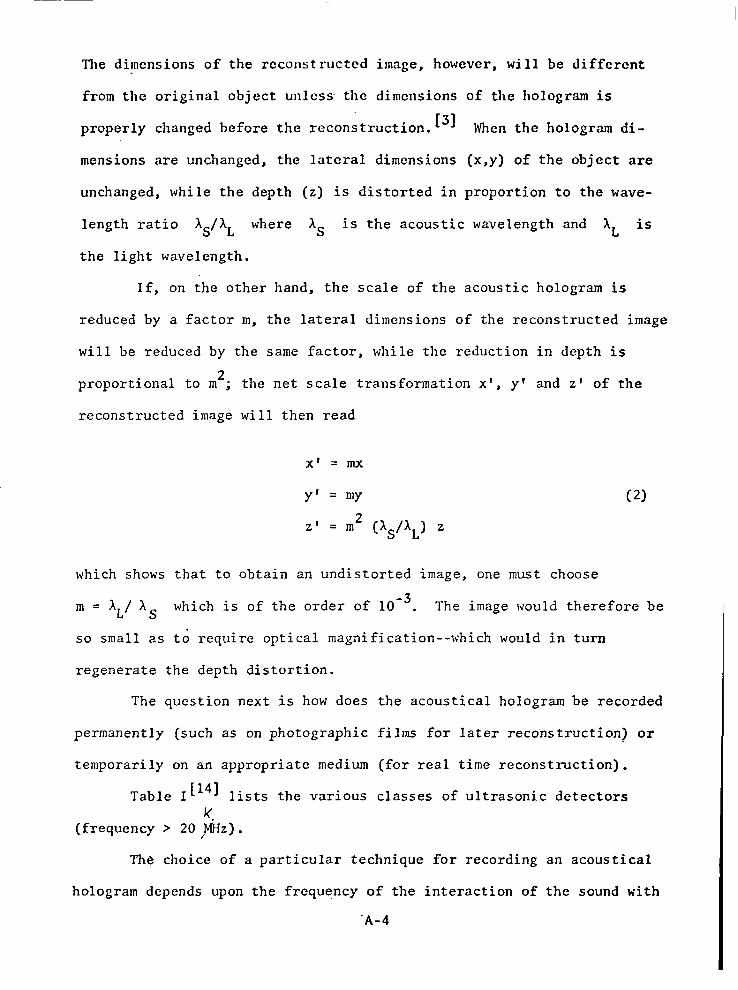
The dimensions of the rcconstructcd image, however, will be diffcrcnt
from the original object unless the dimensions of the hologram is
properly changed before the reconstruction. r31 When the hologram di-
mensions are unchanged, the lateral dimensions (x,y) of the object are
unchanged, while the depth (z) is distorted in proportion to the wave-
length ratio As/AL where Xs is the acoustic wavelength and XL is
the light wavelength.
If, on the other hand, the scale of the acoustic hologram is
reduced by a factor m, the lateral dimensions of the reconstructed image
will be reduced by the same factor, while the reduction in depth is
proportional to m2; the net scale transformation x', y' and z' of the
reconstructed image will then read
x’ = mx
y' = my (2)
z' = m 2 (Q/A,) z
which shows that to obtain an undistorted image, one must choose
m = XL/ hS -3 which is of the order of 10 . The image would therefore be
so small as to require optical magnification--;<hich would in turn
regenerate the depth distortion.
The question next is how does the acoustical hologram be recorded
permanently (such as on photographic films for later reconstruction) or
temporarily on an appropriate medium (for real time reconstruction).
Table 1[14] lists the various classes of ultrasonic detectors Jc
(frequency > 2Opz).
The choice of a particular technique for recording an acoustical
hologram depends upon the frequency of the interaction of the sound with
'A-4
the subject under study. As a guide for the choice of the appropriate
sonic frcqucncy for various applications, Table II may bc used as a
guide. 1151 For nondestructive testing, frequencies in the range of
100 KHz to 10 MHz arc used for detection of macroscopic flows. The
techniques of mapping the acoustic field into an optical one vary ac-
cording to the acoustic frequency used. Furthermore, the coupling
between the tested object and the medium of acoustic wave propagation
depends, also, on the acoustic frequency. We shall emphasize in this
proposal techniques applicable to nondestructive testing of macroscopic,
nonbiological objects.
A-5
I
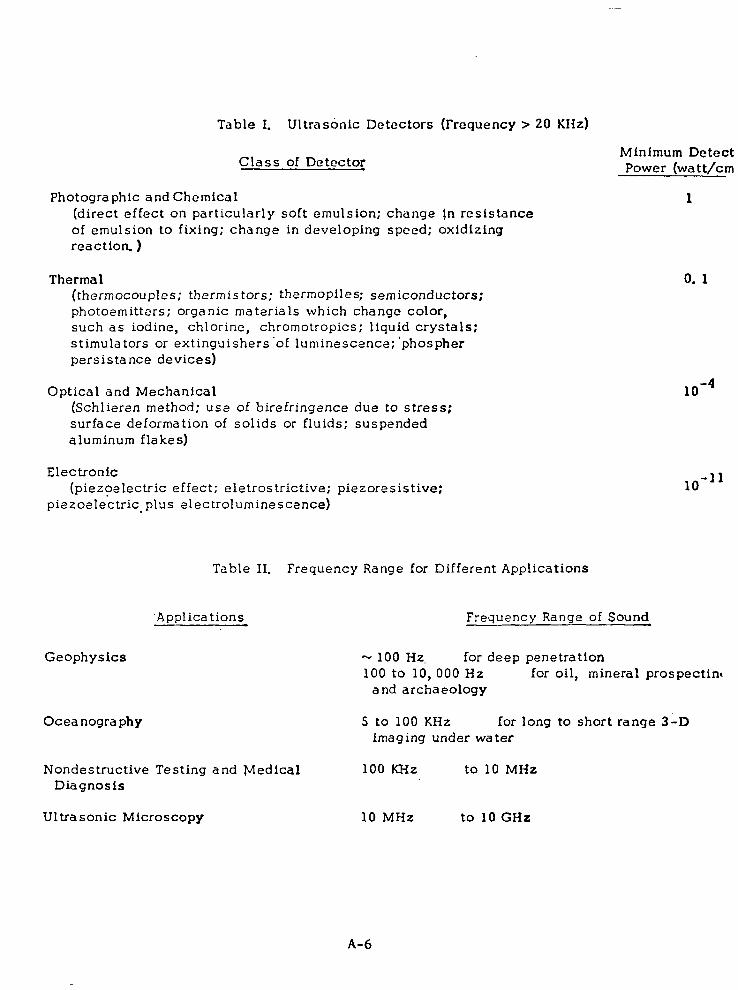
Table 1. Ultras&k Detectors (Frequency > 20 KIiz)
Class of Detector Mfnfmum Detect
Power (watt/cm
Photographic and Chemical (direct effect on particularly soft emulsion; change in resistance of emulsion to fixing; change in developing speed; oxldlzlng reaction. )
1
Thermal (thermocouples; thermistors; thermopiles; semiconductors; photoemitt2rs; organic materials which change color, such as iodine, chlorine, chromotropics; liquid crystals: stimulators or extinguishers ‘of luminescence; ‘phospher
0. 1
persistance devices)
Optical and Mechanical (Schlieren method; use of birefringence surface deformation of sollds or fluids; aluminum flakes)
Electronic (piezoelectric effect; eletrostrictive;
piezoelectric. plus electroluminesc2nce)
due to stress; suspended
piezoresistive;
1o-4
10’11
Table II. Frequency Range for Different Applications
‘Applications Frequency Range of Sound
Geophysics - 100 Hz, for deep penetration 100 to 10,000 Hz for oil, mineral prospectint
and archaeology
Ocea nogra phy 5 to 100 KHz for long to short range 3-D imaging under water
Nondestructive Testing and Medical Diagnosis
100 KHZ to 10 MHz
Ultrasonic Microscopy 10 MHz to 10 GHz
A-6
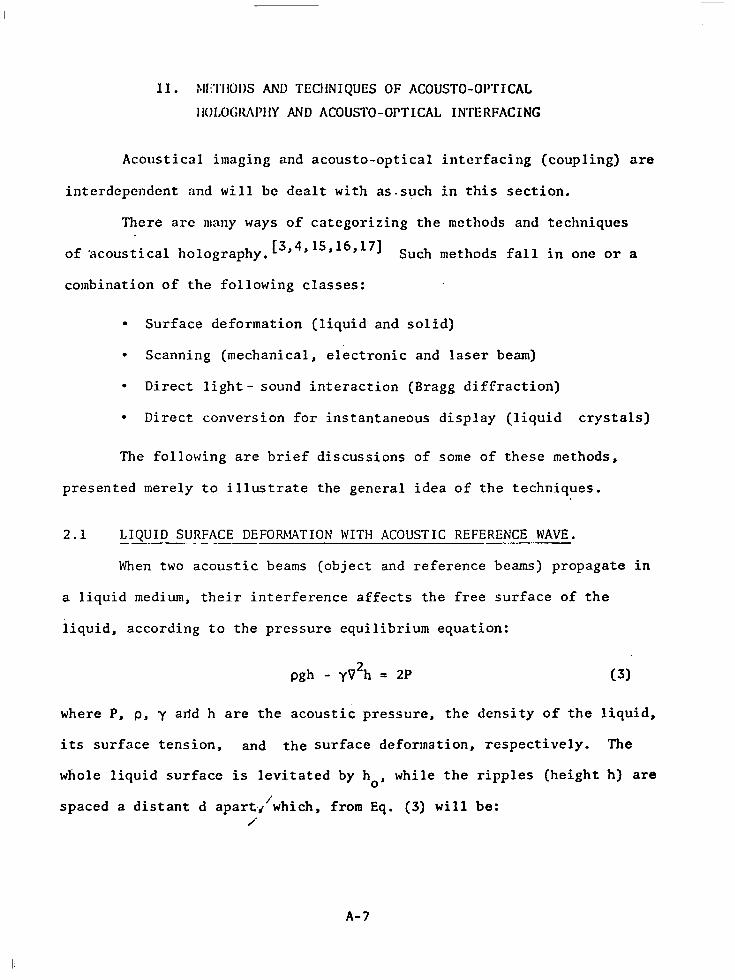
II. PlIi'l'lIODS AND TEQINIQUES OF ACOUSTO-OPTICAL IIOI,OCIu\PI1Y AND ACOUSTO-OPTICAL INTERFACING
Acoustical imaging and acousto-optical interfacing (coupling) are
interdepcndcnt and will bc dealt with as-such in this section.
There arc many ways of categorizing the methods and techniques
of acoustical holography. [3,4,15,16,173 Such methods fall in one or a
combination of the following classes:
l Surface deformation (liquid and solid)
. Scanning (mechanical, electronic and laser beam)
. Direct light- sound interaction (Bragg diffraction)
l Direct conversion for instantaneous display (liquid crystals)
The following are brief discussions of some of these methods,
presented merely to illustrate the general idea of the techniques.
2.1 LIQUID SURFACE DEFORMTION WITH ACOUSTIC REFERENCE WAVE. --.-__~
When two acoustic beams (object and reference beams) propagate in
3 liquid medium, their interference affects the free surface of the
liquid, according to the pressure equilibrium equation:
ah - yV2h = 2P (3)
where P, p, y and h are the acoustic pressure, the density of the liquid,
its surface tension, and the surface deformation, respectively. The
whole liquid surface is levitated by ho, while the ripples (height h) are
spaced 3 distant d apart.,/'which, from Eq. (3) will be: /'
A-7
I!
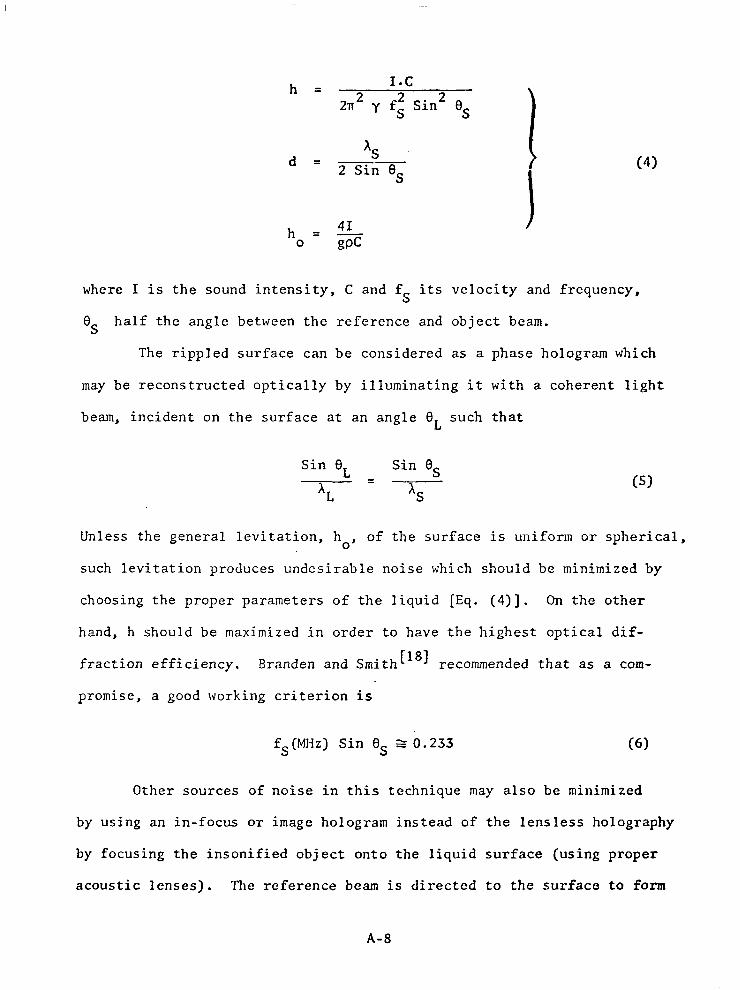
h = 1.c 25r2 y fi Sin' OS
d = % 2 Sin OS (4)
where I is the sound intensity, C and fs its velocity and frequency,
es half the angle between the reference and object beam.
The rippled surface can be considered 3s 3 phase hologram which
may be reconstructed optically by illuminating it with a coherent light
beam, incident on the surface at an angle BL such that
Sin BL Sin es
AL =
As (51
Unless the general levitation, ho, of the surface is uniform or spherical,
such levitation produces undesirable noise which should be minimized by
choosing the proper parameters of the liquid [Eq. (4)]. On the other
hand, h should be maximized in order to have the highest optical dif-
fraction efficiency. Branden and Smithr18] recommended that 3s a com-
promise, 3 good working criterion is
fs(MHz) Sin es ~0.233 (6)
Other sources of noise in this technique may also be minimized
by using an in-focus or image hologram instead of the lensless holography
by focusing the insonified object onto the liquid surface (using proper
acoustic lenses). The reference beam is directed to the surface to form
A-8
the image hologram. Such technique has advantages :IIKI disndvnntagcs,
in addition to several limitations which will bc dc'alt with in the course
of the study.
2.2 LIQUID SURFACE DEFORMATION WITflOUT ACOUSTIC REFERENCE WAVE ~=-- - (Time-Ind_elend=
Instead of 3 reference beam, Green [I91 used 3 wire grating close
to the surface.on which the acoustic image of the object, immersed in
the liquid, is projected. In this way, the undesired high frequency
ripples,superimposed on the main ripples of the surface and which is :;Yi
UnavoidableinBrenden-Smith arrangement, is reduced considerably. The
optical intensity at the image plane of Green's arrangement is propor-
tional to the square of the acoustic intensity transmitted through the
object, and hence is higher than Smith-Brenden arrangement. However,
this is not 3 too important advantage, since it can be compensated for
by appropriately choosing the response characteristic of the optical
detector. In general the two techniques produce images of comparable
quality.
2.3 LIQUID SURFACE DEFOJ?MATION WITH SIMULTANEOUS SCANNING OF THE ACOUSTIC SOURCE AND LIGHT DETECTOR (Synthetic Aperture)
To avoid'the distortion of the reconstructed image, brought about
by the extreme difference between the acoustic and light wavelengths,
El-S&1g] and Hilderbrand, et al., r201 . used a synthetic aperture
technique. In this scheme both the detector and the source are scanning
with either different or the same velocities. The resultant is a holo-
gram with an equivalent larger aperture and consequently less distortion
in the reconstructed image, higher resolution and less speckle noise.
A-9
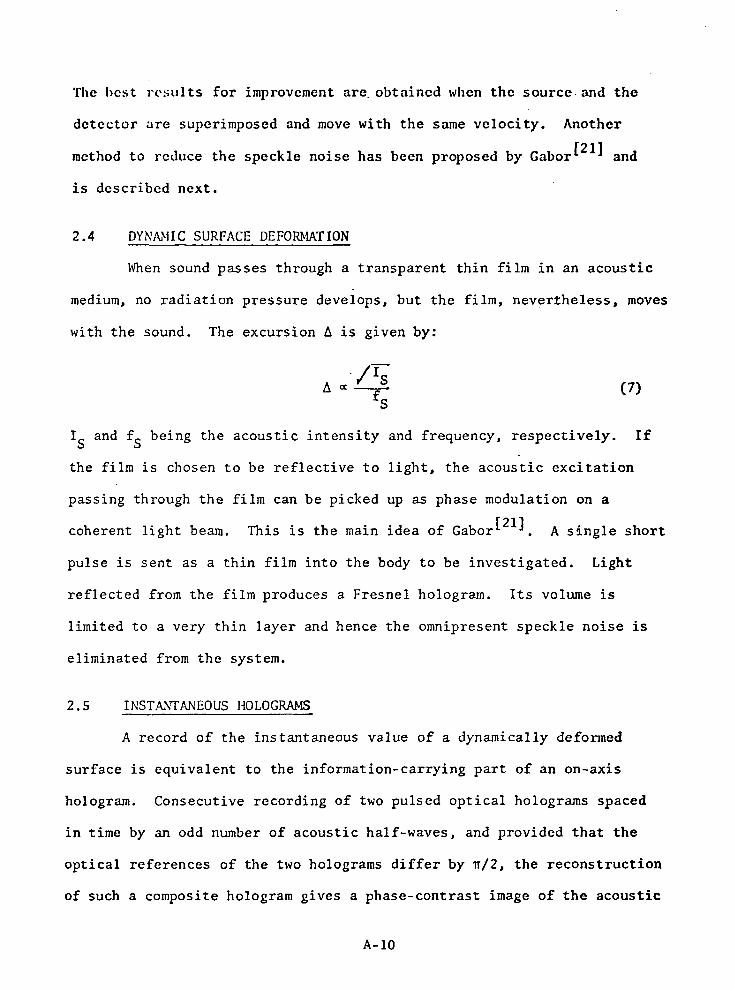
The hcst results for improvement are.obtaincd when the source.and the
dctcctor are superimposed and move with the same velocity. Another
method to reduce the speckle noise has been proposed by Gabor [*'I and
is dcscribcd next.
2.4 DYNAMIC SURFACE DEFORMATION
When sound passes through a transparent thin film in an acoustic
medium, no radiation pressure develops, but the film, nevertheless, moves
with the sound. The excursion A is given by:
-J LS A=----- fS
(71
Is and fS being the acoustic intensity and frequency, respectively. If
the film is chosen to be reflective to light, the acoustic excitation
passing through the film can be picked up as phase modulation on a
coherent light beam. This is the main idea of Gabor E211 . A single short
pulse is sent as 3 thin film into the body to be investigated. Light
reflected from the film produces 3 Fresnel hologram. Its volume is
limited to a very thin layer and hence the omnipresent speckle noise is
eliminated from the system.
2.5 INSTAXTANEOUS HOLOGRAMS
A record of the instantaneous value of 3 dynamically deformed
surface is equivalent to the information-carrying part of an on-axis
hologram. Consecutive recording of two pulsed optical holograms spaced
in time by an odd number of acoustic half-waves, and provided that the
optical references of the two holograms differ by r/2, the reconstruction
of such 3 composite hologram gives 3 phase-contrast image of the acoustic
A- 10
image over the excited surface. [=I This in turn can be uscd'as an
acoustic hologram.
2.6 RAPID LASER BEAM SCANNING ._---_---
A laser beam scanned over a reflecting surface picks up the
local acoustic excitation as phase modulation. Korpel, et al. r231
demonstrated the idea'using a lens to image the exit pupil of the beam
deflector onto the entrance pupil of the detector. A knife edge in front
of the photodiode detector transforms the phase modulation of the beam
into amplitude modulation, producing a signal proportional to the
acoustic excitation. The signal is then processed and displayed on a
CR tube from which a record can be made for optical reconstruction.
This scheme, however, is limited in resolution and in aperture, and
hence is usually limited to ultrasonic microscopy.
2.7 ELECTRON BEAM SCANNING OF ACOUSTICALLY DEFORMED SURFACE .--. _----. ____ ._._ ._~_ _ ------
A less sensitive scheme than the laser scanning one is to image
the acoustically deformed surface onto a photocathode. The electron
,image is then scanned electrically. This scheme is capable of displaying
either a hologram or its optical reconstruction, depending on the loca-
tion of the photocathode in the optical system. I241
2.8 PIEZOELECFRIC TRANSDUCERS
Many materials (quartz, lithium sulfate, barium titanate, lead
zirconate-titanate, lead metaniobate, etc.) are used as either trans-
ducers or detectors. For imaging,the transducer (or the object) is
scanned mechanically, [251 or by making use of an array of transducers.
Since a piezoelectric transducer acts as a mosaic (transducers
array), the acoustic wave incident on it produces an equivalent electric
A-11
imagc'across it. The transducer surface can then be scanned by an
electron beam in order to generate a tclcvision-type signal. Acoustic
television camera, based on this principle, was first made by Sokolov. P61
Barium titanate or quartz has been used in such cameras. They have a -9 -3 good dynamic range (3x10 to 3x10 W/cm2) and a low sensitivity
threshold of 2x10 -11 w/cy2. However, they have a limited aperture and
a narrow angular field of view. Such tubes have been used to record and
reconstruct acoustic holograms 1271 with real or simulated reference
wave.[351
2.9 PIEZORESISTIVE DETECTORS 1281
,A*CdS(Cu) has high electric resistivity and its conductivity
changes with an incident acoustic wave. A vidicon-type camera tube
using such a target has mainly three advantages over the piezoelectric
type tube:
(a) It responds to a wide range of acoustic frequencies as
opposed to the resonant frequency and odd harmonic response
of the piezoelectric type.
(b) 1.t has the capability of information storage.
(c) It has higher sensitivity.
2.10 ELECTROLUMINESCENT DETECTOR
This is mainly a piezoelectric material with an electroluminescent
coating having a proper thickness and, additionally, simulated for lumi-
nescence with either a bias voltage or ultraviolet illumination. Such
-6 a detector has a sensitivity of 10 - lo-' W/cm2. Voltages generated
by the acoustic wave incident on the piezoclectric side, appear at the
interface with the electroluminescent layer.
A-12
2.11 PO1lLMAN CELL [291
A cell filled with xylene in which small aluminum flakes are
suspended is used for acoustic image detection. In the presence of
acoustic wave incident on the cell, the Al flakes arc aligned and they
reflect light incident on the cell. With no acoustic wave prcsent, the
flakes are randomly oriented and present a grey background by the rc-
fleeted light; this background can be eliminated, in order to produce a
better contrasting image,by applying a small bias voltage across the
cell.
2.12 LIQUID-CRYSTAL ACOUSTICAL-TO-OPTICAL CONVERSION CELL 130,311
A thin layer of nematic liquid crystals sandwiched between a
polarizer and a glass plate treated in such a way that the liquid
crystals float freely in their low-energy state, and hence are aligned
on one axis only. Since the liquid crystals are birefringent, they act
as a wave plate, and when an acoustic wave is projected on such a liquid-
crystal cell, the directions of the molecules change, causing a change
in the optical transmission pattern. Thus the acoustic wave information
is transformed into visible information. The sensitivity of such cells
is demonstrated to be of the order of a few mW/cm', and the aperture
attained so far is not too large (-25 cm square). The image resolution
attained is reasonable and shows the fringes of an acoustical hologram
made with 3 MHz wave.
2.13 BRAGG DIFFRACTION
This is a direct interaction of light and sound, capable of real
time visualization of acoustic images. r321 A visible image of the insoni-
fied object is formed when the angle 0 between the acoustic waves and the
A-13
I
direction of propagation of a coherent light beam satisfies Bragg's
condition
2XS Sin 8 = AL (8)
where AL is the wavelength of the light inside the medium and Xs is the
acoustic.wavelength. This necessitates an almost perpendicular illumi-
nation of the acoustic field. The image formed is usually demagnified
by the ratio of XL/As, and its resolution depends on the size of the
light source. Such images are usually of low intensity.
The maximum usable acoustical frequency in this technique is
20-30 GHz and it is usually limited to microscopic objects.
2.14 BIREFRINGENT CRYSTALS IN ACOUSTICAL MICROSCOPY 1333
LiNb03 birefringent crystals are used as the acoustic propagating
r341 medium. . The light propagates coaxially in the crystal in.an opposite
direction to the acoustic wave. From the conservation of energy and
momentum of the interacting fields, one finds that
($1 = xL max "E - nO
where n E and n 0 are indices of refraction of the extraordinary and
ordinary waves in the crystal. This yields minimum acoustic frequency
limit, and hence allows an extremely high frequency to be used in micro-
scopic objects visualization.
This technique, however, is limited to microscopic objects.
2.15 MISCELLANEOUS OTHER TECIINIQUES
Meindl, Walker and Maginess [361 developed a new acoustic camera
for real time visualization of insonified optics. Such a camera uses
A-14
intcgrntcd clcctronic circuits, acoustic lenses, and electron beam
scanning of dctcctor arrays. Although the technique is not based on the
theory of holography, its exploration by itself and its possible applica-
tion to holography is worth consideration.
Microwave acoustics is also gaining keen interest by many workers
in the field of acoustical imaging. One approach is the use of electronic
scanning of a focussed acoustic beam, where the focussing and steering of
the acoustic waves are produced by means of inhomogeneity and anisotropy
induced by applied magnetic and electric fields. A collimated acoustic
beam has been scanned over an angle of 8O in a uniform magnetic field,
and a 12S-u-diameter acoustic beam has been produced by focussing in a
nonuniform field. [371
Various developments and refinements in acoustical imaging tech-
niques has been reported recently in the 1975 Ultrasonic Symposium. 1383
Further information on coherent optical processing of acoustical
information can be found in reference 39.
A-15
1.
2.
3.
4.
5.
6.
7.
8.
9.
10.
11.
12.
13.
14.
15.
16.
17.
18.
19.
20.
21.
22.
REFERENCES
Berger, H., Acoustical Holography, vol. I, Metherell, El-Sum, et al. (Plenum Press, 1969) pp. 27-48.
Berger, H., and Dickens, R. E., Report ANL-(5680 (1963).
El-Sum, H. M. A., ref. 1, pp. l-26.
El-Sum, H. M. A., Acoustical liolography, vol. II (Plenum Press, 1970) pp. 7-22.
Gabor, D., Nature 161, 777 (1948); Proc. Roy. Sot. 197A, 454 (1949); Proc. Roy. Sot. 64r449 (1951).
El-Sum, H. M. A., Ph.D. Thesis (Stanford University, 1952).
Kirkpatrick, P., and El-Sum, H. M. A., J.O.S.A. 46, 825-831 (1956). -
Haine, M. E., and Mulvey, T., J.O.S.A. 42, 763 (1952). -
Patty, et al., Proceedings National Electronics Conference 10, l-13 (February, 195s); U.S. NOL, A Report, #6228 (January, 1959).
Mueller, R. K., and Sheridan, N. K., App. Phys. Letters 2, 328 (1966).
Acoustic Holography, vol. I (Plenum Press, 1969).
Optical Holography by R. J. Collier, et al. (Academic Press, 1971).
Goodman, J. W., Proc. IEEE 59, 1292 (1971). -
El-Sum, H. M. A., Holography Seminar Proceedings (SPIE, 1968).
blueller, R. K., Proc. IEEE 59, 1319 (1971). -
Greguss, P., Phys. Today 27 42 (1974). -J
Wade, J., private communications and paper to be published.
Smith, R. B., and Brenden, B. B., IEEE Symposium on Sonics and Ultrasonics, N.Y., (Sept., 1968).
El-Sum, H. M. A., ref. 4, pp. 16.
Hilderbrand, R. P., and Haines, K. A., Phys. Letters 2, 378 (1968); J.O.S.A., 59, 1 (1969). -
Gabor, D., U.S. Patents Nos. 548939 and 3745814 (1973).
Metherell, et al., Ref. 4, pp. 394.
A-16
23.
24.
2s.
26.
27.
28.
29.
30.
31.
32. Korpel, A., Appl. Phys. Letters 2, 425 (1966).
33. Quate, C., and Havlice, J., Stanford University, private communications; Havlice, J., Quate, C. F., and Richardson, B., IEEE Trans. SU-15, 68 (1968); Massey, G. A., Proc. IEEE 56, 2157 - (1968).
34.
3s.
36.
37.
38.
39.
Korpcl, A., and Dcsmaris, P., J. Acoust. Sot. Am. 45, 881 (1909).
Chutjian, A., and Collier, R. J., J.O.S.A. 57, 1405 (1967). -
Martin, G., Brit. J. NDT 2, 27 (1967).
Sokolov, S., U.S. Patent 2'164,125.
Fritzler, D., et al., Acoustic Holography, vol. I (Plenum Press, 1969)' pp. 249.
Jacobs, J. C., U;S. Patent 3'236,944.
Pohlman, R, Z. Physik 113, 697 (1939).
Greguss, P., Acoustica 2, 52 (1973).
Ferguson, J. L., Acoust. Holography, vol. II (Academic Press, 1970), pp. 53.
Dixon, R. W., Quantum Electron, QE-3, 85 (1967).
Ref. 4, pp. 12.
Private discussions. Also, Acoustical Holography, vol. V (Plenum Press, 1973).
Auld, B. A., et al.,Ref. 4, pp. 117; Acoustic Fields and Waves in Solids, ~01s. I and II (Wiley Interscience, 1973).
IEEE Proceedings of the 1975 Ultrasonic Symposium (under publica- tion.
El-Sum, H. M. A., AGARD Conference Proceedings SO (1970). -
A-17
APPENDIX B
REAL-TIME, ERASABLE IMAGE RECORDING
B-l
The electronically focussed, electronically scanned piezoelectric
mosaic array used for acoustical imaging plays the role of the photo-
graphic films in detecting optical images. It is fast and sensitive.
Another group of recording devices is the Ruticon (B-11 family. .
Such devices are based on surface deformation using photoconductors like
the thermoplastic sandwiches (B-2,3) the photomembrane light modulator (B-4) ,
and the Elmikon(B-s) . Surface-deformation imaging was first proposed for
electron-beam addressing of deformable liquid or elastomer surfaces in the
Eidophor systems (B-6) valves(B-2,7J8) J in light , and in the deformo-
graphic storage and display tube (B-9,10) .
The “Rut i can” temporarily store an input image ai a surface-
deformation pattern on an elastomer layer. It is a layered structure
consisting of a transparent conductive substrate, as shown in .Fig. B-l,
a photoconductor layer (usually poly-N-vinyl-carbazole with a green
organic sensitizer dye and an elastomer layer, usually of the siloxane-
based variety). When the photoconductor is exposed to image light, the
voltage distribution across the photoconductor changes, in turn causing
changes in the electric field across the elastomer layer. The resulting
distribution of electromechanical forces across the elastomer causes it
to deform into a surface relief pattern corresponding to the image light.
This deformation persists ‘after the optical image has been removed, as
long as the field is maintained. Rut i cons are suitable for recording
holograms and continuous-tone incoherent images at exposure levels of
less than 300 erg cm2 (3x10-’ W/cm2 for 1 set exposure, 5~10~~ W/cm2 for
1 min exposure, or 3x10 -4 for 0.1 sec. exposure), with a resolution
in excess of 850 line pairs/mm. The “Rut i cons” are read out with a .
‘B-2
phase-sensitive optical system (Schlierren) as shown in Figure B-2:
It can be used for incoherent-to-coherent image conversion, spatial
filtering, correlation, wavelength conversion, image intensification,
buffer storage of optical information, and real-time display (since
they can be erased to less than 10 percent of their initial intensities
within 10 msec.
Although the use of dielectric liquid (with or without applied
electric field) was demonstrated as a promising deformable surface to
detect acoustical holograms and images, the Ruticon has never been
tested for acoustical imaging. However, its optical behavior may prove
useful for the hybrid system of nondestructive testing (Figure 1).
B-3
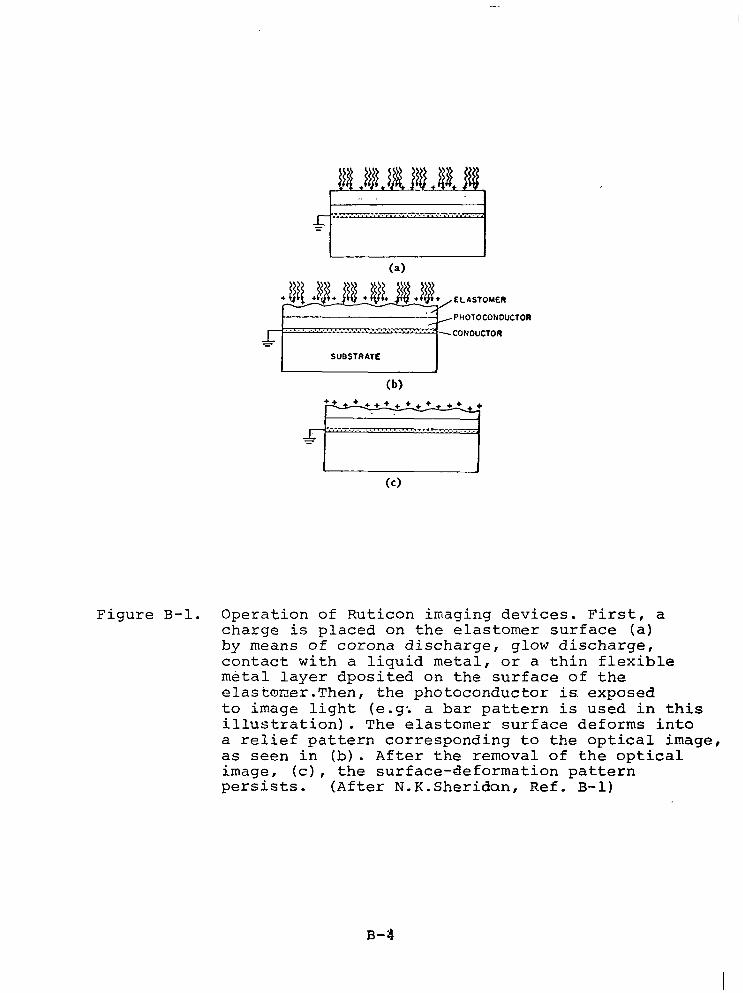
(4
+w ELASTOMER
,PHOTOCONDUCTOR .
- -CONOUCTOR I
SUBSTR4TE
2
6)
Figure B-l. Operation of Ruticon imaging devices. First, a charge is placed on the elastomer surface (a) by means of corona discharge, glow discharge, contact with a liquid metal, or a thin flexible metal layer dposited on the surface of the elastomer.Then, the photoconductor is exposed to image light (e.g-. a bar pattern is used in this illustration). The elastomer surface deforms into a relief pattern corresponding to the optical image, as seen in (b). After the removal of the optical image, (c), the surface-deformation pattern persists. (After N.K.Sheridan, Ref. B-l)
B-4
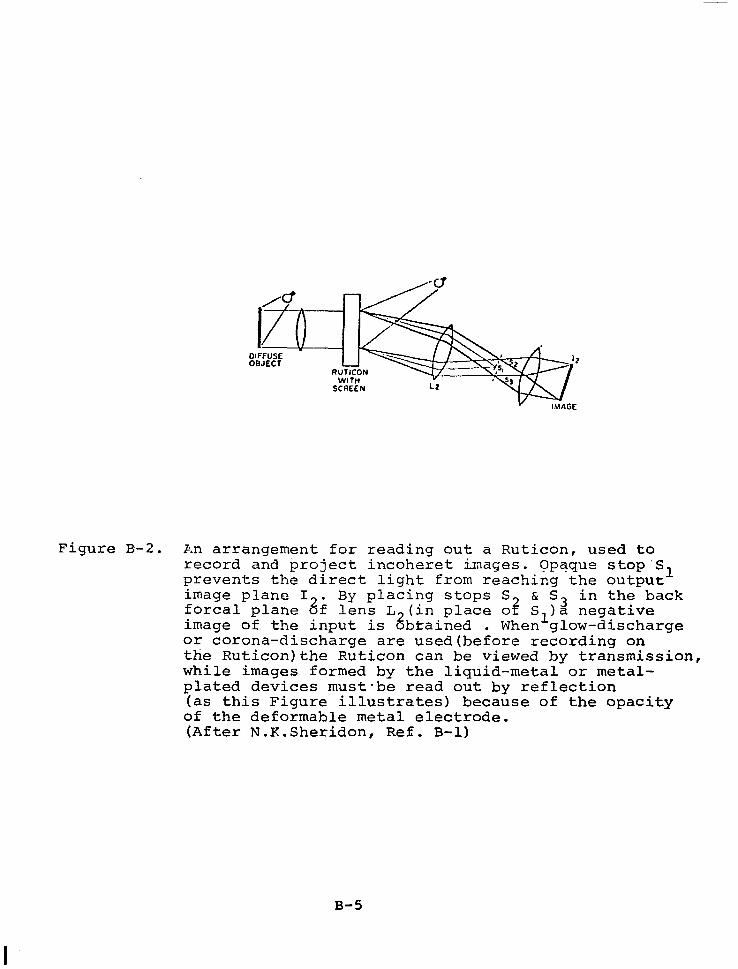
V M-AGE
Figure B-2. An arrangement for reading out a Ruticon, used to record and project incoheret images. Ppaque stop's1 prevents the direct light from reaching the outpur image plane I
8' By placing stops S
forcal plane f lens L2(in place & S3 in the back
0 2 Sl)a negative image of the input is obtained . When glow-discharge or corona-discharge are used(before recording on the Ruticon)the Ruticon can be viewed by transmission, while images formed by the liquid-metal or metal- plated devices must-be read out by reflection (as this Figure illustrates) because of the opacity of the deformable metal electrode. (After N.K.Sheridon, Ref. B-l)
B-5
B-l
B-2
B-3
B-4
B-S
B-6
B-7
B-8
B-9
B-10
REFERENCES
N. K. Sheridan, IEEE Trans. on Electron Devices ED-19 (9), 1003- 1010 (1972).
W. Glenn, J. App. Phys. 30 (12), 1570 (1959); J.O.S.A. 48 841 - -' (1958).
R. W. Gundlach and C. Claus, Photo. Sci. Eng. 17, 14 (1963). -
F. Reizman, AGARD Conf. Proc. 50 (Sept. 1959).
W. Bawngartner, Z. Angew. Math. Phys. 18, 31 (1967). -
F. Fisher and H. Thiemann, Schweiz. Arch. z, 1, 33, 305, 337 (1941); 8, 15, 1351, 1691, 199 (1942).
W. Good, Proc. Nat. Electron. Conf. 24 (1968). -
E. Bauman, J. Sot. Motion Pitt. Telev. Eng. 60, 351 (1953). -
R. J. Wohl, F. A. Hawn and H. C. Medley, U.S. Pat. 3,626,084 (1971).
J. A. van Raalte, J.O.S.A. 9 (lo), 2225 (1970).
B-6 NASA-Langley, 1976