Analytical Solutions for Food Safety and Quality
20
Food Testing Solutions Overview Guide ANALYTICAL SOLUTIONS FOR FOOD SAFETY
Transcript of Analytical Solutions for Food Safety and Quality

Food Testing SolutionsOverview Guide
ANALYTICALSOLUTIONSFOR FOOD SAFETY

2
Introduction ..................................................................................2
Food Testing Matrix – Analytical Perspective ...............................3
Chromatography and Mass Spectrometry .............................. 4 - 6
Atomic Spectroscopy .............................................................. 7 - 8
Molecular Spectroscopy........................................................ 9 - 10
Thermal Analysis ................................................................ 11 - 12
Five Tips to Improving Sample Digestion ....................................13
Analytical Solutions for Agri Food Industries. ..................... 14 - 15
Complete Analysis Solutions for Milk and Dairy Products ..........16
Food and Feed Safety Diagnostic Assay Kits ..............................17
Consumables and Accessories ...................................................18
Informatics Solutions for Food Analysis .............................. 19 - 20
Table of Contents
There are myriad of complexities associated with food analysis from a regulatory perspective. Globally, the demand for food products is on an exponential rise. As the demand increases, the need for supply also goes up, so would the emphasis on a quality driven approach. Food regulatory authorities across the globe have imposed stricter laws to ensure safety and quality. This has led to incorporation of a sophisticated robust, efficient, sensitive, and cost-effective analytical methodologies to guarantee the safety, quality, and traceability of foods in compliance with legislation and consumers’ demands. The old methods used at the beginning of the 20th century based on “wet chemistry” have evolved into the current powerful instrumental techniques used in food laboratories. This advancement has led to significant enhancements in analytical accuracy, precision, detection limits, and sample throughput, thereby expanding the practical range of food applications. Besides, currently, there is also a huge interest in the health-related properties of foods as a result of an increasing public concern on how to improve health through the so-called functional
foods, functional ingredients, and nutraceuticals. With the Food Safety Modernization Act being rolled out by the U.S. Food and Drug Administration and with the regulatory bodies like FSSAI, FDA, China Food and Drug Administration, the European Food Safety Authority enforcing stricter regulations, a regulatory driven analytical set up is very much required.
To assess the quality and safety of food supplies around the world, PerkinElmer offers industry-leading solutions for characterizing nutritional components within food and agricultural products and detecting risks to human and animal health. Our instruments are used extensively by researchers throughout the food and beverage industry to detect harmful levels of toxins, heavy metals, and pesticides, ensure accurate labeling and compliance with regulations around the globe, evaluate the quality of raw materials prior to food processing, meet targets for nutritional content, maintain standards for flavor, aroma, to sustain consistency in food and beverages and also to understand how food packaging effects the food it contains.
Introduction
3
Food Testing Solutions Overview Guide
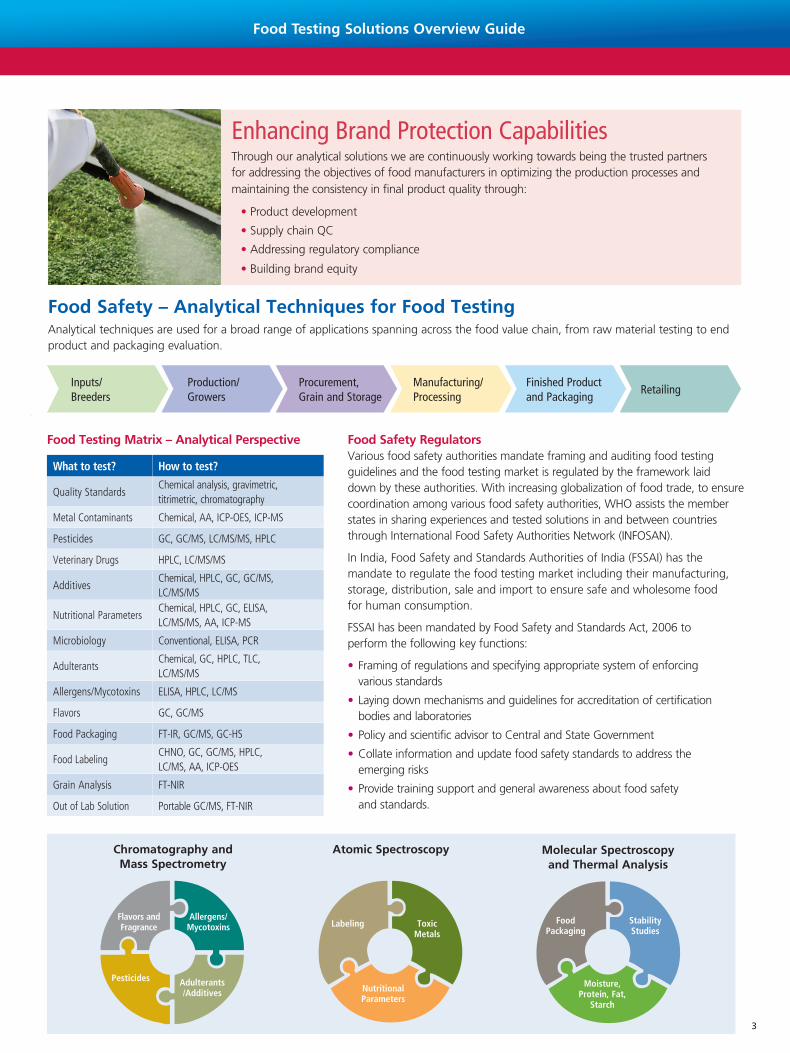
Through our analytical solutions we are continuously working towards being the trusted partners for addressing the objectives of food manufacturers in optimizing the production processes and maintaining the consistency in final product quality through:
• Product development
• Supply chain QC
• Addressing regulatory compliance
• Building brand equityIntroduction ..................................................................................2
Food Testing Matrix – Analytical Perspective ...............................3
Chromatography and Mass Spectrometry .............................. 4 - 6
Atomic Spectroscopy .............................................................. 7 - 8
Molecular Spectroscopy........................................................ 9 - 10
Thermal Analysis ................................................................ 11 - 12
Five Tips to Improving Sample Digestion ....................................13
Analytical Solutions for Agri Food Industries. ..................... 14 - 15
Complete Analysis Solutions for Milk and Dairy Products ..........16
Food and Feed Safety Diagnostic Assay Kits ..............................17
Consumables and Accessories ...................................................18
Informatics Solutions for Food Analysis .............................. 19 - 20
Enhancing Brand Protection Capabilities
Food Safety RegulatorsVarious food safety authorities mandate framing and auditing food testing guidelines and the food testing market is regulated by the framework laid down by these authorities. With increasing globalization of food trade, to ensure coordination among various food safety authorities, WHO assists the member states in sharing experiences and tested solutions in and between countries through International Food Safety Authorities Network (INFOSAN).
In India, Food Safety and Standards Authorities of India (FSSAI) has the mandate to regulate the food testing market including their manufacturing, storage, distribution, sale and import to ensure safe and wholesome food for human consumption.
FSSAI has been mandated by Food Safety and Standards Act, 2006 to perform the following key functions:
• Framing of regulations and specifying appropriate system of enforcing various standards
• Laying down mechanisms and guidelines for accreditation of certification bodies and laboratories
• Policy and scientific advisor to Central and State Government
• Collate information and update food safety standards to address the emerging risks
• Provide training support and general awareness about food safety and standards.
Food Safety – Analytical Techniques for Food TestingAnalytical techniques are used for a broad range of applications spanning across the food value chain, from raw material testing to end product and packaging evaluation.
Inputs/ Breeders
Production/ Growers
Procurement, Grain and Storage
Manufacturing/ Processing
Finished Product and Packaging
Retailing
Atomic Spectroscopy
Labeling
Nutritional Parameters
Toxic Metals
Food Packaging
Moisture, Protein, Fat,
Starch
Stability Studies
Molecular Spectroscopy and Thermal Analysis
Chromatography and Mass Spectrometry
Pesticides
Flavors and Fragrance
Allergens/Mycotoxins
Adulterants /Additives
What to test? How to test?
Quality StandardsChemical analysis, gravimetric, titrimetric, chromatography
Metal Contaminants Chemical, AA, ICP-OES, ICP-MS
Pesticides GC, GC/MS, LC/MS/MS, HPLC
Veterinary Drugs HPLC, LC/MS/MS
AdditivesChemical, HPLC, GC, GC/MS, LC/MS/MS
Nutritional ParametersChemical, HPLC, GC, ELISA, LC/MS/MS, AA, ICP-MS
Microbiology Conventional, ELISA, PCR
AdulterantsChemical, GC, HPLC, TLC, LC/MS/MS
Allergens/Mycotoxins ELISA, HPLC, LC/MS
Flavors GC, GC/MS
Food Packaging FT-IR, GC/MS, GC-HS
Food LabelingCHNO, GC, GC/MS, HPLC, LC/MS, AA, ICP-OES
Grain Analysis FT-NIR
Out of Lab Solution Portable GC/MS, FT-NIR
Food Testing Matrix – Analytical Perspective

4
Food Testing Solutions Overview Guide
Chromatography and Mass Spectrometry
QSight™ Triple Quadrupole LC/MS/MSPerkinElmer’s QSight® LC/MS/MS brings innovative technology solutions to address food testing challenges and enhance the productivity of your laboratory. Be it pesticide residue testing, simultaneous multimycotoxin detection, veterinary drug analysis, allergen detection or nutritional component analysis, the QSight LC/MS/MS is a versatile triple quad instrument with the levels of accuracy and sensitivity, scientists need to ensure compliance. Our complete pesticide solution takes you from initial sample prep and extraction to analysis and reporting – all backed by the most knowledgeable service and support organization in the business.
With the QSight LC/MS/MS, you can gain up to 15% more uptime – that translates to 35 more days of sample testing per year. These unique features enable more productivity and more sample testing in less time:
• StayClean™ technology employs Hot-surface induced desolvation (HSID™), a multi-orthogonal sampling interface that can significantly increase your uptime and improve your sensitivity.
• Laminar Flow Ion Guide™ ensures the system is not susceptible to field fluctuations and delivers consistently high levels of performance with no maintenance requirements
• Dual Source technology gives you the capability to set ESI or APCI modes, with two independent probes for true multiplexing.
GC PlatformsPerkinElmer’s GC and GC/MS platforms offer best-in-class technology delivering superior performance, optimal efficiency, higher user productivity, and lower consumable costs. Clarus® SQ 8 GC/MS delivers both unsurpassed sensitivity and unparalleled stability required in food analysis. For volatile compounds in food matrices, TurboMatrix™ Headspace (HS) is your ideal choice with enhanced sensitivity, allowing for low-level detection or small sample sizes.
No matter what your throughput requirements or food matrices, the Clarus SQ 8 GC/MS can streamline you work-flows with a suite of productivity-enhancing technologies.
Universal Programmable Split/Splitless (PSS) Injector• Enables large-volume split, splitless and on-column injections
of volatile solvents with one injector
• Eliminates the need for expensive cooling agents
• Offers greater application flexibility
Headspace and Thermal Desorption Sample Introduction Systems• Dramatically reduce sample preparation time
• Simplify a broad range of specialized applications including flavor/fragrance analysis
Full-Color, Multi-Language Touch-Screen Interface• Speeds and simplifies system accessibility and usability
Work faster. Work smarter.

5
Food Testing Solutions Overview Guide
Food Testing Solutions Overview Guide
Chromatography and Mass Spectrometry - Applications
With QSight LC/MS/MS an analyst can perform all the applications confidently and with minimum downtime thereby ensuring the safety of food supply across the world.
Analysis of targeted pesticide residues in berries with QuEChERS sample preparationExtensive use of pesticides can pose health risks to humans and this has led to worldwide stringent regulations. Among the routinely used testing methods, LC/MS/MS has become the method of choice, due to its high sensitivity, reliability and accuracy.
In this study, a unique laminar flow UHPLC-ESI-MS/MS triple quad mass spectrometer was used to identify and quantitate 40 pesticides in four brands of nonorganic berries. The QuEChERS extraction method proved both rapid and reliable for extracting pesticide residues in the heavily pigmented berry samples.
Pesticide Concentration (μg/kg)
Bluberry (Brand A)
Pyraclostrobin 11.8
Flonicamid 9.7
Bifenazate 12.6
Thiamenthoxam 9.5
Pyrimethanill 11.8
Blueberry (Brand B)
Cyprodinil 16.8
Pyraclostrobin 23.2
Boscalid 51.1
Hexythiazox 4.5
Blueberry (Brand C) N/A --
Blackberry (Brand D) Hexythiazox 447.3
Table 1. Summary of pesticides found in berry samples
Determination, confirmation, quantitation of multi-class antibiotic residues in milkEvery country has set the limit for maximum residue levels (MRL’s) of antibiotic drug residues in food; LC/MS/MS is a fast and sensitive technique for quantitative and confirmatory analysis of multi-class antibiotics in milk. The analyzed antibiotics in the study included ciprofloxacin, sarafloxacin, ofloxacin, penicillin-G, cloxacillin, tilmicosin, tylosin, erythromycin, sulfamethazine, sulfamethoxazole, sulfadimethoxine, tetracycline and chlortetracycline.
* Publication number to use for searching PerkinElmer Web site for full application note.
5
Table 5. Repeatability of response for antibiotic residues at different levels in milk extract.
Compound 2.5 ng/ml RSD (n=5)
5 ng/ml RSD (n=5)
10 ng/ml RSD (n=5)
25 ng/ml RSD (n=5)
50 ng/ml RSD (n=5)
100 ng/ml RSD (n=5)
Sulfamethazine 2.4 % 2.4 % 1.1 % 1.4 % 0.8 % 0.7 %
Sulfamethoxazole 3.5 % 4.7 % 2.8 % 1.7 % 2.9 % 1.4 %
Sulfadimethoxine 3.0 % 0.8 % 2.0 % 1.6 % 1.2 % 1.7 %
Tilmicosin 0.7 % 1.5 % 1.8 % 0.7 % 0.8 % 1.1 %
Tylosin 7.8 % 4.3 % 3.9 % 2.1 % 2.2 % 1.4 %
Erythromycin 4.7 % 3.8 % 4.0 % 1.7 % 2.3 % 0.8 %
Penicillin-G 3.0 % 4.4 % 4.2 % 1.4 % 2.6 % 1.5 %
Cloxacillin 4.5 % 4.4 % 3.7 % 2.5 % 1.8 % 1.4 %
Ofloxacin 2.9 % 1.9 % 2.6 % 1.5 % 1.7 % 1.8 %
Ciprofloxacin 2.2 % 2.3 % 0.9 % 3.1 % 1.0 % 1.1 %
Sarafloxacin 2.4 % 2.8 % 2.0 % 1.5 % 2.0 % 0.7 %
Tetracycline 6.1 % 5.9 % 6.1 % 4.7 % 2.8 % 1.3 %
Chlortetracycline 5.6 % 5.0 % 5.7 % 3.6 % 4.1 % 2.1 %
Table 6. Average and RSD of recovery and matrix effect for different antibiotics from milk extract with different extraction solvents (acetonitrile and methanol) during protein precipitation step of extraction process.
CompoundFortified
Level (ng/ml)
Recovery with Methanol
Recovery RSD with Methanol
N=5
Matrix Effect with Methanol
Recovery with Acetonitrile
Recovery RSD with Acetonitrile
N=5
Matrix Effect with Acetonitrile
Sulfamethazine 10 102 % 8 % 110 % 101 % 9 % 102 %
Sulfamethoxazole 10 103 % 10 % 93 % 105 % 13 % 97 %
Sulfadimethoxine 10 96 % 7 % 111 % 104 % 7 % 106 %
Tilmicosin 50 89 % 10 % 127 % 82 % 15 % 103 %
Tylosin 50 97 % 14 % 83 % 92 % 17 % 97 %
Erythromycin 50 98 % 11 % 80 % 27 % 17 % 91 %
Penicillin-G 10 103 % 10 % 94 % 84 % 10 % 96 %
Cloxacillin 10 94 % 13 % 97 % 96 % 13 % 102 %
Ofloxacin 10 101 % 17 % 163 % 97 % 1.7 % 181 %
Ciprofloxacin 10 102 % 16 % 174 % 87 % 1.0 % 163 %
Sarafloxacin 10 104 % 11 % 162 % 96 % 9 % 142 %
Tetracycline 50 32 % 5 % 152 % 24 % 5 % 120 %
Chlortetracycline 50 25 % 8 % 177 % 21 % 10 % 130 %
Table 7. Average of 2 ion ratios and their ranges for antibiotic residues at different concentration levels in milk extract.
Compound Ion Ratio 1
Relative Ion Ratio 1 Difference
Ion Ratio 2
Relative Ion Ratio 2 Difference
Sulfamethazine 57 % ± 5 % 43 % ± 6 %
Sulfamethoxazole 99 % ± 5 % 90 % ± 6 %
Sulfadimethoxine 38 % ± 6 % 29 % ± 5 %
Tilmicosin 76 % ± 5 % 64 % ± 5 %
Tylosin 44 % ± 6 % 26 % ± 11 %
Erythromycin 46 % ± 5 % 24 % ± 6 %
Penicillin-G 78 % ± 5 % 50 % ± 10 %
Cloxacillin 43 % ± 5 % 38 % ± 6 %
Ofloxacin 69 % ± 9 % 62 % ± 7 %
Ciprofloxacin 43 % ± 5 % 2.5 % ± 12 %
Sarafloxacin 13 % ± 7 % 8.1 % ± 7 %
Tetracycline 23 % ± 6 % 21 % ± 10 %
Chlortetracycline 68 % ± 6 % 37 % ± 6 %
Figure 3. Long term stability data over six days for injections of milk spiked with 10 ng/ml of sulfamethazine.
0
20
40
60
80
100
120
0 50 100 150 200 250 300 350 400 450 500
Nor
mal
ized
Res
pons
e fo
r 10
ppb
Sulfa
met
hazi
ne in
Milk
Ext
ract
Run Number
RSD=4.5 %
Figure 1. Long term stability data over six days for inections of milk spiked with 10 ng/ml of sulfamethazine.
Analysis of water-soluble vitamins in infant formulaThe study presents an LC/MS/MS method for the quantitative analysis of B-vitamins in a single run. The analyzed vitamins included vitamin B1 (thiamine), B2 (riboflavin), B3 (niacin), B3 (niacinamide), B6 (pyridoxine), B7 (biotin), B9 (folic acid) and vitamin B12 (cyanocobalamin), using three internal standards. A simple liquid-liquid extraction was used for extracting vitamins from infant formula. The sample extraction coupled with the fast analytical method (<6 mins) was found to be robust/reliable and the least time consuming.
In addition to this LC/MS/MS has proved to be effective and sensitive technique for the following applications:
• Rapid LC/MS/MS analysis of phthalates
• Residue analysis in wine
• Direct analysis of glyphosate and similar polar pesticides in oatmeal
• Simultaneous determination of plant growth regulators in bean sprouts
6
Food Testing Solutions Overview Guide
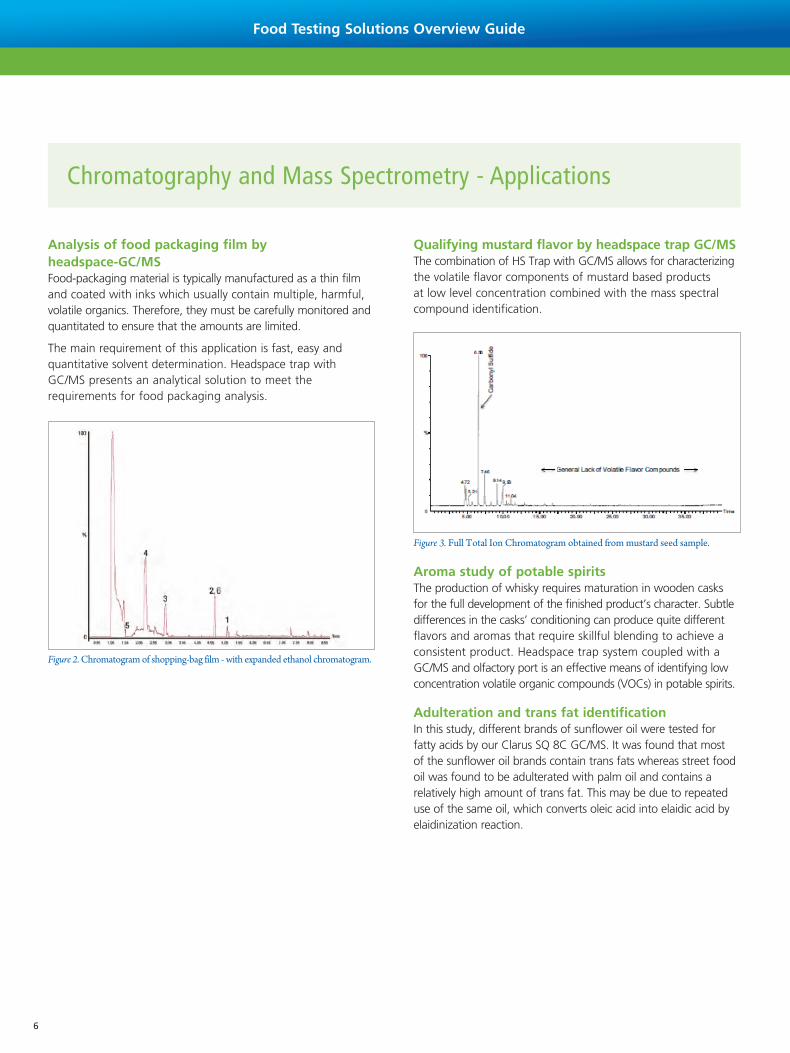
Analysis of food packaging film by headspace-GC/MSFood-packaging material is typically manufactured as a thin film and coated with inks which usually contain multiple, harmful, volatile organics. Therefore, they must be carefully monitored and quantitated to ensure that the amounts are limited.
The main requirement of this application is fast, easy and quantitative solvent determination. Headspace trap with GC/MS presents an analytical solution to meet the requirements for food packaging analysis.
Qualifying mustard flavor by headspace trap GC/MSThe combination of HS Trap with GC/MS allows for characterizing the volatile flavor components of mustard based products at low level concentration combined with the mass spectral compound identification.
Aroma study of potable spiritsThe production of whisky requires maturation in wooden casks for the full development of the finished product’s character. Subtle differences in the casks’ conditioning can produce quite different flavors and aromas that require skillful blending to achieve a consistent product. Headspace trap system coupled with a GC/MS and olfactory port is an effective means of identifying low concentration volatile organic compounds (VOCs) in potable spirits.
Adulteration and trans fat identificationIn this study, different brands of sunflower oil were tested for fatty acids by our Clarus SQ 8C GC/MS. It was found that most of the sunflower oil brands contain trans fats whereas street food oil was found to be adulterated with palm oil and contains a relatively high amount of trans fat. This may be due to repeated use of the same oil, which converts oleic acid into elaidic acid by elaidinization reaction.
Chromatography and Mass Spectrometry - Applications
Figure 2. Chromatogram of shopping-bag film - with expanded ethanol chromatogram.
Figure 3. Full Total Ion Chromatogram obtained from mustard seed sample.

7
NexION 2000 ICP-MSThe most versatile ICP-MS on the market, NexION® 2000 features an array of unique technologies that combine to deliver the highest performance no matter what your analytical challenge. But what makes NexION 2000 an ideal choice for food analysis? Is it its precision measurement capability? Rapid turnaround speeds? Or its Extended Dynamic Range competency? In fact, it is a combination of all three and many more unique features.
• NexION 2000 is the lowest maintenance ICP-MS in the market.
• All Matrix Solution (AMS) sample introduction system enables you to run samples with up to 35% dissolved solids without manual dilution.
• Its 2nd generation Universal Cell Technology enables the analyst to confidently remove interferences for unsurpassed performance.
• It is the only ICP-MS with a cell designed to never need cleaning or replacing.
Avio 500 ICP-OESThe Avio® 500 is a truly simultaneous, dual view, and compact ICP-OES. It utilizes a vertical plasma and is engineered to handle even the most difficult, high-matrix samples without dilution, delivering productivity, performance, and faster return on your investment.
The Avio 500 provides:
• Lowest argon consumption of any ICP – at least 50% lower than other systems
• Simultaneous background correction for faster sample-to-sample time and improved data accuracy
• Greater uptime and sample throughput with PlasmaShear's maintenance-free design
• Unsurpassed matrix tolerance with vertical torch design
PinAAcle Series AAAs the undisputed global leader in atomic absorption (AA) spectrometry, we offer state-of-the-art analytical capabilities through our PinAAcle™ flame furnace and graphite furnace AA spectrometers.
• Our PinAAcle 500 flame AA spectrometer is ideal for laboratories needing a reliable, easy-to-use, yet high-performance flame AA
• Our premier PinAAcle 900 series AA spectrometers integrate a wide range of technological innovations in the smallest flame/furnace packages on the market
A food or agriculture scientist helping to determine the nutritional content or safeguard the authenticity of the food we eat is dependent on atomic spectroscopy techniques to generate the results and data they need to help them make informed scientific decisions. And those techniques often depend on microwave sample preparation systems that can deliver complete, uncontaminated samples – each and every time.Bad preparation. Bad results. It’s as simple as that. With the Titan MPS™ Microwave Sample Preparation System, we’re
delivering on the promise of a simple, safe, cost-effective microwave – one that provides the quick return on investment that labs are looking for in these times of constrained budgets. And it’s backed by PerkinElmer, the one-stop, go-to resource for all things atomic spectroscopy with a team of support individuals who understand, in a deep-seated way, the science behind the goals your lab is trying to achieve. The Titan Microwave Sample Preparation System. Yes, it’s a microwave. But we think it’s a whole lot more!
The first step to better Food Analysis – Titan MPS
Atomic Spectroscopy

8
Analysis of milk for major and trace elements by ICP-MSDue to its nutritional importance and widespread consumption, regulations in many countries necessitate that the quality of milk is routinely monitored. Both dairies and food manufacturers need to carry out the analysis of major, trace, and contaminant elements in milk and milk powders to fulfill requirements for labelling purposes, monitor nutritional quality, and safeguard against contamination by toxic elements.
Amongst the variety of analytical techniques available for elemental measurements, ICP-MS is unique in its capability to rapidly measure both trace and elevated concentrations of different elements in the same sample.
Determination of Arsenic speciation in apple juice by HPLC-ICP-MSArsenic can exist in several forms (some toxic, some non-toxic), it is important to identify the individual forms present in the juice. This is most easily accomplished through the use of liquid chromatography (HPLC), to separate the species, and inductively coupled plasma mass spectrometry (ICP-MS), to detect them.
This application note demonstrates an HPLC-ICP-MS method for the separation and determination of arsenic species in a variety of apple juices.
Analysis of micronutrients in fruit juice using ICP-OESFor food manufacturers and processors, it is imperative that there is a means to quantify the content of food products, including micronutrients, for both safety and quality reasons along with regulatory label-claim requirements.
This application work focuses on the analysis of micronutrients in a variety of commercial juice products using ICP-OES with sample preparation performed using a microwave digestion system.
Atomic Spectroscopy - Applications
Analysis of toxic metals in spices using Graphite Furnace Atomic AbsorptionWith an inherent toxicity, a tendency to accumulate in the food chain and a particularly low removal rate through excretion, lead (Pb), cadmium (Cd) and arsenic (As) cause harm to humans even at low concentrations. Due to the significant amount of spices consumed, it is important to know the toxic metal concentrations in them.
The objective of this work is two-fold: (1) to use GFAA to accurately analyze the levels of Pb, Cd, and As present in some major spices commonly available on the market; and (2) to cross reference these measured levels to the recommended limits specified by the U.S. FDA.
Analysis of Pb, Cd and As in tea leaves using Graphite Furnace Atomic Absorption Tea is drunk by about half of the world’s population. It is widely cultivated and consumed in southeast Asia and is a rich source of many trace inorganic elements. Due to polluted soil, application of pesticides, fertilizers or industrial activities, there is the possibility that in addition to essential elements, toxic elements may also be present in tea leaves. There is often little information available about the safety of tea leaves and finished tea products with respect to heavy metal contamination.
Due to the significant amount of tea consumed, it is important to know the toxic metal contents. A major challenge in the analysis of tea leaves is the extremely low analyte levels and the very high matrix levels. For many years, GFAA has been a reliable technique and the preferred method for this analysis.

9
Frontier FT-IROur powerful and adaptable Frontier™ system meets all your biggest detection challenges today – and is flexible and expandable enough to meet the next big food fraud threat. With automated range switching, mid-, near-, and far-IR techniques are readily available. And with excellent signal-to-noise ratio and photometric performance, you get optimal spectral performance and sensitivity – a configurable platform that delivers dependable, consistent, trouble-free operation.
LAMBDA Series UV/Vis/NIRWith unmatched flexibility, higher accuracy and increased sensitivity, LAMBDA™ series UV/Vis offers wide array of sampling techniques and shorter sample setup time. The LAMBDA family makes it easy to generate methods for common food analysis without the need for extensive training, ensuring that the correct results are reported – and food and beverage quality is maintained. LAMBDA is a great choice for packaging characterization, color testing, browning index of fruit juices, purity of olive oil, enzymatic determination of alcohols, aldehydes, and malic acid and to detect wine color and intensity.
The DairyGuard Milk Powder Analyzer is one of a complete line of products designed to protect the public – and protect your brand – from a wide range of economic adulterants, either known or unknown. Oils, spices, dairy, nutraceuticals, and more: whatever foods you provide to an eager and hungry world, we have a solution for making them safer and ensuring their authenticity.
Food safety is in our nature.
Molecular Spectroscopy
Spectrum Two FT-NIRSimple yet powerful, compact and rugged: The Spectrum Two™ system is the spectrometer of choice for everyday screening, inside and outside the lab setting. It breaks new ground in operational simplicity, combining outstanding performance with low-maintenance design, and it spectral quality and analytical performance are perfect for a wide variety of applications – from raw materials identification to analysis of formulated food and nutraceuticals products. And its unique OpticsGuard™ humidity shield protects the instrument from the effects of harsh environments, with long-life desiccant for maximum uptime.
Spectrum Two N FT-NIRThe Spectrum Two N™ is a high-performance, yet robust and transportable FT-NIR system platform enabling simple, reliable NIR analyses. It’s the perfect system for labs that need to combine high-end performance with the ease-of-use features of a portable instrument, allowing users with different levels of expertise, from novice to seasoned professionals, to be proficient with it in no time.

10
Detection of honey adulteration using FT-NIR SpectroscopyA high-value product commonly associated with adulteration is honey. Adding corn syrup allows dishonest suppliers to maintain the sweet taste without a noticeable difference in the product. Without testing, it is hard to tell which honeys are adulterated and which are not.
Fourier Transform Near-Infrared Spectroscopy (FT-NIR) provides a quick, high quality testing method that allows for the detection of adulterants in honey.
Quality control of specialty fats on palm oilThe quality control parameters in the manufacturing of specialty fats, such as Free Fatty acid (FFA), Iodine Value (IV), moisture and impurities (MI), Peroxide Value (PV), and slip melting point (SMP), not only consume many chemicals, they also harbor the potential to cause environmental issues if left untreated.
To help reduce those issues, FT-IR can provide effective, environmental friendly solution that will save the palm oil industry both time and money.
Determination of wine color and total phenol content using UV/Vis SpectrophotometerWine contains over 600 nutritional substances including vitamins, organic acids and more importantly polyphenols. The seeds and skin of the grape provide a valuable source of polyphenols, and with increasing interest in their health-enhancing properties as antioxidants, research has gathered pace over the last 15 years.
UV/Vis Spectrophotometer allows quantification of total phenol content in the wines, and also wine color to be measured to determine quality and any potential contamination.
Molecular Spectroscopy - Applications
Determination of HMF in honey using UV/Vis SpectrophotometerThe level of Hydroxymethylfurfural (HMF) present is a key indicator as to the quality of honey. In this application note, the HMF content has been determined using the LAMBDA™ 465 UV/Vis Spectrophotometer and the Equation Calculation mode in the UV Lab™ software.
2
Fourier Transform Near-Infrared Spectroscopy (FT-NIR) provides a quick, high quality testing method that allows for the detection of adulterants in honey. In order to optimize the effectiveness of the technique, various data modelling approaches were tested.
Data Analysis Approaches for Detection of Adulterants
The detection of adulterants in products can be either targeted or non-targeted. In targeted approaches, such as Partial Least Squares (PLS), the adulterant is a specific material that you are looking for within the product. This allows for a quantitative measurement of the amount of that adulterant, assuming a suitable calibration has been generated from a series of calibration standards. Each adulterant material will require a separate calibration. A typical non-targeted approach, such as Soft Independent Modelling of Class Analogies (SIMCA), will inform the analyst if the product does not conform to the expected material profile. It will indicate that the product may be adulterated, but it cannot say what it is adulterated with and by how much.
Spectrum 10’s unique Adulterant Screen™ will inform the analyst when the product does not conform, identify the adulterant, and estimate the concentration of the adulterant without the lengthy requirement of running (multiple concentration) standards for each known adulterant and future adulterants. This allows for rapid deployment of initial Adulterant Screen methods and rapid method updating with new adulterants.
Experimental
NIR spectral data was collected on a PerkinElmer Frontier™ NIR spectrometer by pouring the honey sample into a Petri dish, placing the Petri dish onto the top of the NIRA II Reflectance Accessory, and placing a Transflectance Adaptor on top of the sample. Spectra were collected at 8 cm-1 resolution using a scan time of 30 seconds.
Spectra of the following pure samples were measured:
• Clover honey
• Wildflower honey
• Orange blossom honey
• Organic honey
• Corn syrup
• Rice syrup
Ten replicate spectra were measured for each of these pure materials.
In addition, dilutions of the pure material using corn syrup were prepared yielding the following concentrations:
• Clover Honey ♦ 0%, 2%, 4%, 6%, 8%, 10%, 12%, 14%, 16%, 18%,
20%, 30%, 40%, 50%, 60%, 70%, 80%, 90%, 92%, 94%, 96%, 98%, 100%
• Wildflower Honey ♦ 0%, 20%, 40%, 60%, 80%, 100%
• Organic Honey* ♦ 0%, 20%, 40%, 60%, 80%, 100%
Additional sample dilutions were prepared as validation samples to test the methods: The wildflower, orange blossom, clover, and organic honeys were diluted two separate times, once with 10% corn syrup and once with 10% rice syrup.
Results
Figure 1 contains the scans of three different samples with varying concentrations of honey (0% honey is Corn Syrup). There are clear spectral differences between the samples at these high concentrations. The second derivative (Figure 2) simplifies the view to quickly identify differences and will also remove any baseline offsets or slopes from the data.
A PLS quantitative model was generated from the clover honey/corn syrup standard mixtures. Figure 3 shows the calibration for the NIR estimated concentration versus the specified mixture concentrations for these standards. The data shows an excellent correlation indicating that PLS modeling may be successful in characterizing honeys with “known” adulterants.
Figure 2. Second derivative spectra of samples in Figure 1.
Figure 3. PLS model of honey dilutions with a line of best fit.
Figure 1. FT-NIR overlay demonstrating the typical spectra of honey.Figure 4. FT-NIR overlay demonstrating the typical spectra of honey.
Figure 5. Spectra of honey.

11
DSC 8000/8500 Differential Scanning CalorimetryDSC, breakthrough technology pioneered by PerkinElmer, has opened up new horizon for better food oriented solutions as well. The DSC 8000/8500 features our proprietary double furnace technology, which directly measures the heat flow difference between two independent furnaces. This design gives higher accuracy and sensitivity for even your most demanding food applications across variety of matrices.
DMA 8000 Mechanical AnalysisDMA 8000 accurately characterizes the modulus, compliance, damping and other bulk properties of materials. It is amazingly capable of measuring changes in rheological behavior under dynamic conditions as a function of temperature, time, frequency, stress, atmosphere, or a combination of these parameters. With a unique dual ability to carry out TMA and DMA measurements at will, this technology is your new age solution provider for your thermal applications. Be it any complex food matrices like Coffee powder or confectionery items, DMA 8000 is specially designed to give you the right results you are looking for.
TGA 8000 Thermogravimetric AnalyzerOur TGA 8000 Thermogravimetric Analyzer combines the best available sample atmosphere control, high throughput automation, and advanced hyphenation technology for better understanding of gases evolved during experiments. Delivering the throughput and performance you need in an easy-to-use, easy-to-maintain, automated system, our TGA 8000 is perfect for these applications. TGA 8000 is equipped with the capability to address complex matrices in the food we consume as well as any leachables that may be contaminating the packaging.
PerkinElmer’s hyphenated solutions couple two or more instruments to greatly increase the power of analysis and save precious time by acquiring more information from a single run. PerkinElmer’s TGA 8000™ coupled with FT-IR, MS, and/or GC/MS instruments represent the industry’s most complete and advanced line of hyphenated platforms. Its applications include identifying harmful chemicals in soil, quantitating components in polymers, determining leachables that may contaminate a product’s packaging, and identifying phthalates in PVC samples.
Hyphenation technology in food and agriculture!
Thermal Analysis

12
Practical applications of DSC in food analysisDifferential scanning calorimetry (DSC) is a useful technique for the characterization of food products, including:
• The gelatinization and staling (retrogradation) behavior of starches
• Polymorphism of fats such as cocoa butters and chocolate
• Effects of moisture content or absorbed moisture
• Aging effects
• Protein denaturation
• Determination of fat content or solid fat index (SFI)
DSC is particularly suitable for analysis of food systems because they are often subject to heating or cooling during processing. The calorimetric information from DSC can be directly used to understand the thermal transitions that the food system may undergo during processing or storage.
Dynamic Mechanical Analysis (DMA) of coffeeDMA is one of the most appropriate methods to study amorphous materials. The glass transition (Tg) is a key process in any material, and can be observed with ease by DMA. Both granulated instant coffee and granulated filter coffee were analyzed by DMA.
A multi-frequency experiment clearly shows complex relaxation processes and other phase transitions.
When run over a large temperature range, relaxations were observed as well as reproducible events below -150 °C.
Characterization of fats in cookies using powercompensation DSCThe Power Compensation or double furnace DSC yields excellent results for foods including the fat nature and content. The fast responsiveness of the Power Compensation DSC provides the highest possible resolution and this is critical for characterizing the various polymorphic melting forms associated with fats in foods.
Thermal Analysis - Applications
Type of samples Type of information
Oils, facts and spreadsOnset temp of melt / crystallisation / polymorphic behavior / oxidation stability
Flour and rice starchRetrogradation / gelatinization / glass transition Tg
Vegitable powders Glass transition Tg
Pastes and gels containing polysaccharides or gums
Specific heat Cp, onset of melt and crystallization
Protein Protein denaturation / aggregation
Table 2. Typical food samples and their application by DSC.
13
Food Testing Solutions Overview Guide
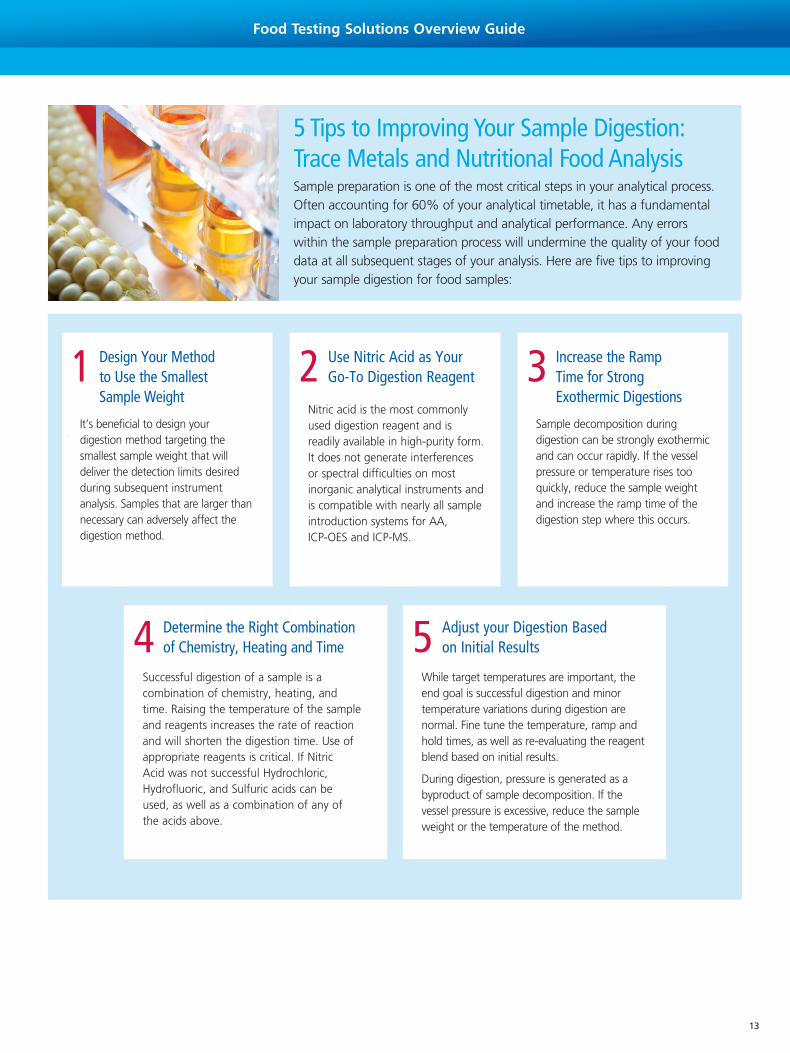
Successful digestion of a sample is a combination of chemistry, heating, and time. Raising the temperature of the sample and reagents increases the rate of reaction and will shorten the digestion time. Use of appropriate reagents is critical. If Nitric Acid was not successful Hydrochloric, Hydrofluoric, and Sulfuric acids can be used, as well as a combination of any of the acids above.
Determine the Right Combination of Chemistry, Heating and Time4
While target temperatures are important, the end goal is successful digestion and minor temperature variations during digestion are normal. Fine tune the temperature, ramp and hold times, as well as re-evaluating the reagent blend based on initial results.
During digestion, pressure is generated as a byproduct of sample decomposition. If the vessel pressure is excessive, reduce the sample weight or the temperature of the method.
Adjust your Digestion Based on Initial Results5
5 Tips to Improving Your Sample Digestion: Trace Metals and Nutritional Food AnalysisSample preparation is one of the most critical steps in your analytical process. Often accounting for 60% of your analytical timetable, it has a fundamental impact on laboratory throughput and analytical performance. Any errors within the sample preparation process will undermine the quality of your food data at all subsequent stages of your analysis. Here are five tips to improving your sample digestion for food samples:
It’s beneficial to design your digestion method targeting the smallest sample weight that will deliver the detection limits desired during subsequent instrument analysis. Samples that are larger than necessary can adversely affect the digestion method.
Design Your Method to Use the Smallest Sample Weight
1 Nitric acid is the most commonly used digestion reagent and is readily available in high-purity form. It does not generate interferences or spectral difficulties on most inorganic analytical instruments and is compatible with nearly all sample introduction systems for AA, ICP-OES and ICP-MS.
Use Nitric Acid as Your Go-To Digestion Reagent2
Sample decomposition during digestion can be strongly exothermic and can occur rapidly. If the vessel pressure or temperature rises too quickly, reduce the sample weight and increase the ramp time of the digestion step where this occurs.
Increase the Ramp Time for Strong Exothermic Digestions
3

14
Food Testing Solutions Overview Guide
Compositional analysis:Moisture, Total Solids, Fat, Protein, Fibre, Starch, Ash, pH, Lactose
DA 7250 NIR Analyzer Fast, accurate, easy-to-use NIR analysis system. It comes pre-calibrated for a wide range of applications to analyze whole grains, powders, pastes, pellets, slurries and liquids on one instrument. Case designed for at-line placement.
DA 7300 In-line NIREnables real-time information about the product as it is produced. Immediate access to this information, without having to wait for laboratory measurements, provides a number of advantages:
• Enables automatic process control
• Allows immediate manual intervention.
• Faster start-up and grade changes
• Complete traceability of the entire production
DA 7440 On-line NIRThe DA 7440 is an advanced, modern and versatile on-line NIR sensor for over-the-belt type measurements. It performs real-time multi-constituent measurements of a product on a processing line providing information for process control and quality monitoring.
Continuous process monitoring helps users to increase efficiency and reduce scrap and re-work while improving product consistency and quality.
Analytical Solutions for Agri Food IndustriesFor over half a century, Perten Instruments has been a leading supplier of advanced analytical instruments to the agricultural industries. By adding Perten’s analysis platforms, along with its leading food quality calibration database to the existing portfolio of analytical instruments, we are now holistically equipped to firmly assist our customers and provide comprehensive solutions for both functional and compositional analysis to the grain, flour, feed and food industries

15
Food Testing Solutions Overview Guide
Analytical Solutions for Agri Food Industries
Falling Number SystemThe Falling Number® System measures the alpha-amylase enzyme activity in grains and flour to detect sprout damage, optimize flour enzyme activity and guarantee soundness of traded grain.
Alpha-amylase activity is crucial for final product quality of bread, pasta, noodles and malt. Anyone handling wheat, barley, rye or sorghum intended for these applications will benefit from the Falling Number system.
TVT Texture AnalyzerTVT Texture Analyzer measures texture on a wide range of products. A fast and simple test o determine performance and quality characteristics.
Lab MillsA range of hammer and disk lab mills for proper and convenient sample preparation for many tests used in the grain and food industry.
Rapid Visco Analyzer (RVA)RVA is a unique tool for product development, quality and process control and quality assurance.
It provides valuable information on viscosity, mouth-feel and degree of cook for varied samples:
Native and modified starches, for-mulated foods (sauce, ketchup, may-onnaise, soup), cooked & extruded foods etc.
Glutomatic System When baking bread and producing noodles or pasta, the flour gluten content and strength will determine the quality of the finished product. The Glutomatic System is the world standard for determination of gluten quantity and quality.
Measures wet gluten content, dry gluten content and the Gluten Index.
Functional analysis:Viscosity, Texture, Color, Melting Point, Volume, Gluten

16
Food Testing Solutions Overview Guide
Complete Analysis Solutions for Milk and Dairy ProductsTogether with Perten and Delta instruments we offer the widest range of analyzers for the dairy industry – from milk analysis, through the production process, to your finished products. Our milk analyzers will work according to internationally recognized standards like IDF, ISO and ICAR.
Delta LactoScope FT-IR The LactoScope™ FT-IR Milk Analyzer is AOAC and IDF approved for the analysis of fat, protein, lactose, and total solids in milk. With its’ 30-second response time it is an ideal component analysis tool for busy dairy laboratories.
The LactoScope FT-IR can test other products such as cream, yogurt and whey thereby increasing its value and versatility.
Delta LactoScope FilterThe LactoScope™ C3+/C4+ is the perfect solution for all dairy processors that require highly cost effective dairy component analysis without the expense of unneeded capabilities.
The LactoScope Filter is a simpler instrument for milk and cream products and smaller product sites.
Delta SomaScope SmartThe DA 7440 is an advanced, modern and versatile on-line NIR sensor for over-the-belt type measurements. It performs real-time multi-constituent measurements of a product on a processing line providing information for process control and quality monitoring.
Continuous process monitoring helps users to increase efficiency and reduce scrap and re-work while improving product consistency and quality.
Our comprehensive portfolio of milk and dairy analyzers are uniquely equipped to measure both of these important sets of attributes.
Compositional information:Lactose, fat, total solids, protein, moisture etc. required for formulation and nutritional information.
Functional information:How the product will perform – melt, flow, stick, etc. – under specific conditions in a specific formulation or matrix
Milk analyzers:Quality control, product pricing, milk standardization
Porcine Detection Kits for Quick, On the Spot Results with High Sensitivity
PerkinElmer offers two breakthrough Porcine Detection Kits to provide rapid screening for pork that may be present in other types of meat. This provides on-the-spot testing for processed or raw meat, and provides quick results with high sensitivity, before sending samples to the lab. With religious requirements adding an additional layer of surveillance and concern, certifying agencies, contract laboratories, and food manufacturers will find this helpful in assessing the purity of meat products.
Safer, Healthier Halal Food – Ensuring Halalan Toyyiban
Porcine Detection Kits Characteristics
Detection Time Approximately 15-25 minutes per test cycle
TechnologyNo instrumentation or calibration requires - antibody detection based technology
Operation Costs Does not have any consumables and parts to maintain
Sensitivity0.5% pork in processed meat and 0.05% pork in raw meat yields a positive result
Operator Skill RequiredVery simple operation - self trained by following operating instructions

17
Food Testing Solutions Overview Guide
Food and Feed Safety Diagnostic Assay Kits
Expanding our food testing capabilities further, we have diverse portfolio of food and feed diagnostic kits from Bioo Scientific, for the detection of microbial and industrial contaminants, natural toxins, constituents, hormones, antibiotics and a variety of other veterinary drug residues. Some highlights of Bioo Scientific’s food and feed safety product line include:
• The most sensitive ELISA available for tetracycline detection which includes ready-to-use standards
• The broadest range of kits for flouroquinolone residue detection with the best cross reactivity available
• A single extraction protocol that can be used for testing samples with all of our AHD, SEM, AMOZ and AOZ ELISAs for the detection of nitrofuran antibiotics
• Detection assays that cover all of the major sulfa group drugs
• Reusable immunoaffinity columns for the purification and enrichment of mycotoxins
General food safety• Diverse portfolio of kits used for the detection
of drug residues, toxins, pesticide residue and constituents in food.
Dairy and grain• Lateral flow, ELISA and immunoaffinity columns
for analysis of antibiotics, hormones and toxins in dairy and grain.
• Kits for analysis of constituents.
Our AlphaLISA food contamination detection assay kits offer homogenous (no-wash) alternative for aflatoxin, chloramphenicol, soybean agglutinin, and beef troponin. AlphaLISA has proven to be more feasible and robust than conventional ELISA, requiring much lesser sample and producing high dynamic range and reproducibility.
Detection and quantification of food contaminants using AlphaLISA®
Targets:• Chloramphenicol
• Chloramphenicol (biotin free)
• Total Aflatoxin
• Beef Troponin
• Soy agglutinin

18
Food Testing Solutions Overview Guide
Consumables and Accessories
The best consumables for the mostdemanding applicationsPerkinElmer offers a comprehensive collection of consumables and accessories for all your analytical needs, whatever the brand or model of your instrument. We offer a wide range of consumables for chromatography, atomic spectroscopy and molecular spectroscopy. We have recently expanded our portfolio in GC and HPLC to incorporate gas filtration systems, capillary columns, columns for UHPLC and columns featuring fused core technology. We are also able to offer a complete solution for sample preparation including SPE cartridges, 96-well plates and QuEChERS.
When you order PerkinElmer consumables, supplies and accessories, you can enjoy peace of mind, ease of ordering, and a flexible E-commerce system designed to suit your needs. PerkinElmer invests heavily to test and validate the quality of our products and systems to ensure that you receive accurate, repeatable results, on-time, every time.
Supra-d QuEChERS Dispersive SPE kits ensures simple, error-free and high quality extractions, thereby improving lab productivity and resulting in fewer errors.
Nothing beats good preparation.
Features and Benefits:• High recoveries are achieved for more accurate analyses
• Up to four times faster than traditional methods
• Low solvent usage and waste for maximum cost savings

19
Food Testing Solutions Overview Guide
Informatics Solutions for Food Analysis
It is very inevitable that ensuring the safety and quality of food and beverage products is paramount in the success of any laboratory. Now, capture experiment data related to product innovation and perform data analysis surrounding traceability, contaminant tracking, formulations and compliance verification with efficiency and accuracy.
The features of PerkinElmer’s leading-edge informatics solutions make it possible to save both time and money while producing a superior food and beverage quality analysis. Scientists have a complete package of data capture, data management as well as data analysis and visualization to better harness information for more informed insights and decisions. The interoperability of PerkinElmer’s E-Notebook™ Solutions with the TIBCO Spotfire® platform puts all of the information in one place.
Trace food contaminant origin from initial ingredients to the final product
• Drill down into clusters of multidimensional data
• Hierarchically categorize ingredient and additive data
• Interact with data across all visualizations
TIBCO Spotfire®
TIBCO Spotfire® for Inorganic Food Dashboard provides a tool to perform data analysis protocols with efficiency and accuracy. The features of this dashboard make it possible to save both time and money while producing a superior contaminant tracking analysis.
• 3D Scatterplot: Formatted to make clear distinctions between clusters of data, the 3D scatterplot utilizes color, size and marker by options allowing data to be viewed by type as well as country of origin.
• Treemap: The Treemap categorizes data hierarchically providing a comprehensive layout; ingredients fall under the classification of raw or final product, are then separated by type of ingredient, and further by country of origin.
• Traceability Chart: A Traceability Chart has been included to pinpoint any contaminant issues that occur during the production process.
• 2D Scatterplots: 2D Scatterplots visualize data above and below contaminant limits. For quick reference, a horizontal line has been placed at each contaminant’s limit value.
• Interactivity: Each visualization has been constructed from the data within the SpotfireInorganicFoodv1 Data Table. This allows markings from one visualization to be simultaneously applied to all others. Utilizing this functionality, results that are shown above the contaminant threshold of a particular element can be marked and analyzed on other pages of the analysis.

For a complete listing of our global offices, visit www.perkinelmer.com/ContactUs
Copyright ©2018, PerkinElmer, Inc. All rights reserved. PerkinElmer® is a registered trademark of PerkinElmer, Inc. All other trademarks are the property of their respective owners. 014099_01 PKI
PerkinElmer, Inc. 940 Winter Street Waltham, MA 02451 USA P: (800) 762-4000 or (+1) 203-925-4602www.perkinelmer.com
E-NotebookPerkinElmer’s E-Notebook solutions facilitate collaboration with internal and external partners, enhance data quality, and helps to increase the productivity of researchers across an entire organization and/or research network. The E-Notebook collaborative framework is robust, allowing scientists to capture experimental procedures and results to define and protect intellectual property and to share that insight organization-wide.
The solutions include E-Notebook operating on an enterprise level, Signals™ Notebook a Cloud based electronic lab notebook (ELN) as well as a connector which provides a mechanism for E-Notebook and Signals Notebook to exchange experimental protocols and results. The E-Notebook Collaboration Platform can be used by food scientists facilitating the sharing of data and knowledge.
In addition, E-Notebook is part of a complete Collaboration to Insight Solution which also includes TIBCO Spotfire® for advanced data analysis and visualization.
Informatics Solutions for Food Analysis
The color of food has an overwhelming impact on our per-ception of taste. Certain colors provoke an idea of freshness, fruitiness, earthiness, even rot. Lackluster appearance of a product may mean fewer consumers pick it off the shelf, and in turn, less profit for the manufacturer. This pressure to produce consistently appealing food products has led to an increased use of dye additives in processed food and thus a need to implement stringent quality control.
The TIBCO Spotfire® Software for UV Instrumentation Food Dye Dashboard has been designed to ensure your food dyes comply with FDA guidelines regarding their use, though can be modified for other international regulations. With the ability to insert custom equations calculating dye concentration in food, track trends of total color percentage and optionally visualize quantities of contaminants from alternative tests, the Food Dye Dashboard is the versatile visualization tool for your industrial food dye needs.
Key Features:• Compare unknown food dye samples with known samples
for identification
• Quickly pinpoint data of concern and analyze across multiple visualizations
• Analyze results from any number of laboratory tests in conjunction with FDA regulations
TIBCO Spotfire® Software for UV Instrumentation: Food Dye Dashboard