
Hoffman +the+Patient+as+Interpreter+of+the+Analyst's+Experience

OAK ASSOCIATES, ltd.
Analyst's Handbook: Materials
March 29, 2005
Dr. Edward Yardeni
Mali Quintana
Please visit our websites atwww.yardeni.com &
www.oakassociates.com

Table Of Contents
Figures Page
S&P 500 Materials 3
S&P 400 Materials 4
Squiggles: Materials 5
Squiggles: Aluminum 6
Squiggles: Diversified Chemicals 7
Squiggles: Paper Products 8
Squiggles: Specialty Chemicals 9
Squiggles: Steel 10
Net Earnings Revisions 11
Earnings Growth 12
Earnings Growth Spreads 13
Forward Earnings & Prices 14
Commodities 15
Earnings & Price Cycles 16
Chemicals 17-18
Metals (Fabricated) 19-21
Metals (Primary) 22-24
Paper Products 25-26
Petroleum 27
Plastics & Rubber Products 28
Page 2 / March 29, 2005 / Analyst’s Handbook: Materials OAK ASSOCIATES, ltd.www.oakassociates.com

Figure 1.
1998 1999 2000 2001 2002 2003 2004 2005 200690
110
130
150
170
190
210
230
3/28
MATERIALS__________
1998 1999 2000 2001 2002 2003 2004 2005 200620
40
60
80
100
120
140
160
180
200
220
3/28
DIVERSIFED METALS & MINING___________________________FCX PD
1998 1999 2000 2001 2002 2003 2004 2005 200680
100
120
140
160
180
200
3/28
PAPER PRODUCTS_________________GP IP MWV
1998 1999 2000 2001 2002 2003 2004 2005 2006100
125
150
175
200
225
250
275
300
3/28
DIVERSIFIED CHEMICALS_______________________DD DOW EC EMN HPC PPG
1998 1999 2000 2001 2002 2003 2004 2005 2006100
150
200
250
300
3/28
ALUMINUM__________AA
1998 1999 2000 2001 2002 2003 2004 2005 200675
100
125
150
175
200
225
3/28SPECIALTY CHEMICALS_____________________ECL GLK IFF ROH SIAL
1998 1999 2000 2001 2002 2003 2004 2005 200630
50
70
90
110
130
150
170
3/28
STEEL______ATI NUE WOR X
200-day average.Source: Standard & Poor’s Corporation.
1998 1999 2000 2001 2002 2003 2004 2005 200625
50
75
100
125
150
3/28
GOLD_____NEM
yardeni.com
- S&P 500 Materials -
Page 3 / March 29, 2005 / Analyst’s Handbook: Materials www.oakassociates.com
OAK ASSOCIATES, ltd.

Figure 2.
1998 1999 2000 2001 2002 2003 2004 2005 200680
100
120
140
160
180
200
3/28
MATERIALS__________
1998 1999 2000 2001 2002 2003 2004 2005 200680
100
120
140
160
180
200
3/28
SPECIALTY CHEMICALS_____________________ALB CK CYT FOE LZ MTX RPM SXT VAL
1998 1999 2000 2001 2002 2003 2004 2005 200675
125
175
225
3/28
PAPER PACKAGING_________________LFB PKG SON
1998 1999 2000 2001 2002 2003 2004 2005 20062
3
4
5
6
7
3/28
DIVERSIFIED CHEMICALS______________________CBT FMC OLN
1998 1999 2000 2001 2002 2003 2004 2005 200690
110
130
150
170
190
3/28
PAPER PRODUCTS_________________BOW GLT PCH
1998 1999 2000 2001 2002 2003 2004 2005 20060
50
100
150
200
250
3/28
FERTILIZERS & AGRICULTURAL CHEMICALS______________________________________IGL SMG
1998 1999 2000 2001 2002 2003 2004 2005 20065075
100125150175200225250275300325350
3/28
DIVERSIFIED METALS & MINING____________________________ACI BTU
200-day moving average.Source: Standard & Poor’s Corporation.
1998 1999 2000 2001 2002 2003 2004 2005 2006100
150
200
250
300
350
400
3/28
CONSTRUCTION MATERIALS_________________________MLM
yardeni.com
- S&P 400 Materials -
Page 4 / March 29, 2005 / Analyst’s Handbook: Materials www.oakassociates.com
OAK ASSOCIATES, ltd.
1995 1996 1997 1998 1999 2000 2001 2002 2003 2004 2005 20063
4
5
6
7
8
9
10
11
12
13141516
3
4
5
6
7
8
9
10
11
12
13141516
Mar
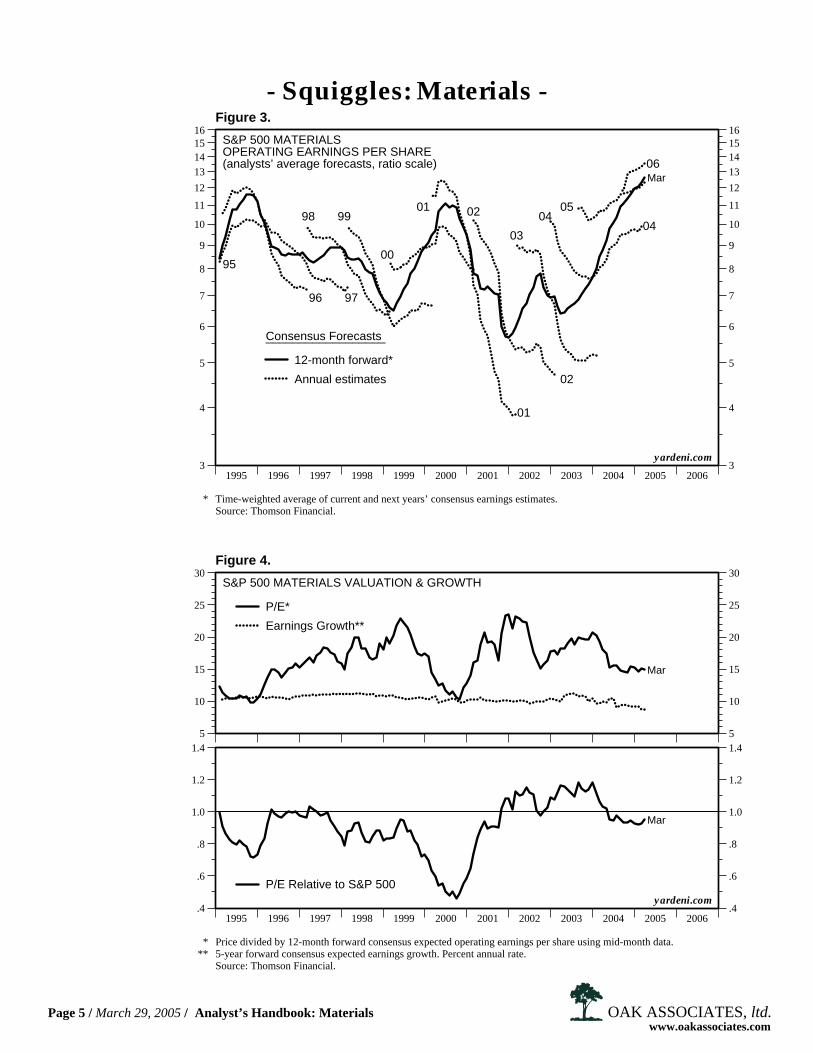
S&P 500 MATERIALSOPERATING EARNINGS PER SHARE(analysts’ average forecasts, ratio scale)
Consensus Forecasts__________________
Annual estimates
12-month forward*
95
96 97
98 99
00
01
01
02
02
03
0404
05
06
* Time-weighted average of current and next years’ consensus earnings estimates.Source: Thomson Financial.
yardeni.com
Figure 3.
5
10
15
20
25
30
5
10
15
20
25
30
Mar
1995 1996 1997 1998 1999 2000 2001 2002 2003 2004 2005 2006.4
.6
.8
1.0
1.2
1.4
.4
.6
.8
1.0
1.2
1.4
Mar
S&P 500 MATERIALS VALUATION & GROWTH
P/E*
Earnings Growth**
P/E Relative to S&P 500
* Price divided by 12-month forward consensus expected operating earnings per share using mid-month data.** 5-year forward consensus expected earnings growth. Percent annual rate.
Source: Thomson Financial.
yardeni.com
Figure 4.
- Squiggles: Materials -
Page 5 / March 29, 2005 / Analyst’s Handbook: Materials www.oakassociates.com
OAK ASSOCIATES, ltd.

1995 1996 1997 1998 1999 2000 2001 2002 2003 2004 2005 20065
10
15
20
25
5
10
15
20
25
Mar
S&P 500 ALUMINUMOPERATING EARNINGS PER SHARE(analysts’ average forecasts, ratio scale)
Consensus Forecasts__________________
Annual estimates
12-month forward*
95
96
97 9899
99
00
01
01
02
02
03
03
04
04
05
06
* Time-weighted average of current and next years’ consensus earnings estimates.Source: Thomson Financial.
yardeni.com
Figure 5.
5
10
15
20
25
5
10
15
20
25
Mar
1995 1996 1997 1998 1999 2000 2001 2002 2003 2004 2005 2006.4
.5
.6
.7
.8
.9
1.0
1.1
1.2
1.3
.4
.5
.6
.7
.8
.9
1.0
1.1
1.2
1.3
Mar
S&P 500 ALUMINUM VALUATION & GROWTH
P/E*
Earnings Growth**
P/E Relative to S&P 500
* Price divided by 12-month forward consensus expected operating earnings per share using mid-month data.** 5-year forward consensus expected earnings growth. Percent annual rate.
Source: Thomson Financial.
yardeni.com
Figure 6.
- Squiggles: Aluminum -
Page 6 / March 29, 2005 / Analyst’s Handbook: Materials www.oakassociates.com
OAK ASSOCIATES, ltd.

1995 1996 1997 1998 1999 2000 2001 2002 2003 2004 2005 20064
6
8
10
12
14
16
18
20
4
6
8
10
12
14
16
18
20
Mar
S&P 500 DIVERSIFIED CHEMICALSOPERATING EARNINGS PER SHARE(analysts’ bottom-up forecasts, ratio scale)
Consensus Forecasts__________________
Annual estimates
12-month forward*
95
96 97 9899
00
01
02
03
04
04
0506
* Time-weighted average of current and next years’ consensus earnings estimates.Source: Thomson Financial.
yardeni.com
Figure 7.
5
10
15
20
25
30
5
10
15
20
25
30
Mar
1995 1996 1997 1998 1999 2000 2001 2002 2003 2004 2005 2006.4
.6
.8
1.0
1.2
1.4
.4
.6
.8
1.0
1.2
1.4
Mar
S&P 500 DIVERSIFIED CHEMICALS VALUATION & GROWTHP/E*
Earnings Growth**
P/E Relative to S&P 500
* Price divided by 12-month forward consensus expected operating earnings per share using mid-month data.** 5-year forward consensus expected earnings growth. Percent annual rate.
Source: Thomson Financial.
yardeni.com
Figure 8.
- Squiggles: Diversified Chemicals -
Page 7 / March 29, 2005 / Analyst’s Handbook: Materials www.oakassociates.com
OAK ASSOCIATES, ltd.

1995 1996 1997 1998 1999 2000 2001 2002 2003 2004 2005 20061
4
7
10
13
16
19222528
1
4
7
10
13
16
19222528
Mar
S&P 500 PAPER PRODUCTSOPERATING EARNINGS PER SHARE(analysts’ average forecasts, ratio scale)
Consensus Forecasts__________________
Annual estimates
12-month forward*
95
96
97
96
9899
00
01
01
02
02
03
03
04
04
05 06
* Time-weighted average of current and next years’ consensus earnings estimates.Source: Thomson Financial.
yardeni.com
Figure 9.
0
5
10
15
20
25
30
35
0
5
10
15
20
25
30
35
Mar
1995 1996 1997 1998 1999 2000 2001 2002 2003 2004 2005 2006.0
.5
1.0
1.5
2.0
.0
.5
1.0
1.5
2.0
S&P 500 PAPER PRODUCTS VALUATION & GROWTH
P/E*Earnings Growth**
P/E Relative to S&P 500
Mar
* Price divided by 12-month forward consensus expected operating earnings per share using mid-month data.** 5-year forward consensus expected earnings growth. Percent annual rate.
Source: Thomson Financial.
yardeni.com
Figure 10.
- Squiggles: Paper Products -
Page 8 / March 29, 2005 / Analyst’s Handbook: Materials www.oakassociates.com
OAK ASSOCIATES, ltd.

1995 1996 1997 1998 1999 2000 2001 2002 2003 2004 2005 20065
7
9
11
13
15
5
7
9
11
13
15
Mar
S&P 500 SPECIALTY CHEMICALSOPERATING EARNINGS PER SHARE(analysts’ average forecasts, ratio scale)
Consensus Forecasts__________________
Annual estimates
12-month forward*
95
96
9798 99
00
01
01
02
02
03
04
04
05
06
* Time-weighted average of current and next years’ consensus earnings estimates.Source: Thomson Financial.
yardeni.com
Figure 11.
5
10
15
20
25
5
10
15
20
25
Mar
1995 1996 1997 1998 1999 2000 2001 2002 2003 2004 2005 2006.4
.6
.8
1.0
1.2
1.4
.4
.6
.8
1.0
1.2
1.4
Mar
S&P 500 SPECIALTY CHEMICALS VALUATION & GROWTH
P/E*
Earnings Growth**
P/E Relative to S&P 500
* Price divided by 12-month forward consensus expected operating earnings per share using mid-month data.** 5-year forward consensus expected earnings growth. Percent annual rate.
Source: Thomson Financial.
yardeni.com
Figure 12.
- Squiggles: Specialty Chemicals -
Page 9 / March 29, 2005 / Analyst’s Handbook: Materials www.oakassociates.com
OAK ASSOCIATES, ltd.

1995 1996 1997 1998 1999 2000 2001 2002 2003 2004 2005 2006-2
0
2
4
6
8
10
12
14
16
-2
0
2
4
6
8
10
12
14
16
Mar
S&P 500 STEEL OPERATING EARNINGS PER SHARE(analysts’ average forecasts)
Consensus Forecasts__________________
Annual estimates
12-month forward*
95
96
97
98
9900
01
02
03
04
06
05
05
04
* Time-weighted average of current and next years’ consensus earnings estimates.Source: Thomson Financial.
yardeni.com
Figure 13.
5
10
15
20
25
30
35
40
45
5
10
15
20
25
30
35
40
45
Mar
1995 1996 1997 1998 1999 2000 2001 2002 2003 2004 2005 2006.25
.50
.75
1.00
1.25
1.50
1.75
2.00
2.25
.25
.50
.75
1.00
1.25
1.50
1.75
2.00
2.25
Mar
S&P 500 STEEL VALUATION & GROWTH
P/E*
Earnings Growth**
P/E Relative to S&P 500
* Price divided by 12-month forward consensus expected operating earnings per share using mid-month data.** 5-year forward consensus expected earnings growth. Percent annual rate.
Source: Thomson Financial.
yardeni.com
Figure 14.
- Squiggles: Steel -
Page 10 / March 29, 2005 / Analyst’s Handbook: Materials www.oakassociates.com
OAK ASSOCIATES, ltd.

Figure 15.
1996 1997 1998 1999 2000 2001 2002 2003 2004 2005 2006-40
-30
-20
-10
0
10
20
30
Mar
S&P 500 MATERIALS(% estimates up less down)__________________
1996 1997 1998 1999 2000 2001 2002 2003 2004 2005 2006-60
-40
-20
0
20
40
Mar
DIVERSIFIED CHEMICALS______________________DD DOW EC EMN HPC PPG
1996 1997 1998 1999 2000 2001 2002 2003 2004 2005 2006-80
-60
-40
-20
0
20
40
60
Mar
PAPER PRODUCTS_________________GP IP MWV
1996 1997 1998 1999 2000 2001 2002 2003 2004 2005 2006-60
-40
-20
0
20
40
Mar
SPECIALTY CHEMICALS_____________________ECL GLK IFF ROH SIAL
1996 1997 1998 1999 2000 2001 2002 2003 2004 2005 2006-60
-40
-20
0
20
40
Mar
ALUMINUM__________AA
1996 1997 1998 1999 2000 2001 2002 2003 2004 2005 2006-60
-40
-20
0
20
40
Mar
DIVERSIFIED METALS & MINING____________________________FCX PD
1996 1997 1998 1999 2000 2001 2002 2003 2004 2005 2006-60
-40
-20
0
20
40
60
Mar
STEEL______ATI NUE X
Note: 3-month moving average of 12-month forward consensus expected operating earnings per share using mid-month consensus forecast. Source: Thomson Financial.
1996 1997 1998 1999 2000 2001 2002 2003 2004 2005 2006-40
-20
0
20
40
Mar
GOLD_____NEM
yardeni.com
- Net Earnings Revisions -
Page 11 / March 29, 2005 / Analyst’s Handbook: Materials www.oakassociates.com
OAK ASSOCIATES, ltd.

Figure 16.
1995 1996 1997 1998 1999 2000 2001 2002 2003 2004 2005 2006-10
0
10
20
30
40
50
60
70
-10
0
10
20
30
40
50
60
70
Mar
S&P 500 MATERIALS vs. S&P 500(percent)
STEG*_____
S&P 500 Materials
S&P 500
1995 1996 1997 1998 1999 2000 2001 2002 2003 2004 2005 20065
10
15
20
5
10
15
20
Mar
LTEG*_____
S&P 500 Materials
S&P 500
1995 1996 1997 1998 1999 2000 2001 2002 2003 2004 2005 2006-10
0
10
20
30
40
50
60
70
-10
0
10
20
30
40
50
60
70
Mar
S&P 500 Materials_______________
STEG*
LTEG*
yardeni.com
* Short-term earnings growth: 12-month forward consensus earnings growth. Long-term earnings growth: 5-year forward consensus expected earnings growth.
Source: Thomson Financial.
- Earnings Growth -
Page 12 / March 29, 2005 / Analyst’s Handbook: Materials www.oakassociates.com
OAK ASSOCIATES, ltd.

Figure 17.
1995 1996 1997 1998 1999 2000 2001 2002 2003 2004 2005 2006-20
-10
0
10
20
30
40
50
-20
-10
0
10
20
30
40
50
Mar
S&P 500 MATERIALS vs. S&P 500(percentage points)
Materials Less S&P 500 STEG*
1995 1996 1997 1998 1999 2000 2001 2002 2003 2004 2005 2006-10
-9
-8
-7
-6
-5
-4
-3
-2
-1
0
1
2
3
-10
-9
-8
-7
-6
-5
-4
-3
-2
-1
0
1
2
3
Mar
Materials Less S&P 500 LTEG*
1995 1996 1997 1998 1999 2000 2001 2002 2003 2004 2005 2006-20
-10
0
10
20
30
40
50
60
-20
-10
0
10
20
30
40
50
60
Mar
Materials STEG*Less Materials LTEG*
yardeni.com
* Short-term earnings growth: 12-month forward consensus earnings growth. Long-term earnings growth: 5-year forward consensus expected earnings growth.
Source: Thomson Financial.
- Earnings Growth Spreads -
Page 13 / March 29, 2005 / Analyst’s Handbook: Materials www.oakassociates.com
OAK ASSOCIATES, ltd.

1997 1998 1999 2000 2001 2002 2003 2004 20055
6
7
8
9
10
11
12
13
200
225
250
275
300
325
350
375
3/22
MarS&P 500 EARNINGS & PRICES:MATERIALS
CRB Raw IndustrialsSpot Price Index(weekly)
S&P 500 Forward Earnings:Materials*
* 12-month forward consensus expected operating earnings per share. Time-weighted average of current and next year’sconsensus earnings estimates.Source: Thomson Financial and Commodity Research Bureau.
yardeni.com
Figure 18.
1997 1998 1999 2000 2001 2002 2003 2004 20055
6
7
8
9
10
11
12
13
150
200
250
300
350
400
3/22
MarS&P 500 EARNINGS & PRICES
CRB MetalsSpot Price Index(weekly)
S&P 500 Forward Earnings:Materials*
* 12-month forward consensus expected operating earnings per share. Time-weighted average of current and next year’sconsensus earnings estimates.Source: Commodity Research Bureau and Thomson Financial.
yardeni.com
Figure 19.
- Forward Earnings & Prices -
Page 14 / March 29, 2005 / Analyst’s Handbook: Materials www.oakassociates.com
OAK ASSOCIATES, ltd.

86 87 88 89 90 91 92 93 94 95 96 97 98 99 00 01 02 03 04 05 06200
225
250
275
300
325
350
375
200
225
250
275
300
325
350
375
3/22
Source: Commodity Research Bureau.
CRB RAW INDUSTRIALS SPOT PRICE INDEX*(1967=100)
* Includes copper scrap, lead scrap, steel scrap, tin, zinc, burlap, cotton, print cloth, wool tops, hides, rosin,rubber, and tallow.
yardeni.com
Figure 20.
81 82 83 84 85 86 87 88 89 90 91 92 93 94 95 96 97 98 99 00 01 02 03 04 05 06150
200
250
300
350
400
150
200
250
300
350
400
3/28
CRB METALS SPOT PRICE INDEX*(1967=100)
* Includes copper scrap, lead scrap, steel scrap, tin, and zinc.Source: Commodity Research Bureau.
yardeni.com
Figure 21.
- Commodities -
Page 15 / March 29, 2005 / Analyst’s Handbook: Materials www.oakassociates.com
OAK ASSOCIATES, ltd.
1995 1996 1997 1998 1999 2000 2001 2002 2003 2004 2005 20060
5
10
15
20
-20
-10
0
10
20
30
40
Mar
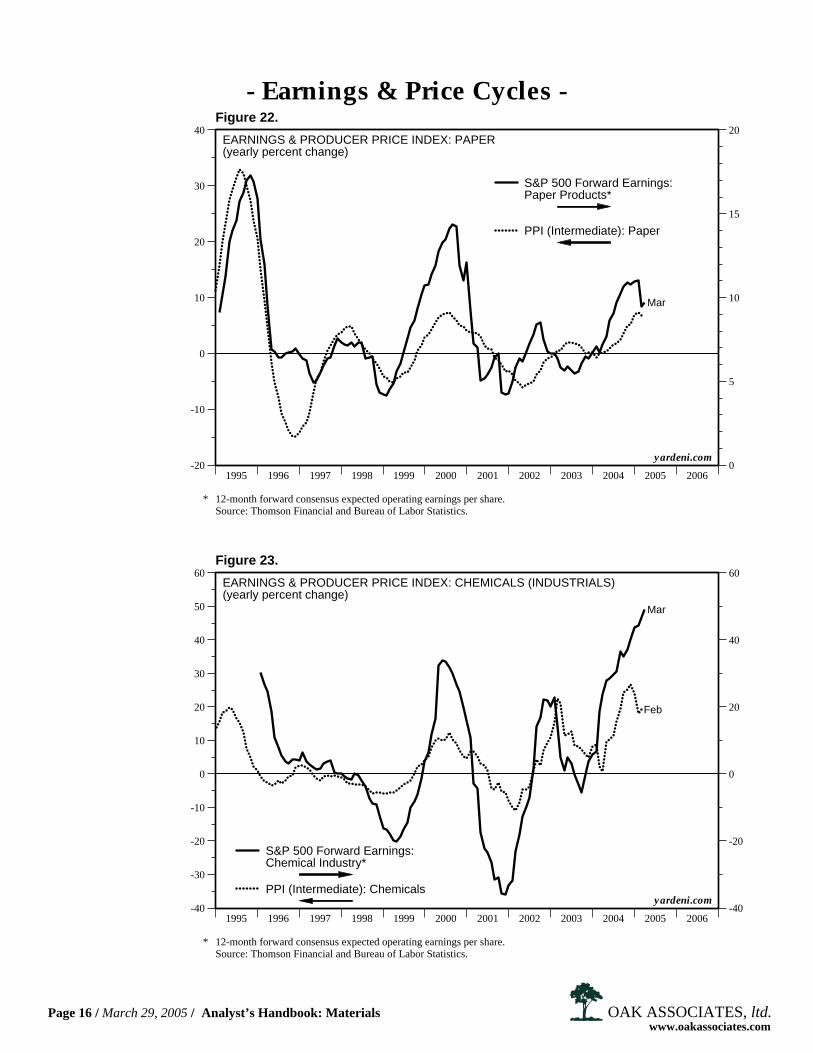
EARNINGS & PRODUCER PRICE INDEX: PAPER(yearly percent change)
PPI (Intermediate): Paper
S&P 500 Forward Earnings:Paper Products*
* 12-month forward consensus expected operating earnings per share.Source: Thomson Financial and Bureau of Labor Statistics.
yardeni.com
Figure 22.
1995 1996 1997 1998 1999 2000 2001 2002 2003 2004 2005 2006-40
-20
0
20
40
60
-40
-30
-20
-10
0
10
20
30
40
50
60
Feb
Mar
EARNINGS & PRODUCER PRICE INDEX: CHEMICALS (INDUSTRIALS)(yearly percent change)
PPI (Intermediate): Chemicals
S&P 500 Forward Earnings:Chemical Industry*
* 12-month forward consensus expected operating earnings per share.Source: Thomson Financial and Bureau of Labor Statistics.
yardeni.com
Figure 23.
- Earnings & Price Cycles -
Page 16 / March 29, 2005 / Analyst’s Handbook: Materials www.oakassociates.com
OAK ASSOCIATES, ltd.

1992 1993 1994 1995 1996 1997 1998 1999 2000 2001 2002 2003 2004 2005 2006300
325
350
375
400
425
450
475
500
525
550
300
325
350
375
400
425
450
475
500
525
550
JanBASIC CHEMICALS SHIPMENTS(billion dollars, saar)
Shipments
Source: U.S. Department of Commerce, Bureau of the Census.
yardeni.com
Figure 24.
1993 1994 1995 1996 1997 1998 1999 2000 2001 2002 2003 2004 2005 200685
90
95
100
105
110
115
120
85
90
95
100
105
110
115
120
Feb
CHEMICALS INDUSTRIAL PRODUCTION(1997=100)
Source: Board of Governors of the Federal Reserve System.
yardeni.com
Figure 25.
- Chemicals -
Page 17 / March 29, 2005 / Analyst’s Handbook: Materials www.oakassociates.com
OAK ASSOCIATES, ltd.

1993 1994 1995 1996 1997 1998 1999 2000 2001 2002 2003 2004 2005 2006-4
-2
0
2
4
6
-4
-2
0
2
4
6
Jan
BASIC CHEMICALS INVENTORIES(billion dollars, yearly change)
Source: U.S. Department of Commerce, Bureau of the Census.
yardeni.com
Figure 26.
85 86 87 88 89 90 91 92 93 94 95 96 97 98 99 00 01 02 03 04 05 06-20
-15
-10
-5
0
5
10
15
20
25
30
35
-20
-15
-10
-5
0
5
10
15
20
25
30
35
Feb
CHEMICALS (INDUSTRIAL) PRODUCER PRICE INDEX(yearly percent change)
PPI
Source: U.S. Department of Labor, Bureau of Labor Statistics.
yardeni.com
Figure 27.
- Chemicals -
Page 18 / March 29, 2005 / Analyst’s Handbook: Materials www.oakassociates.com
OAK ASSOCIATES, ltd.

1993 1994 1995 1996 1997 1998 1999 2000 2001 2002 2003 2004 2005 2006160
170
180
190
200
210
220
230
240
250
260
270
280
290
300
160
170
180
190
200
210
220
230
240
250
260
270
280
290
300
Feb
FABRICATED METALS ORDERS & SHIPMENTS(billion dollars, 3-month ma, saar)
Orders
Shipments
Source: U.S. Department of Commerce, Bureau of the Census.
yardeni.com
Figure 28.
1993 1994 1995 1996 1997 1998 1999 2000 2001 2002 2003 2004 2005 2006-50
0
50
100
-50
0
50
100
Feb
FABRICATED METALS INVENTORIES(billion dollars, yearly change)
Source: U.S. Department of Commerce, Bureau of the Census.
yardeni.com
Figure 29.
- Metals (Fabricated) -
Page 19 / March 29, 2005 / Analyst’s Handbook: Materials www.oakassociates.com
OAK ASSOCIATES, ltd.

2000 2001 2002 2003 2004 2005 200616
18
20
22
24
26
28
30
32
34
36
38
16
18
20
22
24
26
28
30
32
34
36
38
Jan
FABRICATED METALS PRODUCTS* EXPORTS & IMPORTS(billion dollars, 12-month sum)
Exports
Imports
* Excluding machinery and transportation equipment.Source: U.S. Department of Commerce, Bureau of the Census.
yardeni.com
Figure 30.
1993 1994 1995 1996 1997 1998 1999 2000 2001 2002 2003 2004 2005 2006-20
-10
0
10
20
30
40
50
60
-20
-10
0
10
20
30
40
50
60
Feb
FABRICATED METALS PRODUCER PRICE INDEX(yearly percent change)
Steel Mill Products
Fabricated StructuralMetal Products
Source: U.S. Department of Labor, Bureau of Labor Statistics.
yardeni.com
Figure 31.
- Metals (Fabricated) -
Page 20 / March 29, 2005 / Analyst’s Handbook: Materials www.oakassociates.com
OAK ASSOCIATES, ltd.

1993 1994 1995 1996 1997 1998 1999 2000 2001 2002 2003 2004 2005 200675
80
85
90
95
100
105
110
115
75
80
85
90
95
100
105
110
115
Feb
FABRICATED METAL PRODUCTS INDUSTRIAL PRODUCTION(1997=100)
Source: Board of Governors of the Federal Reserve System.
yardeni.com
Figure 32.
1993 1994 1995 1996 1997 1998 1999 2000 2001 2002 2003 2004 2005 200665
70
75
80
85
90
65
70
75
80
85
90
Feb
FABRICATED METAL PRODUCTS CAPACITY UTILIZATION(percent)
Source: Board of Governors of the Federal Reserve System.
yardeni.com
Figure 33.
- Metals (Fabricated) -
Page 21 / March 29, 2005 / Analyst’s Handbook: Materials www.oakassociates.com
OAK ASSOCIATES, ltd.

1993 1994 1995 1996 1997 1998 1999 2000 2001 2002 2003 2004 2005 2006110
120
130
140
150
160
170
180
190
110
120
130
140
150
160
170
180
190
Feb
PRIMARY METALS ORDERS & SHIPMENTS(billion dollars, 3-month ma, saar)
Orders
Shipments
Source: U.S. Department of Commerce, Bureau of the Census.
yardeni.com
Figure 34.
1993 1994 1995 1996 1997 1998 1999 2000 2001 2002 2003 2004 2005 2006-50
-25
0
25
50
75
-50
-25
0
25
50
75
Feb
PRIMARY METALS INVENTORIES(billion dollars, yearly change)
Source: U.S. Department of Commerce, Bureau of the Census.
yardeni.com
Figure 35.
- Metals (Primary) -
Page 22 / March 29, 2005 / Analyst’s Handbook: Materials www.oakassociates.com
OAK ASSOCIATES, ltd.

2000 2001 2002 2003 2004 2005 200610
20
30
40
50
60
70
10
20
30
40
50
60
70
Jan
PRIMARY METALS PRODUCTS EXPORTS & IMPORTS(billion dollars, 12-month sum)
Exports
Imports
* Excluding machinery and transportation equipment.Source: U.S. Department of Commerce, Bureau of the Census.
yardeni.com
Figure 36.
1993 1994 1995 1996 1997 1998 1999 2000 2001 2002 2003 2004 2005 2006-50
-25
0
25
50
75
100
125
-50
-25
0
25
50
75
100
125
Feb
PRIMARY METALS PRODUCER PRICE INDEX(yearly percent change)
Iron and Steel Scrap
Copper Base Scrap
Aluminum Base Scrap
Source: U.S. Department of Labor, Bureau of Labor Statistics.
yardeni.com
Figure 37.
- Metals (Primary) -
Page 23 / March 29, 2005 / Analyst’s Handbook: Materials www.oakassociates.com
OAK ASSOCIATES, ltd.

1993 1994 1995 1996 1997 1998 1999 2000 2001 2002 2003 2004 2005 200680
85
90
95
100
105
110
80
85
90
95
100
105
110
Feb
PRIMARY METALS INDUSTRIAL PRODUCTION(1997=100)
Source: Board of Governors of the Federal Reserve System.
yardeni.com
Figure 38.
1993 1994 1995 1996 1997 1998 1999 2000 2001 2002 2003 2004 2005 200665
70
75
80
85
90
95
100
65
70
75
80
85
90
95
100
Feb
PRIMARY METALS CAPACITY UTILIZATION(percent)
Source: Board of Governors of the Federal Reserve System.
yardeni.com
Figure 39.
- Metals (Primary) -
Page 24 / March 29, 2005 / Analyst’s Handbook: Materials www.oakassociates.com
OAK ASSOCIATES, ltd.

1992 1993 1994 1995 1996 1997 1998 1999 2000 2001 2002 2003 2004 2005 2006120
140
160
180
200
120
140
160
180
200
Jan
PAPER PRODUCTS SHIPMENTS(billion dollars, saar)
Shipments
Source: U.S. Department of Commerce, Bureau of the Census.
yardeni.com
Figure 40.
80 81 82 83 84 85 86 87 88 89 90 91 92 93 94 95 96 97 98 99 00 01 02 03 04 05 0660
65
70
75
80
85
90
95
100
105
110
115
120
125
60
65
70
75
80
85
90
95
100
105
110
115
120
125
Feb
PAPER PRODUCTS INDUSTRIAL PRODUCTION(1997=100)
Source: Board of Governors of the Federal Reserve System.
yardeni.com
Figure 41.
- Paper Products -
Page 25 / March 29, 2005 / Analyst’s Handbook: Materials www.oakassociates.com
OAK ASSOCIATES, ltd.

1993 1994 1995 1996 1997 1998 1999 2000 2001 2002 2003 2004 2005 2006-2.0
-1.5
-1.0
-.5
.0
.5
1.0
1.5
2.0
2.5
3.0
3.5
-2.0
-1.5
-1.0
-.5
.0
.5
1.0
1.5
2.0
2.5
3.0
3.5
Jan
PAPER PRODUCTS INVENTORIES(billion dollars, yearly change)
Source: U.S. Department of Commerce, Bureau of the Census.
yardeni.com
Figure 42.
1992 1993 1994 1995 1996 1997 1998 1999 2000 2001 2002 2003 2004 2005 2006-30
-20
-10
0
10
20
30
40
50
60
-30
-20
-10
0
10
20
30
40
50
60
Feb
PAPER PRODUCTS PRODUCER PRICE INDEX(yearly percent change)
Paperboard
Paperboxes & Containers
Source: U.S. Department of Labor, Bureau of Labor Statistics.
yardeni.com
Figure 43.
- Paper Products -
Page 26 / March 29, 2005 / Analyst’s Handbook: Materials www.oakassociates.com
OAK ASSOCIATES, ltd.

1992 1993 1994 1995 1996 1997 1998 1999 2000 2001 2002 2003 2004 2005 200625
75
125
175
225
275
325
375
425
475
25
75
125
175
225
275
325
375
425
475
Jan
PETROLEUM REFINERIES SHIPMENTS(billion dollars, saar)
Crude Oil Outlays*
Shipments
* Total daily crude oil demand multiplied by 365 days and the price of a barrel of crude oil.Source: U.S. Department of Labor, Bureau of Labor Statistics, U.S. Department of Commerce, Bureau of the Censusand Oil Market Intelligence.
yardeni.com
Figure 44.
1992 1993 1994 1995 1996 1997 1998 1999 2000 2001 2002 2003 2004 2005 2006-100
0
100
200
300
-100
0
100
200
300
Feb
CRUDE PETROLEUM PRODUCER PRICE INDEX(yearly percent change)
Source: U.S. Department of Labor, Bureau of Labor Statistics.
yardeni.com
Figure 45.
- Petroleum -
Page 27 / March 29, 2005 / Analyst’s Handbook: Materials www.oakassociates.com
OAK ASSOCIATES, ltd.

1992 1993 1994 1995 1996 1997 1998 1999 2000 2001 2002 2003 2004 2005 2006100
125
150
175
200
225
100
125
150
175
200
225
Jan
PLASTICS & RUBBER PRODUCTS SHIPMENTS(billion dollars, saar)
Shipments
Source: U.S. Department of Commerce, Bureau of the Census.
yardeni.com
Figure 46.
1992 1993 1994 1995 1996 1997 1998 1999 2000 2001 2002 2003 2004 2005 2006-20
-10
0
10
20
30
40
-20
-10
0
10
20
30
40
Feb
PLASTICS & RUBBER PRODUCTS PRODUCER PRICE INDEX(yearly percent change)
Plastic Resins & Materials
Synthetic Rubber
Source: U.S. Department of Labor, Bureau of Labor Statistics.
yardeni.com
Figure 47.
- Plastics & Rubber Products -
Page 28 / March 29, 2005 / Analyst’s Handbook: Materials www.oakassociates.com
OAK ASSOCIATES, ltd.

Copyright (C) Dr. Edward Yardeni 2005. All rights reserved. Theinformation contained herein has been obtained from sources believedto be reliable, but is not necessarily complete and its accuracy cannot beguaranteed. Any opinions expressed are subject to change without notice.
Additional Information Available on Request.


