Analysis of strained sedimentary fabrics: review and...
7
442 Analysis of strained sedimentary fabrics: review and tests G. J. BORRADAILE Department of Geology, Lakehead University, Thunder Bay, One., Canada P7B 5El Received April 17, 1986 Revision accepted August 25, 1986 Accurate analysis of the homogeneous strain of ellipsoidal objects requires that certain premises are met. These are (1) coaxiality of strain increments, (2) accurate definition of finite strain axes, and (3) perfectly passive behaviour of the objects with respect to the matrix. The Rtl¢> equations provide a mathematical model for this idealized scenario. In practice the analysis is limited to data from plane surfaces, and its success depends upon the type of initial fabric of the objects, the frequency distribution of their initial shapes, and errors of measurement of the final shapes (Rill) and of final orientations (¢». Together with the difficulty in locating the fmite strain axes, these factors greatly affect the outcome of the analysis, and their combined effects have not been studied previously. Detailed observations on the orientations of strain and of the orientation -distribution of the objects' long axes sometimes indicate that the Rf/¢> model is incompatible with the data. Strain analysis is then not possible by the present methods. If the data are compatible with the Rr/¢> model and if the original fabric can be shown to have been random or had a preferred orienta- tion parallel to bedding, it is possible to determine the strain accurately to within a few percent. This has been partly confirmed in practical examples in which the strain has been independently determined using the tectonic distortion of rims of individual clasts. L'analyse precise de la deformation homogene d'objets ellipsoidaux doit respecter certaines premisses. Ce sont (I) la coaxialite des accroissements de deformation, (2) une definition rigoureuse des axes fmis de deformation et (3) une absence totate de reponse des objets par rapport ala matrice. Les equations ReI¢> foumissent un modele mathematique pour ces condi- tions ideales. En pratique, l'analyse ne s'appJique qu'aux donnees de surfaces planes. et la performance de la methode depend du type de fabrique initiale des objets, de la fr€quence de distribution de leurs formes initiales et des erreurs de mesure sur les formes finales (Rr'Il) et les orientations finales (¢». S' ajoute la difficulte de localiser les axes finis de deformation, et tous ces facteurs affectent grandement Ie qualite de l'analyse, et leurs effets combines n'ont pas ete etudies anterieurement. Les observations detaillees sur les orientations de deformation et sur l'orientation -distribution des axes longs des objets indiquent quelquefois que Ie modele ReI¢> ne s'accorde aucunement avec les resultats. Dans ce cas l'analyse de la deformation est impossible avec les methodes actuelles. Cependant, si les donnees sont en accord avec Ie modele ReI¢> et s'it est prouve que la fabrique originale etait aleatoire ou orientee parallelement ala stratification, it est alors possible de determiner la deforma- tion avec une precision de quelques pour-cent. Ceci est confirme par quelques exemples pratiques OU la deformation a ere determinee de maruere independante en utilisant la distortion tectonique des rebords des fragments individuels. [Traduit par la revue] Can. J. Earth Sci. 24. 442-455 (1987) 1. Introduction following items concerning the passive stmin of an elliptical marker on a plane. The analysis of stmin of defomted rocks has provided infor- mation on the genesis of folds, of microfabrics, and even of 1.1 Items tectonic regimes by the integmtion of individual analyses (1) The orientation of the maximum extension, x, in the (Ramsay 1970; Ramsay and Huber 1983). Structuml geolo- plane. gists have been preoccupied with the stmin analysis of homo- (2) The section's stmin ellipse mtio, Rsll2. geneously stmined ellipsoidal markers because of the common (3) The initial shape mtio of the object, RoW. occurrence of pebbles, ooids, accretionary lapilli, and lava (4) The orientation, 8, ofthe long axis of the clast, relative to pillows. the maximum extension, x. The treatments of such maikers usually rely on the approx- (5) The final shape mtio of the object, Rll2. imation that the inclusion defomts homogeneously with its (6) The final orientation, </>, of the long axis of the clast matrix, i.e., that it undergoes passive stmin. If the behaviour is relative to the maximum extension, x. nonpassive, we need to know the viscosity contmsts of objects The equations, listed in the Appendix, relate the pammeters and matrix, and since the objects may impinge on one another, in the following way: (a) </> as a function of R s , R o , and 8; (b) R f , something must be known about their concentmtion. These are as a function of Rg, R o , 8, and </>, R f as a function of Rs. Ro. major issues that are only mrely addressed in pmctical applica- and 8, or R f as a function of R s ' 8, and </>. tions (e.g., Lisle et al. 1983; Freeman and Lisle, in prepam- For the pmctical situation of a defomted conglomemte we tion), although encoumging progress has been made in theory restrict the analysis to a plane. For simplicity this should be (Bilby et al. 1975; Gay 19680, 1968b, 1968c; Ferguson 1979; close in orientation to a principal plane of the finite strain Freeman 1985, 1986). Here we pursue only the limited, ellipsoid. passive model. 2. Premises and parameters Most analyses of strain of conglomemtes are rooted in the Rr/</> passive stmin theory of Ramsay (1967) based on two 2.1 Orientation of the maximum extension in a plane equations (Ramsay's eqs. [5-22] and [5-27] or, alternatively, In most analyses this is inferred from some fabric element. Elliot's (1970) eqs. [23] and [24]). These equations relate the The fabric element used to locate the principal plane tmce (XY) Printed in Canada / Imprimt au Canada
Transcript of Analysis of strained sedimentary fabrics: review and...
442
Analysis of strained sedimentary fabrics: review and tests
G. J. BORRADAILE
Department of Geology, Lakehead University, Thunder Bay, One., Canada P7B 5El
Received April 17, 1986
Revision accepted August 25, 1986
... Accurate analysis of the homogeneous strain of ellipsoidal objects requires that certain premises are met. These are (1) coaxiality of strain increments, (2) accurate definition of finite strain axes, and (3) perfectly passive behaviour of the objects with respect to the matrix. The Rtl¢> equations provide a mathematical model for this idealized scenario.
In practice the analysis is limited to data from plane surfaces, and its success depends upon the type of initial fabric of the objects, the frequency distribution of their initial shapes, and errors of measurement of the final shapes (Rill) and of final orientations (¢». Together with the difficulty in locating the fmite strain axes, these factors greatly affect the outcome of the analysis, and their combined effects have not been studied previously.
Detailed observations on the orientations of strain and of the orientation -distribution of the objects' long axes sometimes indicate that the Rf/¢> model is incompatible with the data. Strain analysis is then not possible by the present methods. If the data are compatible with the Rr/¢> model and if the original fabric can be shown to have been random or had a preferred orientation parallel to bedding, it is possible to determine the strain accurately to within a few percent. This has been partly confirmed in practical examples in which the strain has been independently determined using the tectonic distortion of rims of individual clasts.
L'analyse precise de la deformation homogene d'objets ellipsoidaux doit respecter certaines premisses. Ce sont (I) la coaxialite des accroissements de deformation, (2) une definition rigoureuse des axes fmis de deformation et (3) une absence totate de reponse des objets par rapport ala matrice. Les equations ReI¢> foumissent un modele mathematique pour ces conditions ideales.
En pratique, l'analyse ne s'appJique qu'aux donnees de surfaces planes. et la performance de la methode depend du type de fabrique initiale des objets, de la fr€quence de distribution de leurs formes initiales et des erreurs de mesure sur les formes finales (Rr'Il) et les orientations finales (¢». S'ajoute la difficulte de localiser les axes finis de deformation, et tous ces facteurs affectent grandement Ie qualite de l'analyse, et leurs effets combines n'ont pas ete etudies anterieurement.
Les observations detaillees sur les orientations de deformation et sur l'orientation -distribution des axes longs des objets indiquent quelquefois que Ie modele ReI¢> ne s'accorde aucunement avec les resultats. Dans ce cas l'analyse de la deformation est impossible avec les methodes actuelles. Cependant, si les donnees sont en accord avec Ie modele ReI¢> et s'it est prouve que la fabrique originale etait aleatoire ou orientee parallelement ala stratification, it est alors possible de determiner la deformation avec une precision de quelques pour-cent. Ceci est confirme par quelques exemples pratiques OU la deformation a ere determinee de maruere independante en utilisant la distortion tectonique des rebords des fragments individuels.
[Traduit par la revue]
Can. J. Earth Sci. 24. 442-455 (1987)
1. Introduction following items concerning the passive stmin of an elliptical marker on a plane. The analysis of stmin of defomted rocks has provided infor
mation on the genesis of folds, of microfabrics, and even of 1.1 Items tectonic regimes by the integmtion of individual analyses (1) The orientation of the maximum extension, x, in the (Ramsay 1970; Ramsay and Huber 1983). Structuml geolo plane. gists have been preoccupied with the stmin analysis of homo (2) The section's stmin ellipse mtio, Rsll2. geneously stmined ellipsoidal markers because of the common (3) The initial shape mtio of the object, RoW. occurrence of pebbles, ooids, accretionary lapilli, and lava (4) The orientation, 8, ofthe long axis of the clast, relative to pillows. the maximum extension, x.
The treatments of such maikers usually rely on the approx (5) The final shape mtio of the object, Rll2. imation that the inclusion defomts homogeneously with its (6) The final orientation, </>, of the long axis of the clast matrix, i.e., that it undergoes passive stmin. Ifthe behaviour is relative to the maximum extension, x. nonpassive, we need to know the viscosity contmsts of objects The equations, listed in the Appendix, relate the pammeters and matrix, and since the objects may impinge on one another, in the following way: (a) </> as a function of Rs, Ro, and 8; (b) Rf , ,something must be known about their concentmtion. These are as a function of Rg , Ro, 8, and </>, Rf as a function of Rs. Ro. major issues that are only mrely addressed in pmctical applica and 8, or Rf as a function of Rs' 8, and </>.tions (e.g., Lisle et al. 1983; Freeman and Lisle, in prepam For the pmctical situation of a defomted conglomemte we tion), although encoumging progress has been made in theory restrict the analysis to a plane. For simplicity this should be (Bilby et al. 1975; Gay 19680, 1968b, 1968c; Ferguson 1979; close in orientation to a principal plane of the finite strain Freeman 1985, 1986). Here we pursue only the limited, ellipsoid. passive model.
2. Premises and parameters Most analyses of strain of conglomemtes are rooted in the Rr/</> passive stmin theory of Ramsay (1967) based on two 2.1 Orientation of the maximum extension in a plane equations (Ramsay's eqs. [5-22] and [5-27] or, alternatively, In most analyses this is inferred from some fabric element. Elliot's (1970) eqs. [23] and [24]). These equations relate the The fabric element used to locate the principal plane tmce (XY)
Printed in Canada / Imprimt au Canada
maximum extension
on
BORRADAILE 443
direction plane b
.. z z
y
X>Y>I·O>Z FIG. I. Lower-hemisphere equal-area projection of contours (solid
lines) of radii of a strain ellipse with axes X, Y, and Z. The stippling emphasises the longer radii of the strain ellipse toward the centre of the diagram. Consider that XY is also a principal plane cleavage. A plane such as (a), broken line, will have the greatest extension parallel to the trace of XY because that is where it meets the highest contour of the radii of the strain ellipse. However, a generally oriented plane such as (b), which is not perpendicular to XY cleavage, will have a maximum extension not parallel to the cleavage trace.
must be defined independently of the deformed objects. For example, consider a deformed conglomerate with a greywacke matrix. The pebbles tend to have a preferred orientation, but that orientation must not be taken to indicate a principal strain direction because a component of initial preferred orientation may still persist. If the principal plane is to be inferred from the fabric, it should be taken from the fine-grained matrix, in which metamorphic processes, accompanying the acquisition of strain, have dominated over any component of original fabric. In the computer tests of strain analysis below (section 5), two possibilities are considered: strain directions inferred from the pebble fabric and strain directions known from some other privileged source.
Consider that the orientation of the maximum extension, x, in a plane is inferred from the trace of some fabric element believed to be an XY structure. Firstly, the schistosity and the plane of which strain analysis is made should be perpendicular. Otherwise, a cut effect will render the trace of the schistosity oblique to the maximum extension, x, in the plane, even if the schistosity is a principal plane structure (Fig. 1).
Secondly, there remains the question of whether the schistosity is a principal plane structure. Current consensus of opinion in the literature (e.g., Wood 1974; Siddans 1972, 1977; but see Williams 1976, 1977) is that most continuous, primary, low-grade tectonic fabrics (that might be termed slaty cleavage or fine schistosity) are parallel to the XY plane of the rock's finite strain ellipsoid. However, this has never been universally proven and has been rarely independently proven in any specific natural context, and it has been disproven by some experiments (Means 1977). Nevertheless, discrepancies between XY and such a fabric may be smalL This is because any large strain will transpose the two planes toward a
r---.
(oj (bJ~,~,
(e) Cd)
FIG. 2. The sand-dike test. A right-angle marker, such as a sand dike and bedding (a), fonns an acute angle after strain (b). The acute angle must contain the XY plane of the finite strain ellipsoid. In three dimensions the test is more specific. Poles to sand dikes (black dots) and the bedding pole (So) rotate toward the Z direction of a finite strain ellipsoid (c). A series of constructions derived only from the defonned positions of the poles locates the possible positions of the Z direction in the stippled field (d). If the pole to cleavage lies outside this field the strain was noncoaxial.
common orientation even if they were oblique earlier, and even if they were genetically independent.
A test that has been devised for the relationship between XY and a cleavage in naturally deformed rocks is illustrated in Fig. 2 (Borradaile 1977). This test indicates that some cleavages could be XY structures, whilst in other areas there are primary cleavages at 30° to the XY plane. The test uses some structure that initially defined a right angle between two planar elements and assumes passive behaviour.
We can appreciate why cleavages may not be an XY structure. Primary cleavages are often defined by deformed grains, and it has been documented both experimentally (Schmid and Paterson 1977; Schmid et al. 1980) and in natural examples (Borradaile 1979a, 1979b, 1981a) that the bulk strain of rocks can exceed grain strain. Thus cleavage formation by grain strain might only commence some time after the bulk deformation started. In a noncoaxial strain history (Means 1976, p. 236), one can accept that the cleavage may only correspond to later orientations of a principal plane and therefore show some angular discordance with the finite XY plane for the rock (Borradaile 1977, 1981a, 1981b).
If the schistosity was not parallel to the XYplane of the finite strain ellipsoid, this would indicate that successive strain increments did not accumulate coaxially. Nevertheless, if one could determine the finite strain directions after a noncoaxial history, as Siddans (1980) has done, strain analysis of elliptical particles under some circumstances is successful. In mathematical tests in which he had privileged knowledge of the strains applied, he showed that strain can be determined only for the restricted case of randomly oriented, identical ellipsoidal shapes.
2.2 The initial orientations (0) of the clasts For a deformed conglomerate, the initial shape and initial
orientation of any individual clast are unknown. Even if the problems in the preceding section can be resolved, there

--- ---
CAN. 1. EARTH SCI. VOL. 24, 1987 444
,
..
n. -- ~ng. dev. = (00
- - ~ng. dev. =250
0,!/--\~,-.... o 10 20 30 40 50 60 70 80 90
---. degrees
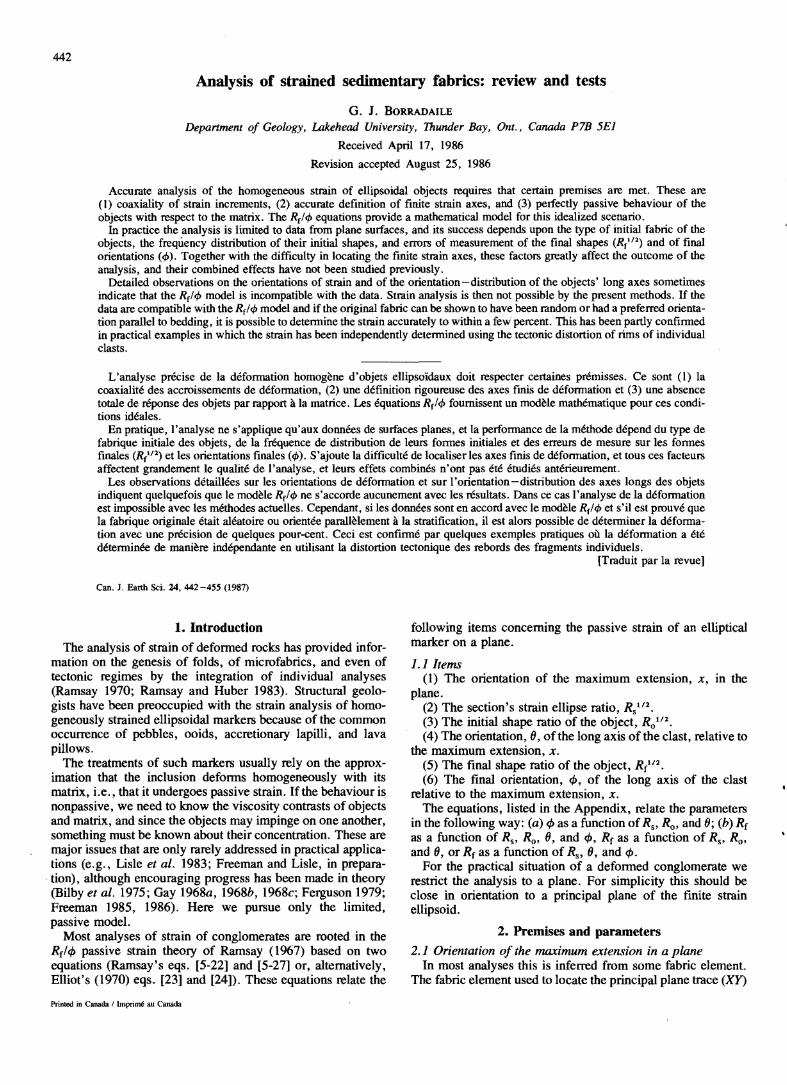
FIG. 3. Smoothed histograms for the angular orientations of 100 clast long axes selected from natural distributions of long axes of clasts in never-deformed rocks with angular deviations of 10 and 25 0
•
remain two unknown quantities in the Rflq, equations; therefore, there is insufficient information to solve for the ratio of the strain ellipse.
The analysis usually proceeds in two steps. Firstly, a large number of clasts are considered at the same time, permitting a quasi-statistical approach. Note the behaviour of a group of markers may be very different from that of a" typical" marker (Lisle 1982). Secondly, some assumptions are made concerning the range of initial shapes and the initial angular distribution of the clasts. U suall y, the initial fabric is stratified to some degree. Bedding planes may then lend a clue to the direction and presence of the original preferred orientation tendency.
The Rflq, equations are still unsolvable at this point, but an array of powerful graphical techniques translates the analytical problem into one that can be solved in a graphical or statistical manner (Ramsay 1967; Ramsay and Huber 1983; Dunnet and Siddans 1971; Lisle 1977b; or the different approach of Elliott 1970). The graphical methods are based on a plot of some function of Rf against q, for the individual pebbles. These useful plots may indicate the presence of a sedimentary fabric and its relative strength. The type of scatter of the data along the q, axis (the "fluctuation") may indicate something about the relative shapes of the strain ellipse and the mean clast shape, while the spread of the data in the Rfaxis yields some insight into the magnitude of the strain. Further, scatter within the Rf-q, distribution or around its edge may indicate the degree of variation in initial shape ratio (Dunnet 1969; Lisle 1979). We acknowledge that these inferences all depend on the fundamental premise of passive behaviour and coaxial strain history. Nevertheless, these approaches have made significant contributions to our understanding of strain and fabric in deformed clastic rocks.
Few clastic sediments will have random initial orientation fabrics. Even if this were the case, some preferred orientation may develop during diagenesis and compaction. Since such an orienting process would proceed largely by active or partly rigid body rotation, it could not be accounted for or included in the analysis of subsequent tectonic strain by Rflq, methods because these assume passive behaviour. Thus we should accept the inevitable: most clasts will have a preferred orientation in most cross sections prior to tectonic strain (e.g., Seymour and Boulter 1979).
Holst (1982) showed the degree of preferred orientation that is common in sedimentary rocks in sections cutting across bedding. Only in sections parallel to bedding are random initial fabrics likely to be encountered. Examples of natural distributions of clast long axes are shown in Fig. 3: the distributions
n ('Yo)
I f'\ 30
(a)
20
(- I " .:7;::L.,, __
'~ I
10 -j II
2 3 ~-\..,. n ('Yo)
I (b) 20
,o~ I I 2 3 -JRo"r\ \'
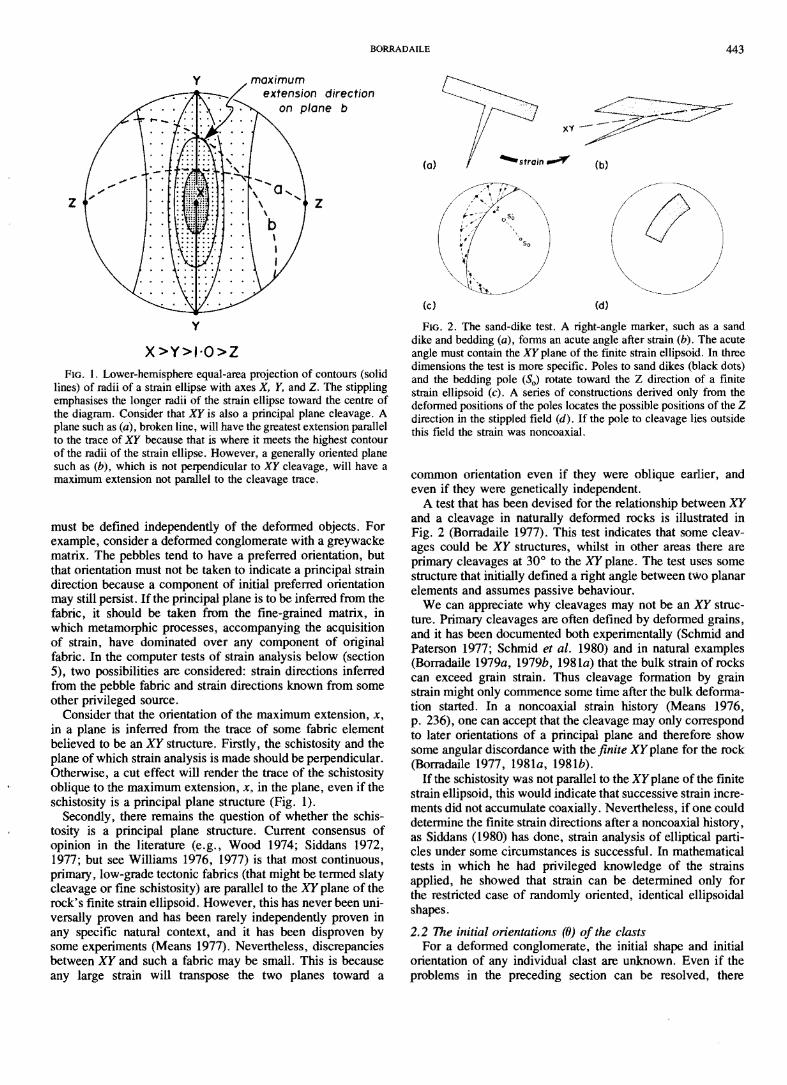
FIG. 4. (a) Natural distributions of pebble and lapilli shapes, Ro1l2, from sections perpendicular to bedding (some in compacted but otherwise undeformed rocks). These histograms and those in the following diagrams were assembled and smoothed for class intervals of 0.1 of the shape ratio. These were simulated from three-dimensional measurements of extracted pebbles: (A) 697 pebbles from a probably fluviatile, monomict Triassic conglomerate, near Albarracin, Spain. (0) Two-dimensional shape distribution derived from measurements of 300 loose greywacke pebbles on a modem beach at Oamaru, New Zealand. (T) 143 pebbles from a polymict slump conglomerate in Texas (data deduced from McBride 1966). (b) (F) Two-dimensional shape distribution derived from 212 resedimented pebbles in Italian Flysch (data derived from Lucchi 1969). (K) 193 accretionary lapilli shapes from the Proterozoic strata at Kakabeka Falls, northern Ontario, Canada. (yV) Two-dimensional shape distribution derived from measurements of 300 loose, lineated greywacke pebbles on a modem beach at Waianakarua, New Zealand.
are approximately circular normal and present the fabrics seen in sections perpendicular to bedding. Only sections of this orientation will be considered in the remainder of this study.
If analysis is to successfully restore the deformed clasts to a prestrain configuration, thereby determining the strain, it is only necessary to assume that the angular vector mean of the initial distribution was parallel to bedding. If discrete bed laminations are present, it is possible to restore a strained distribution to the prestrain condition. The latter will be found when the vector mean of long axes is parallel to the bedding planes (Dunnet and Siddans 1971).
2.3 The initial shapes o/the clasts (Rolll) One group of data collected was of accretionary lapilli in a
Proterozoic tuff near Kakabeka Falls in northern Ontario. The tuff is compacted but has suffered no penetrative tectonic deformation. The lapilli were exposed in saw cuts perpendicular to bedding from a horizontally stratified sequence. Photographs were made of a surface of 1800 cm1 area, and the outlines of lapilli were digitized to reveal their shapes and orientations (K in Fig. 4b).
Other data are from a modem beach (0), a modem river con
BORRADAlLE 445
"""
..
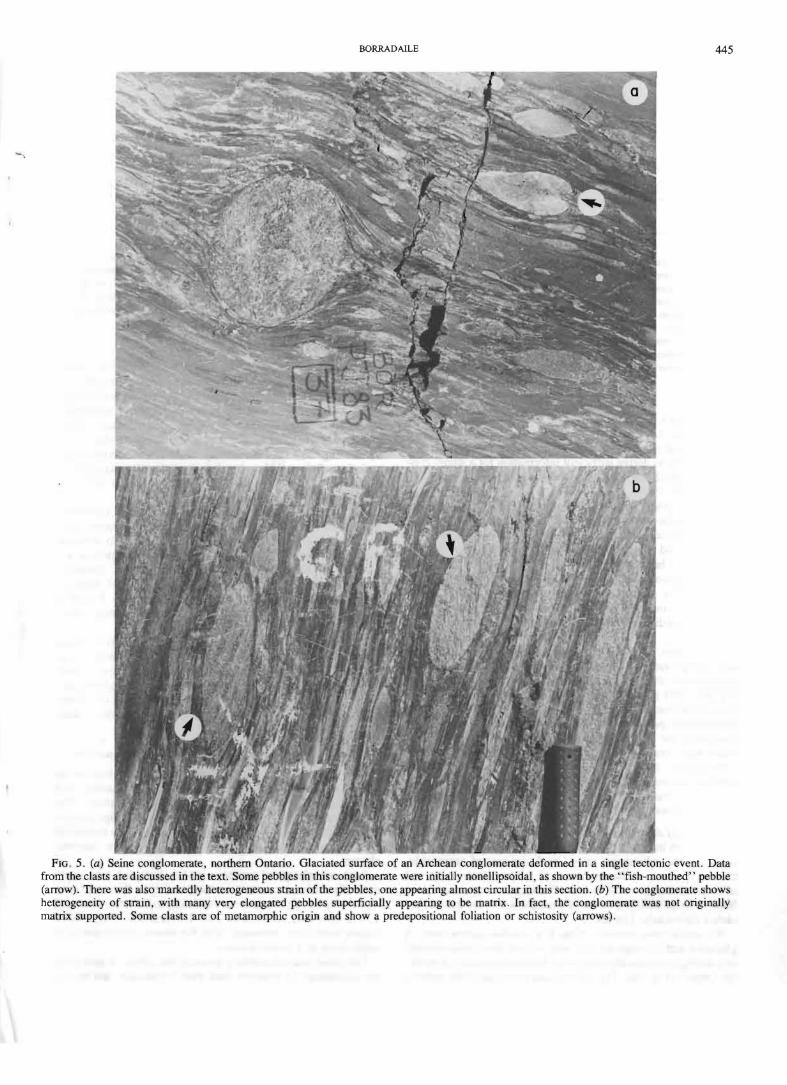
FIG. 5. (a) Seine conglomerate, northern Ontario. Glaciated surface of an Archean conglomerate defonned in a single tectonic event. Data from the clasts are discussed in the text. Some pebbles in this conglomerate were initially nonellipsoidal, as shown by the "fish-mouthed" pebble (arrow). There was also markedly heterogeneous strain of the pebbles, one appearing almost circular in this section. (b) The conglomerate shows heterogeneity of strain , with many very elongated pebbles superficially appearing to be matrix . In fact, the conglomerate was not originally matrix supported. Some clasts are of metamorphic origin and show a predepositional foliation or schistosity (arrows) .
4
CAN. J. EARTH SCI. VOL. 24, 1987 446
n (%)
20 .J..A--" t(h)! y1 /<'1 <;:
~ ,f ~ \
/"'\ I \ I '" \ r\
10
.. I .:::&" \ I \
,-I
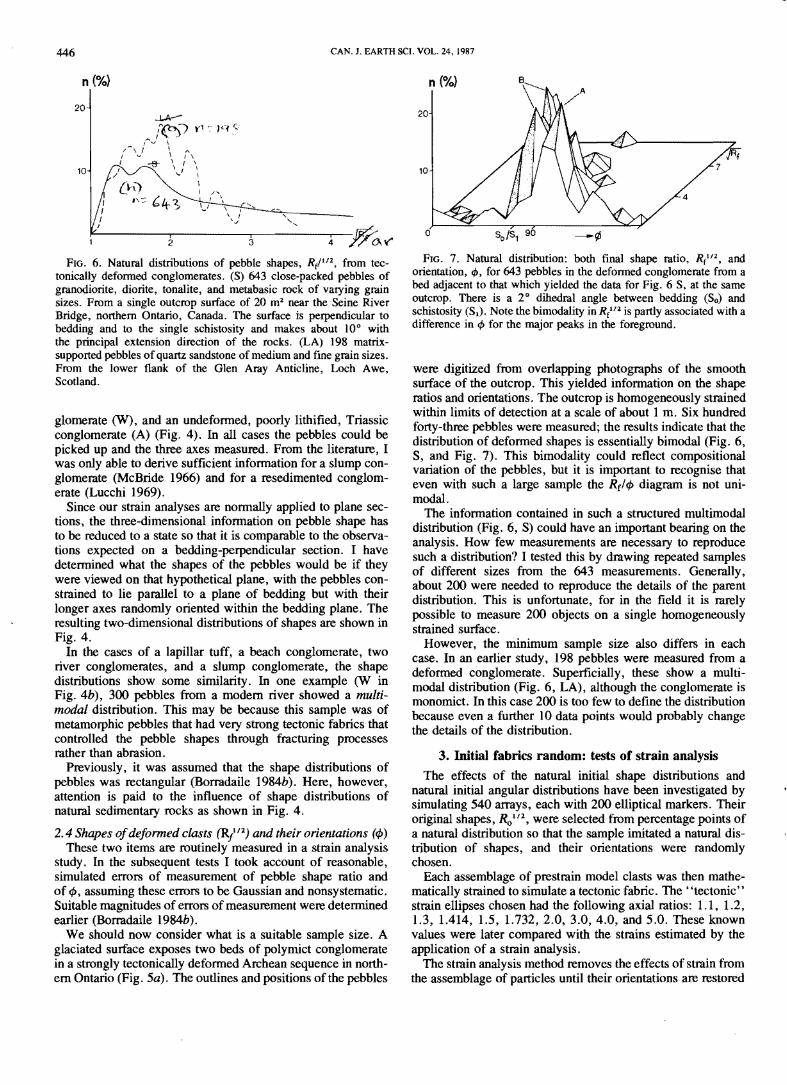
r- 2 3 4 ~t(' FIG. 6. Natuml distributions of pebble shapes, Refill, from tec
tonically defonned conglomemtes. (S) 643 close-packed pebbles of gmnodiorite, diorite, tonalite, and metabasic rock of varying gr.rin sizes. From a single outcrop surface of 20 m' near the Seine River Bridge, northern Ontario, Canada. The surface is perpendicular to bedding and to the single schistosity and makes about 10° with the principal extension direction of the rocks. (LA) 198 matrixsupported pebbles ofquartz sandstone of medium and fine grain sizes. From the lower flank of the Glen Amy Anticline, Loch Awe, Scotland.
glomerate (y{), and an undefonned, poorly lithified, Triassic conglomerate (A) (Fig. 4). In all cases the pebbles could be picked up and the three axes measured. From the literature, I was only able to derive sufficient infonnation for a slump conglomerate (McBride 1966) and for a resedimented conglomerate (Lucchi 1969).
Since our strain analyses are nonnally applied to plane sections, the three-dimensional infonnation on pebble shape has to be reduced to a state so that it is comparable to the observations expected on a bedding-perpendicular section. I have detennined what the shapes of the pebbles would be if they were viewed on that hypothetical plane, with the pebbles constrained to lie parallel to a plane of bedding but with their longer axes randomly oriented within the bedding plane, The reSUlting two-dimensional distributions of shapes are shown in Fig. 4.
In the cases of a lapillar tuff, a beach conglomerate, two river conglomerates, and a slump conglomerate, the shape distributions show some similarity. In one example (y{ in Fig.4b), 300 pebbles from a modem river showed a multimodal distribution, This may be because this sample was of metamorphic pebbles that had very strong tectonic fabrics that controlled the pebble shapes through fracturing processes rather than abrasion.
Previously, it was assumed that the shape distributions of pebbles was rectangular (Borradaile 1984b). Here, however, attention is paid to the influence of shape distributions of natural sedimentary rocks as shown in Fig. 4.
2.4 Shapes ofdeformed clasts (R/Il) and their orientations (cp) These two items are routinely measured in a strain analysis
study. In the subsequent tests I took account of reasonable, simulated errors of measurement of pebble shape ratio and of cp, assuming these errors to be Gaussian and nonsystematic. Suitable magnitudes of errors of measurement were detennined earlier (Borradaile 1984b).
We should now consider what is a suitable sample size. A glaciated surface exposes two beds of polymict conglomerate in a strongly tectonically defonned Archean sequence in northern Ontario (Fig. 5a). The outlines and positions of the pebbles
20
10
o
n (%)
So 151 90 -¢
FIG. 7. Natuml distribution: both final shape mtio, Rr' 12 , and orientation, 41, for 643 pebbles in the defonned conglomemte from a bed adjacent to that which yielded the data for Fig. 6 S, at the same outcrop. There is a 2° dihedml angle between bedding (So) and schistosity (Sl)' Note the bimodality in R/" is partly associated with a difference in 41 for the major peaks in the foreground.
were digitized from overlapping photographs of the smooth surface of the outcrop. This yielded infonnation on the shape ratios and orientations. The outcrop is homogeneously strained within limits of detection at a scale of about 1 m. Six hundred forty-three pebbles were measured; the results indicate that the distribution of defonned shapes is essentially bimodal (Fig. 6, S, and Fig. 7). This bimodality could reflect compositional variation of the pebbles, but it is important to recognise that even with such a large sample the Rf/cp diagram is not unimodal.
The infonnation contained in such a structured multimodal distribution (Fig. 6, S) could have an important bearing on the analysis. How few measurements are necessary to reproduce such a distribution? I tested this by drawing repeated samples of different sizes from the 643 measurements. Generally, about 200 were needed to reproduce the details of the parent distribution. This is unfortunate, for in the field it is rarely possible to measure 200 objects on a single homogeneously strained surface.
However, the minimum sample size also differs in each case. In an earlier study, 198 pebbles were measured from a defonned conglomerate. Superficially, these show a multimodal distribution (Fig. 6, LA), although the conglomerate is monomict. In this case 200 is too few to define the distribution because even a further 10 data points would probably change the details of the distribution.
3. Initial fabrics random: tests of strain analysis
The effects of the natural initial shape distributions and natural initial angular distributions have been investigated by simulating 540 arrays, each with 200 elliptical markers. Their original shapes, Ro1l2, were selected from percentage points of a natural distribution so that the sample imitated a natural distribution of shapes, and their orientations were randomly chosen.
Each assemblage of prestrain model clasts was then mathematically strained to simulate a tectonic fabric. The "tectonic" strain ellipses chosen had the following axial ratios: 1.1, 1.2, 1.3, 1.414, 1.5, 1.732, 2.0, 3.0, 4.0, and 5.0. These known values were later compared with the strains estimated by the application of a strain analysis.
The strain analysis method removes the effects of strain from the assemblage of particles until their orientations are restored

...
2'0 • + fJR~ I
Rs f t t
1'4
") ulL[-11 11
2'2 I
+++ I
JRe;R~ I ++t
14 -I +
BORRADAILE 447
(0) "De_-_strained" with respect to vector mean
lifo: natural distribution of shapes
e : random orientations
f harmonic means
! I ? m'''m,m m"hod,
!L-----l---__ JL_____T1 11
I I I 2 :3 4
(b) "De-strained" with respect
t ~ __ _ 5 i
-JFf;.
to
""~11H-~-t-- -i- ------i-------~ I I I r
2 :3 4 5 -JFf;.
FIG. 8. (a) The results of multiple "de-straining" tests of prepared synthetic samples ofRflt/> data, each of 200 clasts, for which the true strain ellipse ratios, R,.1I2, were known. R,,"Z is the estimate of the value of Rs"Z by strain analysis, so that perfectly accurate analyses should have E = (ReIRs)'12 = 1.0. The means of22 tests on 200 synthetic clasts are shown by each point, and the standard deviation is given by the error bar about each point. The (J distribution was random, and the principal strain direction was inferred from the vector mean of the deformed clasts orientations. (b) Results of multiple "de-straining" tests as in (a), but here the principal strain direction was not assumed to be given by the preferred orientation of clasts. Instead, the true principal strain direction was used.
known princiPalS'train axis
lifo: natural distribution of shapes
e : random orientations
f harmonic means
? minimum methods
+ +
to the prestrain condition (Dunnet and Siddans 1971). This requires that the prestrain orientation distribution is known-in this case we assume it to be random. We check for a successful restoration of the I/> distribution to the initial f) distribution by applying a ::.e test and a runs test (Borradaile 1976, 1984b) to compare the two distributions. When the test statistics reach a minimum value we know that the "de-strained" distribution matches the hypothesized prestrain distribution and that the amount of strain removed to achieve this is equivalent to the "tectonic" strain we wish to determine. Hypothesis testing determines the significance of the match at the 0.05 level.
Harmonic means (Lisle 1977a, 1979) were also determined for each tectonically strained array because at high strains these can also sometimes yield an approximate estimate of strain (Borradaile 1984b), especially if the initial fabric was random.
The results of the tests are presented in terms of the ratio between the estimated strain (Re I/2
) determined from the computer program and the true strain (R/'2) that was actually applied to generate the test data. This ratio, E = (ReIRs) I 12,
will be equal to unity if the test is perfectly accurate. Little scatter in E reflects good precision.
The tested arrays of model clasts all used 200 particles, with
initial clast shapes like the Oamaru beach conglomerate (Fig. 4). Errors of measurement of the clasts' shapes and orientations similar to those that the field geologist might make were also simulated and applied to the data.
These tests have been applied to two situations. Firstly, the principal strain direction is unknown but is inferred from the vector mean of the deformed particles' long axes (i.e., from the I/> distribution). The tests are satisfactory and yield values of strain about 5% higher than the strains that the particles actually experienced (E = 1.05; Fig. 8a). At low strains, the "minimum" or "de-straining" method is a better estimate of strain than the harmonic means of clasts' shapes.
Secondly, the tests have been applied assuming independent knowledge of the principal strain direction. (In our tests we are privileged to know this, since the "strained data" were generated mathematically.) The estimated strains are about 4% larger than the true strains (E 1.04) with less scatter (Fig. 8b).
Where the clasts were originally randomly oriented it makes little improvement if the principal extension direction is known. If we assume that the vector mean of particle long axes is the principal direction, the results are slightly less satisfactory for this sample size (200).
CAN. J. EARTH SCI. VOL. 24,1987448
,," "Hi T ~ 1? • 1 tr;;.: .~ t 1 ,fRo: natural distribution
of shapesRs Stratified distribution. a· 45°, Ang. dey. = 10° .. + harmonic means
IA
t ?minimum methods
I.OJ----------------- principal strain axis
2 3 4 5 -~
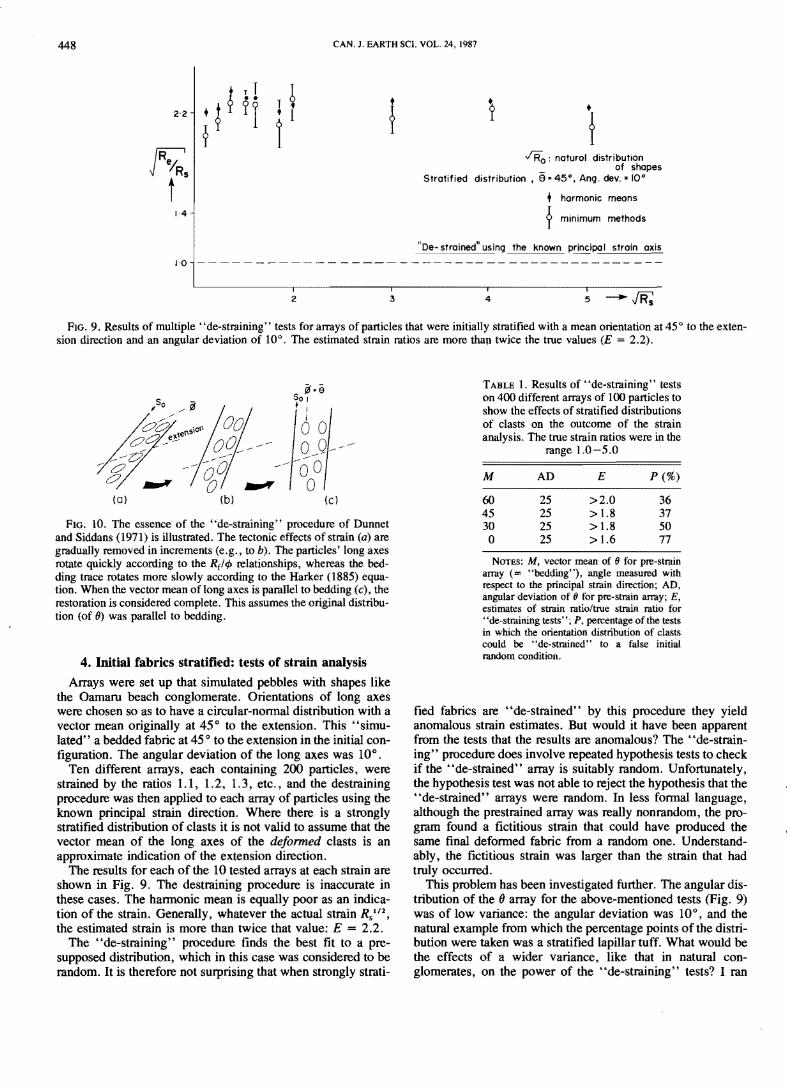
FIG. 9. Results of multiple "de-straining" tests for arrays of particles that were initially stratified with a mean orientation at 45° to the extension direction and an angular deviation of 10°. The estimated strain ratios are more thall twice the true values (E = 2.2).
~& :n~~,onflo.v:..0f!.! OO~~-,~a ~-- 0 ~~ ~-a4:..." 0 ."""o
(a) (bl (e)
FIG. 10. The essence of the "de-straining" procedure of Dunnet and Siddans (1971) is illustrated. The tectonic effects of strain (a) are gradually removed in increments (e.g., to b). The particles' long axes rotate quickly according to the Rf/tf> relationships, whereas the bedding trace rotates more slowly according to the Harker (1885) equation. When the vector mean oflong axes is parallel to bedding (c), the restoration is considered complete. This assumes the original distribution (of 0) was parallel to bedding.
4. Initial fabrics stratified: tests of strain analysis
Arrays were set up that simulated pebbles with shapes like the Oamaru beach conglomerate. Orientations of long axes were chosen so as to have a circular-nonnal distribution with a vector mean originally at 45° to the extension. This "simulated" a bedded fabric at 45 ° to the extension in the initial configuration. The angular deviation of the long axes was 10°.
Ten different arrays, each containing 200 particles, were strained by the ratios 1.1, 1.2, 1. 3, etc., and the destraining procedure was then applied to each array of particles using the known principal strain direction. Where there is a strongly stratified distribution of clasts it is not valid to assume that the vector mean of the long axes of the deformed clasts is an approximate indication of the extension direction.
The results for each of the 10 tested arrays at each strain are shown in Fig. 9. The destraining procedure is inaccurate in these cases. The hannonic mean is equally poor as an indication of the strain. Generally, whatever the actual strain RSl/2,
the estimated strain is more than twice that value: E = 2.2. The "de-straining" procedure finds the best fit to a pre
supposed distribution, which in this case was considered to be random. It is therefore not surprising that when strongly strati-
TABLE 1. Results of "de-straining" tests on 400 different arrays of 100 particles to show the effects of stratified distributions of clasts on the outcome of the strain analysis. The true strain ratios were in the
range 1.0-5.0
M AD E P (%)
60 25 >2.0 36 45 25 > 1.8 37 30 25 > 1.8 50 o 25 >1.6 77
NOTES: M, vector mean of 0 for pre-strain aIlllY (= "bedding"), angle measured with respect to the principal strdin direction; AD, angular deviation of fJ for pre-strain array; E, estimates of strain ratio/true strain ratio for "de-straining tests"; P, pen::entage of the tests in which the orientation distribution of clasts could be "de-strained" to a false initial random condition.
fied fabrics are "de-strained" by this procedure they yield anomalous strain estimates. But would it have been apparent from the tests that the results are anomalous? The "de-straining" procedure does involve repeated hypothesis tests to check if the "de-strained" array is suitably random. Unfortunately, the hypothesis test was not able to reject the hypothesis that the "de-strained" arrays were random. In less fonnallanguage, although the prestrained array was really nonrandom, the program found a fictitious strain that could have produced the same final defonned fabric from a random one. Understandably, the fictitious strain was larger than the strain that had truly occurred.
This problem has been investigated further. The angular distribution of the 0 array for the above-mentioned tests (Fig. 9) was of low variance: the angular deviation was 100
, and the natural example from which the percentage points of the distribution were taken was a stratified lapillar tuff. What would be the effects of a wider variance, like that in natural conglomerates, on the power of the "de-straining" tests? I ran
/