00 Baranova Induced Seismicity Jan 1999 CJES
3
A model for induced seismicit y caused by hydrocarbon production in the Western Canada Sedimentary Basin Val entina Baranova, Azer Mustaqeem, and Sebastian Bell Abstract : Over the past three decades, a significant number of small-magnitude and shallow earthquakes have occurred in the Western Canada Sedimentary Basin and are located along its western flank near areas of oil and gas production. One of the better documented examples is the swarm of earthquakes associated with the Strachan field, in the Alberta foothills. A model based on Segall’s poroelastic theory is developed to account for the occurrence of earthquakes below the Strachan reservoir. Using this methodology, we show that the earthquake of 19 October 1996, underneath the Strachan field, was most probably triggered by gas extraction. The numerical model also implies that gas extraction would cause subsidence and localized changes in in situ stress magnitudes. There is a strong correlation between rates of production and the number of seismic events, but the onset of major seismic activity postdates the commencement of production by approximately 5 years. Poroelastic modelling can account neatly for this observed delay. The modelled stress changes due to gas extraction point to a regime which favours reverse or thrust faulting that is compatible with stress magnitude measurements in the area. The proposed mechanism involves volume changes which decrease the vertical stress S v and increase the larger horizontal stress S Hmax . The mean stress increase beneath the reservoir appears to be small, but increasing the deviatoric stress permits Mohr–Coulomb failure. As a result, the initially high rate and long history of gas extraction appear likely to be the main trigger for the seismicity beneath the Strachan field. Résumé : Au cours des trois dernières décennies, un nombre important de tremblements de terre de faible magnitude et de faible profondeur sont survenus dans le Bassin sédimentaire de l’Ouest du Canada, et localisés le long de son flanc occidental, à proximité de régions productrices de pétrole et de gaz. L’un des exemples le mieux documenté est représenté par le groupe de tremblements de terre associé au champ de Strachan, dans les Foothills de l’Alberta. Un modèle fondé sur la théorie poroélastique de Segall a été élaboré pour expliquer les événements de tremblements de terre sous le réservoir de Strachan. Nous démontrons par cette approche que la cause la plus probable de déclenchement du tremblement de terre du 19 octobre 1996, sous le champ de Strachan, serait l’extraction du gaz. Le modèle numérique révèle en plus que l’extraction du gaz serait responsable d’un phénomène de subsidence et des chang ements apparus localement dans la grandeur des contr aintes in situ. On observ e une forte corrél ation entre les taux de production et le nombre d’événements sismiques, mais le début de l’activité sismique significative n’a débuté que cinq années approximativement après le commencement de la production. La modélisation poroélastique rend compte nettement de ce délai observé. La modélisation des changements des contraintes engendrés par l’extraction du gaz pointe un régime qui favorise le développement de failles chevauchantes ou inverses, qui est compatible avec les mesures de la magnitude des contraintes dans la région. Le mécanisme proposé implique des changements de volume dont l’effet est d’affaiblir la contrainte verticale S v et de renforcer la contrainte horizontale S Hmax plus grande. Il semble que l’augmentation de la contrainte moyenne sous le réservoir soit faible, mais l’accroissement de la contrainte déviatorique est suffisante pour provoquer la rupture Mohr–Coulomb. En conclusion, le taux élevé de l’extraction du gaz au début de l’exploitation et sa longue durée nous apparaissent comme la véritable cause du déclenchement de l’activité sismique sous le champ de Strachan. [Traduit par la Rédaction] Baranova et al. 64 In the latter half of this century it has become apparent that certain engineering activities can lead to earthquakes in the upper crust (Gough 1978; Simpson 1986; Knoll 1992; Bell 1996). Generally, these activities are not the sole cause of the earthquakes; they merely induce seismic activity by altering stress regimes, so failure occurs. In effect, these are humanly triggered earthquakes. Triggered seismicity can re- Can. J. Earth Sci. 36: 47–64 (1999) © 1999 NRC Canada 47 Received April 4, 1998. Accepted August 28, 1998. V. Baranova, 1 A. Mustaqeem, and S. Bell. Geological Survey of Canada, 3303 33rd Street NW, Calgary, AB T2L 2A7, Canada. 1 Corresponding author. Present address: 3, 2127 7 Avenue NW, Calgary, AB T2N 0Z8, Canada (e-mail: [email protected]).
Transcript of 00 Baranova Induced Seismicity Jan 1999 CJES

7/28/2019 00 Baranova Induced Seismicity Jan 1999 CJES
http://slidepdf.com/reader/full/00-baranova-induced-seismicity-jan-1999-cjes 1/18
A model for induced seismicity caused by
hydrocarbon production in the Western Canada
Sedimentary Basin
Valentina Baranova, Azer Mustaqeem, and Sebastian Bell
Abstract: Over the past three decades, a significant number of small-magnitude and shallow earthquakes have occurred
in the Western Canada Sedimentary Basin and are located along its western flank near areas of oil and gas production.
One of the better documented examples is the swarm of earthquakes associated with the Strachan field, in the Alberta
foothills. A model based on Segall’s poroelastic theory is developed to account for the occurrence of earthquakes
below the Strachan reservoir. Using this methodology, we show that the earthquake of 19 October 1996, underneath the
Strachan field, was most probably triggered by gas extraction. The numerical model also implies that gas extraction
would cause subsidence and localized changes in in situ stress magnitudes. There is a strong correlation between rates
of production and the number of seismic events, but the onset of major seismic activity postdates the commencement
of production by approximately 5 years. Poroelastic modelling can account neatly for this observed delay. The
modelled stress changes due to gas extraction point to a regime which favours reverse or thrust faulting that iscompatible with stress magnitude measurements in the area. The proposed mechanism involves volume changes which
decrease the vertical stress S v and increase the larger horizontal stress S Hmax. The mean stress increase beneath the
reservoir appears to be small, but increasing the deviatoric stress permits Mohr–Coulomb failure. As a result, the
initially high rate and long history of gas extraction appear likely to be the main trigger for the seismicity beneath the
Strachan field.
Résumé : Au cours des trois dernières décennies, un nombre important de tremblements de terre de faible magnitude
et de faible profondeur sont survenus dans le Bassin sédimentaire de l’Ouest du Canada, et localisés le long de son
flanc occidental, à proximité de régions productrices de pétrole et de gaz. L’un des exemples le mieux documenté est
représenté par le groupe de tremblements de terre associé au champ de Strachan, dans les Foothills de l’Alberta. Un
modèle fondé sur la théorie poroélastique de Segall a été élaboré pour expliquer les événements de tremblements de
terre sous le réservoir de Strachan. Nous démontrons par cette approche que la cause la plus probable de
déclenchement du tremblement de terre du 19 octobre 1996, sous le champ de Strachan, serait l’extraction du gaz. Lemodèle numérique révèle en plus que l’extraction du gaz serait responsable d’un phénomène de subsidence et des
changements apparus localement dans la grandeur des contraintes in situ. On observe une forte corrélation entre les
taux de production et le nombre d’événements sismiques, mais le début de l’activité sismique significative n’a débuté
que cinq années approximativement après le commencement de la production. La modélisation poroélastique rend
compte nettement de ce délai observé. La modélisation des changements des contraintes engendrés par l’extraction du
gaz pointe un régime qui favorise le développement de failles chevauchantes ou inverses, qui est compatible avec les
mesures de la magnitude des contraintes dans la région. Le mécanisme proposé implique des changements de volume
dont l’effet est d’affaiblir la contrainte verticale S v et de renforcer la contrainte horizontale S Hmax plus grande. Il
semble que l’augmentation de la contrainte moyenne sous le réservoir soit faible, mais l’accroissement de la contrainte
déviatorique est suffisante pour provoquer la rupture Mohr–Coulomb. En conclusion, le taux élevé de l’extraction du
gaz au début de l’exploitation et sa longue durée nous apparaissent comme la véritable cause du déclenchement de
l’activité sismique sous le champ de Strachan.
[Traduit par la Rédaction] Baranova et al. 64
In the latter half of this century it has become apparentthat certain engineering activities can lead to earthquakes inthe upper crust (Gough 1978; Simpson 1986; Knoll 1992;Bell 1996). Generally, these activities are not the sole causeof the earthquakes; they merely induce seismic activity byaltering stress regimes, so failure occurs. In effect, these arehumanly triggered earthquakes. Triggered seismicity can re-
Can. J. Earth Sci. 36: 47–64 (1999) © 1999 NRC Canada
47
Received April 4, 1998. Accepted August 28, 1998.
V. Baranova,1 A. Mustaqeem, and S. Bell. GeologicalSurvey of Canada, 3303 33rd Street NW, Calgary, AB T2L2A7, Canada.
1Corresponding author. Present address: 3, 2127 7 AvenueNW, Calgary, AB T2N 0Z8, Canada (e-mail:[email protected]).

7/28/2019 00 Baranova Induced Seismicity Jan 1999 CJES
http://slidepdf.com/reader/full/00-baranova-induced-seismicity-jan-1999-cjes 2/18
sult from (i) impounding of reservoirs (Gough 1970; Belland Nur 1978; Gupta and Rastogi 1979), (ii) quarrying ormining and subsurface extraction of fluids (Pomeroy et al.1976; Gendzwill et al. 1982; Segall 1989; Davis et al. 1995),(iii) subsurface injection of fluids (Healy et al. 1968; Ra-leigh et al. 1972; Hsien and Bredehoeft 1981; Davis andFrohlich 1993), and (iv) underground explosion (Consoleand Nikolaev 1995). Each of these activities is characterized
by specific mechanisms, most of which involve pore-pressure changes (Kisslinger 1976).
The present paper deals with seismicity resulting fromfluid extraction. Theoretically, the mechanism involved issimilar to that which promotes seismicity during mining ac-tivities (McGarr et al. 1975; Pomeroy et al. 1976; Gendzwillet al. 1982). Many authors such as Segall (1985, 1989),Yerkes and Castle (1976), and Smirnova et al. (1975) haveproposed different models for this type of triggered seismic-ity.
The area highlighted in this study lies on the westernflank of the Western Canada Sedimentary Basin in Alberta,near the town of Rocky Mountain House (Fig. 1). This is notan area of high natural seismicity (Rogers and Horner 1991),but, over the past several decades, numerous small-magnitude earthquakes have occurred along the westernflank of the basin in areas where oil and gas have been ex-tracted (Milne 1970; Milne and Berry 1976; Rebollar et al.1982, 1984; Wetmiller 1986). Many are suspected to havebeen triggered by hydrocarbon production, but this is un-proven because of lack of on-site monitoring. For example,Milne (1970) described a magnitude 5.1 earthquake that oc-curred in 1970 at Snipe Lake, Alberta. He noted that its lo-cation was anomalous and speculated that its occurrencemight be related to oil and gas production activities in thearea. Rebollar et al. (1982, 1984) and Wetmiller (1986) in-
vestigated earthquake swarms near Rocky Mountain House,Alberta. Wetmiller concluded that the earthquakes may havebeen induced by gas production. A much stronger case forinduced seismicity was made by Horner et al. (1994) for therecent earthquake swarm near Fort St. John, British Colum-bia, which has been extensively monitored. Horner et al.have assembled stress and fluid-pressure data which suggestthat the probable triggering mechanism for these earth-
quakes is water injection into oil-bearing Permian BelloyFormation sandstones in the Eagle and Eagle West fields.
In this study, we revisit the Rocky Mountain House earth-quakes, evaluate their occurrence in the light of gas produc-tion from the Strachan field, and propose a mechanism toexplain their timing and nature.
The Western Canada Sedimentary Basin extends along asoutheast–northwest-trending axis across southern Manitoba,southern Saskatchewan, Alberta, and northeastern BritishColumbia (Fig. 1). It contains Phanerozoic sediments rang-ing in age from Cambrian to Palaeocene which rest uncon-formably on metamorphic rocks of the Canadian Shield. ThePaleozoic section is dominated by carbonates that accumu-lated in passive-margin environment (Mossop and Shetsen1994), whereas the overlying Mesozoic and Cenozoic rock units are predominantly clastic and accumulated in a fore-land-basin setting (Leckie and Smith 1992). The foreland-basin deposits form a series of west-thickening wedges and,together with the underlying Paleozoic sediments, areoverthrust along the western flank of the basin. Total sedi-ment thickness reaches 5 km along the western margin of the basin.
© 1999 NRC Canada
48 Can. J. Earth Sci. Vol. 36, 1999
A L B
E R T A
B R I T I S H
C O LU M B I A
Y UKON
S A S K A T C H E W
A N
NORT HW E S T T E R RI TO R I E S
M A N I T O B A
Rocky Mountain House
Stress trajectoryof S
Hmin
>20 20 18 16 <16 kPa / m
HminS
gradient
0 500 km
C A N A D I A N S H I E L D
Fig. 1. Contemporary stress field in the Western Canada Sedimentary Basin.
7/28/2019 00 Baranova Induced Seismicity Jan 1999 CJES
http://slidepdf.com/reader/full/00-baranova-induced-seismicity-jan-1999-cjes 3/18
Some overpressuring is present at depth along the westernedge of the basin, but most units are hydrostatically pres-sured, or underpressured. The only potential décollementzone, where geomechanical detachment might take place, isthe Lower Devonian halite-rich section of the PrairieEvaporite. However, similar oriented horizontal stresses
above and below this unit suggest that the entire sedimen-tary section is attached to the basement (Bell 1996). Thestress regime is directionally homogeneous (Fig. 1) in thatS Hmax, the maximum horizontal stress, is regionally orientednortheast–southwest across most of the basin (Bell andGough 1979; Adams and Bell 1991). There is persuasive ev-
© 1999 NRC Canada
Baranova et al. 49
115o120
o
115o
120o 110
o
110o
50o
50o
52o
52o
54o
54o
56o
56o
58o
58o
60o
RMHSZ
Calgary
Study Area
Snipe LakeEarthquake
Turner ValleyCluster
BrazeauRiver
Cluster
Fort St. JohnCluster
Edmonton
C a n a d i a n
S h i e l d
W e s t e
r n
C a n
a d i a n
S e d
i m e n t a r y
B a s i n
R o c k y
M o u n t a i n s
Seismograph stations
2.0 - 2.5
2.5 - 3.03.0 - 3.5
3.5 - 4.0
Above 4.0
d i s t u r b e d b e l t
Magnitude of earthquakes
6
7
1
8
5 4
3
#
2
9
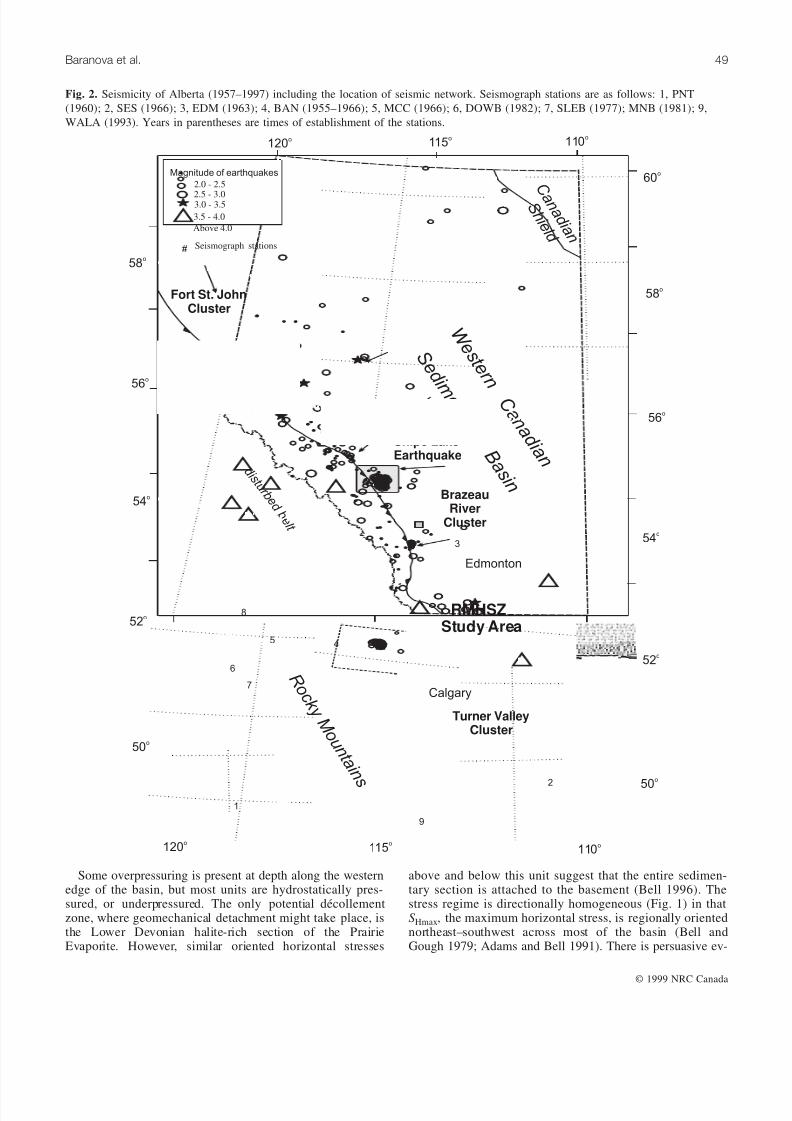
Fig. 2. Seismicity of Alberta (1957–1997) including the location of seismic network. Seismograph stations are as follows: 1, PNT
(1960); 2, SES (1966); 3, EDM (1963); 4, BAN (1955–1966); 5, MCC (1966); 6, DOWB (1982); 7, SLEB (1977); MNB (1981); 9,
WALA (1993). Years in parentheses are times of establishment of the stations.

7/28/2019 00 Baranova Induced Seismicity Jan 1999 CJES
http://slidepdf.com/reader/full/00-baranova-induced-seismicity-jan-1999-cjes 4/18
idence that horizontal stress magnitudes vary laterally withinthe Western Canada Sedimentary Basin. Bell (1996) pre-sented a preliminary interpretation showing a systematic in-crease in the minimum horizontal stress (S Hmin) gradients
southwestwards towards the overthrust Rocky Mountainfoothills, where S Hmin magnitudes approach and locally ex-ceed overburden stresses. The highest S Hmin gradients so fardocumented come from foothill wells drilled in structuralsettings comparable to that of Rocky Mountain House.These elevated gradients may reflect paleostresses derivedfrom the Laramide orogeny and (or) they may be an artifactof late Tertiary uplift and erosion. Thus, the differentialstress σ1 – σ3 (where σ1 and σ3 are the largest and smallestprincipal stress, respectively) also increases toward thesouthwest (Fig. 1). This is important because it is the differ-ential effective stress, together with the geomechanical prop-erties of a rock unit, which determine its propensity tofracture. The basin is not highly active seismically (Rogers
and Horner 1991). Earthquakes of magnitude 4 and greaterare rare (Fig. 2). Most seismic events are barely felt and, ex-cept for a few earthquakes like the Snipe Lake event of March 1970 ( M = 5.1), they have not caused alarm in thislightly populated region of Canada. The high seismicity of the intermontane belt that passes through Utah, Wyoming,and Montana south of the United States border (Smith andArabasz 1991; Rogers and Horner 1991), does not extendnorthwards into the Western Canada Sedimentary Basin.
Available seismic dataThe catalogue of earthquakes used in this study is a subset
of the Canadian seismic events database for the last 100
years. The first recorded seismic event for the Alberta Basinoccurred in 1957. Currently, there are four seismic stationslocated in Alberta, and the western Canadian earthquakesare recorded reliably by these stations together with many in
British Columbia, Saskatchewan, Montana, and the North-western Territories. In Alberta, the catalogue lists 419 eventswith magnitudes up to 5.1. Events smaller than magnitude 2were included only from 1993. Many more smaller eventswould be recognised if a denser seismometer grid was em-ployed. Rebollar et al. (1984) recorded 220 events betweenJanuary 1976 and February 1980 with magnitude less than 4in the Rocky Mountain House area. This is twice the totalnumber of events in the catalogue for the same period. Thecatalogue lists the time of a seismic event, its location, itsmagnitude, and the felt area. The depth has not been deter-mined for most events. Rebollar et al. (1982, 1984) andWetmiller (1986) attempted to determine the depth of spe-cific earthquakes in the Rocky Mountain House Seismic
Zone (RMHSZ), but the results are inconclusive.
General pattern of seismicity of the Alberta BasinFigure 2 portrays earthquakes that occurred in Alberta
prior to March 1996. Seismic events are more or less evenlydistributed along the Alberta foreland fold and thrust belt(disturbed belt), except for major clusters at Turner Valley,Rocky Mountain House, and Brazeau River. Figure 3 showsthe number of seismic events per year for this area. The in-crease in number of earthquakes in recent years cannot beexplained fully by the improvement of the seismic network.Horner and Hasegawa (1978) discuss the spatial and tempo-ral distribution of seismograph stations in western Canada.
© 1999 NRC Canada
50 Can. J. Earth Sci. Vol. 36, 1999
0
5
10
15
20
25
30
35
40
45
50
1 9 5 2
1 9 5 4
1 9 5 6
1 9 5 8
1 9 6 0
1 9 6 2
1 9 6 4
1 9 6 6
1 9 6 8
1 9 7 0
1 9 7 2
1 9 7 4
1 9 7 6
1 9 7 8
1 9 8 0
1 9 8 2
1 9 8 4
1 9 8 6
1 9 8 8
1 9 9 0
1 9 9 2
1 9 9 4
1 9 9 6
N u m b e r o f e a r t h q u a k e s r e c o r d e d
Fig. 3. Number of events ( M > 2) recorded yearly in Alberta.

7/28/2019 00 Baranova Induced Seismicity Jan 1999 CJES
http://slidepdf.com/reader/full/00-baranova-induced-seismicity-jan-1999-cjes 5/18
For the period 1936–1956 there was one seismic station in
Alberta (in Banff), one in Saskatchewan, and one inMontana. By 1966, seismic events in the RMHSZ were be-ing registered by more than six seismic stations in Alberta,British Columbia, Saskatchewan, and Montana.
We selected the RMHSZ cluster of events for closer inves-tigation into the possible causes of the seismicity. Thischoice was made because this is the main area of concen-trated seismicity in Alberta, it is the oldest producing zonewhich is also still active seismically, and it is the area withthe largest amount of relevant data, including focal-mechanism solutions and gas production statistics. The studyencompasses the region between 52° and 52°30′N and 115°and 115°30′W, and covers approximately 700 square miles.It includes Strachan, Phoenix, part of Ricinus, Ricinus West,
the western part of Ferrier, and Caroline fields (Fig. 4).
Statistical analysisFigure 4a shows the seismic events, and Fig. 4b portrays
all the producing wells (oil, gas, and water injection) in thestudy area. The earthquakes are mostly concentrated withinthe Strachan field, which produces mainly gas (five oil wellsout of 36 producing wells). No seismic events have been ob-served around the western part of the Ferrier field or around
Caroline, both of which produce mainly oil. Ricinus
produces half oil and half gas and is characterized by highseismic activity of variable magnitude in the vicinity both of the gas and oil producing wells. In addition, many seismicevents were recorded around Ricinus West, which is mainlya gas-producing field. As can be seen, the seismic events inthe study area are concentrated mainly in the vicinity of gas-producing pools and they are far less abundant near oil-producing areas.
As reported by Wetmiller (1986), Horner et al. (1994),and an in-house database of the Geological Survey of Can-ada (Calgary), high-pressure water injection has been carriedout for only two wells at Strachan. Water injection was car-ried out at Ferrier, but there are no associated seismic events(Fig. 4).
The data on gas production are provided by the AlbertaEnergy and Utilities Board (1996) for the Strachan, Ricinus,and Ferrier fields. Figure 5 shows the high correlation coeffi-cient (r = 0.61) between gas-production volumes and num-ber of seismic events for Strachan D3-A gas pool from 1976to 1995. There is a lag between the commencement of pro-duction (1970) and the onset of seismic events (1975–1976).The significance of this lag will be discussed later. Between1976 and 1995 there is a strong correlation between the inci-dence of seismic events and fluctuations in production.
Figure 6 is a contour map of the depths of producingwells which also shows the location and magnitudes of seis-mic events. The majority of the seismic events are enclosed
© 1999 NRC Canada
Baranova et al. 51
gas
water injection
oil
Magnitude of earthquakes
hydrocarbonfield
boundary
Type of wells
2.0 - 2.4
2.5 - 2.9
3.0 - 3.43.5 - 3.9
> 4.0
(a)
Ricinus - name of a hydrocarbon field
52
52.1
52.2
52.3
52.4
52.5
52
52.1
52.2
52.3
52.4
52.5
115115.1115.2115.3115.4115.5115115.1115.2115.3115.4115.5
A
A'
(b)
A - A' - cross section
Strachan
Ricinus West
Caroline
Ricinus
PhoenixFerrier
Fig. 4. (a) Seismicity of RMHSZ. (b) Approximate location of the hydrocarbon fields of RMHSZ, showing all the producing wells and
cross section A–A′.

7/28/2019 00 Baranova Induced Seismicity Jan 1999 CJES
http://slidepdf.com/reader/full/00-baranova-induced-seismicity-jan-1999-cjes 6/18
by the 3000 m contour. The Snipe Lake event (Milne 1970)is not shown on Fig. 6, but it also occurred in an area wherethe production wells were deeper than 2500 m. There are646 oil and gas wells within 80 km of Snipe Lake with aver-age depths of 2600 m. It appears that the wells shallowerthan 2500 m do not play an important role in generating in-duced seismicity in the Western Canada Sedimentary Basin.
Similar well depth – seismicity relationships have been re-ported elsewhere. Beneath the Lacq gas field in southwestFrance, induced earthquake epicentres coincide areally withwells drilled deeper than 3200 m (Grasso 1992). In the Gazliand Grozny gas fields in the former Soviet Union which arefamous for their devastating induced seismicity (Smirnova etal. 1975; Plotnikova et al. 1989), the majority of the eventsoccurred in proximity to wells deeper than 3000 m.
In the study area, the seismic monitoring program run byWetmiller in 1980 (Wetmiller 1986) demonstrated that themajority of the events were concentrated within a thin hori-zontal interval approximately 5000 m below the surface(4000 m below sea level) and at an average of 900 m belowthe Devonian Leduc carbonates from which gas has been ex-
tracted at Strachan, Ricinus, and Ricinus West (Fig. 7).Wetmiller (1986) deployed five Sprengnether MEQ-800smoked-paper seismographs and one Sprengnether DR-100three-component digital seismograph. Over a 3 week period,14 sites were occupied. One hundred and forty six micro-earthquakes were recorded by the network, of which 67 werelocated. Epicentres were located in the basal Cambrian se-quence and within the Precambrian basement.
Analytical approach
It is not intuitively obvious why gas production, unaccom-panied by fluid injection, should trigger earthquakes. Nor
does it seem reasonable that these earthquakes should occurbeneath the rocks from which fluids were withdrawn. Thisconundrum has been resolved by Segall (1985), who em-ployed Biot’s Theory (Rice and Cleary 1976) to show howchanges in fluid content within a reservoir can result inmodifications to the stress regime in adjacent and underlyingrocks and that, in specific circumstances, these changes can
trigger seismicity. Segall’s approach is followed in thisstudy. Where possible, we have used measured quantities,but some parameters have had to be estimated, as discussedbelow. The material properties used in the calculations arelisted in Table 1. The geometry of the field used is shown inFig. 8. To simulate conditions that might trigger seismicity,we have simplified the geometry of the Strachan D-3A poolso as to analyse a linear accumulation. This is portrayedschematically in Fig. 8.
The rate of liquid extraction per year for gas is reported(Alberta Energy and Utilities Board 1996) without takinginto account the gas formation volume factor. Slider (1976)derives the gas formation volume factor ( Bg) as
[1] BznRT
Pg = 5615.
where P is the pressure in psi (1 psi = 6.895 kPa), z is a de-viation factor, n is the number of moles (1/379), R isRhydberg’s constant, and T is the temperature in K. Withthis relationship, a revised figure for gas extraction that givesthe true volume of gas extracted from the reservoir porespaces was obtained. Fluid compressibility for gas (β) istaken from Alberta Energy and Utilities Board (1996) forgas subject to a pressure of 7000 psi, the virgin reservoirpressure at Strachan (Rose 1990). The viscosity of gas (η) istaken from McCain (1973) and equated to the viscosity of
© 1999 NRC Canada
52 Can. J. Earth Sci. Vol. 36, 1999
2.5
3.75
5.0
6.25
7.5
8.75
10
1.25
00
5
10
15
20
25
30
35
40
N u m b e r o f e v e n t s ( M > 2 ) p e r y e a r
G a s p r o d u c t i o n ( m l n . m
/ y r )
3
1970 1972 1974 1976 1978 1980 1982 1984 1986 1988 1990 1992 1994 1996
Gas production
Number of Earthquakes
Fig. 5. Relationship between gas production and seismicity for Strachan D3-A pool; r = 0.61 (1976–1995).

7/28/2019 00 Baranova Induced Seismicity Jan 1999 CJES
http://slidepdf.com/reader/full/00-baranova-induced-seismicity-jan-1999-cjes 7/18
methane at 7000 psi and 124°C. Skempton’s coefficient ( B),Poisson’s ratios (both drained ν and undrained νu), and theshear modulus (µ) are not reported for the Strachan field, orfor any other fields in the Western Canada Sedimentary Ba-sin. The values used are from Rice and Cleary (1976) as es-timated for Tennessee marble. The density of limestone (ρ)is taken from Anderson et al. (1989) and conformed withdensity log measurements at the 10-31-37-9W5 well. Theshear modulus µ is estimated using the equation
[2] µ ρ= V s2
where the sheer wave velocity V s = 3200 m/s, and density isknown. V s is derived from V p / r , where the compressionalwave velocity V p = 5500 m/s as reported by Anderson et al.(1989), and the reflection coefficient r is derived from
[3] νu 0.16= −−
=( )
( )
r
r
2
2
2
2 1
where νu is the undrained Poisson’s ratio.
Diffusivity c is estimated after Segall (1985) as
© 1999 NRC Canada
Baranova et al. 53
52.00
52.1
52.20
52.30
52.40
52.50
4 0 0 0
4 0 0 0
3 0 0 0
3 0 0 0
3 5 0 0
3 5 0 0
4 0 0 0 4 5 0 0
3 5 0 0
4 0 0 0
3 0 0 0 2 5 0 0
3 0 0 0
3 5 0 0
3 5 0 0
4 5 0 0
Magnitude of earthquakes
2.0 - 2.42.5 - 2.93.0 - 3.43.5 - 3.9> 4.0
3000
producing wells (m)depth of
115.6 115.5 115.4 115.3 115.2 115.1 115.0
Fig. 6. Relationship between the seismicity and the depth of producing in RMHSZ.

7/28/2019 00 Baranova Induced Seismicity Jan 1999 CJES
http://slidepdf.com/reader/full/00-baranova-induced-seismicity-jan-1999-cjes 8/18
[4] c =φκ
η β
where φ is the porosity, β is the fluid compressibility, η is thefluid viscosity, and κ is the permeability. The changes inpore-fluid content ( M ) are calculated as
[5] M y t V
LT t c
y
ct ( , ) ( / )½= −
φ
ierfc
2
4
where V is the extracted volume, L is the length along strike,T is the thickness, t is the duration in years, y is the distancefrom the point of extraction, and ierfc( x) is the first integralof the complementary error function and is given by theequation
[6] ierfc erfc d erfc( ) ( ) [ ( )] xe
x x x x
= = −∫ −
0
2
ξ ξπ
where x, y = ζ ξ, at the point of extraction, where ζ and ξ arethe vertical and horizontal coordinates.
© 1999 NRC Canada
54 Can. J. Earth Sci. Vol. 36, 1999
Leduc Ree f
11-33-35-10W5 6-25-36-10W5 10-30-37-9W5 6-34-37-9W5 6-14-38-9W5 9-23-40-9W5
500
0
1000
3000
3500
4000
2500
2000
1500
500
0
1000
3000
3500
4000
2500
2000
1500
D e p t h ( m
b m s l )
Belly River Gp.
Colorado Group
Woodbend GroupWabamun Group
Rundle Group
Mannville Group
Ricinus West Strachan Ferrier
SSWNNE
C o o k i n g L a k e F m.
Approximate Location of Earthquake Swarm
Fig. 7. Cross section through the RMHSZ (A–A′ in Fig. 4). Approximate location of the earthquake swarm is after Wetmiller (1986).
bmsl, below mean sea level.
Parameter Symbol Value References
Depth (km) D 4.100 Rose 1990
Thickness (m) T 115 (net pay) Alberta Energy and Utilities Board 1996
Average rate of gas extraction (m3 /year) V 2.62 × 10⁶ Alberta Energy and Utilities Board 1996
Extraction starts (year) — 1971 Alberta Energy and Utilities Board 1996
Characteristic length along strike (km) L 7 Rose 1990
Average porosity φ 0.082 Alberta Energy and Utilities Board 1996
Permeability (m2) κ 2.46 × 10¹³ Rose 1990
Fluid compressibility (Pa–1) β 1.6 × 10⁻⁴ Alberta Energy and Utilities Board 1996
Viscosity (Pa·s) η 31 × 10–6 McCain 1973
Diffusivity (m2 /s) c 0.6 × 10⁻³ (1.89 × 10⁴ m2 /year) See text
Skempton’s coefficient B 0.51 Rice and Cleary 1976
Poisson’s ratio (undrained) νu 0.16 Carmichael 1984
Poisson’s ratio (drained) ν 0.14 Carmichael 1984
Density of limestone (kg/m3) ρ 2750 Carmichael 1984; Anderson et al.1989
Shear modulus (Pa) µ 3.367 × 10⁹ See text
Table 1. Average properties of the producing horizon, Strachan D-3A pool.

7/28/2019 00 Baranova Induced Seismicity Jan 1999 CJES
http://slidepdf.com/reader/full/00-baranova-induced-seismicity-jan-1999-cjes 9/18
© 1999 NRC Canada
Baranova et al. 55
L
mea
n sea le v
e l
x
y
z
D
T
NW
SE
Fig. 8. Permeable producing layer of thickness T buried at a depth D in a fluid-infiltrated, impermeable half-space. L, length of
reservoir along strike.
-0.9
-0.8
-0.7
-0.6
-0.5
-0.4
-0.3
-0.2
-0.1
-1
0
0.1
-2000 -1500 -1000 -500 500 1000 1500 2000
5
10
15
20
25
Horizontal distance from the point of extraction (m)
p o r e f l u i d c
o n t e n t m ( y , t
)
yrs
yrs
yrs
yrs
yrs
Fig. 9. Changes in pore-fluid content in fraction (variable rate of extraction for the Strachan field).

7/28/2019 00 Baranova Induced Seismicity Jan 1999 CJES
http://slidepdf.com/reader/full/00-baranova-induced-seismicity-jan-1999-cjes 10/18
Subsidence u x is calculated after Segall (1985) as
[7] u x y t B VD
L
t
c x( , , )
( ) &½
= = +
0 u2 1
3
νπ
×+ −−∞
∞
∫ ierfc
d( / )
( )
½ξξ
ξ2
2 2
4ct
D y
where D is the depth in metres, and &V is the volume of gasextracted per year.
The following equations are used to calculate the stresschanges σmn below the Strachan field:
[8] σ µ νπ νmn x y t B V
L
t
c( , , )
( ) &
( )
½
= − +−
1
3 1
u
u
×
−∞
∞∫ G x y D
ct mn( , , , )
½
ξ ξ ξierfc d2
4
where m, n = x, y, and the Green functions Gmn are
[9] Gy x
r
x x y
r xx = − − − + + + − −( ) ( ) ( )( ) ( )ξ ζ ξ ζ ξ2 2
14
2
24
5
−
+ −16 2
26
x x y
r
( )( )ζ ξ
[10] Gx y
r yy = − − −( ) ( )ζ ξ2 2
14
+ + − − −( )( ) ( ) x x y
r
ζ ζ ξ3 3 2
24
− + −16 2
26
x x y
r
( )( )ζ ξ
© 1999 NRC Canada
56 Can. J. Earth Sci. Vol. 36, 1999
No. of years (n)
Production rate (×103 m3 /year)
averaged from the onset of production
Production rate (×103 m3 /year)
averaged for 5 years and used in the calculations
5 2744 2744 (1971–1976)
10 2337 1930 (1977–1982)
15 1893 1004 (1983–1988)
20 1580 640 (1989–1994)25 1350 430 (1995–recent)
Table 2. Rate of production of Strachan field D-3A pool.
-0.3
-0.25
-0.2
-0.15
-0.1
-0.05
0
-25000 -20000 -15000 -10000 -5000 5000 10000 15000 20000 25000
Horizontal distance from the point of extraction (m)
S u b s i d e n c e ( m )
t=5
t=10
t=15
t=20
t=25
yrs
yrs
yrs
yrs
yrs
Fig. 10. Subsidence using variable rate of extraction in the Strachan field.

7/28/2019 00 Baranova Induced Seismicity Jan 1999 CJES
http://slidepdf.com/reader/full/00-baranova-induced-seismicity-jan-1999-cjes 11/18
© 1999 NRC Canada
Baranova et al. 57
4000
5000
6000
7000
8000
-3000 -2000 -1000 1000 2000 3000
Horizontal distance from the point of extraction (m)
D e
p t h ( m
b m s l )
- 0 . 2 5
-0.25
0 . 0 0
. 0 0 . 0 0
. 0
0.25
0. 2 5
0.25
0 .2 5
-0.5
- 0. 5
-1.0
-2.0
- 1. 0
Fig. 11. Incremental changes in magnitude of vertical stress field (MPa) below Strachan reservoir (D3-A pool) shown on a southwest–
northeast vertical plane, after 5 years (solid lines) and 20 years (broken lines) of gas extraction. ଙ, approximate location of the
seismic event.
4000
5000
6000
7000
8000
-3000 -2000 -1000 1000 2000 3000
Horizontal distance (m) from the point of extraction
D e p t h ( m
b m s l )
0. 5
1. 0
0.4
0. 4
0.5
1.0
2.0
0.3
0. 3
- 0 .3
- 0 .2
-0.1
-0.1
0 .0 0 .0
0.2
0.1
-0.1 - 0
. 2
- 0. 3
- 0 .1
0. 2
0. 1
0. 0 0. 0
Fig. 12. Incremental changes in magnitude of horizontal stress field (MPa) below Strachan reservoir (D3-A pool) shown on a
southwest–northeast vertical plane, after 5 years (solid lines) and 20 years (broken lines) of gas extraction. ଙ, approximate location of
the seismic event.

7/28/2019 00 Baranova Induced Seismicity Jan 1999 CJES
http://slidepdf.com/reader/full/00-baranova-induced-seismicity-jan-1999-cjes 12/18
[11] G
y x
r
y x
r xy =− − −
−− +2 2 3
14
24
( )( ) ( )( )ξ ζ ξ ζ
− + −16 2
26
x x y
r
( ) ( )ζ ξ
where r x y r x y12 2 2
22 2 2= − + − = + + −( ) ( ) and ( ) ( )ζ ξ ζ ζ .
Pore-fluid content changes and subsidence due to gasproduction
Figure 9 shows the changes in pore-fluid content calcu-lated from eq. [5]. The rate of extraction is used averagedfor each 5 year increment of production (Table 2):
[12] M M M M n n ntotal = + −− −5 51( )
where M total is the net change of pore-fluid content after nyears of production. Figure 9 shows that nearly 70% of fluidcontent was extracted for the first 5 years of production.Fluid extraction will be associated with reservoir compactionand surficial subsidence above the reservoir.
The above theory is also used to calculate the subsidencewhich might have occurred above the Strachan field as a re-sult of gas extraction. Unfortunately, we are unable to relatethe calculated results to observations due to lack of data.The most recent map of vertical crustal movements com-piled by the Geological Survey of Canada (Vanicek and
Nagy 1980) shows negligible movements close to 0 cm/yearin the vicinity of RMHSZ due to lack of resolution.
The parameters used in the calculation are the same asthose used previously. It is clear that the subsidence in-creases linearly with the rate of fluid extraction and dependson hydraulic diffusivity. Figure 10 shows the calculated rateof subsidence due to variable rate of extraction (for 5, 10,15, 20, and 25 years). For the first 5 years of gas production,when the rate of extraction was the highest (see Table 2), thesubsidence could reach 25 mm/year, decreasing to11 mm/year after 25 years of gas production. As mentionedabove, we cannot compare calculated results with observedones. However, it is worth noting that Segall’s (1985) calcu-lated results coincide well with the observed ones and give
3–6 mm/year due to oil extraction. According to Maury etal. (1992), the average rate of subsidence of the Lacq gasfield in France for 20 years of extraction is 2.1 mm/year, al-though the production rate is much lower than that atStrachan.
Changes of stress fields below Strachan field because of production
Changes in vertical (σ xx) and horizontal (σ yy) stresses be-low the Strachan D-3A pool are calculated according toeq. [8]. The parameters used for the calculations are given inTable 1. The changes in stresses are plotted in the x– y planewhich is perpendicular to the strike of the pool and is ap-
© 1999 NRC Canada
58 Can. J. Earth Sci. Vol. 36, 1999
4000
5000
6000
7000
8000
-3000 -2000 -1000 1000 2000 3000
Horizontal distance from the point of extraction (m)
D e p t h ( m
b m s l )
0. 0 6
0. 0 8
0.02
0. 0 4
0.06
0.04
0. 0 2
0 . 0 0
0.10
0.14
0.16
0.08
Fig. 13. Incremental changes in magnitude of mean stress field (MPa) below Strachan reservoir (D3-A pool) shown on a southwest–
northeast vertical plane, after 5 years (solid lines) and 20 years (broken lines) of gas extraction. ଙ, approximate location of the
seismic event.

7/28/2019 00 Baranova Induced Seismicity Jan 1999 CJES
http://slidepdf.com/reader/full/00-baranova-induced-seismicity-jan-1999-cjes 13/18
proximately parallel to the direction of the S Hmax (Figs. 11,12). Calculations were made for 5 and 20 years after extrac-
tion started in 1971. In this paper the positive stresses are al-ways treated as compressions.
The mean stress [(σ xx + σ yy)/2] (Fig. 13) and thedeviatoric stress changes [(σ xx – σ yy)/2] (Fig. 14) are plottedon the same x– y plane. It is notable that the changes in meanstress are very small (0.1 MPa) as compared with thedeviatoric stresses, which are of the order of 1 MPa. Thisphenomenon can be explained by the fact that due to extrac-tion the changes in vertical stress are negative (dilatation),whereas the changes in horizontal stress (see Fig. 12) arepositive (compression).
The above stress changes are then applied to the focal-mechanism solution of the 3.9 magnitude RMHSZ earth-
quake that occurred on 19 October 1996 (R. Horner, per-sonal communication, 1997). This yielded two solutions,NP1 302/51° northeast and NP2 156/44° southwest, at an ap-proximate depth of 4 km below sea level (Fig. 15), which is1 km below the Strachan D3-A pool.
It is interesting to note that the strike of the D3-A pool isalmost the same as the strike of the fault planes suggested bythe focal-mechanism solution (northwest–southeast 302 and336). The vertical and horizontal stresses are resolved intonormal, shear, and driving stresses on the two planes and areplotted in Figs. 16 and 17. These stresses represent thechanges of magnitude in the existing stress state due to gasproduction from the Strachan D3-A pool.
© 1999 NRC Canada
Baranova et al. 59
4000
5000
6000
7000
8000
-3000 -2000 -1000 1000 2000 3000
Horizontal distance (m) from the point of extraction
D
e p t h ( m
b m s l )
1.0
2.0
0. 4
0. 3
0. 5
1. 0
2. 0
0.4
0.5
0.2
0. 2
0. 1
0.1
0.3
0 . 0
0 . 0
- 0 .1
- 0. 2
-0.1
- 0. 2
- 0 .1
- 0 .2
- 0 .1
- 0 .2
0. 0
0. 0
Fig. 14. Incremental changes in magnitude of deviatoric stress field (MPa) below Strachan reservoir (D3-A pool) shown on a
southwest–northeast vertical plane, after 5 years (solid lines) and 20 years (broken lines) of gas extraction. ଙ, approximate location of
the seismic event.
NSHmax
Fig. 15. Lower hemisphere equal area projection of the best
fitting double-couple solution of the focus for a seismic event
( M = 3.9), dated 19 October 1996 at Rocky Mountain House,
Alberta (52°13′N, 115°13′W), which occurred at an estimated
depth of 4.0 km below mean sea level (R.B. Horner, personal
communication, 1997).

7/28/2019 00 Baranova Induced Seismicity Jan 1999 CJES
http://slidepdf.com/reader/full/00-baranova-induced-seismicity-jan-1999-cjes 14/18
The change in driving stress (∆σd) acting to cause dis-placement is calculated following Segall (1985) as
[13] ∆ ∆ ∆ ∆σ σ σd s n= + + f p( )
where ∆σs and ∆σn are the changes in shear and normalstresses, respectively; f is the coefficient of friction; and ∆ pis the change in pore pressure. Change in pore pressure iscalculated as
[14] ∆ ∆ p
B
nn=
+( )1
3
ν
σu
where ∆σnn is the change in mean stress.The positive sign of shear stress on both planes favours re-
verse faulting up to 8 km below the Strachan field(Figs. 16a, 17a). Note that the changes in the magnitudes of shear stress are quite high; it decreases from 4.5 MPa rightbelow the reservoir to approximately 1 MPa at 4 km belowsea level, the depth of the seismic event. Changes in magni-tude of normal stress at both planes are relatively low, asshown in Figs. 16b and 17b. On the southwest-dipping planeit represents compression, whereas on northeast-dipping
plane it represents dilatation. The changes in magnitudes of normal stress on both planes decrease with depth.
The changes in driving stress on the southwest- and north-east-dipping planes are shown in Figs. 16c and 17c, respec-tively. Changes in driving stresses after 5 and 20 years of gas production favour reverse faulting and show the sharpdecrease in magnitudes from 4 MPa right below the reser-voir up to almost nothing at a depth of 6 km.
Figure 18 depicts the inferred Mohr–Coulomb circle and
failure line before and after the gas extraction. Since we donot know the exact value of the coefficient of friction for therocks in which failure occurred, the most common value(0.6) is used. Figure 19 shows changes of S Hmin with depthbased on hydraulic fractures run in Mesozoic rocks in theCaroline, Ricinus, and Strachan fields (McLellan 1989). Avalue of 120 MPa was assigned for S Hmin at the depth of earthquake occurrence (4000 m below mean sea level). Notethat a change of only 1 MPa in stress is apparently sufficientto produce the failure under the recent rate of extraction(Fig. 18). The proposed mechanism of failure suggests thatthe overburden pressure (vertical stress) is decreasing while
© 1999 NRC Canada
60 Can. J. Earth Sci. Vol. 36, 1999
0
0.1
0.2
0.3
3000 4000 5000 6000 7000 8000
3000 4000 5000 6000 7000 8000
3000 4000 5000 6000 7000 8000
Depth (m bmsl)
Depth (m bmsl)
Depth (m bmsl)
N o r m a
l s t r e s s ( M P a )
(b)
0
1
2
3
4
5
6
0
1
2
3
4
5
6
(a)
S h e a r s t r e s s ( M P a )
(c)
D r i v i n g s t r e s s ( M P a )
Fig. 16. Incremental changes in magnitude of shear (a), normal
(b), and driving (c) stresses with depth at a plane dipping 44°
southwest below the Strachan field after 5 years (solid lines) and
20 years (broken lines) of gas production.
Depth (m bmsl)
3000 4000 5000 6000 7000 8000
0.5
0.0
-0.5
-1.0
N o r m a l s t r e s s ( M P a )
(a)
3000 4000 5000 6000 7000 8000
Depth (m bmsl)
S h e a r s t r e s s ( M
P a )
(b)
Depth (m bmsl)
3000 4000 5000 6000 7000 8000
6
5
4
3
2
1
0
6
5
4
3
2
1
0
D r i v i n g s t r e s s ( M P a )
(c)
Fig. 17. Incremental changes in magnitude of shear (a), normal
(b), and driving (c) stresses with depth at a plane dipping 51°
northeast below the Strachan field after 5 years (solid lines) and
20 years (broken lines) of gas production.

7/28/2019 00 Baranova Induced Seismicity Jan 1999 CJES
http://slidepdf.com/reader/full/00-baranova-induced-seismicity-jan-1999-cjes 15/18
the normal stress is increasing due to extraction. This canexplain the modest changes in mean stress which have theeffect of increasing the radius of the Mohr’s circle until itcrosses the failure threshold. Since the stress regime and fo-cal mechanism favour thrust faulting, we assume that failure
occurred within a preexisting low-angle fault zone.
The regional state of stress in the RMHSZ is close to thecondition at which earthquakes could occur (Bell 1996), sosmall stress and strain changes could trigger seismic insta-bilities. We have shown that the rate of extraction (especiallyduring the first 5 years for the Strachan field) can give rise tochanges of stress magnitudes great enough to trigger earth-quakes on reactivated faults. In the case of RMHSZ, theproximity to the disturbed belt and the instability of the stateof stress are two factors that play important roles in generat-
ing the seismicity in the area.There is no correlation between water injection and occur-
rence of earthquakes in the study area, although there are ex-amples of seismic events caused by water injection inwestern Canada. According to Horner et al. (1994), earth-quakes in the Fort St. John oil production area have beencaused by massive water injection and occurred immediatelyafter commencement of injection. We suspect that seismicevents in Snipe lake, as well as in Turner Valley, were alsocaused by water injection. Water injection in the study areawas carried out in several wells in the Ferrier, Ricinus West,and Strachan fields. The lack of seismic events associated
with it allows us to conclude that the volume of water in- jected simply was not enough to cause stress release.
It is interesting to note that, in the case of Strachan (thispaper), Lacq (Grasso and Wittlinger 1990), Gazli (Smirnovaet al. 1975), and Grozny (Plotnikova et al. 1989) gas produc-
tion areas, the onset of earthquake activity is very similarand started 5–10 years after gas extraction began. We believethat this period was required to accumulate the stressesneeded to initiate movements on the faults in a “disturbedzone” (in our case) below the reservoir. Once the faults areactivated, the failure line in Mohr–Coulomb criteria comescloser to the circle because of lowering of the coefficient of friction of the faults. So, it can explain the lack of correla-tion between the rate of production and seismicity of theStrachan field during the 5–7 years of extraction. However,the correlation increases dramatically after fault movementsbegin to occur below the reservoir.
There is no similarity in the relative depths of seismicevents in the different gas production areas. At Strachan, re-
ported seismic events occurred beneath the reservoir(Wetmiller 1986). However, most seismic events at Lacq oc-cur above or within the reservoir (Grasso and Wittlinger1990).
There are several observations which strongly suggest thatthe earthquakes that occurred in and around the Strachanfield were triggered by gas extraction.
(1) These seismic events occurred in an area of naturallylow seismicity, but high tectonic stresses.
© 1999 NRC Canada
Baranova et al. 61
50
40
30
20
10
00 20 40 60 80 100SvS 'v SHmin
Normal stress (MPa)
τ=
0. 6σ n
S h e a r s t r e s s ( M P a )
Fig. 18. Schematic representation of the Mohr–Coulomb failure criterion applied to the stress regime in the Strachan area before
extraction (circles formed using solid lines) and after extraction (circles formed using broken lines). The significance of this simulation
is explained in the text. S Hmax′, maximun horizontal effective stress; S v and S v′, vertical stress and effective vertical stress, respectively;
τ, sheer stress.

7/28/2019 00 Baranova Induced Seismicity Jan 1999 CJES
http://slidepdf.com/reader/full/00-baranova-induced-seismicity-jan-1999-cjes 16/18
(2) There is spatial and temporal correlation betweenearthquake occurrence and the rate of gas production.
(3) There is no apparent correlation noted between extrac-tion of oil and the number of seismic events. We speculatethat the difference in density between gas and oil can ac-count for this.
(4) There is no relationship between water injection andearthquakes for the study area.
(5) There is a linear correlation between depth of produc-tion and the number of seismic events.
(6) Application of the model developed by Segall (1985)shows that the 19 October 1996 earthquake below the D3-A
pool of the Strachan field could have been triggered by gasextraction, which also would have caused subsidence andstress changes.
(7) Changes of stress due to extraction indicate a regimethat favours reverse faulting and coincides well with the nat-ural state of stress for this area. The proposed mechanismsuggests decreasing pore pressure (vertical stress) and in-creasing normal stress so that changes of mean stresses aresmall and failure on preexisting faults can be initiated by in-creasing deviatoric stresses.
(8) As a consequence of the above, the high rate and longhistory of gas extraction can be considered as probable
causes of triggering of the recent seismicity beneath theStrachan field.
This research was supported by the Geological Survey of Canada, Calgary. We thank R.B. Horner for his helpful com-ments and suggestions, and for providing the focal-mechanism solution and seismic events database. We aremost grateful for the helpful comments and suggestions of the reviewers, Drs. J. Roest and G. Atkinson.
Adams, J., and Bell, J.S. 1991. Crustal stresses in Canada. In
Neotectonics of North America. Edited by D.B. Slemmons,
E.R. Engdahl, M.D. Zoback, and D.D. Blackwell. Geological
Society of America, The Geology of North America, Decade
Map Volume 1, pp. 367–385.
Alberta Energy and Utilities Board. 1996. Alberta reserves of
crude oil, oil sands, gas, natural gas: statistics 1965–1996. Al-
berta Energy and Utilities Board, Calgary, Alta.
Anderson, N.L., Brown, R.J., and Hinds, R.C. 1989. Low- and
high-relief Leduc formation reefs: a seismic analysis. Geophys-
ics, 54: 1410–1419.
© 1999 NRC Canada
62 Can. J. Earth Sci. Vol. 36, 1999
0
500
1000
1500
2000
2500
3000
3500
4000
4500
0 20 40 60 80 100 120 140
T r u e v e r t i c a l
d e p t h b m s l ( m )
Stress magnitude (MPa)
a p p
r o x . p
o r e p
r e s s u r e
a p p r o x . S H m i n
a p p r o x . S v
Fig. 19. Approximate pore-pressure, S Hmin, and S v gradients estimated from the hydraulic fractures in the Caroline, Ricinus, and
Strachan fields.

7/28/2019 00 Baranova Induced Seismicity Jan 1999 CJES
http://slidepdf.com/reader/full/00-baranova-induced-seismicity-jan-1999-cjes 17/18
Bell, J.S. 1996. In situ stresses in sedimentary rocks (part 2): appli-
cations of stress measurements. Geoscience Canada, 23: 135–
153.
Bell, J.S., and Gough, G.I. 1979. Northeast–southwest compressive
stress in Alberta: evidence from oil wells. Earth and Planetary
Science Letters, 45: 475–482.
Bell, M.L., and Nur, A. 1978. Strength changes due to reservoir-
induced pore pressure and stresses and application to LakeOroville. Journal of Geophysical Research, B9: 4469–4483.
Carmichael, R.S. ( Editor ). 1984. Handbook of physical properties
of rocks. Vols. I–III. CRC Press, Boca Raton, Fla.
Console, R., and Nikolaev, A. ( Editors). 1995. Earthquakes in-
duced by underground nuclear explosions. NATO ASI Series,
Partnership Sub-Series 2. Environment, 4.
Davis, D.S., and Frohlich, C. 1993. Did (or will) fluid injection
cause earthquakes? — criteria for a rational assessment. Seismo-
logical Research Letters, 64: 207–224.
Davis, S.D., Nyffenegger, P.A., and Frohlich, C. 1995. The 9 April
1993 earthquake in South-Central Texas: was it induced by fluid
withdrawal? Bulletin of the Seismological Society of America,
85: 1888–1895.
Gendzwill, D.J., Horner, R.B., and Hasegawa, H.S. 1982. Induced
earthquakes at a potash mine near Saskatoon, Canada. Canadian
Journal of Earth Sciences, 19: 466–475.
Gough, D.I. 1970. Load-induced earthquakes at Lake Kariba — II.
Geophysical Journal of the Royal Astronomical Society, 21: 79–
101.
Gough, D.I. 1978. Induced seismicity. In Assessment and mitiga-
tion of earthquake risk. Proceedings of intergovernmental con-
ference on the assessment of earthquake risk. UNESCO, Paris,
pp. 91–117.
Grasso, J.R. 1992. Mechanics of seismic instabilities induced by
the recovery of hydrocarbons. Pure and Applied Geophysics,
139: 507–534.
Grasso, J.R., and Wittlinger, G. 1990. Ten years of seismic moni-
toring over a gas field. Bulletin of the Seismological Society of
America, 80: 450–473.
Gupta, H., and Rastogi, B. 1979. Dams and earthquakes. MIR,
Moscow. (In Russian.)
Healy, J.H., Rubey, W.W., Griggs, D.T., and Raleigh, C.B. 1968.
The Denver earthquakes. Science (Washington, D.C.), 161:
1301–1310.
Horner, R.B., and Hasegawa, H.S. 1978. The seismotectonics of
southern Saskatchewan. Canadian Journal of Earth Sciences, 15:
1341–1355.
Horner, R.B., Barclay, J.E., and MacRae, J.M. 1994. Earthquakes
and hydrocarbon production in the Fort St. John area of north-
eastern British Columbis. Canadian Journal of Exploration Geo-
physics, 30: 39–50.
Hsien, P.A., and Bredehoeft, J.D. 1981. A reservoir analysis of the
Denver earthquake: a case of induced seismicity. Journal of Geophysical Research, 86(B2): 903–920.
Kisslinger, C. 1976. A review of theories of mechanisms of in-
duced seismicity. Engineering Geology, 10: 85–98.
Knoll, P. ( Editor ). 1992. Induced seismicity. A.A. Balkema Pub-
lishers, Old Post Road, Brookfield, Vt.
Leckie, D.A., Smith, D.G. 1992. Regional setting, evolution, and
depositional cycles of the Western Canada Foreland Basin. In
Foreland basins and fold belts. American Association of Petro-
leum Geologists (AAPG), Memoir 55, Chapt. 1, pp. 9–46.
Maury, V.M.R., Grasso, J.R., and Wittlinger, G. 1992. Monitoring
of subsidence and induced seismicity in the Lacq gas field
(France): the consequences on gas production and field opera-
tion. Engineering Geology, 32: 123–135.
McCain, W.D., Jr. 1973. The properties of petroleum fluids. Petro-
leum Publication Co., Tulsa, Okla.
McGarr, A., Spottiswoode, S.M., and Gay, N.C. 1975. Relationship
of mine tremors to induced stresses and to rock properties in the
focal region. Bulletin of the Seismological Society of America,
65: 981–993.
McLellan, P.J. 1989. In-situ stress magnitudes from hydraulic frac-
turing treatment records: a feasibility study. Geological Survey
of Canada, Open File 1947.
Milne, W.G. 1970. The Snipe Lake, Alberta, earthquake of March
8, 1970. Canadian Journal of Earth Sciences, 6: 1564–1567.
Milne, W.G., and Berry, M.J. 1976. Induced seismicity in Canada.
Engineering Geology, 10: 219–226.
Mossop, G., and Shetsen, I. (Compilers). 1994. Geological atlas of
the Western Canada Sedimentary Basin. Canadian Society of
Petroleum Geologists and Alberta Research Council, Edmonton,
Alta.
Plotnikova, L.M., Flynova, M.G., and Machmudova, V.I. 1989. In-
duced seismicity in gas field region. In Proceedings of the 15th
International Association of Seismology and Physics of the
Earth Interior General Assembly, Istanbul, August 1989, pp. 31–32.
Pomeroy, P.W., Simpson, D.W., and Sbar, M.L. 1976. Earthquakes
triggered by surface quarrying — the Wappinger Falls, New
York, sequence of June 1974. Bulletin of the Seismological So-
ciety of America, 66: 685–700.
Raleigh, C.B., Healy, J.H., Bohn, J., and Bredehoeft, J. 1972.
Earthquakes and water flooding in Rangely oil field. Earthquake
Notes, 41: 20–29.
Rebollar, C.J., Kanasewich, E.R., and Nyland, E. 1982. Source pa-
rameters from shallow events in the Rocky Mountain House
earthquake swarm. Canadian Journal Earth Sciences, 19: 907–
918.
Rebollar, C.J., Kanasewich, E.R., and Nyland, E. 1984. Focal
depth and source parameters of the Rocky Mountain Houseearthquake swarm from digital data at Edmonton. Canadian
Journal of Earth Sciences, 21: 1105–1113.
Rice, J.R., and Cleary, M.P. 1976. Some basic stress diffusion solu-
tion for fluid saturated elastic porous media with compressible
constituents. Reviews of Geophysics and Space Physics, 14:
227–241.
Rogers, G.C., and Horner, R.B. 1991. An overview of western Ca-
nadian seismicity. In Neotectonics of North America. Edited by
D.B. Slemmons, E.R. Engdahl, M.D. Zoback, and D.D.
Blackwell. Geological Society of America, The Geology of
North America, Decade Map Volume 1, pp. 69–76.
Rose, M.L. ( Editor ). 1990. The Canadian Society of Petroleum Ge-
ologists oil and gas pools of Canada. Series 1, The Canadian So-
ciety of Petroleum Geologists, Calgary, Alta.
Segall, P. 1985. Stress and subsidence resulting from subsurface
fluid withdrawal in the epicentral region of the 1983 Coalinga
earthquake. Journal of Geophysical Research, B9: 6801–6816.
Segall, P. 1989. Earthquakes triggered by fluid extraction. Geology,
17: 942–946.
Simpson, D.W. 1986. Triggered earthquakes. Annual Review of
Earth and Planetary Sciences, 14: 21–42.
Slider, H.C. 1976. Petroleum reservoir engineering methods. Petro-
leum Publishing Company, Tulsa, Okla.
Smirnova, M.N., Navitskaya, N.A., and Shebalin, N.V. 1975.
Earthquake swarm caused by intensive exploitation of an oil
field. In Proceedings of the 8th International Association of
© 1999 NRC Canada
Baranova et al. 63

7/28/2019 00 Baranova Induced Seismicity Jan 1999 CJES
http://slidepdf.com/reader/full/00-baranova-induced-seismicity-jan-1999-cjes 18/18
Seismology and Physics of the Earth Interior General Assembly,
Moscow, International Union of Geodesy and Geophysics, Ab-
stracts, p. 39.
Smith, R.B., and Arabasz, W.J. 1991. Seismicity of the
Intermountain Seismic Belt. In Neotectonics of North America.
Edited by D.B. Slemmons, E.R. Engdahl, M.D. Zoback, and
D.D. Blackwell. Geological Society of America, The Geology
of North America, Decade Map Volume 1.
Vanicek, P., and Nagy, D. 1980. Report on the compilation of the
map of vertical crustal movements in Canada. Geodynamics
Service of Canada, Earth Physics Branch, Open File Report 80-
2.
Wetmiller, R.J. 1986. Earthquakes near Rocky Mountain House,
Alberta, and their relationship to gas production facilities. Cana-
dian Journal of Earth Sciences, 23: 172–181.
Yerkes, R.F., and Castle, R.O. 1976. Seismicity and faulting attrib-
utable to fluid extraction. Engineering Geology, 10: 151–167.
64 Can. J. Earth Sci. Vol. 36, 1999