
Analysis of Outpatient Attendance in Thames Valley - hcaf.biz Demand/Benchmark... · Outpatient...
24
Supporting your commitment to excellence Outpatient First Attendance in Thames Valley Links between deprivation, ethnicity, students, system thresholds and higher NHS usage Dr Rod Jones Statistical Advisor Healthcare Analysis & Forecasting www.hcaf.biz
-
Upload
trinhtuyen -
Category
Documents
-
view
218 -
download
1
Transcript of Analysis of Outpatient Attendance in Thames Valley - hcaf.biz Demand/Benchmark... · Outpatient...
Supporting your commitment to excellence
Outpatient First Attendance
in Thames Valley
Links between deprivation, ethnicity, students, system thresholds and higher NHS usage
Dr Rod Jones
Statistical Advisor Healthcare Analysis & Forecasting
www.hcaf.biz
Dr Rod Jones (Statistical Advisor), mobile 07890 640399 2 of 24
Final version - October 2006
Table of Contents
Table of Contents ................................................................................................... 2
Aims ......................................................................................................................... 3
Executive Summary................................................................................................ 4
Key Points ............................................................................................................... 6
First attendance .................................................................................................. 6
System Thresholds for First attendance........................................................... 6
Wider Applications .............................................................................................. 6
Specialty Overlaps & Data Quality Issues............................................................ 7
Role of Deprivation, Ethnicity, Students and other Population Factors............. 7
Deprivation (IMD)................................................................................................ 7
Role of Private Healthcare Usage ....................................................................10
Role of Ethnicity .................................................................................................10
Effect of Students...............................................................................................11
System Thresholds for First Attendance/Counting.............................................12
Examples of High Variance ..................................................................................13
Potential to Reduce Volume of First Attendance................................................13
Conclusions ............................................................................................................16
Appendix One: Methodology ................................................................................17
National Average Rates of First attendance ...................................................17
Population Data at Lower Super Output Area (LSOA) Level ........................17
Specialty Groups................................................................................................17
Index of Multiple Deprivation ............................................................................17
Ethnicity ..............................................................................................................17
Full Time Students .............................................................................................17
First attendances ...............................................................................................18
LSOA-based First attendance Rate Relative to the Expected Average .......18
Allocation of LSOA to Trust/Site Catchment Areas ........................................18
Trust/Site Thresholds for First attendance ......................................................18
GP Referral and First attendance Thresholds ................................................18
Modelling of the effects of IMD, Ethnicity, Students and Site Thresholds....19
Appendix Two: Top 150 LSOA in Thames Valley Where First Attendance Avoidance Schemes May Yield the Greatest Return .........................................20
Appendix Three: Site thresholds for volume of first attendance relative to the Thames Valley average. .......................................................................................23

Dr Rod Jones (Statistical Advisor), mobile 07890 640399 3 of 24
Final version - October 2006
Aims
• To establish the fundamental population characteristics leading to demand for outpatient first attendance
• To demonstrate that particular areas have above average levels of first attendance
• To show that specialty boundaries vary between locations
• To show that the counting of ‘other’ (as opposed to GP-referred) first attendances varies considerably between acute sites
Dr Rod Jones (Statistical Advisor), mobile 07890 640399 4 of 24
Final version - October 2006
Executive Summary This work analyses the results from 2.13 million head of population (576,000 first outpatient attendances per annum in 2005/06) at lower super output area level (LSOA)1 covering all extremes of age profile, deprivation, ethnic composition (Asian & Black) and students in full-time education2 found across Thames Valley using outpatient first attendance data for the three years 2003/04, 2004/05 and 2005/06 with volumes normalised to 2005/06 out-turn. First attendance was split into patients referred by a GP and into ‘other’ referrals (i.e. Optometrist, Dentist, Nurse, consultant in another specialty, via A&E, Self-referred, etc). The results mirrored the conclusions of a separate study which demonstrated that low outpatient to inpatient conversion rates in the surgical specialties were a feature of particular GP surgeries and also wider locations. This work confirms that the low conversion rates for the surgical specialties are principally due to excess first attendance, i.e. first attendance which does not lead to a surgical intervention. A role for indiscriminate high referral across all specialties (not just the surgical specialties) by particular GP practices is implicated.
The key finding of this work is that location specific thresholds for referral and to a lesser extent the counting of a ‘first attendance’ at particular acute sites drive the overall volume of first attendances more so than the characteristics of the population. The existence of these catchment area thresholds reflects aspects of the surrounding primary care behaviour. A reduction in overall volume of first attendances will focus on GP referral triage backed by a review of data standards at acute sites.
A relationship between deprivation and increased outpatient first attendance is confirmed. However, the rate of increase with IMD is generally lower than for emergency admission but higher than for elective admission. Refer to the related document covering emergency admission for a wider discussion of the model. Appendix One gives specific details relevant to outpatient first attendance. Students in full-time education are characterised by considerably lower levels of first attendance in all specialties except Dermatology (no effect) or mental health (slightly higher). Ethnicity (Asian or Black) has variable effects on first attendance depending on the specialty. The variable nature of the response to ethnicity is broadly consistent with known disease prevalence and appears to disprove any form of discrimination based on ethnic origin. There does not appear to be a relationship between distance to the acute site and the relative volume of first attendance (as seen for emergency admission). Areas of high disposable income most likely to benefit from usage of the private health sector do not appear to have lower than expected levels of NHS first attendance. Even after adjusting for population characteristics likely to affect demand for healthcare the volume of first attendances or what is counted as a ‘first attendance’ varies considerably3. These differences appear to influence the disproportionate
1 A LSOA contains around 1,000 to 3,000 head of population. LSOA nest together into electoral wards.
2 Students in full time education aged 16 and over.
3 For example the same haematology care can be labelled and therefore counted as ‘emergency’, ‘day
case’, ‘outpatient attendance’ or ‘regular day attendance’ depending on how different hospitals choose
Dr Rod Jones (Statistical Advisor), mobile 07890 640399 5 of 24
Final version - October 2006
financial pressures experienced by PCTs. In particular the counting of ‘other’ first attendance appears to have considerable variation indicating the possibility of inconsistent data standards between acute sites. In this study the 12 acute hospital sites (both within and outside of TV) providing care to the residents of TV is used to define an acute site catchment area4. Each output area was allocated to a location using straight line distance5. Each acute site at the centre of a location does not provide a full range of services, however, it is illustrative to see how relative rates of first attendance vary between different locations, e.g. supply induced demand. The implications to Practice Based Commissioning (PBC) and the development of a small area capitation formula are discussed. The need for suitable adjustment to account for the effect of students (very low levels of first attendance) and different ethnic groups are highlighted. The outputs of this model have been used to calculate specialty benchmarks for all TV PCTs. These benchmarks allow a PCT to identify which specialties are accounting for the highest volume of ‘excess to funded levels’ of outpatient first attendance activity and in particular identify those LSOA (i.e. GP practices) where the excess is concentrated.
to interpret the NHS Data Definitions – which in some cases is dictated by the limitations of PAS
systems. By implication the same unit of care can be charged at 4 different prices. 4 The 12 acute sites are as follows: Frimley Park, Heatherwood, Hillingdon, Horton, Milton Keynes,
Northampton, Oxford (ORH/NOC), Royal Berkshire, Stoke Mandeville, Swindon, Wexham Park,
Wycombe. 5 This method assumes that the bulk of the population would normally go to the nearest acute site for
outpatient care. Around 5% of first attendances are to more specialist hospitals; however, for the
purpose of establishing good correlations the approximation is fit for purpose.

Dr Rod Jones (Statistical Advisor), mobile 07890 640399 6 of 24
Final version - October 2006
Key Points First attendance
• For all specialties the first attendance rates increase with the Index of Multiple Deprivation (IMD)6, i.e. areas of highest deprivation have highest levels of first attendance.
• Only a few specialties show increased levels of first attendance due to % ethnic population.
• In areas with a high proportion of ‘students’ the rate of first attendance is significantly reduced
System Thresholds for First attendance
• Unless first attendance rates are adjusted for system thresholds the true underlying value of the relationship with IMD cannot be characterised
• System thresholds for the counting of ‘Other’ first attendance vary considerably
Wider Applications
• Areas of highest IMD are most likely to gain greatest benefit from the input of first attendance avoidance programmes, i.e. peer review of GP referral
• There are implications to the development of a small area formula suited to the needs of practice based commissioning
6 See Appendix One for a wider discussion on the Index of Multiple Deprivation

Dr Rod Jones (Statistical Advisor), mobile 07890 640399 7 of 24
Final version - October 2006
Specialty Overlaps & Data Quality Issues Throughout this report reference is made to several composite specialty groups where there is considerable overlap in assigning a patient to a specific specialty. These overlaps were identified by combining the data from the two specialties and observing if the sum of residuals (the difference between the value predicted by the model and the actual number of first attendances) was significantly reduced. Considerable overlap was observed between Plastic Surgery (£130)7 & Dermatology (£115), between Gynaecology (£135) & Obstetrics (£154), between the Medical group of specialties (£161 to £260) and between Orthopaedics (£144), Neurosurgery, Plastic Surgery (£130), and Anaesthetics (£187). There is also some overlap between General Surgery (£151) and Urology (£157). The recommendation is that these groups be used for PBC activity reporting rather than the separate specialties. The observed overlap between Obstetrics and Gynaecology was of too great a magnitude to encompass the small area of ambiguity between the two specialties, i.e. by convention at 13 weeks pregnancy a woman is treated under the heading of ‘Obstetrics’. The extreme variability between hospital sites indicates that data standards are not being consistently applied. There is the potential for financial advantage (£19 per first attendance) to those sites who count significantly more attendances (typically double the volume elsewhere) as Obstetrics (Horton & Oxford Radcliff, Heatherwood, Swindon and Ashford). The SHA and PCTs are advised to take urgent action to correct this situation. The final issue of data quality lies in Milton Keynes where the PCT recently adjusted its LDP following an independent count of GP referral volumes conducted via its Referral Hub. The values were some 20,000 higher than via the Trust reported Minimum Data Set (MDS). It is of interest to note that only in Milton Keynes is there a consistent bias in the counting of ‘Other’ referrals which are on average 11% higher than in other locations. This gap is greatest in the Medical Group of specialties (70% higher than the TV average).
Role of Deprivation, Ethnicity, Students and other Population Factors Due to the relationship between IMD, ethnicity, students and level of private health usage and first attendance rate it is impossible to answer questions regarding first attendance rates without first adjusting for the effect of these factors on the relative use of services. Comparison in all figures and tables is always against the age adjusted average, i.e. after adjusting for the effects of age how many first attendances would be expected in each LSOA.
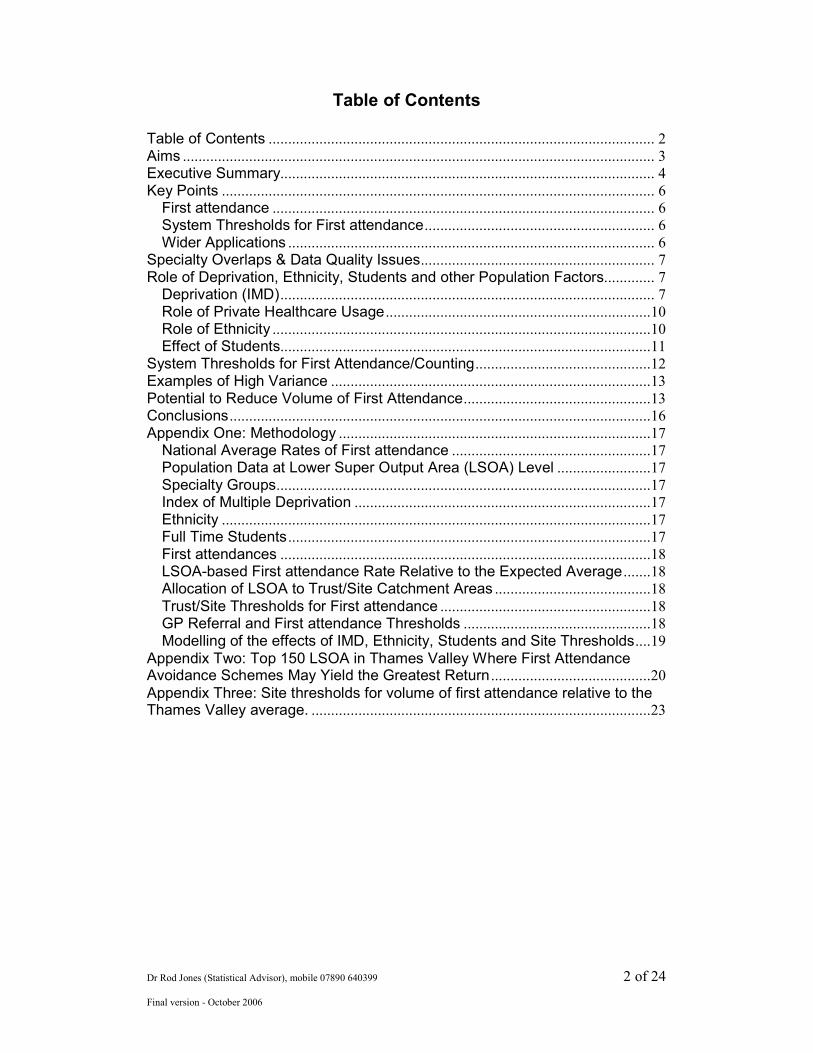
Deprivation (IMD) Figure One demonstrates the relationship between the relative volume of first attendance and IMD.
7 The 06/07 PbR tariff for outpatient first attendance is given in brackets
Dr Rod Jones (Statistical Advisor), mobile 07890 640399 8 of 24
Final version - October 2006
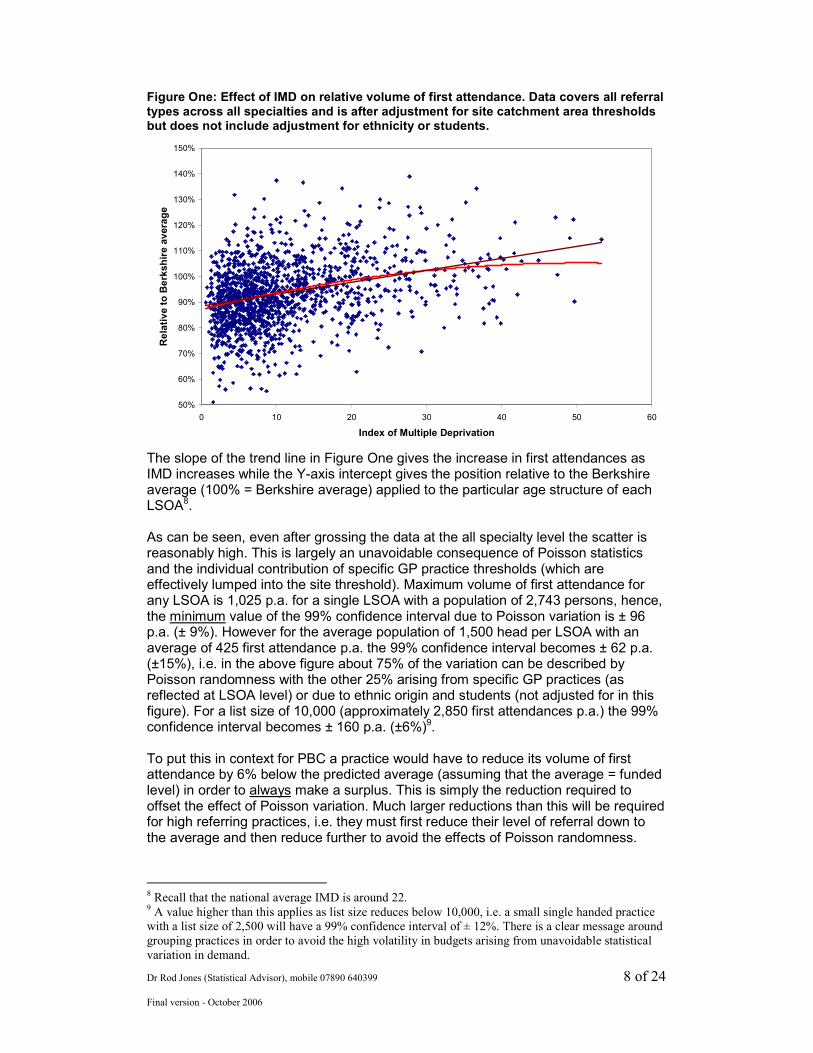
Figure One: Effect of IMD on relative volume of first attendance. Data covers all referral types across all specialties and is after adjustment for site catchment area thresholds but does not include adjustment for ethnicity or students.
50%
60%
70%
80%
90%
100%
110%
120%
130%
140%
150%
0 10 20 30 40 50 60
Index of Multiple Deprivation
Relative to Berkshire average
The slope of the trend line in Figure One gives the increase in first attendances as IMD increases while the Y-axis intercept gives the position relative to the Berkshire average (100% = Berkshire average) applied to the particular age structure of each LSOA8. As can be seen, even after grossing the data at the all specialty level the scatter is reasonably high. This is largely an unavoidable consequence of Poisson statistics and the individual contribution of specific GP practice thresholds (which are effectively lumped into the site threshold). Maximum volume of first attendance for any LSOA is 1,025 p.a. for a single LSOA with a population of 2,743 persons, hence, the minimum value of the 99% confidence interval due to Poisson variation is ± 96 p.a. (± 9%). However for the average population of 1,500 head per LSOA with an average of 425 first attendance p.a. the 99% confidence interval becomes ± 62 p.a. (±15%), i.e. in the above figure about 75% of the variation can be described by Poisson randomness with the other 25% arising from specific GP practices (as reflected at LSOA level) or due to ethnic origin and students (not adjusted for in this figure). For a list size of 10,000 (approximately 2,850 first attendances p.a.) the 99% confidence interval becomes ± 160 p.a. (±6%)9. To put this in context for PBC a practice would have to reduce its volume of first attendance by 6% below the predicted average (assuming that the average = funded level) in order to always make a surplus. This is simply the reduction required to offset the effect of Poisson variation. Much larger reductions than this will be required for high referring practices, i.e. they must first reduce their level of referral down to the average and then reduce further to avoid the effects of Poisson randomness.
8 Recall that the national average IMD is around 22. 9 A value higher than this applies as list size reduces below 10,000, i.e. a small single handed practice
with a list size of 2,500 will have a 99% confidence interval of ± 12%. There is a clear message around
grouping practices in order to avoid the high volatility in budgets arising from unavoidable statistical
variation in demand.
Dr Rod Jones (Statistical Advisor), mobile 07890 640399 9 of 24
Final version - October 2006
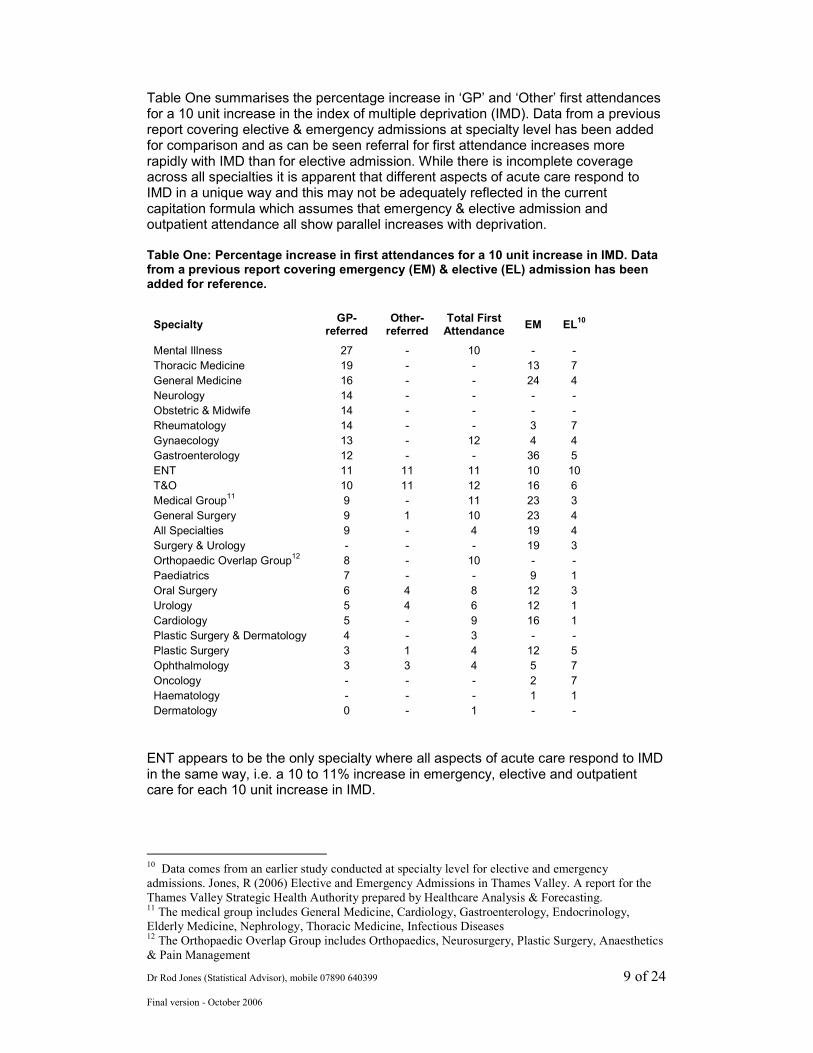
Table One summarises the percentage increase in ‘GP’ and ‘Other’ first attendances for a 10 unit increase in the index of multiple deprivation (IMD). Data from a previous report covering elective & emergency admissions at specialty level has been added for comparison and as can be seen referral for first attendance increases more rapidly with IMD than for elective admission. While there is incomplete coverage across all specialties it is apparent that different aspects of acute care respond to IMD in a unique way and this may not be adequately reflected in the current capitation formula which assumes that emergency & elective admission and outpatient attendance all show parallel increases with deprivation. Table One: Percentage increase in first attendances for a 10 unit increase in IMD. Data from a previous report covering emergency (EM) & elective (EL) admission has been added for reference.
Specialty GP-
referred Other- referred
Total First Attendance
EM EL10
Mental Illness 27 - 10 - -
Thoracic Medicine 19 - - 13 7
General Medicine 16 - - 24 4
Neurology 14 - - - -
Obstetric & Midwife 14 - - - -
Rheumatology 14 - - 3 7
Gynaecology 13 - 12 4 4
Gastroenterology 12 - - 36 5
ENT 11 11 11 10 10
T&O 10 11 12 16 6
Medical Group11 9 - 11 23 3
General Surgery 9 1 10 23 4
All Specialties 9 - 4 19 4
Surgery & Urology - - - 19 3
Orthopaedic Overlap Group12 8 - 10 - -
Paediatrics 7 - - 9 1
Oral Surgery 6 4 8 12 3
Urology 5 4 6 12 1
Cardiology 5 - 9 16 1
Plastic Surgery & Dermatology 4 - 3 - -
Plastic Surgery 3 1 4 12 5
Ophthalmology 3 3 4 5 7
Oncology - - - 2 7
Haematology - - - 1 1
Dermatology 0 - 1 - -
ENT appears to be the only specialty where all aspects of acute care respond to IMD in the same way, i.e. a 10 to 11% increase in emergency, elective and outpatient care for each 10 unit increase in IMD.
10
Data comes from an earlier study conducted at specialty level for elective and emergency
admissions. Jones, R (2006) Elective and Emergency Admissions in Thames Valley. A report for the
Thames Valley Strategic Health Authority prepared by Healthcare Analysis & Forecasting. 11
The medical group includes General Medicine, Cardiology, Gastroenterology, Endocrinology,
Elderly Medicine, Nephrology, Thoracic Medicine, Infectious Diseases 12
The Orthopaedic Overlap Group includes Orthopaedics, Neurosurgery, Plastic Surgery, Anaesthetics
& Pain Management
Dr Rod Jones (Statistical Advisor), mobile 07890 640399 10 of 24
Final version - October 2006
The increase in first attendance with increasing IMD creates the situation where the 14% of the population living in areas with an IMD >20 account for up to 26% of first attendances (see Appendix Two for the top 150 LSOA). These findings are consistent with the known evidence for health inequalities13 and the secondary effects of smoking on health. Note the differing sensitivity at Specialty level of GP and Other first attendance to IMD. This difference partly explains why the ratio of GP to Other first attendances is different in the same specialty from one PCT to another and why the relative volumes between specialties are different from one PCT to another.
Role of Private Healthcare Usage Summing the residuals (i.e. the difference between actual and expected) across the surgical specialties enables the identification of those areas which have consistently higher or lower NHS usage. This will partly reflect the influence of private health usage in certain areas and high GP referral in other areas. Investigation of those SOA with very low first attendances to the NHS (i.e. a residual greater than -20% in Figure One) shows that they are mainly clustered in Wycombe & South Buckinghamshire. Using the web tool www.upmystreet.com such areas appear to correlate with high disposable income and are typically Acorn classification Type 1 to 4 which are know to have ‘high’ levels of private health cover, i.e. approximate 60% above national average levels of private medical insurance leads to an average -40% residual (against the Berkshire average). This lower usage of elective NHS surgery is partly compensated for by areas of higher usage in areas with IMD values between 0 and 20. This is perhaps a reflection of the referral habits of individual GPs. In this respect three of the LSOA with very high first attendance rates are all from Slough in the adjacent areas of Haymill & Britwell. In conclusion, while NHS utilisation in the surgical group of specialties is on average 10% lower for IMD < 11 there are particular Acorn Classification types that exhibit very low NHS usage. The referral behaviour of particular GP practices is also seen to play a role. The implication of both these statements to PBC is obvious. In terms of PBC a specific adjustment is needed to correctly account for the effects of private health care usage. Other than resorting to tools such as the Acorn classification the best factor upon which to rely would appear to be the historic levels of low first attendance seen in specific LSOA.
Role of Ethnicity Different ethnic groups are known to have a disposition to particular conditions and diseases. These effects are summarised in Table two where the magnitude of the change in volume of first attendance associated with a 10 percentage point increase in ethnic population is given for each specialty.
13
Raleigh,V.S. & Polato,G.M. (2004) Evidence of health inequalities. Healthcare Commission Strategy
Document.
Dr Rod Jones (Statistical Advisor), mobile 07890 640399 11 of 24
Final version - October 2006
Table Two: Effect of ethnic origin and full-time students on the volume of first outpatient attendance. Values in the table show the effect of a 10 percentage point increase in ethnic type or the age adjusted proportion of students.
GP-referred First Attendance All First Attendance (GP + Other)
Specialty Volume (1,000’s) Asian Black
14 Student
Volume (1,000’s) Asian Black Student
All Specilaties 1,433 2% 1% -8% 2,655 1% -1% -7%
Orthopaedic Overlap 227 -1% -1% -6% 427 -1% 1% -8%
Medical Group 190 4% 9% -8% 343 4% 10% -6%
T&O 151 0% 0% -9% 298 -1% 0% -8%
Ophthalmology 133 6% 11% -6% 275 5% 2% -2%
Mental Illness 40 -3% 7% 10% 251 -1% -2% -1%
General Surgery 154 0% 4% -9% 209 0% 4% -10% Plastic Surgery & Dermatology 154 0% -2% -2% 206 -1% -2% -1%
ENT 100 1% 11% -4% 151 1% 9% -5%
Cardiology 76 5% 9% -7% 143 5% 6% -9%
Gynaecology 101 3% 0% -11% 138 2% 0% -9%
Dermatology 90 1% 8% 0% 111 1% 7% -1%
Oral Surgery 21 4% -2% -13% 100 2% 4% -10%
Obstetric & Midwife 87 6% 0% -15% 189
Plastic Surgery 64 0% -8% -7% 96 -1% -6% -5%
Urology 59 1% 4% -4% 82 1% 3% -4%
General Medicine 46 4% 8% -10% 91
Paediatrics 49 3% 2% -17% 88
Neurology 44 2% -3% -7% 71
Rheumatology 29 1% 14% -7% 46
Gastroenterology 30 1% 8% -6% 43
Thoracic Medicine 18 4% 4% -10% 37
As can be seen the different ethnic types have a unique pattern of demand for each specialty. The existence of any form of racial discrimination can be ruled out by virtue of the fact that each racial group has both +ve and –ve coefficients over a range of specialties.
Effect of Students Some 90% of LSOA have less than10% students15 and only 4% of LSOA have >20% students. The maximum population of full-time students is 83% & 69% respectively for the two LSOA situated in the ward of Carfax in Oxford. There is evidence that a high proportion of students are able to skew the calculation of fundamental population characteristics such as life expectancy. For example, the Ward of Carfax in Oxford (highest proportion of students in TV) has the 4th lowest average life expectancy at birth in the SE of England16 - clearly the presence of large numbers of students is acting to distort the calculation of this otherwise fundamental population characteristic.
14
Note that the confidence interval associated with Black ethnic type is much higher than for Asian.
See report covering emergency admission for a more complete discussion. 15
Students in full-time education aged 16 or above 16
Eayres,D.P & Williams,ES. Evaluation of methodologies for small area life expectancy estimation –
note that the very low life expectancy may itself be an artefact of the high proportion of students in this
ward.
Dr Rod Jones (Statistical Advisor), mobile 07890 640399 12 of 24
Final version - October 2006
Another interesting comment is that students may not have health needs reflective of the IMD for the area in which they reside during term time. Most students come from relatively affluent socio-economic parent groups and may therefore be better approximated by a more ‘affluent’ IMD value. The impact of students on the overall first attendance rate for each specialty was assessed by first calculating the age adjusted expected percentage of first attendances due to students (assuming that their attendance rate was at the age adjusted average). For whatever reason it is apparent from Table Two that students do have a lower rate of first attendance than the non-student population. Mental Illness and Dermatology are the only exceptions to an otherwise negative effect due to students. Such effect will have a material effect on the funding allocated for outpatient attendance within PBC budgets, in particular for the University practices.
System Thresholds for First Attendance/Counting The fact that there is large variation in healthcare structure & practice and in GP referral behaviour is widely known and implies those system-wide thresholds to first attendance or the counting of a ‘first attendance’ should be different. The usual approach to identify a healthcare system is to use a PCT or local authority boundary, however, such boundaries do not reflect the usual flows of patients to the nearest acute hospital site. In this study each LSOA has been assigned to sit in the catchment area of the nearest acute hospital site using straight line distance17. Hence in Tables Four & Five the Frimley healthcare system is that group of LSOA which would normally travel to Frimley Park hospital to receive their outpatient care. This is an alternative way of identifying population groups in relation to acute care. This acts to simplify an otherwise exceedingly complex analytical problem. In this study a system threshold of 100% represents the TV average while a threshold of 120% implies 20% more first attendances (or events counted as a ‘first attendance’) than the TV average after adjusting for the effects of age, IMD, ethnicity and full-time students – the effect of which are covered in the following section. Interpreting differences in thresholds between acute sites is not a straightforward matter since the threshold can reflect one or more of the following:
• The specialty overlaps particular to that site, i.e. at one site more Urology type work may be conducted by General Surgeons than at another site, etc.
• The higher or lower referral behaviour of the surrounding GP’s, i.e. in the area surrounding one site diabetes, etc may be treated to a greater extent in a primary care setting.
• Other data quality issues such as follow-up appointments following an emergency or elective admission counted as a first attendance or GP referrals misallocated to ‘other’ referrals.
• Capacity issues particular to 2005/06. For example, higher levels of first attendance at one site to meet waiting time targets or capacity differences due to rationalisation of services between sites.
17 Experience shows that there are only minor differences between the use of travel times and linear
distance, i.e. the acute site catchment areas are relatively stable. Whatever the method there will always
be ambiguity for those LSOA which are almost equidistant between two sites, however, since over
50% of a site catchment population live within only 5 km of the site such distant LSOA make little
impact on the analysis.
Dr Rod Jones (Statistical Advisor), mobile 07890 640399 13 of 24
Final version - October 2006
• Lower rates in other areas may signify particular endoscopy, laparoscopy, cystoscopy, lithotripsy, etc procedures which by-pass a first outpatient attendance and are first seen as a ‘day case’ procedure.
As such a higher threshold at one site should not be interpreted as direct evidence for ‘excess’ referral but signifies a need to investigate the root causes. Adjustment for the effect of system thresholds is vitally important to establishing the correct sensitivity to the effects of IMD, ethnicity and students. The value of the coefficients can be skewed if the effects of system thresholds are ignored. This observation has implications to the national capitation formula where no adjustment has been made for system thresholds and hence implies that the funding allocations may be subject to bias. For example, a population with an IMD of 20 and with 20% ethnic population would receive a Urology budget of 85% of the national average after adjusting for the effect of thresholds but would only be given 73% of national average if the confounding effect of the thresholds were ignored. There is the potential for extreme bias since what appear to be small changes in the individual coefficients translate into large changes in the calculated output. Thresholds for the various acute sites are given in Appendix Three. Note that thresholds vary at different sites for the same acute trust (i.e. Horton vs ORH, Heatherwood vs Wexham Park) and that there is considerable variation between sites even at total first attendance across all specialties which implies that some sites may have been counting in a different way to others, i.e. nurse led clinics, ward attenders, etc. PCTs and PBR leads need to be aware that there is a basic inconsistency in the way outpatient attendances are counted and that this will have a material effect on financial pressures.
Examples of High Variance
• High levels of Plastic Surgery first attendance appear to cluster around Stoke Mandeville and Wexham Park hospitals but not around the ORH. All have specialist Plastic Surgery departments. This raises the question – where do all the equivalent first attendances go in other locations?
• The locations (most notably Milton Keynes) showing high Medical first attendances require investigation given the effect on the cost born by the PCT.
• Other examples of significant variation in first attendance/counting are in ENT (HWWP), Ophthalmology (ORH/Horton), Paediatrics (RBBH, Horton, Wycombe), Oncology (ORH/Horton), Rheumatology (ORH), Oral Surgery (ORH/Horton), Haematology (ORH).
Potential to Reduce Volume of First Attendance Table Three details the potential to reduce the volume of first attendance across all specialties for the combined GP & Other referrals. This total includes excess GP referral and any additional excess due to the potentially variable data standards applied at various acute sites. As can be seen the excess is located in particular areas (parts of Oxfordshire, Milton Keynes, Berkshire East, South Bucks & Aylesbury Vale) and the sub-total of these areas gives a potential saving
Dr Rod Jones (Statistical Advisor), mobile 07890 640399 14 of 24
Final version - October 2006
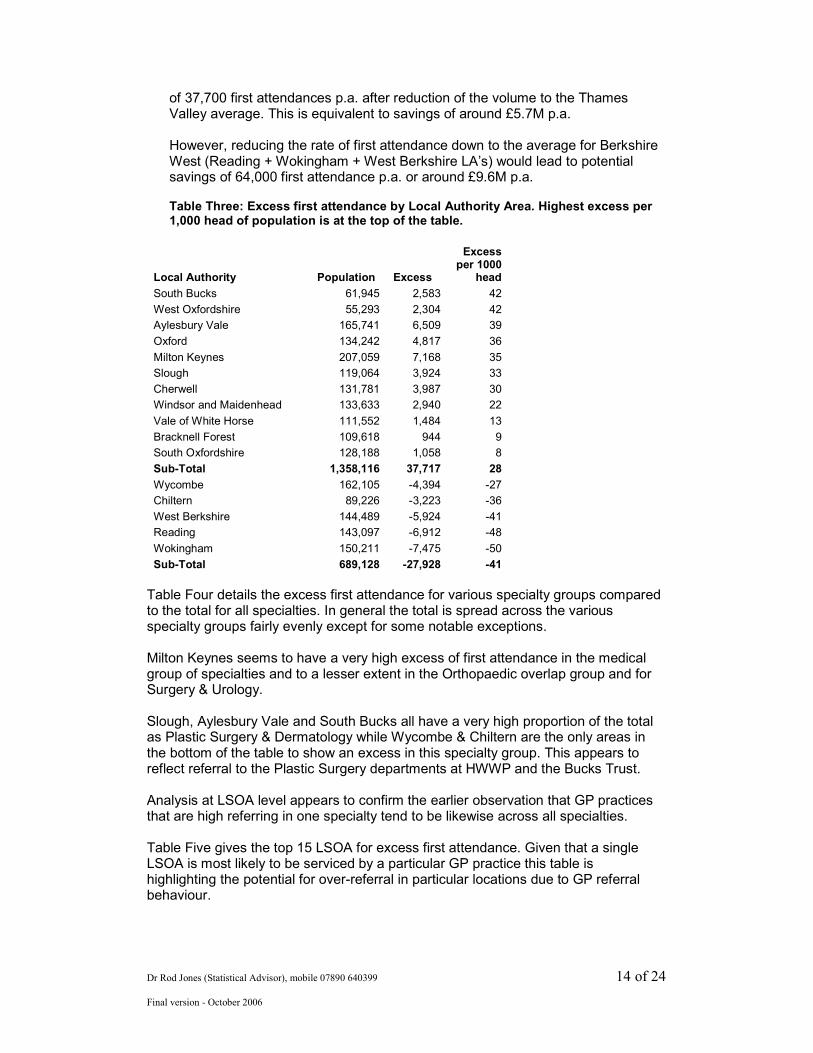
of 37,700 first attendances p.a. after reduction of the volume to the Thames Valley average. This is equivalent to savings of around £5.7M p.a. However, reducing the rate of first attendance down to the average for Berkshire West (Reading + Wokingham + West Berkshire LA’s) would lead to potential savings of 64,000 first attendance p.a. or around £9.6M p.a. Table Three: Excess first attendance by Local Authority Area. Highest excess per 1,000 head of population is at the top of the table.
Local Authority Population Excess
Excess per 1000
head
South Bucks 61,945 2,583 42
West Oxfordshire 55,293 2,304 42
Aylesbury Vale 165,741 6,509 39
Oxford 134,242 4,817 36
Milton Keynes 207,059 7,168 35
Slough 119,064 3,924 33
Cherwell 131,781 3,987 30
Windsor and Maidenhead 133,633 2,940 22
Vale of White Horse 111,552 1,484 13
Bracknell Forest 109,618 944 9
South Oxfordshire 128,188 1,058 8
Sub-Total 1,358,116 37,717 28
Wycombe 162,105 -4,394 -27
Chiltern 89,226 -3,223 -36
West Berkshire 144,489 -5,924 -41
Reading 143,097 -6,912 -48
Wokingham 150,211 -7,475 -50
Sub-Total 689,128 -27,928 -41
Table Four details the excess first attendance for various specialty groups compared to the total for all specialties. In general the total is spread across the various specialty groups fairly evenly except for some notable exceptions. Milton Keynes seems to have a very high excess of first attendance in the medical group of specialties and to a lesser extent in the Orthopaedic overlap group and for Surgery & Urology. Slough, Aylesbury Vale and South Bucks all have a very high proportion of the total as Plastic Surgery & Dermatology while Wycombe & Chiltern are the only areas in the bottom of the table to show an excess in this specialty group. This appears to reflect referral to the Plastic Surgery departments at HWWP and the Bucks Trust. Analysis at LSOA level appears to confirm the earlier observation that GP practices that are high referring in one specialty tend to be likewise across all specialties. Table Five gives the top 15 LSOA for excess first attendance. Given that a single LSOA is most likely to be serviced by a particular GP practice this table is highlighting the potential for over-referral in particular locations due to GP referral behaviour.
Dr Rod Jones (Statistical Advisor), mobile 07890 640399 15 of 24
Final version - October 2006
Table Four: Volume of excess to the Thames Valley average for first attendance in various locations.
Local Authority All Medical Group
18
Orthopaedic Overlap Group
19
Plastic Surgery &
Dermatology
Surgery &
Urology
South Bucks 42 3 5 10 2
West Oxfordshire 42 7 12 5 7
Aylesbury Vale 39 11 5 11 7
Oxford 36 5 5 7 -1
Milton Keynes 35 26 12 -4 10
Slough 33 -5 6 9 4
Cherwell 30 6 9 0 8
Windsor & Maidenhead 22 -7 8 8 1
Vale of White Horse 13 1 3 1 0
Bracknell Forest 9 -8 2 0 0
South Oxfordshire 8 3 -1 -1 -5
Wycombe -27 -4 -5 5 -3
Chiltern -36 -6 -8 4 -4
West Berkshire -41 -7 -12 -10 -7
Reading -48 -7 -4 -6 -7
Wokingham -50 -8 -4 -7 -7
Table Five: Top 15 LSOA for excess total first attendances per 1,000 head. Red indicates top 50, Pink top 50 to 100.
LSOA LA IMD All
SpecialtiesMedical Group
Orthopaedic Overlap
Plastic & Dermatology
Surgery & Urology
E01017656 Aylesbury Vale 2 274 34 47 41 26
E01028769 West Oxfordshire 6 247 11 49 19 18
E01016785 Milton Keynes 12 236 55 49 8 32
E01016782 Milton Keynes 12 232 40 48 19 33
E01016747 Milton Keynes 11 220 55 43 10 44
E01016749 Milton Keynes 6 204 54 43 6 40
E01017828 South Bucks 12 156 23 23 12 13
E01028584 Oxford 8 152 14 22 19 5
E01017805 South Bucks 19 151 14 12 18 20
E01028442 Cherwell 10 148 19 34 8 22
E01028463 Cherwell 4 147 18 15 6 20
E01017809 South Bucks 16 133 7 22 13 11
E01017709 Aylesbury Vale 24 131 22 12 22 14
E01028516 Oxford 25 128 12 22 12 6
E01017694 Aylesbury Vale 8 128 14 24 15 21
E01016448 Slough 28 127 10 22 19 22
Note that the top 15 LSOA for excess referral are mostly in affluent areas and all have an IMD less than the national average. GP referral behaviour is clearly capable of exerting a major effect.
18
General Medicine, Gastroenterology, Endocrinology, Cardiology, Thoracic Medicine, Infectious
Diseases, Elderly Care, Nephrology 19 Orthopaedics (including fracture clinic), Neurosurgery, Plastic Surgery, Anaesthetics & Pain
Dr Rod Jones (Statistical Advisor), mobile 07890 640399 16 of 24
Final version - October 2006
Conclusions This work has clearly demonstrated that both GP referral behaviour and the counting of first attendances at acute sites lead to differences in the financial pressures experienced in particular locations. In the context of benchmarks for PBC it identifies the unique relationship between IMD, ethnicity and students which exist for each specialty and highlights the practical difficulty of identifying every relevant population characteristic to be incorporated into a small area capitation formula. At a pragmatic level the volume of first attendance even after aggregation at the all specialty level is still relatively small in statistical terms and as such there is considerable statistical noise at a practice level. By implication stable PBC budgets can only exist for the largest practices and smaller practices will of necessity need to be grouped into larger entities.
Dr Rod Jones (Statistical Advisor), mobile 07890 640399 17 of 24
Final version - October 2006
Appendix One: Methodology A more detailed description of the methodology is given in the companion report covering non-zero day stay emergency admissions. Details specifically relevant to this report are as follows.
National Average Rates of First attendance
National data for outpatient attendance is not easily obtained. For this study data for the whole of Berkshire was used as a proxy for the national average. Data was at specialty level for GP and other first attendance types. First attendances were split into 5 year age bands (0 to 4, 5 to 9, etc up to 85+). Age banded first attendances were matched against 2003 mid-year population estimates for Berkshire to give a rate per 1,000 head for each age band. This figure assumes that all areas are at the Berkshire average Index of Multiple Deprivation (IMD). The only effect that this approximation is likely to have is to change the value of the intercept in the model. This is effectively a self-correcting mechanism which allows the output from the model to be recalibrated against the national average should this data become available.
Population Data at Lower Super Output Area (LSOA) Level 2001 census population data by 5 year age band was obtained for each lower super output area in Thames Valley. A lower super output area (LSOA) is a geographic and socio-economically distinct area containing 960 to 6,500 head of population (average 1,500). LSOAs nest into wards and then into Unitary Authority and PCT boundaries. For each LSOA an expected volume of first attendances was calculated using the age banded population and the age banded national average first attendance rates.
Specialty Groups Specialty level data was aggregated into larger specialty groups with General and Elderly medicine combined; Oral, Maxillofacial, Orthodontics & Medical dental all combined. Paediatric Surgery was combined with General Surgery, Paediatric Cardiology combined with Cardiology, etc.
Index of Multiple Deprivation ONS data for each LSOA was obtained for the 2004 revision of the Index of Multiple Deprivation (IMD).
Ethnicity 2001 census data at LSOA level on the percentage of persons from different ethnic origins was obtained from the neighbourhood statistics database of the ONS.
Full Time Students ONS data for students was obtained from Tables KS14 and CS63. This data was used to determine the number of full time students in each LSOA for the age bands 15-19, 20-24, 25-29, 30 to 34. These numbers were then used to calculate the expected number of first attendances for all persons and for full time students. The
Dr Rod Jones (Statistical Advisor), mobile 07890 640399 18 of 24
Final version - October 2006
expected percentage of first attendances attributed to students (assuming they had the same attendance rate as the general population) was then calculated. Hence for each LSOA we have a calculated % of attendances expected to arise from students. This is a better approach than simply taking the unadjusted raw proportion of students in the LSOA since we are applying an adjustment for age, i.e. the percentage of attendances due to students in the specialty of Geriatrics is expected to be 0% while in Paediatrics the proportion will be higher, etc. Full data tables are available covering all LSOA in the South Central SHA.
First attendances First attendances at LSOA level in 2003/04, 2004/05 and 2005/06 was obtained via the Health Informatics Shared Services for Berkshire, Oxfordshire and Buckinghamshire. First attendances for residents outside of Thames Valley were excluded.
LSOA-based First attendance Rate Relative to the Expected Average Actual first attendances for each LSOA were compared to forecast expected average using the age profile of each LSOA and the Berkshire rates for each of the 5 year age bands.
Allocation of LSOA to Trust/Site Catchment Areas Each LSOA was allocated to a Trust/Site catchment area using linear distance between the LSOA population centroid and the acute site. Linear distance has been shown to be a good approximation to travel time.
Trust/Site Thresholds for First attendance It is reasonable to expect that different organisations and sites have different thresholds for first attendance. These thresholds can arise due to:
• GP referral thresholds
• Different standards for counting of a ‘first attendance’, i.e. some locations may count ward attendees, urgent outpatient appointments, assessment unit attendance, etc differently to others
• Different ways of allocating a patient to a specialty, i.e. there is overlap between General Surgery/Urology/Gynaecology, between General Surgery and Gastroenterology, between General Medicine and Cardiology, etc, between T&O, Neurosurgery & Plastic Surgery and between Plastic Surgery & Dermatology, etc.
If a site has a threshold equal to the average for Thames Valley then the value of the threshold should be equal to 100%. Sites with a lower threshold for counting of a first attendance will have a value greater than 100%, i.e. a value of 125% implies 25% higher numbers of first attendances than the average for Thames Valley. The aim of the threshold is therefore to detect non-average counting of ‘first attendances’ due to one or more of the above reasons.
GP Referral and First attendance Thresholds

Dr Rod Jones (Statistical Advisor), mobile 07890 640399 19 of 24
Final version - October 2006
GP referral behaviour is known to vary considerably. This variability will be to some extent encapsulated into the area thresholds for first attendance, i.e. the observed threshold is the combined outcome of both primary and secondary care.
Modelling of the effects of IMD, Ethnicity, Students and Site Thresholds The population age distribution for each LSOA was used to calculate the expected number of first attendances based on the Berkshire average first attendance rates per age band. The difference between the actual number of first attendances and the expected (Berkshire average) was assumed to be due to the effects of IMD, Ethnicity, Students and Trust/Site thresholds for Counting/First attendance. A linear relationship has been assumed. No effect of distance was observed. The model had the following parameters. Ratio of actual/national average = ((Intercept + A x IMD + B x % Asian + C x % Black + D x % Student) x Site Threshold) The value of all constants was derived using the Solver function in Excel. This was accomplished by minimising the sum of residuals between the expected value predicted from the model and the actual value.
Dr Rod Jones (Statistical Advisor), mobile 07890 640399 20 of 24
Final version - October 2006
Appendix Two: Top 150 LSOA in Thames Valley Where First Attendance Avoidance Schemes May Yield the Greatest Return
Data is grouped by Local Authority and then by Ward. LSOA in the top 100 are highlighted in red bold. Note that this is the excess after adjusting for the effects of age, IMD, ethnicity and students. All data is an average of three years of referrals/attendances. Excess per 1,000 head ranges from 274 to 65. The wards of Coldharbour (Aylesbury Vale), Carterton NE (West Oxfordshire), Middleton & Emerson Valley (Milton Keynes) all have >200 excess first attendance per 1,000 head and a total outpatient first attendance rate of over 500 per 1,000 head20! Data from this table can be exported into Excel for additional analysis or can be mapped to discern spatial patterns. For example, the highest number of LSOA flagged in one electoral ward is for Bletchley & Fenny Stratford in Milton Keynes which is likely to be serviced by a particular GP practice.
LSOA_CODE Ward LA IMD Excess
Excess per 1000 head
E01017929 The Risboroughs Wycombe 11.1 116 76
E01016548 Clewer East Windsor & Maidenhead 2.78 135 95
E01016549 Clewer East Windsor & Maidenhead 10.3 118 78
E01016550 Clewer East Windsor & Maidenhead 6.14 140 97
E01016553 Clewer North Windsor & Maidenhead 4.36 124 86
E01016555 Clewer North Windsor & Maidenhead 20.8 109 78
E01016556 Clewer South Windsor & Maidenhead 13.1 122 67
E01016569 Eton Wick Windsor & Maidenhead 9.66 87 82
E01016577 Horton & Wraysbury Windsor & Maidenhead 17.8 123 79
E01016582 Maidenhead Riverside Windsor & Maidenhead 10.6 143 108
E01016590 Oldfield Windsor & Maidenhead 17.2 112 78
E01016609 Sunninghill & South Ascot Windsor & Maidenhead 9.18 166 99
E01028764 Bampton & Clanfield West Oxfordshire 4.77 153 91
E01028765 Bampton & Clanfield West Oxfordshire 6.89 173 89
E01028766 Brize Norton & Shilton West Oxfordshire 6.14 290 106
E01028769 Carterton North East West Oxfordshire 6.29 370 247
E01028771 Carterton North West West Oxfordshire 9.35 129 88
E01028774 Carterton South West Oxfordshire 5.77 96 69
E01028785 Eynsham & Cassington West Oxfordshire 4.39 119 77
E01028789 Freeland & Hanborough West Oxfordshire 2.16 95 67
E01028704 Abingdon Ock Meadow Vale of White Horse 11.2 123 87
E01028738 Marcham & Shippon Vale of White Horse 4.95 139 68
E01028614 Chinnor South Oxfordshire 6.99 100 67
E01028625 Didcot Ladygrove South Oxfordshire 4.77 119 82
E01028638 Forest Hill & Holton South Oxfordshire 13.4 96 74
E01028670 Thame South South Oxfordshire 2.96 97 70
E01028672 Thame South South Oxfordshire 4.22 104 72
E01028681 Wheatley South Oxfordshire 3.16 85 68
E01028683 Wheatley South Oxfordshire 5.06 95 69
E01017804 Burnham Church South Bucks 7.99 157 109
E01017805 Burnham Church South Bucks 18.7 271 151
E01017806 Burnham Church South Bucks 4.87 166 99
E01017807 Burnham Lent Rise South Bucks 4.5 180 121
E01017808 Burnham Lent Rise South Bucks 10.5 179 117
E01017809 Burnham Lent Rise South Bucks 15.7 198 133
E01017814 Dorney & Burnham South South Bucks 7.94 115 74
20 The Thames valley average for total outpatient first attendance is 280 per 1,000 head.
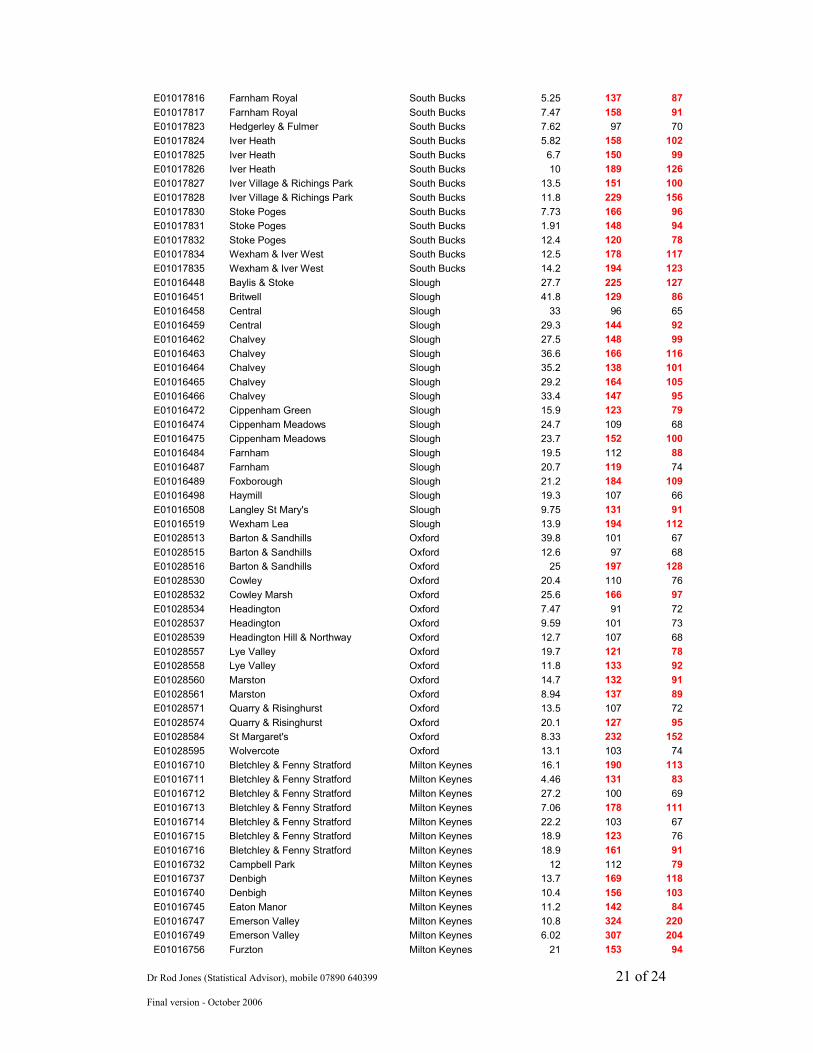
Dr Rod Jones (Statistical Advisor), mobile 07890 640399 21 of 24
Final version - October 2006
E01017816 Farnham Royal South Bucks 5.25 137 87
E01017817 Farnham Royal South Bucks 7.47 158 91
E01017823 Hedgerley & Fulmer South Bucks 7.62 97 70
E01017824 Iver Heath South Bucks 5.82 158 102
E01017825 Iver Heath South Bucks 6.7 150 99
E01017826 Iver Heath South Bucks 10 189 126
E01017827 Iver Village & Richings Park South Bucks 13.5 151 100
E01017828 Iver Village & Richings Park South Bucks 11.8 229 156
E01017830 Stoke Poges South Bucks 7.73 166 96
E01017831 Stoke Poges South Bucks 1.91 148 94
E01017832 Stoke Poges South Bucks 12.4 120 78
E01017834 Wexham & Iver West South Bucks 12.5 178 117
E01017835 Wexham & Iver West South Bucks 14.2 194 123
E01016448 Baylis & Stoke Slough 27.7 225 127
E01016451 Britwell Slough 41.8 129 86
E01016458 Central Slough 33 96 65
E01016459 Central Slough 29.3 144 92
E01016462 Chalvey Slough 27.5 148 99
E01016463 Chalvey Slough 36.6 166 116
E01016464 Chalvey Slough 35.2 138 101
E01016465 Chalvey Slough 29.2 164 105
E01016466 Chalvey Slough 33.4 147 95
E01016472 Cippenham Green Slough 15.9 123 79
E01016474 Cippenham Meadows Slough 24.7 109 68
E01016475 Cippenham Meadows Slough 23.7 152 100
E01016484 Farnham Slough 19.5 112 88
E01016487 Farnham Slough 20.7 119 74
E01016489 Foxborough Slough 21.2 184 109
E01016498 Haymill Slough 19.3 107 66
E01016508 Langley St Mary's Slough 9.75 131 91
E01016519 Wexham Lea Slough 13.9 194 112
E01028513 Barton & Sandhills Oxford 39.8 101 67
E01028515 Barton & Sandhills Oxford 12.6 97 68
E01028516 Barton & Sandhills Oxford 25 197 128
E01028530 Cowley Oxford 20.4 110 76
E01028532 Cowley Marsh Oxford 25.6 166 97
E01028534 Headington Oxford 7.47 91 72
E01028537 Headington Oxford 9.59 101 73
E01028539 Headington Hill & Northway Oxford 12.7 107 68
E01028557 Lye Valley Oxford 19.7 121 78
E01028558 Lye Valley Oxford 11.8 133 92
E01028560 Marston Oxford 14.7 132 91
E01028561 Marston Oxford 8.94 137 89
E01028571 Quarry & Risinghurst Oxford 13.5 107 72
E01028574 Quarry & Risinghurst Oxford 20.1 127 95
E01028584 St Margaret's Oxford 8.33 232 152
E01028595 Wolvercote Oxford 13.1 103 74
E01016710 Bletchley & Fenny Stratford Milton Keynes 16.1 190 113
E01016711 Bletchley & Fenny Stratford Milton Keynes 4.46 131 83
E01016712 Bletchley & Fenny Stratford Milton Keynes 27.2 100 69
E01016713 Bletchley & Fenny Stratford Milton Keynes 7.06 178 111
E01016714 Bletchley & Fenny Stratford Milton Keynes 22.2 103 67
E01016715 Bletchley & Fenny Stratford Milton Keynes 18.9 123 76
E01016716 Bletchley & Fenny Stratford Milton Keynes 18.9 161 91
E01016732 Campbell Park Milton Keynes 12 112 79
E01016737 Denbigh Milton Keynes 13.7 169 118
E01016740 Denbigh Milton Keynes 10.4 156 103
E01016745 Eaton Manor Milton Keynes 11.2 142 84
E01016747 Emerson Valley Milton Keynes 10.8 324 220
E01016749 Emerson Valley Milton Keynes 6.02 307 204
E01016756 Furzton Milton Keynes 21 153 94
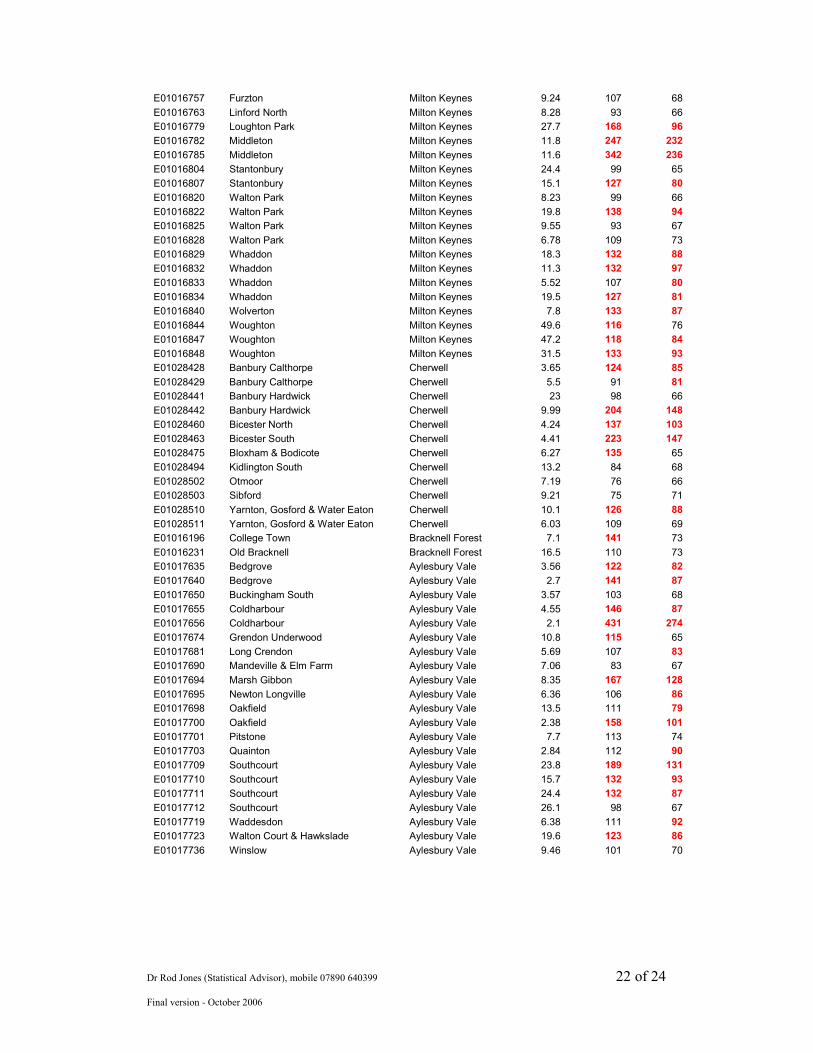
Dr Rod Jones (Statistical Advisor), mobile 07890 640399 22 of 24
Final version - October 2006
E01016757 Furzton Milton Keynes 9.24 107 68
E01016763 Linford North Milton Keynes 8.28 93 66
E01016779 Loughton Park Milton Keynes 27.7 168 96
E01016782 Middleton Milton Keynes 11.8 247 232
E01016785 Middleton Milton Keynes 11.6 342 236
E01016804 Stantonbury Milton Keynes 24.4 99 65
E01016807 Stantonbury Milton Keynes 15.1 127 80
E01016820 Walton Park Milton Keynes 8.23 99 66
E01016822 Walton Park Milton Keynes 19.8 138 94
E01016825 Walton Park Milton Keynes 9.55 93 67
E01016828 Walton Park Milton Keynes 6.78 109 73
E01016829 Whaddon Milton Keynes 18.3 132 88
E01016832 Whaddon Milton Keynes 11.3 132 97
E01016833 Whaddon Milton Keynes 5.52 107 80
E01016834 Whaddon Milton Keynes 19.5 127 81
E01016840 Wolverton Milton Keynes 7.8 133 87
E01016844 Woughton Milton Keynes 49.6 116 76
E01016847 Woughton Milton Keynes 47.2 118 84
E01016848 Woughton Milton Keynes 31.5 133 93
E01028428 Banbury Calthorpe Cherwell 3.65 124 85
E01028429 Banbury Calthorpe Cherwell 5.5 91 81
E01028441 Banbury Hardwick Cherwell 23 98 66
E01028442 Banbury Hardwick Cherwell 9.99 204 148
E01028460 Bicester North Cherwell 4.24 137 103
E01028463 Bicester South Cherwell 4.41 223 147
E01028475 Bloxham & Bodicote Cherwell 6.27 135 65
E01028494 Kidlington South Cherwell 13.2 84 68
E01028502 Otmoor Cherwell 7.19 76 66
E01028503 Sibford Cherwell 9.21 75 71
E01028510 Yarnton, Gosford & Water Eaton Cherwell 10.1 126 88
E01028511 Yarnton, Gosford & Water Eaton Cherwell 6.03 109 69
E01016196 College Town Bracknell Forest 7.1 141 73
E01016231 Old Bracknell Bracknell Forest 16.5 110 73
E01017635 Bedgrove Aylesbury Vale 3.56 122 82
E01017640 Bedgrove Aylesbury Vale 2.7 141 87
E01017650 Buckingham South Aylesbury Vale 3.57 103 68
E01017655 Coldharbour Aylesbury Vale 4.55 146 87
E01017656 Coldharbour Aylesbury Vale 2.1 431 274
E01017674 Grendon Underwood Aylesbury Vale 10.8 115 65
E01017681 Long Crendon Aylesbury Vale 5.69 107 83
E01017690 Mandeville & Elm Farm Aylesbury Vale 7.06 83 67
E01017694 Marsh Gibbon Aylesbury Vale 8.35 167 128
E01017695 Newton Longville Aylesbury Vale 6.36 106 86
E01017698 Oakfield Aylesbury Vale 13.5 111 79
E01017700 Oakfield Aylesbury Vale 2.38 158 101
E01017701 Pitstone Aylesbury Vale 7.7 113 74
E01017703 Quainton Aylesbury Vale 2.84 112 90
E01017709 Southcourt Aylesbury Vale 23.8 189 131
E01017710 Southcourt Aylesbury Vale 15.7 132 93
E01017711 Southcourt Aylesbury Vale 24.4 132 87
E01017712 Southcourt Aylesbury Vale 26.1 98 67
E01017719 Waddesdon Aylesbury Vale 6.38 111 92
E01017723 Walton Court & Hawkslade Aylesbury Vale 19.6 123 86
E01017736 Winslow Aylesbury Vale 9.46 101 70
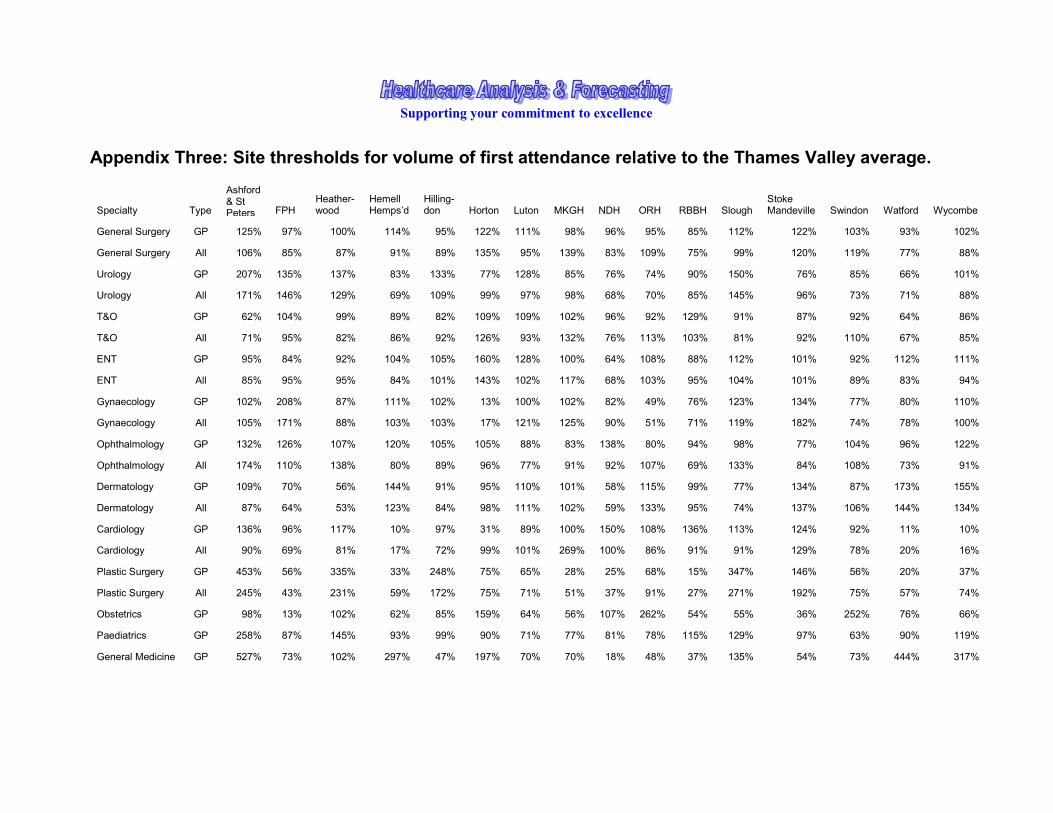
Supporting your commitment to excellence
Appendix Three: Site thresholds for volume of first attendance relative to the Thames Valley average.
Specialty Type
Ashford & St Peters FPH
Heather-wood
Hemell Hemps’d
Hilling-don Horton Luton MKGH NDH ORH RBBH Slough
Stoke Mandeville Swindon Watford Wycombe
General Surgery GP 125% 97% 100% 114% 95% 122% 111% 98% 96% 95% 85% 112% 122% 103% 93% 102%
General Surgery All 106% 85% 87% 91% 89% 135% 95% 139% 83% 109% 75% 99% 120% 119% 77% 88%
Urology GP 207% 135% 137% 83% 133% 77% 128% 85% 76% 74% 90% 150% 76% 85% 66% 101%
Urology All 171% 146% 129% 69% 109% 99% 97% 98% 68% 70% 85% 145% 96% 73% 71% 88%
T&O GP 62% 104% 99% 89% 82% 109% 109% 102% 96% 92% 129% 91% 87% 92% 64% 86%
T&O All 71% 95% 82% 86% 92% 126% 93% 132% 76% 113% 103% 81% 92% 110% 67% 85%
ENT GP 95% 84% 92% 104% 105% 160% 128% 100% 64% 108% 88% 112% 101% 92% 112% 111%
ENT All 85% 95% 95% 84% 101% 143% 102% 117% 68% 103% 95% 104% 101% 89% 83% 94%
Gynaecology GP 102% 208% 87% 111% 102% 13% 100% 102% 82% 49% 76% 123% 134% 77% 80% 110%
Gynaecology All 105% 171% 88% 103% 103% 17% 121% 125% 90% 51% 71% 119% 182% 74% 78% 100%
Ophthalmology GP 132% 126% 107% 120% 105% 105% 88% 83% 138% 80% 94% 98% 77% 104% 96% 122%
Ophthalmology All 174% 110% 138% 80% 89% 96% 77% 91% 92% 107% 69% 133% 84% 108% 73% 91%
Dermatology GP 109% 70% 56% 144% 91% 95% 110% 101% 58% 115% 99% 77% 134% 87% 173% 155%
Dermatology All 87% 64% 53% 123% 84% 98% 111% 102% 59% 133% 95% 74% 137% 106% 144% 134%
Cardiology GP 136% 96% 117% 10% 97% 31% 89% 100% 150% 108% 136% 113% 124% 92% 11% 10%
Cardiology All 90% 69% 81% 17% 72% 99% 101% 269% 100% 86% 91% 91% 129% 78% 20% 16%
Plastic Surgery GP 453% 56% 335% 33% 248% 75% 65% 28% 25% 68% 15% 347% 146% 56% 20% 37%
Plastic Surgery All 245% 43% 231% 59% 172% 75% 71% 51% 37% 91% 27% 271% 192% 75% 57% 74%
Obstetrics GP 98% 13% 102% 62% 85% 159% 64% 56% 107% 262% 54% 55% 36% 252% 76% 66%
Paediatrics GP 258% 87% 145% 93% 99% 90% 71% 77% 81% 78% 115% 129% 97% 63% 90% 119%
General Medicine GP 527% 73% 102% 297% 47% 197% 70% 70% 18% 48% 37% 135% 54% 73% 444% 317%
Dr Rod Jones (Statistical Advisor), mobile 07890 640399 24 of 24
Final version - October 2006
Neurology GP 91% 75% 117% 96% 85% 93% 73% 106% 63% 112% 96% 126% 94% 86% 95% 101%
Mental Illness GP 154% 120% 139% 96% 53% 86% 19% 0% 133% 126% 114% 104% 99% 105% 54% 76%
Mental Illness All 140% 115% 106% 74% 145% 91% 29% 1% 144% 104% 144% 126% 71% 90% 56% 85%
Gastroenterology GP 50% 8% 110% 7% 87% 86% 102% 166% 104% 148% 131% 50% 182% 134% 0% 5%
Midwife GP 411% 150% 565% 0% 51% 238% 17% 0% 0% 0% 0% 381% 0% 0% 0% 0% Obstetric & Midwife GP 182% 51% 216% 47% 78% 169% 50% 43% 81% 199% 43% 124% 28% 190% 59% 53%
Rheumatology GP 237% 95% 112% 163% 94% 72% 121% 82% 47% 70% 88% 127% 134% 68% 181% 170%
Oral Surgery GP 155% 58% 90% 34% 114% 183% 16% 42% 161% 211% 44% 119% 42% 231% 47% 40%
Oral Surgery All 109% 100% 108% 101% 103% 83% 85% 88% 66% 112% 101% 102% 121% 117% 88% 90% Thoracic Medicine GP 43% 90% 40% 20% 48% 31% 119% 125% 150% 149% 144% 31% 144% 145% 32% 14% Medical Group excl Cardiology GP 249% 68% 80% 149% 75% 122% 112% 94% 71% 107% 83% 85% 141% 108% 199% 150% Medical Group incl Cardiology GP 205% 75% 89% 96% 90% 91% 100% 96% 98% 109% 102% 92% 135% 105% 126% 105% Medical Group incl Cardiology All 153% 66% 77% 78% 86% 109% 111% 170% 81% 114% 80% 92% 127% 104% 93% 81%
All Specialties GP 133% 96% 112% 97% 93% 105% 100% 86% 103% 105% 89% 114% 102% 87% 95% 102%
All Specilaties All 126% 92% 104% 86% 93% 107% 104% 111% 87% 110% 82% 110% 114% 102% 85% 88% Orthopaedic Group GP 145% 95% 142% 78% 125% 109% 90% 90% 78% 88% 101% 143% 98% 83% 63% 80% Orthopaedic Group All 111% 90% 107% 84% 116% 115% 87% 118% 69% 107% 88% 114% 108% 102% 74% 86% Plastic Surgery & Dermatology GP 148% 76% 123% 112% 138% 89% 93% 81% 49% 100% 76% 147% 133% 78% 139% 131% Plastic Surgery & Dermatology All 162% 64% 114% 101% 122% 89% 94% 85% 48% 115% 70% 142% 156% 89% 129% 117%


![Thames Region Land Drainage - gov.uk · Thames Water Authority LAND DRAINAGE BYELAWS 1981 [as amended by the Thames Region FLOOD DEFENCE BYELAWS 1991] The Thames Water Authority,](https://static.fdocuments.net/doc/165x107/5ead899913c7690cc165ecc9/thames-region-land-drainage-govuk-thames-water-authority-land-drainage-byelaws.jpg)