ANALYSIS OF GROUND-WATER FLOW - USGS
46
Analysis of Ground-Water Flow 115 The simulated ground-water levels in the regional model were most sensitive to the location of the freshwater–saltwater interface, the amount of recharge and irrigation return flow applied to the Oxnard Plain, the vertical distribution of pumpage, the variation in streambed conductance, and the conductance of faults at subarea boundaries where the hydraulic gradient is approximately perpendicular to the fault trace. The model also was sensitive to estimates of vertical conductivity in areas where there are large differences between heads in the two aquifer systems. For the most part, a group of model parameters, such as the vertical distribution of pumpage; vertical leakance; general-head boundary conductance; and irrigation return flow controlled the goodness-of-fit for the Oxnard Plain. The model was relatively insensitive to ET, valley-floor infiltration, and some aquifer parameters such as transmissivity. As in most models, changes in water levels and ground-water flow were most sensitive to changes in the recharge and discharge boundary conditions near basin margins. Changes in pumpage, vertical leakance, and storage properties were more important to changes in head and ground-water flow in areas away from basin margins. Pumpage, and its vertical distribution, was the most sensitive parameter in this regional ground-water flow model. As in previous simulations of regional subsidence (Hanson, 1989; Hanson and Benedict, 1994), matching the timing and the amount of land subsidence was most sensitive to changes in the initial preconsolidation stress thresholds. This current model adequately reproduces long- term historical changes in flows and in ground-water levels on a regional scale, but the ability of the model to simulate the specific water-level histories of some wells is limited because the aquifers were grouped into only two layers. Because the ocean boundary greatly simplifies the mobile freshwater–saltwater interface, the simulation of coastal inflow and outflow is only a crude approximation of the actual process of seawater intrusion; therefore, caution should be taken in using this model to simulate relatively small-scale flows near the coast. Inflows and outflows over seasonal time periods were combined in the model; this may have had some effect on the ability of the model to simulate rapidly changing streamflow conditions during natural floodflows or during releases from Lake Piru in low- flow summer and fall months. The complex processes of irrigation return flow and related vertical leakage to the upper-aquifer system in the Oxnard Plain were further simplified by the exclusion of the semiperched system. The exclusion of the shallow fluvial deposits as a separate layer precluded the assessment of some ground-water/surface-water exchanges along the Santa Clara River and Calleguas Creek. However, even with these significant limitations, this model provides a framework for assessing regional water-resources management issues and a basis for further model development and refinement. This model also can be used to assess future water-supply projects and the relative importance of various flow components on a regional scale. ANALYSIS OF GROUND-WATER FLOW The calibrated ground-water flow model was used to analyze the distribution and magnitude of ground-water flow within the entire Santa Clara– Calleguas Basin. The flow analysis in this report includes a summary of flow under predevelopment and historical conditions, the period of reported pumpage 1984–93, projected future ground-water flow conditions in relation to planned water-supply projects, and projected future ground-water flow conditions for possible alternative water-supply projects. Formulation of planned future and alternative future water-supply projects was done jointly by the FGMA, the UWCD, and the CMWD.
Transcript of ANALYSIS OF GROUND-WATER FLOW - USGS

Analysis of Ground-Water Flow 115
The simulated ground-water levels in the regional model were most sensitive to the location of the freshwater–saltwater interface, the amount of recharge and irrigation return flow applied to the Oxnard Plain, the vertical distribution of pumpage, the variation in streambed conductance, and the conductance of faults at subarea boundaries where the hydraulic gradient is approximately perpendicular to the fault trace. The model also was sensitive to estimates of vertical conductivity in areas where there are large differences between heads in the two aquifer systems. For the most part, a group of model parameters, such as the vertical distribution of pumpage; vertical leakance; general-head boundary conductance; and irrigation return flow controlled the goodness-of-fit for the Oxnard Plain. The model was relatively insensitive to ET, valley-floor infiltration, and some aquifer parameters such as transmissivity. As in most models, changes in water levels and ground-water flow were most sensitive to changes in the recharge and discharge boundary conditions near basin margins. Changes in pumpage, vertical leakance, and storage properties were more important to changes in head and ground-water flow in areas away from basin margins. Pumpage, and its vertical distribution, was the most sensitive parameter in this regional ground-water flow model. As in previous simulations of regional subsidence (Hanson, 1989; Hanson and Benedict, 1994), matching the timing and the amount of land subsidence was most sensitive to changes in the initial preconsolidation stress thresholds.
This current model adequately reproduces long-term historical changes in flows and in ground-water levels on a regional scale, but the ability of the model to simulate the specific water-level histories of some wells is limited because the aquifers were grouped into only two layers. Because the ocean boundary greatly simplifies the mobile freshwater–saltwater interface, the simulation of coastal inflow and outflow is only a crude approximation of the actual process of seawater
intrusion; therefore, caution should be taken in using this model to simulate relatively small-scale flows near the coast. Inflows and outflows over seasonal time periods were combined in the model; this may have had some effect on the ability of the model to simulate rapidly changing streamflow conditions during natural floodflows or during releases from Lake Piru in low-flow summer and fall months. The complex processes of irrigation return flow and related vertical leakage to the upper-aquifer system in the Oxnard Plain were further simplified by the exclusion of the semiperched system. The exclusion of the shallow fluvial deposits as a separate layer precluded the assessment of some ground-water/surface-water exchanges along the Santa Clara River and Calleguas Creek. However, even with these significant limitations, this model provides a framework for assessing regional water-resources management issues and a basis for further model development and refinement. This model also can be used to assess future water-supply projects and the relative importance of various flow components on a regional scale.
ANALYSIS OF GROUND-WATER FLOW
The calibrated ground-water flow model was used to analyze the distribution and magnitude of ground-water flow within the entire Santa Clara–Calleguas Basin. The flow analysis in this report includes a summary of flow under predevelopment and historical conditions, the period of reported pumpage 1984–93, projected future ground-water flow conditions in relation to planned water-supply projects, and projected future ground-water flow conditions for possible alternative water-supply projects. Formulation of planned future and alternative future water-supply projects was done jointly by the FGMA, the UWCD, and the CMWD.

116 Simulation of Ground-Water/Surface-Water Flow in the Santa Clara–Calleguas Ground-Water Basin, Ventura County, California
The summaries of the flow analysis are grouped into categories of recharge, coastal flow, inland flow, and subsidence. These summaries describe the major inflow and outflow components driving the changes in supply and the effects of ground-water overdraft (demand). For budgetary-flow analysis, the regional ground-water flow system was divided into 34 subareas (fig. 17B) that represent the upper- and lower-aquifer systems in the 12 landward subbasins and offshore subareas of the Santa Clara–Calleguas Basin (fig. 1). Total flows, relative percentages of flow, and mean flows for the simulation period were used for the analysis of the long-term ground-water conditions. The mean flows were based on the flows from the last time step of every season; therefore, the mean flows of head-dependent boundary conditions used to describe flows closely approximate but may not equal the average total flow over a simulation period. The mean flows should be considered with some caution because they may not adequately represent the true variability or the cumulative magnitude of a particular flow component. Net flow represents the difference between ground-water inflow and outflow for a particular boundary flow, such as coastal flow accross subarea boundaries.
The basin is partially under the management authority of the FGMA; other water purveyors include the UWCD and the CMWD water districts—all of which provide water and water-related services to different parts of the basin (fig. 26). The Oxnard Plain subbasin is subdivided into four model subareas: the Oxnard Plain Forebay, the Northwest Oxnard Plain, the Northeast Oxnard Plain, and the South Oxnard Plain (fig. 17B). These subareas are roughly in alignment with surface-water pipeline service areas and are coincident with the areal extent of the fluvial deposits within the two river drainages that cross the Oxnard Plain. The offshore part of the model is subdivided into three subareas that represent extensions of the Mound
subbasin (Offshore Mound subarea), the northwestern Oxnard Plain north of the Hueneme submarine canyon (Offshore North Oxnard Plain), and the southern Oxnard Plain south of the Hueneme submarine canyon (Offshore South Oxnard Plain) (fig. 17B). For the purposes of this discussion, the Santa Clara River Valley consists of the Piru, Fillmore, Santa Paula, and Mound subareas, and the non-FGMA area consists of these same subareas plus the Santa Rosa Valley subarea. The FGMA areas are composed of the Oxnard Plain model subareas, referred to as the coastal FGMA subareas, and the Pleasant Valley and the Las Posas Valley model subareas, referred to as the inland FGMA subareas (fig. 17B).
Total flows, relative percentages of flow, and mean flows for the simulation period were used to analyze long-term ground-water conditions. Mean flows were based on flows from the last time step of every season. Therefore, mean flows of head-dependent boundary conditions, used to describe flows, closely approximate but may not exactly equal the average total flow over a simulation period. Because the regional model does not simulate transport or density-dependent flow, the summaries on coastal landward flow (seawater intrusion) (fig. 25B) are meant to give some regional approximation of potential flow along the coastal boundary of the regional aquifer system. Thus, using the reference to seawater intrusion implies that gradients above the equivalent freshwater head at the approximate average location of the seawater interface represent the inflow of seawater into the coarse-grained layers of the aquifer systems. Without density-dependent or transport modeling, such as that described by Nishikawa (1997), or some surrogate for advective flow, such as particle tracking, the reference to outflow at the coast could include moving the seawater front seaward or actually discharging freshwater into the ocean.
Analysis of Ground-Water Flow 117
Pacific
Ocean
R18
WR
22W
T 2 NT 4 N
Wat
erA
utho
riti
es
Uni
ted
Wat
erC
onse
rvat
ion
Dis
tric
t(U
WC
D)
Fox
Can
yon
Gro
undw
ater
Man
agem
ent
Age
ncy
(FG
MA
)
Cal
legu
asM
unic
ipal
Wat
erD
istr
ict
(CM
WD
)R
iver
Santa
Clara
Lak
eP
iru
Calleg
uas
CreekE
XP
LA
NA
TIO
N
Hyd
rolo
gic
Uni
tbo
unda
ryG
roun
d-w
ater
subb
asin
boun
dary
–Su
bbas
inna
mes
are
give
nin
figu
re1
Mod
el-g
rid
boun
dary
offl
owre
gion
and
suba
reas
Oxna
rd-
Huen
eme
pipe
line
Oxna
rd-
Huen
eme
pipe
line
Pum
ping
-Tr
ough
pipe
line
Pum
ping
-Tr
ough
pipe
line
Cha
nnel
Isla
nds
wel
lsaf
ter
1997
(5)
City
ofO
xnar
dco
ntin
ued-
pum
page
afte
r19
96(1
)
Port
Hue
nem
ew
ells
afte
r19
97(5
)
CM
WD
Proj
ect–
Inje
ctio
nan
dpu
mp-
back
vari
able
base
don
clim
ate
(3)
Plea
sant
Val
ley
wel
ls–
Pum
page
redu
ced
5,00
0ac
re-f
eetp
erye
arw
ithH
illC
anyo
nD
eliv
erie
s(6
)
Incr
ease
dre
char
geat
Satic
oy(4
)
Incr
ease
dre
char
geat
ElR
io(4
)
Del
Nor
tew
ells
–Pu
mpa
gere
duce
dby
900
acre
-fee
tper
year
(2)
Fau
lt
Mod
elce
llsus
edto
sim
ulat
eef
fect
sof
prop
osed
proj
ects
(Pro
ject
num
ber)
0 0
10M
ILES
10KI
LOM
ETER
S
A11
8°45
'11
9°15
'
34°
07'
30"
34°
22'
30"
119°
Sant
aC
lara
-Cal
legu
asgr
ound
-wat
erba
sin
Out
side
Sant
aC
lara
-Cal
legu
asgr
ound
-wat
erba
sin
Shal
low
allu
vium
Shal
low
allu
vium
and
unco
nsol
idat
edde
posi
ts
Con
solid
ated
and
unco
nsol
idat
edde
posi
ts
Figu
re 2
6. L
ocat
ion
of m
odel
cel
ls u
sed
to s
imul
ate
(A) p
ropo
sed
wat
er-s
uppl
y pr
ojec
ts fo
r the
exi
stin
g m
anag
emen
t pla
n, S
anta
Cla
ra–C
alle
guas
gro
und-
wat
er b
asin
, Ven
tura
Cou
nty,
Ca
lifor
nia.

118 Simulation of Ground-Water/Surface-Water Flow in the Santa Clara–Calleguas Ground-Water Basin, Ventura County, California
Pacific
Ocean
R18
WR
22W
T 2 NT 4 N
Wat
erA
utho
riti
es
Uni
ted
Wat
erC
onse
rvat
ion
Dis
tric
t(U
WC
D)
Fox
Can
yon
Gro
undw
ater
Man
agem
ent
Age
ncy
(FG
MA
)
Cal
legu
asM
unic
ipal
Wat
erD
istr
ict
(CM
WD
)R
iver
Santa
Clara
Lak
eP
iru
Calleg
uas
Creek
B
EX
PL
AN
AT
ION
Hyd
rolo
gic
Uni
tbo
unda
ry
Gro
und-
wat
ersu
bbas
inbo
unda
ry–
Subb
asin
nam
esar
egi
ven
infi
gure
1
Mod
el-g
rid
boun
dary
offl
owre
gion
and
suba
reas
Oxna
rd-
Huen
eme
pipe
line
Oxna
rd-
Huen
eme
pipe
line
Pum
ping
-Tr
ough
pipe
line
Pum
ping
-Tr
ough
pipe
line
Sout
hern
Oxn
ard
Plai
n(3
,6)
Inje
ctio
nSo
uthe
rnO
xnar
dPl
ain
(1)
Nor
thea
stO
xnar
dPl
ain
(5)
Pum
ping
Tro
ugh
Pipe
line
Wel
ls(4
)
OH
-Wel
lpum
p-ba
ck(1
)(2
0,00
0ac
re-f
eetp
erye
ar)
Plea
sant
Val
ley
(7)
Hap
pyC
amp
Can
yon
Rec
harg
e(2
)
Hap
pyC
amp
Can
yon A
dditi
onal
Com
pone
nts
(See
figu
re26
A)
Fau
lt
0 0
10M
ILES
10KI
LOM
ETER
S
118°
45'
119°
15'
34°
07'
30"
34°
22'
30"
119°
Sant
aC
lara
-Cal
legu
asgr
ound
-wat
erba
sin
Out
side
Sant
aC
lara
-Cal
legu
asgr
ound
-wat
erba
sin
Shal
low
allu
vium
Shal
low
allu
vium
and
unco
nsol
idat
edde
posi
ts
Con
solid
ated
and
unco
nsol
idat
edde
posi
ts
Mod
elce
llsus
edto
sim
ulat
eef
fect
sof
alte
rnat
ive
proj
ects
(Pot
enti
al-c
ase
num
ber)
Figu
re 2
6—Co
ntin
ued.
(B) a
ltern
ativ
e w
ater
-sup
ply
proj
ects
in th
e m
odel
of t
he S
anta
Cla
ra–C
alle
guas
gro
und-
wat
er b
asin
, Ven
tura
Cou
nty,
Cal
iforn
ia.

Analysis of Ground-Water Flow 119
Predevelopment Ground-Water Flow
Simulated water levels for predevelopment conditions were about 40 and 50 ft above land surface in the upper- and lower-aquifer systems along the coast, respectively, which is consistent with early reports of artesian water levels during 1870–90. The total simulated recharge for predevelopment conditions was 59,900 acre-ft/yr, and the total net recharge was 33,650 acre-ft/yr. Streamflow accounted for 68 percent of the total recharge and nonstreamflow recharge accounted for 32 percent (fig. 25C). Simulated streamflow resulted in 40,600 acre-ft/yr of infiltration and 26,300 acre-ft/yr of ground-water discharge back into the stream channels for a net streamflow recharge of about 14,300 acre-ft/yr (table 6). Net streamflow recharge was largest in the Piru (32 percent) and Fillmore (22 percent) subareas and the Oxnard Plain Forebay (18 percent). Ground-water discharge to the Santa Clara River was largest in the Fillmore subarea (41 percent) and was concentrated near the narrow boundary with the Santa Paula subarea. Streamflow discharge also occurs in the Piru subarea at the narrow boundary with the Fillmore subarea and in the Santa Paula and South Las Posas Valley subareas. Total mean nonstreamflow recharge for the entire regional flow system was about 19,400 acre-ft/yr (table 6) of which about 4,800 acre-ft/yr is valley-floor recharge and about 14,600 acre-ft/yr is mountain-front and bedrock recharge (fig. 25C).
Total simulated natural discharge was 59,900 acre-ft/yr (fig. 25C) and the total net discharge, which equals net recharge, was about 33,650 acre-ft/yr. Coastal outflow accounts for about 18,900 acre-ft/yr which is 31 percent of the total discharge (fig. 25C) and 56 percent of the net discharge. ET accounts for about 14,800 acre-ft/yr which is 25 percent of the total discharge (fig. 25C) and 44 percent of the net discharge. The largest amounts of ground-water discharge as ET occur in the Fillmore (38 percent), South Pleasant Valley (21 percent), and Santa Paula subareas (17 percent).
Net underflow from the Santa Clara River Valley subareas to the Oxnard Plain subareas was simulated as about 6,890 acre-ft/yr for time-averaged predevelopment conditions. A net downward leakage between aquifer systems of about 450 acre-ft/yr was simulated for the entire Oxnard Plain subareas. The largest downward flow, about 1,330 acre-ft/yr, was
simulated in the Oxnard Plain Forebay. This relatively small net leakage includes downward leakage in the Oxnard Plain Forebay and strictly upward leakage in the South Oxnard Plain subarea and most of the Northeast and Northwest Oxnard Plain subareas, which is consistent with the upward vertical head gradient in these areas.
Historical Ground-Water Flow, 1984–93
The analysis of historical ground-water flow was restricted to 1984–93, the period when estimates of pumpage were the most complete and were largely based on reported values of metered pumpage. This period contains an equal number of wet and dry years; 3 wet years, followed by 5 dry years, followed by 2 wet years. This period also was one of increasing ground-water management related actions: increasing streamflow diversions for artificial recharge at the Freeman Diversion, increasing discharges of treated sewage effluent, and increasing pumpage. As a result of these increases in supply and demand, there was an increase in recharge, seawater intrusion, subsidence, leakage between aquifers, and ground-water flow between subareas, as well as reduced ET and a reduction in ground water in storage. The policies of the FGMA resulted in a moratorium on new wells in the upper-aquifer system in the northwestern part of the Oxnard Plain subareas and on the drilling of new wells and increased pumpage in the lower-aquifer system (Rick Farnsworth, Fox Canyon Ground-Water Management Agency, oral commun., 1991). This has resulted in additional seawater intrusion in the lower aquifer system and additional subsidence.
Summary of Ground-Water Conditions
The total simulated pumpage for 1984–93 is 2,468,600 acre-ft, which is an average of about 247,000 acre-ft/yr. About 37 percent of the pumpage was from the Oxnard Plain subareas, 37 percent from the Santa Clara River Valley subareas, 13 percent from the Las Posas Valley subareas, 9 percent from the Pleasant Valley subareas, 3 percent from the Mound subarea, and 1 percent from the Santa Rosa Valley subarea (fig. 25D). The distribution of pumpage for the ground-water management area is 59 percent for the FGMA-managed areas and 41 percent for the non-FGMA-managed areas.

120 Simulation of Ground-Water/Surface-Water Flow in the Santa Clara–Calleguas Ground-Water Basin, Ventura County, California
Overall, pumpage during the 1984–93 sequence of wet and dry years resulted in overdraft of the ground-water flow system. The combination of water from storage, coastal landward flow (seawater intrusion), and subsidence represents an estimated 23,830 acre-ft/yr of average overdraft for the 1984–93 period, which is about 10 percent of the average annual pumpage. Of the total overdraft, 60 percent is from aquifer storage depletion, 31 percent is from coastal landward flow (seawater intrusion), and 17 percent is from subsidence. The mean rate of water extracted from aquifer storage is 14,260 acre-ft/yr. Results of the model simulations indicate that a relatively large contribution of aquifer storage is from the lower-aquifer system (layer 2) of the Oxnard Plain subarea and of the inland FGMA-managed subareas, and from the upper-aquifer system in the Santa Clara River Valley subareas. The contribution of ground water from subsidence (interbed storage) was about 4,100 acre-ft/yr (table 6) and represent about 17 percent of the average annual overdraft (23,830 acre-ft/yr). Recall that water derived from subsidence is, in part, a one-time source of water because the inelastic component of interbed storage is irreversible. Simulation results show that most of water derived from subsidence is from the Oxnard Plain subareas (47 percent) and the Las Posas Valley subareas (34 percent) (fig. 25D).
Ground-water pumpage resulted in a decrease in ET and stream baseflow in the inland subareas. Both ET and stream baseflow remain concentrated at the basin narrows of the Santa Clara River Valley and the Las Posas Valley subareas. Most of the simulated ET occurs in the Santa Clara Valley subareas (76 percent or 810 acre-ft/yr) (fig. 25D). The simulated ET for 1984–93 averaged 1,060 acre-ft/yr and is 7 percent of the simulated annual ET for the predevelopment period. Baseflow averaged about 8,250 acre-ft/yr for the period 1984–93 and is about 13 percent of the total streamflow infiltration and about 33 percent of the simulated predevelopment baseflow.
Recharge
Hydrological, geophysical, and geochemical data and ground-water simulations indicate that the upper-aquifer system is the recipient of most of the natural and artificial recharge and, thus, is a relatively more dynamic flow system than is the lower-aquifer system. Simulated total recharge (natural and artificial) for 1984–93 was 228,500 acre-ft/yr, which is about 93 percent of the average pumpage for this period. Most of the recharge occurred in the upper-aquifer system of the Santa Clara River Valley and the Oxnard Plain Forebay subareas. The total simulated natural recharge was about 114,100 acre-ft/yr: 27,800 acre-ft/yr of mountain-front and bedrock recharge, 24,100 acre-ft/yr of valley-floor recharge, and 62,200 acre-ft/yr of net streamflow infiltration. The distributions of natural recharge show that most of the mountain-front and bedrock recharge occurs in the Santa Clara River Valley subareas, most of the streamflow recharge occurs in the Piru and Fillmore subareas, and most of the valley-floor infiltration occurs in the Santa Clara subareas (fig. 25D). Simulated natural recharge and streamflow infiltration were 21 and 25 percent, respectively, of the total pumpage for 1984–93. The model simulated 54,400 acre-ft/yr of artificial recharge; 51,000 acre-ft/yr of irrigation return flow; and 9,000 acre-ft/yr of treated sewage effluent. About 93 percent of the total distribution of artificial recharge occurs in the Oxnard Plain Forebay and 7 percent occurs in the Piru subarea. Simulated irrigation return flow is greatest in the Oxnard Plain, and infiltration of treated sewage effluent is greatest in the Pleasant Valley subareas.
A comparison of the 1984–93 conditions with predevelopment conditions indicated a large increase in the rate of valley-floor recharge and streamflow recharge (fig. 25C,D). The largest increases were in the Santa Clara River Valley subareas. The net streamflow recharge increased from 14,300 acre-ft/yr to 62,200 acre-ft/yr.

Analysis of Ground-Water Flow 121
Coastal Flow
Net coastal landward flow occurred in both aquifer systems throughout the Oxnard Plain subareas during parts of the 1984–93 period (fig. 22A,B). The total simulated net seaward flow in the upper-aquifer system (layer 1) was 9,500 acre-ft, which is considerably less than the seaward flow simulated for steady-state conditions. Flow was seaward in 1984 but reversed to landward in 1985; landward flow increased during the 1987–91 dry-year period (fig. 25B). By the end of 1993, the measured and simulated water levels had recovered and were above the equivalent freshwater head in the upper-aquifer system of the submarine outcrops (fig. 25A) resulting in seaward flow and artesian conditions and flowing wells in parts of the Oxnard Plain subareas. This change in coastal flow in the upper-aquifer system is supported by reduced chloride concentrations and reduced EM conductivities in many of the coastal monitoring wells (figure A5.2 in Appendix 5).
The simulated total coastal landward flow for 1984–93 was 64,200 acre-ft; the landward flow was due to declining water levels in the lower-aquifer system (fig. 25A,B). This sustained coastal landward flow (fig. 25B) is supported by increased chloride concentrations and increased EM conductivities in many of the coastal monitoring wells (figure A5.2 in Appendix 5).
The model simulations indicate that total coastal landward flow occurs during seasonal and climatic cycles and during periods of long-term storage depletion (fig. 25B). Simulated coastal landward flow began in the lower-aquifer system of the South Oxnard Plain subarea in about 1928, in the Northwest Oxnard Plain subarea in about 1930, and in the Mound subarea as early as 1919. Coastal flow was landward in the upper-aquifer system during the droughts of the 1930s and from the mid-1940s through the last drought (1987–91), and was seaward during the intervening wet periods. Coastal flow was consistently landward in the lower-aquifer system of the south Oxnard Plain subarea for the entire period 1928–94. The general timing of the simulated coastal landward flow is consistent with observed increases in salinity, which were due to
seawater intrusion into the water-supply wells. The earliest documented seawater intrusion in the upper aquifer occurred in the Oxnard Plain subareas during 1930–40 followed by increases in seawater intrusion between 1946 and the late 1970s.
Of the total simulated coastal landward flow, about 54 percent entered the South Oxnard Plain subarea, most of which entered the lower-aquifer system (fig. 25D). The mean net coastal seaward flow was about 950 acre-ft/yr for the upper-aquifer system and the mean net coastal landward flow (seawater intrusion) was about 6,420 acre-ft/yr for the lower-aquifer system (table 6). Seawater intrusion, however, has a cumulative effect, contributing to long-term overdraft and loss of storage for potable water. The long-term simulation of coastal landward flow indicates that seawater intrusion started as early as the summer of 1927; by 1932, about 1,957 acre-ft/yr was intruding the offshore parts of the upper-aquifer system. This is consistent with the early accounts of increased salinity in some of the shallow coastal wells. Model simulations show that the total coastal landward flow during 1984–93 was about 12 percent of the 526,600 acre-ft of total coastal landward flow (seawater intrusion) simulated for the summer of 1927 through the winter of 1993.
Flow Between Subareas and Aquifer Systems
The direction and mean flow for the simulated historical period 1984–93 are shown in figure 25A. Faults are an important factor in the distribution of ground-water and water levels in the lower-aquifer system and, to a lesser extent, in the upper-aquifer system. For the upper-aquifer system, ground-water underflow to the Oxnard Plain subareas averaged about 4,200 acre-ft/yr of inflow from the Santa Paula subarea and about 2,770 acre-ft/yr of outflow into the South Pleasant Valley subarea (fig. 25A). For the lower-aquifer system, the simulated flow averaged less than 140 acre-ft/yr out of the Oxnard Plain Forebay toward the Santa Paula subarea and about 3,000 acre-ft/yr into the region of lower water levels in the South Pleasant Valley subarea (fig. 25A).

122 Simulation of Ground-Water/Surface-Water Flow in the Santa Clara–Calleguas Ground-Water Basin, Ventura County, California
Tabl
e 6.
Sum
mar
y of
sim
ulat
ed g
roun
d−w
ater
flow
com
pone
nts
for t
he S
anta
Cla
ra–C
alle
guas
Bas
in, V
entu
ra C
ount
y, C
alifo
rnia
[All
flow
s in
acr
e−fe
et p
er y
ear.
The
pre
cisi
on o
f th
e nu
mbe
rs d
o no
t refl
ect t
he v
aria
ble
accu
racy
of
the
estim
ates
. FG
MA
, Fox
Can
yon
Gro
und−
wat
er M
anag
emen
t Age
ncy]
Sim
ulat
ion
case
and
tim
e pe
riod
1
1) T
otal−m
ean
nons
trea
mflo
w
rech
arge
2
2) M
ean
spre
adin
g gr
ound
s re
char
ge3
3) L
as P
osas
rech
arge
4
Mea
n gr
ound−w
ater
in
flow
to O
xnar
d Pl
ain
from
adj
acen
t su
bbas
ins5 :
1) S
anta
Cla
raRi
ver V
alle
y2)
Wes
t Las
Pos
as3)
Sou
th P
leas
ant
Valle
y
Mea
n−ne
t st
ream
flow
re
char
ge6
Mea
nco
asta
l flow
7
1) L
ayer
12)
Lay
er 2
Mea
n ve
rtic
al fl
ow
betw
een
aqui
fer
syst
ems
in
Oxn
ard
Plai
n8
Mea
n ev
apot
rans
-pi
ratio
n
Mea
n pu
mpa
ge9
1) F
GM
A a
rea
2) O
utsi
de F
GM
A a
rea
3) T
otal
Bas
in a
rea
Mea
n flo
w fr
om
inte
rbed
st
orag
e (s
ubsi
denc
e)
Mea
nch
ange
in a
quife
rst
orag
e10
Pred
evel
opm
ent
(tim
e −av
erag
ed)
1) 1
9,40
02)
03)
0
1) 6
,900
2) 2
,180
3) 1
,720
14,3
001)
−16
,000
2) −
2,90
045
014
,800
1) 0
2) 0
3) 0
00
Rep
orte
d
pum
page
pe
riod
: 19
84−1
993
1) 1
66,0
002)
54,
400
3) 0
1) 5
,770
2) 1
,260
3) 5
,720
62,2
001)
−95
02)
6,4
2022
,700
1,06
01)
146
,000
2) 1
01,0
003)
247
,000
4,10
014
,260
Bas
e −C
ase
1:
1994−2
017
1) 1
79,0
002)
63,
500
3) 3
,750
1) 2
,900
2) −
803)
−2,
740
58,7
001)
−3,
970
2) 4
,770
20,9
0095
01)
141
,000
2) 1
00,0
003)
241
,000
1,50
02,
700
Bas
e−C
ase
2:
1994−2
017
1) 1
79,0
002)
63,
500
3) 3
,750
1) 2
,540
2) 2
03)
−1,
840
56,0
001)
−5,
750
2) 3
,420
18,6
001,
030
1) 1
29,0
002)
100
,000
3) 2
29,0
00
420
−2,4
00
Bas
e−C
ase
3:
1994−2
017
1) 1
79,0
002)
63,
500
3) 3
,750
1) 2
,000
2) 3
03)
−1,
360
50,3
001)
−9,
430
2) 2
,130
17,4
001,
180
1) 1
13,6
002)
99,
700
3) 2
13,0
00
−330
−7,0
00
Bas
e−C
ase
4:
1994−2
037
1) 1
59,0
002)
55,
300
3) 3
,750
1) 3
,490
2) −
110
3) −
2,50
0
80,8
001)
−2,
680
2) 4
,950
20,
500
2,03
01)
140
,000
2) 1
00,0
003)
240
,000
1,07
0−1
,750
Pote
ntia
l−C
ase
1:
1994
−201
71)
194
,000
2) 6
3,50
03)
3,7
50
1) 3
,500
2)
−10
03)
−2,
950
60,6
001)
−8,
000
2) 4
,900
20,7
0090
01)
140
,000
2) 1
01,0
003)
241
,000
1,50
095
0
Pote
ntia
l−C
ase
2:
1994
−201
71)
190
,000
2) 6
3,50
03)
3,7
50
1) 2
,900
2) 8
03)
−2,
740
58,6
001)
−3,
970
2) 4
,770
20,9
0095
01)
141
,000
2) 1
00,0
003)
241
,000
1,50
0−8
,500
Pote
ntia
l−C
ase
3:
1994
−201
71)
179
,000
2) 6
3,50
03)
3,7
50
1)
2,54
02)
290
3) −
4,58
0
56,1
001)
−7,
330
2) 2
,470
17,8
001,
030
1) 1
29,0
002)
100
,000
3) 2
29,0
00
790
−420

Analysis of Ground-Water Flow 123
Pote
ntia
l−C
ase
4:
1994
−201
71)
179
,000
2) 6
3,50
03)
3,7
50
1) 2
,910
2) 8
03)
−2,
880
58,7
001)
−3,
640
2) 4
,480
19,6
0095
01)
141
,000
2) 1
00,0
003)
241
,000
1,36
0−4
0
Pote
ntia
l−C
ase
5:
1994
−201
71)
179
,000
(2)
63,5
003)
3,7
50
1) 3
,000
2) 1
103)
−3,
380
58,7
001)
−2,
880
2) 3
,590
14,8
0095
01)
141
,000
2) 1
00,0
003)
241
,000
1,25
03,
130
Pote
ntia
l−C
ase
6:
1994
−201
71)
179
,000
2) 6
3,50
03)
3,7
50
1) 2
,910
2) 8
03)
−3,
260
58,5
001)
−2,
220
2) 3
,180
16,6
0095
01)
141
,000
2) 1
00,0
003)
241
,000
1,27
02,
800
Pote
ntia
l−C
ase
7:
1994
−201
71)
179
,000
2) 6
3,50
03)
3,7
50
1) 2
,860
2) 1
103)
−1,
600
57,9
001)
−3,
950
2) 4
,040
18,1
0097
01)
141
,000
2) 1
00,0
003)
241
,000
1,07
04,
650
1 A
ll tim
e pe
riod
s ar
e in
cal
enda
r ye
ars
and
all s
imul
ated
mea
n flo
ws
are
in a
cre-
feet
per
yea
r.2
Rec
harg
e in
clud
es m
ount
ain-
fron
t rec
harg
e, v
alle
y-flo
or in
filtr
atio
n, b
edro
ck in
filtr
atio
n, ir
riga
tion
retu
rnflo
w, s
ewag
e ef
fluen
t, an
d ar
tifici
al r
echa
rge.
3 Sp
read
ing-
grou
nds
rech
arge
is th
e su
m o
f in
filtr
atio
n of
sur
face
spr
eadi
ng a
t the
Pir
u, E
l Rio
, and
Sat
icoy
spr
eadi
ng g
roun
ds o
pera
ted
by U
nite
d W
ater
Con
serv
atio
n D
istr
ict.
4 N
umbe
r is
the
addi
tiona
l pot
entia
l rec
harg
e at
the
aqui
fer
stor
age
and
reco
very
fac
ility
pla
nned
for
ope
ratio
n by
Cal
legu
as M
unic
ipal
Wat
er D
istr
ict i
n th
e E
ast L
as P
osas
sub
area
in th
e lo
wer
-aq
uife
r sy
stem
.5
Sim
ulat
ed m
ean
unde
rflow
to th
e O
xnar
d Pl
ain
suba
reas
with
top
num
ber
net u
nder
flow
fro
m S
anta
Cla
ra V
alle
y su
bare
as, m
iddl
e nu
mbe
r is
mea
n un
derfl
ow f
rom
Wes
t Las
Pos
as s
ubar
ea, a
nd
botto
m n
umbe
r is
mea
n un
derfl
ow f
rom
the
Sout
h Pl
easa
nt V
alle
y su
bare
a.6
Tota
l net
mea
n st
ream
flow
loss
to a
ll si
mul
ated
riv
ers
and
trib
utar
ies.
7 M
ean
coas
tal fl
ow is
the
tota
l flow
bet
wee
n al
l coa
stal
sub
area
s an
d th
e ad
jace
nt o
ffsh
ore
suba
reas
and
is u
sed
in th
is s
tudy
as
a su
rrog
ate
for
seaw
ater
intr
usio
n fo
r th
e to
tal t
ime
peri
od s
imul
ated
. A
pos
itive
num
ber
is c
oast
al la
ndw
ard
flow
(se
awat
er in
trus
ion)
fro
m o
ffsh
ore
suba
reas
and
a n
egat
ive
num
ber
is c
oast
al s
eaw
ard
flow
to o
ffsh
ore
suba
reas
.8
Tota
l net
mea
n flo
w f
rom
upp
er-a
quif
er s
yste
m (
mod
el la
yer
1) to
low
er-a
quif
er s
yste
m. P
ositi
ve n
umbe
r is
dow
nwar
d flo
w a
nd n
egat
ive
num
ber
is u
pwar
d flo
w.
9 To
p nu
mbe
r in
dica
tes
sim
ulat
ed m
ean
pum
page
for
FG
MA
are
a, m
iddl
e nu
mbe
r is
pum
page
out
side
of
GM
A a
reas
, and
bot
tom
num
ber
is p
umpa
ge in
tota
l San
ta C
lara−C
alle
guas
Bas
in.
10 M
ean
chan
ge in
sto
rage
is th
e to
tal f
or th
e up
per-
and
the
low
er-a
quif
er s
yste
m d
ivid
ed b
y th
e nu
mbe
r of
yea
rs f
or th
e pe
riod
of
sim
ulat
ion
for
the
entir
e m
odel
. Pos
itive
num
ber
indi
cate
s w
ater
co
min
g fr
om g
roun
d-w
ater
sto
rage
and
neg
ativ
e nu
mbe
r in
dica
tes
wat
er r
etur
ning
to g
roun
d-w
ater
sto
rage
.
Sim
ulat
ion
case
and
tim
e pe
riod
1
1) T
otal−m
ean
nons
trea
mflo
w
rech
arge
2
2) M
ean
spre
adin
g gr
ound
s re
char
ge3
3) L
as P
osas
rech
arge
4
Mea
n gr
ound−w
ater
in
flow
to O
xnar
d Pl
ain
from
adj
acen
t su
bbas
ins5 :
1) S
anta
Cla
raRi
ver V
alle
y2)
Wes
t Las
Pos
as3)
Sou
th P
leas
ant
Valle
y
Mea
n−ne
t st
ream
flow
re
char
ge6
Mea
nco
asta
l flow
7
1) L
ayer
12)
Lay
er 2
Mea
n ve
rtic
al fl
ow
betw
een
aqui
fer
syst
ems
in
Oxn
ard
Plai
n8
Mea
n ev
apot
rans
-pi
ratio
n
Mea
n pu
mpa
ge9
1) F
GM
A a
rea
2) O
utsi
de F
GM
A a
rea
3) T
otal
Bas
in a
rea
Mea
n flo
w fr
om
inte
rbed
st
orag
e (s
ubsi
denc
e)
Mea
nch
ange
in a
quife
rst
orag
e10
Tabl
e 6.
Sum
mar
y of
sim
ulat
ed g
roun
d−w
ater
flow
com
pone
nts
for t
he S
anta
Cla
ra–C
alle
guas
Bas
in, V
entu
ra C
ount
y, C
alifo
rnia

124 Simulation of Ground-Water/Surface-Water Flow in the Santa Clara–Calleguas Ground-Water Basin, Ventura County, California
The simulated flow across the Oak Ridge and McGrath Faults from the Mound and Santa Paula to the Oxnard Plain subareas for 1984–93 was about 5,800 acre-ft/yr, of which about 73 percent flowed to the upper-aquifer system, in the narrow swath of the Santa Clara River flood plain where the fault was not simulated. Almost no flow occurred across the Oak Ridge and McGrath Faults into the lower-aquifer system. The simulated mean flow across the Country Club Fault from the Santa Paula subarea to the Mound subarea was about 4,200 acre-ft/yr, resulting in a net inflow to the Mound subarea of about 2,500 acre-ft/yr. Three other fault-related flow barriers between the subareas control underflow: the Central Las Posas Fault, the extension of the Springville Fault and the Somis Fault, and the Camarillo Fault. The Central Las Posas Fault controls flow between the East and West Las Posas Valley subarea; the simulated mean flow across this fault toward the West Las Posas Valley subarea was 920 acre-ft/yr. The extension of the Springville Fault and the Somis Fault control flow between the East Las Posas Valley and North Pleasant Valley subareas; the simulated mean flow toward North Pleasant Valley subarea was 1,500 acre-ft/yr in the lower-aquifer system and about 196 acre-ft/yr in the upper-aquifer system. The Camarillo Fault controls flow between the North and South Pleasant Valley subareas; the simulated mean flow across this fault from the South to the North Pleasant Valley subareas was 3,600 acre-ft/yr (figs. 12 and 16). Coastal and offshore faults, such as the Bailey Fault and the extension of the Sycamore Fault, are effective barriers that have contributed to water-level declines of more than 100 ft below sea level at the coast and prevent seawater intrusion into the lower-aquifer system in the southern Oxnard Plain near Mugu submarine canyon (fig. 16). The Hueneme Canyon, the Old Hueneme Canyon, and the South Hueneme Canyon Faults reduce flow along the southern exposures of the submarine canyons and retard the northwestern propagation of water-level declines caused by pumping in the lower-aquifer system of the South Oxnard Plain subarea (figs. 16 and 25A).
The simulated downward flow from the upper- to the lower-aquifer system during 1984–93 for groups of subareas (fig. 25D) averaged about 67,000 acre-ft/yr.
The downward flow was greatest in the Las Posas Valley (34 percent, or 22,800 acre-ft/yr), Oxnard Plain (34 percent, or 22,700 acre-ft/yr), and Pleasant Valley (22 percent, or 14,700 acre-ft/yr) subareas (fig. 25D). The simulated average downward flow in the Oxnard Plain is similar to previous estimates (Mann and Associates, 1959; California Department of Water Resources, 1971). The downward flow between aquifer systems increased during the dry years owing to increases in water-level differences (fig. 15). Water-level differences between the upper- and lower-aquifer systems were more than 100 ft in the East and West Las Posas Valley and the Pleasant Valley subareas, more than 30 ft in the Oxnard Plain subareas, and more than 10 ft in the Santa Clara River Valley subareas.
Land Subsidence
Simulation results indicate that the total quantity of water derived from subsidence during 1984–93 was 35,700 acre-ft, for an average net rate of subsidence of 3,570 acre-ft/yr. The largest contributions were from the Oxnard Plain (47 percent) and the Las Posas Valley (34 percent) subareas; smaller contributions were from the Mound subarea (10 percent), the Pleasant Valley subareas (7 percent), and the Santa Clara River Valley subareas (2 percent) (fig. 25D). Water derived from compaction is about 20 percent of the mean annual overdraft, which is comparable to previous regional estimates (Hanson and Benedict, 1994).
Simulation results for the 1984–96 period show that 96 percent of the water was derived from compaction of the lower-aquifer system. This may reflect, in part, the additional development of ground water from the lower-aquifer system and, in part, the moratorium of the 1980s on new wells in the upper-aquifer system throughout the Oxnard Plain subareas. Collectively, these resulted in increased water-level declines in the lower-aquifer system during the 1987–91 drought. Thus, overdraft appears to have a significant effect on subsidence in the coastal regional-aquifer systems. Overdraft and land subsidence will continue during dry-year periods when water levels drop below previous maximum declines.

Analysis of Ground-Water Flow 125
Projected Future Ground-Water Flow for Existing Management Plan
The model was used to assess future ground-water conditions based on the implementation of proposed water-supply projects included in the existing management plan for the Santa Clara–Calleguas ground-water basin. These plans assume the current water demands plus the addition of proposed water-supply projects. Testing of projects included assessing long-term conditions of the ground and surface water through periods of climatic extremes; for example, the ability to recharge aquifers during wet periods and to arrest seawater intrusion and subsidence during dry periods.
Using the model to cycle the average water demand through a wet and dry period, simulated natural and artificial recharge were varied to reflect the changing and extreme conditions typical of the southern California coast. Two approaches were used to estimate future recharge, streamflow, and climate-related water-demand: a 24-year projection (1994–2017) using historical estimates of recharge and measured streamflow, and a 44-year spectral projection (1994–2037) of future precipitation.
The primary approach used to project future ground-water flow was to simulate the 24-year period 1994–2017. The historical inflow conditions for 1970–93 were used for these simulations; this period cycles through a combination of 13 dry and 11 wet years (fig. 2A). This record was used to simulate the extremes in recharge, streamflow, and pumping demand that may be typical of future interdecadal climate variation. The 1970–93 data series, although not a correlated projection of probable future conditions, does capture the complete variation of recent climate, recharge, and streamflow and the beginning of regulated streamflow (1970) in the Santa Clara–Calleguas Basin.
The alternative approach to project future ground-water flow was to simulate recharge, streamflow, and climate-related demand based on spectral estimates of future precipitation. For this approach, precipitation was estimated for the next 50 years (see Appendix 3 for a description of this approach). The first 44 years, 1994–2037, represent a total of 21 wet years and 23 dry years. The
precipitation estimates are an autocorrelated series of probable future conditions that include three climatic cycles of intradecadal (2.9 and 5.3 yr) to decadal (22 yr) length; they represent 60 percent of the variation of typical changes in rainfall. The 44-year period approximately represents two decadal cycles of climate variability. The advantages of the spectral approach are a longer period of projection and a seamless transition from historical climatic and aquifer conditions to probable future conditions of supply and demand (Hanson and Dettinger, 1996). The spectral approach uses a moving autocorrelation with historical rainfall data that closely approximates rainfall for the years 1994–96 (figure A3.3 in Appendix 3). The autocorrelation with historical data provides a seamless transition with high correlation for about the first 7 years into the future and decreasing correlation further into the future.
The simulations for both projection approaches included adjusting average ground-water pumpage on a well-by-well basis for the period of reported pumpage (1984–93), estimating irrigation return flow from the 1969 land-use distribution, and varying recharge and streamflow climatically. Average pumpage and irrigation return flow were adjusted climatically using ratios of wet or dry pumpage to average historical reported pumpage for each subarea. The following six proposed water-supply projects (fig. 26B) were included in assessing the potential for continued overdraft conditions:
(1) Cessation of pumping of well in the city of Oxnard from July 1995 through December 1996, and a restart of pumping in January 1997;
(2) UWCD surface-water deliveries of 900 acre-ft/yr to Del Norte in lieu of pumpage from the upper-aquifer system starting in January 1997;
(3) CMWD aquifer storage and recovery (ASR) project in the East Las Posas Valley subarea from January 1997 to December 2001, using a proposed injection rate of 5,000 acre-ft/yr for wet years, 1,250 acre-ft/yr for average years, and a pump-back recovery of 2,500 acre-ft/y for dry years. In 2002, the proposed injection rate was increased to 10,000 acre-ft/yr for wet years; 2,500 acre-ft/yr for average years; and a pump-back recovery of stored water of 5,000 acre-ft/yr for dry years;

126 Simulation of Ground-Water/Surface-Water Flow in the Santa Clara–Calleguas Ground-Water Basin, Ventura County, California
(4) Increased artificial recharge by the UWCD at El Rio and Saticoy based on the projected increased capacity of the Freeman Diversion (Steve Bachman, United Water Conservation District, written commun., 1996). With the addition of the Rose pit near Saticoy, the projected artificial recharge ranges from 0 to 127,900 acre-ft/yr. The spectral approach used estimates ranging from 6,000 to 92,000 acre-ft/yr;
(5) Reduced average pumpage from the lower-aquifer system by the city of Port Hueneme, the Channel Islands Beach Community Services District, and the U.S. Navy base at Port Hueneme for a combined reduction of as much as 1,000 acre-ft/yr in lieu of new deliveries of imported water from the State water project starting in January 1997;
(6) Reduced pumpage by the PVCWD in lieu of 5,000 acre-ft/yr of new surface-water deliveries from the city of Thousand Oaks Hill Canyon wastewater-treatment plant starting in January 1998.
Four simulations, referred to as “base-cases 1–4,” were used to project future ground-water conditions. Base-case 1 represents the adjusted 1984–93 mean annual pumpage for the six proposed water-supply projects listed above for the 24-year period (1994–2017). Two additional base-case scenarios were simulated to address the existing FGMA ordinance 5.5 (Fox Canyon Groundwater Management Agency, 1997) of a rolling cut back in pumpage (base-case 2) and the step cut-back reduction of pumping which began in the early to middle 1990s (base-case 3). These two cut-back simulations are based on average pumpage throughout the entire Santa Clara–Calleguas Basin for 1984–89. These two base-case projections used the 24-year period of projection and the same historical period of recharge, streamflow, and climate-related demand conditions. Base-case 4 is the simulation of future ground-water flow for the extended 44-year period; this simulation is based on the spectral estimate of precipitation and uses the same adjusted mean pumpage for 1984–93 that was used for base-case 1.
The mean historical pumpage for 1984–93 for the six hypothetical projects yielded a mean adjusted pumpage of about 241,000 acre-ft/yr for base-case 1 for the 24-year period and 240,000 acre-ft/yr for base-case 4 for the 44-year period (table 6). This represents about 59 percent (141,000 acre-ft/yr) of the total pumpage in the FGMA area and 41 percent (100,000 acre-ft/yr) in non-FGMA areas for
base-case 1 (table 6). The total adjusted mean pumpage for base-case 1 for the FGMA area was about 6,000 acre-ft/yr less than the total mean pumpage for the FGMA area for the 1984–93 period.
Simulation of the rolling cut-back (base-case 2) scenario shows the potential effect of the FGMA Ordinance 5.5 (Fox Canyon Groundwater Management Agency, 1997) and represents the 25-percent total cut back in pumpage as a 5-percent rolling cut back every 5 years through the 2010. This is equivalent to a 5-percent cut back in average pumpage for 1994, a 10-percent cut back in average pumpage for the years 1995–99, a 15-percent cut back in average pumpage for the years 2000–2004, a 20-percent cut back in average pumpage for the years 2005–2009, and a 25-percent cut back in average pumpage for the years 2010–2017. Total average pumpage with climatic variation in demand was about 229,000 acre-ft/yr, of which 56 percent is for the FGMA area of the basin and 44 percent is for the non-FGMA areas of the basin (table 6). The total adjusted average pumpage for base-case 2 is about 18,000 acre-ft/yr less than that for the 1984–93 period for the entire modeled area. Most of the reduction was in the FGMA area and represents an average 12-percent reduction in pumpage in the FGMA area for the 24-year period.
The simulation of the step cut-back (base-case 3) scenario represents the potential effect of continuing the apparent reduction in pumping that occurred in the mid-1990s. The reduction is based on the estimated total pumpage of about 100,000 acre-ft for 1996 for the FGMA area, which represents a 37-percent cut back from the average pumpage for 1984–89. This 37-percent reduction was applied uniformly to all pumpage within the FGMA boundaries for the entire projection period; it was not applied to pumpage in the Piru, Fillmore, Santa Paula, and Mound subareas or in the eastern part of the Santa Rosa Valley subarea, areas that are outside the FGMA area. The projected climatic variations increased overall demands on pumpage and added an average additional 13,600 acre-ft/yr to the reduced pumpage rate in the FGMA area. Total mean pumpage for base-case 3 is about 213,000 acre-ft/yr, of which about 53 percent is for the FGMA area of the basin and 47 percent is for non-FGMA area (table 6). Total mean pumpage is about 34,000 acre-ft/yr less than that for the 1984–93 period for the entire modeled area.
Analysis of Ground-Water Flow 127
Summary of Projected Ground-Water Conditions
Differences in ground-water levels and changes in ground-water storage between 1994 and 2017, the end of the projected period, are shown in figure 27 for the four base-case simulations. The water-level-change maps (fig. 27A–D) indicate a continued decline in the Oxnard Plain subarea, the Santa Clara River Valley subareas, and the East and West Las Posas Valley subareas for base-case 1; the declines are as much as 67 ft in the upper aquifer system (fig. 27A). The rolling cut-back (base-case 2) and the step cut-back (base-case 3) projections progressively show decreased declines and increased recoveries (fig. 27B,C). Total ground-water storage change ranges from a withdrawal from storage of about 65,200 acre-ft (2,700 acre-ft/yr) for base-case 1 to a return of water to storage of about 168,100 acre-ft (7,000 acre-ft/yr) for base-case 3 (table 6). The large withdrawals of water from storage in the Oxnard Plain subareas were coincident with the withdrawals in the Oxnard Plain Forebay and the Northeast Oxnard Plain subareas. The changes in storage during the projection period were as much as 60,000 acre-ft during dry-year periods in the Oxnard Plain Forebay and Fillmore subareas (fig. 27E). In the step cut-back and rolling cut-back simulations, the storage changes were reduced for the Oxnard Plain Forebay but were comparable for the Piru, Fillmore, and Santa Paula subareas (fig. 27A,B,C,E). The cut backs did not affect the magnitude of pumpage in these Santa Clara River Valley subareas because they were outside the FGMA area (fig. 26). The step cut-back projection (base-case 3) resulted in the largest reduction of coastal landward flow (seawater intrusion) in the lower-aquifer system and the largest increase of coastal seaward flow in the upper-aquifer system because the pumpage reductions were applied for the entire projection period (fig. 27E). This is illustrated by the hydrographs of supply well 1N/22W-3F4 for the city of Oxnard which show that the simulated water levels for the step cut-back projection (base-case 3) are always higher than those for the rolling cut-back projection (base-case 2) (fig. 27F). The higher hydraulic head near the coast results in less coastal landward flow (seawater intrusion).
A comparison of model results between the spectral projection for base-case 4 and the historical hydrology projection for base-case 1 indicates differences in the amount of water-level declines, changes in storage, cumulative coastal landward flow
(seawater intrusion), and the timing of wet and dry periods. The spectral projection for base-case 4 indicates that water-level declines and losses in storage were comparable to those of base-case 1 at the end of the 44-year spectral projection period 1994–2037 (fig. 27A, D, and E). However, the major cycles of water-level declines and storage losses were opposite in phase during 2017 and occurred earlier in the projection period of base-case 4 (fig. 27A,D). For example, the difference in water levels in supply well 1N/22W-3F4 for the city of Oxnard was as much as 80 ft between base-cases 1 and 4 during periods when the projections were out of phase (fig. 27F). Projections of base-case 4 show significantly more coastal landward flow (seawater intrusion) by 2017 (fig. 27D) than was projected in base-case 1 (fig. 27A). The comparison of base-cases 1 and 4 shows the importance of the range of possible wet and dry periods and the sequence of events that may affect the state of the system and the management of the water resources.
Recharge
The historical inflow conditions for the base-case 1–3 projections are similar and consist of recharge of about 179,000 acre-ft/yr, of which about 63,500 acre-ft/yr was artificial recharge from the UWCD spreading grounds in Piru subarea and in the Oxnard Plain Forebay (table 6). Recharge of diverted streamflow from the spreading grounds was about 9,000 acre-ft/yr more than the average historical recharge for 1984–93; the projected increase in recharge was due to the increased capacity of the Freeman Diversion. This increase in recharge, however, did not stop water-level declines throughout most of the Santa Clara River Valley and the Oxnard Plain subareas (fig. 27A).
The simulation of the proposed CMWD ASR project (base-case 3) in the East Las Posas Valley subarea for the injection of 3,750 acre-ft/yr added about 90,000 acre-ft of net imported water to ground-water storage in the lower-aquifer system (table 6) during 1994–2017. An additional 25,000 acre-ft of injected water was pumped back during dry years or years with average precipitation. Water-level rises relative to 1993 simulated conditions were more than 30 ft in most of the lower-aquifer system for all base-case projections (fig. 27A–D). Water-level rises in the lower-aquifer system reduced downward vertical leakage, which contributed to water-level rises in the upper-aquifer system for all the base-case projections.

128 Simulation of Ground-Water/Surface-Water Flow in the Santa Clara–Calleguas Ground-Water Basin, Ventura County, California
Figure 27. Simulated differences in ground-water levels from 1993 to 2017 for proposed water-supply projects in the existing management plan for the Santa Clara–Calleguas ground-water basin, Ventura County, California. A, Historical reported pumpage averaged over the period 1984–1993 and estimated or measured historical recharge, streamflow, and diversion data (base-case 1).
Pacific Ocean
Pacific Ocean
118°45'
34°22'30"
R22W R18W
119°
0
0
10 MILES
10 KILOMETERS
T2N
T4N
34°07'30"
119°15'
118°45'
34°22'30"
119°
T2N
T4N
34°07'30"
119°15'
0
0
10 MILES
10 KILOMETERS
4
3
20
19
18
17
7
5
1
34
33
32
31
8
2
30
28
27 26
13
1211
10
96
29
16
14
25
2423
22
21
15
Cal
legu
asCr
eek
Santa Clara River
LakePiru
Cal
legu
asCr
eek
Santa Clara River
LakePiru
100100
7676
4,97
24,
972
1,116
1,116
1,0611,061
2,723
2,723
1,5191,5191,9251,925
168168
573573
532532
791791
1,9301,930
3,06
53,
065
3,5253,525
2,847
2,847
1,13
91,
139
1,6301,630
450450
622622
14,81314,813
16,7
9816
,798
2121
106106
A Base-case 1
EXPLANATION
River and selected streams
Hydrologic Unit boundary Subarea number –See figure 17B for subarea names
Model-grid boundary offlow region and subareas
Difference in water-level altitude (∆h)from 1993, in feet
Total range -66 to 67
Difference in water-level altitude (∆h)from 1993, in feet
Total range -258 to 84
-66 ≤ ∆h ≤ -30
-30 < ∆h ≤ 0
0 < ∆h ≤ 5
5 < ∆h ≤ 15
15 < ∆h ≤ 67
-258 ≤ ∆h ≤ -30
-30 < ∆h ≤ 0
0 < ∆h ≤ 5
5 < ∆h ≤ 30
30 < ∆h ≤ 84
R22W R18W
949949
10
22
Upper-AquiferSystem
Lower-AquiferSystem
Upper-aquifer systemLower-aquifer system
Santa Clara-Calleguas ground-water basin
Outside Santa Clara-Calleguas ground-water basin
Shallow alluvium
Shallow alluvium and unconsolidated deposits
Consolidated and unconsolidated deposits
Rise
Decline
Rise
Decline
Mean simulated ground-waterunderflow and coastal flow –in acre-feet per year

Analysis of Ground-Water Flow 129
Figure 27—Continued. B, Rolling cut back in pumpage and estimated or measured historical recharge, streamflow, and diversion data (base-case 2)
Pacific Ocean
Pacific Ocean
118°45'
34°22'30"
R22W R18W
119°
0
0
10 MILES
10 KILOMETERS
T2N
T4N
34°07'30"
119°15'
118°45'
34°22'30"
119°
T2N
T4N
34°07'30"
119°15'
0
0
10 MILES
10 KILOMETERS
4
3
20
19
18
17
7
5
1
34
33
32
31
8
2
30
28
27 26
13
1211
10
96
29
16
14
25
2423
22
21
15
Cal
legu
asCr
eek
Santa Clara River
LakePiru
Cal
legu
asCr
eek
Santa Clara River
LakePiru
2,72
12,
721
1,062
1,062
5,03
75,
037
358358 633633
429429
2727
1,1841,184
1,238
1,238
2,193
2,193
178178
672672
16,77916,779
2,9282,9282,7362,736
939939
15,47
915
,479
3,3153,315
1,72
91,
729
1,3731,373
429429
409409
1521521717
B
EXPLANATION
Difference in water-level altitude (∆h)from 1993, in feet
Total range -77 to 62
Difference in water-level altitude (∆h)from 1993, in feet
Total range -272 to 74
-77 ≤ ∆h ≤ -30
-30 < ∆h ≤ 0
0 < ∆h ≤ 5
5 < ∆h ≤ 15
15 < ∆h ≤ 62
-272 ≤ ∆h ≤ -30
-30 < ∆h ≤ 0
0 < ∆h ≤ 5
5 < ∆h ≤ 30
30 < ∆h ≤ 74
R22W R18W
River and selected streams
Hydrologic Unit boundary
Model-grid boundary offlow region and subareas
Base-case 2
Upper-AquiferSystem
Lower-AquiferSystem
Santa Clara-Calleguas ground-water basin
Outside Santa Clara-Calleguas ground-water basin
Shallow alluvium
Shallow alluvium and unconsolidated deposits
Consolidated and unconsolidated deposits
Rise
Decline
Rise
Decline
Subarea number –See figure 17B for subarea names
949949
10
22 Upper-aquifer systemLower-aquifer system
Mean simulated ground-waterunderflow and coastal flow –in acre-feet per year

130 Simulation of Ground-Water/Surface-Water Flow in the Santa Clara–Calleguas Ground-Water Basin, Ventura County, California
Figure 27—Continued. C, Step cut-back reduction in pumpage and estimated or measured historical recharge, streamflow, and diversions data (base-case 3).
Pacific Ocean
Pacific Ocean
118°45'
34°22'30"
R22W R18W
119°
0
0
10 MILES
10 KILOMETERS
T2N
T4N
34°07'30"
119°15'
118°45'
34°22'30"
119°
T2N
T4N
34°07'30"
119°15'
0
0
10 MILES
10 KILOMETERS
4
3
20
19
18
17
7
5
1
34
33
32
31
8
2
30
28
27 26
13
1211
10
96
29
16
14
25
2423
22
21
15
Cal
legu
asCr
eek
Santa Clara River
LakePiru
Cal
legu
asCr
eek
Santa Clara River
LakePiru
2828
496496
1,648
1,648
188188
503
503 754754
357357
1,0571,057
1,15
91,
159
485485
4,61
84,
618
322322
329329
259259
1313
1,3091,309
3,946
3,946
2,18
42,
184
3,2273,227
15,47115,471
16,2
7116
,271
3,0383,038
4,8354,835
1,3011,301
C
EXPLANATION
Difference in water-level altitude (∆h)from 1993, in feet
Total range -94 to 55
Difference in water-level altitude (∆h)from 1993, in feet
Total range -283 to 65
-94 ≤ ∆h ≤ -30
-30 < ∆h ≤ 0
0 < ∆h ≤ 5
5 < ∆h ≤ 15
15 < ∆h ≤ 55
-283 ≤ ∆h ≤ -30
-30 < ∆h ≤ 0
0 < ∆h ≤ 5
5 < ∆h ≤ 30
30 < ∆h ≤ 65
R22W R18W
River and selected streams
Hydrologic Unit boundary
Model-grid boundary offlow region and subareas
Base-case 3
Upper-AquiferSystem
Lower-AquiferSystem
Santa Clara-Calleguas ground-water basin
Outside Santa Clara-Calleguas ground-water basin
Shallow alluvium
Shallow alluvium and unconsolidated deposits
Consolidated and unconsolidated deposits
Rise
Decline
Rise
Decline
Subarea number –See figure 17B for subarea names
949949
10
22 Upper-aquifer systemLower-aquifer system
Mean simulated ground-waterunderflow and coastal flow –in acre-feet per year

Analysis of Ground-Water Flow 131
Figure 27—Continued. D, Historical reported pumpage averaged over the period 1984–1993 and spectral-based estimates of recharge, streamflow, and diversions (base-case 4).
Pacific Ocean
Pacific Ocean
118°45'
34°22'30"
R22W R18W
119°
0
0
10 MILES
10 KILOMETERS
T2N
T4N
34°07'30"
119°15'
118°45'
34°22'30"
119°
T2N
T4N
34°07'30"
119°15'
0
0
10 MILES
10 KILOMETERS
4
3
20
19
18
17
7
5
1
34
33
32
31
8
2
30
28
27 26
13
1211
10
96
29
16
14
25
2423
22
21
15
Cal
legu
asCr
eek
Santa Clara River
LakePiru
Cal
legu
asCr
eek
Santa Clara River
LakePiru
741741
231231
1,4411,441
16,4
2916
,429
3,63
63,
636
475475
1,4281,428
7474
703703
14,38114,381
2,5482,548
3,251
3,251
142142
125125102102
2,0242,024
2222
2,8042,804
1,5491,549 877877
558558
4242
1,0231,023
4,96
04,
960
D
EXPLANATION
Base-case 4 Difference in water-level altitude (∆h)from 1993, in feet
Total range -66 to 67
Difference in water-level altitude (∆h)from 1993, in feet
Total range -258 to 84
-66 ≤ ∆h ≤ -30
-30 < ∆h ≤ 0
0 < ∆h ≤ 5
5 < ∆h ≤ 15
15 < ∆h ≤ 67
-258 ≤ ∆h ≤ -30
-30 < ∆h ≤ 0
0 < ∆h ≤ 5
5 < ∆h ≤ 30
30 < ∆h ≤ 84
R22W R18W
River and selected streams
Hydrologic Unit boundary
Model-grid boundary offlow region and subareas
Upper-AquiferSystem
Lower-AquiferSystem
Santa Clara-Calleguas ground-water basin
Outside Santa Clara-Calleguas ground-water basin
Shallow alluvium
Shallow alluvium and unconsolidated deposits
Consolidated and unconsolidated deposits
Rise
Decline
Rise
Decline
Subarea number –See figure 17B for subarea names
949949
10
22 Upper-aquifer systemLower-aquifer system
Mean simulated ground-waterunderflow and coastal flow –in acre-feet per year

132 Simulation of Ground-Water/Surface-Water Flow in the Santa Clara–Calleguas Ground-Water Basin, Ventura County, California
Figure 27—Continued. E, Cumulative changes in ground-water storage and ground-water flow for selected subareas during 1993–2037.
17 31
3 4
7 8
1 2
5 6
25 13
15
21
BASE-CASE 4
1 2
17 31
3 4
7 8
5 6
25 13
BASE-CASE 1
15
21
1 2
17 31
3 4
7 8
5 6
25 13
15
21
BASE-CASE 3
1 2
17 31
3 4
7 8
5 6
25 13
15
21
BASE-CASE 2
Subareanumber –
See figure 17Bfor subareanames
10
22
EXPLANATION
1990
2000
2010
2020
1990
2000
2010
2020
1990
2000
2010
2020
1990
2000
2010
2020
2030
2040
YEAR
50
100
0
-50
-100
50
100
0
-50
-100
0
50
-50
-100
-150 CUM
ULA
TIVE
FLO
WTO
OCE
AN
,IN
THO
USA
ND
SO
FA
CRE
FEET
E
0
50
-50
-100
-150
0
50
-50
-100
-150
0
50
-50
-100
-150
0
50
-50
-100
-150
0
50
-50
-100
-150
0
50
-50
-100
-150
0
50
-50
-100
-150
CUM
ULA
TIVE
STO
RAG
E,IN
THO
USA
ND
SO
FA
CRE
FEET
Upper-aquifersystem
Lower-aquifersystem
Upper-aquifersystem
Lower-aquifersystem

Analysis of Ground-Water Flow 133
Figure 27.—Continued. F, Water-level altitudes for the city of Oxnard public-supply well (1N/22W-3F4). Upper hydrograph generated from historical and spectral simulation data; lower hydrograph generated from spectral simulation data.
Measured water-level altitude
Simulated future water-level elevation for base-case 1Simulated future water-level elevation for base-case 2Simulated future water-level elevation for base-case 3Simulated future water-level elevation for base-case 4
1890 1915 1940 1965
YEAR
1990 2015 2040
Oxnard Water Supply Well (1N/22W-3F4)(Total depth = 232 feet,Screened depth = 141-232 feet below land surface)
Oxnard Water Supply Well (1N/22W-3F4)(Total depth = 232 feet,Screened depth = 141-232 feet below land surface)
Measured water-level altitudeFlow model historical water-level altitude
Flow model historical water-level altitude
Flow model future (1984-93 maximum average pumpage)Flow model future (1992-93 average pumpage)Flow model future (1989-90 average pumpage)Flow model future (1984-93 average pumpage)
-75
-25
Sealevel
25
75
Maximum historical water-leveldecline with subsidencein future conditionsbelow this water level
Equivalentfreshwaterhead in Oxnardaquifer at thesubmarine outcrop -seawater intrusionoccurs below this level
1890 1915 1940 1965 1990 2015 2040
WA
TER-
LEVE
LA
LTIT
UD
E,IN
FEET
AB
OVE
SEA
LEVE
L
Land surfaceat well
Land surfaceat well
-75
-25
Sealevel
25
75
Maximum historical water-leveldecline with subsidencein future conditionsbelow this water level
Equivalentfreshwaterhead in Oxnardaquifer at thesubmarine outcrop -seawater intrusionoccurs below this level
End of2017
End of2017
F

134 Simulation of Ground-Water/Surface-Water Flow in the Santa Clara–Calleguas Ground-Water Basin, Ventura County, California
The mean streamflow recharge rates were similar for the base-case 1–3 projections, ranging from about 59,000 acre-ft/yr for continued historical demand (base-case 1) to about 50,000 acre-ft/yr (a rate reduced by about 11,000 acre-ft/yr) for the step cut back of FGMA pumpage (base-case 3). Mean streamflow recharge for base-case 1 was about 3,000 acre-ft/yr less than that for the historical period 1984–93. Although the simulated water-level declines were reduced in the western part of the Santa Paula subarea for the rolling (base-case 2) and step cut-back projections (base-case 3) (fig. 27A,B,C), the streamflow recharge was similar to base-case 1 because most of the recharge occurred in the Piru and Fillmore subareas and the eastern part of the Santa Paula subarea (fig. 27A,B,C). The mean recharge for the spectral 44-year projection (base-case 4) was about 80,800 acre-ft/yr, which is about 19,000 acre-ft/yr higher than the historical projections (table 6). This difference was largely due to the projection of a severe and prolonged drought spanning 1999 through 2006. The projected drought caused water levels to decline below streambeds resulting in greater streamflow recharge. The larger streamflow recharge may also have been due to the use of regression estimates (Appendix 4) of future streamflow which do not completely capture the extremes of streamflow. Changes in streamflow recharge had little effect on ground-water discharge. ET was simulated at about 1,000 acre-ft/yr and was similar for the three historically based projections, but was about twice this rate for the spectral projection.
Coastal Flow
The simulation of coastal flow yielded one of the largest differences among the base-case scenarios. All the base-case simulations indicated some coastal landward flow (seawater intrusion) into the upper-aquifer system during dry years but a cumulative coastal seaward flow along the coast, and coastal landward flow (seawater intrusion) into the lower-aquifer system for the entire period (table 6). The projection of historical average pumpage for the six hypothetical ground-water/surface-water projects (base-case 1) resulted in about 95,300 acre-ft of coastal seaward flow from the upper-aquifer system and about 114,500 acre-ft of coastal landward flow (seawater intrusion) to the lower-aquifer system. This was almost 10 times the total coastal seaward flow simulated for the historical period (1984–93), even though the simulation period was only 2.4 times longer. The largest mean coastal seaward flow in the upper-aquifer system occurred in the Northwest and South Oxnard Plain subareas, and the largest coastal landward flow occurred in the lower-aquifer system in the South Oxnard Plain subarea (fig. 27). The reductions in pumpage increased the total simulated coastal seaward flow by about 43,000 acre-ft for base-case 2 and about 131,000 acre-ft for base-case 3 while reducing coastal landward flow (seawater intrusion) in the lower-aquifer system only about 32,400 acre-ft for base-case 2 and about 63,400 acre-ft for base-case 3 relative to the projection of historical average pumpage with selected projects (table 6).

Analysis of Ground-Water Flow 135
Flow Between Subareas and Aquifer Systems
The mean horizontal ground-water underflow to and from subareas surrounding the Oxnard Plain subareas are shown in figure 27, and the total mean downward flow between aquifer systems is given in table 6. More than 20,000 acre-ft/yr of underflow entered the Northwest and South subareas from the inland subareas of the Oxnard Plain for base-case 1 (fig. 27A). Even larger subregional underflows were indicated for the cut-back projections for base-cases 2 and 3 (fig. 27B,C). Changes in horizontal flow of ground water as underflow to the Oxnard Plain subareas were directly proportional to the reductions in pumpage in the FGMA area, ranging from about 9,850 acre-ft/yr for base-case 1 to about 10,720 acre-ft/yr for base-case 3 (table 6). The largest components of underflow were from the Santa Clara River Valley and the Pleasant Valley subareas. These flow rates are small relative to coastal landward flow (seawater intrusion), water derived from storage, and downward flow between aquifers, but are important locally near subarea boundaries (fig. 27, table 6). The mean rate of underflow for the base-case 1 projection was about half the rate simulated for 1984–93 (table 6). Ground water was flowing from the Oxnard Plain subareas and adjacent inland subareas toward the Pleasant Valley subareas in both aquifer systems during the 1984–93 period (fig. 25). Yet, the base-case projections simulated flow of water toward Pleasant Valley in the upper-aquifer system, flow from the Northeast Oxnard Plain subarea in the lower-aquifer system, and a reversal of flow toward the South Oxnard Plain subarea. The rate of underflow from the Santa Clara River Valley subareas was similar to that for base-case 1, for the rolling cut-back (base-case 2), and was almost half that for the step cut-back (base-case 3). The direction of mean underflow from the South Pleasant Valley subarea was reversed for both cut-back projections (fig. 27B,C, table 6). About 1,800 and 1,400 acre-ft/yr of underflow left the Oxnard Plain subarea to the South Pleasant Valley subarea for base-case 2 and for three projections, respectively (fig. 27B,C, table 6). Similarly, the direction of net underflow was reversed in the upper-aquifer system toward the West Las Posas Valley subarea. The net
inflow to the Oxnard Plain subareas for the historical period of pumpage was a net flow of about 900 acre-ft/yr (fig. 25A), and the net mean inflow toward the West Las Posas Valley subarea for base-cases 1–3 was less than 500 acre-ft/yr (fig. 27 A–C, table 6). The spectral-based projection (base-case 4) was similar to the base-case 1 projection, that is, there was a large underflow component from the Santa Clara River Valley subareas but a net mean flow toward the Pleasant Valley and Las Posas Valley subareas (fig. 27D, table 6).
Mean downward flow between aquifer systems in the Oxnard Plain subareas changed directly with changes in potential pumpage in the FGMA area, but it varied only between about 17,400 acre-ft/yr and 20,900 acre-ft/yr for the four base-case projections (table 6). Net water-level declines reversed to water-level recoveries throughout most of the subareas in the FGMA areas, as well as the adjacent Mound and Santa Paula subareas, for the cut-back projections (base-cases 2 and 3) (figs. 25, 26, 27B,C).
Land-Subsidence
The water derived from aquifer-system compaction also was reduced and was proportional to the cut backs in pumpage and related water-level recoveries. The total amount of water derived from storage owing to the compaction of fine-grained deposits was about 36,400 acre-ft (1,500 acre-ft/yr) for base-case 1; the amount was reduced to about 10,000 acre-ft (420 acre-ft/yr) for base-case 2 and was reversed to about 8,000 acre-ft (330 acre-ft/yr) returning to storage in the fine-grained deposits for base-case 3 (table 6). For the spectral analyses, the total amount of water from compaction was about 47,250 acre-ft for the entire 44-year period. The larger amount simulated for the spectral analysis relative to base-case 1 is due to the prolonged drought estimated by the spectral precipitation method. The simulated subsidence, which was driven by this extended drought, resulted in potential subsidence of about 1 ft throughout most of the Northeast Oxnard Plain subarea, the northeastern part of the South Oxnard Plain subarea, and the West and East Las Posas Valley subareas.

136 Simulation of Ground-Water/Surface-Water Flow in the Santa Clara–Calleguas Ground-Water Basin, Ventura County, California
The base-case projections generally produced water-level recoveries or modest water-level declines that generally were less than previous maximum declines (figs. 25 and 27). However, as much as an additional 1 ft of subsidence was simulated in the Northeast Oxnard Plain subarea, the northern part of the South Oxnard Plain subarea, the West Las Posas Valley subarea, and the western part of the East Las Posas Valley subarea during the early dry-year period for base-case 1. Simulated subsidence for the rolling cut-back (base-case 2) projection was reduced to a smaller areal extent and generally from about 0.5 ft (base-case 1) to 0.1 ft throughout most of the South and Northeast Oxnard Plain subareas. Simulated subsidence was further reduced for the step cut-back in pumpage for the FGMA areas for base-case 3. However, about 1 ft of subsidence persisted in the base-case 3 simulation in the northeastern part of the Oxnard Plain subareas and the South Pleasant Valley subarea and in the East Las Posas Valley and North Pleasant Valley subareas. The extended drought simulated in the early part of the 44-year projection of base-case 4 produced water-level declines in most of the Oxnard Plain Forebay subarea (fig. 27D) and, to a lesser extent, in the remainder of the Oxnard Plain subareas and the inland subareas in the FGMA areas (fig. 26), which resulted in additional subsidence.
Projected Future Ground-Water Flow for Alternative Water-Supply Projects
The analysis of future ground-water flow for alternative water-supply projects was simulated for the same 24-year period used for the analysis of the proposed projects for the existing management plan.
The simulations included well-by-well average ground-water pumpage for the 1984–93 period, irrigation return flow estimated using the 1969 land-use distribution, and climatically varying recharge, streamflow, and pumpage. Each projection of future ground-water flow that includes potential alternative projects also includes the proposed projects described in the previous section.
Each of these potential future projects was simulated individually, but they include the base-case 1 set of projects and assumptions. These seven alternative water-supply projects were proposed to help manage the effects of increasing demand and variable supply on seawater intrusion, subsidence, increased withdrawal from storage, and vertical and lateral flow between subareas and aquifer systems.
The model cells used to simulate the alternative water-supply projects (referred to as potential cases 1–7) are shown in figures 26 A,B. The simulated differences in ground-water levels and the cumulative changes in ground-water storage, coastal flow, and mean ground-water underflow in and out of the Oxnard Plain are shown in figure 28. In general, reductions in water derived from subsidence in the alternative water-supply projects were proportional to the cut backs in pumpage and related water-level recoveries. The potential-case projections resulted in water-level recoveries or modest water-level declines that generally were less than historical maximum declines (fig. 27). However, an increase in subsidence was simulated in the FGMA areas and in the Fillmore subarea during the early dry-year period for all seven alternative water-supply projects (potential cases 1–7). Selected details for each alternative water-supply project (potential case) are presented below.
Analysis of Ground-Water Flow 137
Potential Case 1—Seawater Barrier and Increased Pumpage in the Oxnard Plain Forebay
For potential case 1, pumpage by the city of Oxnard was reduced by 4,000 acre-ft/yr. The reduced pumpage was supplanted with CMWD deliveries, and a seawater-intrusion barrier project was implemented by injecting 20,000 acre-ft/yr of imported water and reclaimed sewage into the upper-aquifer system along the South Oxnard Plain subarea from Port Hueneme to just south of the wastewater treatment plant. Ground water that had been historically pumped from the lower-aquifer system from the El Rio-OH wells was pumped from the upper-aquifer system in the Oxnard Plain Forebay. This offset the injection of effluent and imported water and reduced the pumpage stress on the lower-aquifer system. These projects collectively started in the year 2000.
Results of potential case 1 show that the simulated seawater-barrier injection stopped coastal landward flow (seawater intrusion) in the upper-aquifer system but did not reduce the coastal landward flow (seawater intrusion) in the lower-aquifer system. The rates of coastal landward flow (seawater intrusion) in the lower-aquifer system were comparable to those simulated for base-case 1 (figs. 27A and 28A; table 6). Injecting water into the upper-aquifer system to form a seawater-intrusion barrier for the South Oxnard Plain subarea south of the Hueneme submarine canyon (fig. 1) produced water-level rises as great as 30 ft (fig. 28A) that resulted in heads as much as 20 ft above sea level (add water-level changes from fig. 28A to water-level elevations from fig. 25A). For this case, more water was pumped from storage in the Oxnard Plain Forebay without increasing coastal landward flow (seawater intrusion) in the upper-aquifer system. However, this additional pumpage produced a small amount of additional subsidence. A 24-percent increase in net underflow from the Santa Clara River Valley subareas to the Oxnard Plain subarea was simulated for this case with the increase of 20,000 acre-ft/yr of pumpage in the Oxnard Plain Forebay at the OH wells
(figs. 26B and 28A). In addition, the pumpage reduced the net ground-water underflow away from the Oxnard Plain Forebay to the Northeast and Northwest Oxnard Plain model subareas by about 11,000 acre-ft/yr in the upper-aquifer system compared with the net underflow in base-case 1 (figs. 27A and 28B). As in the base-case 1 projection, as much as an additional foot of subsidence was simulated in the northeast Oxnard Plain subarea, the northern part of the South Oxnard Plain subarea, the West Las Posas Valley subarea, and the western part of the East Las Posas Valley subarea during the early dry-year period for potential case 1. Subsidence of a few tenths of a foot was further extended across the Oxnard Plain Forebay subarea owing to the additional 20,000 acre-ft/yr of pump-back pumpage, and the extent of subsidence in the South Oxnard Plain subarea along the coast was reduced owing to the 20,000 acre-ft/yr injection project in the upper-aquifer system.
Potential Case 2—Artificial Recharge in Happy Camp Canyon
For potential case 2, additional recharge of 15,000 acre-ft/yr was added as surface-spreading to the upper-aquifer system at the mouth of Happy Camp Canyon along the northeast border of the East Las Posas Valley subarea beginning in 2000. The projected additional recharge contributed about 204,000 acre-ft of water going into storage but resulted in simulated water levels being significantly above land surface (not feasible) in the upper-aquifer system in the East Las Posas Valley subarea (figs. 27A and 28B, table 6). Although this case resulted in simulated water levels that were above land surface in the East Las Posas Valley subarea, essentially no changes were simulated in the hydrologic conditions in the Oxnard Plain, Pleasant Valley, or Santa Clara River Valley subareas. The simulated water-level rise above land surface at the mouth of Happy Camp Canyon may, in part, be due to the hydraulic properties and layering used in the model.

138 Simulation of Ground-Water/Surface-Water Flow in the Santa Clara–Calleguas Ground-Water Basin, Ventura County, California
Figure 28. Simulated differences in ground-water levels from 1993 to 2017 for alternative water-supply projects using the base-case 1 set of projects and assumptions in the Santa Clara–Calleguas ground-water basin, Ventura County, California. A, Seawater intrusion barrier project in the southern Oxnard Plain subregion and equal pump-back from the Oxnard Forebay in the upper-aquifer system (potential case 1).
Pacific Ocean
Pacific Ocean
118°45'
34°22'30"
R22W R18W
119°
0
0
10 MILES
10 KILOMETERS
T2N
T4N
34°07'30"
119°15'
118°45'
34°22'30"
119°
T2N
T4N
34°07'30"
119°15'
0
0
10 MILES
10 KILOMETERS
4
3
20
19
18
17
7
5
1
34
33
32
31
8
2
30
28
27 26
13
1211
10
96
29
16
14
25
2423
22
21
15
Cal
legu
asCr
eek
Santa Clara River
LakePiru
Cal
legu
asCr
eek
Santa Clara River
LakePiru
136136
2,0172,017
2,72
62,
726
157157
152152
1,0731,073
1,7211,721
444444
543543732732 4,7984,798
1,5721,572
748748
639639565565
2,274
2,274
4,1444,144
3,65
23,
652
9,274
9,274
1,066
1,066
910
910
11,66511,665
1,0121,012
1818
A
EXPLANATION
Difference in water-level altitude (∆h)from 1993, in feet
Total range -67 to 71
Difference in water-level altitude (∆h)from 1993, in feet
Total range -258 to 84
-67 ≤ ∆h ≤ -30
-30 < ∆h ≤ 0
0 < ∆h ≤ 5
5 < ∆h ≤ 15
15 < ∆h ≤ 71
-258 ≤ ∆h ≤ -30
-30 < ∆h ≤ 0
0 < ∆h ≤ 5
5 < ∆h ≤ 30
30 < ∆h ≤ 84
R22W R18W
River and selected streams
Hydrologic Unit boundary
Model-grid boundary offlow region and subareas
Potential-case 1
Upper-AquiferSystem
Lower-AquiferSystem
Santa Clara-Calleguas ground-water basin
Outside Santa Clara-Calleguas ground-water basin
Shallow alluvium
Shallow alluvium and unconsolidated deposits
Consolidated and unconsolidated deposits
Rise
Decline
Rise
Decline
Subarea number –See figure 17B for subarea names
949949
10
22 Upper-aquifer systemLower-aquifer system
Mean simulated ground-waterunderflow and coastal flow –in acre-feet per year

Analysis of Ground-Water Flow 139
Figure 28—Continued. B, Additional artificial recharge added at mouth of Happy Camp Canyon, East Los Posas subarea (potential case 2).
Pacific Ocean
Pacific Ocean
118°45'
34°22'30"
R22W R18W
119°
0
0
10 MILES
10 KILOMETERS
T2N
T4N
34°07'30"
119°15'
118°45'
34°22'30"
119°
T2N
T4N
34°07'30"
119°15'
0
0
10 MILES
10 KILOMETERS
4
3
20
19
18
17
7
5
1
34
33
32
31
8
2
30
28
27 26
13
1211
10
96
29
16
14
25
2423
22
21
15
Cal
legu
asCr
eek
Santa Clara River
LakePiru
Cal
legu
asCr
eek
Santa Clara River
LakePiru
1,6301,630
622622
450450
3,06
53,
065
791791
1,9301,930
14,81314,813
2,847
2,847
3,52
53,
525
1,1391,139
16,79816,798
100100
1,9251,925
2,723
2,723
168168
1,0611,0611,5191,519
1,116
1,116
7676
573573
531531
4,97
24,
972
106106
2121
EXPLANATION
Difference in water-level altitude (∆h)from 1993, in feet
Total range -4,489 to 67
Difference in water-level altitude (∆h)from 1993, in feet
Total range -259 to 84
-4,489 ≤ ∆h ≤ -30
-30 < ∆h ≤ 0
0 < ∆h ≤ 5
5 < ∆h ≤ 15
15 < ∆h ≤ 67
-259 ≤ ∆h ≤ -30
-30 < ∆h ≤ 0
0 < ∆h ≤ 5
5 < ∆h ≤ 30
30 < ∆h ≤ 84
R22W R18W
River and selected streams
Hydrologic Unit boundary
Model-grid boundary offlow region and subareas
B Potential-case 2
Upper-AquiferSystem
Lower-AquiferSystem
Santa Clara-Calleguas ground-water basin
Outside Santa Clara-Calleguas ground-water basin
Shallow alluvium
Shallow alluvium and unconsolidated deposits
Consolidated and unconsolidated deposits
Rise
Decline
Rise
Decline
Subarea number –See figure 17B for subarea names
949949
10
22 Upper-aquifer systemLower-aquifer system
Mean simulated ground-waterunderflow and coastal flow –in acre-feet per year

140 Simulation of Ground-Water/Surface-Water Flow in the Santa Clara–Calleguas Ground-Water Basin, Ventura County, California
Figure 28—Continued. C, Cessation of pumpage in the southern Oxnard Plain subregion (potential case 3).
Pacific Ocean
Pacific Ocean
118°45'
34°22'30"
R22W R18W
119°
0
0
10 MILES
10 KILOMETERS
T2N
T4N
34°07'30"
119°15'
118°45'
34°22'30"
119°
T2N
T4N
34°07'30"
119°15'
0
0
10 MILES
10 KILOMETERS
4
3
20
19
18
17
7
5
1
34
33
32
31
8
2
30
28
27 26
13
1211
10
96
29
16
14
25
2423
22
21
15
Cal
legu
asCr
eek
Santa Clara River
LakePiru
Cal
legu
asCr
eek
Santa Clara River
LakePiru
2828
496496
1,648
1,648
188188
503
503 754754
357357
1,0571,057
1,15
91,
159
485485
4,61
84,
618
322322
329329
259259
1313
1,3091,309
3,946
3,946
2,18
42,
184
3,2273,227
15,47115,471
16,2
7116
,271
3,0383,038
4,8354,835
1,3011,301
C
EXPLANATION
Difference in water-level altitude (∆h)from 1993, in feet
Total range -94 to 55
Difference in water-level altitude (∆h)from 1993, in feet
Total range -283 to 65
-94 ≤ ∆h ≤ -30
-30 < ∆h ≤ 0
0 < ∆h ≤ 5
5 < ∆h ≤ 15
15 < ∆h ≤ 55
-283 ≤ ∆h ≤ -30
-30 < ∆h ≤ 0
0 < ∆h ≤ 5
5 < ∆h ≤ 30
30 < ∆h ≤ 65
R22W R18W
River and selected streams
Hydrologic Unit boundary
Model-grid boundary offlow region and subareas
Base-case 3
Upper-AquiferSystem
Lower-AquiferSystem
Santa Clara-Calleguas ground-water basin
Outside Santa Clara-Calleguas ground-water basin
Shallow alluvium
Shallow alluvium and unconsolidated deposits
Consolidated and unconsolidated deposits
Rise
Decline
Rise
Decline
Subarea number –See figure 17B for subarea names
949949
10
22 Upper-aquifer systemLower-aquifer system
Mean simulated ground-waterunderflow and coastal flow –in acre-feet per year

Analysis of Ground-Water Flow 141
Figure 28—Continued. D, Shifting pumpage from the Pumping-Trough Pipeline (PTP) wells from the lower- to upper-aquifer system (potential case 4).
Pacific Ocean
Pacific Ocean
118°45'
34°22'30"
R22W R18W
119°
0
0
10 MILES
10 KILOMETERS
T2N
T4N
34°07'30"
119°15'
118°45'
34°22'30"
119°
T2N
T4N
34°07'30"
119°15'
0
0
10 MILES
10 KILOMETERS
4
3
20
19
18
17
7
5
1
34
33
32
31
8
2
30
28
27 26
13
1211
10
96
29
16
14
25
2423
22
21
15
Cal
legu
asCr
eek
Santa Clara River
LakePiru
Cal
legu
asCr
eek
Santa Clara River
LakePiru
102102
1,7591,759
168168
1,1931,193 1,3741,374
623623 543543
570570
1,187
1,187
4,70
54,
705
2,59
42,
594
2020
1,4861,486
558558
489489
14,756
14,756777777
1,7681,768
9292
1,0071,007
3,08
03,
080
2,480
2,480
2,9202,920
17,1
9817
,198
EXPLANATION
Difference in water-level altitude (∆h)from 1993, in feet
Total range -67 to 67
Difference in water-level altitude (∆h)from 1993, in feet
Total range -258 to 84
-67 ≤ ∆h ≤ -30
-30 < ∆h ≤ 0
0 < ∆h ≤ 5
5 < ∆h ≤ 15
15 < ∆h ≤ 67
-258 ≤ ∆h ≤ -30
-30 < ∆h ≤ 0
0 < ∆h ≤ 5
5 < ∆h ≤ 30
30 < ∆h ≤ 84
R22W R18W
River and selected streams
Hydrologic Unit boundary
Model-grid boundary offlow region and subareas
Santa Clara-Calleguas ground-water basin
Outside Santa Clara-Calleguas ground-water basin
Shallow alluvium
Shallow alluvium and unconsolidated deposits
Consolidated and unconsolidated deposits
D Potential-case 4
Upper-AquiferSystem
Lower-AquiferSystem
Rise
Decline
Rise
Decline
Subarea number –See figure 17B for subarea names
949949
10
22 Upper-aquifer systemLower-aquifer system
Mean simulated ground-waterunderflow and coastal flow –in acre-feet per year

142 Simulation of Ground-Water/Surface-Water Flow in the Santa Clara–Calleguas Ground-Water Basin, Ventura County, California
Figure 28—Continued. E, Shifting pumpage from the lower- to upper-aquifer system in the northeastern Oxnard Plain subarea (potential case 5).
Pacific Ocean
Pacific Ocean
118°45'
34°22'30"
R22W R18W
119°
0
0
10 MILES
10 KILOMETERS
T2N
T4N
34°07'30"
119°15'
118°45'
34°22'30"
119°
T2N
T4N
34°07'30"
119°15'
0
0
10 MILES
10 KILOMETERS
4
3
20
19
18
17
7
5
1
34
33
32
31
8
2
30
28
27 26
13
1211
10
96
29
16
14
25
2423
22
21
15
Cal
legu
asCr
eek
Santa Clara River
LakePiru
Cal
legu
asCr
eek
Santa Clara River
LakePiru
1,0311,031
381381
690690
14,318
14,318
3,16
63,
166
736736
1,3591,359
5959
730
730
1,636
1,636
1,51
91,
519
19,5
5819
,558
166166
110110
1,2041,204
1717
2,261
2,261
429429
2,5242,524
1,7901,790
2,77
32,
773
1,86
01,
860
557557
795795
EXPLANATION
Difference in water-level altitude (∆h)from 1993, in feet
Total range -69 to 67
Difference in water-level altitude (∆h)from 1993, in feet
Total range -258 to 84
-69 ≤ ∆h ≤ -30
-30 < ∆h ≤ 0
0 < ∆h ≤ 5
5 < ∆h ≤ 15
15 < ∆h ≤ 67
-258 ≤ ∆h ≤ -30
-30 < ∆h ≤ 0
0 < ∆h ≤ 5
5 < ∆h ≤ 30
30 < ∆h ≤ 84
R22W R18W
River and selected streams
Hydrologic Unit boundary
Model-grid boundary offlow region and subareas
E Potential-case 5
Upper-AquiferSystem
Lower-AquiferSystem
Santa Clara-Calleguas ground-water basin
Outside Santa Clara-Calleguas ground-water basin
Shallow alluvium
Shallow alluvium and unconsolidated deposits
Consolidated and unconsolidated deposits
Rise
Decline
Rise
Decline
Subarea number –See figure 17B for subarea names
949949
10
22 Upper-aquifer systemLower-aquifer system
Mean simulated ground-waterunderflow and coastal flow –in acre-feet per year

Analysis of Ground-Water Flow 143
Figure 28—Continued. F, Shifting pumpage from the lower- to upper-aquifer system in the southern Oxnard Plain subarea (potential case 6).
Pacific Ocean
Pacific Ocean
118°45'
34°22'30"
R22W R18W
119°
0
0
10 MILES
10 KILOMETERS
T2N
T4N
34°07'30"
119°15'
118°45'
34°22'30"
119°
T2N
T4N
34°07'30"
119°15'
0
0
10 MILES
10 KILOMETERS
4
3
20
19
18
17
7
5
1
34
33
32
31
8
2
30
28
27 26
13
1211
10
96
29
16
14
25
2423
22
21
15
Cal
legu
asCr
eek
Santa Clara River
LakePiru
Cal
legu
asCr
eek
Santa Clara River
LakePiru
5,1135,113
2,790
2,790
14,931
14,931
3,07
63,
076
3737
1,6401,640
776776
17,0
6217
,062
1,4181,418
4545
482482
2372371,1
381,1
38
4,73
74,
737
169169
565565103103
1,6351,635
1414
1,42
81,
428
1,655
1,655 693
693
1,1041,1041,1731,173
EXPLANATION
Difference in water-level altitude (∆h)from 1993, in feet
Total range -69 to 67
Difference in water-level altitude (∆h)from 1993, in feet
Total range -258 to 84
-69 ≤ ∆h ≤ -30
-30 < ∆h ≤ 0
0 < ∆h ≤ 5
5 < ∆h ≤ 15
15 < ∆h ≤ 67
-258 ≤ ∆h ≤ -30
-30 < ∆h ≤ 0
0 < ∆h ≤ 5
5 < ∆h ≤ 30
30 < ∆h ≤ 84
R22W R18W
River and selected streams
Hydrologic Unit boundary
Model-grid boundary offlow region and subareas
F Potential-case 6
Upper-AquiferSystem
Lower-AquiferSystem
Santa Clara-Calleguas ground-water basin
Outside Santa Clara-Calleguas ground-water basin
Shallow alluvium
Shallow alluvium and unconsolidated deposits
Consolidated and unconsolidated deposits
Rise
Decline
Rise
Decline
Subarea number –See figure 17B for subarea names
949949
10
22 Upper-aquifer systemLower-aquifer system
Mean simulated ground-waterunderflow and coastal flow –in acre-feet per year
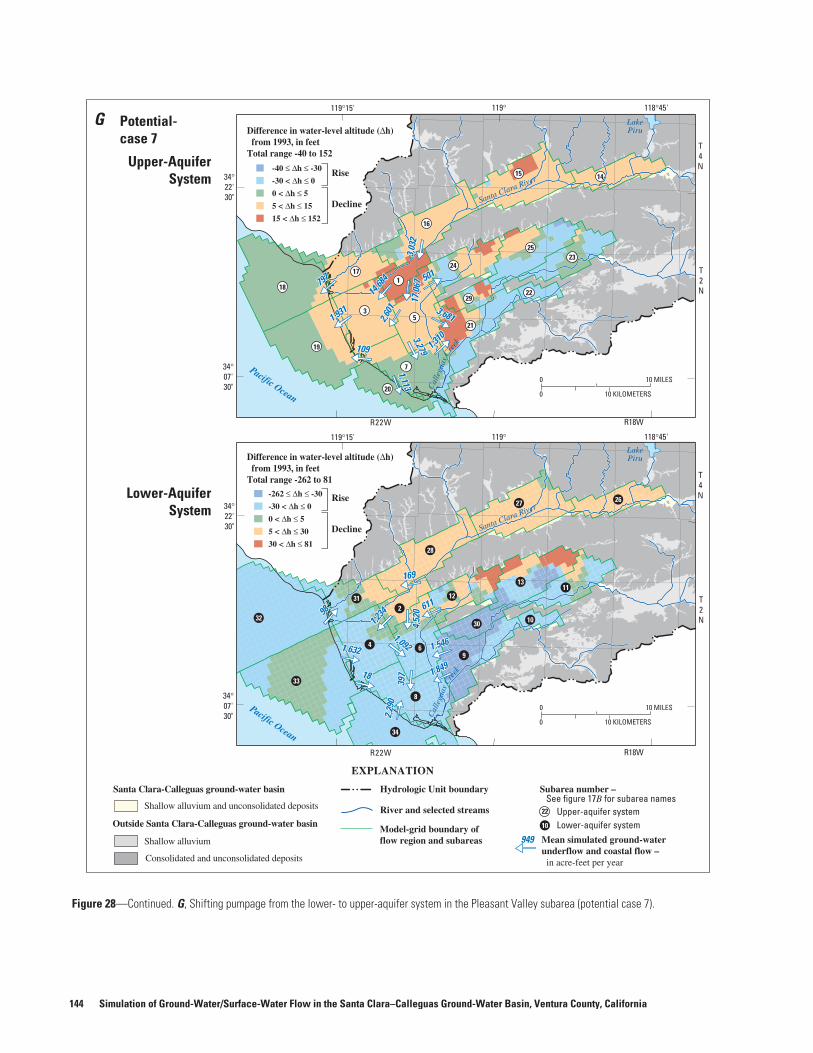
144 Simulation of Ground-Water/Surface-Water Flow in the Santa Clara–Calleguas Ground-Water Basin, Ventura County, California
Figure 28—Continued. G, Shifting pumpage from the lower- to upper-aquifer system in the Pleasant Valley subarea (potential case 7).
Pacific Ocean
Pacific Ocean
118°45'
34°22'30"
R22W R18W
119°
0
0
10 MILES
10 KILOMETERS
T2N
T4N
34°07'30"
119°15'
118°45'
34°22'30"
119°
T2N
T4N
34°07'30"
119°15'
0
0
10 MILES
10 KILOMETERS
4
3
20
19
18
17
7
5
1
34
33
32
31
8
2
30
28
27 26
13
1211
10
96
29
16
14
25
2423
22
21
15
Cal
legu
asCr
eek
Santa Clara River
LakePiru
Cal
legu
asCr
eek
Santa Clara River
LakePiru
1,310
1,310
501501
3,6813,681
797797
1,9311,931
109109
1,1131,113
3,2793,279
2,601
2,601
14,68
414
,684
3,03
23,
032
17,0
6717
,067
4,52
04,
520
1,234
1,234
1,5461,546
1,8491,849
397
397
9898
1,6321,632
1818
2,29
02,
290
1,0921,092
169169
611611
EXPLANATION
Difference in water-level altitude (∆h)from 1993, in feet
Total range -40 to 152
Difference in water-level altitude (∆h)from 1993, in feet
Total range -262 to 81
-40 ≤ ∆h ≤ -30
-30 < ∆h ≤ 0
0 < ∆h ≤ 5
5 < ∆h ≤ 15
15 < ∆h ≤ 152
-262 ≤ ∆h ≤ -30
-30 < ∆h ≤ 0
0 < ∆h ≤ 5
5 < ∆h ≤ 30
30 < ∆h ≤ 81
R22W R18W
River and selected streams
Hydrologic Unit boundary
Model-grid boundary offlow region and subareas
G Potential-case 7
Upper-AquiferSystem
Lower-AquiferSystem
Santa Clara-Calleguas ground-water basin
Outside Santa Clara-Calleguas ground-water basin
Shallow alluvium
Shallow alluvium and unconsolidated deposits
Consolidated and unconsolidated deposits
Rise
Decline
Rise
Decline
Subarea number –See figure 17B for subarea names
949949
10
22 Upper-aquifer systemLower-aquifer system
Mean simulated ground-waterunderflow and coastal flow –in acre-feet per year

Analysis of Ground-Water Flow 145
Figure 28—Continued. H, Cumulative changes in ground-water storage and ground-water flow for selected subareas, 1993–2017.
1 2
17 31
3 4
5 6
25 13
POTENTIAL-CASE 1
15
21
7 8
1 2
17 31
7 8
5 6
25 13
15
21
POTENTIAL-CASE 3
1 2
17 31
3 4
7 8
5 6
25 13
15
21
POTENTIAL-CASE 2
1990
2000
2010
2020
1990
2000
2010
2020
1990
2000
2010
2020
YEARYEAR
50
100
0
-50
-100
50
100
0
-50
-100
0
50
-50
-100
-150 CUM
ULA
TIVE
FLO
WTO
OCE
AN
,IN
THO
USA
ND
SO
FA
CRE
FEET
50
100
0
-50
-100
50
100
0
-50
-100
CUM
ULA
TIVE
FLO
WTO
OCE
AN
,IN
THO
USA
ND
SO
FA
CRE
FEET
H
0
50
-50
-100
-150
0
50
-50
-100
-150
0
50
-50
-100
-150
0
50
-50
-100
-150
0
50
-50
-100
-150
0
50
-50
-100
-150
CUM
ULA
TIVE
STO
RAG
E,IN
THO
USA
ND
SO
FA
CRE
FEET
0
50
-50
-100
-150
0
50
-50
-100
-150
0
50
-50
-100
-150
0
50
-50
-100
-150
0
50
-50
-100
-150
0
50
-50
-100
-150
0
50
-50
-100
-150
CUM
ULA
TIVE
STO
RAG
E,IN
THO
USA
ND
SO
FA
CRE
FEET
0
50
-50
-100
-150
-200
100
150
50
0
-50
-100
Subareanumber –
See figure 17Bfor subareanames
10
22
EXPLANATION
Upper-aquifersystem
Lower-aquifersystem
Upper-aquifersystem
Lower-aquifersystem
3 4

146 Simulation of Ground-Water/Surface-Water Flow in the Santa Clara–Calleguas Ground-Water Basin, Ventura County, California
Figure 28—Continued. H, Cumulative changes in ground-water storage and ground-water flow for selected subareas, 1993–2017.
1 2
17 31
3 4
7 8
5 6
25 13
POTENTIAL-CASE 4
15
21
1 2
17 31
3 4
7 8
5 6
25 13
15
21
POTENTIAL-CASE 5
1 2
17 31
3 4
7 8
5 6
25 13
15
21
POTENTIAL-CASE 6
1 2
17 31
3 4
7 8
5 6
25 13
15
21
POTENTIAL-CASE 7
1990
2000
2010
2020
1990
2000
2010
2020
1990
2000
2010
2020
1990
2000
2010
2020
YEAR
50
100
0
-50
-100
50
100
0
-50
-100
0
50
-50
-100
-150 CUM
ULA
TIVE
FLO
WTO
OCE
AN
,IN
THO
USA
ND
SO
FA
CRE
FEET
H
0
50
-50
-100
-150
0
50
-50
-100
-150
0
50
-50
-100
-150
0
50
-50
-100
-150
0
50
-50
-100
-150
0
50
-50
-100
-150
0
50
-50
-100
-150
CUM
ULA
TIVE
STO
RAG
E,IN
THO
USA
ND
SO
FA
CRE
FEET
Subareanumber –
See figure 17Bfor subareanames
10
22
EXPLANATION
Upper-aquifersystem
Lower-aquifersystem
Upper-aquifersystem
Lower-aquifersystem

Analysis of Ground-Water Flow 147
Potential Case 3—Eliminate Agricultural Pumpage in the South Oxnard Plain Subarea
For potential case 3, the pumping of ground water was stopped in the South Oxnard Plain subarea in lieu of additional pipeline deliveries of diverted streamflow or imported water beginning in 1998. This case shows increased recovery in the upper- and lower-aquifer systems throughout the Oxnard Plain and Pleasant Valley subareas relative to base-case 1. This reduction in pumpage increased the coastal seaward flow in the upper-aquifer system and reduced the coastal landward flow (seawater intrusion) in the lower-aquifer system. Stopping pumpage primarily in the lower-aquifer system in the South Oxnard Plain subarea had the largest effect on reducing coastal landward flow (seawater intrusion) of all the potential cases evaluated. Coastal landward flow (seawater intrusion) in the lower-aquifer system was reduced by 48 percent, yet coastal seaward flow in the upper-aquifer system was increased by 85 percent compared with base-case 1 (figs. 27A and 28C; table 6). The largest net underflow to the South Pleasant Valley subarea was simulated with cessation of pumpage in the South Oxnard Plain subarea (fig. 28C, table 6). Similarly, the cessation of pumpage in the South Oxnard Plain subarea resulted in ground-water underflow to the Northeast Oxnard Plain from the South Oxnard Plain subareas—a reversal in underflow relative to the base-case 1 (figs. 27A and 28C). For cessation of pumpage in the South Oxnard Plain, simulated subsidence was not completely eliminated but was reduced to a few tenths of a foot along the northern boundary with the northeastern part of the Oxnard Plain subareas. This potential case also resulted in an additional 0.1 ft of subsidence over much of the Oxnard Plain Forebay subarea and the adjacent Santa Paula subarea relative to base-case 1. Cessation of pumpage in the South Oxnard Plain also reduced the extent and magnitude of subsidence in the Northeast Oxnard Plain subarea.
Potential Case 4—Shift Pumpage to Upper-Aquifer System in PTP Wells
For potential case 4, pumpage from the Pumping-Trough Pipeline (PTP) wells was shifted from the lower-aquifer system to the upper-aquifer
system beginning in 1998. This change produced water-level declines over a larger areal extent in the upper-aquifer system in the Oxnard Plain Forebay subarea (fig. 28D) relative to base-case 1 (fig. 27A), as well as a small reduction in coastal seaward flow in the upper-aquifer system and a small reduction of coastal landward flow in the lower-aquifer system compared with base-case 1 (fig. 28D). The shifting of PTP-well pumpage to the upper-aquifer system also resulted in increased underflow from the lower-aquifer system in the Northeast Oxnard Plain to the South Oxnard Plain and the South Pleasant Valley subareas by 900 acre-ft/yr compared to net underflow in base-case 1 (figs. 27A and 28D). The shifting of PTP-well pumpage to the upper-aquifer system reduced the extent and magnitude of subsidence in the Northeast Oxnard Plain subarea but had little to no effect elsewhere.
Potential Case 5—Shift Pumpage to Upper-Aquifer System in the Northeast Oxnard Plain
For potential case 5, pumpage throughout the Northeast Oxnard Plain subarea was shifted from the lower-aquifer system to the upper-aquifer system beginning in the year 1998. The change for this simulation is similar to the change in potential case 4. The increase in pumpage in the upper-aquifer system produced increased water-level declines in the Northeast Oxnard Plain subarea, reduced underflow from the Northeast Oxnard Plain subarea to adjacent subareas in the upper-aquifer system, and reduced coastal seaward flow in the upper-aquifer system relative to base-case 1 (figs. 27A, 28E). The reduced pumpage in the lower-aquifer system resulted in reduced coastal landward flow in the lower-aquifer system (fig. 28E). The net coastal seaward flow was decreased by about 1,090 acre-ft/yr in the upper-aquifer system and the coastal landward flow (seawater intrusion) was decreased by about 1,180 acre-ft/yr (figs. 27A, 28E). The shifting of pumpage to the upper-aquifer system in the Northeast Oxnard Plain subarea also reduced the extent and magnitude of subsidence throughout the Oxnard Plain subareas but did extend some potential subsidence of less than 0.1 ft into the Northwest Oxnard Plain subarea.

148 Simulation of Ground-Water/Surface-Water Flow in the Santa Clara–Calleguas Ground-Water Basin, Ventura County, California
Potential Case 6—Shift Pumpage to the Upper-Aquifer System in the South Oxnard Plain Subarea
For potential case 6, pumpage throughout the South Oxnard Plain subarea was shifted from the lower-aquifer system to the upper-aquifer system beginning in the year 1998. The shift in pumpage produced coastal landward flow (seawater intrusion) in the upper-aquifer system and reduced coastal landward flow (seawater intrusion) into the lower-aquifer system in the South Oxnard Plain subarea by about half (fig. 28F) relative to base-case 1 (fig. 27A). Relative to the base-case 1 projection, shifting pumpage from the lower- to the upper-aquifer system in the South Oxnard Plain subarea resulted in the second largest reduction (33 percent) of total coastal landward flow (seawater intrusion) of all the potential cases evaluated. In addition, shifting pumpage to the upper-aquifer system in the South Oxnard Plain subarea resulted in reduction in coastal seaward flow in the upper-aquifer system, an increase in underflow from the Northeast Oxnard Plain subarea to the South Oxnard Plain subarea, and in a reversal of underflow from the South Oxnard Plain to the South Pleasant Valley subarea in the lower-aquifer system (figs. 27A and 28F). The net coastal seaward flow was decreased by about 1,750 acre-ft/yr in the upper-aquifer system, and the net coastal landward flow (seawater intrusion) was decreased by about 1,590 acre-ft/yr (figs. 27A, 28F) in the lower-aquifer system relative to base-case 1. The shifting of pumpage from the lower- to the upper-aquifer system in the South Oxnard Plain subarea yielded the largest combined effect on coastal flow with a reduction of coastal landward flow in the lower-aquifer system and coastal seaward flow from the upper-aquifer system. Similarly, shifting pumpage in the South Oxnard Plain subarea to the upper-aquifer system reduced the magnitude of potential additional subsidence throughout the Northeast and South Oxnard Plain subareas.
Potential Case 7—Shift Pumpage to Upper-Aquifer System, Pleasant Valley
For potential case 7, pumpage throughout the Pleasant Valley subareas was shifted from the lower-aquifer system to the upper-aquifer system beginning
in the year 1998. This simulation produced coastal seaward flow in the upper-aquifer system similar to that in base-case 1 and a small decrease of coastal landward flow (seawater intrusion) in the lower-aquifer system compared with that for base-case 1 (fig. 28G). Shifting pumpage to the upper-aquifer system in the Pleasant Valley subareas resulted in more flow from the upper-aquifer system in the Northeast Oxnard Plain subarea and a reversal of flow in the lower-aquifer system toward the Oxnard Plain subareas from the South Pleasant Valley subarea (figs. 27A and 28G). Shifting pumpage to the upper-aquifer system in the Pleasant Valley subareas reduced potential subsidence in the North Pleasant Valley subarea and resulted in reduced subsidence in the Oxnard Plain subareas—a result similar to that caused by shifting pumpage to the upper-aquifer system in the Northeast and South Oxnard Plain subareas.
SUMMARY AND CONCLUSIONS
Ground water from the regional alluvial-aquifer system is the main source of water in the Santa Clara–Calleguas Basin in southern California. A steady increase in the demand for water in the basin since the late 1800s has resulted in streamflow depletion, ground-water overdraft, seawater intrusion, inter-aquifer flow, land subsidence, and ground-water contamination. Construction of reservoirs and discharge of shallow ground water and treated sewage effluent have contributed to regulated flow and modification of river systems in the basin, changing flows in the Santa Clara River and the Calleguas Creek and in some tributaries to predominantly perennial or intermittent flow. The use of ground water and surface water also is affected by wet and dry climatic periods that control the quantity and distribution of streamflow and recharge. These periods, which have persisted since the late 1600s, are estimated to have had periods of about 22, 5.3, and 2.2–2.9 years during the past 100 years. Dry to wet cycle precipitation increases by a factor of 1.8 for winters and by 1.6 for springs.

Summary and Conclusions 149
The Santa Clara–Calleguas Basin in Ventura County, California, is composed of northeast-trending anticlinal mountains and synclinal valleys in the Transverse Ranges physiographic province. The onshore part of the alluvial basin is about 32 mi long and includes about 310 mi2 bounded by rugged topography. An additional 193 mi2 of the ground-water basin is an extensive sloping offshore plain truncated by steeply dipping submarine cliffs and dissected by several submarine canyons. The two largest submarine canyons dissect the offshore plain west of Port Hueneme and Point Mugu. The Santa Clara River and the Calleguas Creek and their tributaries drain the basin to the Pacific Ocean.
Growth and increasing water use in the Santa Clara–Calleguas Basin have continued over the last century, and because of the proximity to the Los Angeles metropolitan area, they may continue to transform the basin from an agriculture-based economy to an urban and industrial economy. Agricultural land use increased less than 5 percent between 1969 and 1980, and population in Ventura County increased 28 percent between 1980 and 1992. Agricultural water use increased to a historical high during the 1950s owing in part to the introduction of truck crops and refrigerated railroad transportation. Estimated pumpage ranged from 34,800 acre-ft for the drought years of the 1920s to a maximum pumpage of 301,400 acre-ft/yr during the 1990 drought year.
The Santa Clara–Calleguas Basin consists of multiple aquifers grouped into upper- and lower-aquifer systems. The upper-aquifer system includes the Shallow, Oxnard, and Mugu aquifers. The lower-aquifer system includes the Hueneme, Fox Canyon, and Grimes Canyon aquifers. Layers of the aquifer systems include basal coarse-grained sediments overlying regional unconformities; these coarse-grained layers are the major source of ground-water production and pathways for seawater intrusion. The aquifer systems are surrounded and underlain by consolidated bedrock that forms a relatively impermeable boundary to ground-water flow. Numerous faults act as barriers and boundaries to ground-water flow. The aquifer systems crop out offshore along the edge of the submarine shelf and within the coastal submarine canyons. Submarine
canyons have dissected these regional aquifers, providing a hydraulic connection to the ocean through the submarine outcrops of the aquifer systems.
Analysis of hydrological, geophysical, and geochemical data and simulation results indicates that the upper-aquifer system receives most of the natural and artificial recharge, and thus is more dynamic than the lower-aquifer system. Owing to development, many changes have occurred in the regional flow system: streamflow has changed from predominantly floodflows to a combination of regulated flows and floodflows; large quantities of diverted streamflow and treated sewage effluent are used for artificial recharge; streamflow infiltration has increased due to pumpage of ground water; ground water that flowed toward the ocean now flows toward the major pumping centers in the northeastern part of the Oxnard Plain, in Pleasant Valley, and in the western part of the East Las Posas Valley; aquitard compaction has resulted in land subsidence in the southern Oxnard Plain; and vertical flow occurs as leakage between aquifer systems and intraborehole flow within water-supply wells.
A numerical ground-water flow model of the Santa Clara–Calleguas Basin was developed as part of the USGS RASA Program. The flow model was developed to better define the geohydrologic framework of the regional ground-water flow system and to analyze problems affecting water resources of a typical coastal aquifer system. Development of the model included compilation of geographic, geologic, and hydrologic data and estimation of hydraulic properties and flows. The transient-state model was calibrated to historical surface-water and ground-water flows for 1891–1993.
Sources of water to the regional ground-water flow system are natural and artificial recharge, coastal landward flow from the ocean (seawater intrusion), storage in the coarse-grained beds, and water from compaction of fine-grained beds (aquitards). Inflows used in the regional flow model simulation include streamflows routed through the major rivers and tributaries; infiltration of mountain-front runoff and infiltration of precipitation on bedrock outcrops and on valley floors; and artificial ground-water recharge of diverted streamflow, irrigation return flow, and treated sewage effluent.

150 Simulation of Ground-Water/Surface-Water Flow in the Santa Clara–Calleguas Ground-Water Basin, Ventura County, California
Most natural recharge occurs through infiltration (losses) of streamflow within the major rivers and tributaries and the numerous arroyos that drain the mountain fronts of the basin. Most streamflow loss occurs during wet-year periods when flows are the greatest, although the percentage of streamflow loss is larger during dry-year periods (37 percent during dry- and 22 percent during wet-year periods). Total simulated natural recharge was about 114,100 acre-ft/yr for 1984–93: 27,800 acre-ft/yr of mountain-front and bedrock recharge, 24,100 acre-ft/yr of valley-floor recharge, and 62,200 acre-ft/yr of net streamflow recharge.
Artificial recharge (spreading of diverted streamflow, irrigation return, and sewage effluent) is a major source of ground-water replenishment to the Santa Clara–Calleguas ground-water basin. Streamflow has been diverted to spreading grounds since 1929, and treated-sewage effluent has been discharged to stream channels since 1930. During 1984–93, the estimated average artificial recharge at spreading grounds was about 54,400 acre-ft/yr, which is about 13 percent less than simulated streamflow recharge (62,200 acre-ft/yr). Estimated recharge from irrigation return flows on the valley floors and treated sewage effluent for 1984–93 averaged about 51,000 acre-ft/yr and 9,000 acre-ft/yr, respectively.
Surface-water outflows from the Santa Clara–Calleguas Basin are streamflow discharged to the Pacific Ocean and to streamflow diversions used for agriculture and artificial ground-water recharge. The streamflows consist of floodflows, regulated surface-water flows, such as releases from Lake Piru and discharge of treated sewage-effluent, and intermittent baseflow from rejected ground water.
Ground-water discharge from the Santa Clara-Calleguas ground-water basin is pumpage, coastal seaward flow to the Pacific Ocean, and evapotranspiration along the flood plains of the major rivers and tributaries. Under predevelopment conditions, the largest discharge from the ground-water system was outflow as coastal seaward flow and evapotranspiration. Pumpage of ground water from thousands of water-supply wells has diminished these outflows and was the largest outflow from the ground-water flow system for the simulation period 1891–93. The distribution of pumpage for 1984–93 indicates that
most of the pumpage occurs in the Oxnard Plain subareas (37 percent) and in the upper Santa Clara River Valley subareas (37 percent).
The total simulated pumpage for 1984–93 averaged about 247,000 acre-ft/yr, 146,000 acre-ft/yr from the Fox Canyon Groundwater Management agency (FGMA) subareas and 101,000 acre-ft/yr from the non-FGMA subareas. This large demand for ground water exceeded the natural and artificial supply of surface water and ground water for parts of the two aquifer systems and resulted in an overdraft of the potable water supply. Of the total 1984–93 pumpage, 46 percent was contributed by natural recharge, 22 percent was contributed by artificial recharge from diverted streamflow, 20 percent was contributed by irrigation return flow, and 4 percent was contributed from sewage-effluent infiltration, 6 percent was contributed by storage depletion, and 2 percent was contributed by coastal landward flow (seawater intrusion).
Ground-water pumping has resulted in large water-level declines in the Las Posas Valley and the Pleasant Valley subbasins. A monotonic water-level decline occurred in the Las Posas Valley subbasins from agricultural pumping. In the Las Posas Valley and South Pleasant Valley subbasins, water-level declines of 50 to 100 ft have occurred in the upper-aquifer system, and declines of about 25 to 300 ft or more have occurred in the lower-aquifer system since the early 1900s.
The combination of variable demand from ground-water pumpage and variable supply, which changes in response to climatic cycles, has resulted in large cycles of decline and recovery in ground-water levels in the upper- and lower-aquifer systems. The largest seasonal and decadal changes in ground-water levels occur in the Oxnard Plain Forebay subarea owing to artificial recharge and pumping, and in the South Oxnard Plain and Pleasant Valley subareas owing to agricultural pumping.
The simulated direction of ground-water underflow in the Oxnard Plain is from the artificial-recharge areas in the Oxnard Plain Forebay subarea toward pumping centers in the Northwest and Northeast Oxnard Plain subareas. The mean simulated underflow to the Oxnard Plain subareas from the Santa Paula, West Las Posas Valley, and South Pleasant Valley subareas for 1984–93 was about 5,77; 500; and 5,720 acre-ft/yr, respectively.

Summary and Conclusions 151
Pumpage from both aquifer systems has resulted in large simulated water-level differences between aquifer systems during dry-year periods that range from 20 to 30 ft near the Hueneme submarine canyon, 50 to 90 ft near Mugu submarine canyon in the Oxnard Plain, 10 to 25 ft in the Santa Clara subareas, and 30 to more than 100 ft in the Las Posas Valley subareas. As a result, inter-aquifer flow occurs as leakage. The simulated vertical downward flow from the upper to the lower-aquifer system averaged about 22,700 acre-ft/yr for the Oxnard Plain subareas for 1984–93.
Seawater intrusion was first suspected in 1931 when water levels were below sea level in a large part of the Oxnard Plain. The simulation of regional ground-water flow indicated that coastal landward flow (seawater intrusion) began in 1927 and continued to the end of the period of simulation in 1993. During wet climatic periods or periods of reduced demand for ground-water pumpage, the simulated direction of coastal flow is reversed in the upper-aquifer system from landward to seaward. During the 1984–93 simulation period, the total net coastal seaward flow was 9,500 acre-ft in the upper-aquifer system, which is less than the 16,000 acre-ft/yr coastal seaward flow simulated for predevelopment conditions. During the same simulation period, total coastal landward flow was 64,200 acre-ft in the lower-aquifer system. This simulated coastal landward flow was supported by increased chloride concentrations and increased EM conductivities in many of the coastal monitoring wells.
Water-level declines induced land subsidence that was first measured in 1939. The model indicates that land subsidence began prior to the 1940s, with most of the decline occurring after the drought of the late 1920s and during the agricultural expansion of the 1950s and 1960s. From 1939 through 1993, water-level declines contributed to 2.7 ft of measured land subsidence in the southern part of the Oxnard Plain. For this same period, the model simulated a total 3 ft of land subsidence in the South Oxnard Plain subarea, and as much as 5 ft in the Las Posas Valley subareas. Model results indicate that subsidence occurred primarily in the upper-aquifer system prior to 1959, but in the lower-aquifer system between 1959–93 owing to an increase in pumpage from the lower-aquifer system.
The calibrated ground-water flow model was used to assess future ground-water conditions based on proposed water-supply projects in the existing management plan for the Santa Clara–Calleguas ground water basin and seven alternative water-supply projects. Two different approaches were used to estimate future recharge, streamflow, and climate-related water-demand conditions for input to these model simulations: (1) a 24-year projection (1994–2017) using historical estimates of recharge and measured streamflow, and (2) a 44-year projection (1994–2037) using spectral estimates of future precipitation. The model simulations were used to assess the effects of increased recharge, reduced pumpage, and shifted pumpage (from lower- to upper-aquifer system) on ground-water storage depletion and related coastal landward flow (seawater intrusion) and land subsidence.
The model simulations of the proposed water-supply projects in the existing management plan assume average pumpage from 1984–93 with historical inflows (base-case 1) and with spectral estimates of inflows (base-case 4), a rolling cut back in pumpage (base-case 2), and a step cut back in pumpage (base-case 3). All the simulations of the proposed water-supply projects reduced pumpage in the FGMA areas which resulted in a reduction but not an elimination of storage depletion and related coastal landward flow (seawater intrusion) and subsidence, a reduction in streamflow recharge, and an increase in coastal seaward flow and underflow to adjacent subareas from the Oxnard Plain. However, the immediate reduction in pumpage represented by the step cut-back projection showed the largest reduction in coastal landward flow (seawater intrusion) and land subsidence. A comparison of simulations of future ground-water conditions, based on historical inflows (base case 1) and a spectral estimate of inflows (base case 4), shows increased coastal landward flow (seawater intrusion), storage depletion, and increased land subsidence for base-case 4 due to a drought projected earlier in the spectral estimate of inflows than in the historical inflows. The spectral estimate probably provides a smoother and more realistic transition between historical and future climatic conditions.

152 Simulation of Ground-Water/Surface-Water Flow in the Santa Clara–Calleguas Ground-Water Basin, Ventura County, California
Simulations of alternative water-supply projects indicated some differences in hydrologic responses relative to the simulations of the proposed water-supply projects in the existing management plan. Stopping pumpage primarily in the lower-aquifer system in the South Oxnard Plain subarea had the largest effect on reducing coastal landward flow (seawater intrusion) of all the potential cases evaluated. The shifting of pumpage from the lower- to the upper-aquifer system in the South Oxnard Plain subarea yielded the largest combined effect on coastal flow with a reduction of coastal landward flow in the lower-aquifer system and coastal seaward flow from the upper-aquifer system. A seawater-barrier injection projection stopped coastal landward flow (seawater intrusion) into the upper-aquifer system but also resulted in large quantities of coastal seaward flow. The recharge of water in Happy Camp Canyon resulted in water-level rises that were above land surface (not feasible) in the East Las Posas Valley subarea and did not result in significant changes in hydrologic conditions in other parts of the basin.
Water-resource management alternatives may require implementation of feasible demand-side pumpage strategies that do not create adverse effects, such as seawater intrusion and land subsidence, during the driest parts of the dry climate cycles. Management practices should consider the natural climatic cycles that are dominant factors in the supply and demand aspects of the hydrologic budget and hydrologic cycle.
Management of the regional-aquifer system may require the implementation of feasible supply-side recharge projects that do not create adverse effects during the wettest parts of the wet climate cycles; such effects include the potential for liquefaction or contaminant mobilization from water levels that could approach the land surface. Near-surface ground-water levels currently controlled by ground-water pumpage along Arroyo Simi in Simi Valley could occur in areas, such as South Las Posas Valley subarea and the Oxnard Plain Forebay, where additional recharge projects are planned. Contaminant mobilization of organic and inorganic constituents from agricultural and treated sewage effluent can occur when unsaturated sediments become saturated or semiperched systems are hydraulically reconnected to the upper-aquifer system by rising water levels. Evaluation of future management projects may require simulating multiple projects as opposed to individual water-supply projects as was done for this study. Optimization modeling may
be used to better evaluate the effects of multiple water-supply projects, allocate the final distribution of resources among the final set of supply and demand components, and delineate the limits of feasibility of any combination of water-supply projects and water-resource management policies.
SELECTED REFERENCES
Adams, F., 1913, Irrigation resources of California and their utilization: Washington, U.S. Government Printing Office, U.S. Office of Experiment Stations series, Bulletin 254, 95 p.
Bennett, G. D., Kontis, A. L., and Larson, S. P., 1982, Representation of multi-aquifer well effects in three-dimensional ground-water flow simulation: Ground Water, v. 20, no. 3, p. 334–341.
Blake, T.F., and Larson, R.A., eds., 1991, Engineering geology along the Simi-Santa Rosa Fault system and adjacent areas, Simi Valley to Camarillo, Ventura County, California: Association of Engineering Geologists, Southern California Section, [Los Angeles, Calif.], 1991, Annual Field Trip Guidebook, 2 v.
Blaney, H. F., and Criddle, W. D., 1950, Determining water requirements in irrigated areas from climatological and irrigated data: [Washington], Soil Conservation Service, 48 p.
———1962, Determining consumptive use and irrigation water requirements: U.S. Department of Agriculture, Agricultural Research Service, Technical Bulletin 1275, 59 p.
Brownlie, W.R., and Taylor, B.D., 1981, Sediment management for southern California mountains, coastal plains, and shoreline—Part C., Coastal sediment delivery by major rivers in southern California: California Institute of Technology, Environmental Quality Laboratory, EQL Report 17-C, 83 p.
California Department of Public Works, 1934, Ventura County investigation: California Department of Public Works, Division of Water Resources Bulletin 46, 244 p.
———1950, Crop survey—Ventura County, surveyed 1949–50 [map]: California Department of Public Works, Division of Water Resources [map available at California Department of Water Resources, Map Library, 1416 9th Street, Sacramento, CA 95814].
California Department of Water Resources, 1958, Sea water intrusion in California: California Department of Water Resources Bulletin 63, 91 p.
———1964, Names and areal code numbers of hydrologic areas in the Southern District: [Sacramento, Calif.], California Department of Water Resources, 57 p.

Selected References 153
———1965, Sea-water intrusion: Oxnard Plain of Ventura County: California Department of Water Resources Bulletin 63-1, variously paged.
———1967, Ground water basin protection projects: Oxnard Basin, salinity barrier, Ventura County: [Sacramento, Calif.], California Department of Water Resources, Progress Report, 132 p.
———1970, Memorandum Report for Southern District, Ventura County land use survey: 1969 Ventura County and Upper Santa Clara River Drainage Area Land and Water Use Study: California Department of Water Resources, maps 63-44 Camarillo, 61-45 Fillmore, 62-45 Moorpark, 63-45 Newbury Park, 63-43 Oxnard, 61-46 Piru, 62-44 64-44 Point Mugu, 62-44 Santa Paula, 61-44 Santa Paula Peak, 62-43 Saticoy, 62-46 Simi, 62-42 Ventura.
———1971, Sea-water intrusion: Aquitards in the coastal ground water basin of Oxnard Plain, Ventura County: California Department of Water Resources Bulletin 63-4, 569 p.
———1974a, Mathematical modeling of water quality for water resources management. Volume 1, Development of the ground water quality model: [Sacramento, Calif.], California Department of Water Resources, Southern District, 204 p.
———1974b, Mathematical modeling of water quality for water resources management, development of the ground water quality model. Volume 2, Development of historic data for the verification of the ground water quality model of the Santa Clara–Calleguas area, Ventura County: [Sacramento, Calif.], California Department of Water Resources, Southern District, 114 p.
———1975, Compilation of technical information records for the Ventura County cooperative investigation: [Sacramento, Calif.], California Department of Water Resources, v. 2, 234 p.
———1981a, Ventura County and upper Santa Clara River Drainage Area Land Use Study 1980: District Report: [Sacramento, Calif.], California Department of Water Resources, Southern District, 25 p.
———1981b, Standard land use legend: [Sacramento, Calif.], California Department of Water Resources, 8 p.
———1988, Ventura County and the upper Santa Clara River drainage area land use survey, map 63-43 Oxnard, Calif.: Unpublished map series on file with California Department of Water Resources, Southern District.
California Division of Oil and Gas, 1977, Subsidence study of Oxnard Oil Field and vicinity, Ventura County, California: California Department of Conservation, Division of Oil and Gas Report, 45 p.
California State Water Resources Board, 1956, Ventura County Investigation: [Sacramento, Calif.], California Water Resources Board, Bulletin 12, v. 1, variously paged.
CH2M HILL, 1992, North Las Posas Basin ASR demonstration project: Denver, Colo., variously paged [available from Metropolitan Water District of Southern California, 700 N. Alameda St., Los Angeles, CA 90012].
———1993, Hydrogeology and three-dimensional ground-water flow model of the Las Posas Basin, Ventura County, California: Denver, Colo., variously paged [available from Metropolitan Water District of Southern California, 700 N. Alameda St., Los Angeles, CA 90012].
County of Ventura Public Works Agency, 1975, Compilation of technical information records for the Ventura County cooperative investigation: [Sacramento, Calif.], California Department of Water Resources, 28 p.
———1990, Oxnard Plain of Ventura County, 1989 seawater intrusion study: [Sacramento, Calif.], California Department of Water Resources, 5 p.
Dahlen, M.Z., 1992, Sequence stratigraphy, depositional history and Middle to Late Quaternary sea levels of the Ventura shelf, California: Quaternary Research, v. 38, no. 2, p. 234–245.
Dahlen, M.Z., Osborne, R.H., and Gorsline, D.S., 1990, Late Quaternary history of the Ventura mainland shelf, California: Marine Geology, v. 94, no. 4, p 317–340.
Dal Pozzo, P., 1992, Stream loss and stream loss blockage in Santa Paula Creek: United Water Conservation District, open-file report, 17 p.
Densmore, J.N., 1996, Data from ground-water monitoring wells in the Oxnard Plain, Pleasant Valley, and Las Posas subbasins, Ventura County, California, 1989–95: U.S. Geological Survey Open-File Report 96-120, 179 p.
Densmore, J.N., Middleton, G.K., and Izbicki, J.A., 1992, Surface-water releases for ground-water recharge, Santa Clara River, Ventura County, California, in Herrmann, Raymond, ed., Managing Water Resources during Global Change: Proceedings of the American Water Resources Association Annual Meeting, Jackson Hole, Wyoming, p. 407–416.
Dettinger, M.D., Ghil, M., Strong, C.M., Weibel, W., and Yiou, P., 1995, Software expedites singular-spectrum analysis of noisy time series: Eos, Transactions of the American Geophysical Union, v. 76, no. 2, p. 12, 14, 21.
Dibblee, T.W., 1988, Geologic map of the Ventura/Pitas Point Quadrangles, Ventura County, California: Santa Barbara, Calif., Dibblee Geological Foundation, Dibblee Foundation Map series, DF-21, scale 1:24,000.

154 Simulation of Ground-Water/Surface-Water Flow in the Santa Clara–Calleguas Ground-Water Basin, Ventura County, California
———1990a, Geologic map of the Fillmore Quadrangle, Ventura County, California: Santa Barbara, Calif., Dibblee Geological Foundation, Dibblee Foundation Map series, DF-27, scale 1:24,000.
———1990b, Geologic map of the Santa Paula Peak Quadrangle, Ventura County, California: Santa Barbara, Calif., Dibblee Geological Foundation, Dibblee Foundation Map series, DF-26, scale 1:24,000.
———1991, Geologic map of the Piru Quadrangle, Ventura County, California: Santa Barbara, Calif., Dibblee Geological Foundation, Dibblee Foundation Map series, DF-34, scale 1:24,000.
———1992a, Geologic map of the Simi Quadrangle, Ventura County, California: Santa Barbara, Calif., Dibblee Geological Foundation, Dibblee Foundation Map series, DF-39, scale 1:24,000.
———1992b, Geologic map of the Moorpark Quadrangle, Ventura County, California: Santa Barbara, Calif., Dibblee Geological Foundation, Dibblee Foundation Map series, DF-40, scale 1:24,000.
———1992c, Geologic map of the Santa Paula quadrangle: Ventura County, California: Santa Barbara, Calif., Dibblee Geological Foundation, Dibblee Foundation Map series, DF-41, scale 1:24,000.
———1992d, Geologic map of the Saticoy quadrangle: Ventura County, California: Santa Barbara, Calif., Dibblee Geological Foundation, Dibblee Foundation Map series, DF-42, scale 1:24,000.
Dibblee, T.W., and Ehrenspeck, H.E., 1990, Geologic Map of the Camarillo and Newbury Park Quadrangles, Ventura County, California: Santa Barbara, Calif., Dibblee Geological Foundation, Dibblee Foundation Map series, DF-28, scale 1:24,000.
Duell, L.F.W., Jr., 1992, Use of regression models to estimate effects of climate change on seasonal streamflow in the American and Carson River basins, California–Nevada, in Herrmann, Raymond, ed., Managing water resources during global change: AWRA 28th annual conference and symposium: An international conference, Reno, Nevada, November 1–5, 1992: Bethesda, Md., American Water Resources Association, p. 731–740.
England, Evan, and Sparks, Allen, 1988, GEO-EAS (Geostatistical Environmental Assessment Software) User’s Guide: Environmental Monitoring Systems Laboratory Office of Research and Development, U.S. Environmental Protection Agency, Las Vegas, Nevada, EPA600/4-88/033, variously paged.
Farnsworth, R.K., Thompson, E.S., and Peck, E.L., 1982, Evaporation atlas for the contiguous 48 United States: U.S. Dept. of Commerce, National Oceanic and Atmospheric Administration, National Weather Service, NOAA Technical Report NWS 33, 26 p.
Finkle, F.C., 1909, Report on irrigation project for Lower Santa Clara Valley, Ventura County, California to Messrs. James H. Adams & Company and Wm. R. Staats Company: Consulting Engineer Report, 91 p.
Fox Canyon Groundwater Management Agency, 1997, Ordinance 5.5: An ordinance to reduce groundwater extractions: Board of Directors of the Fox Canyon Groundwater Management Agency, 13 p. [ordinance available from the California Water Resources Division, Ventura County Government Center, Administration Building, 800 South Victoria Avenue, Ventura, California 93009-1600].
Freckleton, J.R., Martin, Peter, and Nishikawa, Tracy, 1998, Geohydrology of storage unit III and a combined flow model of the Santa Barbara and Foothill ground-water basins, Santa Barbara County, California: U.S. Geological Survey Water-Resources Investigations Report 97-4121, 80p.
Freeman, V. M., 1932, Report on the study of capacity of underground reservoirs and calculated depletion and replenishment of underground stored water during the period January 1928 to March 1, 1932: [Santa Paula, Calif.], Santa Clara Water Conservation District Report, 27 p.
———1968, People-land-water: Santa Clara Valley and Oxnard Plain, Ventura County, California: Los Angeles, Calif., Lorrin L. Morrison, 227 p.
Galloway, D.L., Hudnut, K.W., Ingebritsen, S.E., Phillips, S.P., Peltzer, G., Rogez, F., and Rosen, P.A., 1998, Detection of aquifer system compaction and land subsidence using interferometric synthetic aperture radar, Antelope Valley, Mojave Desert, California: Water Resources Research, v. 34, no. 10, pp. 2573–2585.
Gardner D., 1995, Summary of operations report—Mound Basin ground water management program construction of monitoring wells: Ventura, Calif., Fugro West Inc., variously paged [available from City of San Buenaventura].
Greene, H.G., Wolf, S.C., and Blom, K.G., 1978, The marine geology of the eastern Santa Barbara Channel, with particular emphasis on the ground water basins offshore from the Oxnard Plain, southern California: U.S. Geological Survey Open-File Report 78-305, 104 p.
Grunsky, C.E., 1925, Report on the water resources of the Santa Clara River Valley: C.E. Grunsky Company, Engineers, 100 p.

Selected References 155
Hanson, R.T., 1989, Aquifer-system compaction, Tucson basin and Avra Valley, Arizona: U.S. Geological Survey Water-Resources Investigations Report 88-4172, 69 p.
———1995, Land subsidence in the Oxnard Plain of the Santa Clara–Calleguas basin, Ventura County, California [abs.], in Prince, K.R., Galloway, D.L., and Leake, S.A., eds., U.S. Geological Survey Subsidence Interest Group conference, Edwards Air Force Base, Antelope Valley, California, November 18–19, 1992: Abstracts and summary: U.S. Geological Survey Open-FIle Report 94-532, p. 37–39.
———1996, Postaudit of head and transmissivity estimates and ground-water flow models of Avra Valley, Arizona: U.S. Geological Survey Water-Resources Investigations Report 96-4045, 84 p.
Hanson, R.T., and Benedict, J.F., 1994, Simulation of ground-water flow and potential subsidence, upper Santa Cruz Basin, Arizona: U.S. Geological Survey Water-Resources Investigations Report 93-4196, 47 p.
Hanson, R.T., and Dettinger, M.D., 1996, Combining future ground-water and climate scenarios as a management tool for the Santa Clara–Calleguas basin, Southern California [abs.]: Eos, Transactions, American Geophysical Union, v. 77, no. 46, p. F55.
Hanson, R.T., and Nishikawa, Tracy, 1992, Flow-meter data: an important addition to aquifer-test analysis for modeling layered aquifer systems [abs.]: Eos, Transactions, American Geophysical Union, v. 73, no. 43, p. 165.
———1996, Combined use of flowmeter and time-drawdown data to estimate hydraulic conductivities in layered aquifer systems: Ground Water, v. 34, no. 1, p. 84–94.
Harbaugh, A.W., and McDonald M.G., 1996, User’s Documentation for MODFLOW-96, and update to the U.S. Geological Survey modular finite-difference ground-water flow model: U.S. Geological Survey Open-File Report 96-485, 56 p.
Holzer, T.L., 1981, Preconsolidation stress of aquifer systems in areas of induced land subsidence: American Geophysical Union, Water Resources Research, v. 17, no. 3, p. 693–04.
Hsieh, P.A., and Freckleton, J.R., 1993, Documentation of a computer program to simulate horizontal-flow barriers using the U.S. Geological Survey’s modular three-dimensional finite-difference ground-water flow model: U.S. Geological Survey Open-File Report 92-477, 32 p.
Ireland R.L., Poland, J.F., and Riley, F.S., 1984, Land Subsidence in the San Joaquin Valley, California, as of 1980: U.S. Geological Survey Professional Paper 437-I, 93 p.
Izbicki, J.A., 1991, Chloride sources in a California coastal aquifer, in Peters, H.J., ed., Ground water in the Pacific Rim countries: Proceedings of the symposium sponsored by the Irrigation and Drainage Division of the American Society of Civil Engineers, Honolulu, Hawaii, July 23–25, 1991: New York, American Society of Civil Engineers, p. 71–77.
———1992, Sources of chloride in ground water of the Oxnard Plain, California, in Prince, K. R., and Johnson, A.I., eds., 1992, Aquifers of the Far West: Papers presented at AWRA Symposium on Water Supply and Water Reuse, 1992 and beyond, June 2–6, 1991, San Diego, California: Bethesda, Md., American Water Resources Association, AWRW Monograph series, no. 16, p. 5–14.
———1996a, Seawater intrusion in a coastal California aquifer: U.S. Geological Survey, Fact Sheet 125-96, 4 p.
———1996b, Source, movement, and age of ground water in a coastal California aquifer: U.S. Geological Survey, Fact Sheet 126-96, 4 p.
Izbicki. J.A., and Martin, Peter, 1997, Use of isotopic data to evaluate recharge and geologic controls on the movement of ground water in Las Posas Valley, Ventura County, California: U.S. Geological Survey, Water-Resources Investigations Report 97-4035, 12 p.
Izbicki. J.A., Martin, Peter, Densmore, J.N., and Clark, D.A., 1995, Water-quality data for the Santa Clara–Calleguas hydrologic unit, Ventura County, California, October 1989 to December, 1992: U.S. Geological Survey, Open-File Report 95-315, 124 p.
Jakes, M.C., 1979, Surface and subsurface geology of the Camarillo and Las Posas Hills Area, Corvalis, Ore., Oregon State University, M.S. thesis, 105 p.
Jiang, N., Neelin, D., and Ghil, M., 1995, Quasi-quadrennial and quasi-biennial variability in the equatorial Pacific: Climate Dynamics, v. 12, p. 101–112.
Johnson, R.L., and Yoon, Y., 1987, Report on Santa Rosa groundwater basin management plan: Boyle Engineering Corp. consulting report for city of Thousand Oaks and Camarosa County Water District, no. VT-T01-107-05, variously paged.
Kennedy, M.P., Greene, H.G., and Clarke, S.H., 1987, Geology of the California continental margin: Explanation of the California continental margin geologic map series: Interpretive methods symbology, stratigraphic units, and bibliography: California Division of Mines and Geology Bulletin 207, 110 p.
Keppenne, C.L., and Ghil, M., 1992, Adaptive spectral analysis and prediction of the Southern Oscillation Index, Journal of Geophysical Research, v. 97, p. 20449-20554.

156 Simulation of Ground-Water/Surface-Water Flow in the Santa Clara–Calleguas Ground-Water Basin, Ventura County, California
Koczot, K.M., 1996, Estimating rates and patterns ofhistorical ground-water pumpage for irrigation using a geobased numerical model: San Diego, San DiegoState University, Masters Thesis, 111 p.
Law/Crandall Inc., 1993, Water Resource evaluation Santa Paula ground water basin, Ventura County, California: Consultants Report to United Water Conservation District, March 1993, 71 p.
Leake, S.A., and Prudic, D.E., 1991, Documentation of a computer program to simulate aquifer-system compaction using the modular finite-difference ground-water flow model: U.S. Geological Survey Techniques of Water-Resources Investigations, book 6, chap. A2, 68 p.
Mann, John F. Jr. and Associates, 1959, A plan for ground water management --- United Water Conservation District: La Habra, California, [consulting ground-water geologists], 131 p.
Martin, Peter, 1986, Southern California alluvial basins regional aquifer-system study, in Sun, R.L. (ed.), Regional Aquifer-System Analysis Program of the U.S. Geological Survey— summary of projects, 1978–84, U.S. Geological Survey Circular 1002, p. 245–247.
———1993, Southern California basins interim report: 12 p.Martin, Peter, and Berenbrock, Charles, 1986, Ground-water
monitoring at Santa Barbara, California: Phase 3--Development of a three dimensional digital ground-water flow model for storage unit I of the Santa Barbara ground-water basin: U.S. Geological Survey Water-Resources Investigations Report 86-4103, 58 p.
McDonald, M.G., 1984, Development of a multi-aquifer well option for a modular ground-water flow model, in Proceedings of the National Water Well Conference on Practical Applications of Ground Water Models Aug. 15–17, 1984, variously paged.
McDonald, M.G., and Harbaugh, A. W., 1988, A modular three-dimensional finite-difference ground-water flow model: Techniques of Water-Resources Investigations of the U.S. Geological Survey, book 6, chap A1, 586 p.
McDonald, M.G., Harbaugh, A.W., Orr, B.R., and Ackerman, D. J., 1991, A method of converting no-flow cells to variable-head cells for the U.S. Geological Survey modular finite-difference ground-water flow model: U.S. Geological Survey Open-File Report 91-536, 99 p.
National Atmospheric and Oceanic Administration, 1994, The International Tree Ring Data Base, NOAA's World Data Center-A for Paleoclimatology, Boulder, Colorado, 1994.
Neuman, S.P., and Witherspoon, P.A., 1972, Field determination of the hydraulic properties of leaky multiple aquifer systems: Water Resources Research, v. 8, no. 5, p. 1284–1298.
Nishikawa, Tracy, 1997, Testing alternative conceptual models of seawater intrusion in a coastal aquifer using computer simulation, Southern California, USA: Hydrogeology Journal, v. 5, no. 3, p. 60–74.
Pollock, D.W., 1989, Documentation of computer programs to compute and display pathlines using results from the U.S. Geological Survey modular three-dimensional finite-difference ground-water flow model: U.S. Geological Survey Open-File Report 89-381, 188 p.
Predmore, S.K., 1993, Use of a geographic information system to identify abandoned wells: U.S. Geological Survey Open-File Report 93-147, 1 sheet.
Predmore, S.K., Koczot, K.M., and Paybins, K.S., 1997, Documentation and description of the digital spatial data base for the Southern California Regional Aquifer-System Analysis Program, Santa Clara–Calleguas Basin, Ventura County, California: U.S. Geological Survey Open-File Report 96-629, 100 p.
Press, W.H., Flannery, B.P., Teukolsky, S.A., and Vetterling, W.T., 1989, Numerical recipes— The art of scientific computing (FORTRAN Version): Cambridge University Press, New York, 702 p.
Prudic, D.E., 1989, Documentation of a computer program to simulate stream-aquifer relations using a modular, finite-difference, ground-water flow model: U.S. Geological Survey Open-File Report 88-729, 113 p.
Prudic, D.E., and Herman, M.E., 1996, Ground-water flow and simulated effects of development in Paradise Valley, a basin tributary to the Humboldt River in Humboldt County, Nevada: U.S. Geological Survey Professional Paper 1409-F, 92 p.
Quinn, W.H., and Neal, V.T., 1987, El Niño occurrences over the past four and a half centuries: Journal of Geophysical Research, v. 92, no. C13, p. 14449–14461.
Reichard, E.G., 1995, Ground-water/surface-water management with stochastic surface-water supplies: A simulation-optimization approach: Water Resources Research, v. 31, no. 11, p. 2845–2865.
Santa Barbara County Water Agency, 1977, Adequacy of the ground-water basin of Santa Barbara County: Santa Barbara County Water Agency, chap 4, p. 1–14.
Stamos, C.L., Predmore, S.K., and Zohdy, A.A.R., 1992, Use of D-C resistivity to map saline ground water, in Engman, E.T. (ed.), Saving a threatened resource—in search of solutions: Proceedings of the irrigation and drainage sessions at Water Forum ‘92, Baltimore, Md., p. 80–85.
Taylor, B.D., Brown, W.M., and Brownlie, W.R., 1977, Sediment management for southern California mountains, coastal plains, and shoreline—Progress Report No. 3: Environmental Quality Laboratory, California Institute of Technology, Open File Report 77-8, variously paged.

Selected References 157
Turner, J.M., 1975, Ventura County water resources management study—Aquifer delineation in the Oxnard–Calleguas area, Ventura County: Technical Information Record, January 1975, Ventura County Department of Public Works Flood Control District, 45 p.
United Water Conservation District, 1983, Appendix for report on proposed Freeman Diversion Improvement Project, Public Law 84-984.
———1986, Hydrologic conditions of water resources within United Water Conservation District: Report for Water Year 1984–85 beginning October 1, 1984 and ending September 30, 1985, 18 p.
———1991, Untitled: Unpublished map delineating groundwater basins in the United Water Conservation District: Ventura County, Calif. [on file with United Water Conservation District].
Vautard, R., Yiou, P., and Ghil, M., 1992, Singular-spectrum analysis: A toolkit for short, noisy chaotic signals: Physica D, v. 58, p. 95–126.
Ventura County Board of Supervisors, 1988, Ventura County general plan, goals, policies, and programs—hazards appendix: Ventura County Board of Supervisors document no. 1D297-1.90 and no. I198, adopted May 24, 1988, 146 p.
Ventura County Public Works Agency, 1973, Santa Paula Creek Percolation Study: Ventura County Department of Public Works, Flood Control District, Hydrology Section, 18 p.
———1990, Quadrennial report of hydrologic data 1985–88: Ventura County Department of Public Works, Flood Control Department, variously paged.
———1993, Quadrennial report of hydrologic data 1989–92: Ventura County Department of Public Works, Flood Control Department, Planning and Regulatory Division, Hydrology Section, variously paged.
Ventura County Resource Management Agency, Environmental Health Department, 1980, 208 Areawide waste treatment management planning study: Technical appendix G, p. 341–356.
Webb, R.H., and Bettancourt, J.L., 1990, Climatic variability and flood frequency of the Santa Cruz River, Pima County, Arizona: U.S. Geological Survey Water-Supply Paper 2379, 40 p.
Weber, F.H., Kiessling, E.W., Sprotte, E.C., Johnson, J.A., Sherburne, R.W., and Cleveland, G.B., 1976, Seismic hazards study of Ventura County, California: California Department of Conservation, California Division of Mines and Geology Open-File Report 76-5, 396 p., pls. 3A and 3B.
Yerkes, R.F., Sarna-Wojcicki, A.M., and Lajoie, K.R., 1987, Geology and Quaternary deformation of the Ventura area, in Recent reverse faulting in the Transverse Ranges, California: U.S. Geological Survey Professional Paper 1339, p. 169–178.
Yeats, R.S., 1983, Large-scale Quaternary detachments in the Ventura basin, southern California: Journal of Geophysical Research, v. 88, p. 569–583.
Zohdy, A.A.R., Martin, P., and Bisdorf, R. J., 1993, A study of seawater intrusion using direct-current soundings in the southeastern part of the Oxnard Plain, California: U.S. Geological Survey Open-File Report 93-524, 138 p.

THIS PAGE LEFT BLANK INTENTIONALLY