LOW-FLOW CHARACTERISTICS OF KENTUCKY - the USGS
17
LOW-FLOW CHARACTERISTICS OF KENTUCKY STREAMS By Kevin J . Ruhl and Gary R . Martin U .S . GEOLOGICAL SURVEY Water-Resources Investigations Report 91-4097 Prepared in cooperation with the KENTUCKY NATURAL RESOURCES AND ENVIRONMENTAL PROTECTION CABINET Louisville, Kentucky 1991
Transcript of LOW-FLOW CHARACTERISTICS OF KENTUCKY - the USGS

LOW-FLOW CHARACTERISTICSOF KENTUCKY STREAMS
By Kevin J . Ruhl and Gary R. Martin
U.S. GEOLOGICAL SURVEY Water-Resources Investigations Report 91-4097
Prepared in cooperation with the KENTUCKY NATURAL RESOURCES AND ENVIRONMENTAL PROTECTION CABINET
Louisville, Kentucky 1991
Nick
Text Box
Click here to return to USGS publications

������
U.S . DEPARTMENT OF THE INTERIOR
MANUEL LUJAN, JR ., Secretary
U .S . GEOLOGICAL SURVEY
Dallas L . Peck, Director
For additional information Copies of this report may be write to : purchased from :
District Chief U .S . Geological Survey U .S . Geological Survey Books and Open-File Reports Section 2301 Bradley Avenue Federal Center, Box 25425 Louisville, KY 40217 Denver, CO 80225

CONTENTS
Page
Abstract . . . . . . . . . . . . . . . . . . . . . . . . . . . . . . . . . . . . . . . . . . . . . . . . . . . . . . . . . . . . . . . 1Introduction . . . . . . . . . . . . . . . . . . . . . . . . . . . . . . . . . . . . . . . . . . . . . . . . . . . . . . . . . . . 1
Purpose and scope . . . . . . . . . . . . . . . . . . . . . . . . . . . . . . . . . . . . . . . . . . . . . . . . . 2Background . . . . . . . . . . . . . . . . . . . . . . . . . . . . . . . . . . . . . . . . . . . . . . . . . . . . . . . . 2Previous studies . . . . . . . . . . . . . . . . . . . . . . . . . . . . . . . . . . . . . . . . . . . . . . . . . . 3Physiography and geology . . . . . . . . . . . . . . . . . . . . . . . . . . . . . . . . . . . . . . . . . . 4Climate . . . . . . . . . . . . . . . . . . . . . . . . . . . . . . . . . . . . . . . . . . . . . . . . . . . . . . . . . . 4
Selected streamflow characteristics . . . . . . . . . . . . . . . . . . . . . . . . . . . . . . . . . . . . 7Low-flow frequency . . . . . . . . . . . . . . . . . . . . . . . . . . . . . . . . . . . . . . . . . . . . . . . . 7
Continuous-record gaging stations . . . . . . . . . . . . . . . . . . . . . . . . . . . 7Partial-record gaging stations . . . . . . . . . . . . . . . . . . . . . . . . . . . . . . 12
Streamflow indices . . . . . . . . . . . . . . . . . . . . . . . . . . . . . . . . . . . . . . . . . . . . . . . . 13Streamflow-recession index . . . . . . . . . . . . . . . . . . . . . . . . . . . . . . . . . . 15Streamflow-variability index . . . . . . . . . . . . . . . . . . . . . . . . . . . . . . . . 15
Selected basin characteristics . . . . . . . . . . . . . . . . . . . . . . . . . . . . . . . . . . . . . . . . . 16Development of estimating equations . . . . . . . . . . . . . . . . . . . . . . . . . . . . . . . . . . . . 18
Estimating equations . . . . . . . . . . . . . . . . . . . . . . . . . . . . . . . . . . . . . . . . . . . . . . 20Limitations and accuracy . . . . . . . . . . . . . . . . . . . . . . . . . . . . . . . . . . . . . . . . . . 22
Estimating low-flow frequency values at stream sites in Kentucky . . . . . . . 28Stream sites with gage information . . . . . . . . . . . . . . . . . . . . . . . . . . . . . . . . 28
Sites at gage locations . . . . . . . . . . . . . . . . . . . . . . . . . . . . . . . . . . . . . 28Sites near gage locations . . . . . . . . . . . . . . . . . . . . . . . . . . . . . . . . . . . 28Sites between gage locations . . . . . . . . . . . . . . . . . . . . . . . . . . . . . . . . 31
Stream sites with no gage information . . . . . . . . . . . . . . . . . . . . . . . . . . . . . 31Sites with drainage basins in one index area . . . . . . . . . . . . . . . . 32Sites with drainage basins in more than one index area . . . . . . 32
Summary . . . . . . . . . . . . . . . . . . . . . . . . . . . . . . . . . . . . . . . . . . . . . . . . . . . . . . . . . . . . . . . . 34References . . . . . . . . . . . . . . . . . . . . . . . . . . . . . . . . . . . . . . . . . . . . . . . . . . . . . . . . . . . . . 35
ILLUSTRATIONS
Page
Plate 1 . Location of the streamflow-variability index boundaries and selected continuous-record gaging stations in In Kentucky . . . . . . . . . . . . . . . . . . . . . . . . . . . . . . . . . . . . . . . . . . . . . . . . . pocket
2 . Location of selected low-flow partial-record gaging In stations in Kentucky . . . . . . . . . . . . . . . . . . . . . . . . . . . . . . . . . . . . . pocket
Figure 1 . Map showing physiographic regions in Kentucky . . . . . . . . . . . . . . . 52 . Map showing generalized carbonate areas and
surficial karst development in Kentucky . . . . . . . . . . . . . . . . . . 63-6 . Graphs showing :
3 . Lowest annual mean value for 7 consecutive days for years ending March 31, 1953-87, for Buck Creek near Shopville, Kentucky . . . . . . . . . . . . . . . . . . . . . . . . . . . . . 9
Page
4 . Frequency curves of annual 7-day low flows for Nolin River at White Mills and Troublesome Creek at Noble, Kentucky . . . . . . . . . . . . . . . . . . . . . . . . . . . . . 11
5 . Relation between base-flow measurements for Valley Creek near Glendale and concurrent daily mean flows for Nolin River at White Mills, Kentucky . . . . . . . . . . . . . 14
6 . Flow duration curves for Nolin River at White Mills and Troublesome Creek at Noble, Kentucky . . . . . . . . . . . . . 17
7 . Graphical solution of the 7-day 2-year low-flow estimating equation for Kentucky . . . . . . . . . . . . . . . . . . . . . . . . . . 23
8 . Graphical solution of the 7-day 10-year low-flow . . . . . . . . . . . . . . . . . . . . . . . . .estimating equation for Kentucky . 24
9-12 . Graphs showing : 9 . Plot of 7-day 2-year low flow from measured
streamflow and from regression equation for selected continuous-record gaging stations in Kentucky . . . . . . . . . . . . . . . . . . . . . . . . . . . . . . . . . 26
10 . Plot of 7-day 10-year low flow from measured streamflow and from regression equation for selected continuous-record gaging stations in Kentucky . . . . . . . . . . . . . . . . . . . . . . . . . . 27
11 . Plot of 7-day 2-year low flow from correlation methods and from regression equation for selected partial-record gaging stations in Kentucky . . 29
12 . Plot of 7-day 10-year low flow from correlation methods and from regression equation for selected partial-record gaging stations in Kentucky . . 30
TABLES
Page
Streamflow characteristics for selected continuous-record gaging stations in Kentucky . . . . . . . . . . . . . . . . . . . . . . . . . . . . . . . . 38
Drainage area, streamflow-variability index, and low-flow characteristics estimated from graphical correlation and from regression equations for selected low-flow partial-record gaging stations in Kentucky . . . . . . . . . . . . . . . . . 45

CONVERSION FACTORS
Multiply b To obtain
foot (ft) 0 .3048 meter mile (mi) 1 .609 kilometer square mile (mil) 2 .590 square kilometer cubic foot (ft3 ) 0 .02832 cubic meter cubic foot per second 0 .02832 cubic meter per second
(ft3 /s)
The use of trade or product names in this report is for identification purposes only, and does not constitute endorsement by the U .S . Geological Survey or the Kentucky Natural Resources and Environmental Protection Cabinet .
v

�
LOW-FLOW CHARACTERISTICS OF KENTUCKY STREAMS
By Kevin J . Ruhl and Gary R . Martin
ABSTRACT
Low-flow characteristics were determined for 136 continuous-record and 212 low-flow partial-record streamflow gaging stations in Kentucky . Low-flow frequency curves were developed for the continuous-record gaging stations from daily mean streamflows for unregulated periods of 10 years or more . Through graphical correlation with data from one or more of the continuous-record stations, estimates of selected low-flow frequency values were also made at each of the partial-record stations .
Techniques are presented to estimate the 7-day 2-year and 7-day 10-year low-flow frequency values for ungaged, unregulated streams in Kentucky . These frequency values were determined at each of the continuous-record gaging stations and were related to basin characteristics and streamflow indices using multiple linear regression . The most significant variables for estimating the 7-day 2- and 10-year low-flow values from the analysis were drainage area and streamflow-variability index . The equations developed to estimate the 7-day 2-year and the 7-day 10-year low flows have a standard error of estimate of 71 and 90 percent, respectively .
INTRODUCTION
Knowledge of low-flow characteristics of Kentucky streams is important in decisions regarding water resource planning and management . Information needed to allocate waste-effluent discharges to receiving waters and to estimate surface-water availability for domestic, agricultural, industrial, and recreational supply is vital to the wise management of water resources . Certain waste-effluent discharge limits and water-supply criteria in Kentucky are based on the 7-day 10-year (7Q 10 ) low-flow frequency value, which is the lowest mean value of streamflow for 7 consecutive days having a 10 percent chance of not being exceeded in any year .
Even though the 7-day 2-year (7Q2 ) low-flow frequency value is not used directly in waste-effluent discharge or water-supply criteria for the State, it provides additional insight into the flow characteristics of the stream site . The value also is important in providing additional spatial coverage in the regionalization analysis performed in this study .
As a result of increased demand for low-flow information, the U .S . Geological Survey (USGS), in cooperation with the Kentucky Natural Resources and Environmental Protection Cabinet (KNREPC), analyzed data available from the streamflow-gaging network in Kentucky to update low-flow frequency values and to derive equations to estimate these values at ungaged stream sites . Low-flow frequency values at continuous-record streamflow gaging stations were updated using data through 1987 . Previous reports describing low-flow

�
information of Kentucky streams are by Swisshelm (1974) and Sullavan (1980 and 1984) . Using the updated low-flow values, equations were derived using multiple linear regression techniques to estimate low-flow frequency values at ungaged stream sites .
Purpose and Scope
This report describes the results of a study to (1) update the 7Q and 7Q10 low flows for the continuous-record streamflow-gaging stations for unregulated streamflow periods and for the low-flow partial-record gaging stations in Kentucky, and (2) develop techniques to estimate these low flows for ungaged stream sites in Kentucky .
The values reported are the 7Q2 and 7Q 10 low flows for 136 continuous-
record streamflow stations in Kentucky having 10 or more years of unregulated streamflow record . Frequency values for the continuous-record stations having less than 25 years of unregulated record were adjusted through correlation with data from stations having 25 or more years of record . This was done to adjust values for the effect that climatic variations might have on a short-term record . The 7Q 2 and 7Q low flows were also determined for 212 partial-record stations in Kentucky 19rough correlation of the partial-record station data with the data from the continuous-record stations . Data from some of the partial-record stations were correlated with data from continuous-record stations operated by the USGS in West Virginia and Tennessee .
Selected basin characteristics were determined for each of the 136 continuous- and 212 partial-record stations . These included total and contributing drainage area ; main channel length, slope, and elevation ; basin length and shape ; and mean annual precipitation . For the continuous-record gaging stations, values of streamflow variability and streamflow recession were also determined .
Regionalization of the 7Q2 and 7Q 0 low flows for the continuous-record stations was accomplished using multiple linear regression techniques . The basin characteristics mentioned previously, and the streamflow-variability and streamflow-recession indices were used as regressor variables in the analysis . Techniques are presented to estimate the 7Q2 and 7Q 0 low flows at ungaged stream sites in Kentucky . Examples of the use of Aese techniques are also presented .
Background
Continuous-record gaging stations were first established by the USGS in Kentucky in the early 1900's . Currently (1991), the continuous-record gaging network in Kentucky includes approximately 115 stations . In the intervening time, numerous other continuous-record gaging stations have been operated and subsequently discontinued . Daily mean flows computed at 136 of these continuous-record stations were used in the determination of the 7Q2 and 7Q10low flows . These stations had unregulated streamflow record for 10 or more years . Streamflow records for stations with less than 10 years of

���
unregulated, continuous record were correlated with streamflow records from one or more of the 136 stations to obtain estimates of the 7Q and 7Q10 low flows . These sites were treated as partial-record gaging sta ions and are included in the 212 stations .
Partial-record gaging stations are stream sites located throughout the State where periodic streamflow measurements were made . The measured streamflow values were correlated with the concurrent daily mean flows at nearby continuous-record gaging stations to estimate selected low-flow frequency values at the partial-record station . This network of partial-record stations provided greater spatial coverage of low-flow information . Streamflow measurements were made at a few stations in the late 1940's, but a more concerted effort was made during a drought episode in the early 1950's . In the 1960's and early 1970's, additional measurements were made at these same stations and at other stations . When sufficient information was obtained at a station to estimate low-flow frequency values through correlation with a continuous-record station (usually 8 to 12 measurements), measurements were discontinued at the station and a new station was established elsewhere . This process continued until the early 1980's when the low-flow program was discontinued .
In 1987 and 1988, a limited amount of data was collected at selected partial-record stations operated in the early 1980's to verify existing correlations . Approximately 80 new low-flow partial-record stations also were established in 1988 and measurements continue to be collected at these sites . Additionally, 12 new or discontinued continuous-record stations have been either established or reactivated (1989), through a cooperative effort with the KNREPC . These stations augment the existing continuous-record gaging network used for low-flow information . Because the amount of data collected at the new stations (80 partial-record and 12 continuous-record) is limited, the data could not be incorporated into the analysis described in this report .
Previous Studies
Several reports documenting low-flow characteristics of Kentucky streams have been published . These include a report by Speer and others (1965) which describes low-flow characteristics of streams in the Mississippi Embayment . Swisshelm (1974) reported the 7Q10 low flow at 85 continuous-record and 49 partial-record gaging stations .
Information from Swisshelm (1974) was incorporated into two reports by Sullavan (1980 and 1984) . The report by Sullavan (1984) contained the 7Q2 and 7Q1 low flows for 84 continuous-record and 203 partial-record stations in Ken~ucky . The report by Melcher and Ruhl (1984) is the most recent publication describing low-flow characteristics for Kentucky streams . It incorporated the information contained in Sullavan (1984) plus selected frequency values at approximately 71 additional continuous-record stations including stations with only five or more years of record .
This report updates the values contained in Melcher and Ruhl (1984) for selected low-flow frequencies based on additional information collected at the continuous-record stations and at selected low-flow partial-record stations .
3

���
Because data from the partial-record stations are correlated with data from the continuous-record stations, changes in the frequency values at the partial-record stations may also occur . Such changes are generally small . The updated values for both the continuous- and partial-record stations are included in this report .
Physiography and Geology
The physiography of the State reflects the lithology of the surface rocks in the State and is largely defined by the Cincinnati arch (fig . 1) . The axis of the Cincinnati arch trends north and slightly east from south-central Kentucky to just south of the Inner and Outer Bluegrass boundary where it divides into two branches . The branches are approximately parallel but are separated by approximately 25 mi at the Ohio River (McFarland, 1950) .
East and west from the Cincinnati arch, progressively younger rocks are exposed at the surface . The oldest exposed rocks are part of the Jessamine Dome and the areas adjacent to it . The location of this area corresponds approximately to the Inner Bluegrass region (fig . 1) . These rocks consist of limestone, shale, and sandstone of Ordovician age . Narrow bands of shales and limestones of Silurian and Devonian age surround this area and correspond to the Outer Bluegrass region . An expansive area of limestone of Mississippian age (Mississippian Plateaus Region) is exposed starting at the Ohio River in northeastern Kentucky and extending southwest to the State boundary and northwest in a crescent-shaped area surrounding the Western Coal Field . The eastern boundary of this area is the Cumberland Escarpment (fig . 1) . The youngest rocks are sandstones, shales, siltstones, and coals of Pennsylvanian age in eastern and northwestern Kentucky and correspond to the Eastern and Western Kentucky Coal Fields . Alluvial deposits of Cretaceous and Tertiary age occur in extreme western Kentucky in the Mississippi Embayment .
Much of the Mississippian Plateau is characterized by karst features such as sinkholes, caves, springs, and gaining and losing streams . The distribution of these features is shown in figure 2 . Most well-developed karst features are located in a band originating in west-central Kentucky and extending to south-central Kentucky, southeast to the State boundary, east along the boundary, and then northeast and north (areas shown in black in figure 2) . Less well-developed karst features are in central and south-central Kentucky . The streams in karst areas are characterized by sustained base flow throughout dry periods .
Climate
The mean annual precipitation in Kentucky ranges from about 41 to 53 in . (Conner, 1982) . Rainfall generally decreases to the north, reflecting the increase in distance from the source of precipitation, which is mostly the Gulf of Mexico .
Kentucky's dry season occurs during the fall and October is the driest month . The Bermuda High, which normally resides off the coast of the southeastern United States during summer, moves inland in the fall . In

From Kentucky Geological Survey, 19W
Figure l .--Physiographic regions in Kentucky .

���������
0
CARBONATE AREASWITH GREATER THAN 10 PERCENT SINKHOLES
CARBONATE AREAS WITH 1 TO 10 PERCENT SINKHOLES
CARBONATE AREAS WITH LESS THAN 1 PERCENT SINKHOLES
NONCARBONATE AREAS
EXPLANATION
39° . 85"
0
01 T1 0
I I
50
I 50 100 MILES
I 1
100 KILOMETERS
84" 83~
87° 38Y 0
sr 820
89°
r
From Crawford and Webster,1986
Figure 2 .--Generalized carbonate areas and surficial karst development in Kentucky.

���
October, the normal position of the Bermuda High is over Kentucky and Tennessee . The High retards convective activity and may deflect frontal movements away from Kentucky (Conner, 1982) . As a result, streamflow depends primarily on the discharge of ground water during most of late summer and early fall .
SELECTED STREAMFLOW CHARACTERISTICS
Low-Flow Frequency
Low-flow frequency analyses are usually performed using an annual series of selected low-flow statistics, usually the lowest mean discharge for some number of consecutive days . The annual series for the determinations in this report was based on a year from April 1 to March 31 . The use of this time period allowed for an analysis of an uninterrupted low-flow period . The statistic used for this study was the 7-day low flow (7Q), which is the lowest mean discharge for 7 consecutive days in a year, from April 1 through March 31 .
Frequency curves were developed from this statistic, but only for the period of unregulated streamflow record for each of the continuous-record gaging stations having 10 or more years of unregulated record . Flow data collected after regulation were not used . Values for selected recurrence intervals were obtained from a frequency analysis which attempts to fit the data to a particular distribution, and were compared to values obtained from a frequency curve developed from the station data . The frequency values used in this report are the 7Q2 and 7Q10 low flows . These values are commonly expressed as the minimum 7-day mean discharge with an average recurrence interval of 2 and 10 years, respectively . These values are more correctly expressed as the lowest mean discharge for 7 consecutive days having a SO- and 10-percent chance, respectively, of not being exceeded in any year .
Selected low-flow frequency values were estimated at additional stream sites to provide greater spatial coverage of low-flow information . Approximately 8 to 12 streamflow measurements were made at each site during base-flow conditions . The measured streamflows for each of these sites were then correlated with concurrent daily mean streamflows from nearby continuous-record gaging stations . Estimates of selected low-flow frequency values were made at these sites based on this correlation (Riggs, 1972) .
Continuous-Record Gaging Stations
Selected low-flow frequency values were determined for the period of unregulated streamflow record through 1987 at 136 continuous-record gaging stations shown in plate 1 . These included the 7Q and 7Q10 low flows for the unregulated period of record at stations having 19 or more years of unregulated streamflow record . The values shown in table 1 (at the back of the report) update those values given in previous publications by Swisshelm (1974), Sullavan (1980 and 1984), and Melcher and Ruhl (1984) . Additional streamflow data and the development of new analytical techniques made it necessary to update the frequency values .

���
Each continuous-record gaging station was first screened to determine if the station was regulated and to determine the period of unregulated record (Melcher and Ruhl, 1984) . Many continuous-record gaging stations are affected by reservoir regulation, which has the affect of reducing high flows and augmenting low flows . Those stations with 10 years or more of unregulated record were retained for subsequent analysis . Values of 7Q for each year of unregulated record from April 1 to March 31 were computed using standard methods (Hutchinson, 1975 ; Meeks, 1983) . A time series plot of these values was constructed for each station, an example of which is shown in figure 3 .
Kendall's Tau, a statistic to indicate a monotonic increasing or decreasing trend in a time series, was computed for the period of record at each station using Statistical Analysis System (SAS) programs (Statistical Analysis System, 1982) . At many sites, the Kendall's Tau analysis indicated that a trend did exist . If the trend resulted from changes in the watershed or human activities, the data would need to be detrended, or, possibly, only a part of the record would be used in the frequency analysis . Upon review of the plots of the 7Q with time, however, a consistent increasing pattern became apparent at many of the stations . The trend was deemed to be climatic in nature and not induced by changes within the watershed . The trend is illustrated in figure 3 . The mid-1950's were characterized by many low values of 7Q, followed by another such period in the early 1960's . These periods coincide with droughts that occurred over much of the State . Starting in the late 1960's and continuing throughout the 1970's, a substantial increase in 7Q occurred and the 7Q finally decreased in the early 1980's . The substantial increase in 7Q in the 1970's, as shown in figure 3, is indicated on most of the station plots and is the source of the positive trend in most cases .
Even though no published time-series plots of annual or monthly precipitation data were available, some plots of annual precipitation were obtained from the State Climatologist's Office (Conner, written commun ., 1990) which indicated increased precipitation concurrent to the periods shown in figure 3 . Additionally, for the period 1951-80 (Conner, 1982), it is stated that in 1979 the maximum annual total precipitation was recorded at 41 of 73 precipitation stations in Kentucky, and the year 1972 produced 12 record highs . Other years that produced record high precipitation at one or more recording stations were 1951, 1956, 1957, 1962, 1973, 1975, 1977, and 1978 . The years that these annual highs occurred coincide closely with annual high values of 7Q, as shown in figure 3 . Because of the wide variability in flow conditions and the apparent absence of trend because of changes in watershed conditions, the entire period of streamflow record was used to develop the low-flow frequency curves at each station without prior adjustment for climatic trend .
The frequency curves were developed assuming a Pearson Type III distribution with log transformation (log-Pearson Type III) of the 7Q data (Meeks, 1983) . While the graphical curve is considered the basic curve for annual low flows, Riggs (1972) recommends that the log Pearson Type III curve be used if it is adequate . - The graphical and log Pearson Type III curves were plotted and overlain for comparison, and the log Pearson Type III curve was considered adequate for each of the 136 continuous-record stations, and no adjustments were made .

100
0Z OUW
W a. HWW U 00 U Z
10
0 .01 1940 1950 1960 1970 1980 1990 2000 2010
CLIMATIC YEAR (CLIMATIC YEAR: APRIL 1 TO MARCH 31)
Figure 3.--Lowest annual mean value for seven consecutive days for years ending March 31, 1953-87, for Buck Creek near Shopville, Kentucky.
����
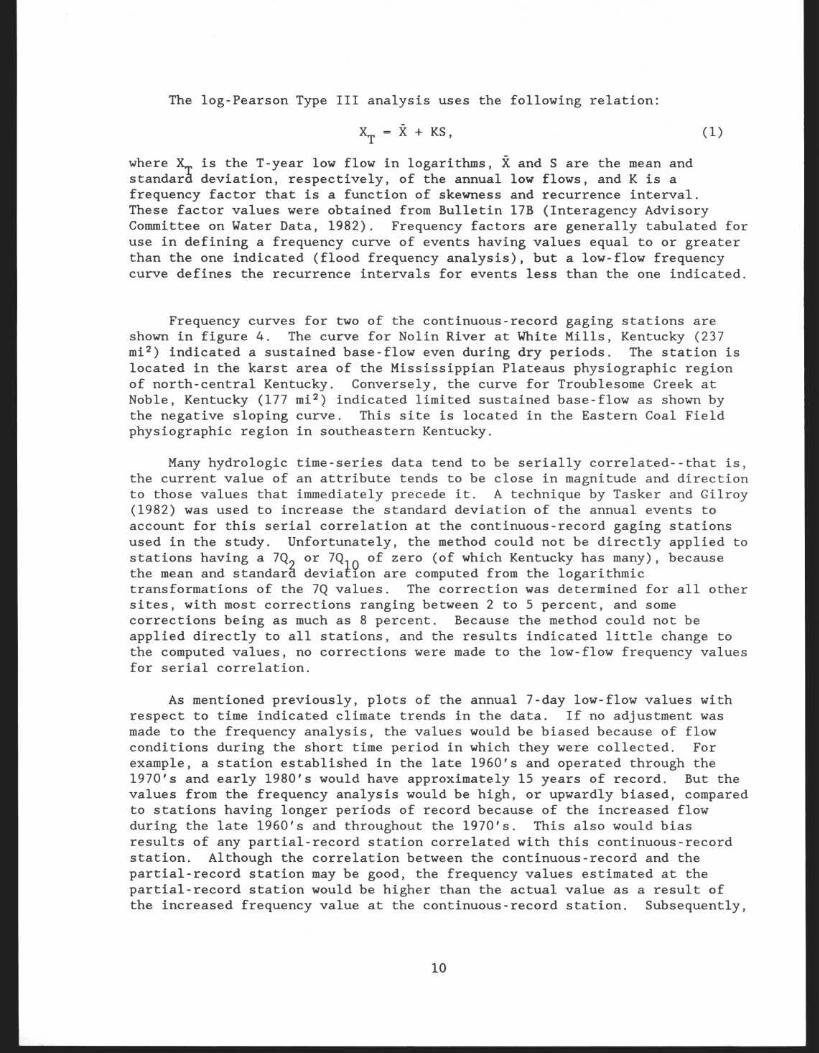
The log-Pearson Type III analysis uses the following relation :
XT =X+KS,
where XT is the T-year low flow in logarithms, X and S are the mean and standard deviation, respectively, of the annual low flows, and K is a frequency factor that is a function of skewness and recurrence interval . These factor values were obtained from Bulletin 17B (Interagency Advisory Committee on Water Data, 1982) . Frequency factors are generally tabulated for use in defining a frequency curve of events having values equal to or greater than the one indicated (flood frequency analysis), but a low-flow frequency curve defines the recurrence intervals for events less than the one indicated .
Frequency curves for two of the continuous-record gaging stations are shown in figure 4 . The curve for Nolin River at White Mills, Kentucky (237 mil) indicated a sustained base-flow even during dry periods . The station is located in the karst area of the Mississippian Plateaus physiographic region of north-central Kentucky . Conversely, the curve for Troublesome Creek at Noble, Kentucky (177 mil) indicated limited sustained base-flow as shown by the negative sloping curve . This site is located in the Eastern Coal Field physiographic region in southeastern Kentucky .
Many hydrologic time-series data tend to be serially correlated--that is, the current value of an attribute tends to be close in magnitude and direction to those values that immediately precede it . A technique by Tasker and Gilroy (1982) was used to increase the standard deviation of the annual events to account for this serial correlation at the continuous-record gaging stations used in the study . Unfortunately, the method could not be directly applied to stations having a 7Q or 7Q 0 of zero (of which Kentucky has many), because the mean and standar devianon are computed from the logarithmic transformations of the 7Q values . The correction was determined for all other sites, with most corrections ranging between 2 to 5 percent, and some corrections being as much as 8 percent . Because the method could not be applied directly to all stations, and the results indicated little change to the computed values, no corrections were made to the low-flow frequency values for serial correlation .
As mentioned previously, plots of the annual 7-day low-flow values with respect to time indicated climate trends in the data . If no adjustment was made to the frequency analysis, the values would be biased because of flow conditions during the short time period in which they were collected . For example, a station established in the late 1960's and operated through the 1970's and early 1980's would have approximately 15 years of record . But the values from the frequency analysis would be high, or upwardly biased, compared to stations having longer periods of record because of the increased flow during the late 1960's and throughout the 1970's . This also would bias results of any partial-record station correlated with this continuous-record station . Although the correlation between the continuous-record and the partial-record station may be good, the frequency values estimated at the partial-record station would be higher than the actual value as a result of the increased frequency value at the continuous-record station . Subsequently,
10

��������
aZOUWU Wa HWW U m U Z L1J0 Q2U
I I I I I 1 .01 1 .1 1 .5 2 3 4 5 10 20 50 100
RECURRENCE INTERVAL, IN YEARS
Figure 4.--Frequency curves of annual 7-day low flows for Nolin River at White Mills and Troublesome Creek at Noble, Kentucky.

��
regional analysis using either the continuous-record station values or both the continuous- and partial-record station values would also be biased .
Continuous-record gaging stations with less than 25 years of unregulated record (short-term stations) were correlated with the concurrent period of record for stations having 25 years or more of unregulated record (long-term stations) to adjust the frequency analysis for the climatic trend . The correlations were performed using the SAS programs (Statistical Analysis System, 1982) . Using techniques outlined by Stedinger and Thomas (1985), an adjusted mean and standard deviation were obtained for the short-term station . These values were used with the station skew of the long-term station to obtain an adjusted value for selected recurrence intervals (eqn . 1) . Factor values, which are a function of the skew coefficient and selected recurrence intervals, were obtained from Bulletin 17B (Interagency Advisory Committee on Water Data, 1982) . Stations with a 7-day 10-year low-flow value of zero were not correlated to long-term sites . The main stem Rough River stations were correlated with Rough River near Madrid, Kentucky (03317000), which has only 20 years of continuous record . The correlation smoothed out the frequency values at the downstream main stem stations .
The frequency values at the continuous-record gaging stations are listed in table 1 . Frequency values in the table for stations currently affected by regulation were for the unregulated period only, except for the Kentucky River stations at Locks 2, 4, and 6 . These stations were established after the construction of Herrington Lake in 1925 . For informational purposes, frequency analysis was performed for these three sites, and the entire period of record was used . Frequency values for Kentucky River stations at Lock 10 and 14 used streamflow record up to 1960, which reflected the unregulated period of record . Even though Martins Fork Lake in southeastern Kentucky had an effect on low flows at the main stem Cumberland River gaging stations, the effect of regulation was probably not significant . Therefore, the entire period of record was used in the frequency analysis for the main stem Cumberland River stations . Frequency analysis for the main stem Ohio River gaging stations was not performed because of the significant effects of regulation, which had continually increased with time throughout the basin . Stations with flows affected by local diversion, and the source of the diversion, are also noted in table 1 . It is not possible to assess the degree to which these local diversions affect low flows, therefore data from these stations were not used in the regression analysis in this report, but are presented for informational purposes .
Partial-Record Gaging Stations
The 7Q and 7Q low flows were determined at 212 partial-record gaging stations for the study (pl . 2) and are given in table 2 at the back of the report . These values were determined through graphical correlation of streamflow records from nearby continuous-record gaging stations having similar basin characteristics and similar geology . Typically, 8 to 12 streamflow measurements were made during base flow conditions at the partial-record station, and these values were correlated with the concurrent daily mean streamflow values at one or more of the continuous-record stations (Riggs, 1972) . A graphical relation was developed for the data set, with the
12