ANALYSIS OF ALTIMETRIC DATA OBTAINED BY LIDAR IN AN …
19
Analysis of altimetric data obtained by lidar in an area of Atlantic forest in southeastern Brazil Elisa Araujo Penna Caris 67 Rev. Tamoios, São Gonçalo (RJ), ano 16, n. 2, pág. 67-85, jan-jun 2020 ANALYSIS OF ALTIMETRIC DATA OBTAINED BY LIDAR IN AN AREA OF ATLANTIC FOREST IN SOUTHEASTERN BRAZIL Análise de dados altimétricos obtidos pelo LiDAR em uma área de floresta Atlântica no sudeste do Brasil Elisa Araujo Penna Caris Pesquisadora Associada do Laboratório Espaço de Sensoriamento Remoto e Estudos Ambientais, Departamento de Geografia, UFRJ [email protected] Carla Bernadete Madureira Cruz Professora Titular do Departamento de Geografia – UFRJ [email protected] Bruno Coutinho Kurtz Pesquisador Titular – Jardim Botânico do Rio de Janeiro [email protected] Artigo enviado para publicação em 01/12/2019 e aceito em 29/04/2020 DOI: 10.12957/tamoios.2020.47023 Abstract We evaluated the accuracies of Digital Terrain Models (DTMs) generated from LiDAR data in an area of montane Atlantic Forest in the municipality of Rio de Janeiro, Brazil, and explored the use of those data to estimate tree heights. We employed the interpolation of data on a regular grid and a Triangular Irregular Network (TIN) using two softwares (ArcGis 10.3 and Fusion), with 0.4 and 1 m pixels, at scales of 1:2,000 and 1:5,000. The DTMs were evaluated using statistical inferences, considering 165 points surveyed using a geodetic Total Station (TS) in a 20x50 m plot. The models were classified according to the standard regulatory instructions of National Cartography technical norms. Accuracy varied from 0.59 m to 0.63 m among the specifications use for scales of 1:2,000 and 1:5,000. The maximum tree crown heights encountered with the eight Canopy Height Models (CHMs) employed were very similar to field measurements. When our data were analyzed by height classes, however, differences were encountered between the different softwares and interpolation methods used, indicating the influence of DTMs on tree height estimates based on LiDAR data. Key-words: Laser scanning; Digital Terrain Model; Canopy Height Model; Atlantic Forest; Tijuca National Park. Resumo Este trabalho avaliou a acurácia de Modelos Digitais de Terreno (MDT) gerados a partir de dados LiDAR em trecho de Mata Atlântica de encosta, município do Rio de Janeiro, RJ, e explorou o uso destes dados para a estimativa de altura de árvores. Foram utilizados métodos de interpolação de grade regular e grade irregular triangular em dois softwares, ArcGis 10.3 e Fusion, com pixels de 0,4 e 1 m, para atender às escalas de 1:2.000 e 1:5.000. Os MDT foram avaliados a partir de inferências estatísticas, considerando 165 pontos levantados com Estação Total (ET) numa parcela de 20x50 m. Os modelos foram classificados de acordo com os padrões das instruções reguladoras das normas técnicas da Cartografia Nacional. A acurácia variou de 0,59 m até 0,63 m entre as especificações para as escalas 1:2.000 e 1:5.000. As alturas máximas encontradas nos oito Modelos Digitais de Copa (MDC) ficaram bem próximas àquela medida em campo. No entanto, quando os dados são analisados por classes de altura, são encontradas diferenças entre os softwares e os métodos de interpolação, indicando a influência dos MDT nas estimativas de altura de árvores a partir de dados LiDAR. Palavras-chave: Escaneamento a laser; Modelo Digital de Terreno, Modelo Digital de Copa; Mata Atlântica; Parque Nacional da Tijuca.
Transcript of ANALYSIS OF ALTIMETRIC DATA OBTAINED BY LIDAR IN AN …
Analysis of altimetric data obtained by lidar in an area of Atlantic forest in southeastern Brazil
Elisa Araujo Penna Caris
67
Rev. Tamoios, São Gonçalo (RJ), ano 16, n. 2, pág. 67-85, jan-jun 2020
ANALYSIS OF ALTIMETRIC DATA OBTAINED BY LIDAR IN AN AREA OF
ATLANTIC FOREST IN SOUTHEASTERN BRAZIL
Análise de dados altimétricos obtidos pelo LiDAR em uma área de floresta Atlântica no
sudeste do Brasil
Elisa Araujo Penna Caris
Pesquisadora Associada do Laboratório Espaço de Sensoriamento Remoto e Estudos Ambientais,
Departamento de Geografia, UFRJ
Carla Bernadete Madureira Cruz
Professora Titular do Departamento de Geografia – UFRJ
Bruno Coutinho Kurtz
Pesquisador Titular – Jardim Botânico do Rio de Janeiro
Artigo enviado para publicação em 01/12/2019 e aceito em 29/04/2020
DOI: 10.12957/tamoios.2020.47023
Abstract
We evaluated the accuracies of Digital Terrain Models (DTMs) generated from LiDAR data in an area of
montane Atlantic Forest in the municipality of Rio de Janeiro, Brazil, and explored the use of those data to
estimate tree heights. We employed the interpolation of data on a regular grid and a Triangular Irregular
Network (TIN) using two softwares (ArcGis 10.3 and Fusion), with 0.4 and 1 m pixels, at scales of 1:2,000 and
1:5,000. The DTMs were evaluated using statistical inferences, considering 165 points surveyed using a
geodetic Total Station (TS) in a 20x50 m plot. The models were classified according to the standard regulatory
instructions of National Cartography technical norms. Accuracy varied from 0.59 m to 0.63 m among the
specifications use for scales of 1:2,000 and 1:5,000. The maximum tree crown heights encountered with the
eight Canopy Height Models (CHMs) employed were very similar to field measurements. When our data were
analyzed by height classes, however, differences were encountered between the different softwares and
interpolation methods used, indicating the influence of DTMs on tree height estimates based on LiDAR data.
Key-words: Laser scanning; Digital Terrain Model; Canopy Height Model; Atlantic Forest; Tijuca National
Park.
Resumo
Este trabalho avaliou a acurácia de Modelos Digitais de Terreno (MDT) gerados a partir de dados LiDAR em
trecho de Mata Atlântica de encosta, município do Rio de Janeiro, RJ, e explorou o uso destes dados para a
estimativa de altura de árvores. Foram utilizados métodos de interpolação de grade regular e grade irregular
triangular em dois softwares, ArcGis 10.3 e Fusion, com pixels de 0,4 e 1 m, para atender às escalas de 1:2.000
e 1:5.000. Os MDT foram avaliados a partir de inferências estatísticas, considerando 165 pontos levantados
com Estação Total (ET) numa parcela de 20x50 m. Os modelos foram classificados de acordo com os padrões
das instruções reguladoras das normas técnicas da Cartografia Nacional. A acurácia variou de 0,59 m até 0,63
m entre as especificações para as escalas 1:2.000 e 1:5.000. As alturas máximas encontradas nos oito Modelos
Digitais de Copa (MDC) ficaram bem próximas àquela medida em campo. No entanto, quando os dados são
analisados por classes de altura, são encontradas diferenças entre os softwares e os métodos de interpolação,
indicando a influência dos MDT nas estimativas de altura de árvores a partir de dados LiDAR.
Palavras-chave: Escaneamento a laser; Modelo Digital de Terreno, Modelo Digital de Copa; Mata Atlântica;
Parque Nacional da Tijuca.

Analysis of altimetric data obtained by lidar in an area of Atlantic forest in southeastern Brazil
Elisa Araujo Penna Caris
68
Rev. Tamoios, São Gonçalo (RJ), ano 16, n. 2, pág. 67-85, jan-jun 2020
Introduction
LiDAR (Light Detection and Ranging) is a Remote-Sensing technology that allows
three-dimensional spatial analysis. It is based on the principle of laser beam emission from a
platform (aerial, terrestrial or orbital) to the Earth’s surface and its reception resulting in a
point clouds with x, y and z coordinates having centimeter-level precision. As a result,
LiDAR technology has been widely used to produce models of land surfaces and capture
elevations on them, producing Digital Terrain Models (DTMs) and Digital Surface Models
(DSMs) respectively (BECKER; CENTENO, 2013).
The capacity of LiDAR laser pulses to penetrate dense forest cover makes it a more
accurate technology than photogrammetry for generating DTMs under dense vegetation
conditions (LIU, 2008). By providing high resolution horizontal and vertical information and
vertical accuracy, LiDAR has demonstrated enormous potential for use in ecological research
(LIM et al., 2003; BERGEN et al., 2009), such as in the production of Canopy Height Models
(CHMs). It must be pointed out, however, that the identification of structural vegetation
characteristics from LiDAR data is greatly influenced by variables such as point data density,
requiring that the models produced are calibrated and validated by field data to produce truly
accurate estimates. That requirement becomes more challenging in tropical environments due
to the complexity of their forest structures and the high spatial and temporal variability of
vegetation density (LEITOLD et al., 2016).
While the high resolution obtainable with LiDAR allows the acquisition of more
precise data about the Earth’s surface, that technology must be complemented with additional
studies examining the quality of the vertical data (CRUZ et al., 2011). Reutebuch et al. (2003)
discussed the importance of evaluating LiDAR accuracy in forest environments and analyzed
the accuracy of a DTM generated in a 500 ha mountainous area using 347 control points (in
open areas as well as in sites with dense forest cover in a conifer forest in Washington State,
USA). The mean error of the DTM under those conditions was found to be 0.22± 0.24 m,
with elevational differences varying from -0.63 to 1.31 m, with the greatest errors occurred
in areas with tree cover (0.31 m). Clark et al. (2004) analyzed the accuracy of DTM generated
by LiDAR in a dense forest in Costa Rica. Their results indicated a RMSE (Root Mean
Square Error) of 2.29 m as compared to 3859 points taken in the field by a geodetic Total
Station using a Differential Global Positioning System (DGPS). In the oldest forest areas, the
RMSE on steep slopes was 0.67 m, a value greater than the error on more level surfaces.
Schimallesky and Centeno (2007) evaluated the quality of altimetry information
derived from LiDAR in a fragment of Mixed Ombrophilous Forest in Paraná State, Brazil,
and detected the presence of trees forming a sub-canopy layer that strongly reduced the
penetration rate of the laser pulses to ground level. Their results indicated that the dense layer
of vegetation interfered with the penetration rates of the laser pulses, introducing errors in
the interpolation processes of the DTM due to the low densities of points reaching ground-
level and the consequent irregular distribution of those points.
Very few projects using LiDAR have been undertaken in the Atlantic Forest due to
its topographically irregular environments and wide altitudinal gradients along the Brazilian
coast. Leitold et al. (2016) compared the DTMs generated from LiDAR data with different
point densities per m2 in a mountainous region of the Serra do Mar Range in São Paulo State,
and reported a small super-estimation in their model that increased with lower point densities.
Barros et al. (2013) evaluated the accuracy of a DTM generated by LiDAR in an area of
dense vegetation in the municipalities of São Sebastião and Caraguatatuba (São Paulo State),
Analysis of altimetric data obtained by lidar in an area of Atlantic forest in southeastern Brazil
Elisa Araujo Penna Caris
69
Rev. Tamoios, São Gonçalo (RJ), ano 16, n. 2, pág. 67-85, jan-jun 2020
analyzing the errors according to Cartographic Accuracy Standards (CAS) and testing
hypotheses to evaluate the precision of the resulting products. According to those authors,
although the results did not fully realize initial expectations, they were considered very good,
and probably represented the best DTM results for dense vegetation cover.
In 2012, the Mayor's Office of the city of Rio de Janeiro acquired an aerial LiDAR
survey of the Tijuca Massif, with a mean density of 10 pts/m2. The Tijuca Massif is in the
eastern portion of the city and it is largely covered by montane forest vegetation (DIAS;
COELHO NETTO, 2011). That survey was designed (in part) to prepare a risk analysis of
landslides on the mountain slopes.
Considering the irregular topography of the Tijuca Massif, it is essential to examine
the vertical accuracy of the elevation models generated from LiDAR data so that they can be
used in ecological studies. Within that context, the present work sought to analyze the
accuracy of the DTMs derived from LiDAR data in “Sector A” in the Tijuca National Park
(with dense forest cover). Therefore, this work specially addresses two main aims:
(1) Evaluate the accuracy of DTMs using different interpolation techniques at
different scales, comparing the results with control points that were acquired using
a geodetic Total Station, allowing statistical investigations of errors;
(2) Generate CHMs using different interpolation techniques and compare them to the
tree height data measured during field work, in order to check the potential use of
these data in ecological research.
Materials and Methods
Study area
The study area was located in “Sector A” of the Tijuca National Park (TNP). The
TNP is situated on the Tijuca Massif and covers an area of 3953 ha. The park is subdivided
into four sectors (Floresta da Tijuca, Serra da Carioca, Pedra Bonita/Pedra da Gávea, and
Pretos Forros/Covanca - Figure 1) that differ according to their use and human occupation,
environmental characteristics and states of conservation (ICMBio, 2008). The vegetation
cover in the National Park is classified as Dense Montane and Sub-Montane Ombrophilous
Forest (ICMBio, 2008; IBGE, 2012) and, according to Coelho Netto et al. (2007),
approximately 35% of the area of Tijuca Massif is covered by late secondary or local climax
forest.
In terms of its geomorphology, the TNP demonstrates a mountainous landscape with
elevations between 80 and 1023 m a.s.l. The landscape is generally oriented in a northeast-
southwest direction and, according to Oliveira et al. (1995), that orientation is reflected in
the environmental and vegetation characteristics of its slopes. While the slopes facing the
north demonstrate more extreme climatic variations, the closed canopies of the forested
slopes having southern exposures retain more heat and humidity and do not demonstrate
temperature extremes. The local climate is classified as tropical altitudinal (COELHO
NETTO, 1985).

Analysis of altimetric data obtained by lidar in an area of Atlantic forest in southeastern Brazil
Elisa Araujo Penna Caris
70
Rev. Tamoios, São Gonçalo (RJ), ano 16, n. 2, pág. 67-85, jan-jun 2020
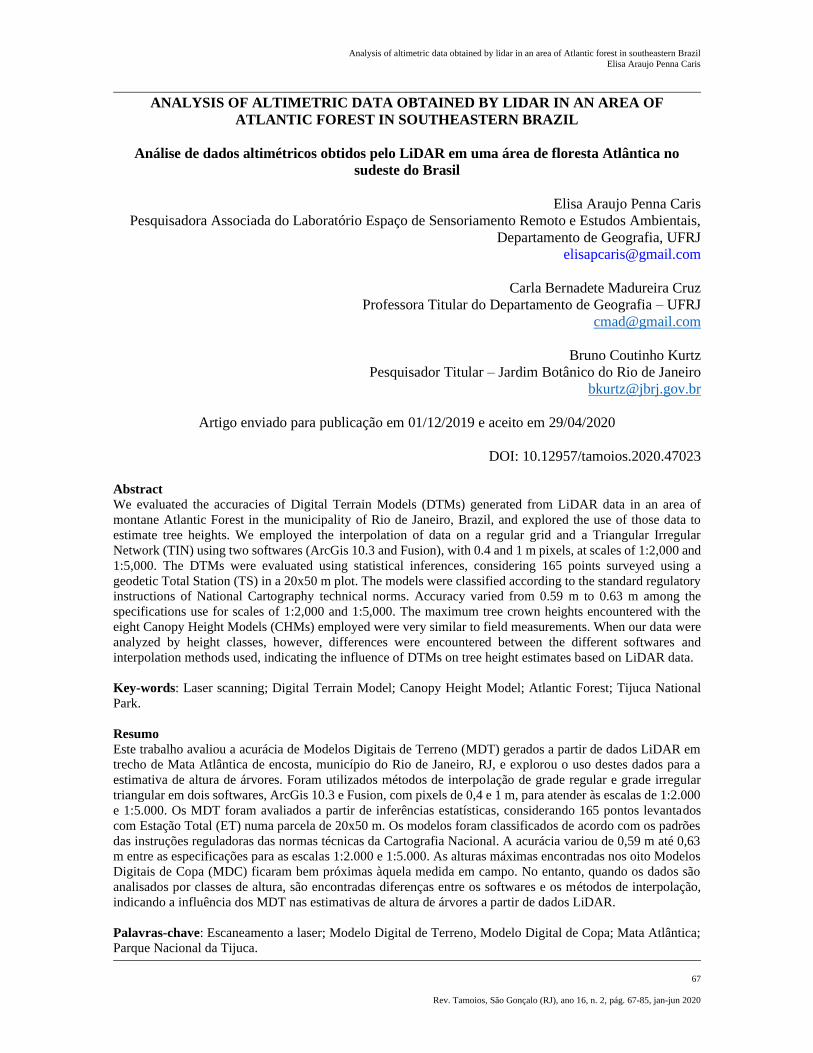
Figure 1: Locations of the four sectors of the Tijuca National Park, Rio de Janeiro State,
Brazil. Note the dense forest cover of Sector “A”.
Methodology
LiDAR data
The LiDAR data used here was obtained from an aerial survey undertaken on
November 6, 2012, for the Geotechnical Institute Foundation of the municipality of Rio de
Janeiro (GEORIO). The sensor was transported by helicopter and covered 155 km2 of the
Tijuca Mountain. Table 1 presents the parameters and specifications of the aerial survey data
gathered by the HANSA– Geofísica e Aerolevantamento Ltda. company.

Analysis of altimetric data obtained by lidar in an area of Atlantic forest in southeastern Brazil
Elisa Araujo Penna Caris
71
Rev. Tamoios, São Gonçalo (RJ), ano 16, n. 2, pág. 67-85, jan-jun 2020
Table 1: Data from the aerial survey of the Tijuca Massif undertaken by the HANSA –
Geofísica e Aerolevantamento Ltda. company, acquired for the Mayor’s Office of the city of
Rio de Janeiro, Brazil.
The point cloud was classified using TerraScan software by the same company that
performed the survey; Sector “A” of the TNP comprises 25 archives of Lidar Data Exchange
Format File (.las), UTM23S/SAD69, totaling 270 million points. The .las archives classify
points following the ASPRS (American Society for Photogrammetry and Remote Sensing)
orientation. The mean density of points in Sector “A” was 8.78 pt/m2.
Digital Terrain Models
The DTMs based on LiDAR data were elaborated for the entire area of Sector “A”
(25 archives). Due to the sizes of the archives, it was necessary to process some of them
separately and subsequently generate a mosaic of the area. That mosaic was assembled using
ArcGis 10.3 software using the mosaic to new raster tool.
We used two values for the pixel size (0.4 and 1) to evaluate the qualities of the
products generated to create cartographic scales of 1:2,000 and 1:5,000. Only points
classified as ground were interpolated for the DTMs. The DTMs in raster format were
generated using two different softwares: FUSION (free software) and ArcGis 10.3, using
distinct methodologies.
In ArcGis 10.3, the methodology employed regular cells and is called Binning. Due
to the high point density, the same cell can often contain two or more points and its stipulated
value is critical to the Cell Assignment Type. The Cell Assignment Type criteria used was the
parameter “Average”, as suggested by Barbosa (2015), where the mean value of all of the
points in the cell is attributed to it. For the DTMs based on the triangulation methodology
(TIN – Triangular Irregular Network), interpolation was performed using only the nearest
neighbor (Natural Neighbor).
There are two commands for creating a DTM when using Fusion software:
GridSurfaceCreate and TINSurfaceCreate. Additional parameters, however, can be used in
each of those commands, such as surface smoothing (MCGAUGHEY, 2016), although no
additional optional parameter was used in the present work. The DTMs were generated based

Analysis of altimetric data obtained by lidar in an area of Atlantic forest in southeastern Brazil
Elisa Araujo Penna Caris
72
Rev. Tamoios, São Gonçalo (RJ), ano 16, n. 2, pág. 67-85, jan-jun 2020
on a line of command, altering only pixel size. In the methodology of GridSurfaceCreate,
the area is divided into a regular grid based on dimensions defined by the user. The elevations
of the cells are determined by the mean elevation of its points. The values of the cells without
points are determined by the Natural Neighbor interpolation method. The TINSurfaceCreate
method initially generates a Triangular Irregular Network (TIN) based on the point cloud;
the surface, in the form of a grid, is then interpolated based on that irregular web (the
triangular algorithms used were developed by J.R. Shewechuk of the University of California
[MCGAUGHEY, 2016]).
A total of eight models were produced, four for each of the stipulated pixel sizes. As
the survey was performed using SAD69 datum, it was necessary to transform the coordinates
of the geodesic reference system to that currently used in Brazil (SIRGAS 2000), which was
done based on the transformation parameters between geodesic systems as defined by IBGE
(Brazilian Institute of Geography and Statistics). That processing was performed using
ArcGis 10.3 software according to IBGE (2015).
Altimetric precision was evaluated for each of the eight models generated. Those
analyses used 165 points defined by the Total Station (TS) in a 20x50 m plot located on a
southern facing slope with a mean declivity of 25.45o. The base of that plot was at an
elevation of 656 m, ending at 678 m. The TS survey required the initial establishment of two
points using a GNSS (Global Navigation Satellite System) apparatus, which were post-
processed at the site by IBGE. The 165 points in the plot were then collected using a Geodetic
G2 Total Station within a closed polygon. The data were processed using the Geooffice
function. The field data were collected between February and March/2018 in Sector “A” of
the TNP.
The extraction of altimetric data from the DTMs was performed using the Extract
Value to Multi Points function of ArcGis 10.3. We calculated the differences between the
elevations obtained from the DTMs and the values determined in the field. The final
evaluation of the results was based on three approaches. The first approach consistent of
evaluation based on the limits established by the Cartographic Accuracy Standard (CAS)
according to Brazilian Law no 89.817 (BRASIL, 1984), in which at least 90% of the points
evaluated must demonstrate differences within the tolerances defined for each map scale; the
total standard deviations of all of the points analyzed must be less than the established
tolerance limits to guarantee that the points that do happen to exceed the defined tolerance
are not excessively distant from it. As the CAS refers only to tolerances related to
equidistances, we chose to use as references the equidistance values most typical of each
scale, as presented in Table 2.

Analysis of altimetric data obtained by lidar in an area of Atlantic forest in southeastern Brazil
Elisa Araujo Penna Caris
73
Rev. Tamoios, São Gonçalo (RJ), ano 16, n. 2, pág. 67-85, jan-jun 2020
Table 2: Limits established by the Cartographic Standard of Accuracy (CAS). Adapted from
Barros et al. (2013). The Mean Square Error (MSE) is to be understood as the Error or
Standard Error.
The data were also evaluated following the methodology proposed by Santos et al.
(2016), using GEOPEC software and spatial statistics for bias analysis. Evaluations of
cartographic products are made using Technical Specifications to Vectorial Geospatial Data
Acquisition (ET-ADGV), a document linked to National Spatial Data Infrastructure (NSDI),
which can be allied to Brazilian Law no 89.817 – allowing a more rigorous evaluation of
digital cartographic products (Annex 2.4, of the Technical Specifications of Geospatial Data
Acquisition).
Altimetric precision was also evaluated using statistical inferences, following Vieira
and Genro (2013). According to those authors and based on an adaptation by Congalton and
Green (2009), the methodology estimates accuracy independent of the existence of a relevant
bias. That methodology considers the use of predefined accuracy patterns based on the
maximum probable error in relation to confidence intervals. The statistical foundations
applied are all based on the PEC, considering a 90% probability for the different classes with
the t-Student distribution as the statistical inference, emphasizing that the accuracy values
are overwhelmingly dependent on the sampling method.
Digital Height Models and Vegetation Surveys
To evaluate the quality of the DTMs and its influence on the estimates of tree heights,
we generated CHMs based on the differences between the DSMs and DTMs (Figure 2). The
DSMs were generated using the same software but interpolated to generate the DTMs using
all of the return signals from the point cloud. Those differences were calculated using ArcGis
10.3 and employing the raster calculator tool. It is possible, however, to create a CHM by
way of an optional parameter that indicates the DTM using a single Fusion software
command (GORGENS et al., 2014).

Analysis of altimetric data obtained by lidar in an area of Atlantic forest in southeastern Brazil
Elisa Araujo Penna Caris
74
Rev. Tamoios, São Gonçalo (RJ), ano 16, n. 2, pág. 67-85, jan-jun 2020
Figure 2: Example of a Canopy Height Model (CHM) generated from the differences
between a Digital Surface Model (DSM) and a Digital Terrain Model (DTM), in Sector “A”
of the Tijuca National Park, RJ, Brazil.
A vegetation survey was undertaken in the same plot used for the TS survey (between
2016 and 2017) to compare with the CHMs, recording all of the shrub-arboreal individuals
with diameters ≥ 5 cm at 1.30 above ground level, and minimum heights of 1.30 m. The total
heights of all individuals were estimated by a field assistant with significant experience in
that activity.
Results and Discussion
To facilitate the reader, abbreviations will be used for each of the models generated:
DTMFt (models generated using Fusion software and the TINSurfaceCreate command);
DTMFg (models generated using Fusion software and the GridSurfaceCreate command);
DTMAb (models generated using ArcGis 10.3 software and the Binning command; and
DTMAt (models generated using ArcGis 10.3 software and the TIN command).
When all of Sector “A” in the TNP was analyzed for the maximum and minimum
altitudes of the DTMs by all of the models and considering the different pixel values (0.4 and
1 m), we could perceive small variations in elevations. The minimum heights varied from
85.87 m using DTMFg with 1 m pixels, to 86.01 m using DTMAt, also with 1 m pixels. The
maximum landscape elevations varied between 1021.16 m using DTMfg with 0.4 m pixels,
to 1021.09 m using DTMFg and DTMAb, both with 1 m pixels. Those small differences are
probably related to the interpolation methods used and the predefined pixel sizes.
The analysis of altimetric precision of the DTMs (0.4 m pixels), based on the TS
survey, indicated the poorest results from DTMFg among the four methods analyzed (Table
3). That product was only classified at the 1:5,000 scale and demonstrated the greatest
elevational difference (2.67 m) when compared to the points determined by the TS, with an
estimated precision of 1.53 m according to the methodology proposed by Vieira and Genro
(2013). In the other three models analyzed, the maximum tree height differences varied

Analysis of altimetric data obtained by lidar in an area of Atlantic forest in southeastern Brazil
Elisa Araujo Penna Caris
75
Rev. Tamoios, São Gonçalo (RJ), ano 16, n. 2, pág. 67-85, jan-jun 2020
between 0.9 m in the DTMAt to 0.98 m in the DTMFt. Those results are very similar and
indicate that the interpolation methods used had similar efficiencies.
Table 3: Syntheses of the Digital Terrain Models (DTMs) analyses derived from the LiDAR
point clouds with 0.4 m pixels, based on PEC and the methodology proposed by Santos et al.
(2016) and Vieira and Genro (2013), in Sector “A” of the Tijuca National Park, RJ, Brazil.
∆H= Difference between the points determined by the Total Station and their homologs (in
absolute values).
*Non-normal sample. All values in meters.
In terms of accuracy, the best results were obtained with DTMAt (0.57 m); although
that model demonstrated bias. DTMFt and DTMAb demonstrated accuracies of 0.59 and 0.58
m respectively, with DTMAb also demonstrating bias. It could be observed in those cases
that the means of the altitudinal differences between those observed in the field and those
obtained by DTM were not zero, with values of -0.164 m for DTMFg, 0.057 m for DTMAt,
and 0.061 m for DTMAb.
It was expected that the evaluation based on Santos et al. (2016) would generate the
worst results among the different models due to the rigidity innate in ET-CQDG. Except for
DTMFg, which agreed with the Class D 1:5,000 scale, the other three models generated
agreed with the Class C 1:2,000 scale.
Despite the non-normality of the sample, it was possible to perceive a bias to
underestimate elevations in DTMFg, with approximately 60% of the points analyzed
demonstrating height differences less than zero (Figure 3). The analysis of the discrepancy
graph of DTMFg clearly shows a bias to underestimate model elevations above 662 m. The
other two models that demonstrated bias (DTMAt and DTMAb) demonstrated a general bias
of overestimating elevations, in spite of demonstrating an underestimation of elevation
beginning at 662 m. As was noted earlier, DTMFt was the only model that did not
demonstrate bias and was therefore considered to provide the best result.

Analysis of altimetric data obtained by lidar in an area of Atlantic forest in southeastern Brazil
Elisa Araujo Penna Caris
76
Rev. Tamoios, São Gonçalo (RJ), ano 16, n. 2, pág. 67-85, jan-jun 2020
Figure 3: Graphs demonstrating the discrepancies between the points determined by the Total
Station and their homologs, considering 0.4 m pixels. The orange line indicates the
topography of the plot in Sector “A” of the Tijuca National Park, RJ, Brazil.
Table 4 presents the results of the altimetric evaluations of the DTMs generated with
1 m pixels. The analysis of DTMs altimetric accuracy indicated that DTMFg gave the worst
results of the four methods analyzed. That product was classified only at the scale of 1:5,000
Class B and demonstrated an accuracy of 0.86 m following Vieira and Genro (2013). It
demonstrated, as it did in the model with 0.4 m pixels, a non-normality, but then without
bias. The GridSurfaceCreate interpolation method did not yield good results in terms of the
0.4 and 1 m pixels and generated inferior results when compared to the others.
Table 4: Syntheses of the analyses of Digital Terrain Models (DTMs) derived from LiDAR
point clouds with 1 m pixels based on the PEC and the methodology proposed by Santos et
al. (2016) and Vieira and Genro (2013), in Sector “A” of the Tijuca National Park, RJ, Brazil.
∆H= difference between the points established using the Total Station and their homologs in
absolute values.
*Non-normal sample. All values in meters.

Analysis of altimetric data obtained by lidar in an area of Atlantic forest in southeastern Brazil
Elisa Araujo Penna Caris
77
Rev. Tamoios, São Gonçalo (RJ), ano 16, n. 2, pág. 67-85, jan-jun 2020
The principal discrepancy between the points determined by TS and their homologs
in the models was observed in DTMAb (1.737 m), which also demonstrated bias. As the two
models generated in ArcGis 10.3 demonstrated bias, the best result was demonstrated by
DTMFt in terms of accuracy (0.604 m considering LE90, and 0.63 m following Vieira and
Genro, 2013). As was seen in the evaluations of models using 0.4 m pixels, a rigorous
evaluation, following Santos et al. (2016), places DTMFt in the 1:2,000 Class C scale.
Figure 4 presents the discrepancies between each of the models and the reference
points determined by TS. As with the models using 0.4 m pixels, there is a bias with the 1 m
models to underestimate true elevations as altimetric levels increase. That situation was most
evident in DTMFg, where the mean elevational difference between DTM and the TS was
0.001 m.
Figure 4: Graphs demonstrating the discrepancies between the points established by the Total
Station and their homologs, considering a 1 m pixel, in Sector “A” of the Tijuca National
Park, RJ, Brazil. The topographic profile of the plot is indicated by the orange line.
If the best result, however, is considered the one that does not demonstrate bias while
having the greatest accuracy, considering the PEC-PCD, the best model was generated using
Fusion software, with 0.4 m pixels, using the TINSurfaceCreate command. Figure 5
demonstrates that model applied to the total study area.

Analysis of altimetric data obtained by lidar in an area of Atlantic forest in southeastern Brazil
Elisa Araujo Penna Caris
78
Rev. Tamoios, São Gonçalo (RJ), ano 16, n. 2, pág. 67-85, jan-jun 2020
Figure 5: Digital Terrain Model of Sector “A” - Tijuca National Park, RJ, Brazil with 0.4 m
pixels, produced by the interpolation of LiDAR points using Fusion software and the
TINSurfaceCreate command.
The small underestimation of elevation encountered in our work was also reported by
Hodgson et al. (2005). Those authors analyzed the effects of land cover and inclination in a
hydrographic basin in North Carolina, USA, in an elevation model derived from LiDAR
points collected during the winter (when the trees were devoid of leaves). They employed
1225 control points for six different types of land cover. The RMSE varied between 14.5 and
36.1 cm, with the largest error being seen in the open shrub vegetation class. In relation to
slope, the authors reported that there was little evidence of increasing errors with increasing
declivity at low slope angles, between 0 and 10º, except in the low grass vegetation class,
where the error increased with declivity. On the average, the model underestimated
elevations independent of the vegetation cover class. Adams and Chandler (2002) likewise
reported a bias of LiDAR data towards underestimating elevations, as well as a lower
sensitivity to landscape inclinations when compared to DTM derived from photogrammetric
surveys.
Hodgson and Breshanm (2004) reported that, in decreasing order of importance,
measurements based on LiDAR systems (with GNSS or IMU equipment, for example) were

Analysis of altimetric data obtained by lidar in an area of Atlantic forest in southeastern Brazil
Elisa Araujo Penna Caris
79
Rev. Tamoios, São Gonçalo (RJ), ano 16, n. 2, pág. 67-85, jan-jun 2020
the dominant source of errors, followed by interpolation errors, horizontal dislocation errors,
and point filtration errors. The elevation of the platform holding the equipment can also
influence point cloud densities, which will reflect on the accuracies of the models generated,
because at higher flight altitudes there are lower quantities of photon return due to the
increased diameter of the laser beam (GOODWIN et al., 2006; LEITOLD et al., 2015).
As such, in addition to forest cover, the point cloud densities of the models generated
will also be a source of error, with the bias of exponential increases in errors with increasing
spacing between the points (JAKUBOSKI et al., 2013), principally in tropical forests
growing on areas of steep topography with dense vegetation cover (LEITOLD et al., 2016).
As discussed earlier, to evaluate the possibility of using LiDAR data in ecological
research, we generated different CHMs from each of the DTMs generated. Table 5 presents
the maximum, minimum, and mean values (with standard deviations) for each of the models
analyzed. For comparison, the field vegetation surveys sampled 187 live individuals
(representing a total density of 1870 ind./ha). The maximum tree height encountered was 32
m, while the minimum was 2 m; the mean tree height was 11.15 m, with a standard deviation
of 5.1 m.
Table 5: Maximum, minimum, and mean height values (with standard deviations) of the
Canopy Height Models (CHMs) generated from LiDAR data in Sector “A” of the Tijuca
National Park, RJ, Brazil. CHMFt(0.4)= generated by Fusion software, TINSurfaceCreate
method, with 0.4 m pixels; CHMFg(0,4)= generated by Fusion software, GridSurfaceCreate
method, with 0.4 m pixels; CHMAb(0,4)= generated by ArcGis 10.3 software, Binning
method, with 0.4 m pixels; CHMAt(0,4)= generated by ArcGis 10.3 software, TIN method,
with 0.4 m pixels m; CHMFt(1)= generated by Fusion software, TINSurfaceCreate method,
with 1 m pixels; CHMFg(1)= generated by Fusion software, GridSurfaceCreate method,
with 1 m pixels m; CHMAb(1)= generated by ArcGis 10.3 software, Binning method, with
1 m pixels; CHMAt(1)= generated by ArcGis 10.3 software, TIN method, with 1 m pixels.
Among the models generated, the maximum tree height varied from 29.63 m
(CHMAb(1)) to 30.95 m (CHMFg(0.4)), while in the field, the maximum height was 32 m.
That difference was very small, especially considering the difference in time of two years
between the over flight and the field survey, as it is quite possible that some of the trees grew
during that period. The smallest plant heights correspond to the small openings in the crown

Analysis of altimetric data obtained by lidar in an area of Atlantic forest in southeastern Brazil
Elisa Araujo Penna Caris
80
Rev. Tamoios, São Gonçalo (RJ), ano 16, n. 2, pág. 67-85, jan-jun 2020
that allow the laser beam to arrive near ground level. The mean heights of the models vary
between 18.23 and 21.92 m, values quite different from that encountered in the field. That
situation requires some consideration. A definitive height value was attributed to each
individual sampled in the field, while it is each pixel that is assigned a height value in the
CHM. As the model is generated based on differences between the DSM and the DTM, only
the crowns of the tallest individuals are included, raising the assigned mean height. In the
field survey of individuals with diameters ≥ 5 cm at 1.3 m above soil level (the inclusion
criteria recommended for studies of vegetation structure in the Atlantic Forest), individuals
are necessarily included whose crowns are situated below canopy and emergent individuals,
thus lowering the mean height. If we consider only the 28 individuals whose crowns were
totally exposed to sunlight, the mean height increases to 18.82 m, a value remarkably close
to those encountered using LiDAR data.
If data analysis were based solely on the maximum and mean heights encountered, it
could be argued that the DTMs generated from the different interpolation methods were very
similar within the study area. However, when the model data are analyzed in terms of height
classes, some differences appear, principally as a function of the software utilized.
In the models generated using ArcGis 10.3 software with 0.4 m pixels, there were no
variations in the percentages of pixels in each of the sampled classes (Figure 5). The greatest
concentration of pixels was seen in the 15.1 – 20 m (35.1%) and 20.1 – 25 m (33.7%) classes;
pixels above 25 m represented only 5.6% of the sample. It must be remembered that the
DTMs generated using that software demonstrated very similar accuracies in both of the
methodologies tested: 0.57 m (DTMAt) and 0.58 m (DTMAb). In spite the fact that the
differences between the interpolations were small in some of the models generated using
Fusion software, that difference was almost 17% in the 10.1 – 15 m class; with 12.5% of the
pixels in that class in CHMFg, and 29.1% in CHMFt. It is important to remember that the
DTMFg model demonstrated the least accuracy, in addition to bias in the data, which were
probably reflected in the differences between those two models.

Analysis of altimetric data obtained by lidar in an area of Atlantic forest in southeastern Brazil
Elisa Araujo Penna Caris
81
Rev. Tamoios, São Gonçalo (RJ), ano 16, n. 2, pág. 67-85, jan-jun 2020
Figure 5: Pixel distributions in the different height classes in the different Canopy Height
Models (CHMs) with resolutions of 0.4 m in Sector “A” of the Tijuca National Park, RJ,
Brazil.
In the models with 1 m pixels (Figure 6), the differences between the softwares were
more visible. In the CHM generated using ArcGis 10.3 software, the greatest pixel
concentration was in the 15.1 – 20 m class, while in the CHMs generated using Fusion
software, the greatest pixel concentration was in the 20.1 – 25 m class. On the other hand,
the differences between the Fusion interpolators and those of ArcGis 10.3 in those models
were almost non-existent and a small difference between the results was only seen in the >25
m class.
1,1
5,5
19,1
35,133,7
5,6
1,6 3,0
29,130,7
42,0
9,6
1,5 2,3
12,5
27,5
44,8
11,3
0
5
10
15
20
25
30
35
40
45
50
0-5 5,1-10 10,1-15 15,1-20 20,1-25 >25
Pixel distributions (percentages) of the CHM (0.4 m) in
the different heigth classes
CHMAt CHMAb CHMFt CHMFg

Analysis of altimetric data obtained by lidar in an area of Atlantic forest in southeastern Brazil
Elisa Araujo Penna Caris
82
Rev. Tamoios, São Gonçalo (RJ), ano 16, n. 2, pág. 67-85, jan-jun 2020
Figure 6: Pixel Distribution in the different height classes in the Canopy Height Models
(CHMs) with 1 m resolutions in Sector “A” in the Tijuca National Park, RJ, Brazil.
That evaluation affirmed the view of Leitold et al. (2016) that it was possible to use
LiDAR data to quantify the stocks and dynamics of aboveground biomass. The quality of the
results, however, will be directly related to the choice of an accurate and precise DTM,
especially in environments with heavy forest cover.
Conclusion
The use of LiDAR data to generate high accuracy DTM is very promising, principally
in areas with dense vegetation cover, as the dense point cloud resulting from the laser pulse
is able to penetrate to the forest floor through small openings in the canopy.
The results presented here, on the other hand, stressed the importance of studies that
can determine the accuracies of the models generated. There are currently innumerable
programs capable of reading .las archives, including both commercial and open source
softwares. Fusion software, developed by the U.S. Forest Service of the Department of
Agriculture, has been found to be quite efficient at generating DTM using the
TINSurfaceCreate command and gave the best results in terms of generating a product with
high accuracy and without bias. The functioning of both interpolation methods was very
similar using ArcGis 10.3. It was found that smaller pixel sizes tended to underestimate tree
heights as compared to data generated with the Total Station.
Estimates of maximum tree heights using LiDAR were very similar to those found
through direct measurements in the field, although significant differences were observed in
terms of height classes, principally between softwares. That result emphasizes the importance
of performing surveys with high point densities, principally in tropical environments with
complex topographies; the higher costs of those surveys will be compensated by the excellent
results of using that technology to generate DTM and consequently, CHM.
1,0
5,2
19,6
34,633,6
6,0
0,82,6
20,5
38,135,5
2,50,2 0,8
5,4
24,9
50,7
17,9
0,5
5,2
23,8
51,9
18,4
0
10
20
30
40
50
0-5 5,1-10 10,1-15 15,1-20 20,1-25 >25
Pixel distributions (percentages) of the CHM (1 m) in the
different heigth classes
CHMAt CHMAb CHMFt CHMFg

Analysis of altimetric data obtained by lidar in an area of Atlantic forest in southeastern Brazil
Elisa Araujo Penna Caris
83
Rev. Tamoios, São Gonçalo (RJ), ano 16, n. 2, pág. 67-85, jan-jun 2020
Acknowledgements
We thank the Chico Mendes Institute of Biodiversity (ICMBio) for working permits;
the Pereira Passos Institute (IPP), HANSA L.t.d.a. and Dr. Andre Avelar for Lidar data
cession; J. Caruzo, R. Rangel, E. Lacerda and Mensurar for field and technical assistance and
CAPES for Phd scholarship.
References
ADAMS, J.C., CHANDLER, J.H. Evaluation of LiDAR and medium scale photogrammetry
for detecting soft-cliff coastal change. The Photogrammetry Record, v.17, n.99, p.405-418,
2002.
BARBOSA, L.S. Avaliação de Modelos Digitais de Terreno gerados por escaneamento a
laser (LiDAR) no Maciço da Tijuca, RJ. Dissertação de Mestrado. Departamento de
Geografia. Universidade Federal do Rio de Janeiro. 131 p., 2015
BARROS, R.S.; CRUZ, C.B.M; RABACO, L.M.L. & FAGUNDES, F. de O. Avaliação da
Exatidão Planialtimétrica de produtos oriundos de Radar Interferométrico e LiDAR em área
coberta por floresta. In: Anais... XVI Simpósio Brasileiro de Sensoriamento Remoto, Foz
do Iguaçu, PR, INPE, p. 2126-2133, 2013
BECKER, J.H. & CENTENO, J.A.S. Avaliação de métodos de filtragem de nuvens de pontos
derivados do sistema laser scanner aerotransportado para obtenção de MDT. Revista
Brasileira de Cartografia, v. 65, n. 4, p. 651-659, 2013.
BERGEN, S. J., GOETZ, R. O., DUBAYAH, G. M,. HENEBRY, C. T., HUNSAKER, M. L.,
IMHOFF, R. F., NELSON, G. G., PARKER, & V. C. RADELOFF. Remote sensing of
vegetation 3-D structure for biodiversity and habitat: Review and implications for lidar and
radar spaceborne missions. Journal of Geophysical Research. V.114, p. 1-13, 2009.
BRASIL. Decreto-lei nº 89.817 de 20 de junho de 1984. Estabelece as Instruções
Reguladoras das Normas Técnicas da Cartografia Nacional. Disponível em
<http://www.planalto.gov.br/ccivil_03/decreto/1980-1989/D89817.htm>. Acesso em 02
julho 2017.
CLARK, M.L.; CLARK, D.B., ROBERTS, D.A. Small-footprint lidar estimation of sub-
canopy elevation and tree height in a tropical rain forest landscape. Remote Sensing of
Environment, v.91, p.69-89, 2004.
COLEHO-NETTO, A.L. Surface hidrology and soil erosion in a tropical montainous
rainforest drainage basin, RJ, Phd thesis, Katholieke Univ. Leuven, Belgiun, 181 p., 1985.
COELHO-NETTO, A.L. A interface florestal-urbana e os desastres naturais relacionados à
água no Maciço da Tijuca: desafios ao planejamento urbano numa perspectiva sócio-
ambiental. Revista do Departamento de Geografia, v.16, p.46-60, 2005.
COELHO-NETTO, A.L.; AVELAR, A.S.; FERNANDES, M.C. & LACERDA, W.A.
Landslide susceptibility in a mountainous geoecosystem, Tijuca Massif, Rio de Janeiro: The
role of morphometric subdivision of the terrain. Geomorphology, v.87, p.120–131, 2007.

Analysis of altimetric data obtained by lidar in an area of Atlantic forest in southeastern Brazil
Elisa Araujo Penna Caris
84
Rev. Tamoios, São Gonçalo (RJ), ano 16, n. 2, pág. 67-85, jan-jun 2020
CONGALTON, R.G.; GREEN, K. Assessing the accuracy of remotely sensed data: principles
and practices. Positional Accuracy. 2. Ed. Boca Raton, Florida, cap.3, p.19-53, 2009.
CRUZ, C.B.M.; BARROS, R.S.; CARDOSO, P.V.; REIS, R.B.; ROSARIO, L.S.;
BARBOSA, S.S.; RABACO, L.M.L.; LOURENÇO, J.S.Q. Avaliação da exatidão
planimétrica dos modelos digitais de superfície (MDS) e do terreno (MDT) obtidos através
do LiDAR. In: Anais... XV Simpósio Brasileiro de Sensoriamento Remoto, Curitiba, PR,
INPE, p. 5463-5470, 2011.
DIAS, M.A., COELHO-NETTO, A.L. Distribuição de manchas de gramínea em um
fragmento de floresta Atlântica urbano montanhosa – Maciço da Tijuca, RJ. Revista de
Geografia, v.especial VIII SINAGEO, n.2, p.148-164, 2011.
GORGENS, E.B.; SILVA, A.G.P.; RODRIGUEZ, L.C.E. Lidar: aplicações florestais. 1 Ed.,
Curitiba, PR. CRV, 2014.
GOODWIN, N.R.; COOPS, N.C.; CULVENOR, D.S. Assessment of forest structure with
airbone LiDAR and the effects of platform altitude. Remote Sensing of Environment, v.103,
p.140-152, 2006.
HODGSON, M. E.; JENSEN, J.; RABER, G.; TULLIS, J.; DAVIS, B. A.; THOMPSON, G.;
SCHUCKMAN, K. Evaluation of lidar-derived elevation and terrain slope in leaf-off
conditions. Photogrammetric Engineering and Remote Sensing, v. 71, n. 7, p. 817-823,
2005.
HODGSON, M. E.; BRESNAHAN, P. Accuracy of airborne LiDAR-derived elevation:
empirical assessment and error budget. Photogrammetric Engineering and Remote
Sensing, v. 70, n. 3, p. 331-339, 2004.
ICMBIO. 2008. Plano de manejo. Parque Nacional da Tijuca. Disponível em <http://
www.icmbio.gov.br/portal/images/stories/docs-planos-de-manejo/parna_tijuca_pm.pdf >.
Acesso em 20 de novembro de 2016.
INSTITUTO BRASILEIRO DE GEOGRAFIA E ESTATÍSTICA. Manual Técnico da
Vegetação Brasileira. Série: Manuais Técnicos em Geociências. 2ª ed. Rio de Janeiro:
IBGE, 2012.
______________.Resolução do Presidente número 1/2015. Disponível em
http://geoftp.ibge.gov.br/metodos_e_outros_documentos_de_referencia/normas/rpr_01_25f
ev2005.pdf. Acesso em 24 de abril de 2020.
JAKUBOWSKI, M. K.; GUO, Q.; KELLY M. Tradeoffs between lidar pulse density and
forest measurement accuracy. Remote Sensing of Environment, v. 130, p. 245-253, 2013
LEITOLD, V.; KELLER, M.; MORTON, D.C., SHIMABUKURO, Y.E. Landscape-scale
variation in forest structure and biomass along an elevation gradient in the Atlantic Forest of
the Serra do Mar, Brazil. In: Anais... XVII Simpósio Brasileiro de Sensoriamento Remoto,
João Pessoa, p. 1192-1199, 2015.
LEITOLD, V.; KELLER, M.; MORTON, D.C.; COOK, B.D.; SHIMABUKURO, Y.E.
Airborne lidar-based estimates of tropical forest structure in complex terrain: opportunities
and trade-offs for REDD+. Carbon balance and management, v. 10, n. 1, p. 3, 2015. (a)
LIM, K.; TREITZ, P.; WULDER, M.; ST-ONGE, B. & FLOOD, M. LiDAR remote sensing

Analysis of altimetric data obtained by lidar in an area of Atlantic forest in southeastern Brazil
Elisa Araujo Penna Caris
85
Rev. Tamoios, São Gonçalo (RJ), ano 16, n. 2, pág. 67-85, jan-jun 2020
of forest structure. Progress in Physical Geography, v. 27, n.1, P.88-106, 2003.
LIU, X. Airbone LiDAR for DEM generation: some critical issues. Progress in Physical
Geography, v. 32, n.1, p. 31-49, 2008.
MCGAUGHEY, R. J. FUSION manual, version 2.90. USDA Forest Service, 2016.
OLIVEIRA, R.R. ZAÚ, A.S.; LIMA, D.F; SILVA, M.B.R., VIANNA, M.C. Dinâmica
ecológica de encostas no Maciço da Tijuca - RJ. Oecologia Brasiliensis v.1, p. 523-541,
1995.
REUTEBUCH, S. E.; McGAUGHEY, R. J.; ANDERSON, H. E.; CARSON, W. W. Accuracy
of a high-resolution lidar terrain model under a conifer forest canopy. Canadian Journal of
Remote Sensing, v. 29, n. 5, p. 527-535, 2003.
SANTOS, A.P.; RODRIGUES, D.D.; SANTOS, N.T.; JUNIOR, J.G. Avaliação da acurácia
posicional em dados espaciais utilizando técnicas de estatística espacial: proposta de método
e exemplo utilizando a norma brasileira. Boletim de Ciências Geodésicas, v.22, n.4, p.630-
650, 2016. Disponível em http://dx.doi.org/10.1590/S1982-21702016000400036. Acesso em
28 de maio de 2018.
SCHIMALLESKY, V., CENTENO, J.A.S. Avaliação da qualidade da avaliação altimetrica
derivada da varredura a laser em uma região coberta por vegetação – estudo de caso.
Floresta, v. 38, n. 4, p. 597-606, 2008.
VIEIRA, H. B. G. & GENRO, R. S. Inferência estatística para validação de documentos
cartográficos obtidos com sensores remotos orbitais ou aerotransportados, em áreas de
operação da Petrobras. In: Anais...XV Simpósio Brasileiro de Sensoriamento Remoto,
Curitiba, PR. INPE, p.2339-2346, 2011.